Article

Using MODIS LAI Data to Monitor Spatio-Temporal Changes of Winter Wheat Phenology in Response to Climate Warming

1
College of Resources and Environmental Sciences, China Agricultural University, Beijing 100193, China
2
Key Laboratory of Remote Sensing for Agri-Hazards, Ministry of Agriculture and Rural Affairs, Beijing 100083, China
3
State Key Laboratory of Soil Erosion and Dryland Farming on the Loess Plateau, Northwest A&F University, Yangling 712100, China
4
College of Resources and Environment, University of Chinese Academy of Science, Beijing 100049, China
5
School of Life Sciences, Faculty of Science, University of Technology Sydney, NSW 2007, Australia
6
College of Land Science and Technology, China Agricultural University, Beijing 100083, China
*
Author to whom correspondence should be addressed.
Remote Sens. 2020, 12(5), 786; https://doi.org/10.3390/rs12050786
Submission received: 7 January 2020 / Revised: 10 February 2020 / Accepted: 26 February 2020 / Published: 1 March 2020

Abstract

:
Understanding spatio-temporal changes in winter wheat (Triticum aestivum L) phenology and its response to temperature will be vital for adapting to climate change in the coming years. For this purpose, the heading date (HD), maturity date (MD), and length of the reproductive growth period (LRGP) were detected from the remotely sensed leaf area index (LAI) data by a threshold-based method during the harvest year 2003 to 2018 across the North China Plain. The results show that there was high spatial heterogeneity of winter wheat phenology in pixel scale across the whole area, which could not be detected in previous site-based studies. The results also verified that climate warming could explain part of the change in the HD. However, for the LRGP, the potential impact of non-climate effects should be further investigated. This study presents the spatio-temporal changes both in winter wheat phenology and corresponding mean temperature and then analyzes their relationships in pixel scale. Additionally, this study further discusses the potential impact of non-climate effects on the LRGP.

Graphical Abstract

1. Introduction

Over the past several decades, the annual mean of daily mean temperatures in the North China Plain (NCP) has experienced an increasing trend of approximately 0.2 °C per decade [1,2]. Climate change has influenced the terrestrial ecosystems [1,2,3,4,5]. In the future, a warmer growth environment could further affect the vegetation and the whole ecosystem. Phenological shifts can be an important indicator for us to better understand some of the changes to ecosystems [6,7,8,9]. For native and perennial plant species, increasing spring temperatures could generally boost vegetation growth, lengthen the growing season, and enhance the net ecosystem productivity [10,11,12]. However, for the winter wheat in the NCP, a warmer climate could accelerate senescence, shorten the growing period, and therefore lead to yield loss [13,14,15,16,17].
Phenological shifts can respond to climate change effectively [18,19]. For instance, due to global warming, the advancement of green-up, heading, and maturity dates in winter wheat (Triticum aestivum L.) have been detected in both the US and China [20,21,22,23,24]. The site-scale results show that the phenological shifts in crops could be more complicated [25,26]. Different sites may have different cultivars, agronomic measures, and climatic trends, which could result in different responses of crops to climate change. Long-term observational ground data have shown that the length of the vegetative growth period has shortened over the past few decades [27,28,29]. However, the length of the reproductive growth period could be stable, and even prolonged, in some cases [21,22,30]. Different growth periods could show different phenological changes and trends. Moreover, it has been confirmed that there are significant spatial differences in crop phenological changes and yield at the regional scale [31,32,33]. Therefore, expanding site-scale results to the regional scale and mapping the spatial heterogeneity would be noteworthy starting points to mitigate yield gaps and investigate the impact of climate change [34].
Most previous studies were conducted based on site records in order to focus on the relationships between phenology and climate change [13,14,15]. However, considering the spatial heterogeneity of crop systems, those results could not be detailed and representative enough in continuous space [35,36]. In contrast, remote sensing could be an effective tool to explore continuous-space dynamics and solve the spatial heterogeneity problem [37,38,39]. In past studies, the vegetation index (VI, e.g., NDVI and EVI) has been used to detect crop phenology widely [40,41,42,43]. Using the fitted VI curve, phenological metrics can be estimated to further assess spatio-temporal changes. Recently, leaf area index (LAI) products have provided high-quality data series to detect and monitor vegetation dynamics [44]. In principle, the remotely sensed LAI data can better represent the physiological and physical features in crops than VI [45]. The LAI curve can be associated with the phenological metrics directly. Moreover, LAI data can also avoid the saturation effect of NDVI/EVI in remote sensing. Therefore, LAI data would be a novel data source to describe crop phenology.
It is an indisputable fact that spatio-temporal changes in crop phenology will not only be affected by climate change, but also by non-climate effects [23,24]. Site-based studies reported that the changes in the time series of crop phenology could be detected in sites, but more studies should further assess and map spatio-temporal changes in continuous space [26,29,30,33]. Spatial heterogeneity of crop phenology could be high and induced by non-climate factors. For instance, crop breeding will optimize cultivars to prolong the reproductive growth period (LRGP) for higher grain yield. Meanwhile, modern agronomic measures could also affect the LRGP. These non-climate effects could lead to weak and non-significant responses of crop phenology to climate change. The potential non-climate effects could result in different observations of spatio-temporal changes in crop phenology. More discussions should occur in order to assess the non-climate effects on phenology.
In this study, we conducted analyses of winter wheat phenology in the NCP during the harvest years 2003 to 2018. Our study tested the hypothesis that high spatial heterogeneity could affect the responses of winter wheat to climate change and lead to different spatio-temporal changes in winter wheat phenology. Moreover, we further discuss the potential impact of non-climate effects on the LRGP. The objectives of this study are to (1) detect the spatio-temporal changes in winter wheat phenology using the Moderate Resolution Imaging Spectroradiometer (MODIS) LAI data; (2) assess warming trends in the NCP during the winter wheat growth period, and (3) analyze the relationships between temperature and winter wheat phenology.

2. Materials and Methods
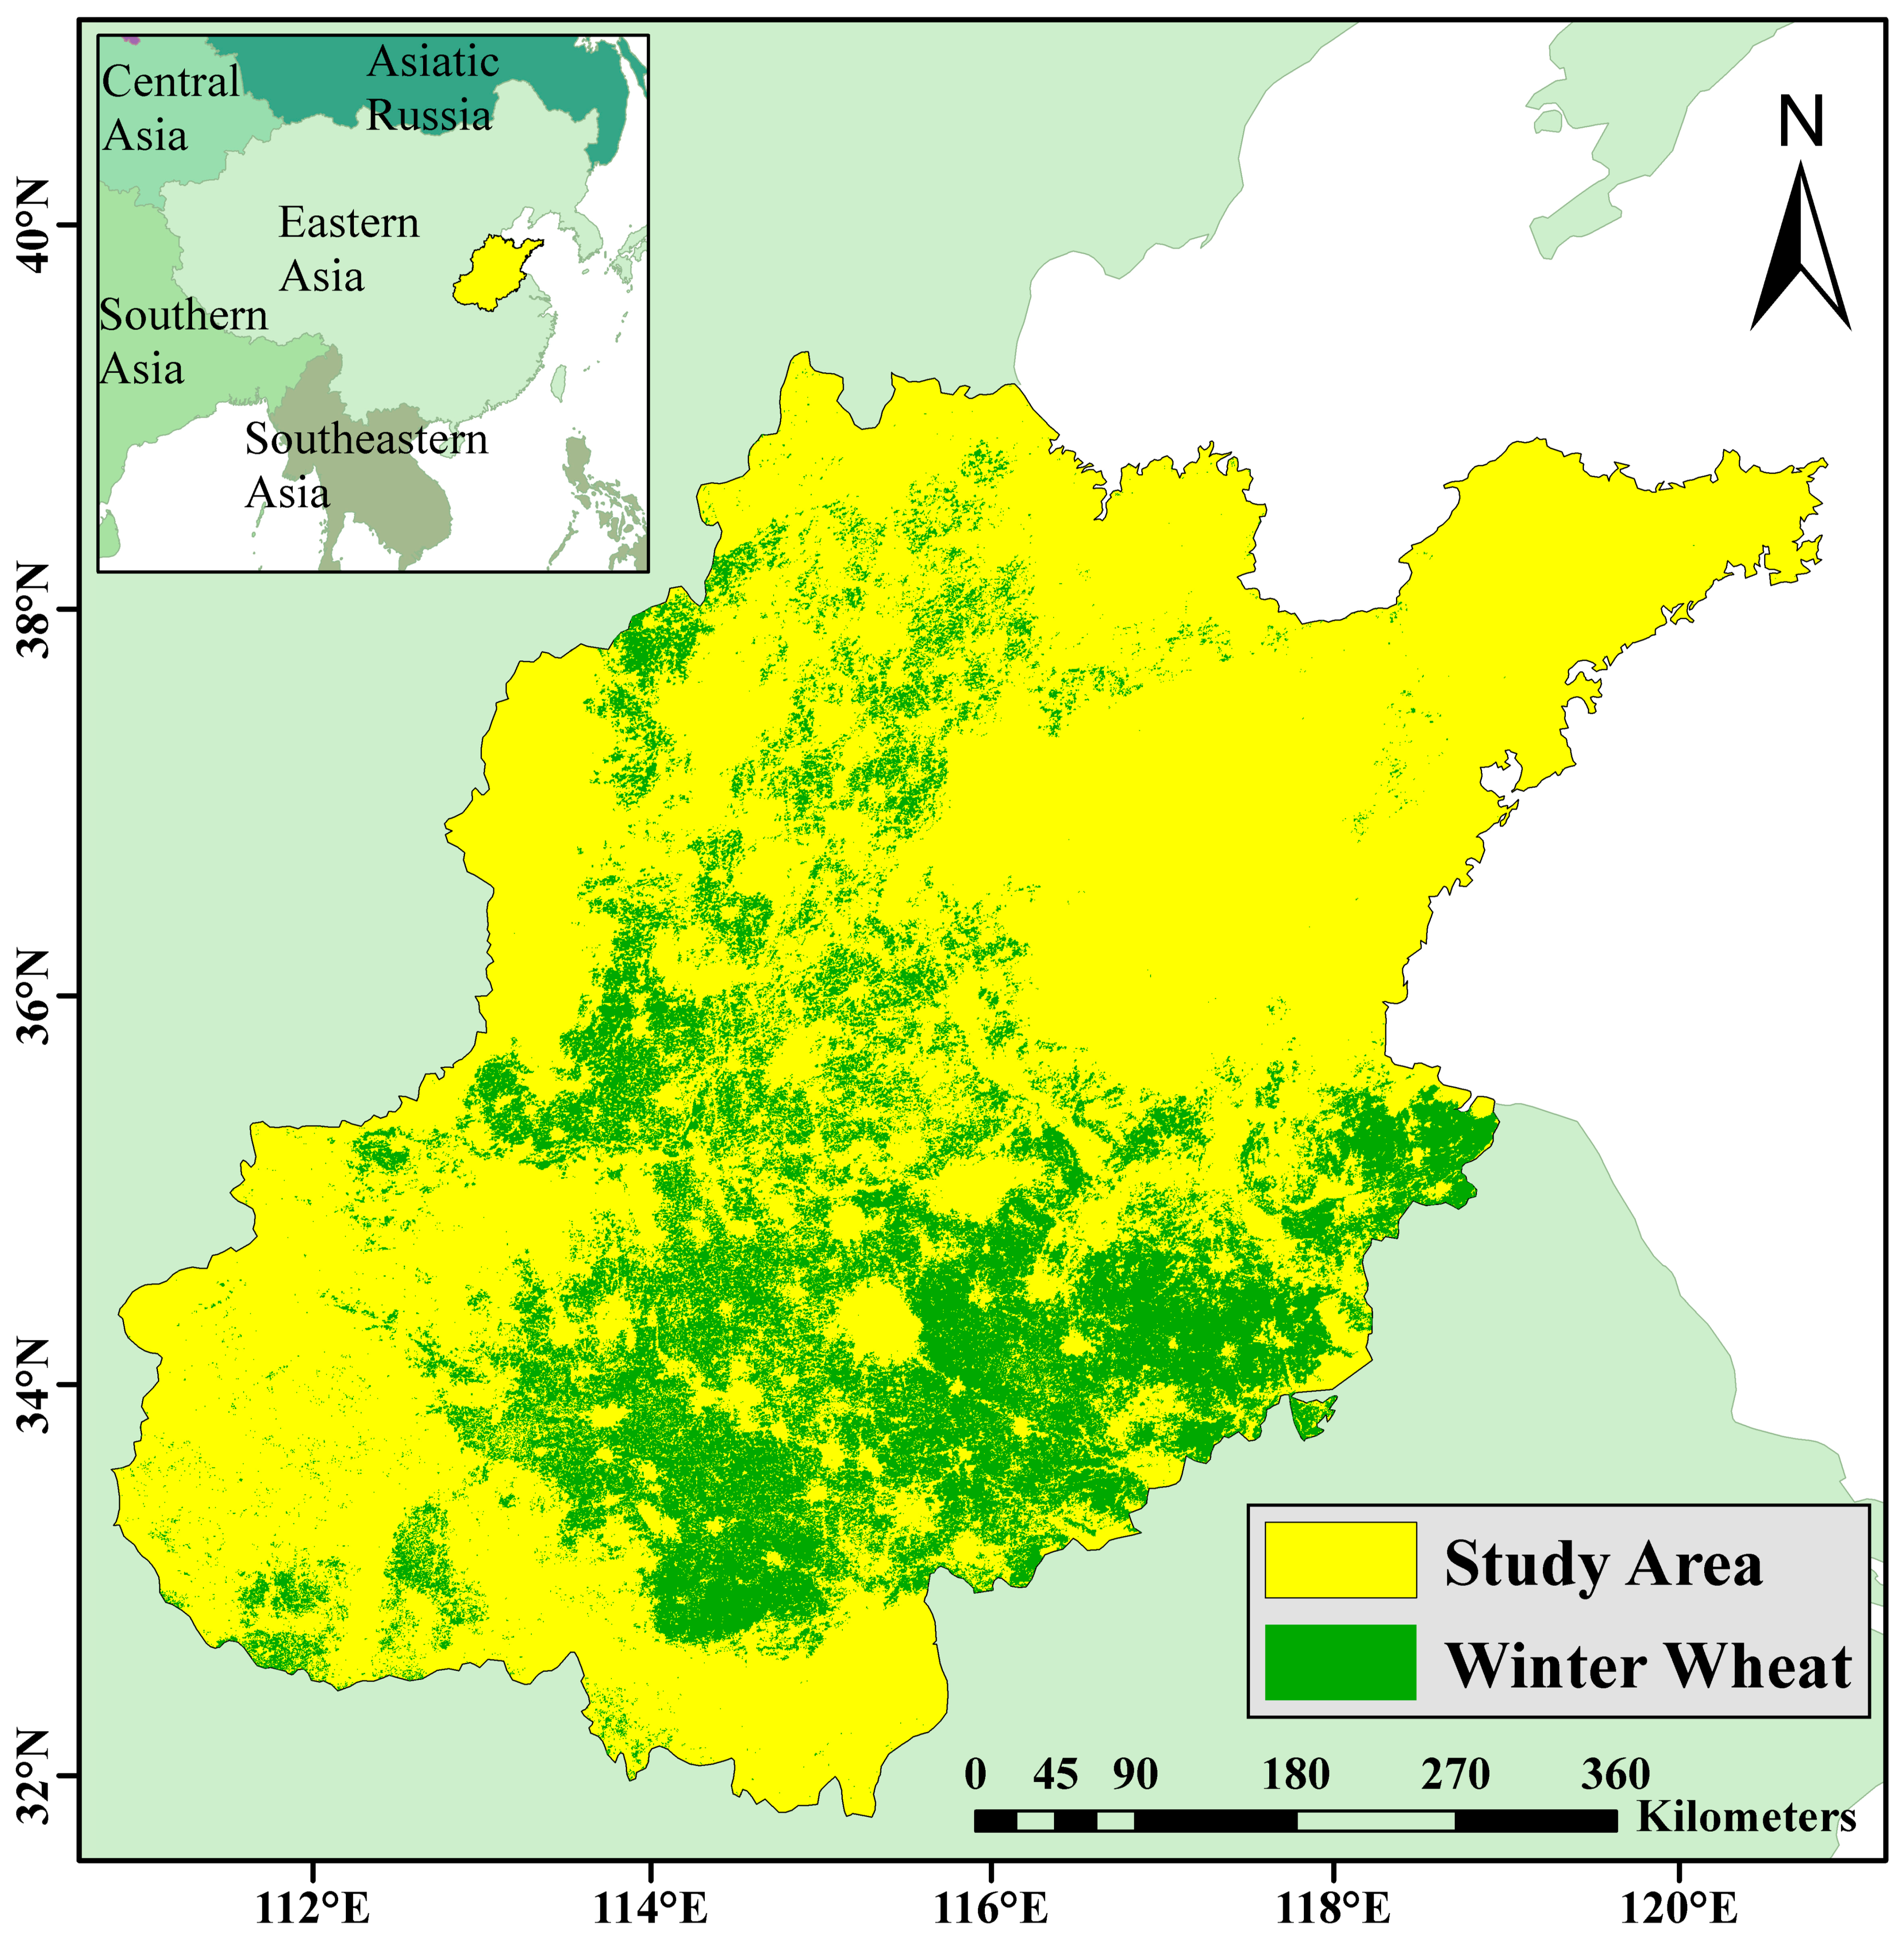
2.1. Study Area

The NCP is the largest agricultural region in China (approximately 400,000 km2) and is the main wheat-producing region in East Asia. Our study area is a wheat–maize rotation cropping system with relatively adequate irrigation and fertilizer (Figure 1) [46]. In this area, winter wheat is sowed in October and harvested in June of the following year. Although most studies have concluded that climate warming has reduced global wheat production, the actual yields in the NCP have in fact increased over the past 50 decades [47,48]. The adaptation options and techniques could offset the negative impact of climate warming [31,49]. Due to the interaction between climate warming and non-climate effects, the phenological change in this region will be more uncertain in the future.

2.2. Phenological Metrics from Remotely Sensed LAI Data

The LAI product (MCD15A3H) was a four-day composite dataset with 500 m pixel size, including the best pixel available from all the acquisitions of the Moderate Resolution Imaging Spectroradiometer from within the four-day period (https://lpdaac.usgs.gov/products/mcd15a3hv006/). The LAI data during winter wheat growing seasons from 2003 to 2018 were obtained from the website of the Earth Observing System Data and Information System (EOSDIS) (https://search.earthdata.nasa.gov/).
In this study, the time series of remotely sensed LAI data were used to estimate winter wheat phenological metrics. Considering the characteristics of winter wheat canopy structure, LAI time series could be consistent with field phenological observations [50]. Due to cloud and haze effects, a filtering algorithm was applied to remove noise [51]. In this study, the Harmonic Analysis of Time Series (HANTS) filtering algorithm was used to fit the curve on a pixel-by-pixel basis using the ENVI image analysis software (version 5.3) and Interactive Data Language (IDL, version 8.5). Moreover, it is certain that the HANTS filtering algorithm can be used to detect vegetation phenology [52,53].
This study used the threshold-based method to estimate phenological metrics. The threshold-based method has been proven to be an acceptable method for estimating phenological information [24,37,54]. The phenological node was defined as the fitted curve reaching a fixed threshold. In this study, the heading date (HD) was defined as the corresponding date of the maximum LAI value for each year, and the maturity date (MD) of winter wheat was defined as the date when the fitted curve of the LAI time series reached 20% of its maximum amplitude for each year [24,37]. The length of the reproductive growth period was calculated as the number of days between the HD and MD for each year.

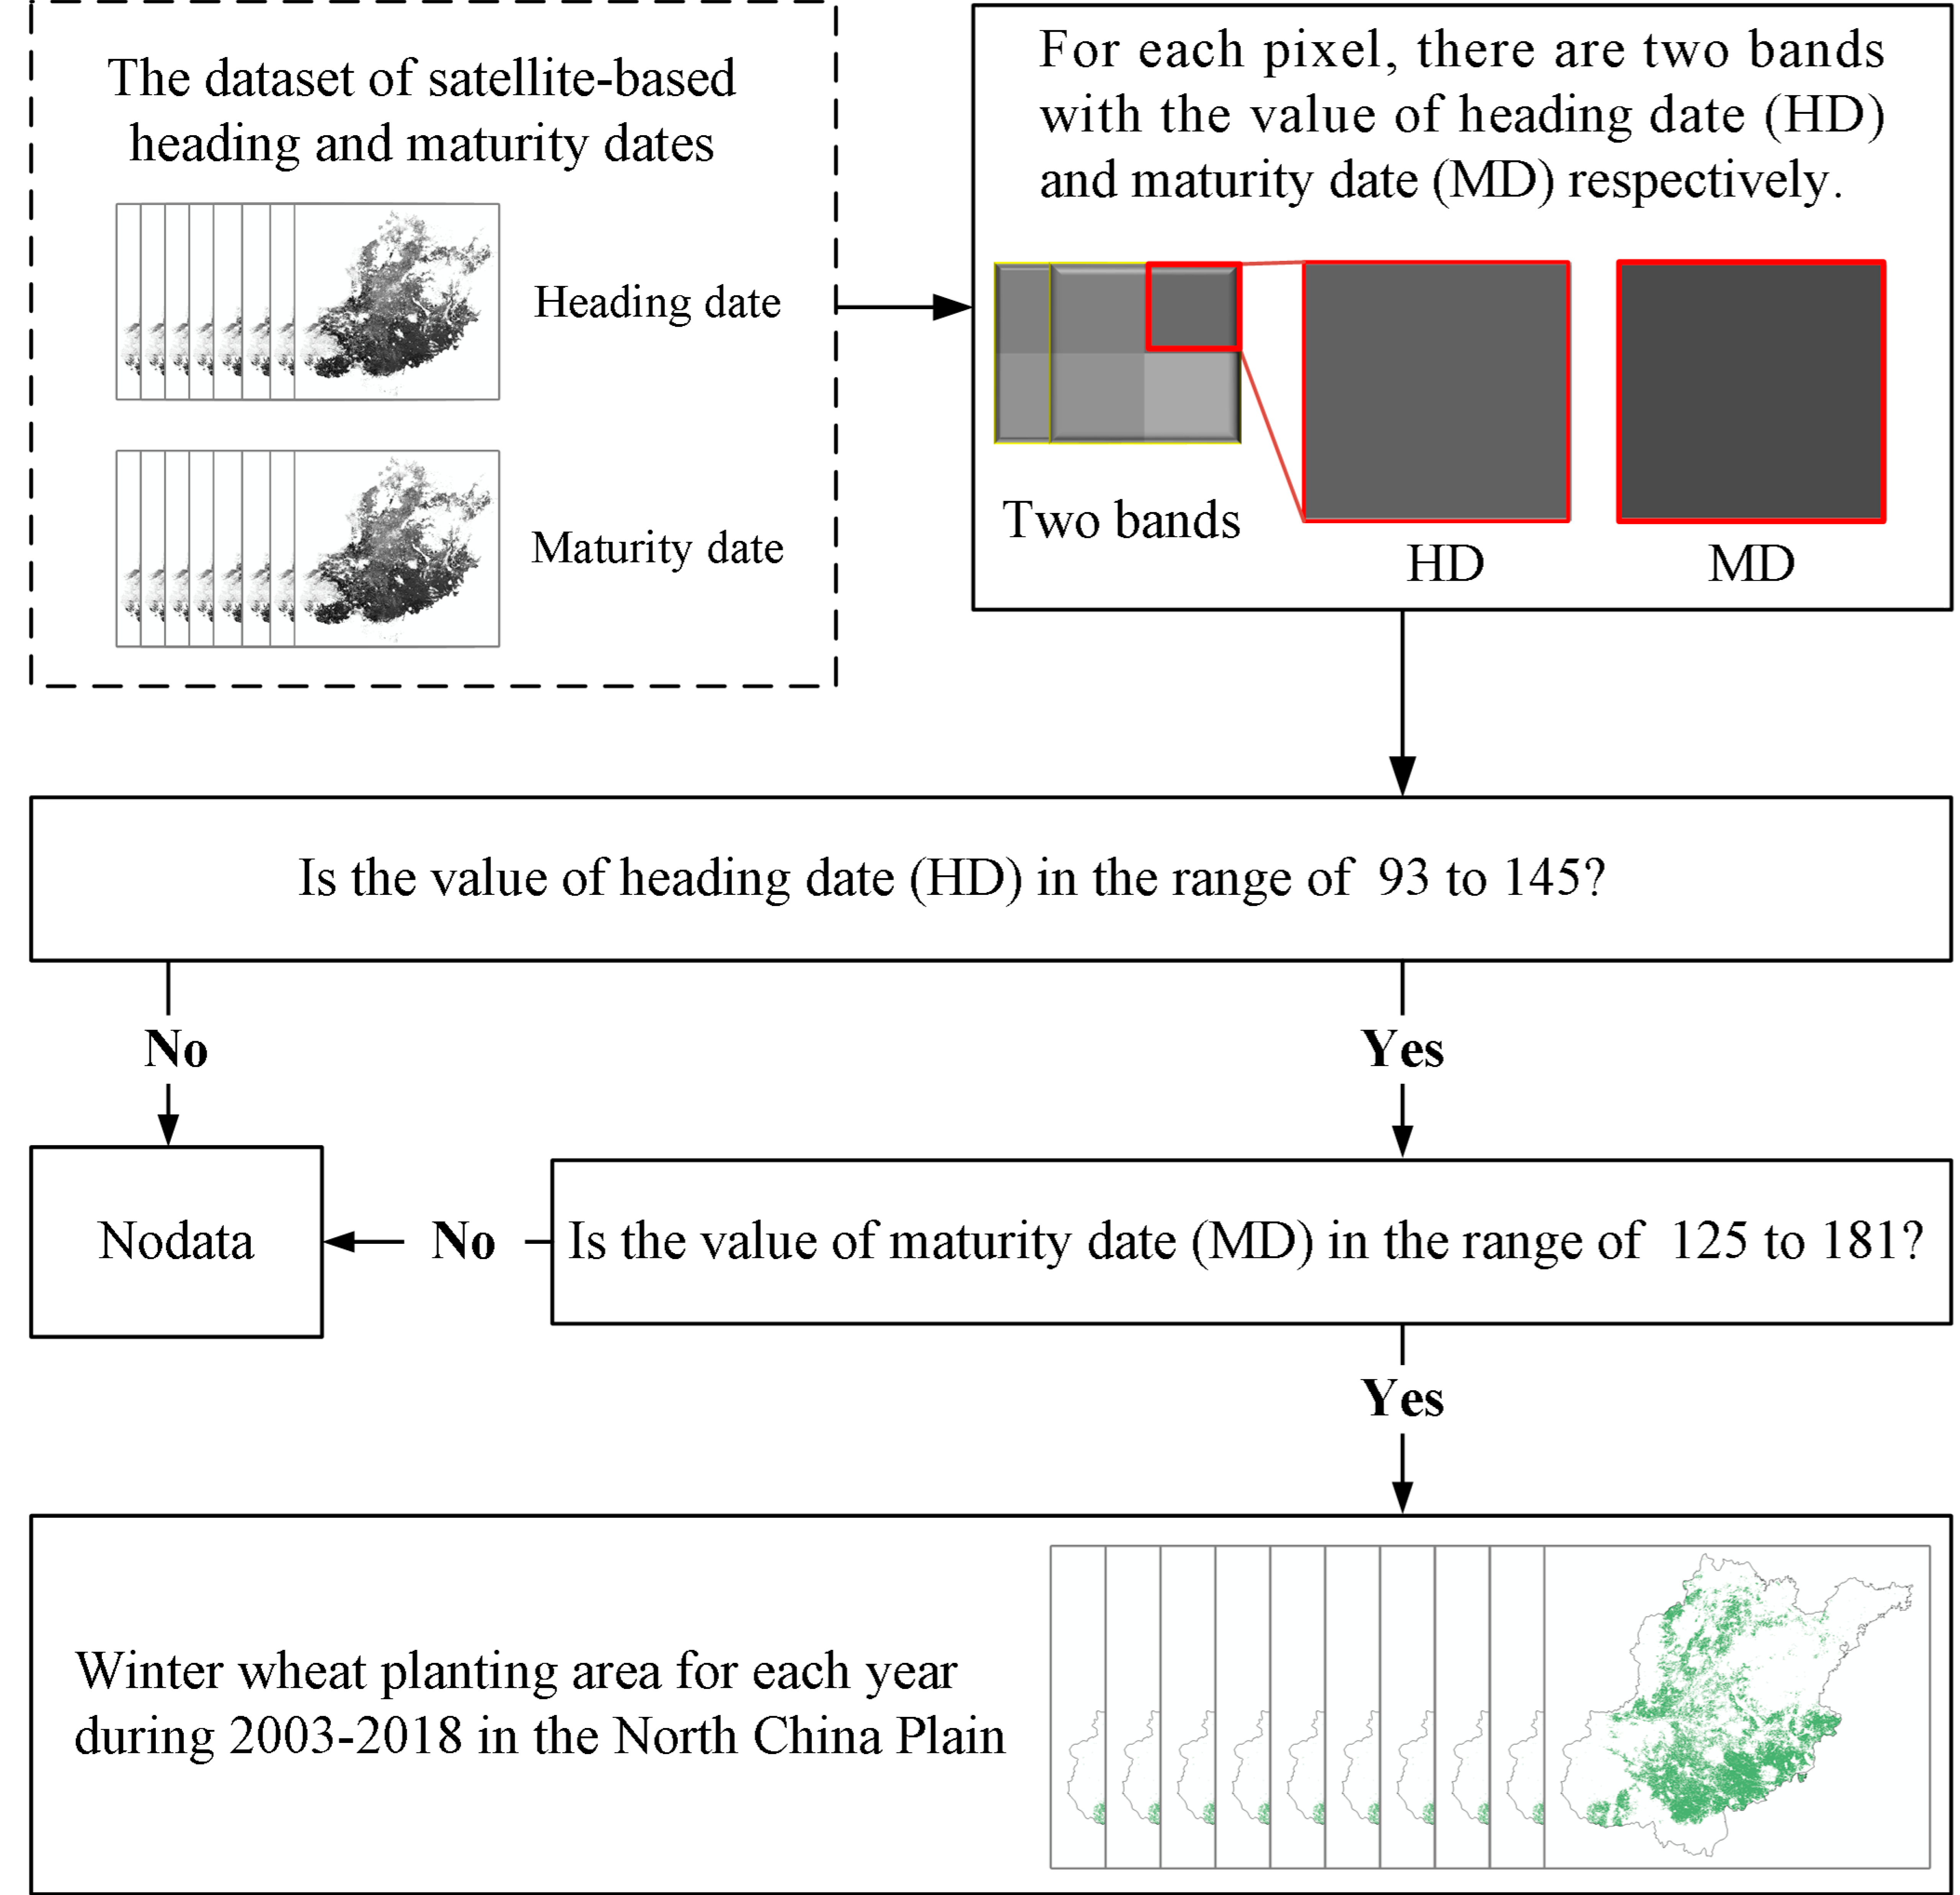
2.3. Winter Wheat Planting Area

Most of the previous studies analyzed the change in wheat phenology with the assumption that the wheat planting area was unchanged during the research period [24,36]. However, this assumption could lead to a high uncertainty of estimated wheat phenology in each pixel. In this study, the winter wheat planting area for each year was extracted based on a simple decision tree method. Decision tree has been widely used in land cover classification and can improve our results [55,56]. A binary decision tree was built to distinguish the pure pixels of winter wheat from other pixels (the non-winter-wheat and mixed pixels). The estimated heading and maturity dates (HD and MD) have been specified as two phenological nodes (Figure 2). Based on observational ground phenology data and previous studies, the ranges of the estimated HD and MD were set between day of year (DOY) 93 and 145, and DOY 125 and 181, respectively [23,26,46]. The pixel value should be within both of these ranges, otherwise it would be set to nodata.

2.4. Climate and Observational Ground Phenology Data

Monthly gridded air temperature (T) was obtained from the Global Land Data Assimilation System (GLDAS), with 0.25 arc degrees spatial resolution (https://ldas.gsfc.nasa.gov/) [57]. The heading and maturity dates during the harvest years 2003 to 2018 were obtained from agro-meteorological observation stations (http://data.cma.cn/en/). The performance of satellite-derived phenological metrics was evaluated by using the mean absolute error (MAE):
MAE = 1 m i = 1 m ( y i y ^ i ) 2
where y i and y ^ i are the observed and estimated values, respectively, and m is the number of observations.

2.5. Analysis

A Theil–Sen slope estimator was used to calculate the trends of phenology and temperature for each pixel, respectively [58,59]. Next, the nonparametric Mann–Kendall (M-K) test was used to quantify the statistical significance of the results in pixel scale [60,61]. According to the Z-values from the M-K test, if |Z-value| > 1.65, 1.96, and 2.32, the trend is at the 99%, 95%, and 90% significance level (p < 0.01, 0.05, and 0.1), respectively. Additionally, the Pearson correlation coefficient was calculated to determine the correlation between phenological metrics (the HD and LRGP) and the corresponding mean temperature in pixel scale.
It should be noted that this study used the monthly mean temperature instead of the daily mean temperature in the analysis. Although the daily mean temperature would be more accurate to obtain the real temperature of the corresponding growing season, we had to consider how to match with the satellite-based phenology in each pixel. Here, this study assumed that the mean temperature in March–April and May–June have primary effects on the HD and LRGP, respectively [24].

3. Results

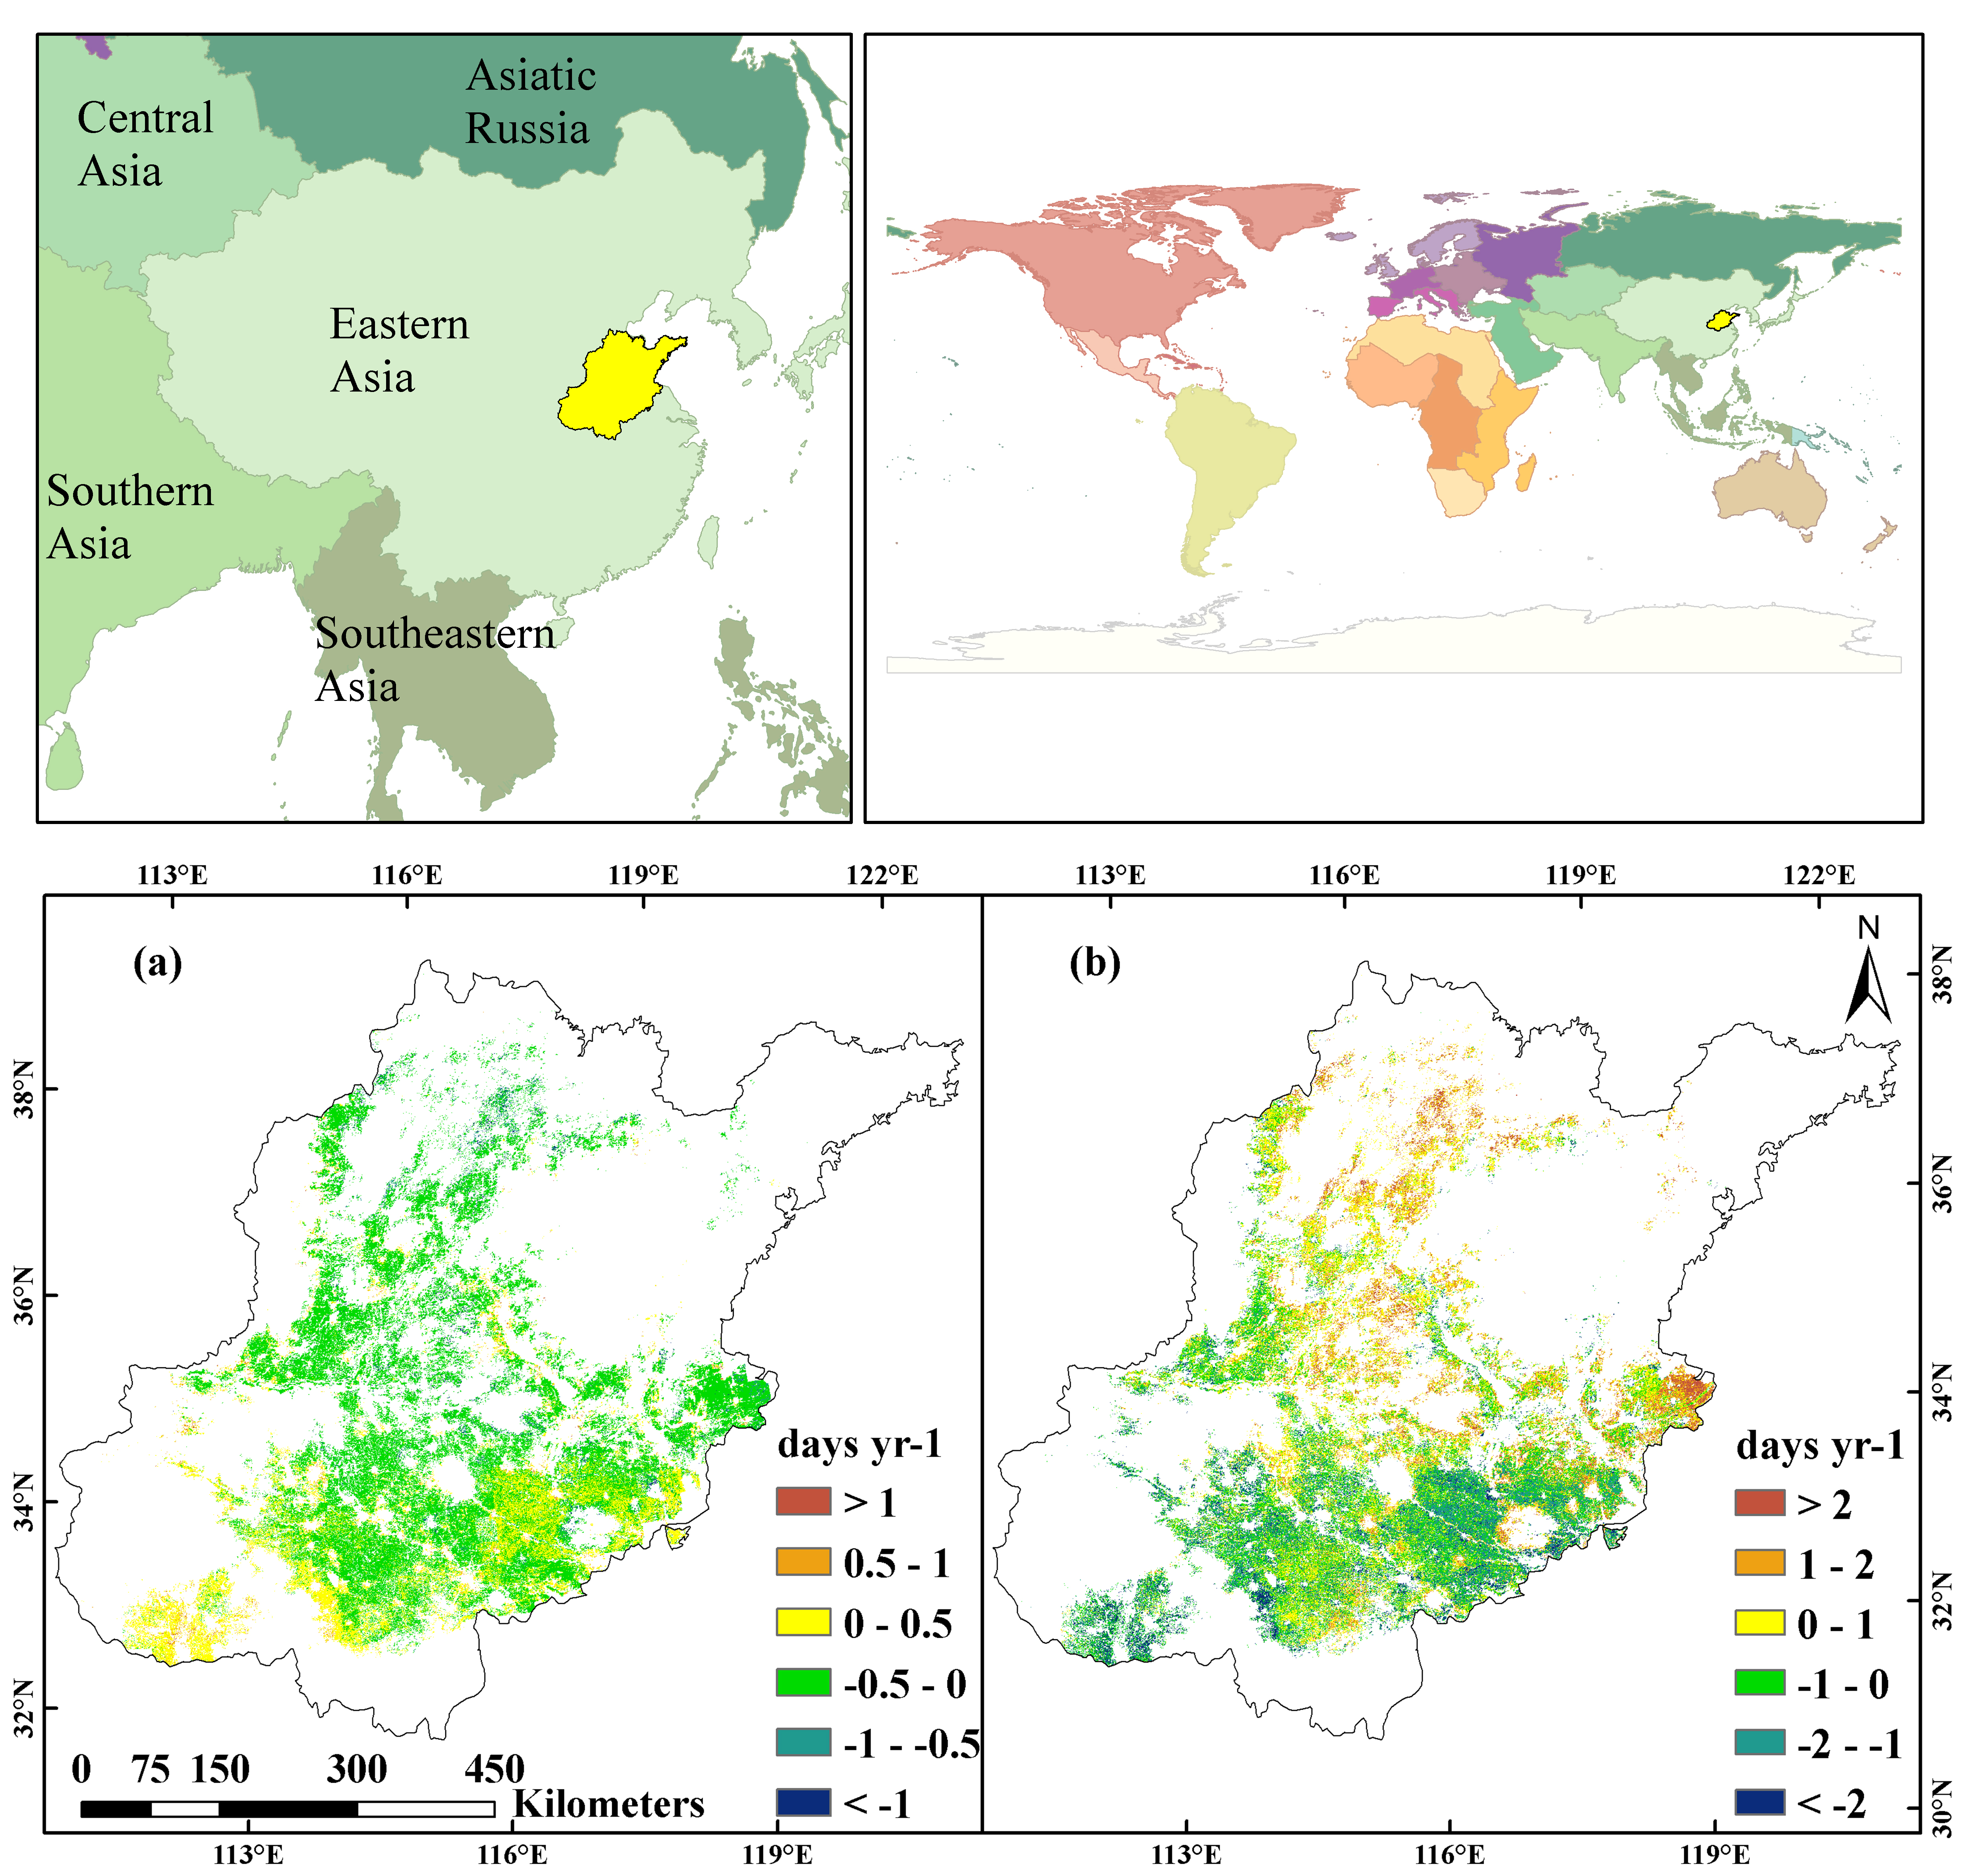
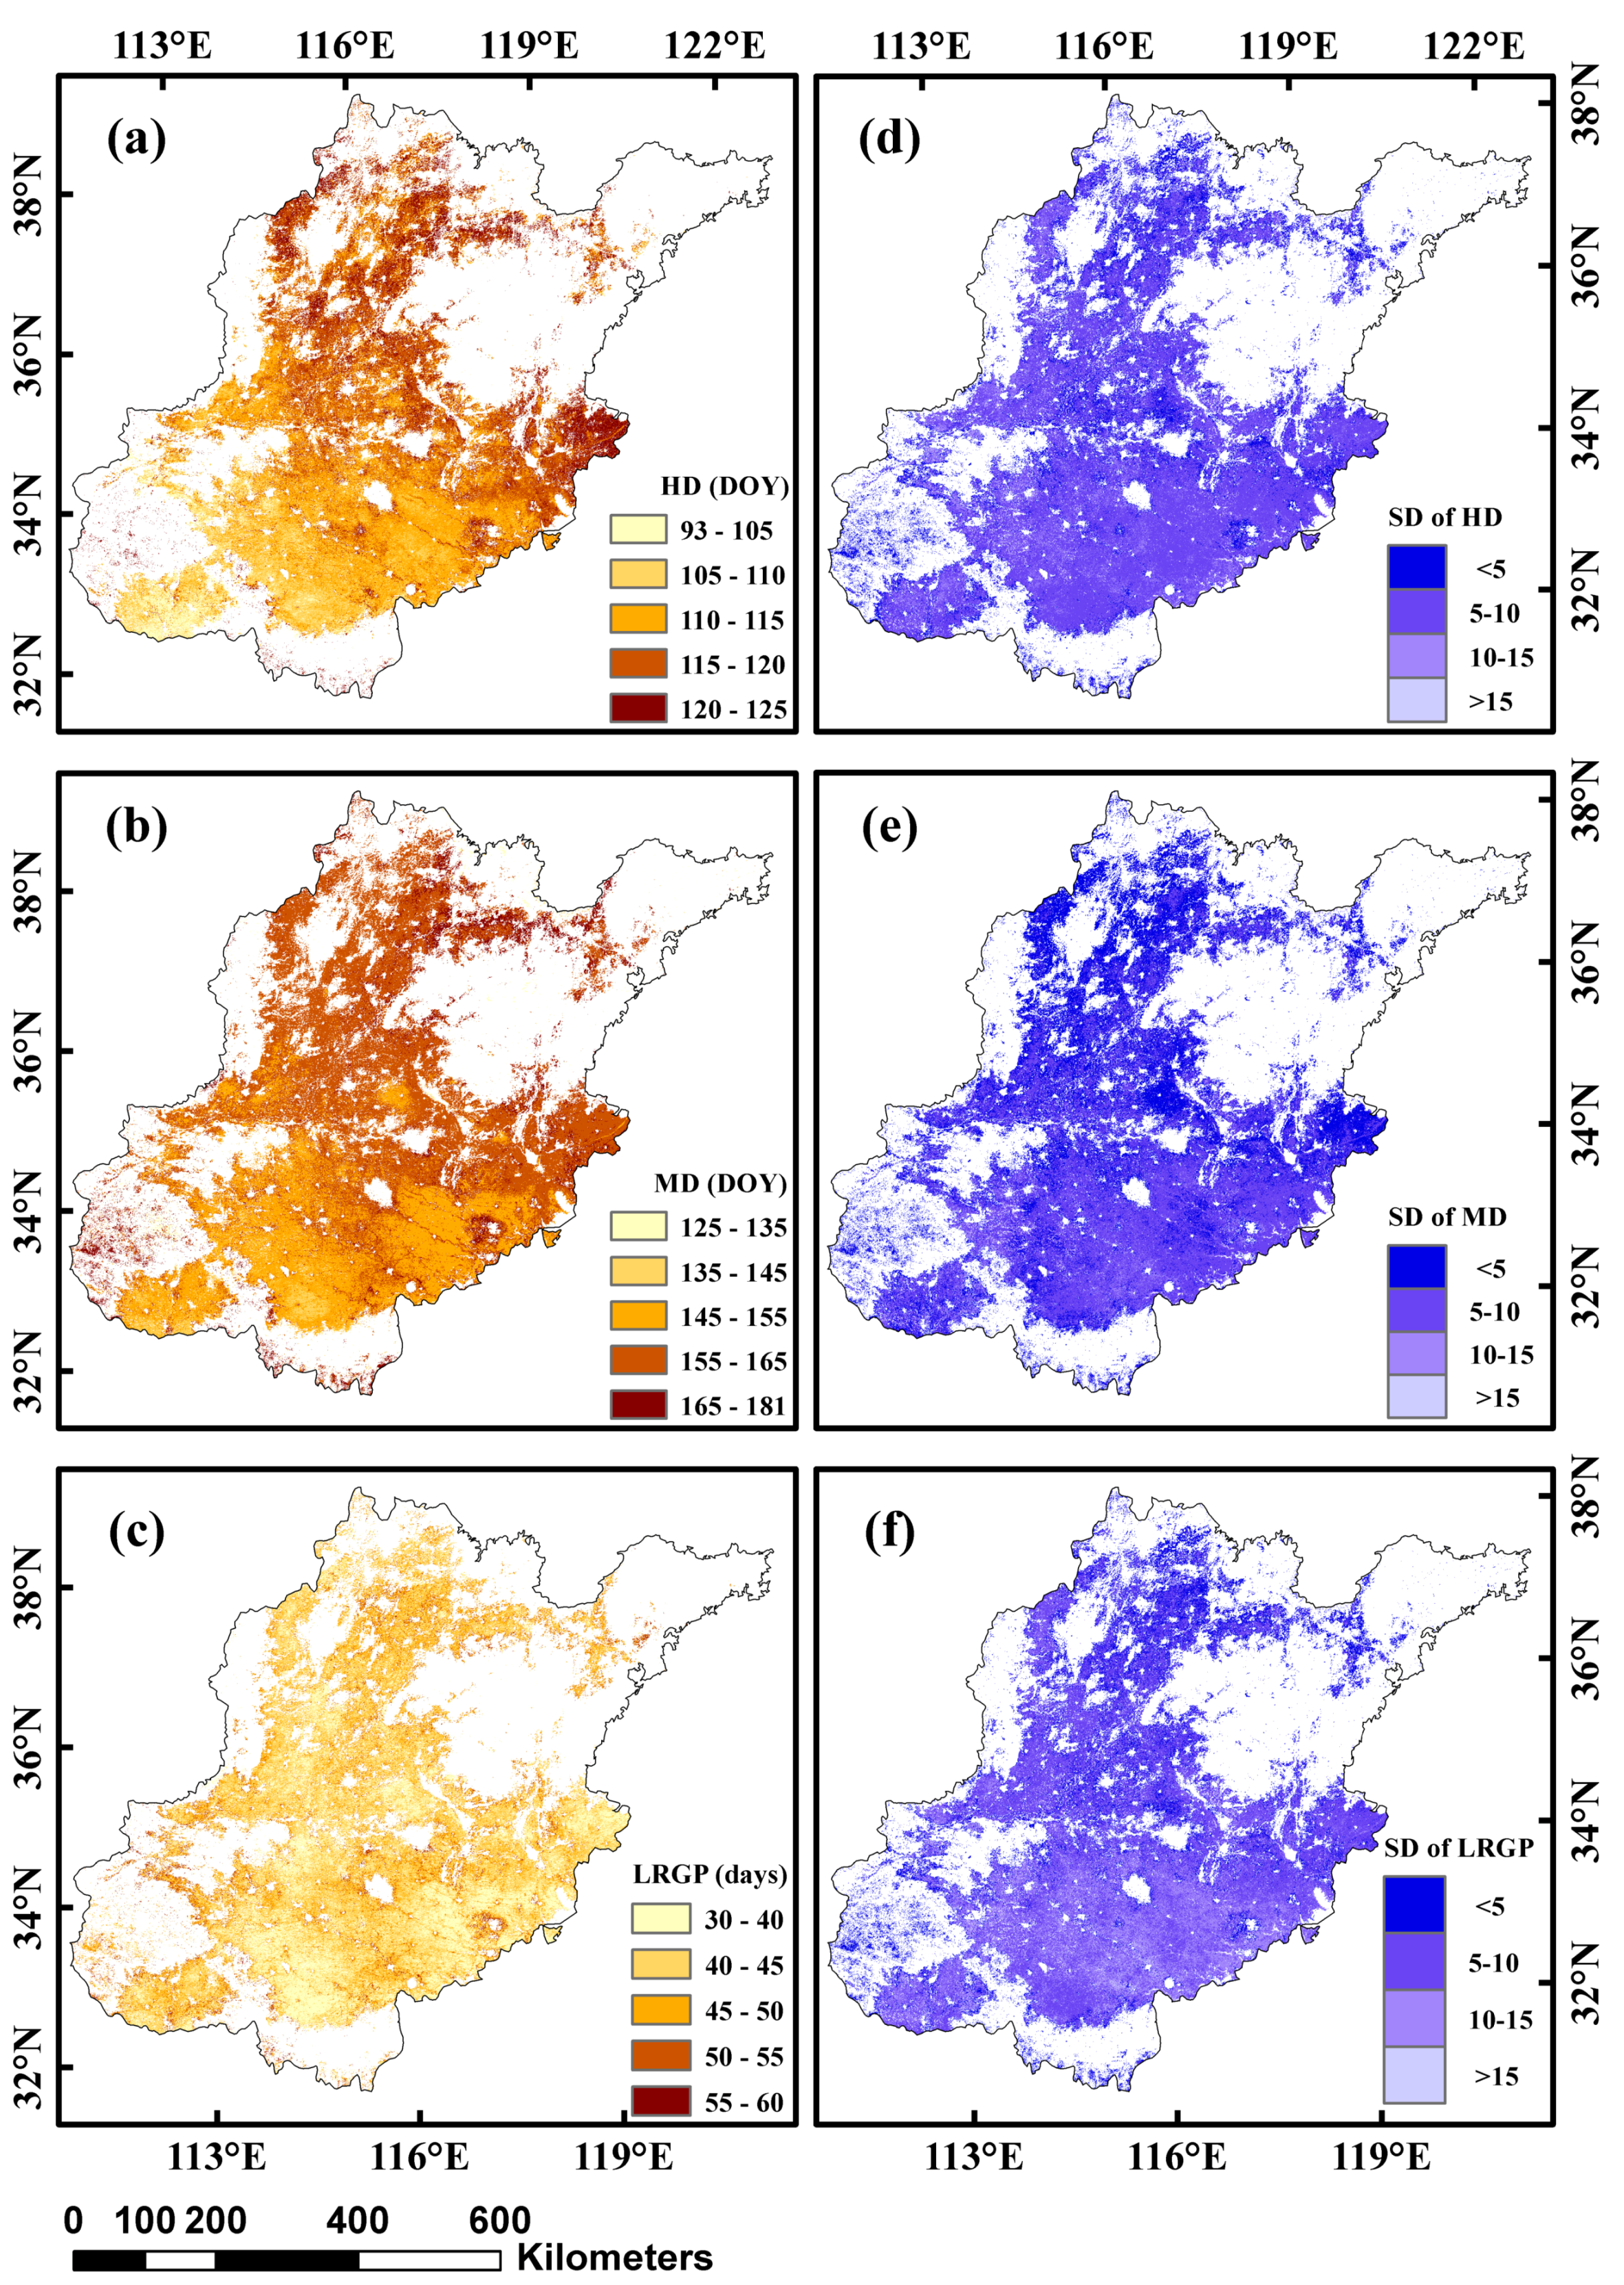
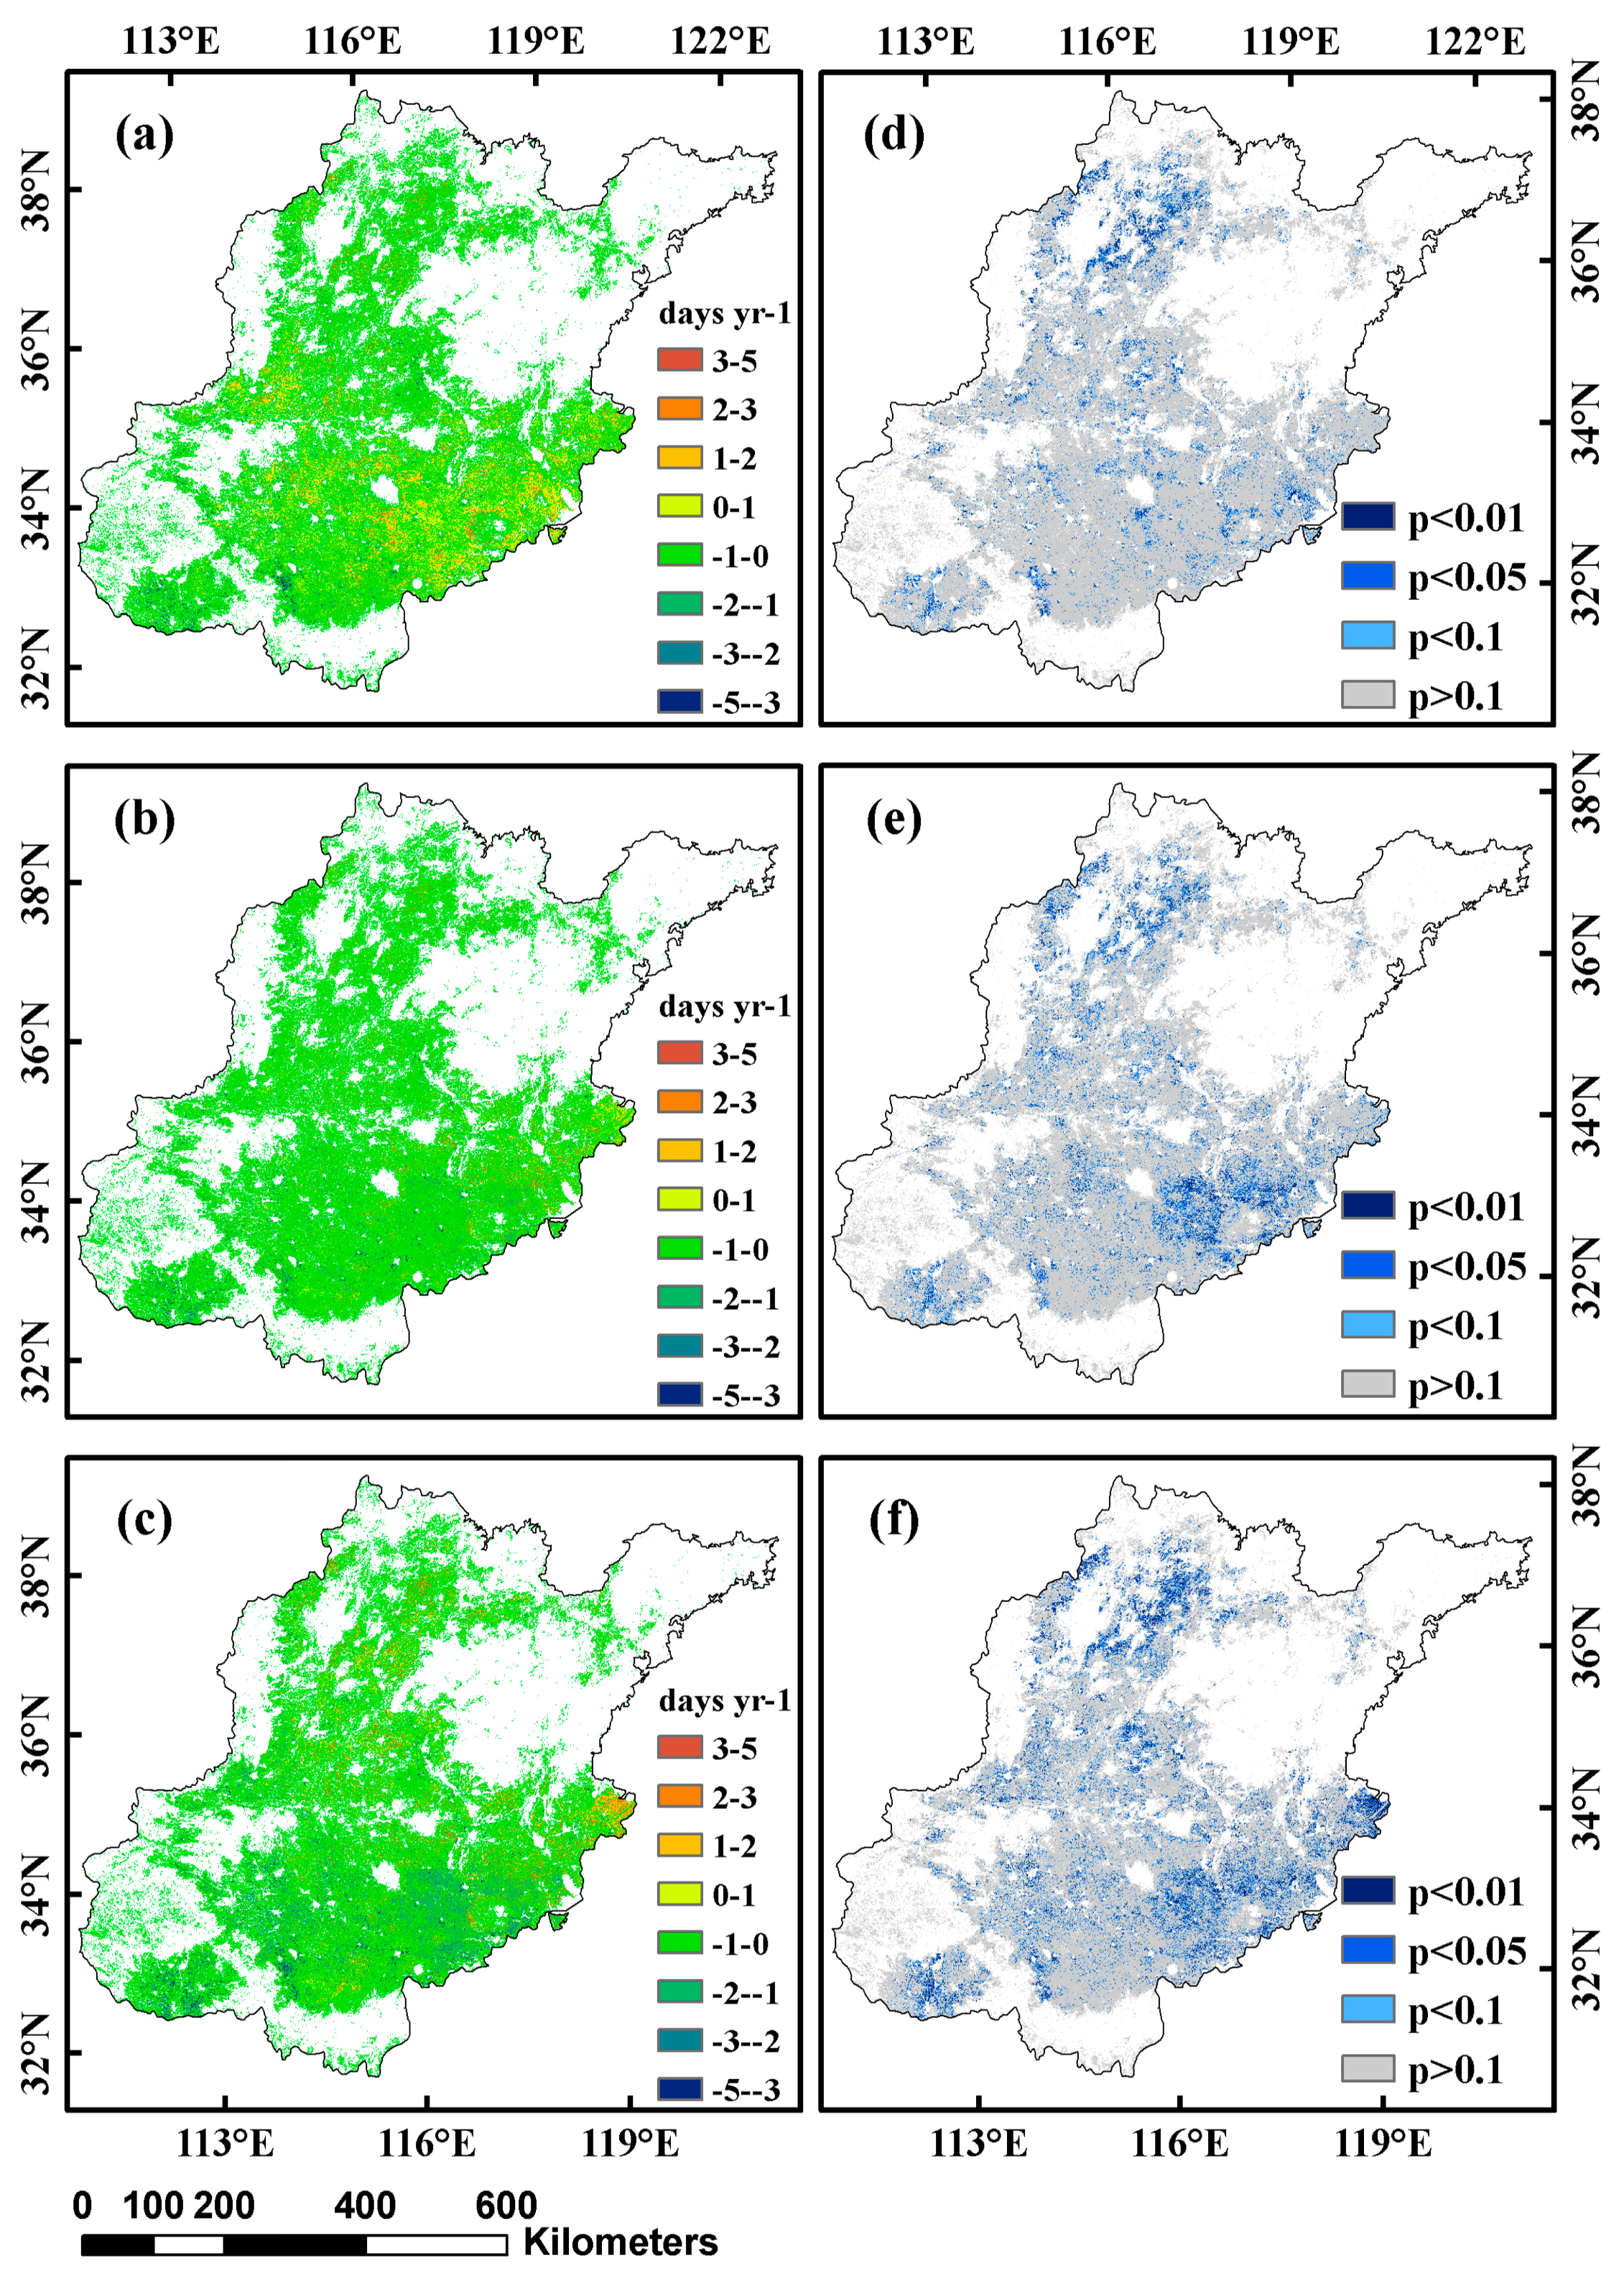
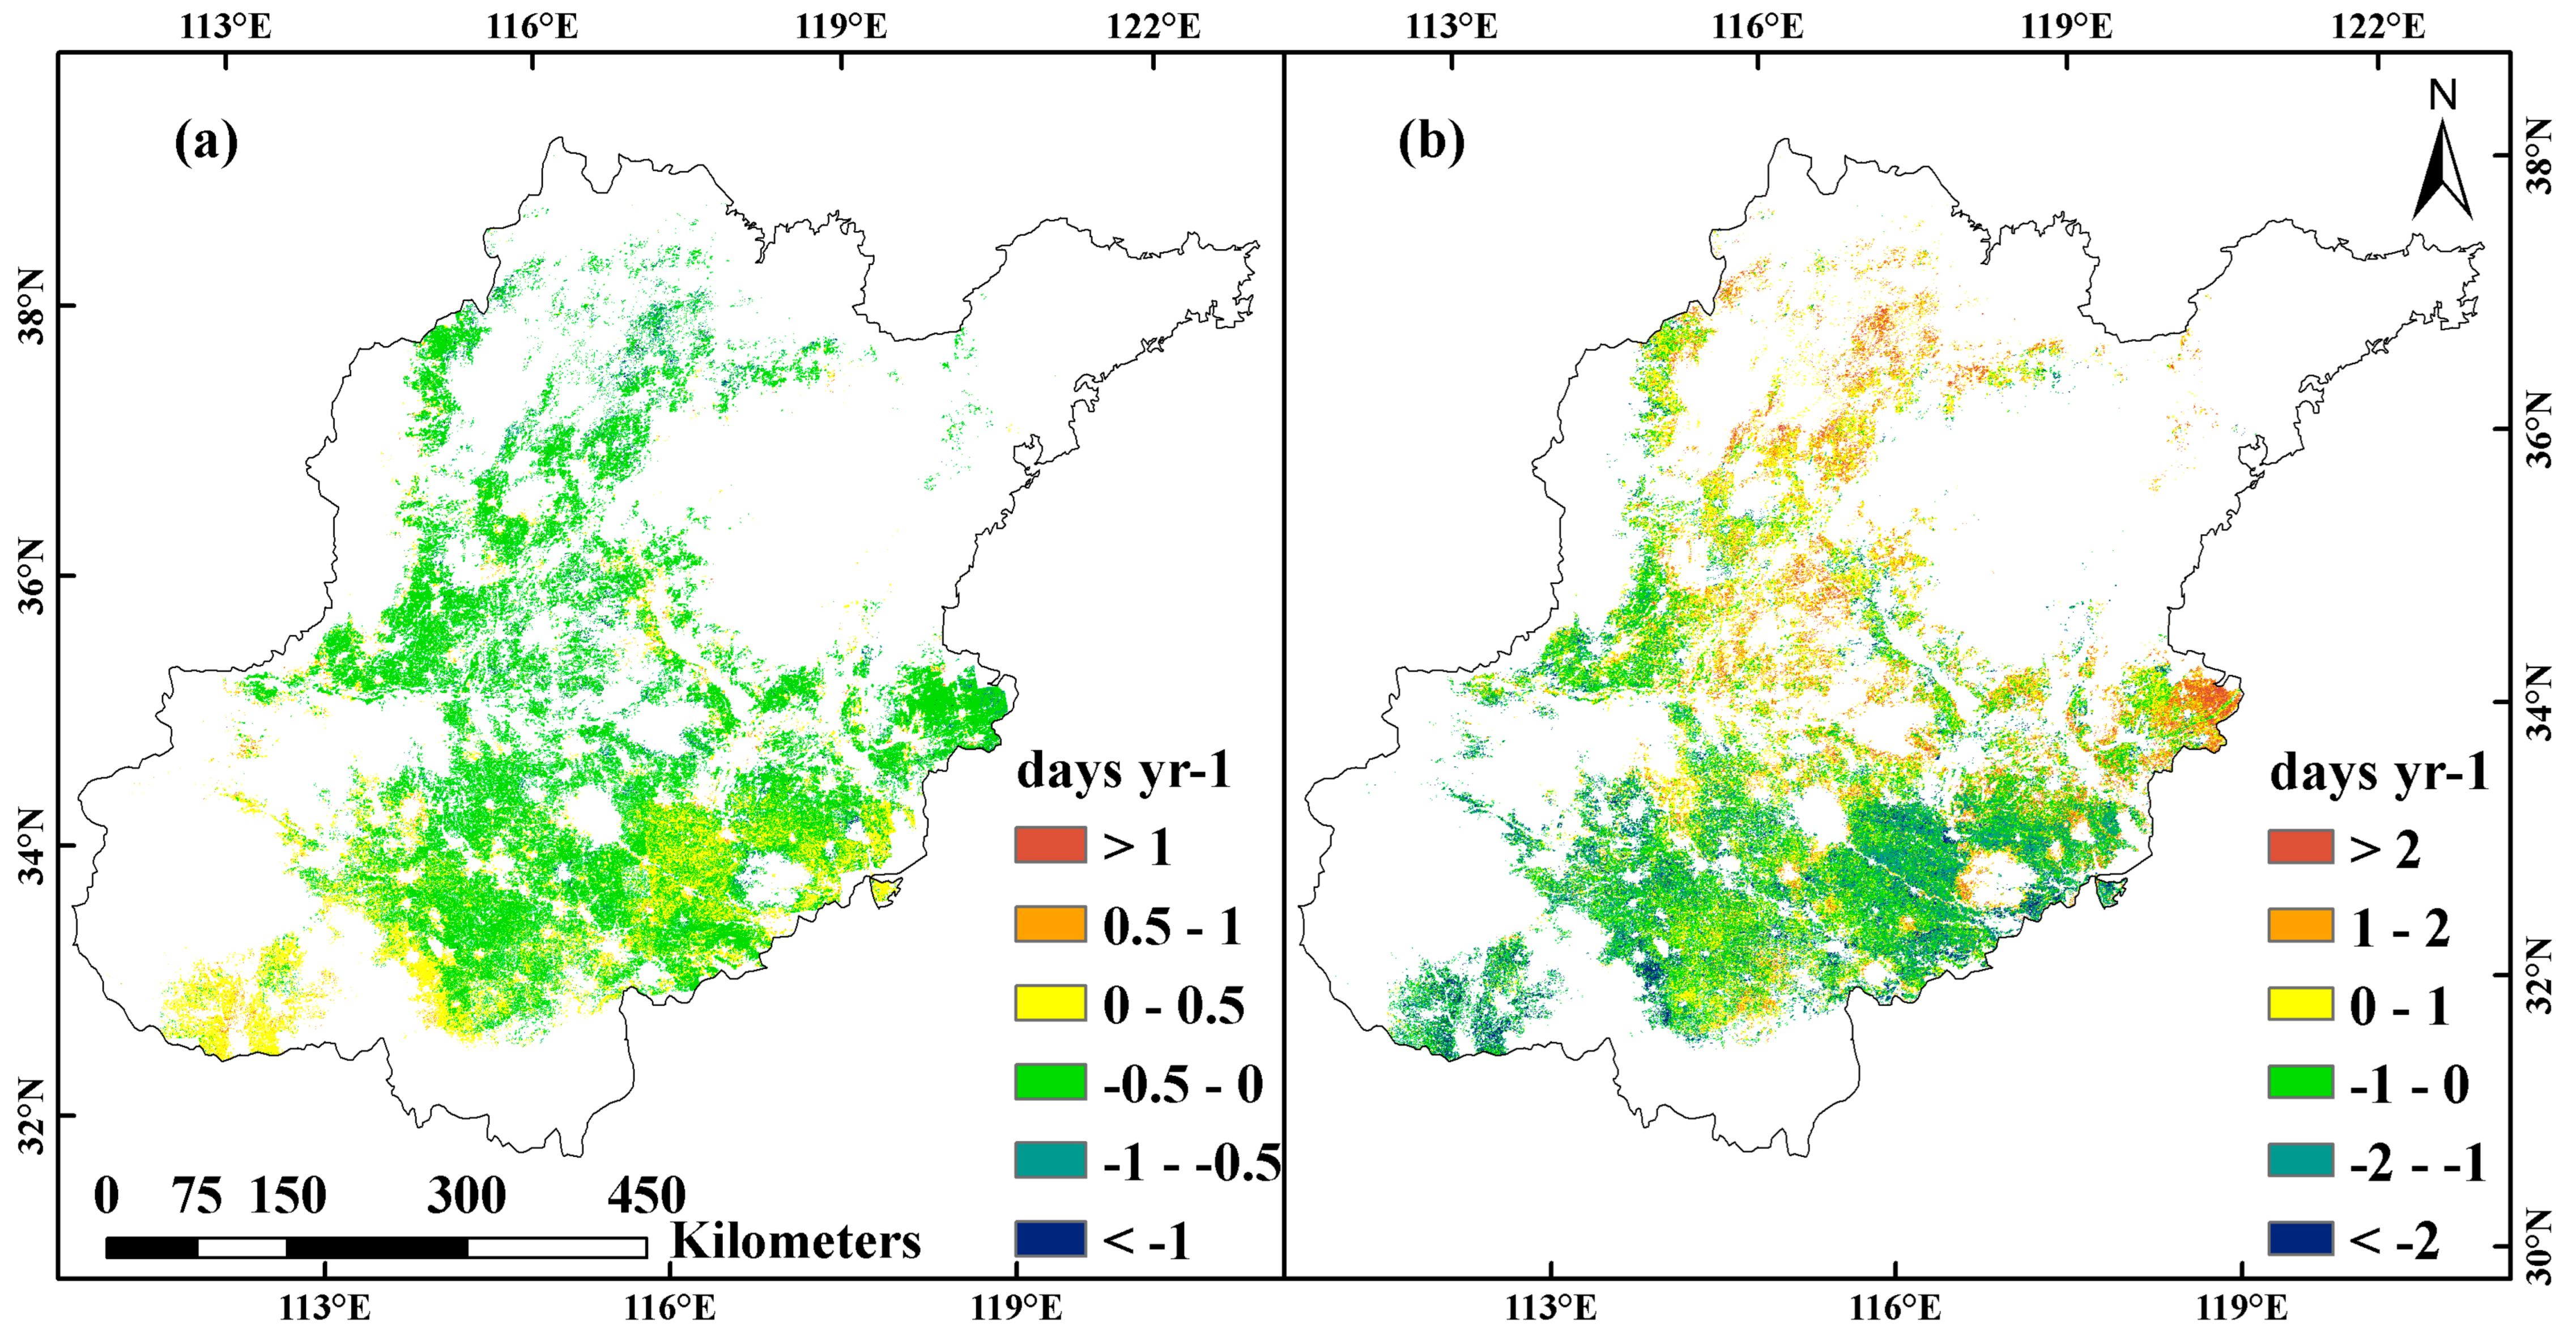
3.1. Spatio-Temporal Changes in Satellite-Based Winter Wheat Phenology

The estimated phenological metrics were validated and compared with ground-observed records (Figure 3). The satellite-based heading date (HD, R = 0.364, p < 0.01) and maturity date (MD, R = 0.851, p < 0.01) both correlated significantly with the ground-observed dates. The mean absolute errors (MAE) of the HD and MD were 8.2 days and 4.5 days, respectively. Overall, threshold-based phenological metrics could be used to produce a robust spatio-temporal distribution of winter wheat phenology.
Figure 4 shows the spatial distributions of the HD, MD, and LRGP averaged from 2003 to 2018 and their standard deviations (SD). Generally, the HD and MD increased from the south to the north, but the LRGP had a relatively stable length of about 40 to 45 days. Our results suggest that across this study area, the winter wheat phenology experienced large spatial differences and inter-annual variations during 2003–2018.
Across the whole NCP, the HD, MD, and LRGP had a mean changing rate of 0.4 days per year, −0.37 days per year, and −0.32 days per year (p < 0.1) (Figure 5), respectively. In pixel scale, the advancement of the HD and MD and the shortening of the LRGP occurred significantly in 4.7%, 1.9%, and 4.3% of the pixels, respectively, which were mostly distributed in the north of the NCP (p < 0.1). On the contrary, the delay trend of the HD and MD and the prolongation of the LRGP were significantly in 8.1%, 14.4%, and 16.4% of the pixels, respectively, and mostly distributed in the south of the NCP (p < 0.1). The spatio-temporal changes in winter wheat phenology showed high spatial heterogeneity. Our findings suggest that the phenological shifts could be responding to some effect factors.

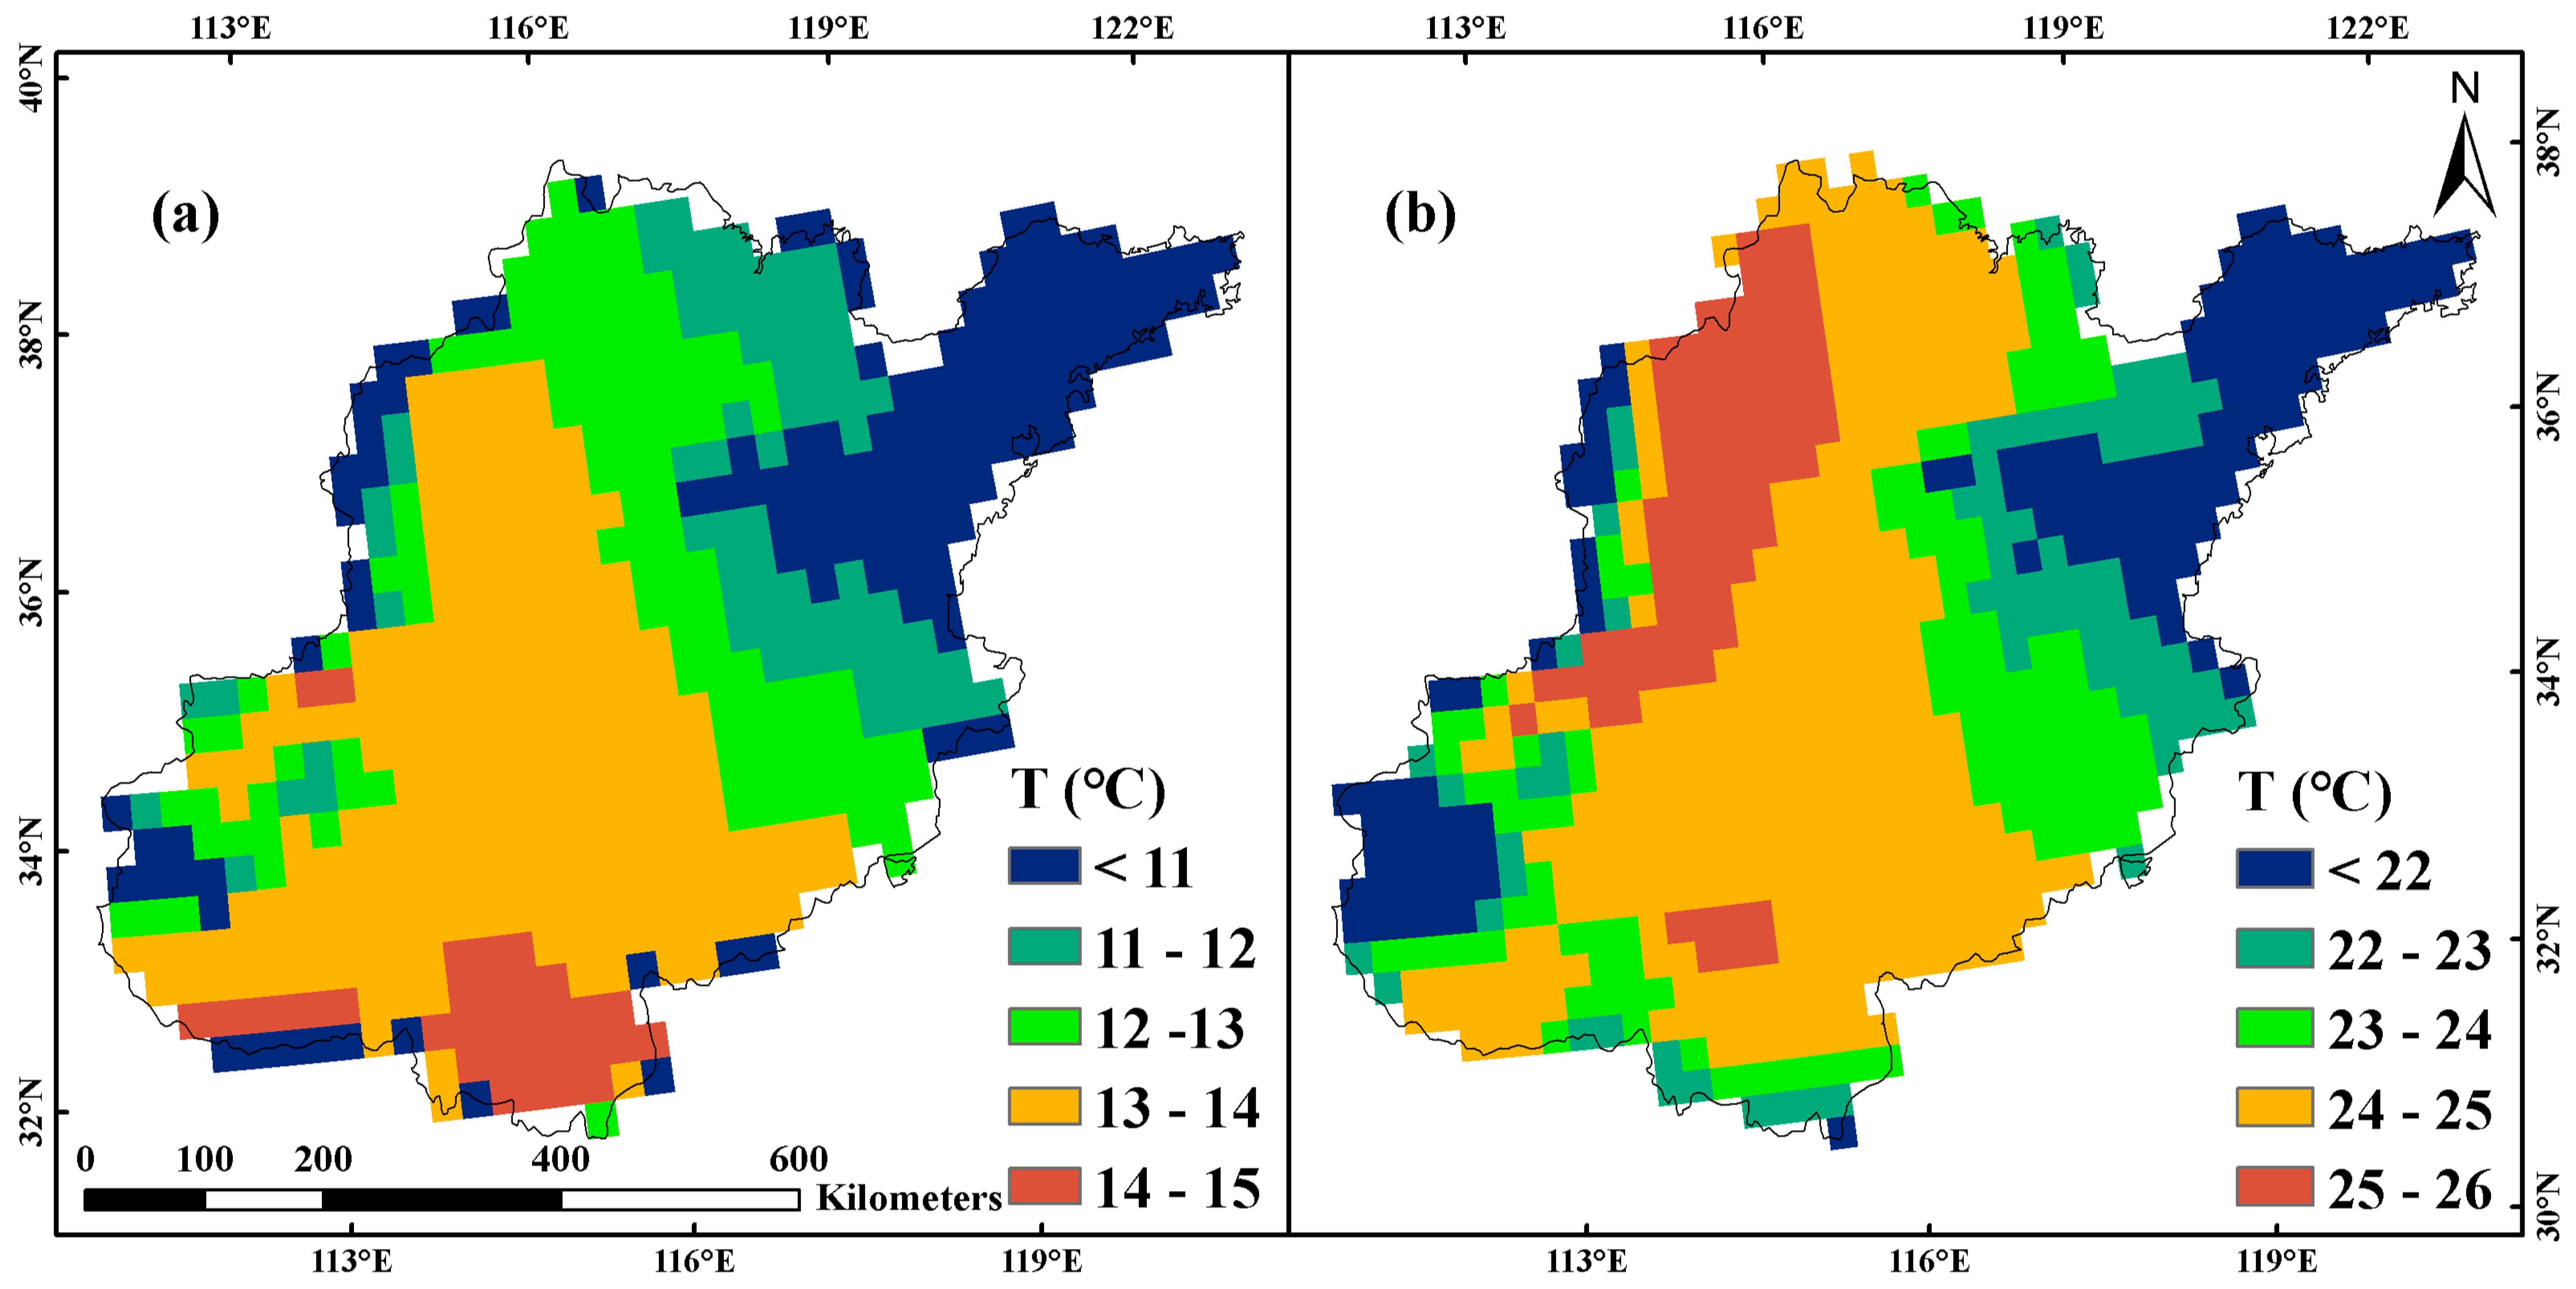
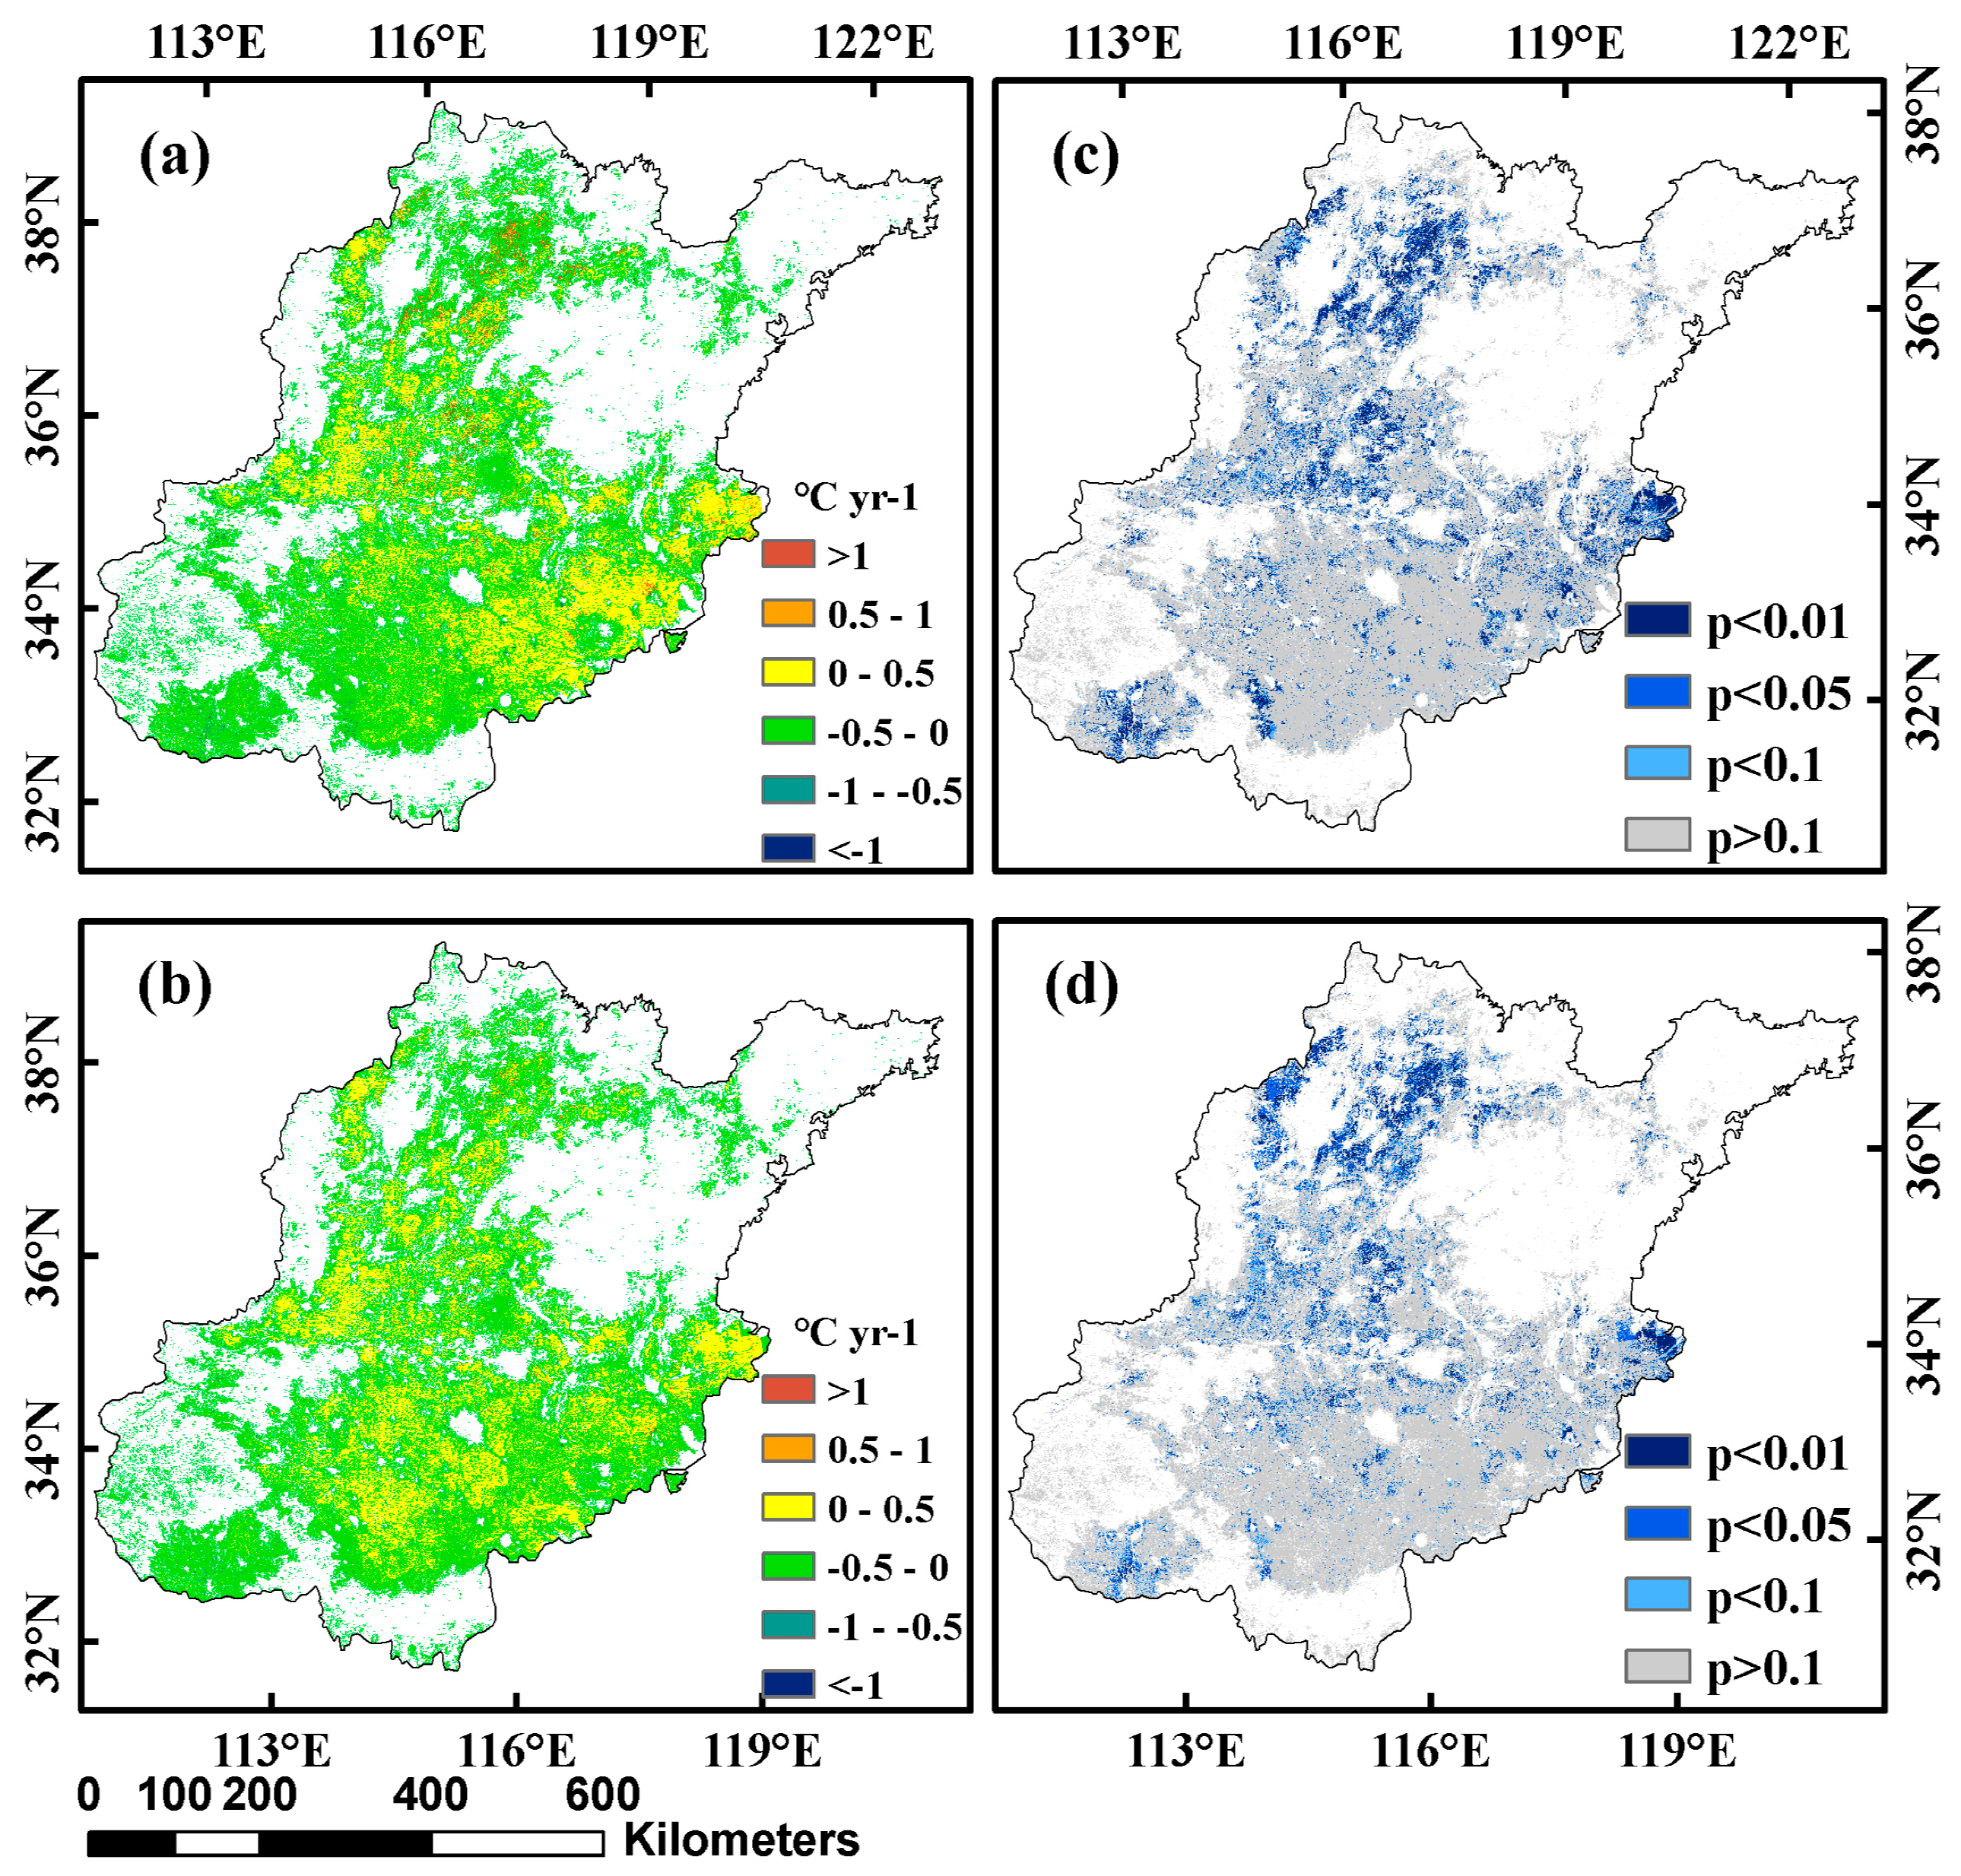
3.2. Spatio-Temporal Changes in Corresponding Mean Temperature

The results showed the spatial distributions of the two-month mean temperature in March–April (two months before the HD) and May–June (two months before the MD), averaged from the harvest year 2003–2018 (Figure 6). Considering the impact of temperature on winter wheat phenology, we further calculated the change in temperature that would further affect the HD and LRGP (Figure 7). Our findings show that the two-month mean temperature in March–April was increased by 0.1 °C per decade during 2003–2018, which could be significant in the north and east part of the NCP. Meanwhile, the two-month mean temperature in May–June increased by 0.6 °C per decade. Overall, the results indicated that the warming trend in spring would be more obvious than in summer across the NCP.

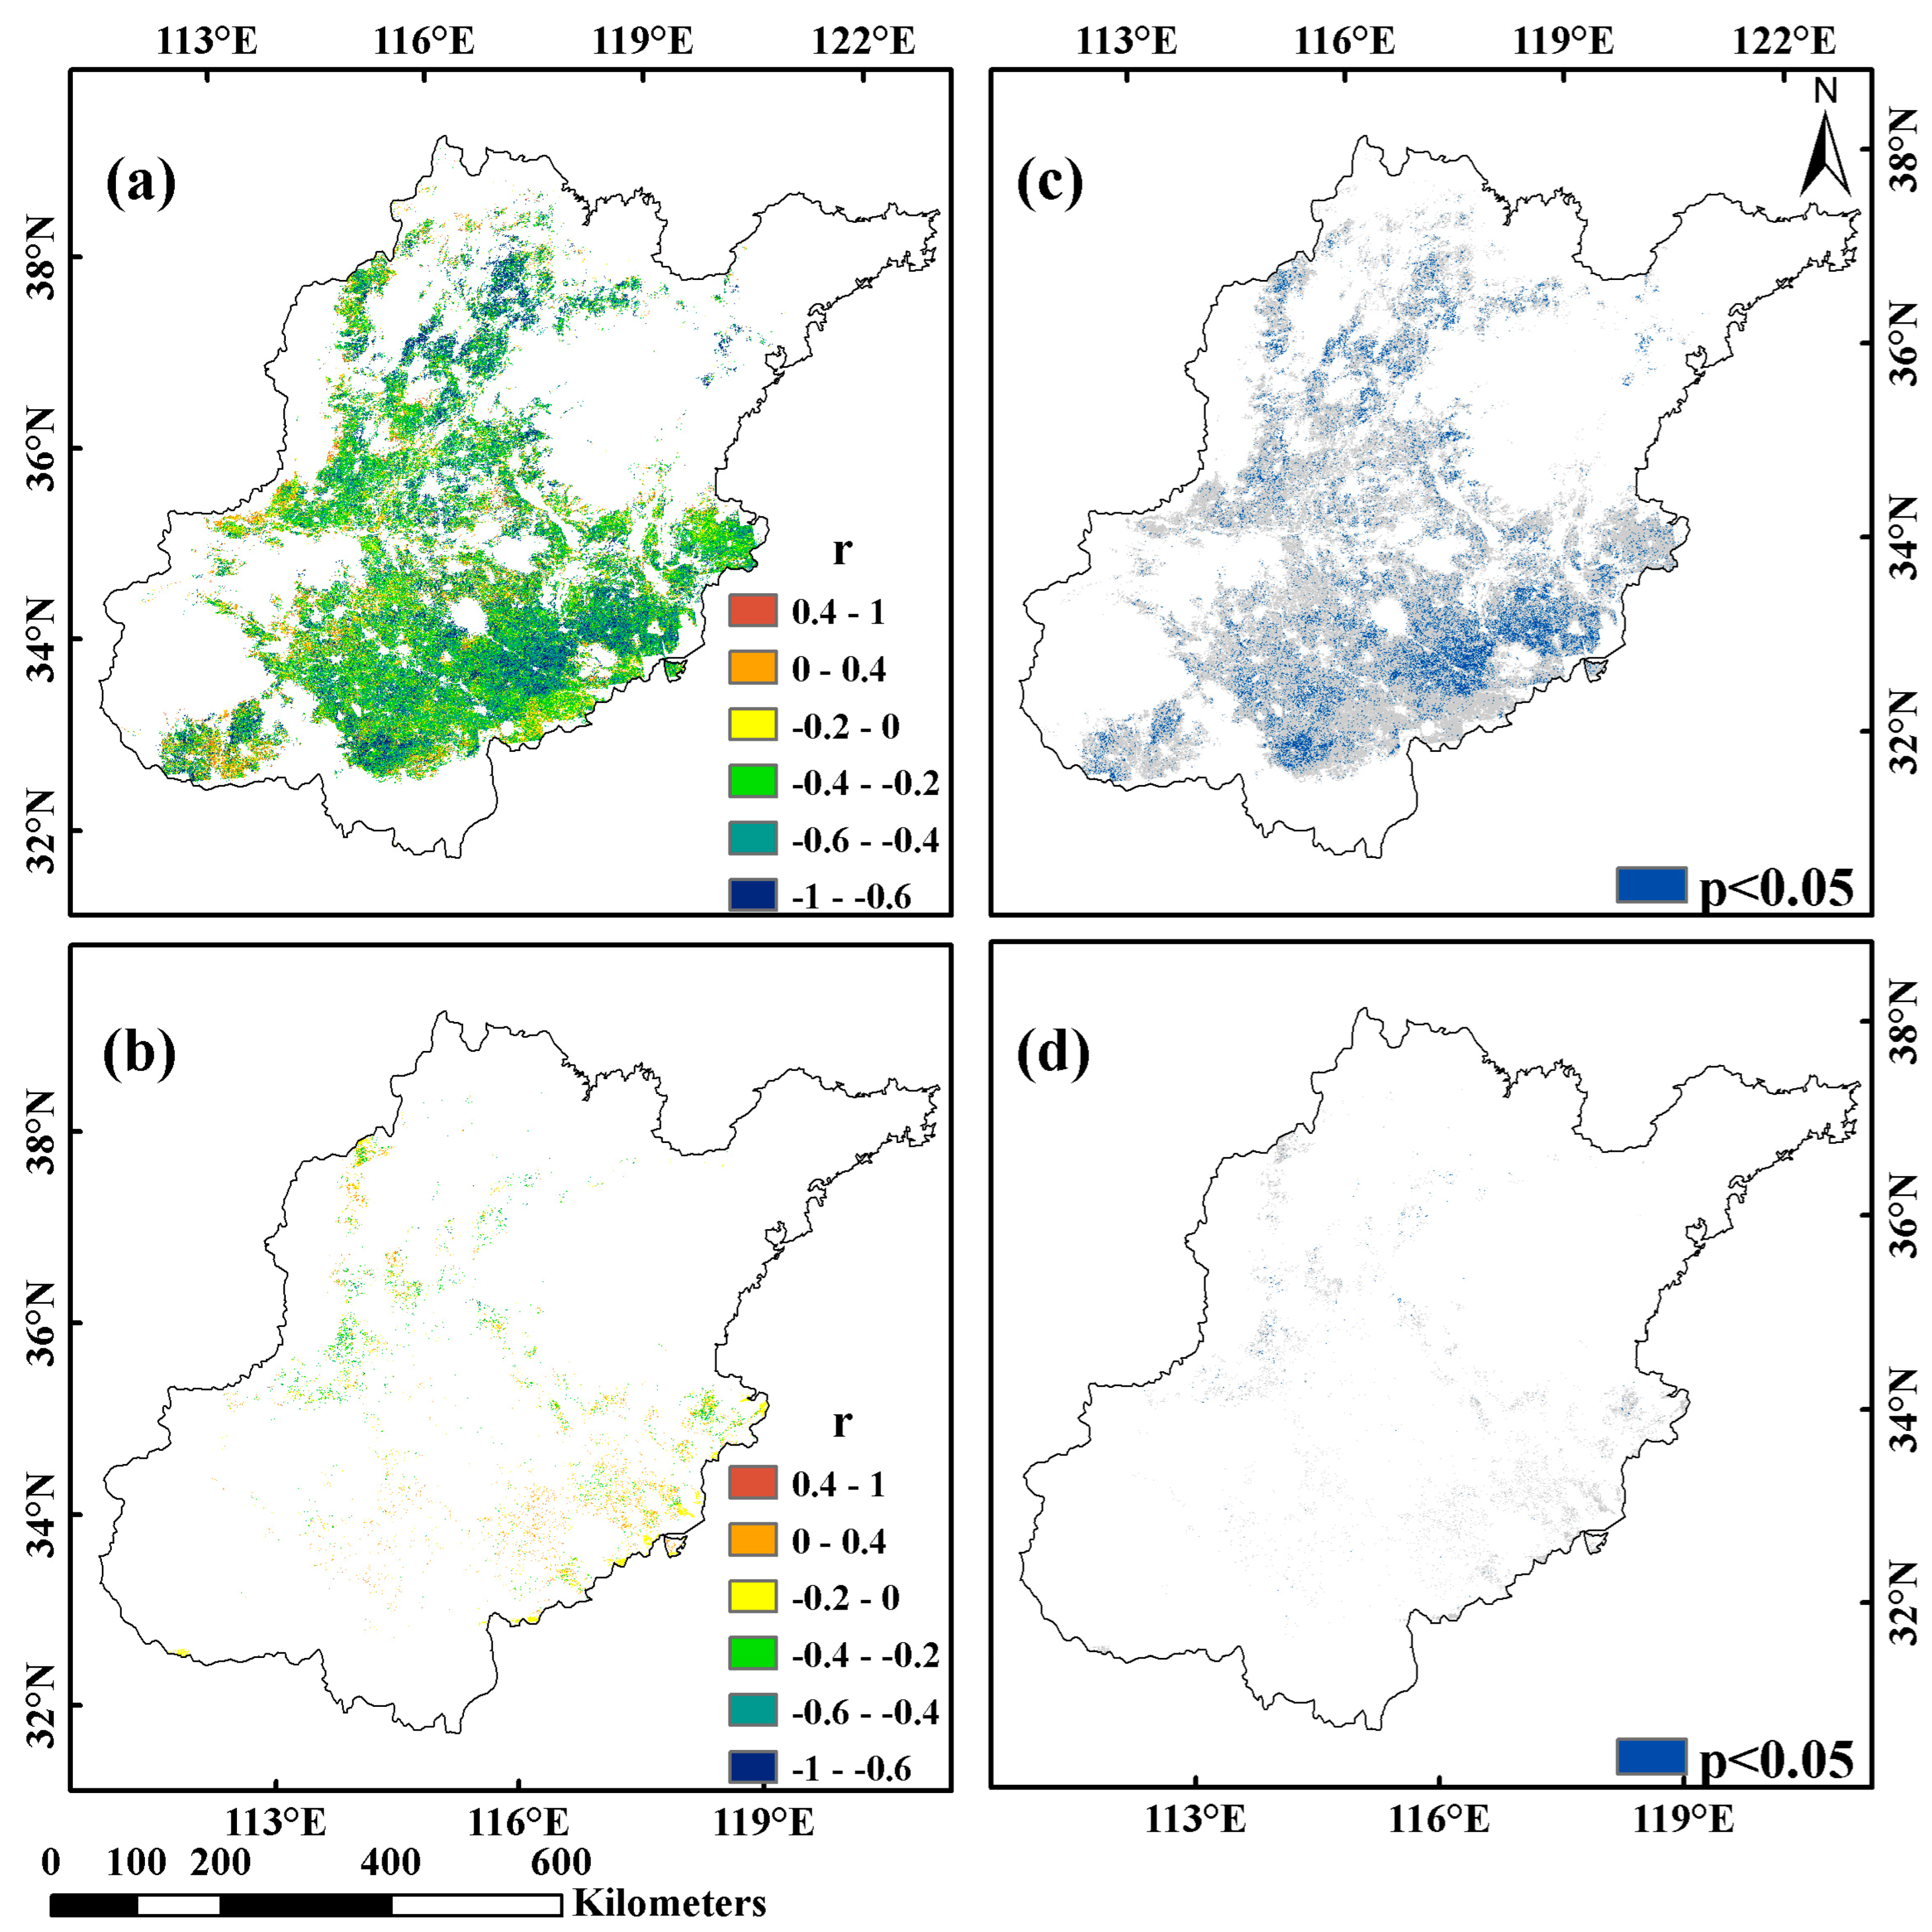
3.3. The Responses of Winter Wheat Phenology to Temperature

Pearson’s correlation coefficient was calculated to further demonstrate whether the spatial patterns of HD/LRGP were correlated with temperature. The results show that the HD was negatively correlated with the March and April mean temperature in most parts of this study area, and 15.7% of the pixels were significant (p < 0.05) (Figure 8a,c); but no significant correlations were found between the LRGP and the May and June mean temperature (Figure 8b,d). Overall, the advanced trend of the HD could be attributed to climate warming in March and April. However, there was no significant correlation between the LRGP and mean temperature, which suggests that some non-climate effects could have an impact on the change in the LRGP.

4. Discussion

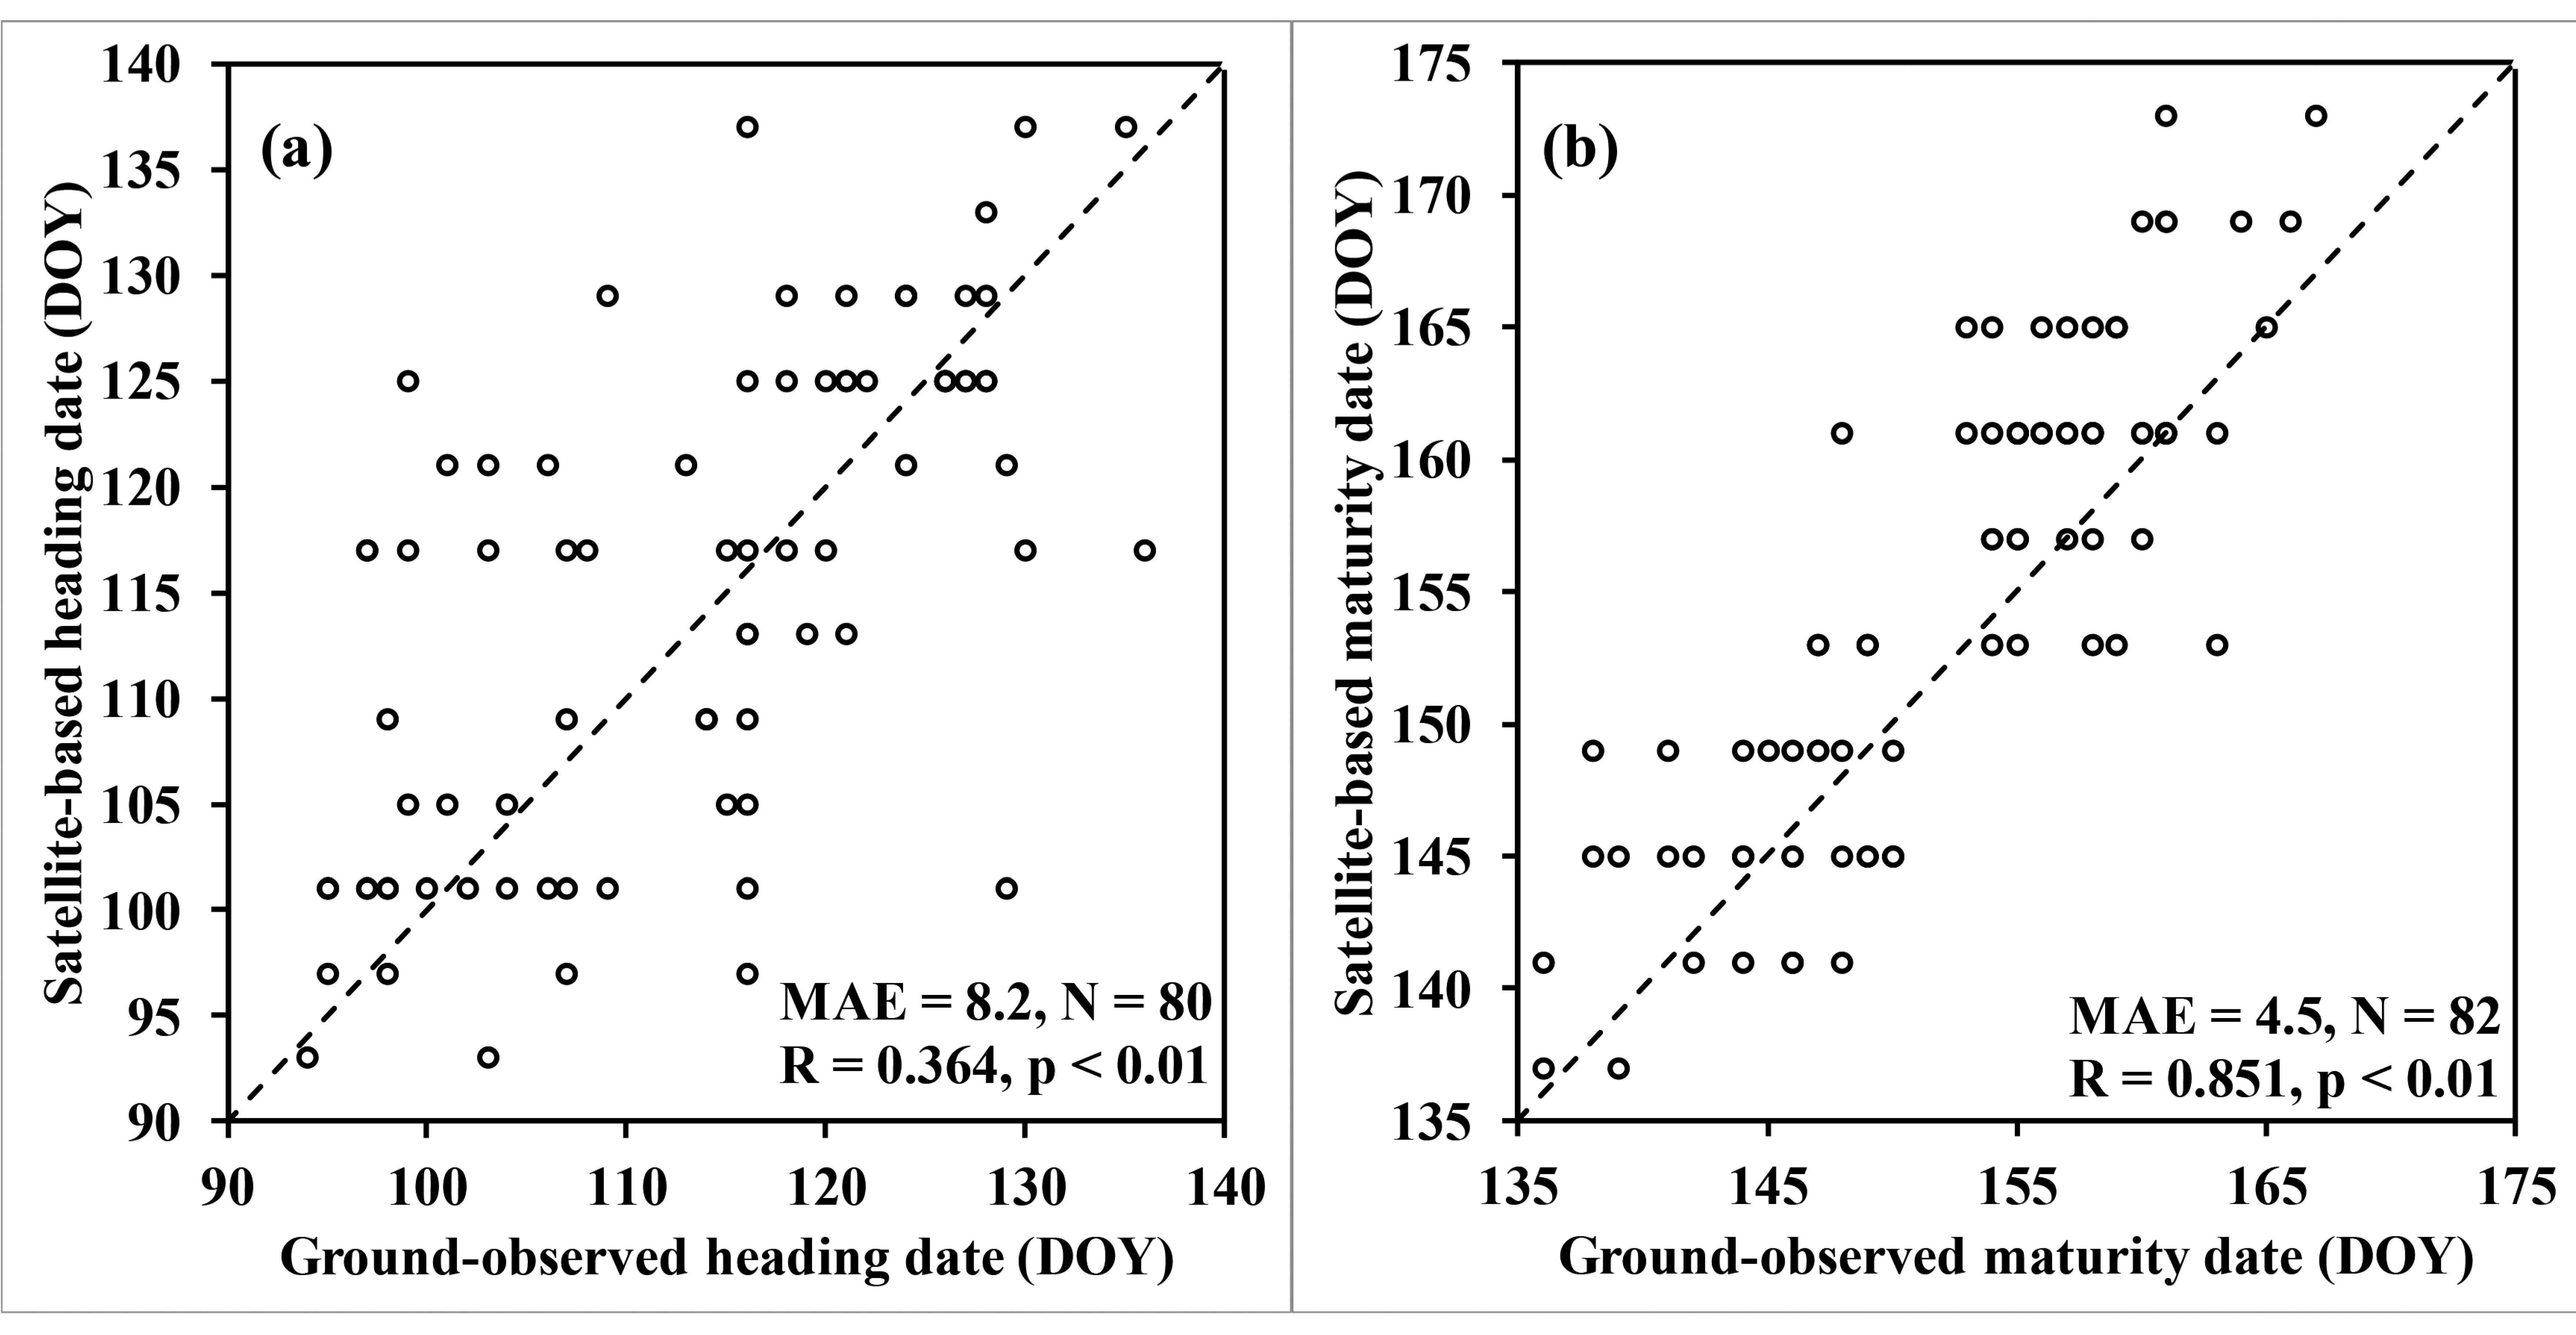
4.1. Improved Monitoring on Wheat Phenology Using MODIS LAI Data

Using the satellite-based phenological metrics and gridded temperature data, this study assessed the spatio-temporal changes in winter wheat phenology and climate warming across the NCP during the harvest years 2003–2018. The results show better temporal and spatial resolution than previous studies [24,36,46,62]. Moreover, our study could detect more details of spatial heterogeneity in wheat phenology than some site-based studies [14,15,29]. Based on the remotely sensed LAI product, we can better conduct the monitoring of phenology. In our study, we derived the spatio-temporal changes in the HD, the MD, and the LRGP by using the MODIS LAI product. Our findings suggest that LAI data could be used to detect phenological metrics with high and stable spatio-temporal resolution [44,45].
In addition, unlike previous studies that rarely consider land use types and land use changes, this study extracted the winter wheat planting area each year by using the decision tree method, which can reduce the uncertainty of inter-annual changes in the crop planting area [24,36]. For the spatio-temporal changes in temperature, our study was consistent with several previous studies at the site- and region-scales [2,26,33]. Therefore, compared with previous studies, this study presented a viable approach for mapping the spatio-temporal changes in winter wheat phenology and detecting more detailed spatial heterogeneity in crop phenology at a regional scale.
Previous site-based studies showed that there are not consistent trends of winter wheat phenology across the NCP. Tao et al. [29] reported that the HD advanced about 1.28 days per year at 40 stations in China. However, our results showed that the mean HD delayed 0.4 days per year across the NCP. Similarly, the delay trend of HD was observed in North America [24]. Different scales of studies would lead to these diverse results. Additionally, the delayed trend of HD was mainly distributed in the south of the NCP, where late-flowering winter wheat cultivars were used to avoid late frost. Moreover, the difference among pixels increased with the diverse non-climate effects. For the MD, Xiao et al. [21] found that the MD was advanced with an average of 0.17 days per year at most stations of the NCP, which is lower than the 0.37 days per year in our study. For the LRGP, Tao et al. [29] reported that the LRGP of winter wheat was prolonged at 58 stations but shortened at 40 stations in China. Our study found that the LRGP was shortened with a mean changing rate of −0.32 days per year, which was consistent with Ren et al. (−0.36 days per year) [24], but contrary with Xiao et al. (0.13 days per year) [21]. The inconsistent studies suggest that different data would lead to different results in crop phenological trends. Further research is required in order to contrast the obtained results across different data.

4.2. The Potential Impact of Non-Climate Effects on the LRGP

Using site-based observational records, previous studies have found that non-climate effects impact winter wheat phenology [26,30,31,32,33]. To explain the non-significant correlation between winter wheat phenology and climate warming in this study, we further discuss the potential impact of non-climate effects on the LRGP. We used an indirect method to assess the potential impact of non-climate effects on the LRGP according to the following equation:
C v = C o b s α × Δ T
where C v (days/year) represents the change in the LRGP only under the impact of non-climate effects, C o b s (days/year) represents the satellite-observed phenological trend of the LRGP, α (days/°C) represents the mean temperature sensitivity of the LRGP determined by crop models in previous studies, which could be stable and representative across the NCP [26,33], and Δ T (°C/year) represents the change trends of corresponding mean temperature. The result showed that the impact of climate warming on the LRGP had changed by –0.1 ± 0.27 days/year during 2003–2018 with large spatial differences across the NCP (Figure 9a). Furthermore, the impact of non-climate effects on the LRGP had a mean changing rate of –0.2 ± 1.46 days/year (Figure 9b).
Although the results (Figure 9) are not convincing enough to prove the impact of non-climate effects on the LRGP, they improve our understanding of the non-significant correlations between climate warming and winter wheat phenology (Figure 8b,d). The impact of non-climate effects could lead to more spatial differences, especially between parts of the north and the south. The results suggest that spatial heterogeneity could be induced by non-climate effects, which may be unable to be validated at present. Contrasting with the spatial interpolation used in site-based studies, this indirect method can be used to map the spatio-temporal changes of non-climate effects in continuous space [29,30]. We expect that our findings can be further evaluated and extended with different crops and in different regions.

4.3. Uncertainties and Limitations

Although the NCP is a typical irrigated agriculture region, with relatively enough water and fertilizer, no additional data can be used to validate this in pixel scale [49,63,64]. The complicated interactions between climate warming and non-climate effects were also not considered in this study. In addition, the rough monthly temperature data we used in this study, similarly to other studies, could lead to some uncertain results [17,24,37]. As a remote sensing study, another limitation that we have to acknowledge is that the results can monitor and map spatio-temporal changes in winter wheat phenology but may not give a full explanation for mechanisms. Although this study analyzed the relationships between winter wheat phenology and climate warming and discussed the potential impact of non-climate effects, our results cannot separate these impacts without using more parallel field experiments. Moreover, studies on the assimilation of remote sensing data into crop growth models could also improve our understanding of how crops respond to climate warming [65]. Consequently, the impact of non-climate effects, such as crop management and cultivar improvement, should be further analyzed in future research. In addition, more studies will be needed to reduce the uncertainties induced by different study scales and data.

5. Conclusions

Based on the four-day composite LAI product, the spatio-temporal changes in satellite-based winter wheat phenology were derived with more detail. The results show that there were spatial differences and heterogeneity across the NCP in the HD, MD, and LRGP, with a mean changing rate of 0.4 days per year, −0.37 days per year, and −0.32 days per year (p < 0.1), respectively. Meanwhile, the spatio-temporal changes in temperature showed that the warming trend could be obvious during the winter wheat growth period. The relationships between temperature and the HD showed that 15.7% of pixels in the NCP were significantly negative (p < 0.05). However, there was no significant correlation between the LRGP and temperature. The non-climate effects could weaken the impact of climate warming and lead to high spatial heterogeneity. More data (e.g., estimated pixel values regarding cultivar and agronomic measures) should be obtained to assess and verify the non-climate effects on crop phenology. Moreover, the impact of interaction between climate warming and non-climate effects should be considered in future studies.

Author Contributions

Conceptualization, Y.S. and J.W.; formal analysis, Y.S., J.W.. and Q.Y.; investigation, Y.S., J.W., and Q.Y.; methodology, Y.S. and J.W.; writing—original draft preparation, Y.S. and J.W.; writing—review and editing, Y.S., J.W., Q.Y., and J.H. All authors have read and agreed to the published version of the manuscript.

Funding

This research was supported by the National Key Research and Development Program of China (2016YFD0300105).

Acknowledgments

The authors would like to thank the China Meteorological Administration for its support of this paper and the National Aeronautics and Space Administration for the remote sensing data.

Conflicts of Interest

The authors declare no conflict of interest.

References

  1. Intergovernmental Panel on Climate Change. Climate Change 2013: The Physical Science Basis: Working Group I Contribution to the Fifth Assessment Report of the Intergovernmental Panel on Climate Change; Cambridge University Press: Cambridge, UK, 2014. [Google Scholar] [CrossRef] [Green Version]
  2. Fu, G.B.; Charles, S.P.; Yu, J.J.; Liu, C.M. Decadal climatic variability, trends, and future scenarios for the North China Plain. J. Clim. 2009, 22, 2111–2123. [Google Scholar] [CrossRef]
  3. Menzel, A.; Fabian, P. Growing season extended in Europe. Nature 1999, 397, 659. [Google Scholar] [CrossRef]
  4. Tucker, C.J.; Pinzon, J.E.; Brown, M.E.; Slayback, D.A.; Pak, E.W.; Mahoney, R.; Vermote, E.F.; El Saleous, N. An extended AVHRR 8-km NDVI dataset compatible with MODIS and SPOT vegetation NDVI data. Int. J. Remote Sens. 2005, 26, 4485–4498. [Google Scholar] [CrossRef]
  5. Piao, S.L.; Fang, J.Y.; Zhou, L.M.; Ciais, P.; Zhu, B. Variations in satellite-derived phenology in China’s temperate vegetation. Glob. Chang. Biol. 2006, 12, 672–685. [Google Scholar] [CrossRef]
  6. Penuelas, J.; Rutishauser, T.; Filella, I. Phenology feedbacks on climate change. Science 2009, 324, 887–888. [Google Scholar] [CrossRef] [Green Version]
  7. Piao, S.L.; Ciais, P.; Huang, Y.; Shen, Z.H.; Peng, S.S.; Li, J.S.; Zhou, L.P.; Liu, H.Y.; Ma, Y.C.; Ding, Y.H.; et al. The impacts of climate change on water resources and agriculture in China. Nature 2010, 467, 43–51. [Google Scholar] [CrossRef]
  8. Richardson, A.D.; Keenan, T.F.; Migliavacca, M.; Ryu, Y.; Sonnentag, O.; Toomey, M. Climate change, phenology, and phenological control of vegetation feedbacks to the climate system. Agric. For. Meteorol. 2013, 169, 156–173. [Google Scholar] [CrossRef]
  9. Asseng, S.; Ewert, F.; Martre, P.; Rotter, R.P.; Lobell, D.B.; Cammarano, D.; Kimball, B.A.; Ottman, M.J.; Wall, G.W.; White, J.W.; et al. Rising temperatures reduce global wheat production. Nat. Clim. Chang. 2015, 5, 143–147. [Google Scholar] [CrossRef]
  10. Piao, S.L.; Friedlingstein, P.; Ciais, P.; Viovy, N.; Demarty, J. Growing season extension and its impact on terrestrial carbon cycle in the Northern Hemisphere over the past 2 decades. Glob. Biogeochem. Cycles 2007, 21. [Google Scholar] [CrossRef]
  11. Peng, S.S.; Chen, A.P.; Xu, L.; Cao, C.X.; Fang, J.Y.; Myneni, R.B.; Pinzon, J.E.; Tucker, C.J.; Piao, S.L. Recent change of vegetation growth trend in China. Environ. Res. Lett. 2011, 6. [Google Scholar] [CrossRef]
  12. Mao, J.F.; Shi, X.Y.; Thornton, P.E.; Piao, S.L.; Wang, X.H. Causes of spring vegetation growth trends in the northern mid-high latitudes from 1982 to 2004. Environ. Res. Lett. 2012, 7. [Google Scholar] [CrossRef] [Green Version]
  13. Tao, F.L.; Yokozawa, M.; Xu, Y.L.; Hayashi, Y.; Zhang, Z. Climate changes and trends in phenology and yields of field crops in China, 1981–2000. Agric. For. Meteorol. 2006, 138, 82–92. [Google Scholar] [CrossRef]
  14. Wang, J.; Wang, E.L.; Feng, L.P.; Yin, H.; Yu, W.D. Phenological trends of winter wheat in response to varietal and temperature changes in the North China Plain. Field Crops Res. 2013, 144, 135–144. [Google Scholar] [CrossRef]
  15. Xiao, D.P.; Moiwo, J.P.; Tao, F.L.; Yang, Y.H.; Shen, Y.J.; Xu, Q.H.; Liu, J.F.; Zhang, H.; Liu, F.S. Spatiotemporal variability of winter wheat phenology in response to weather and climate variability in China. Mitig. Adapt. Strateg. Glob. Chang. 2015, 20, 1191–1202. [Google Scholar] [CrossRef]
  16. Hu, X.Y.; Huang, Y.; Sun, W.J.; Yu, L.F. Shifts in cultivar and planting date have regulated rice growth duration under climate warming in China since the early 1980s. Agric. For. Meteorol. 2017, 247, 34–41. [Google Scholar] [CrossRef]
  17. Zhao, C.; Liu, B.; Piao, S.L.; Wang, X.H.; Lobell, D.B.; Huang, Y.; Huang, M.T.; Yao, Y.T.; Bassu, S.; Ciais, P.; et al. Temperature increase reduces global yields of major crops in four independent estimates. Proc. Natl. Acad. Sci. USA 2017, 114, 9326–9331. [Google Scholar] [CrossRef] [Green Version]
  18. Wolkovich, E.M.; Cook, B.I.; Allen, J.M.; Crimmins, T.M.; Betancourt, J.L.; Travers, S.E.; Pau, S.; Regetz, J.; Davies, T.J.; Kraft, N.J.B.; et al. Warming experiments underpredict plant phenological responses to climate change. Nature 2012, 485, 494–497. [Google Scholar] [CrossRef]
  19. Wang, B.; Liu, D.L.; Asseng, S.; Macadam, I.; Yu, Q. Impact of climate change on wheat flowering time in eastern Australia. Agric. For. Meteorol. 2015, 209, 11–21. [Google Scholar] [CrossRef]
  20. Hu, Q.; Weiss, A.; Feng, S.; Baenziger, P.S. Earlier winter wheat heading dates and warmer spring in the US Great Plains. Agric. For. Meteorol. 2005, 135, 284–290. [Google Scholar] [CrossRef]
  21. Xiao, D.P.; Tao, F.L.; Liu, Y.J.; Shi, W.J.; Wang, M.; Liu, F.S.; Zhang, S.; Zhu, Z. Observed changes in winter wheat phenology in the North China Plain for 1981-2009. Int. J. Biometeorol. 2013, 57, 275–285. [Google Scholar] [CrossRef]
  22. He, L.; Asseng, S.; Zhao, G.; Wu, D.R.; Yang, X.Y.; Zhuang, W.; Jin, N.; Yu, Q. Impacts of recent climate warming, cultivar changes, and crop management on winter wheat phenology across the Loess Plateau of China. Agric. For. Meteorol. 2015, 200, 135–143. [Google Scholar] [CrossRef]
  23. Liu, Y.J.; Chen, Q.M.; Ge, Q.S.; Dai, J.H.; Qin, Y.; Dai, L.; Zou, X.T.; Chen, J. Modelling the impacts of climate change and crop management on phenological trends of spring and winter wheat in China. Agric. For. Meteorol. 2018, 248, 518–526. [Google Scholar] [CrossRef]
  24. Ren, S.L.; Qin, Q.M.; Ren, H.Z. Contrasting wheat phenological responses to climate change in global scale. Sci. Total Environ. 2019, 665, 620–631. [Google Scholar] [CrossRef] [PubMed]
  25. Craufurd, P.Q.; Wheeler, T.R. Climate change and the flowering time of annual crops. J. Exp. Bot. 2009, 60, 2529–2539. [Google Scholar] [CrossRef] [PubMed] [Green Version]
  26. Li, K.N.; Yang, X.G.; Tian, H.Q.; Pan, S.F.; Liu, Z.J.; Lu, S. Effects of changing climate and cultivar on the phenology and yield of winter wheat in the North China Plain. Int. J. Biometeorol. 2016, 60, 21–32. [Google Scholar] [CrossRef] [PubMed]
  27. Wang, H.L.; Gan, Y.T.; Wang, R.Y.; Niu, J.Y.; Zhao, H.; Yang, Q.G.; Li, G.C. Phenological trends in winter wheat and spring cotton in response to climate changes in northwest China. Agric. For. Meteorol. 2008, 148, 1242–1251. [Google Scholar] [CrossRef]
  28. Chen, C.; Wang, E.L.; Yu, Q.; Zhang, Y.Q. Quantifying the effects of climate trends in the past 43 years (1961-2003) on crop growth and water demand in the North China Plain. Clim. Chang. 2010, 100, 559–578. [Google Scholar] [CrossRef]
  29. Tao, F.L.; Zhang, S.A.; Zhang, Z. Spatiotemporal changes of wheat phenology in China under the effects of temperature, day length and cultivar thermal characteristics. Eur. J. Agron. 2012, 43, 201–212. [Google Scholar] [CrossRef]
  30. Liu, Y.; Wang, E.L.; Yang, X.G.; Wang, J. Contributions of climatic and crop varietal changes to crop production in the North China Plain, since 1980s. Glob. Chang. Biol. 2010, 16, 2287–2299. [Google Scholar] [CrossRef]
  31. Wang, Z.B.; Chen, J.; Tong, W.J.; Xu, C.C.; Chen, F. Impacts of climate change and varietal replacement on winter wheat phenology in the North China Plain. Int. J. Plant Prod. 2018, 12, 251–263. [Google Scholar] [CrossRef]
  32. Wu, D.R.; Wang, C.Y.; Wang, F.; Jiang, C.Y.; Huo, Z.G.; Wang, P.J. Uncertainty in simulating the impact of cultivar improvement on winter wheat phenology in the North China Plain. J. Meteorol. Res. 2018, 32, 636–647. [Google Scholar] [CrossRef]
  33. Wu, D.R.; Wang, P.J.; Jiang, C.Y.; Yang, J.Y.; Huo, Z.G.; Yu, Q. Measured phenology response of unchanged crop varieties to long-term historical climate change. Int. J. Plant Prod. 2019, 13, 47–58. [Google Scholar] [CrossRef] [Green Version]
  34. Dhakal, K.; Kakani, V.G.; Linde, E. Climate change impact on wheat production in the Southern Great Plains of the US using downscaled climate data. Atmos. Clim. Sci. 2018, 8, 143–162. [Google Scholar] [CrossRef] [Green Version]
  35. Liu, Z.J.; Wang, S.S. Detecting changes of wheat vegetative growth and their response to climate change over the North China Plain. IEEE J. 2018, 11, 4630–4636. [Google Scholar] [CrossRef]
  36. Sharma, S.; Ochsner, T.E.; Twidwell, D.; Carlson, J.; Krueger, E.S.; Engle, D.M.; Fuhlendorf, S.D. Nondestructive estimation of standing crop and fuel moisture content in tallgrass prairie. Rangel. Ecol. Manag. 2018, 71, 356–362. [Google Scholar] [CrossRef]
  37. Lobell, D.B.; Sibley, A.; Ortiz-Monasterio, J.I. Extreme heat effects on wheat senescence in India. Nat. Clim. Chang. 2012, 2, 186–189. [Google Scholar] [CrossRef]
  38. Chu, L.; Huang, C.; Liu, Q.S.; Liu, G.H. Estimation of winter wheat phenology under the influence of cumulative temperature and soil salinity in the Yellow River Delta, China, using MODIS time-series data. Int. J. Remote Sens. 2016, 37, 2211–2232. [Google Scholar] [CrossRef]
  39. Sharma, S.; Dhakal, K.; Wagle, P.; Kilic, A. Retrospective tillage differentiation using the Landsat-5 TM archive with discriminant analysis. Agrosyst. Geosci. Environ. 2020, 3. [Google Scholar] [CrossRef] [Green Version]
  40. Gallo, K.P.; Flesch, T.K. Large-Area Crop Monitoring with the NOAA AVHRR: Estimating the silking stage of corn development. Remote Sens. Environ. 1989, 27, 73–80. [Google Scholar] [CrossRef]
  41. Zhang, X.Y.; Friedl, M.A.; Schaaf, C.B.; Strahler, A.H.; Hodges, J.C.F.; Gao, F.; Reed, B.C.; Huete, A. Monitoring vegetation phenology using MODIS. Remote Sens. Environ. 2003, 84, 471–475. [Google Scholar] [CrossRef]
  42. White, M.A.; de Beurs, K.M.; Didan, K.; Inouye, D.W.; Richardson, A.D.; Jensen, O.P.; O’Keefe, J.; Zhang, G.; Nemani, R.R.; van Leeuwen, W.J.D.; et al. Intercomparison, interpretation, and assessment of spring phenology in North America estimated from remote sensing for 1982-2006. Glob. Chang. Biol. 2009, 15, 2335–2359. [Google Scholar] [CrossRef]
  43. Atzberger, C.; Klisch, A.; Mattiuzzi, M.; Vuolo, F. Phenological metrics derived over the European continent from NDVI3g data and MODIS time series. Remote Sens. 2014, 6, 257–284. [Google Scholar] [CrossRef] [Green Version]
  44. Guan, K.Y.; Medvigy, D.; Wood, E.F.; Caylor, K.K.; Li, S.; Jeong, S.J. Deriving vegetation phenological time and trajectory information over Africa using SEVIRI daily LAI. IEEE Trans. Geosci. Remote Sens. 2014, 52, 1113–1130. [Google Scholar] [CrossRef]
  45. Verger, A.; Filella, I.; Baret, F.; Penuelas, J. Vegetation baseline phenology from kilometric global LAI satellite products. Remote Sens. Environ. 2016, 178, 1–14. [Google Scholar] [CrossRef] [Green Version]
  46. Lu, L.L.; Wang, C.Z.; Guo, H.D.; Li, Q.T. Detecting winter wheat phenology with SPOT-VEGETATION data in the North China Plain. Geocarto Int. 2014, 29, 244–255. [Google Scholar] [CrossRef]
  47. Lobell, D.B.; Schlenker, W.; Costa-Roberts, J. Climate trends and global crop production since 1980. Science 2011, 333, 616–620. [Google Scholar] [CrossRef] [Green Version]
  48. Food and Agriculture Organization of the United Nations (FAO). FAOSTAT 2016. Available online: http://www.fao.org/faostat/en (accessed on 28 May 2019).
  49. Wang, J.; Wang, E.L.; Yang, X.G.; Zhang, F.S.; Yin, H. Increased yield potential of wheat-maize cropping system in the North China Plain by climate change adaptation. Clim. Chang. 2012, 113, 825–840. [Google Scholar] [CrossRef]
  50. Ma, G.N.; Huang, J.X.; Wu, W.B.; Fan, J.L.; Zou, J.Q.; Wu, S.J. Assimilation of MODIS-LAI into the WOFOST model for forecasting regional winter wheat yield. Math. Comput. Model. 2013, 58, 634–643. [Google Scholar] [CrossRef]
  51. Bradley, B.A.; Jacob, R.W.; Hermance, J.F.; Mustard, J.F. A curve fitting procedure to derive inter-annual phenologies from time series of noisy satellite NDVI data. Remote Sens. Environ. 2007, 106, 137–145. [Google Scholar] [CrossRef]
  52. Zhou, J.; Jia, L.; Menenti, M. Reconstruction of global MODIS NDVI time series: Performance of Harmonic ANalysis of Time Series (HANTS). Remote Sens. Environ. 2015, 163, 217–228. [Google Scholar] [CrossRef]
  53. Song, Y.; Wang, J. Mapping winter wheat planting area and monitoring its phenology using Sentinel-1 backscatter time series. Remote Sens. 2019, 11, 449. [Google Scholar] [CrossRef] [Green Version]
  54. Shen, M.G.; Zhang, G.X.; Cong, N.; Wang, S.P.; Kong, W.D.; Piao, S.L. Increasing altitudinal gradient of spring vegetation phenology during the last decade on the Qinghai-Tibetan Plateau. Agric. For. Meteorol. 2014, 189, 71–80. [Google Scholar] [CrossRef]
  55. Xu, M.; Watanachaturaporn, P.; Varshney, P.K.; Arora, M.K. Decision tree regression for soft classification of remote sensing data. Remote Sens. Environ. 2005, 97, 322–336. [Google Scholar] [CrossRef]
  56. Zhao, J.L.; Xu, C.; Xu, J.P.; Huang, L.S.; Zhang, D.Y.; Liang, D. Forecasting the wheat powdery mildew (Blumeria graminis f. sp tritici) using a remote sensing-based decision-tree classification at a provincial scale. Australas. Plant Pathol. 2018, 47, 53–61. [Google Scholar] [CrossRef]
  57. Rodell, M.; Houser, P.R.; Jambor, U.; Gottschalck, J.; Mitchell, K.; Meng, C.J.; Arsenault, K.; Cosgrove, B.; Radakovich, J.; Bosilovich, M.; et al. The global land data assimilation system. Bull. Am. Meteorol. Soc. 2004, 85, 381–394. [Google Scholar] [CrossRef] [Green Version]
  58. Sen, P.K. Estimates of the regression coefficient based on Kendall’s tau. J. Am. Stat. Assoc. 1968, 63, 1379–1389. [Google Scholar] [CrossRef]
  59. Theil, H. A rank-invariant method of linear and polynomial regression analysis. In Henri Theil’s Contributions to Economics and Econometrics. Advanced Studies in Theoretical and Applied Econometrics; Raj, B., Koerts, J., Eds.; Springer: Dordrecht, The Netherlands, 1992; Volume 23, pp. 345–381. [Google Scholar] [CrossRef]
  60. Mann, H.B. Nonparametric tests against trend. Econometrica 1945, 13, 245–259. [Google Scholar] [CrossRef]
  61. Li, G.; Sun, S.B.; Han, J.C.; Yan, J.W.; Liu, W.B.; Wei, Y.; Lu, N.; Sun, Y.Y. Impacts of Chinese Grain for Green program and climate change on vegetation in the Loess Plateau during 1982–2015. Sci. Total Environ. 2019, 660, 177–187. [Google Scholar] [CrossRef]
  62. Wang, S.S.; Mo, X.G.; Liu, Z.J.; Baig, M.H.A.; Chi, W.F. Understanding long-term (1982–2013) patterns and trends in winter wheat spring green-up date over the North China Plain. Int. J. Appl. Earth Obs. 2017, 57, 235–244. [Google Scholar] [CrossRef]
  63. Ju, X.T.; Xing, G.X.; Chen, X.P.; Zhang, S.L.; Zhang, L.J.; Liu, X.J.; Cui, Z.L.; Yin, B.; Christie, P.; Zhu, Z.L.; et al. Reducing environmental risk by improving N management in intensive Chinese agricultural systems. Proc. Natl. Acad. Sci. USA 2009, 106, 3041–3046. [Google Scholar] [CrossRef] [Green Version]
  64. Wang, J.; Zhao, T.B.; Wang, E.L.; Yu, Q.A.; Yang, X.G.; Feng, L.P.; Pan, X.B. Measurement and simulation of diurnal variations in water use efficiency and radiation use efficiency in an irrigated wheat-maize field in the North China Plain. N. Z. J. Crop Hortic. Sci. 2010, 38, 119–135. [Google Scholar] [CrossRef]
  65. Huang, J.; Gómez-Dans, J.; Huang, H.; Ma, H.; Wu, Q.; Lewis, P.; Liang, S.; Chen, Z.; Xue, J.; Wu, Y.; et al. Assimilation of remote sensing into crop growth models: Current status and perspectives. Agric. For. Meteorol. 2019, 276–277, 107609. [Google Scholar] [CrossRef]
Figure 1. Location of the North China Plain (NCP) (highlighted in yellow). The green pixels represent the locations of winter wheat fields in the harvest year 2018. The base map is the regions of the world.
Remotesensing 12 00786 g001
Figure 2. The decision tree for extracting the winter wheat planting area each year in the North China Plain.
Remotesensing 12 00786 g002
Figure 3. Comparison between the satellite-based and ground-observed heading date (a), and the maturity date (b) in the North China Plain.
Remotesensing 12 00786 g003
Figure 4. The spatial distributions of the heading date (HD) (a), maturity date (MD) (b), and length of the reproductive growth period (LRGP) (c), as well as their standard deviations (df), across the NCP, averaged from the harvest years 2003–2018.
Remotesensing 12 00786 g004
Figure 5. The changes in the HD (a), MD (b), and LRGP (c) during 2003–2018 at different significance levels (df). The gray pixels represent where the changes are not significant (p > 0.1).
Remotesensing 12 00786 g005
Figure 6. The patterns of two-month mean temperature (T) in March–April (a) and May–June (b) across the NCP during 2003–2018.
Remotesensing 12 00786 g006
Figure 7. The changes in two-month mean temperature in March–April (a) and May–June (b) during 2003–2018 at different significance levels (c,d). The gray pixels represent where the changes are not significant (p > 0.1).
Remotesensing 12 00786 g007
Figure 8. The Pearson correlation coefficients (r) of the March–April mean temperature with the HD (a) and the May–June mean temperature with the LRGP (b). There is corresponding significance at the 0.05 statistical level (c,d). The gray pixels represent where the correlation is not significant (p > 0.05).
Remotesensing 12 00786 g008
Figure 9. The changes in the LRGP induced only by climate warming (a) and non-climate effects (b) during harvest years 2003–2018 across the NCP.
Remotesensing 12 00786 g009

