Article

An Efficient Method for Infrared and Visual Images Fusion Based on Visual Attention Technique

School of Information Science and Technology, Dalian Maritime University, Dalian 116026, China
*
Author to whom correspondence should be addressed.
Remote Sens. 2020, 12(5), 781; https://doi.org/10.3390/rs12050781
Submission received: 15 January 2020 / Revised: 19 February 2020 / Accepted: 25 February 2020 / Published: 29 February 2020

Abstract

:
Infrared and visible image fusion technology provides many benefits for human vision and computer image processing tasks, including enriched useful information and enhanced surveillance capabilities. However, existing fusion algorithms have faced a great challenge to effectively integrate visual features from complex source images. In this paper, we design a novel infrared and visible image fusion algorithm based on visual attention technology, in which a special visual attention system and a feature fusion strategy based on the saliency maps are proposed. Special visual attention system first utilizes the co-occurrence matrix to calculate the image texture complication, which can select a particular modality to compute a saliency map. Moreover, we improved the iterative operator of the original visual attention model (VAM), a fair competition mechanism is designed to ensure that the visual feature in detail regions can be extracted accurately. For the feature fusion strategy, we use the obtained saliency map to combine the visual attention features, and appropriately enhance the tiny features to ensure that the weak targets can be observed. Different from the general fusion algorithm, the proposed algorithm not only preserve the interesting region but also contain rich tiny details, which can improve the visual ability of human and computer. Moreover, experimental results in complicated ambient conditions show that the proposed algorithm in this paper outperforms state-of-the-art algorithms in both qualitative and quantitative evaluations, and this study can extend to the field of other-type image fusion.

1. Introduction

Image fusion is an important branch of information fusion, which involves many research fields such as deep learning, image processing and computer vision [1,2,3]. Among them, the infrared and visible image fusion has great application value in the practical engineering. The visible image contains rich texture information and conforms to the human visual system. Infrared images distinguish targets from background based on differences in thermal radiation. By combining the complementary information of visible and infrared image, it is possible to generate fused images that are more conducive to human decision-making or computer vision tasks, which has been applied to many fields such as the military, target detection, surveillance and so on [4,5,6,7,8,9]. An excellent image fusion algorithm must contain the following conditions. First, the fused image can contain the useful information of the source image. Second, it gets a good robustness in complex environments such as noise. Third, it cannot generate artifacts that hinder human observation or application.
In recent years, scholars have proposed many infrared and visible image fusion algorithm through different schemes. They can be mainly divided into five categories including subspace-based methods [10,11,12], multi-scale transform-based methods [13,14,15], sparse representation-based methods [16,17,18], deep learning-based methods [2,19,20] and other methods [21,22]. Next, the ideas of these methods are briefly introduced.
The subspace-based method first projects high-dimensional source image into low-dimensional space, and then fuses the information contained in the subspace, such as principal component analysis (PCA) [10], independent component analysis (ICA) [11], robust principal component analysis (RPCA) [12] and so on. Since processing subspace data consumes less time and memory than source images, this kind of method has the advantage of high computational efficiency. However, its stability is not good for application in complex environment. Multi-scale transform-based methods (MST) have been widely applied since it was introduced into the field of infrared and visible image fusion such as quaternion wavelet transform (QWT) [13], pyramid transform [14] and so on. Generally, this kind of method has three fusion steps [15]: first of all, the source image is decomposed into multiple scale, each of which contains different feature information. Then, the information of multiple scale is fused according to the designed fusion rule. Finally, the fused image is obtained by reconstruction. Spare representation-based methods aim to sparsely represent the source image by learning dictionary for image fusion. The fused image based on the spare representation method is very consistent with human visual perception. However, it lacks the reservation of details [16,17]. This kind of method has four fusion steps [18]: each source image is decomposed into several overlapping blocks. Then, a complete dictionary is learned from many high-quality natural images, and sparse coding is performed on each patch to obtain sparse representation coefficients. Third, sparse representation coefficients are fused according to a given fusion rule. Finally, the learned over complete dictionary is utilized to reconstruct the fused image. Deep learning-based methods are to imitate the behavioral perception mechanism of the human brain, which has strong adaptability and feature extraction ability [2]. However, this kind of method is computationally intensive and requires high hardware equipment [19,20]. In addition, there are other ideas and perspectives that inspire new image fusion method, such as entropy [21], total variation [22] and so on.
With the development of computer vision technology, saliency-based methods have been successfully implemented to infrared and visible image fusion because it effectively utilizes the complementary information of the source image. Saliency-based methods have four fusion steps including saliency region segmentation, designing a fusion rule of saliency region, designing a fusion rule of the background region, and reconstruction [23]. Meng et al. [24] used significant detection method to extract the interesting region, which can be mapped to the region of the fused image. Zhang et al. [25] utilized a super-pixel saliency model to obtain the interesting regions of the infrared image, which can retain the target information of the infrared image to the fused image. Liu et al. [26] integrated saliency detection into the fusion sparse representation framework and used global and local saliency maps to obtain the weight of reconstruction. Ma et al. [27] used the saliency maps to extract the targets from the base layers. Then, the least squares method was used to fuse the detail layers. However, existing saliency-based methods typically only extract significant targets in the infrared image during the fusion process. It may be inappropriate for the infrared and visible image fusion, as the interesting regions of the visible image and the weak targets cannot be captured. In addition, the weak activity level cannot be properly enhanced, which will lead to the fusion algorithm cannot be applied to complex environments. This is particularly true when noise appears in the background or when the source image has low contrast.
To overcome the above weaknesses, we propose a fusion algorithm based on visual attention technology in this paper. Specifically, visual attention technology be used to obtain visual features of the infrared and visible image at the same time, which ensures the fused image is appropriated for human or computer vision tasks. The feasibility and superiority of visual attention technique are also analyzed. Moreover, fusion rule is designed to combine the complementary features and enhance the weak features. It can enable the fused image to preserve more tiny details, which leads to accurate expression of the detection scene.
The main contributions of this work are the following three aspects. First, we propose a special visual attention system to extract visual features. The co-occurrence matrix is utilized to select a particular modality, and then a linear normalization method is used to fairly extract visual feature of each pixel. Secondly, we design a feature fusion strategy based on the saliency maps to combines the visual features. The saliency maps of the infrared and visible image obtained by the special visual attention system are used to integrate complementary information, and then the guided filter is utilized to decompose multi-scale information for enhancing weak features. Last but not least, experimental results in the public image fusion data set show that the proposed fusion algorithm has great robustness and can extend to the field of other-type image fusion.
The rest of this paper is organized as following. In Section 2, we briefly introduced visual attention technique for image fusion. In Section 3, the proposed fusion method in this paper is present in detail. A comparison and analysis of experimental results is presented in Section 4. Finally, the conclusions are presented in Section 5.

2. Visual Attention Technique for Image Fusion

In this section, we discussed the feasibility and advantages of visual attention technique in the field of infrared and visible image fusion. In addition, we also analyze the original VAM.

2.1. Feasibility

According to Section 1, it shows that the fusion framework is mainly composed of three parts including feature extraction, feature fusion and reconstruction. Among them, feature extraction is a key step, which determines the feature information contained in the fused image. When people observe images, the human visual system actively seeks interesting regions to reduce search tasks such as object detection and recognition, so the human brain’s attention to the whole image is not balanced. Therefore, visual attention technique as a feature extraction method is theoretically feasible for image fusion because it can extract the visual features of the image by simulating the observation mechanism of the human eye.
We further explain feasible from the perspective of real application. The purpose of most existing fusion algorithms is to generate fusion images that help to perform human eye or computer vision tasks. We study the image fusion algorithm based on human visual characteristics, which can efficiently improve the visual sensory comfort of the fused image and help humans to monitor the complex environment. This is especially important in practical application such as military, surveillance. Therefore, the fusion image obtained by visual attention technique is also feasible in practical applications.

2.2. Superiority

The advantages of fusion images based on visual attention technique over existing fusion methods are two fold. First, it can effectively capture the interesting regions and remove a lot of redundant information in the source image, so that the fused image has a nice visual effect. Secondly, the human visual attention system can effectively extract the accurate information of targets from various interference information, which makes the fusion algorithm have strong stability. There have been various kinds of visual attention models to realize the simulation of visual attention systems, and it has been proved that the attention target can be accurately extracted even under the interference of noise. Therefore, compared with traditional methods, the algorithm based on visual attention technique has the potential to produce higher visual effects in the results, and also has great potential for better robustness in practical applications.

2.3. The Original VAM for Image Fusion

In order to extract visual attention features, Itti et al. [28] have established the visual attention model. The original VAM first generates intensity, orientation and colors saliency maps corresponding to gray, texture and color features of the input image, and then fuses the saliency maps to obtain a gray image to represent the parts that are easily noticed. However, applying the original visual attention model directly to the field of image fusion may not be an effective method. Figure 1 shows a typical example. Figure 1a is an infrared image, and the interesting region is shown in the red box. Consider that the source images are gray images, only intensity and orientation modality are used. Its different modalities saliency maps are shown in Figure 1b–d. In saliency maps, the larger the pixels, the stronger the visual attention. It can be seen that Figure 1b can find the interesting region. Figure 1c cannot effectively extract the features of the target, but redundant information is extracted (as shown in the yellow box). Although Figure 1d retains the activity level of the interesting region, it is disturbed by the orientation modality. Figure 1e is the visible image whose different modalities saliency maps are shown in Figure 1f–h. We can see that a signal intensity or orientation saliency map can express the salient features from the visible image (as shown in the red box), but the saliency information is mutually suppressed in both modalities.
Based on the above analysis, selecting both modalities to collect feature information is not an effective strategy because it causes the significant features of intensity and orientation to suppress each other and may introduce a lot of redundant features. However, single selection of intensity or texture features is also not a good strategy, which likely lead to loss of useful information. In addition, Figure 1 also shows that the original VAM suppressed the saliency of the weak activity position. The reason is that it adopts an iterative nonlinear normalization operator to simulate the feature competition scheme, which suppresses the weak activity location by the strong global peak.

3. Image Fusion Algorithm Based on Visual Attention Technique

Figure 2 shows the framework of the proposed infrared and visible image fusion algorithm. First, we propose a special visual attention system that is used to extract salient features. Then, feature fusion strategy based on visual saliency map is designed, which can combines the interesting region and enhances the texture details. The brief introduction of the proposed algorithm is given in Section 3.

3.1. The Special Visual Attention System for Extracting Features

According to Section 2, we can utilize the original VAM to generate the fused image. However, there are two disadvantages to this model. On the one hand, it doesn’t automatically select the optimal modality, which may give unnecessary interference. On the other hand, due to the weak activity region suppression mechanism, it likely causes the background of the fused image to be smooth. Therefore, we propose a special visual attention system to extract the visual features of the source image for image fusion.

3.1.1. Modality Selection Based on Texture Complication Evaluation

Features collected by the intensity and orientation modality are different, so we must find an optimal modality. To solve this problem, we experimented on the TNO image fusion data set that is a public data set in the field of infrared and visible image fusion and contains many different military relevant scenarios. The observed results are as follows:
  • Collecting saliency information from intensity modality is an effective method when image texture smoothing. Since it is very sensitive to the image contrast, the intensity modality can use local contrast to measure the image activity level in the absence of direction information.
  • When the texture details are rich, only the orientation modality can be used to achieve the best effect. In texture-rich image, gradient information in different directions is strong. Therefore, when synthesizing the four directions features maps into a single saliency map, the saliency information is much stronger than the signal intensity modality.
We utilize co-occurrence matrix to quantize the texture complication. Different from other texture evaluation metrics, it takes advantage of the rotation invariance of texture feature and thus has strong resistance to noise [29]. The co-occurrence matrix g ( x , y ) is normalized as follows:
g ( x , y ) = p ( x , y ) x = 0 N g 1 y = 0 N g 1 p ( x , y )
where p ( x , y ) is the number of occurrences of pixel. N g is the quantized gray level. For reducing computational complexity, we usually quantize the image to N g = 16 .
Through the co-occurrence matrix, the local pattern and alignment rules of image can be analyzed, and then the second statistic-contrast is obtained. The equation is as follows:
c o n = x = 0 N g 1 y = 0 N g 1 ( x y ) 2 · g ( x y )
where c o n is the contrast. The large c o n means rich texture features. However, when the size of source images is different, the calculated texture complication may have large deviation. In order to overcome this problem, this paper will interpolate the image size to the same size ( 96 × 96 ) when performing texture complication evaluation. After experimenting on TNO data sets, the threshold c o n was found to be 0.314 which only work for military relevant scenarios. When c o n exceed the threshold, only the orientation modality is used to obtain SM. Otherwise, only intensity modality is used.

3.1.2. Across-Scale Combinations with a Fair Competition Mechanism

After modal selection, we will rely on the contrast or texture features of the image to generate saliency maps. In order to accurately evaluate the activity level of each pixel, this paper attempts to adopt a fair competition mechanism. The saliency map acquisition methods for the two modes are as follows:
(1) Intensity modality
First, the image is gaussian sampled to generate a gaussian pyramid I σ , where the pyramid scale σ is in the range of 0 , 1 , , 8 .Then, the center-surround operator is utilized to generate feature maps. The equation is as follows:
I ( c , s ) = I ( c ) I ( s )
where ⊖ indicates that the size of the two images is adjusted to be the same and then the matrix subtraction operation is performed, s = c + σ , c { 2 , 3 , 4 } , σ { 3 , 4 } . Therefore, we can get six intensity feature maps I ( c , s ) .
Then a linear normalization operator is used to simulate a fair competition mechanism which can reasonably measure the activity level of the targets and the background. The equation is as follows:
S M c = N o r ( c = 2 4 s = c + 3 c + 4 I ( c , s ) )
where N o r ( ) is linear normalization.⊕ indicates that the size of the two images is adjusted to be the same and then the matrix addition operation is performed. S M c is the intensity saliency map. In this way, a fair competition mechanism is formed so that the weak active in the background can also be evaluated.
(2) Orientation modality
The orientations pyramid O ( θ ) σ is obtained by filtering I σ in four angle with gabor filter:
O ( θ ) σ = I σ G a b o r ( θ )
where G a b o r ( ) is the gabor filter and θ { 0 , 45 , 90 , 135 } .
Then, the center-surround operator also is utilized to generate feature maps. The equation is as follows:
O ( c , s , θ ) = O ( c , θ ) O ( s , θ )
Therefore, we can get 24 orientation feature maps O ( c , s , θ ) .
The feature maps in the four directions are also calculated using the fair competition mechanism to obtain four directions maps, and then summed and normalized to generate the final saliency map S M o .The equation is as follows:
S M o = N o r ( θ { 0 , 45 , 90 , 135 } N o r ( c = 2 4 s = c + 3 c + 4 O ( c , s , θ ) ) )
Figure 3 shows the saliency maps from the original VAM and the special visual attention system. Figure 3a,f are the infrared and visible image, respectively. Figure 3b,g are the infrared and visible intensity saliency maps by the original VAM. Figure 3d,i are infrared and visible the orientation saliency maps by the original VAM, respectively. We can see that the original VAM can effectively extract the visually significant areas in the image, but cannot accurately measure the activity level of the details in the background. Figure 3c,h are the infrared and visible intensity saliency maps by the special visual attention system, respectively. We can see that intensity modality not only effectively extract the strong interesting regions, but also accurately measure the activity level in the background. Figure 3e,j are the infrared and visible orientation saliency maps by the special visual attention system, respectively. We can see that orientation modality also can overcome the phenomenon of weak activity area suppression.

3.2. Feature Fusion Strategy Based on the Saliency Maps

A survey of existing saliency-based methods by Meher et al. [23] shows that most saliency-based methods are to separately extract targets from the infrared image and then superimpose them into the visible image (accurate extraction of the target contour is often difficult), which not only loses a lot of complementary information in visible image, but also the noise in the visible image will greatly affect the robustness of the fusion algorithm. Different from existing methods, we use the proposed special visual attention system to extract the features of the infrared and visible image, respectively. Then, normalizing the source image to make sure that the input variables are used equally. Finally, combine the visual features contained in the saliency maps to get the fused saliency maps T h e _ f u s e d _ S M ( x , y ) . The equation is as follows:
T h e _ f u s e d _ S M ( x , y ) = n = 1 2 N o r [ f n ( x , y ) ] × S M n ( x , y ) S M 1 ( x , y ) + S M 2 ( x , y )
where f n ( x , y ) is nth the source image, and its corresponding saliency map is S M n ( x , y ) , n { 1 , 2 } . The range of linear normalization is [ 0 , 1 ] . It can be seen that the fused saliency map contains complementary information of the source image. However, the comparison method is used to fuse image features, which may result in smooth textures. It is not conducive to the observation of the weak targets. To solve this problem, detail features need to be appropriately enhanced.
Since the pixel value of the texture is low, we perform logarithmic transformation to emphasize the low gray value region, the transformation method is as follows:
S ( x , y ) = log [ 1 + T h e _ f u s e d _ S M ( x , y ) ]
where S ( x , y ) is transformed image.
Then, the guided filter is utilized to extract multi-scale detail information. Guided filter is an edge-preserving filter proposed by He et al. [30], which is widely used in image processing [31]. The equation is as follows:
R i ( x , y ) = g u i d e d _ f i l t e r ( ω i , ε i ) S ( x , y )
where g u i d e d _ f i l t e r ( ) is guided filter, ω i and ε i are the filter window and coefficient, respectively. R i ( x , y ) is the ith output layer using S ( x , y ) as both input and guidance image. As the scale of detail continues to increase, the time-consuming will grow linearly, so it is appropriate for i to be 3. The parameters ω i and ε i have been discussed in many literatures [30,32]. Therefore, due to the length of the article, it will not be explained in detail here.
We can combine the output layers to obtain the enhanced fusion saliency map E n h a n c e d _ S M ( x , y ) , the equation is as follows:
E n h a n c e d _ S M ( x , y ) = i = 1 N ω i [ S ( x , y ) log ( R i ( x , y ) + 1 ) ] + T h e _ f u s e d _ S M ( x , y )
where η i is the weight coefficient, and its sum is 1.Then multiply the enhanced feature saliency map by 255 to get the fused image F u s e d ( x , y ) . In order to guarantee that all pixel values are between [ 0 , 255 ] , we also design an overflow judgment. The equation is as follows:
F u s e d ( x , y ) = 255 F u s e d ( x , y ) 255 0 F u s e d ( x , y ) 0 F u s e d ( x , y ) 0 < F u s e d ( x , y ) < 255

4. Experimental Results and Analyses

To test the effectiveness of the fusion algorithm in this paper, we utilize the most commonly used infrared and visible image fusion sets as experimental data. In addition, we compared with classic and state-of-the-art algorithms from qualitative and quantitative, respectively. The computational complexity of our proposed algorithm and comparative algorithms is also discussed. Finally, we have extended the proposed fusion algorithms to the field of medical, multi-focus and multi-exposure image fusion.

4.1. Experimental Settings

(1) Image sets
In experimenting, we selected seven pairs of visible and infrared images as the experimental sample, which was collected from the site: https://figshare.com/articles/TNO$_$Image$_$Fusion$_$Dataset/1008029. Figure 4 shows the seven pairs of images including “Soldier-in-trench”, “Soldier-behind-smoke”, “Kaptein-1123”, “Airplane”, “Road”, “Bench”, and “Kaptein-1654”. Among them, “Soldier-in-trench” contains significant infrared targets and texture-smooth visible images. In “Soldier-behind-smoke”, the visible image contains smoke, and the infrared image has the interesting region. “Kaptein-1123” not only has infrared targets but also contains rich background information in the visible image. The contrast of “Airplane” is very low. “Road” is a set of images taken at night. Both visible and infrared image in “Kaptein-1654” contain significant information. “Bench” contains significant infrared targets, but the background of the visible image has a lot of noise information. The size of images is 768 × 576 , 768 × 576 , 620 × 450 , 595 × 328 , 256 × 256 , 620 × 450 and 280 × 280 , respectively. Each image pair is pre-registered, which can fully verify the effect of the proposed algorithm from different scenes.
(2) Compared algorithms
The proposed algorithm base on visual attention technology (PROPOSE) is compared with seven image fusion algorithms based on gradient transfer (GTF) [22], convolutional neural network (DENSE) [33], guided filter (GFF) [32], latent low-rank representation (LATLRR) [34], visual saliency map and weighted least square optimization (VSM-WSM) [27], feature extraction and visual information preservation (FEVIP) [35] and discrete wavelet transform (DWT) [15], respectively. Among these compared algorithms, DWT is a classic multi-scale transform-based method that first divides the source images into two scales, then fuses the information contained in the two scales, and finally reconstruct the fused image. GFF uses the guided filter to obtain the fusion weight value, which is also a classic image fusion algorithm. In addition, we also compare with five state-of-art image fusion algorithms. VSM-WSM is a saliency-based method that utilizes the gaussian filter to divide the image into base and detail parts, and then fuses them by the least square method and the weighting method, respectively. FEVIP is also a saliency-based method that first reconstructs the infrared background by quadtree and Bedizer interpolation, then subtract the infrared image to obtain the target, and finally superimposes the visible image to obtain the fused image. DENSE, a deep learning-based method, uses convolutional neural network to extract various features and combine them to obtain fused results. LATLRR is a sparse representation-based method that utilize latent low-rank representation to decompose the source image into two layers and design different rules to obtain the fused image. GTF uses gradient transfer and total variation minimization to design decomposed method and fusion rules. These five methods were proposed in the last three years. These compared algorithm codes are derived from public data, and the parameters are the default.
The above seven image fusion algorithms can obtain desired fusion results, and the types of these algorithms are different. By comparing with these algorithms, the superiority of the proposed algorithm can be effectively shown.
(3) Computation platform
The proposed algorithm and the compared algorithms are all implemented on a PC-Windows 10 platform with Inter (R) Core (TM) i7-8700K @ 3.70 GHz processor, 16GB RAM, and CeForce GTX 1080 Ti. Besides, DENSE is performed on graphics processing unit (GPU), while other algorithms are programmed in Matlab.

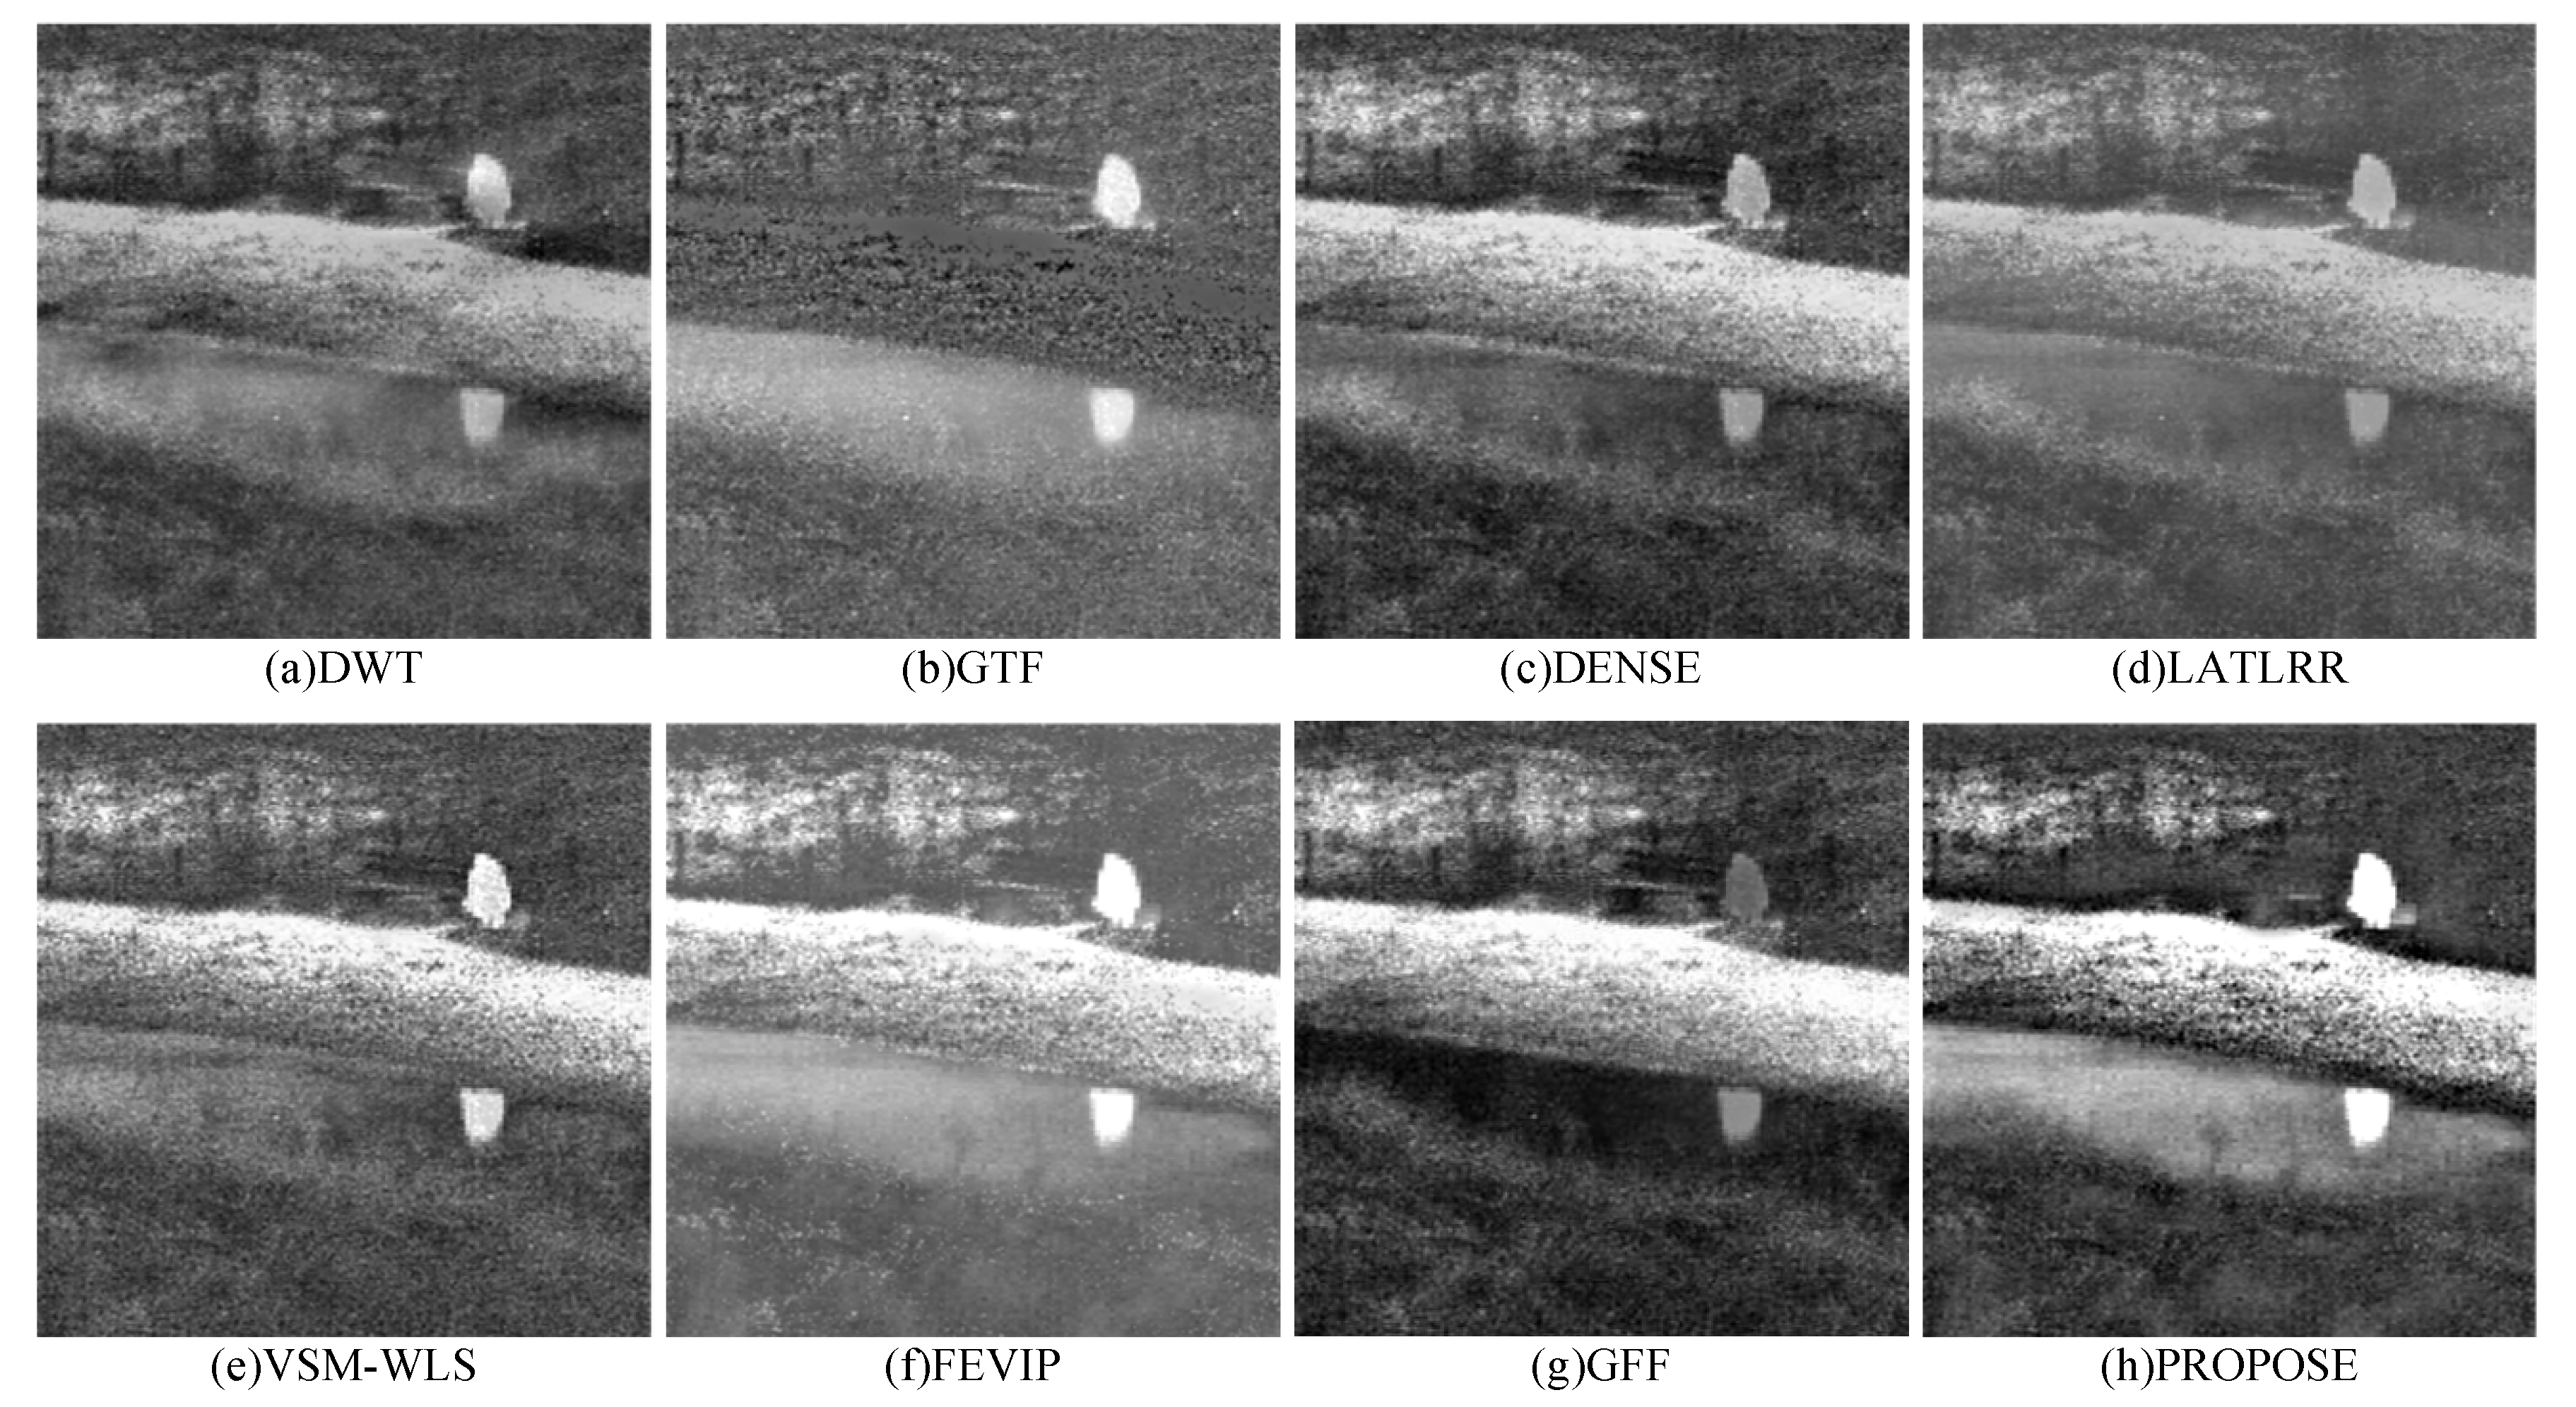
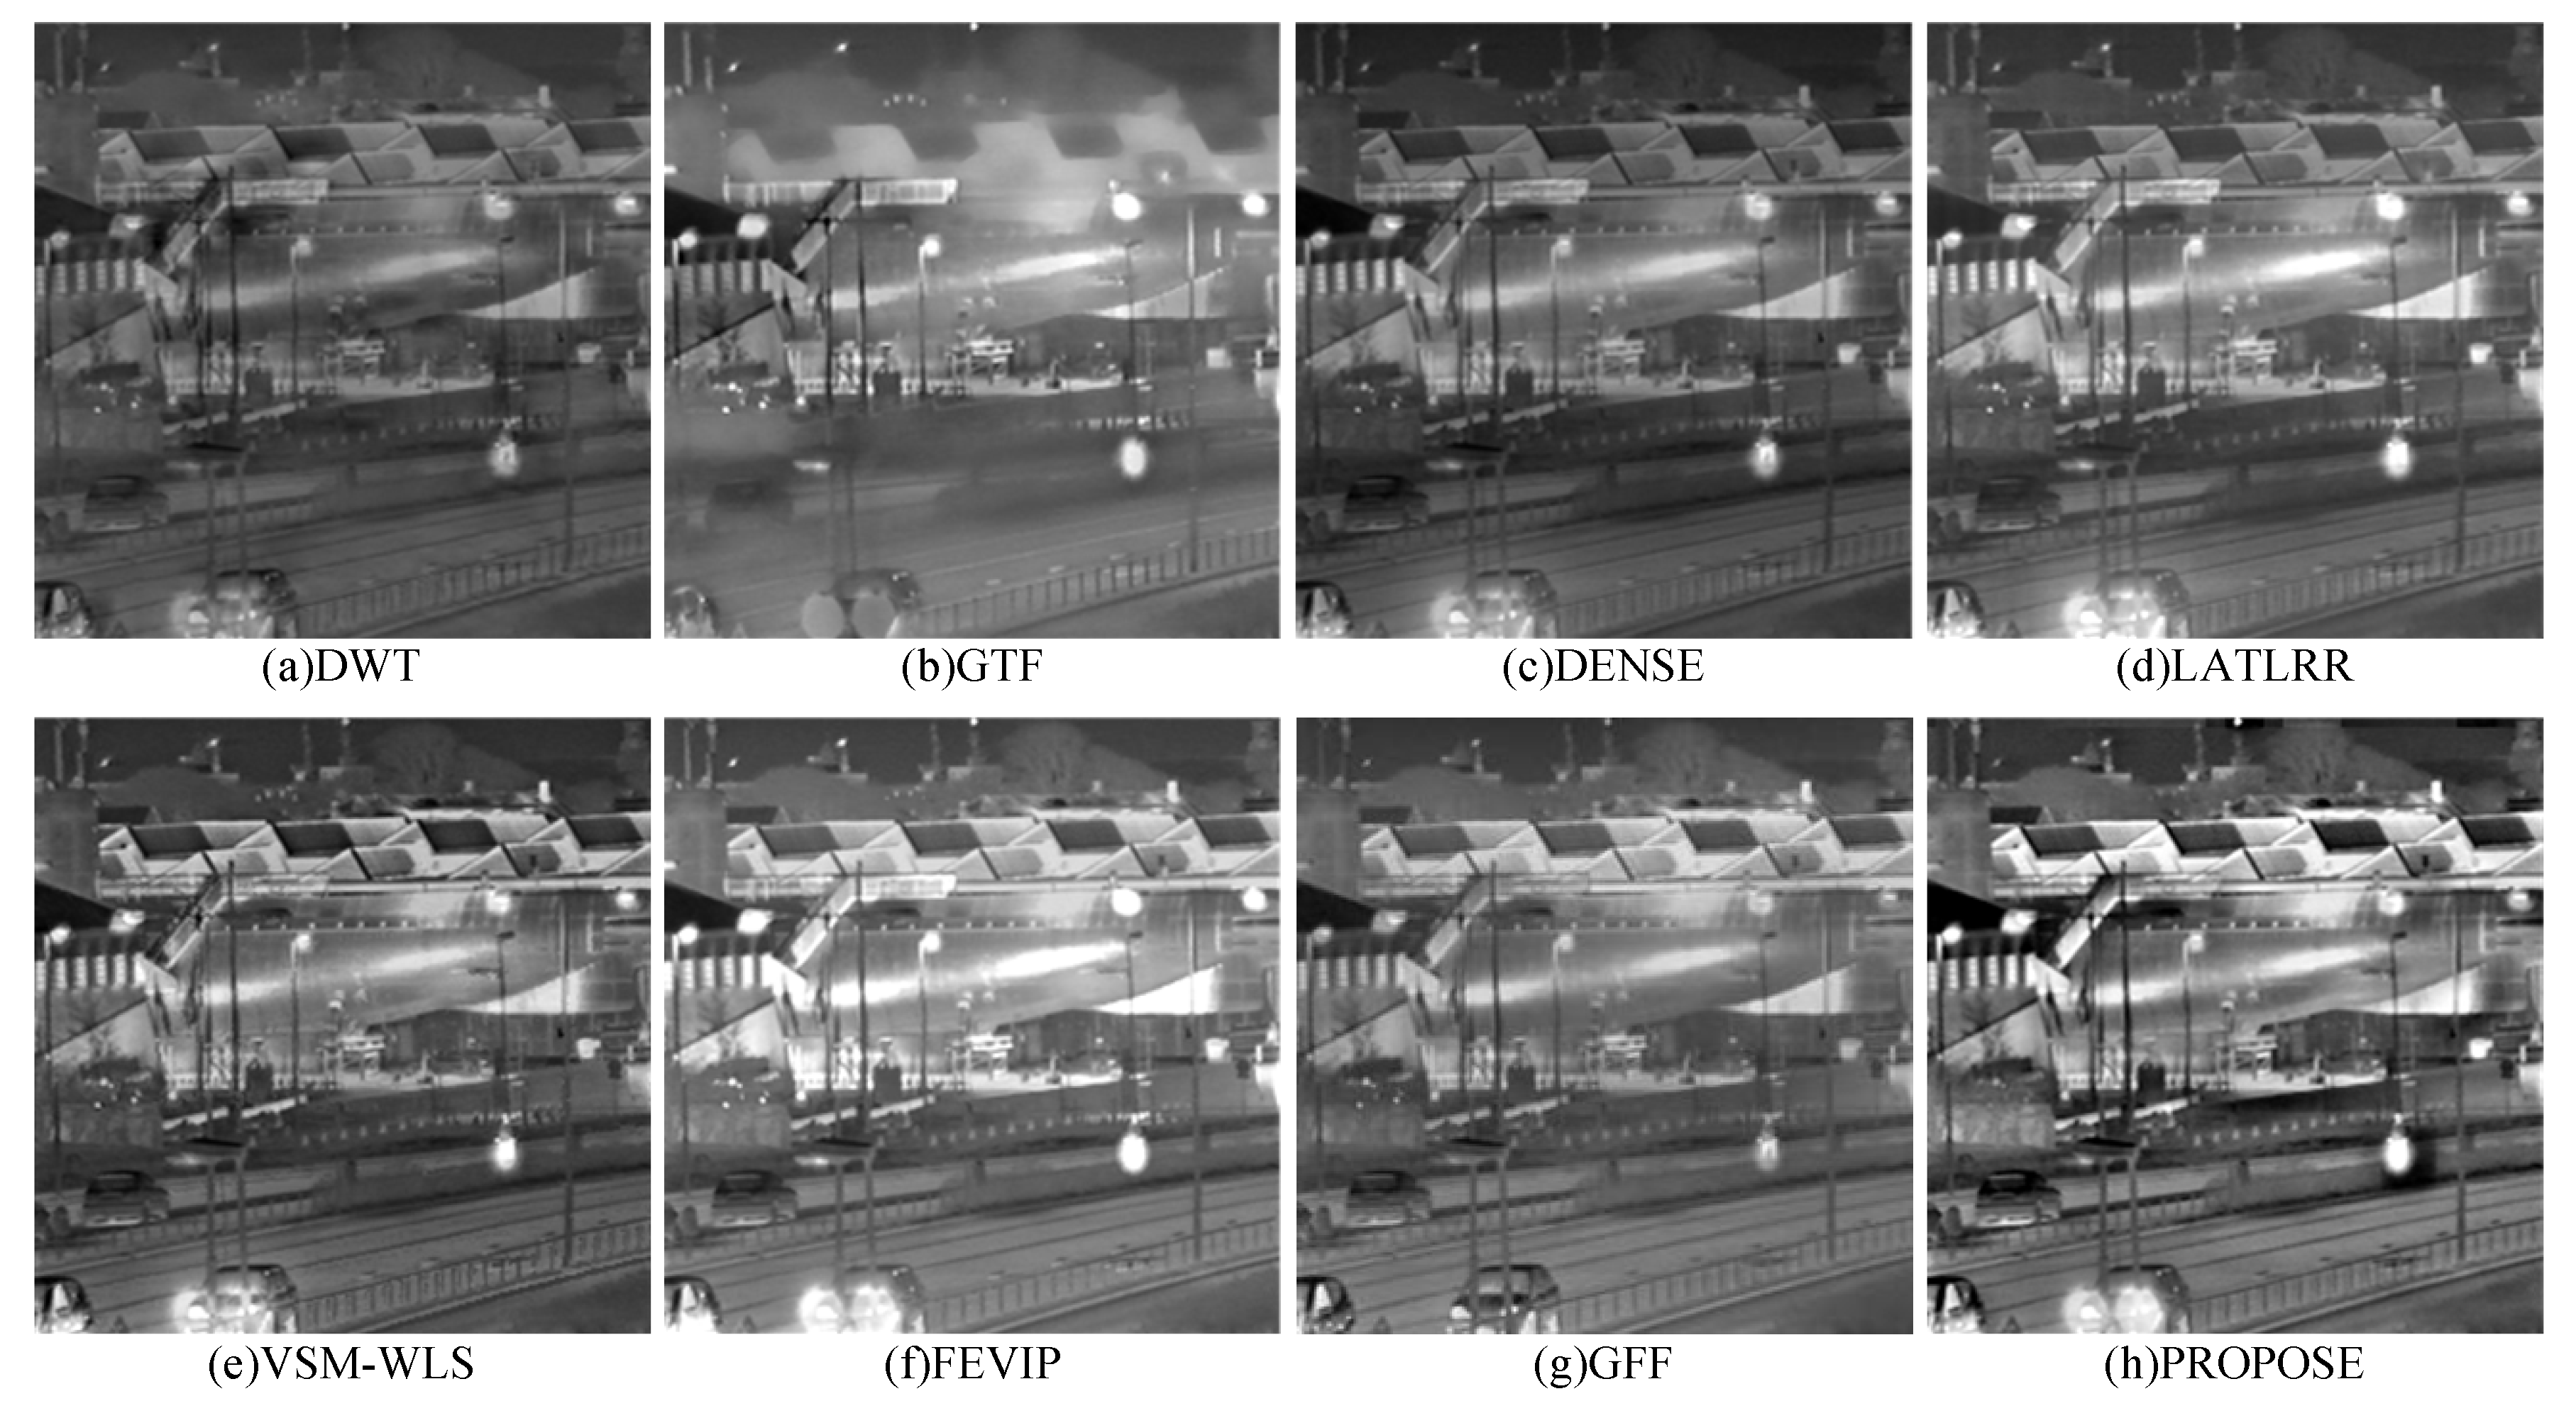
4.2. Qualitative Evaluation

The qualitative evaluation for infrared and visible image fusion can be achieved by the visual effect of the fused image. The experimental results of the DWT, GTF, DENSE, LATLRR, VSM-WLS, FEVIP, GFF and PROPOSE are shown in Figure 5a–h, Figure 6a–h, Figure 7a–h, Figure 8a–h, Figure 9a–h, Figure 10a–h and Figure 11a–h.
Figure 5 shows the fusion results of the “Kaptein-1654” image set. Each fusion algorithm can accomplish the purpose of image fusion. However, different fusion algorithms may produce different fused images. The DWT result loses the significant information and tiny details because this algorithm cannot fully extract various features from the source image (see Figure 5a). The GTF result can preserve the interesting infrared region, but a lot of information contained in the visible image is lost. The DENSE and LATLRR results are better visually than Figure 5a, but these algorithms are also unable to retain the significant information. The VSM-WLS result can preserve the target, but the contrast is low. The background of the FEVIP result is overall bright, which leads to poor visual effects. The GFF results lose a lot of infrared information. However, the result of the proposed algorithm not only can better highlight the interesting region of the source image but also suit the human perception. In summary, the fusion result of the “Kaptein-1654” image set proves that the proposed algorithm can effectively combine the complementary information of the source image.
In addition to verifying the effect of retaining complementary information, it is necessary to test the ability of the proposed algorithm to preserve tiny details. Figure 6 shows the fusion results of the “Kaptein-1123” image set. It can be seen that the DWT fusion result is not only low in contrast but also blurry on the floor. The GTF fusion result can retain the significant information of the infrared image, but it loses a lot of visible background information. The DENSE and LATLRR fusion results are unclear in the texture areas. The FEVIP fusion result has artifacts in the sky. The GFF fusion result appears a lot of noise. The VSM-WLS fusion result is the best of the comparison results, but it cannot retain the salient and detailed regions in the visible image. However, the fusion result of the proposed algorithm not only preserves the interesting region but also has rich tiny details. In summary, the fusion results of the “Kaptein-1123” image set prove that the proposed algorithm can effectively retain the details of the source image, and the artificial information does not appear in the background.
We also experiment with the source images that contain noise to verify the robustness of the proposed algorithm. Figure 7 shows the fusion results of the “Bench” image set. The DWT, DENSE, LATLRR and GFF fusion results lose significant information and have low contrast. The GTF fusion result is disturbed by the noise of the source image. The VSM-WLS and FEVIP fusion results appear some noise in the background, which results in poor visibility. However, due to the better noise immunity of PROPOSE, the fusion result of the proposed algorithm is very clear and overcome noise interference. To further illustrate the robustness of the proposed algorithm, we also chose to experiment in a smoke-interfering environment. In Figure 8, the fusion results of GFF, GTF and the proposed algorithm can clearly observe the interesting region. On the contrary, other fusion results cannot see the target. However, the GTF fusion result can retain target because a lot of visible information is lost. Compared with the GFF fusion result, the proposed algorithm can observe a more complete significant information. In summary, the proposed algorithm can be applied to environments that contain noise.
In addition, we also experimented with the source images taken at night. Figure 9 shows the fusion results of the “Road” image set. The fusion results of DWT, DENSE, LATLRR and GFF cannot highlight the interesting regions such as light and vehicles. The GTF fusion result is very blurred, which is not suitable for human eye observation. The fusion results of VSM-WLS and FEVIP have better contrast than other comparison fusion results. However, because the tiny features are properly enhanced, our fusion results are the clearest among all fusion results. In summary, the proposed algorithm is suitable for observation at night.
Finally, we experiment with low contrast source images to test the effectiveness of the proposed algorithm. Figure 10 shows the fusion results of the “Airplane” image set. It can be seen that the fusion results of the DWT, LATTRR and VSM-WLS have low contrast. The GTF and GFF fusion results lose a lot of complementary information. The FEVIP fusion result has artifacts in the sky. However, because the proposed algorithm protects weak activity regions, the problem of low contrast is solved. Figure 11 shows the fusion results of the “Soldier-in-trench” image set. We can see that the fusion result of the proposed algorithm is clearer than the comparison method. In summary, when the source images contrast is low, the fusion algorithm in this paper can still have a good effect.
In conclusion, the qualitative evaluation results show that the proposed algorithm is suitable for application in various complex environments.

4.3. Quantitative Evaluation

The qualitative evaluation has the disadvantage of human intervention and time-consuming, therefore we also utilize the quantitative method to evaluate the fused images. Quantitative evaluation mainly relies on mathematical calculations to describe image features, which are a very reliable evaluation method. However, the fused images may have some noise, it causes the results of evaluation to be incorrect. To avoid this problem, we will employ multiple evaluation metrics to comprehensively evaluate the fused images. This subsection first introduces the concept of each metric and then the evaluation results are analyzed.

4.3.1. Quantitative Metrics

In recent years, a series of methods for quantitatively evaluating fused images have been proposed. Liu et al. [36] have surveyed the existing quantitative metrics for image fusion and pointed out that these metrics can be divided into three categories: information metrics, image texture metrics and human perception metrics. In this paper, we selected representative metrics from each category including entropy (EN) [37], mutual information (MI) [38], spatial frequency (SF) [39] and visual information fidelity (VIF) [40]. Each metric is defined as follows:
(1) information metrics: EN and MI
EN means the richness of the information contained in the fused image. A larger EN value reflects the better performance in information content. This metrics can be calculated as:
E N = l = 0 L 1 p i log p i
where L is gray levels, p i is the normalized histogram of the corresponding gray level in the fused image.
MI shows the amount of information that the source images convey to the fused image, which can evaluate the ability of the fusion algorithm to combine the complementary information. A larger MI value means that a lot of complementary information is transferred from the source image to the fused results. This metrics can be calculated as:
M I = M I A , F + M I V , F
M I X , F = x , f p X , F ( x , f ) log p X , F ( x , f ) p X ( x ) p F ( f )
where M I A , F and M I V , F are the amount of information that is transferred from infrared and visible to the fused image, respectively. p X , F ( x , f ) is the joint histogram of the source image X and the fused image F. p X ( x ) and p F ( f ) are the marginal histograms of X and F, respectively.
(2) image texture metrics: SF
SF measure the clarity of image texture. A larger SF value means the rich tiny details in the fused image. This metrics can be calculated as:
S F = R F 2 + C F 2
R F = i = 1 M j = 1 N ( F ( i , j ) F ( i , j 1 ) ) 2
C F = i = 1 M j = 1 N ( F ( i , j ) F ( i 1 , j ) ) 2
(3) human perception metrics: VIF
The VIF is used to evaluate the visual effect of the fused image. The larger VIF value, the more consistent with human visual perception. This metric relies on natural scene statistical models, image signal distortion channels, and human visual distortion models.

4.3.2. Quantitative Evaluation Results

The quantitative evaluation results of all image fusion algorithms are shown in Table 1. The bold value in Table 1 represents the maximum value in the corresponding column, and the larger value indicates better performance.
First of all, the ability of all fusion algorithms to combine the complementary information and the information richness of fused images are evaluated by information metrics (MI and EN), respectively. The EN evaluation results show that the fused images of GTF contain the least amount of information because of the improper evaluation of the source images gradient. Besides, the fused images of DWT also have low values, the reason for this problem is that DWT cannot extract various image features. Due to better feature extraction capabilities, the other comparative fusion algorithms (GFF, VSM-WSM, FEVIP, DENSE and LATLRR) have rich information in the fused image. However, since the special visual attention system can measure the activity level of tiny details, the fused images of the proposed algorithm contain more information than the fusion result of the comparison fusion algorithm. For the ability to combine source image information, the MI evaluation results show that GFF, VSM-WSM and FEVIP have higher evaluation values, which indicates that these three algorithms can better combine the source image information. However, FEVIP utilizes quadtree to reconstructs the infrared background, which may result in the loss of infrared information. GFF has poor robustness so that the features of different scenes cannot be accurately extracted by guided filtering. This may cause the redundant information to be transmitted to the fused image. Therefore, compared with FEVIP and GFF, the proposed algorithm achieves high performance, except that GFF has the highest value on the “Bench” and “Soldier-in-trench” because they contain much useless visible image information.
Secondly, the details of the fused image are evaluated by texture metric (SF). The evaluation results show that the DWT and GTF evaluation results have poor performances. Among them, DWT can’t extract the significant features, which lead to texture smoothing. The GTF fusion results have low texture complexity because a lot of visible information is lost. But other comparative fusion algorithms have good gradient information. However, compared with GFF, VSM-WSM, FEVIP, DENFUSE and LATLRR, the evaluation results of the proposed algorithm have great advantages. This is because the fusion algorithm in this paper not only can better extract the salient features of the image, but also design a feature combination strategy to retain the extracted interesting region in the fused image. In conclusion, the proposed algorithm can obtain the fused image with clear texture.
Thirdly, the human visual perception of the fused image is evaluated by human perception metrics (VIF). The evaluation results show that the fused images of the saliency-based methods (VSM-WSM, FEVIP) have better visual in the fusion results of all comparison algorithms because LATLRR, DWT, GFF, GTF and DENSE cannot effectively extract interesting region. However, VSM-WSM and FEVIP use a simple weighted method to fuse the extracted features, which results in the fused image with low contrast. Compared with VSM-VSM and FE-VIP, the fused images of the proposed algorithm has better performance. This is because the feature fusion method designed in this paper can better combine the extracted features, and we also enhance the tiny features.
Moreover, in order to better appear the quantitative performance of the proposed algorithm, Figure 12 also shows the average assessment results of each algorithms. The average score on Figure 4 is shown here. We can see that the EN and MI values of PROPOSE are the largest because the special visual attention system in this paper can effectively extract the complementary information of the source images. SF also has the best performance because the proposed algorithm can properly enhance the details. Finally, since the visual features can be effectively extracted, the VIF of PROPOSE has the highest score.

4.4. Computational Costs

In addition to qualitative and quantitative evaluation, we need to measure the computational cost of the fusion algorithm, which determines the practical application value of these image fusion algorithms. Running time is used to estimate the computational cost of all fusion algorithms.
The evaluation results of each algorithm processing 7 image sets are listed in Table 2, where the bold value denotes the maximum value in the corresponding column, and the larger value indicates better performance. It can be seen that the longest time is the LATLRR, because this algorithm contains a large number of parameters in the LATLRR model. The time of GTF is wasted by traversing the pixels multiple times to obtain gradient information. The VSM-WSM repeats the filtering operation, resulting in an increase in time complexity. The DWT and GFF algorithms have low computational complexity and therefore take less time. Although DENSE performs multi-layer feature extraction, the convolution layer size is small, therefore this image fusion algorithm is faster. Compared with other algorithms, the computational efficiency of the proposed algorithm is second to FEVIP that utilizes an efficient quadtree decomposition strategy, but the fusion algorithm in this paper wastes a lot of computing resources on the guided filter and the co-occurrence matrix. However, efficient programming through C++ without using MATLAB can increase the speed of the fusion algorithm, and as the hardware conditions continue to increase, real-time programs based on the proposed algorithm will not become a problem.

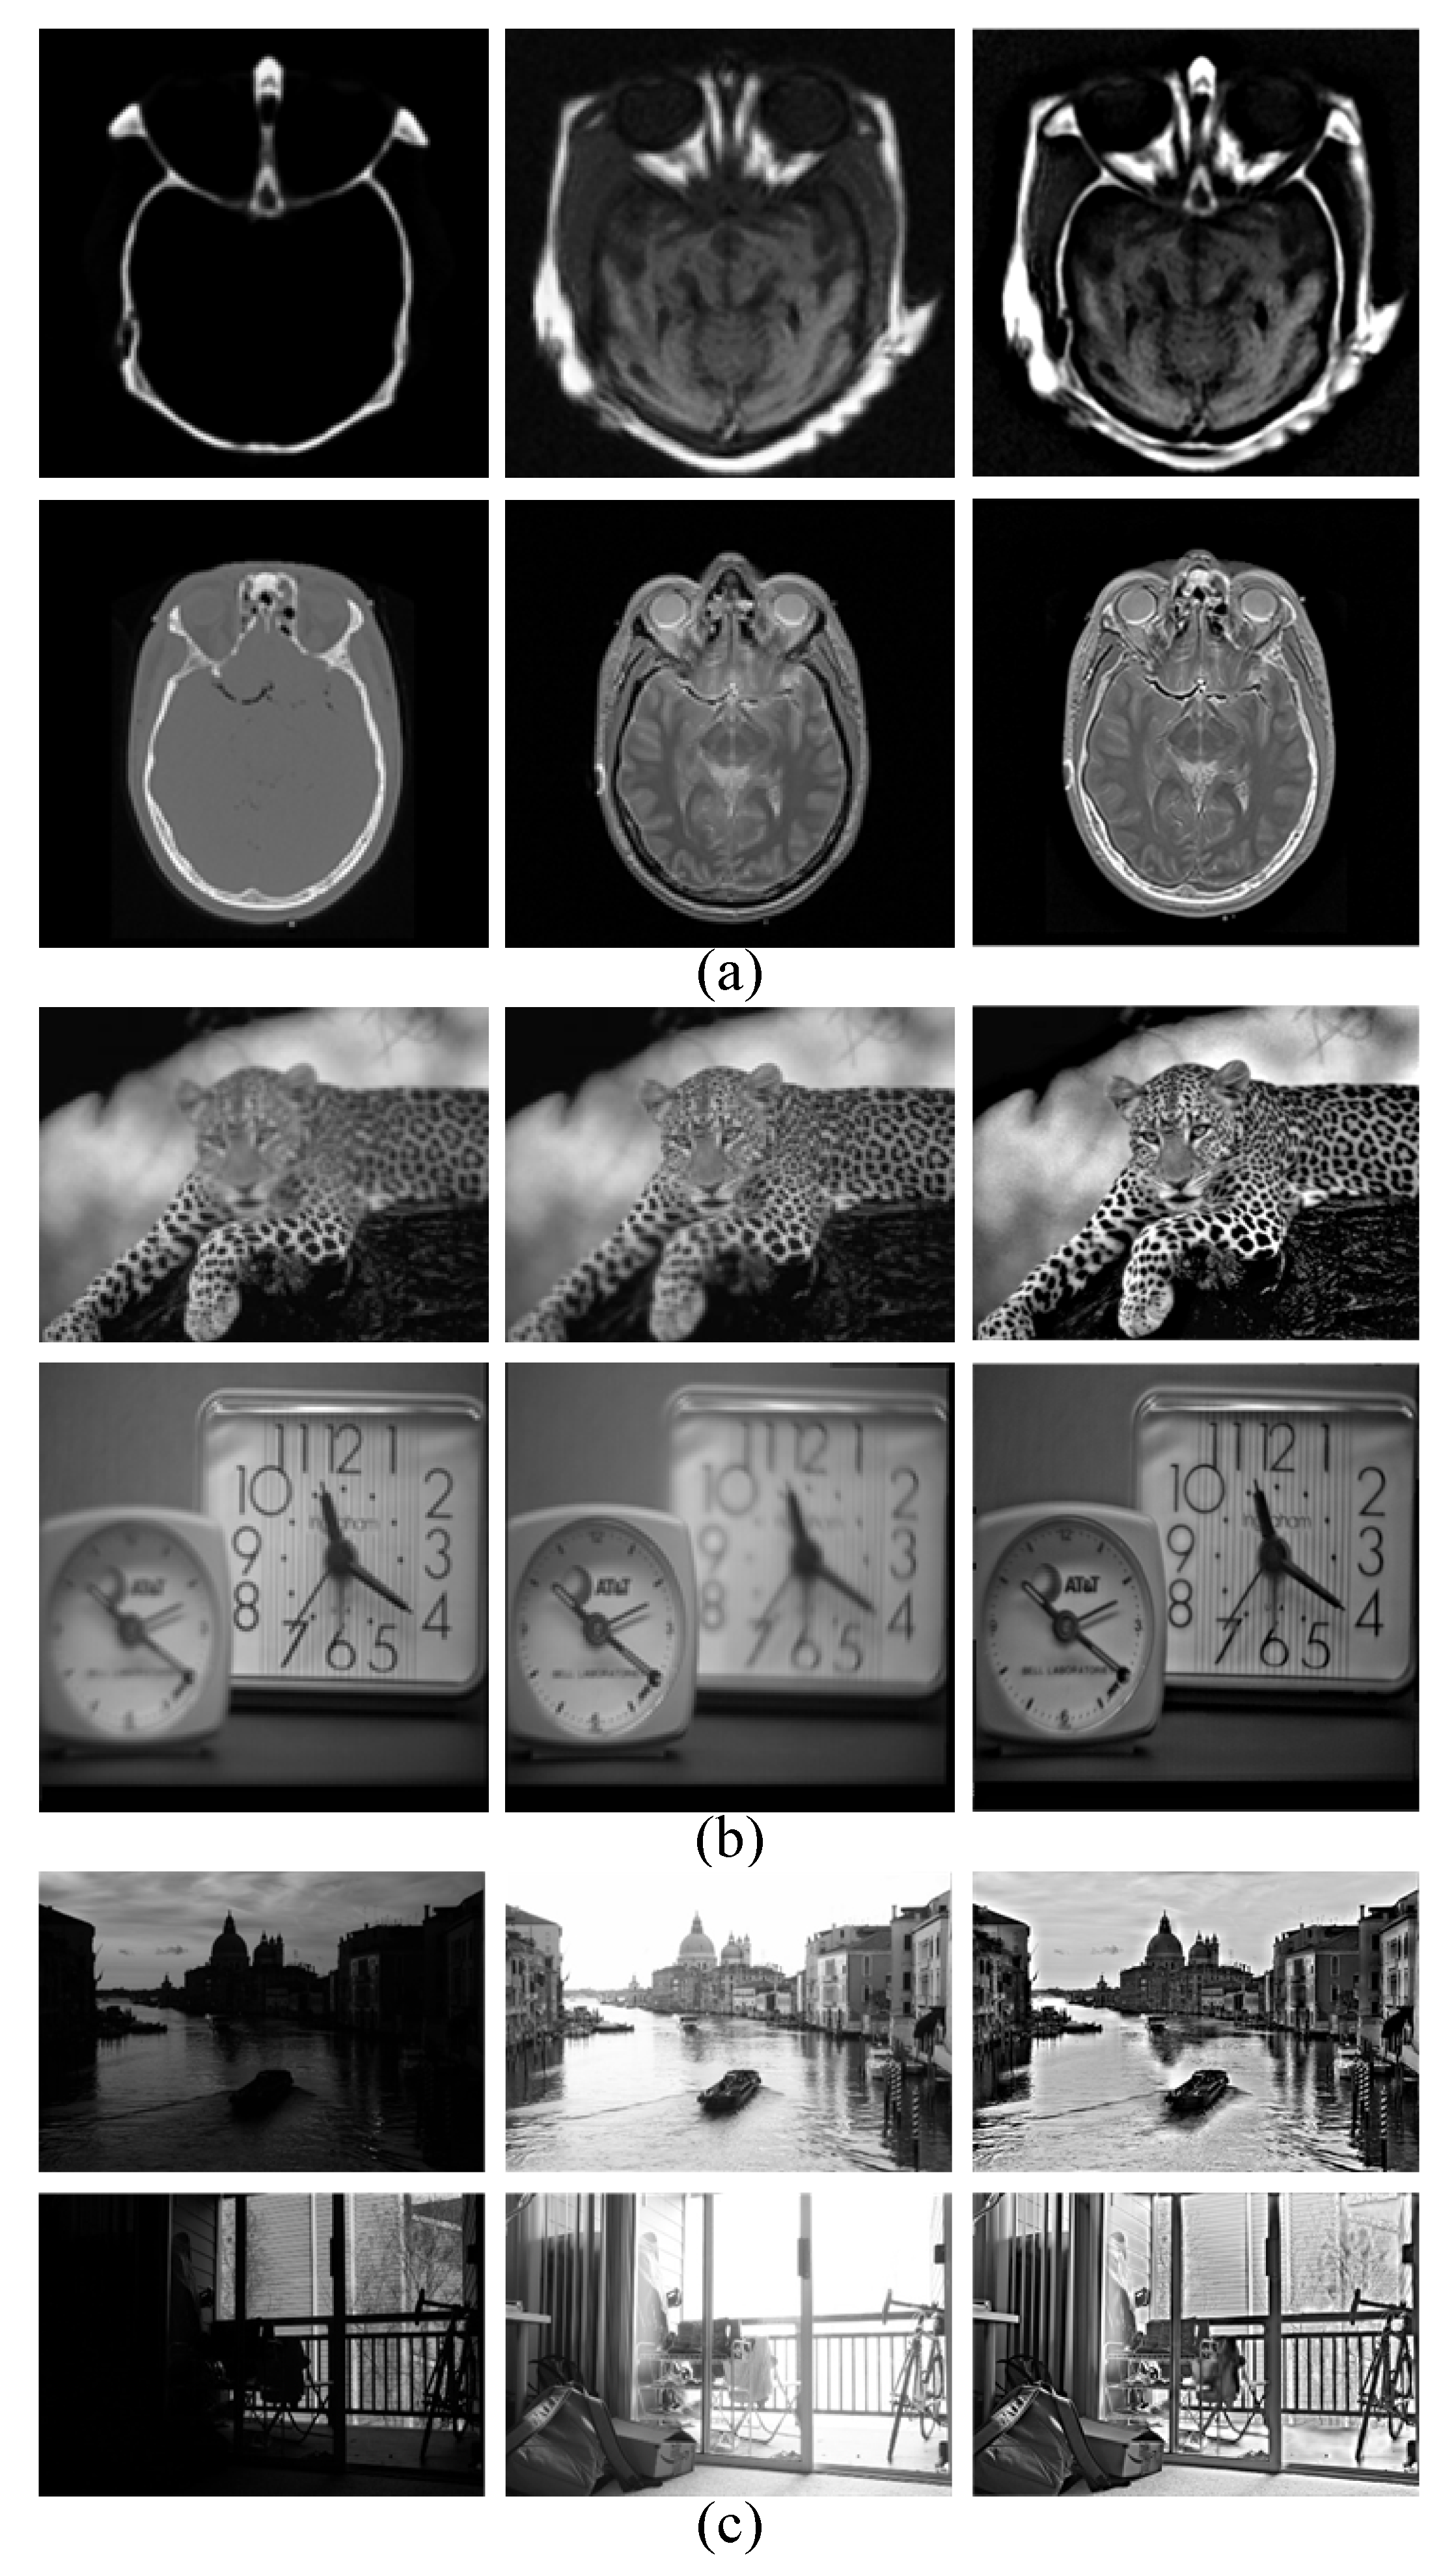
4.5. Extension to Other-Type Image Fusion Field

To further exhibit robustness of the fusion algorithm, we extend the proposed algorithm to multi-modal image fusion, multi-medical image fusion and multi-exposure image fusion. Different types of image have their own characteristics, so the framework and factors considered are also different during the image fusion process. However, since the proposed framework has certain universality and the visual attention technology is not susceptible to complex environments, the fusion algorithm in this paper can be extended to other types of images.
The fusion results of the multi-medical images are shown in Figure 13a. It can be seen that the fusion result can effectively retain the complementary information of the source image.
The fusion results of the multi-modal images are shown in Figure 13b. It can be seen that the fusion result is clearer than the source image. This is because the results obtained by the special visual attention system is similar to the fusion image obtained by the weighted average method, and then the quality of the detail information is improved by the feature fusion strategy.
The fusion results of the multi-exposure image are shown in Figure 13c. It can be seen that the proposed algorithm can successfully solve the over-exposure problem by extracting the exposed regions and retain the details of the source image at the same time.
The discussion and analysis of the experimental results prove that the fusion framework in this paper is a reasonable way. Therefore, future research on fusion algorithms can be continued using this framework.

4.6. Algorithm Limitation Analysis

The proposed fusion algorithm still has some limitations that may weaken its performance under certain conditions.
  • Optimal modality selection threshold. As can be seen from Section 3.1, the optimal modality has played a key role in the proposed algorithm. However, for different data sets, the contrast and texture features of the interesting region are different, so thresholds need to be adjusted for different data sets. In order to resolve this issue, we can experiment on many different data sets, and then the threshold empirical equation can be fitted according to the experimental results. In this way, we can automatically select thresholds for different data sets.
  • Manual parameter selection. As can be seen from Section 3.2, this paper proposes that the feature fusion strategy has the problem of manually designing parameters, which result in the algorithm not being able to run automatically. One possible solution is to match the gray-scale histogram. If there is an over-enhancement phenomenon, adjust the feedback.

5. Conclusions

In this paper, we propose a visible and infrared image fusion algorithm based on visual attention. The proposed algorithm first uses the co-occurrence matrix to select a particular modality. Then, a fair competition mechanism was utilized to obtain the saliency maps. Moreover, a feature fusion strategy is designed to fuse the visual features and appropriately enhance the tiny features, which ensure that the proposed algorithm can be applied to real environment. Experimental results show that the proposed fusion algorithm has advantages in both quantitative and qualitative evaluation, and can be extended to other types of images. Although the proposed method may have some disadvantages (as described in Section 4.6), we have proposed corresponding solutions. In conclusion, the image fusion algorithm in this paper is meaningful and worthwhile. In the future, we will utilize the color modality of visual attention technology to study other-type of color image fusion, such as multispectral image.

Author Contributions

Y.L. and L.D. conceived the proposed algorithm and wrote the paper; Y.C. designed and performed the experiments; W.X. revisited the paper and provided technical guidance. All authors have read and agreed to the published version of the manuscript.

Funding

This research was funded by the National Natural Science Foundation of China (61701069) and the Fundamental Research Funds for the Central Universities of China (3132019340, 3132019200).

Conflicts of Interest

The authors declare no conflict of interest.

References

  1. Ardeshir Goshtasby, A.; Nikolov, S.G. Image fusion: Advances in the state of the art. Inf. Fusion 2007, 8, 114–118. [Google Scholar] [CrossRef]
  2. Liu, Y.; Chen, X.; Wang, Z.; Wang, Z.J.; Ward, R.K.; Wang, X. Deep learning for pixel-level image fusion: Recent advances and future prospects. Inf. Fusion 2017, 42, 158–173. [Google Scholar] [CrossRef]
  3. Li, S.; Kang, X.; Fang, L.; Hu, J.; Yin, H. Pixel-level image fusion: A survey of the state of the art. Inf. Fusion 2017, 33, 100–112. [Google Scholar] [CrossRef]
  4. Ma, J.; Ma, Y.; Li, C. Infrared and visible image fusion methods and applications: A survey. Inf. Fusion 2019, 45, 153–178. [Google Scholar] [CrossRef]
  5. Pohl, C.; Van Genderen, J. Review article Multisensor image fusion in remote sensing: Concepts, methods and applications. Int. J. Remote Sens. 1998, 19, 823–854. [Google Scholar] [CrossRef] [Green Version]
  6. Zhang, Z.; Xin, B.; Deng, N.; Xing, W.; Cheng, Y. An investigation of ramie fiber cross-section image analysis methodology based on edge-enhanced image fusion. Measurement 2019, 145, 436–443. [Google Scholar] [CrossRef]
  7. Palsson, F.; Sveinsson, J.; Ulfarsson, M. Sentinel-2 Image Fusion Using a Deep Residual Network. Remote Sens. 2018, 18, 1290. [Google Scholar] [CrossRef] [Green Version]
  8. Liu, J.; Pan, C.; Wang, G. A Novel Geometric Approach to Binary Classification Based on Scaled Convex Hulls. IEEE Trans. Neural Netw. 2009, 20, 1215–1220. [Google Scholar]
  9. Pan, X.; Li, L.; Yang, H.; Liu, Z.; Yang, J.; Zhao, L.; Fan, Y. Accurate segmentation of nuclei in pathological images via sparse reconstruction and deep convolutional networks. Neurocomputing 2017, 229, 88–99. [Google Scholar] [CrossRef]
  10. Li, H.; Liu, L.; Huang, W. An improved fusion algorithm for infrared and visible images based on multi-scale transform. Infrared Phys. Technol. 2016, 74, 28–37. [Google Scholar] [CrossRef]
  11. Cvejic, N.; Bull, D.; Canagarajah, N. Region-based multimodal image fusion using ICA bases. IEEE Sens. J. 2007, 7, 743–751. [Google Scholar] [CrossRef] [Green Version]
  12. Bouwmans, T.; Javed, S.; Zhang, H. On the Applications of Robust PCA in Image and Video Processing. Proc. IEEE 2018, 106, 1427–1457. [Google Scholar] [CrossRef] [Green Version]
  13. Chai, P.; Luo, X.; Zhang, Z. Image fusion using quaternion wavelet transform and multiple features. IEEE Access 2017, 5, 6724–6734. [Google Scholar] [CrossRef]
  14. Bulanon, D.M.; Burks, T.F.; Alchanatis, V. Image fusion of visible and thermal images for fruit detection. Biosyst. Eng. 2009, 103, 12–22. [Google Scholar] [CrossRef]
  15. Zhang, Z.; Blum, R.S. A categorization of multiscale-decomposition-based image fusion schemes with a performance study for a digital camera application. Proc. IEEE 1999, 87, 1315–1326. [Google Scholar] [CrossRef] [Green Version]
  16. Yang, B.; Li, S. Multifocus image fusion and restoration with sparse representation. IEEE Trans. Instrum. Meas. 2010, 59, 884–892. [Google Scholar] [CrossRef]
  17. Liu, Y.; Liu, S.; Wang, Z. A general framework for image fusion based on multi-scale transform and sparse representation. Inf. Fusion 2015, 24, 147–164. [Google Scholar] [CrossRef]
  18. Zhang, Q.; Liu, Y.; Blum, R.; Blum, R.; Han, J.; Tao, D. Sparse representation based multi-sensor image fusion for multi-focus and multi-modality images: A review. Inf. Fusion 2018, 40, 57–75. [Google Scholar] [CrossRef]
  19. Ma, J.; Yu, W.; Liang, P.; Li, C.; Jiang, J. FusionGAN: A generative adversarial network for infrared and visible image fusion. Inf. Fusion 2019, 48, 11–26. [Google Scholar] [CrossRef]
  20. Liu, Y.; Dong, L.; Ji, Y.; Xu, W. Infrared and Visible Image Fusion through Details Preservation. Sensors 2019, 19, 4556. [Google Scholar] [CrossRef] [Green Version]
  21. Zhao, J.; Cui, G.; Gong, X. Fusion of visible and infrared images using global entropy and gradient constrained regularization. Infrared Phys. Technol 2017, 81, 201–209. [Google Scholar] [CrossRef]
  22. Ma, J.; Chen, C.; Li, C. Infrared and visible image fusion via gradient transfer and total variation minimization. Inf. Fusion 2016, 31, 100–109. [Google Scholar] [CrossRef]
  23. Meher, B.; Agrawal, S.; Panda, R.; Abraham, A. A survey on region based image fusion methods. Inf. Fusion 2019, 48, 119–132. [Google Scholar] [CrossRef]
  24. Meng, F.; Song, M.; Guo, B. Image fusion based on object region detection and non-subsampled contourlet transform. Comput. Electr. Eng. 2017, 62, 375–383. [Google Scholar] [CrossRef]
  25. Zhang, B.; Lu, X.; Pei, H. A fusion algorithm for infrared and visible images based on saliency analysis and non-subsampled shearlet transform. Infrared Phys. Technol. 2015, 73, 286–297. [Google Scholar] [CrossRef]
  26. Liu, C.; Qi, Y.; Ding, W. Infrared and visible image fusion method based on saliency detection in sparse domain. Infrared Phys. Technol. 2017, 83, 94–102. [Google Scholar] [CrossRef]
  27. Ma, J.; Zhou, Z.; Wang, B. Infrared and visible image fusion based on visual saliency map and weighted least square optimization. Infrared Phys. Technol. 2017, 82, 8–17. [Google Scholar] [CrossRef]
  28. Itti, L.; Koch, C.; Niebur, E. A model of saliency-based visual attention for rapid scene analysis. IEEE Trans. Pattern Anal. Mach. Intell. 1998, 20, 1254–1259. [Google Scholar] [CrossRef] [Green Version]
  29. Tahir, M.A.; Bouridane, A.; Kurugollu, F. Accelerating the computation of GLCM and Haralick texture features on reconfigurable hardware. In Proceedings of the IEEE International Conference on Image Processing, Singapore, 24–27 October 2004. [Google Scholar]
  30. He, K.; Sun, J.; Tang, X. Guided image filter. IEEE Trans. Pattern Anal. Mach. Intell. 2013, 35, 1397–1409. [Google Scholar] [CrossRef]
  31. Zhang, W.; Dong, L.; Pan, X.; Zhou, J.; Qin, L.; Xu, W. Single Image Defogging Based on Multi-Channel Convolutional MSRCR. IEEE Access 2019, 7, 72492–72504. [Google Scholar] [CrossRef]
  32. Li, S.; Kang, X.; Wang, Z. Image fusion with guided filtering. IEEE Trans. Image Process 2013, 22, 2864–2875. [Google Scholar] [PubMed]
  33. Prabhakar, K.R.; Srikar, V.S.; Babu, R.V. DeepFuse: A Deep Unsupervised Approach for Exposure Fusion with Extreme Exposure Image Pairs. In Proceedings of the 2017 IEEE International Conference on Computer Vision (ICCV), Venice, Italy, 22–29 October 2017; pp. 4714–4722. [Google Scholar]
  34. Li, H.; Xiao, J. Infrared and visible image fusion using Latent Low-Rank Representation. arXiv 2019, arXiv:1804.08992. [Google Scholar]
  35. Zhang, Y.; Zhang, L.; Bai, X.; Zhang, L. Infrared and Visual Image Fusion through Infrared Feature Extraction and Visual Information Preservation. Infrared Phys. Technol. 2017, 83, 227–237. [Google Scholar] [CrossRef]
  36. Liu, Z.; Blasch, E.; Xue, Z. Objective Assessment of Multiresolution Image Fusion Algorithms for Context Enhancement in Night Vision: A Comparative Study. IEEE Trans. Pattern Anal. Mach. Intell. 2012, 34, 94–109. [Google Scholar] [CrossRef] [PubMed]
  37. Bai, X.; Zhou, F.; Xue, B. Edge preserved image fusion based on multiscale toggle contrast operator. Image Vis. Comput. 2011, 29, 829–839. [Google Scholar] [CrossRef]
  38. Eskicioglu, A.M.; Fisher, P.S. Image quality measures and their performance. IEEE Trans. Commun. 1995, 43, 2959–2965. [Google Scholar] [CrossRef] [Green Version]
  39. Cheng, B.; Jin, L.; Li, G. Infrared and visual image fusion using LNSST and an adaptive dual-channel PCNN with triple-linking strength. Neurocomputing 2018, 310, 135–147. [Google Scholar] [CrossRef]
  40. Roberts, J.; Van Aardt, J.; Ahmed, F. Assessment of image fusion procedures using entropy, image quality, and multispectral classification. J. Appl. Remote Sens. 2008, 2, 023522. [Google Scholar]
Figure 1. Different modalities saliency maps of the original VAM. (a) is an infrared image, its intensity, orientation and the combination of two modality saliency map are (bd), respectively. (e) is a visible image, its intensity, orientation and the combination of two modality saliency map are (fh), respectively.
Remotesensing 12 00781 g001
Figure 2. The proposed fusion framework.
Remotesensing 12 00781 g002
Figure 3. The saliency maps from the original VAM and the special visual attention system. (a,f) are the infrared and visible image, respectively. (b,g) are the infrared and visible intensity saliency maps by the original VAM. (c,h) are the infrared and visible intensity saliency maps by the special visual attention system. (d,i) are the infrared and visible orientation saliency maps by the original VAM. (e,j) are the infrared and visible orientation saliency maps by the special visual attention system.
Remotesensing 12 00781 g003
Figure 4. The infrared and visible image sets used in experiments. (a) The “Soldier-in-trench” image set. (b) The “Soldier-behind-smoke” image set. (c) The “Kaptein-1123” image set. (d) The “Airplane” image set. (e) The “Road” image set. (f) The “Kaptein-1654” image set. (g) The “Bench” image set.
Remotesensing 12 00781 g004
Figure 5. The fusion results of the “Kaptein-1654” image set. (ah) are the result of DWT, GTF, DENSE, LATLRR, VSM-WLS, FEVIP, GFF and PROPOSE, respectively.
Remotesensing 12 00781 g005
Figure 6. The fusion results of the “Kaptein-1123” image set. (ah) are the result of DWT, GTF, DENSE, LATLRR, VSM-WLS, FEVIP, GFF and PROPOSE, respectively.
Remotesensing 12 00781 g006
Figure 7. The fusion results of the “Bench” image set. (ah) are the result of DWT, GTF, DENSE, LATLRR, VSM-WLS, FEVIP, GFF and PROPOSE, respectively.
Remotesensing 12 00781 g007
Figure 8. The fusion results of the “Soldier-behind-smoke” image set. (ah) are the result of DWT, GTF, DENSE, LATLRR, VSM-WLS, FEVIP, GFF and PROPOSE, respectively.
Remotesensing 12 00781 g008
Figure 9. The fusion results of the “Road” image set. (ah) are the result of DWT, GTF, DENSE, LATLRR, VSM-WLS, FEVIP, GFF and PROPOSE, respectively.
Remotesensing 12 00781 g009
Figure 10. The fusion results of the “Airplane” image set. (ah) are the result of DWT, GTF, DENSE, LATLRR, VSM-WLS, FEVIP, GFF and PROPOSE, respectively.
Remotesensing 12 00781 g010
Figure 11. The fusion results of the “Soldier-in-trench” image set. (ah) are the result of DWT, GTF, DENSE, LATLRR, VSM-WLS, FEVIP, GFF and PROPOSE, respectively.
Remotesensing 12 00781 g011
Figure 12. The average quantitative assessment of each fusion method. (a) The evaluation results of EN. (b) The evaluation results of SF. (c) The evaluation results of MI. (d) The evaluation results of VIF.
Remotesensing 12 00781 g012
Figure 13. Fusion results of the other three modal images. (a) Medical image fusion. (b) Multi-focus image fusion. (c) Multi-exposure image fusion.
Remotesensing 12 00781 g013
Table 1. The results of quantitative evaluation for eight algorithms.
GroupFusion AlgorithmEvaluation Index
ENMISFVIF
Kaptein-1654DWT6.480712.96148.35510.6842
GFF7.031514.06309.76030.7862
VSM-WSM6.742613.485312.1580.7933
FEVIP6.664813.329711.8030.8394
DENSE6.413312.82676.90270.6976
GTF6.524413.04889.16000.6558
LATLRR6.554613.10937.64900.6651
PROPOSED7.043814.087714.3140.9089
BenchDWT7.080714.161418.09120.6409
GFF7.493414.986823.20690.8241
VSM-WSM7.164614.329326.35910.6546
FEVIP6.929713.859421.79050.6886
DENSE7.349614.699321.60910.6627
GTF6.778113.556221.81490.7237
LATLRR6.855013.710115.85570.5950
PROPOSED7.367614.735227.53560.8357
Kaptein-1123DWT6.972113.94428.29290.7879
GFF6.856313.71277.07140.7057
VSM-WSM6.971413.942910.5800.8895
FEVIP7.169114.33839.27260.9552
DENSE6.907313.81477.14280.8230
GTF6.958113.91626.47380.7037
LATLRR6.701613.40326.40510.7232
PROPOSED7.421214.842410.7010.9851
Soldier-in-trenchDWT6.885613.771110.59370.8135
GFF7.184514.866813.01780.9179
VSM-WSM6.973813.947713.86720.9587
FEVIP6.943113.886411.72210.8934
DENSE6.999613.999310.11630.8834
GTF6.601513.203112.53060.8535
LATLRR6.554813.10978.112500.7282
PROPOSED7.206114.412214.04250.9365
AirplaneDWT6.694213.38855.57770.7933
GFF6.447712.89545.25790.7515
VSM-WSM6.610413.22105.92020.8567
FEVIP6.730213.46067.19180.8798
DENSE7.035014.07006.10900.9516
GTF5.856311.71274.39890.6881
LATLRR6.457112.91434.26040.7423
PROPOSED7.144414.28898.11861.0698
Soldier_behind_smokeDWT6.903913.80798.52190.7425
GFF7.526315.152711.8840.9369
VSM-WSM6.973513.947011.8310.9064
FEVIP7.027114.054311.6260.9149
DENSE7.052314.10467.89670.8117
GTF6.601513.203010.9240.8302
LATLRR6.923913.84797.75480.7209
PROPOSED7.648915.297915.0630.7842
RoadDWT6.648513.297112.89520.5427
GFF7.152714.305617.72890.7165
VSM-WSM7.265614.531322.84750.6218
FEVIP7.332514.665021.57300.7106
DENSE7.085814.171713.94730.5809
GTF7.087814.175614.69030.5906
LATLRR7.180314.360616.49280.5532
PROPOSED7.586015.172126.69660.7334
Table 2. The comparison of the computational costs.
Fusion AlgorithmKaptein-1654BenchKaptein-1123Soldier-in-TrenchAirplaneSoldier_behind_SMOKERoad
DWT0.24170.09810.20850.30580.16470.27350.1009
GFF0.20470.06280.20420.30860.16690.30460.0709
VSM-WSM1.66260.24641.65212.85381.14552.85570.2132
FEVIP0.08270.04670.09040.09970.07610.10740.0500
DENSE0.42630.39060.67270.48770.60180.50470.3663
GTF3.53500.29463.13966.22773.19883.80560.2673
LATLRR58.97113.08159.234108.0942.076110.1110.999
PROPOSED0.20540.05140.21610.35700.15340.34430.0487

