Monitoring of Coral Reefs Using Artificial Intelligence: A Feasible and Cost-Effective Approach


 ,
,
Abstract

1. Introduction
2. Materials and Methods
2.1. Dataset
2.2. Deep Learning for Automated Image Classification
2.2.1. Overview
2.2.2. Classification of Random Point Annotations
2.3. Performance of Automated Image Annotation
2.3.1. Test Transects
2.3.2. Absolute Error (|E|) for Estimation of Abundance
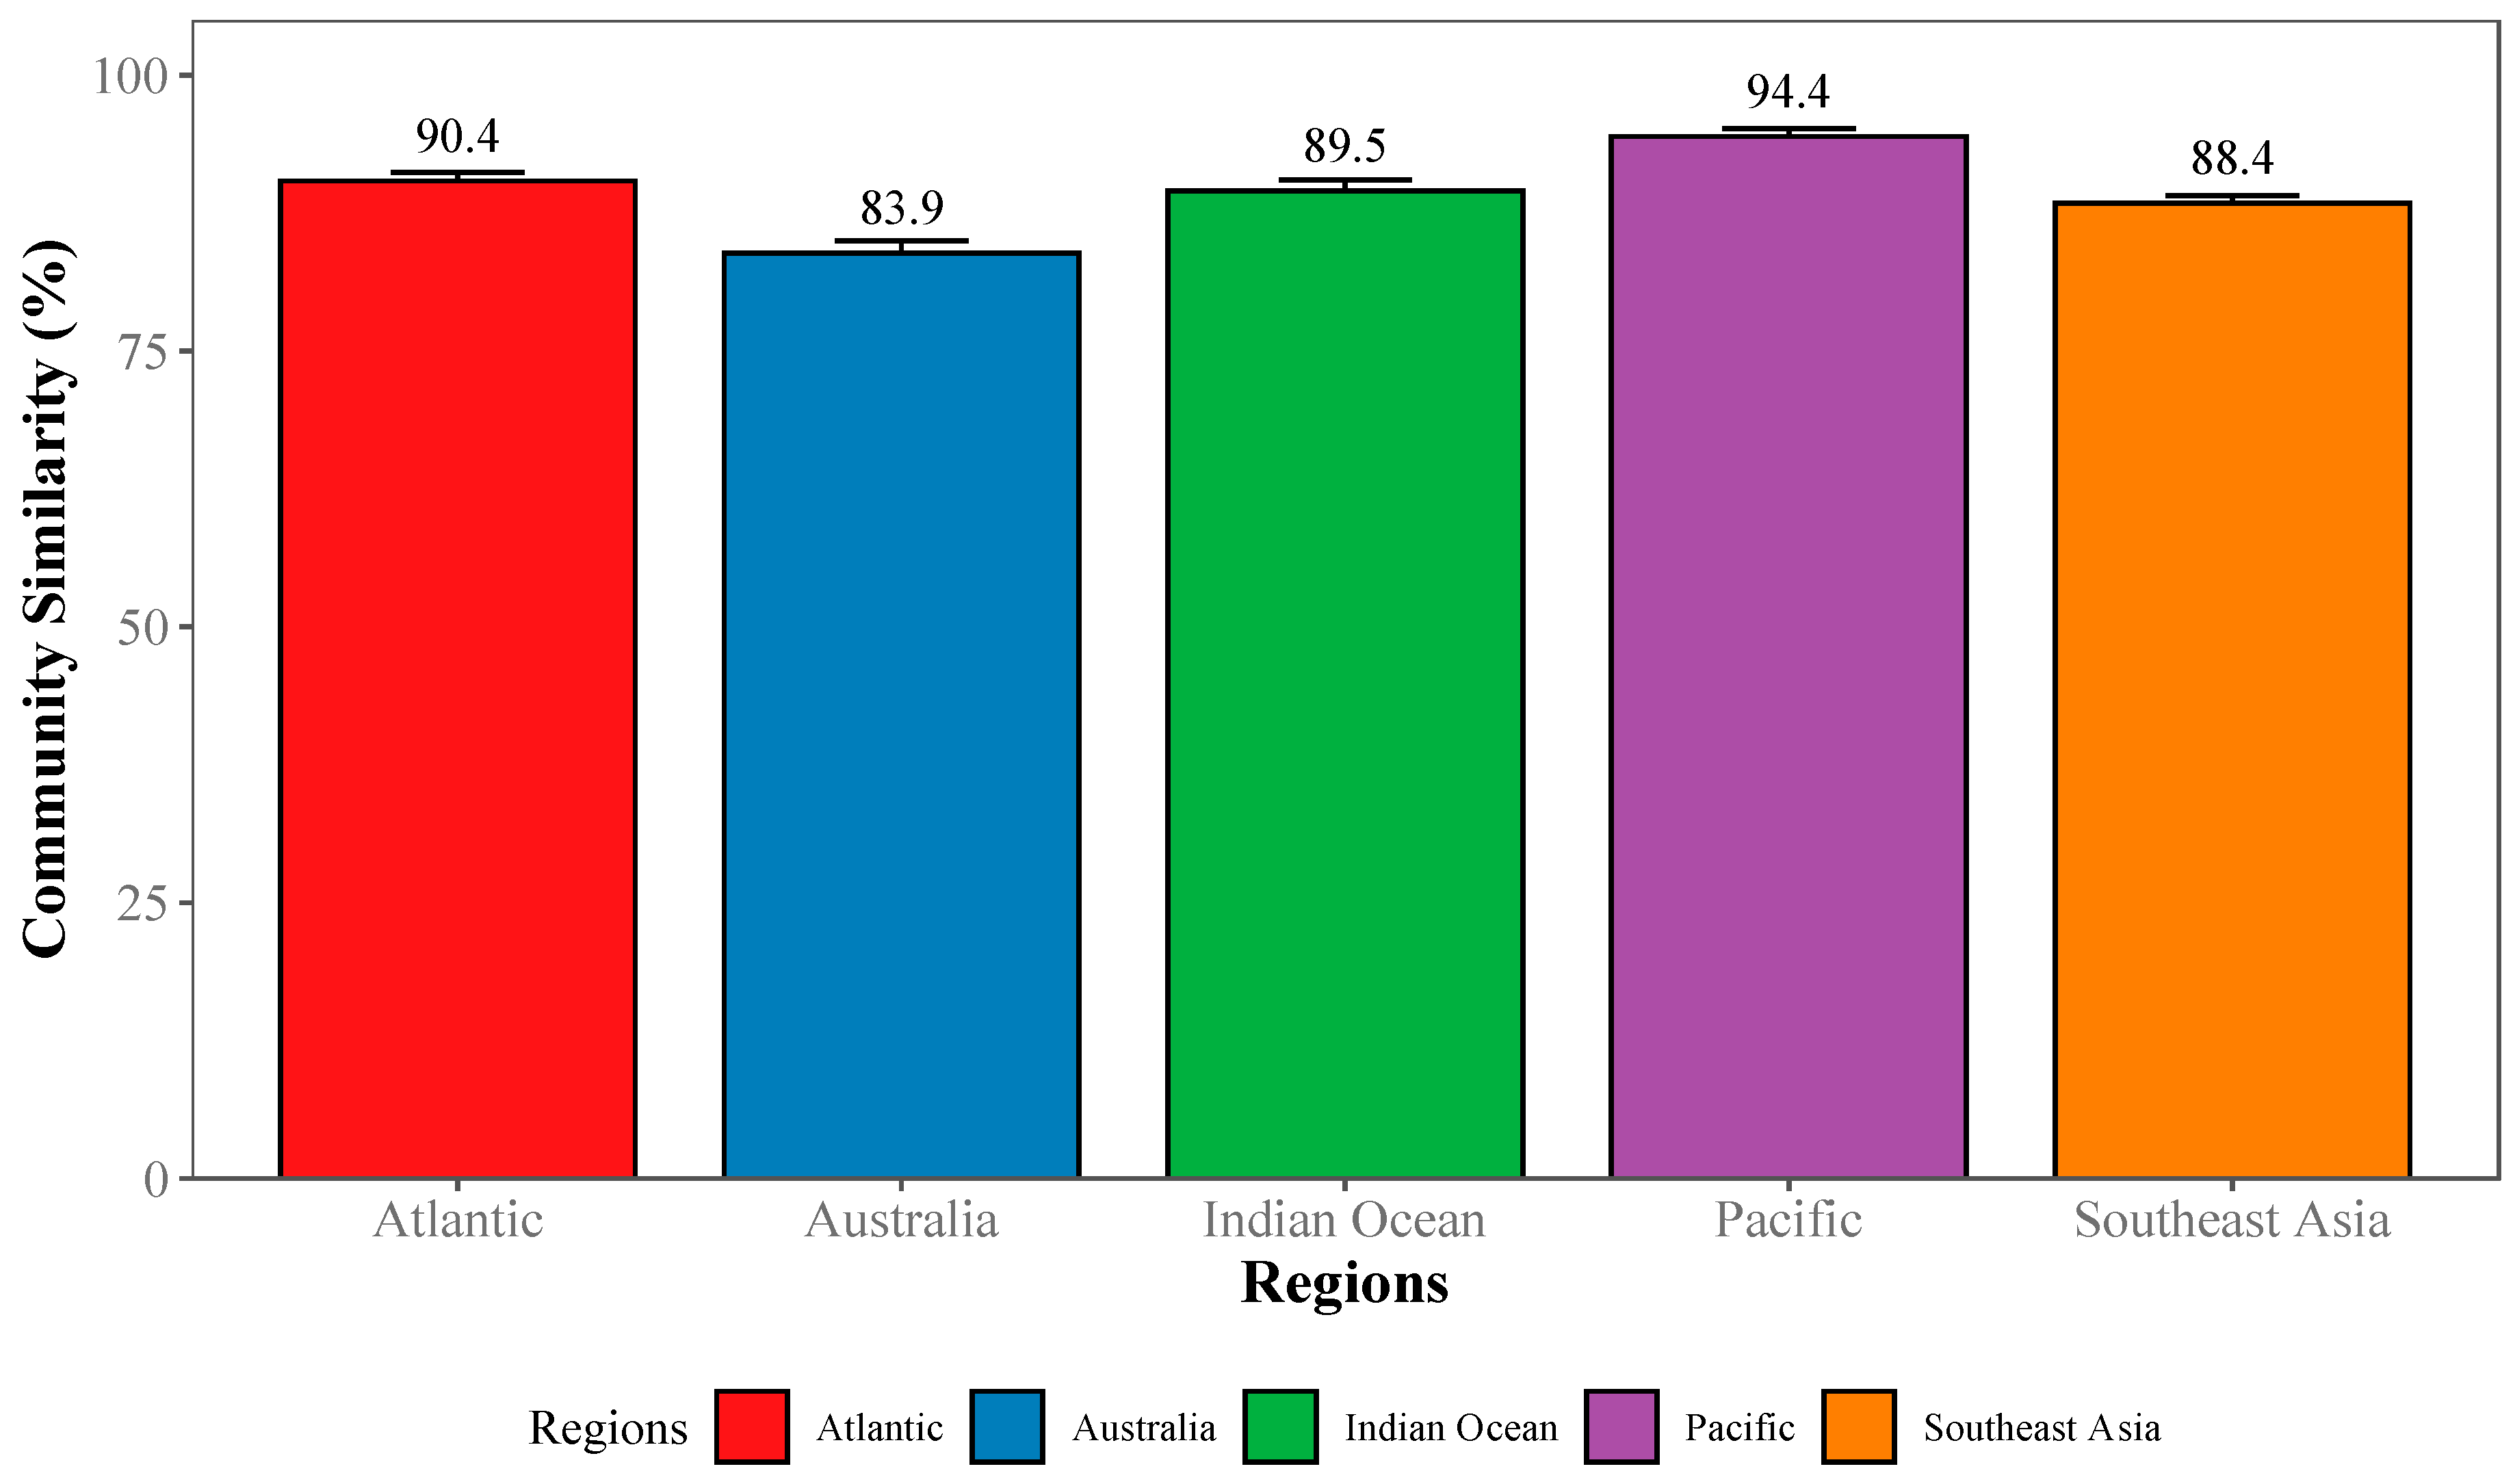
2.3.3. Community-Wide Performance
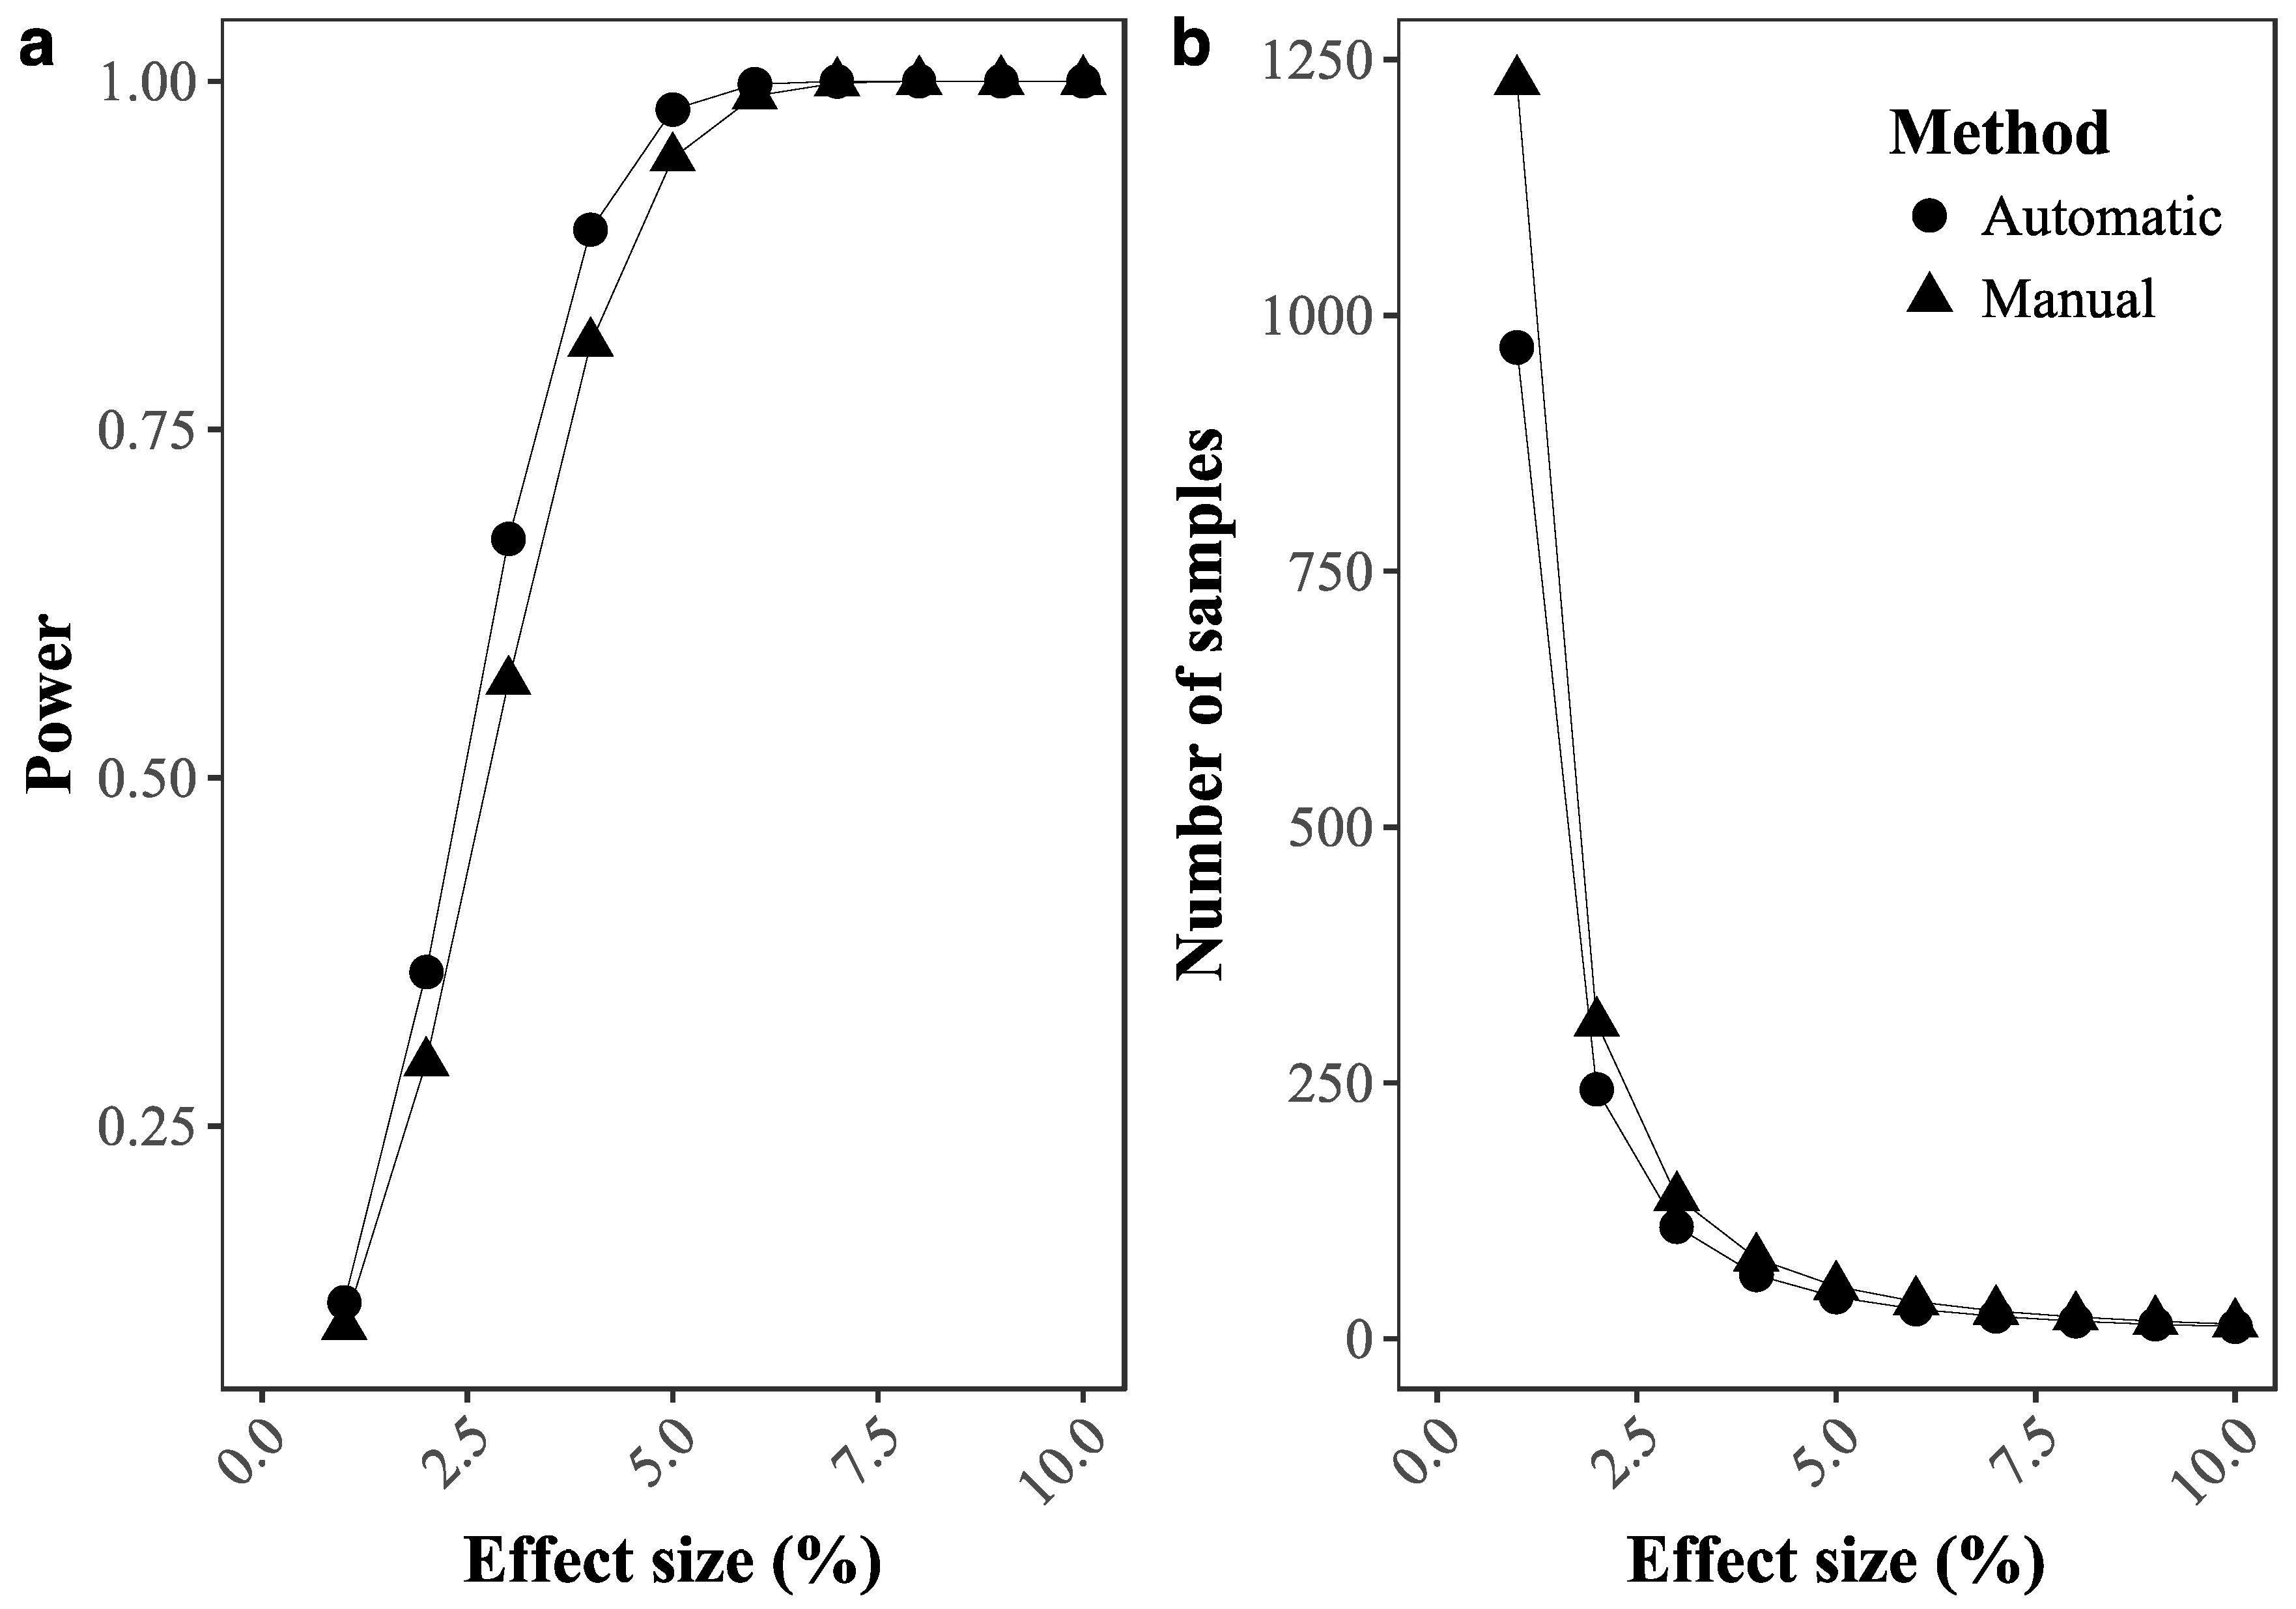
2.3.4. Ability to Detect Temporal Changes in Coral Cover
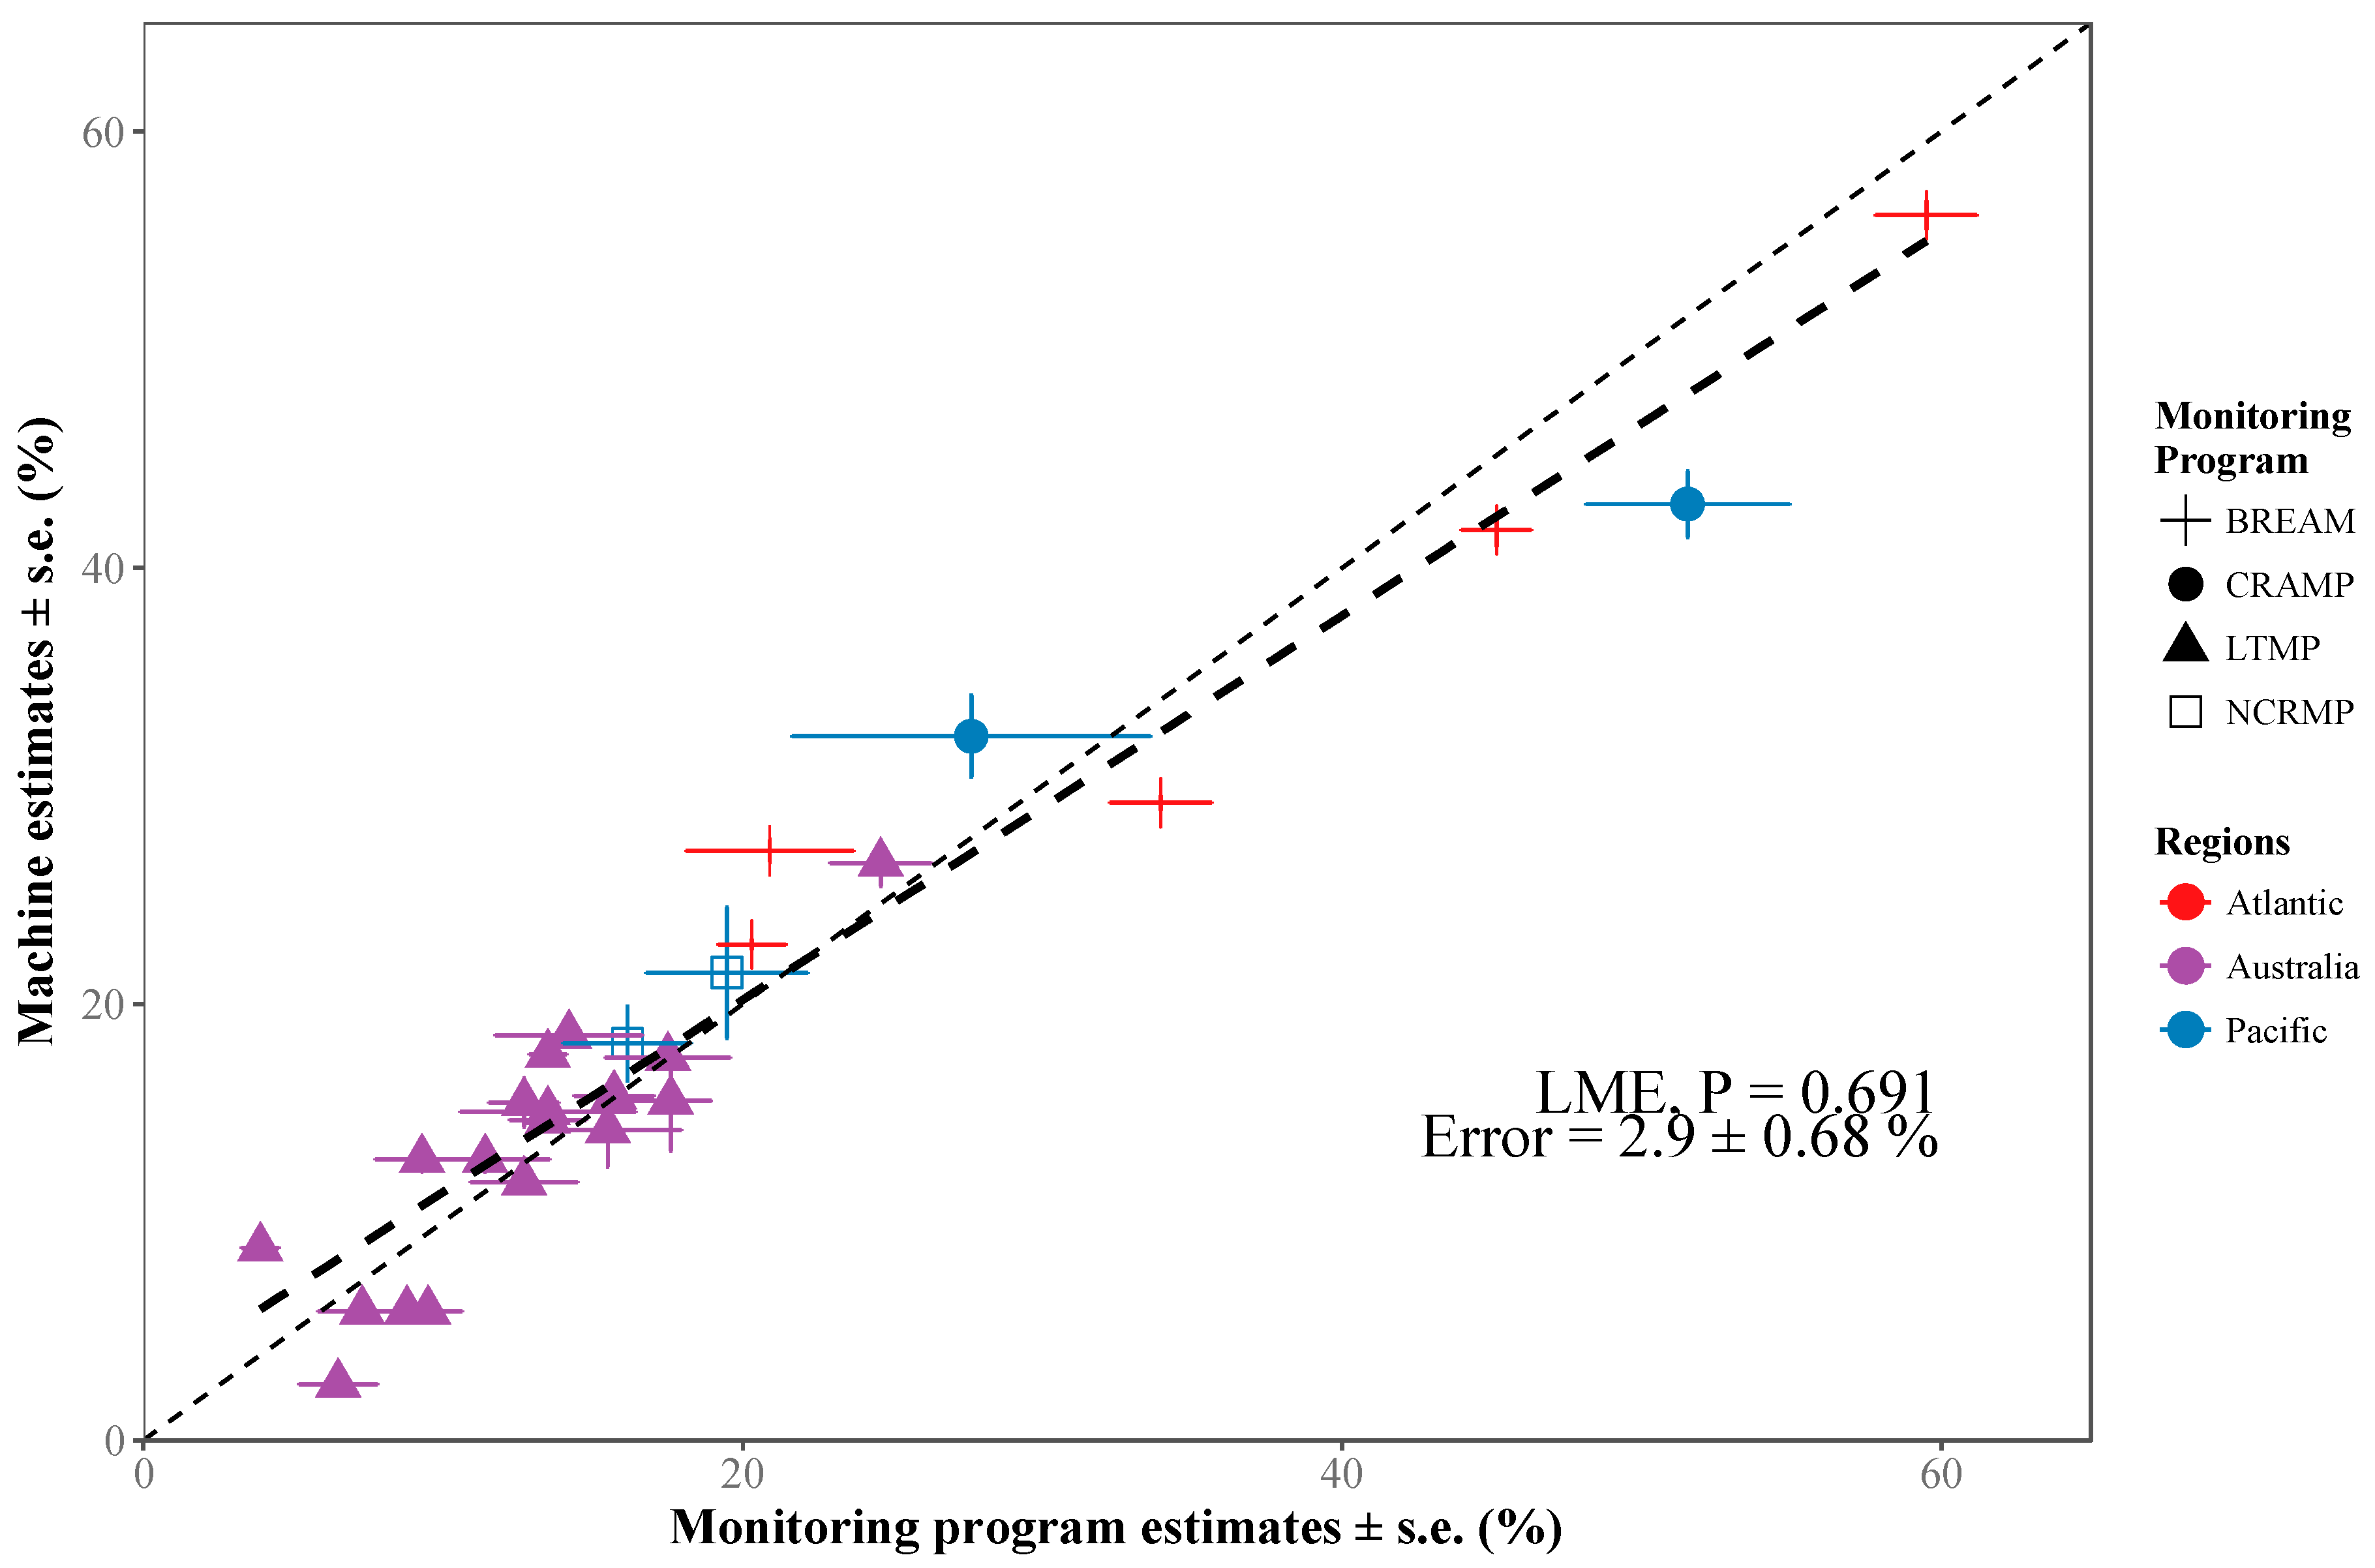
2.3.5. Data Continuity in Coral Reef Monitoring
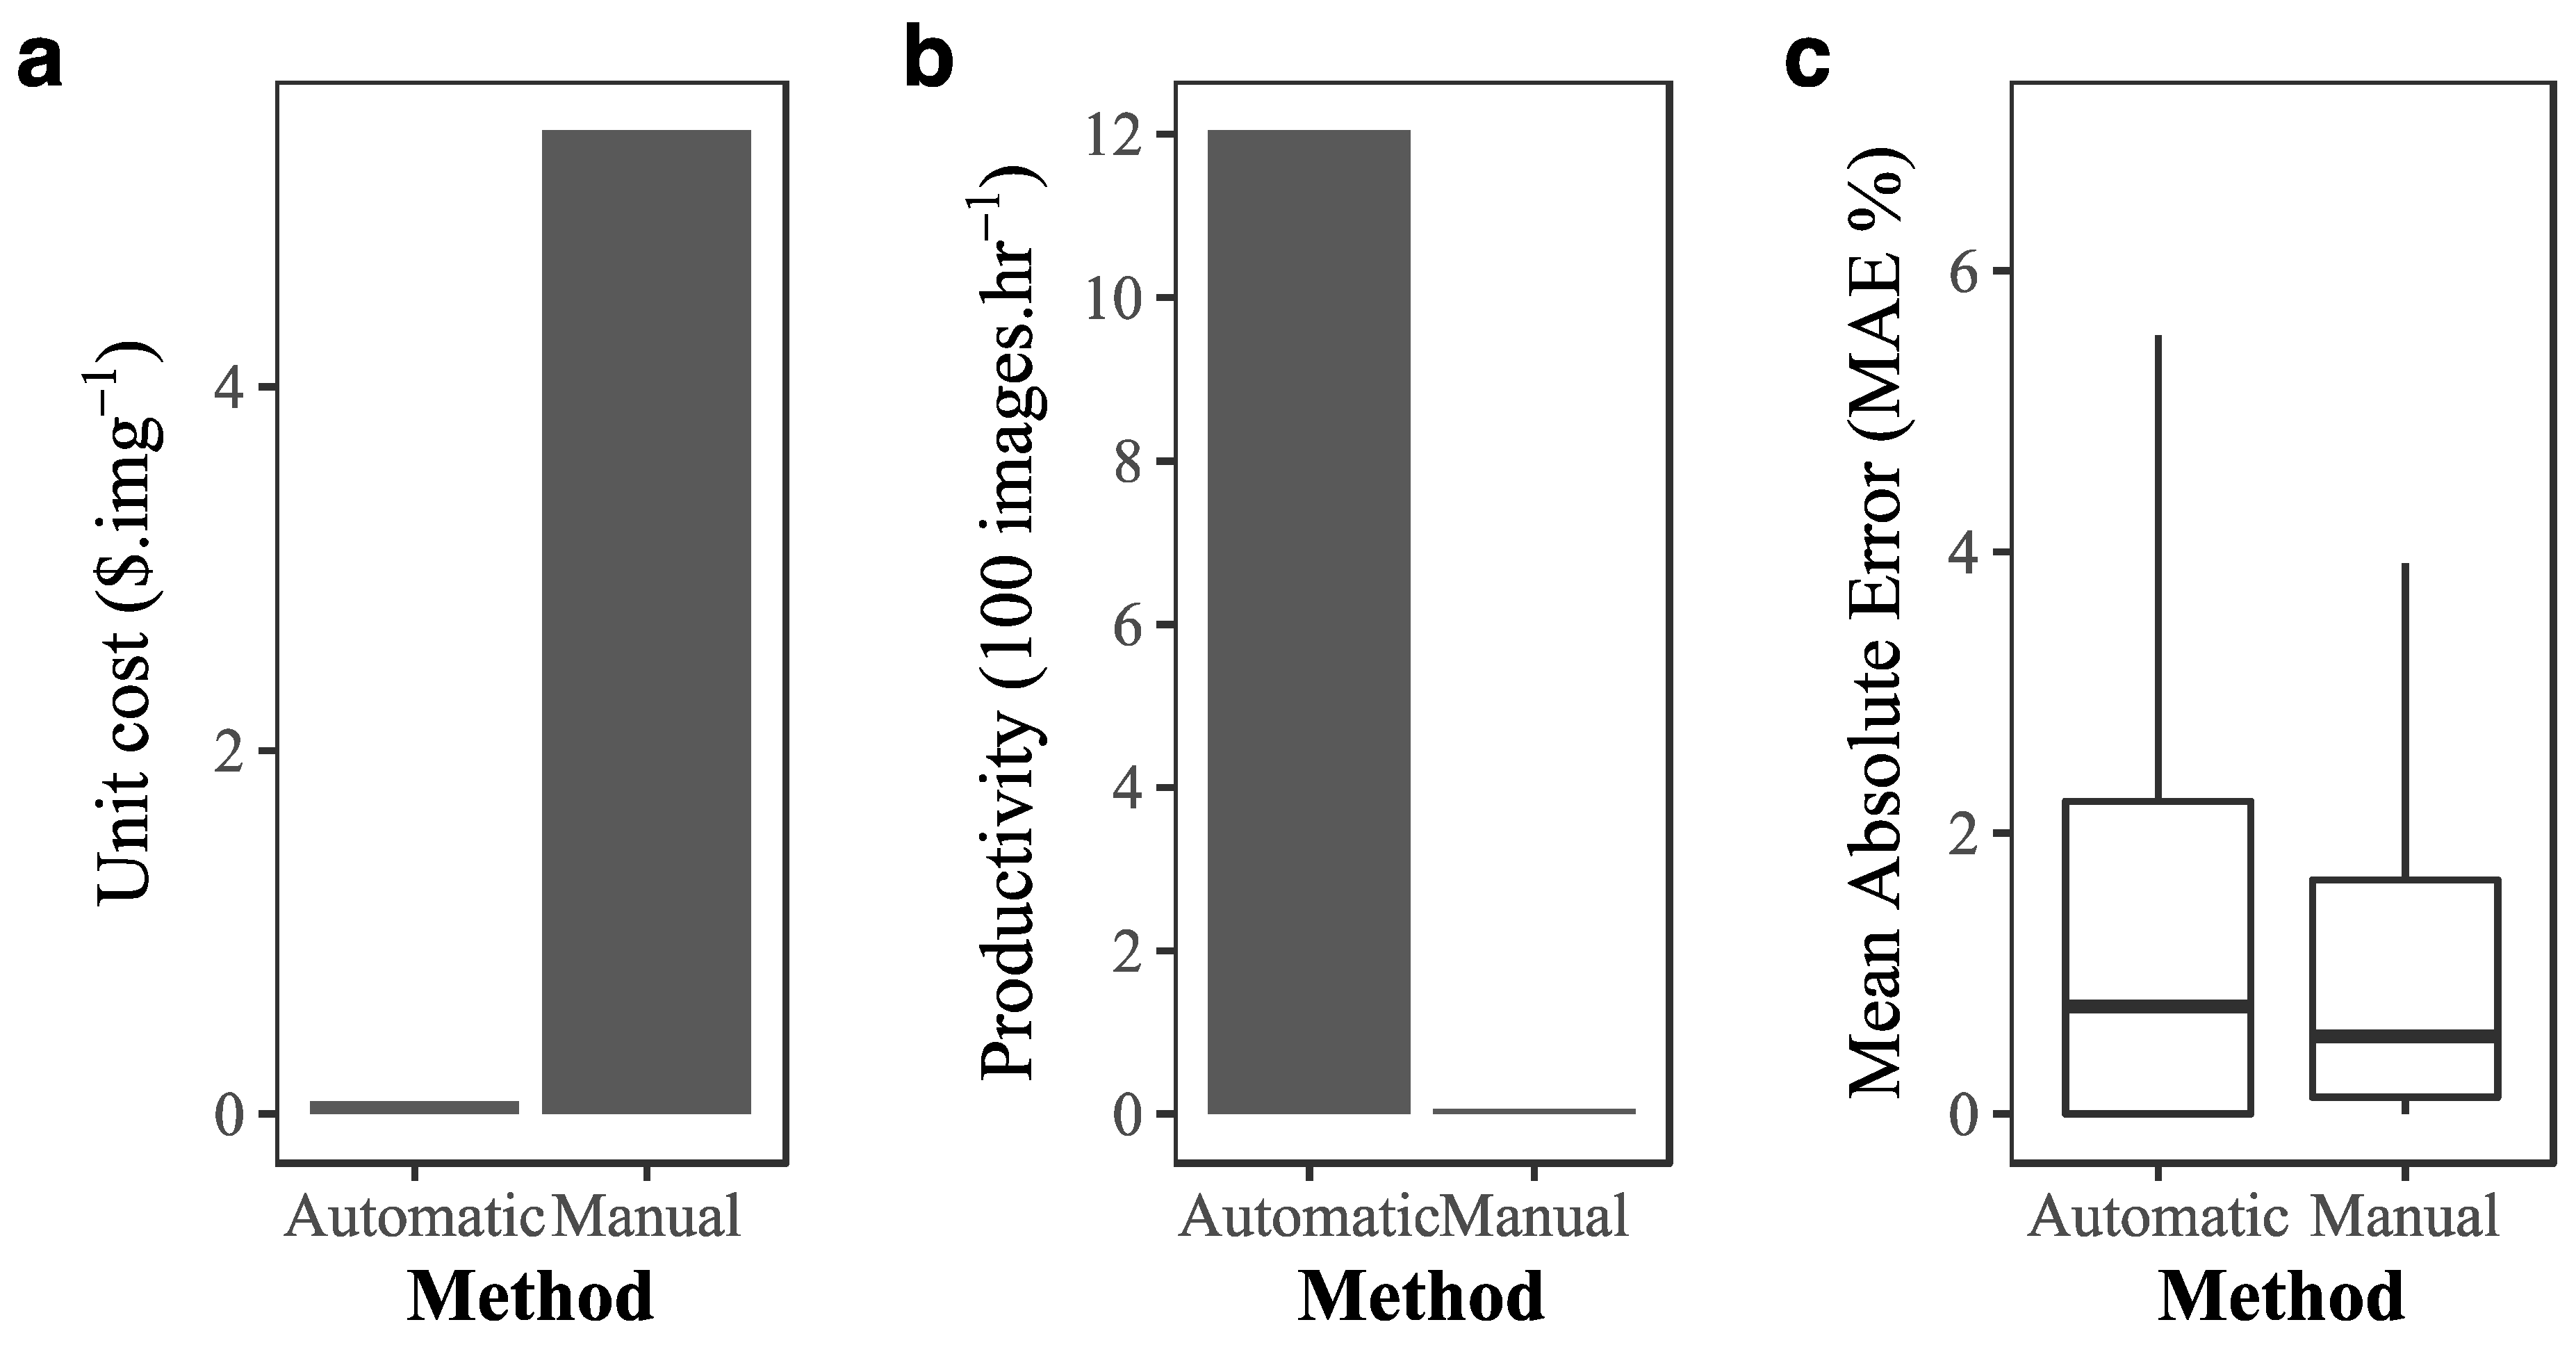
2.4. Cost-Benefit of Implementing Deep Learning in Coral Reef Monitoring
3. Results
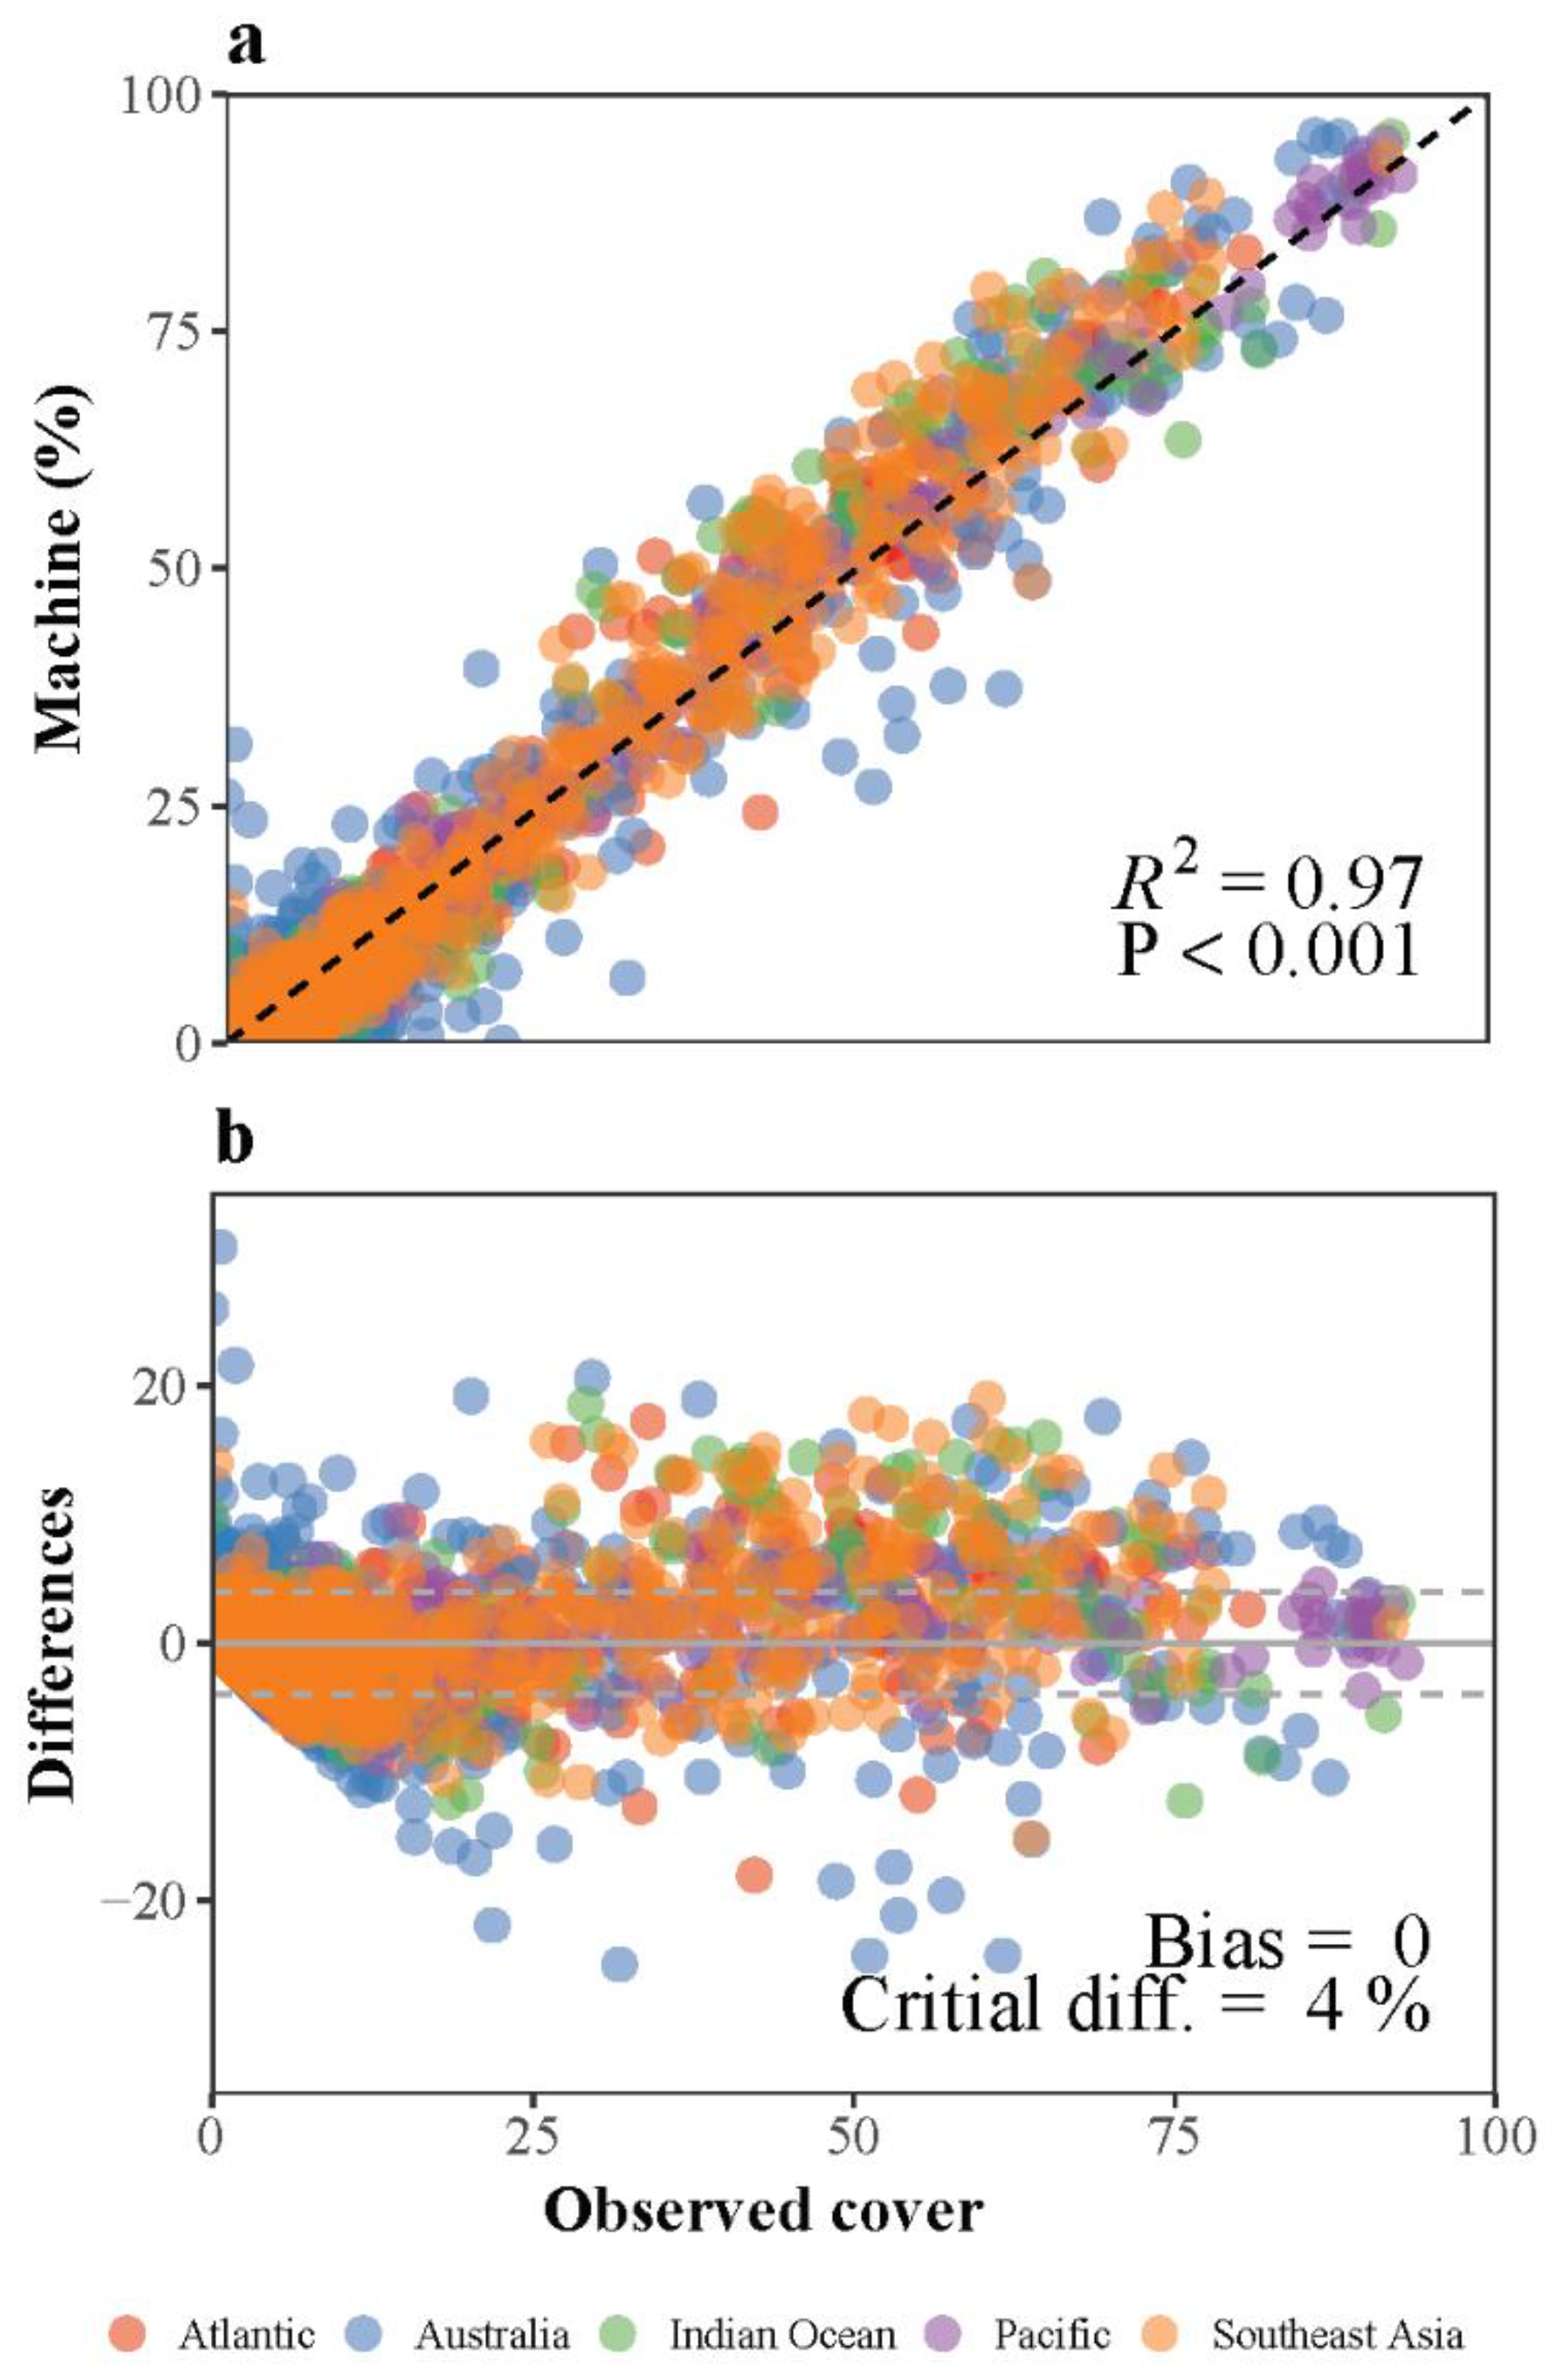
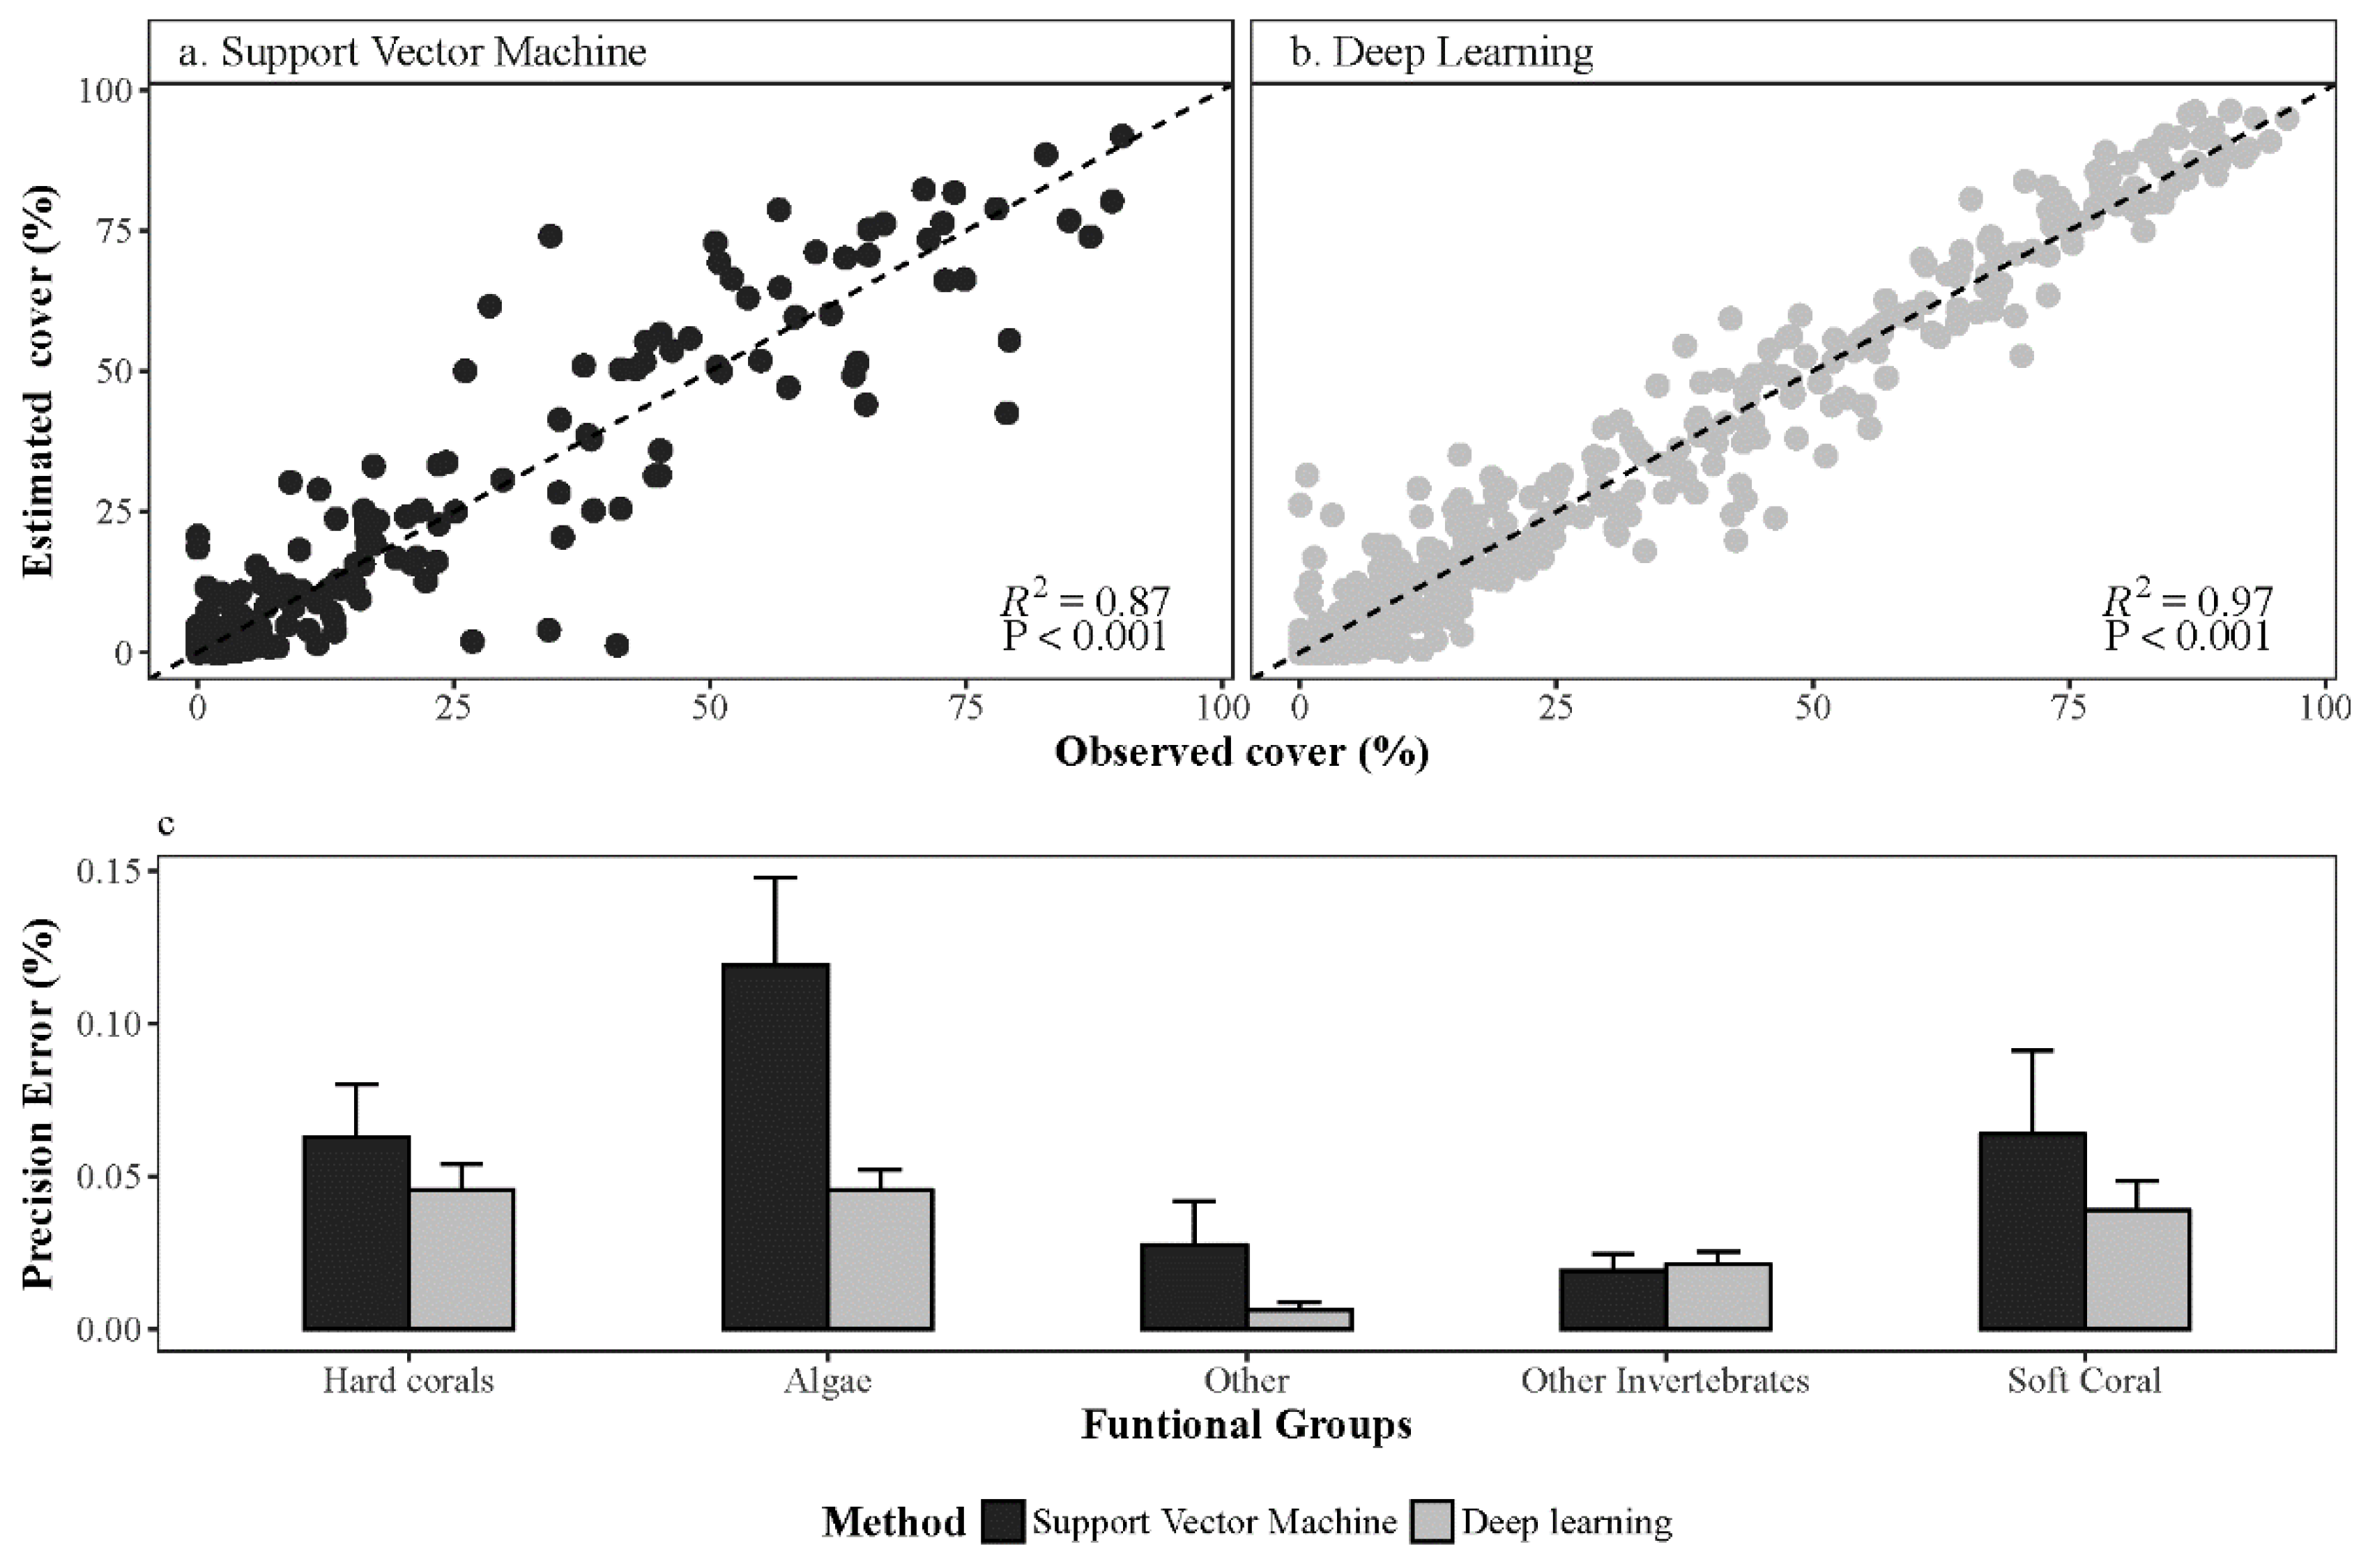
3.1. Deep Learning Performance
3.2. Cost–Benefit Analysis of Implementing Deep Learning
4. Discussion
4.1. Challenges and Further Considerations in Automated Benthic Assessment
4.2. Implications of Automated Benthic Assessments for Coral Reef Monitoring
5. Conclusions
Supplementary Materials
Author Contributions
Funding
Acknowledgments
Conflicts of Interest
Data and Code Source
Appendix A
Overall Performance of Deep Learning Convolution Neural Networks


References
- Yoccoz, N.G.; Nichols, J.D.; Boulinier, T. Monitoring of biological diversity in space and time. Trends Ecol. Evol. 2001, 16, 446–453. [Google Scholar] [CrossRef]
- Lindenmayer, D.B.; Likens, G.E. The science and application of ecological monitoring. Biol. Conserv. 2010, 143, 1317–1328. [Google Scholar] [CrossRef]
- Nichols, J.D.; Williams, B.K. Monitoring for conservation. Trends Ecol. Evol. 2006, 21, 668–673. [Google Scholar] [CrossRef] [PubMed]
- McCook, L.J.; Ayling, T.; Cappo, M.; Choat, J.H.; Evans, R.D.; De Freitas, D.M.; Heupel, M.; Hughes, T.P.; Jones, G.P.; Mapstone, B. Adaptive management of the Great Barrier Reef: A globally significant demonstration of the benefits of networks of marine reserves. Proc. Natl. Acad. Sci. USA 2010, 107, 18278–18285. [Google Scholar] [CrossRef]
- Mills, M.; Pressey, R.L.; Weeks, R.; Foale, S.; Ban, N.C. A mismatch of scales: Challenges in planning for implementation of marine protected areas in the Coral Triangle. Conserv. Lett. 2010, 3, 291–303. [Google Scholar] [CrossRef]
- Hughes, T.P.; Graham, N.A.; Jackson, J.B.; Mumby, P.J.; Steneck, R.S. Rising to the challenge of sustaining coral reef resilience. Trends Ecol. Evol. 2010, 25, 633–642. [Google Scholar] [CrossRef]
- Aronson, R.B.; Edmunds, P.; Precht, W.; Swanson, D.; Levitan, D. Large-scale, long-term monitoring of Caribbean coral reefs: Simple, quick, inexpensive techniques. Atoll Res. Bull. 1994, 421, 1–19. [Google Scholar] [CrossRef]
- Ninio, R.; Delean, J.; Osborne, K.; Sweatman, H. Estimating cover of benthic organisms from underwater video images: Variability associated with multiple observers. Mar. Ecol.-Prog. Ser. 2003, 265, 107–116. [Google Scholar] [CrossRef][Green Version]
- Ninio, R.; Meekan, M. Spatial patterns in benthic communities and the dynamics of a mosaic ecosystem on the Great Barrier Reef, Australia. Coral Reefs 2002, 21, 95–104. [Google Scholar] [CrossRef]
- Russell, S.J.; Norvig, P. Artificial Intelligence: A Modern Approach, 3rd ed.; Prentice Hall: Upper Saddle River, NJ, USA, 2009. [Google Scholar]
- Samuel, A.L. Some Studies in Machine Learning Using the Game of Checkers. IBM J. Res. Dev. 1959, 3, 210–229. [Google Scholar] [CrossRef]
- LeCun, Y.; Bengio, Y.; Hinton, G. Deep learning. Nature 2015, 521, 436–444. [Google Scholar] [CrossRef] [PubMed]
- Krizhevsky, A.; Sutskever, I.; Hinton, G.E. ImageNet classification with deep convolutional neural networks. In Advances in Neural Information Processing Systems, Proceedings of the 25th International Conference on Neural Information Processing Systems, Lake Tahoe, NV, USA, December 3–6, 2012; Curran Associates Inc.: Dutchess County, NY, USA, 2012; pp. 1097–1105. [Google Scholar]
- Hinton, G.; Deng, L.; Yu, D.; Dahl, G.E.; Mohamed, A.-R.; Jaitly, N.; Senior, A.; Vanhoucke, V.; Nguyen, P.; Sainath, T.N. Deep neural networks for acoustic modeling in speech recognition: The shared views of four research groups. IEEE Signal Process. Mag. 2012, 29, 82–97. [Google Scholar] [CrossRef]
- Weinstein, B.G. Scene-specific convolutional neural networks for video-based biodiversity detection. Methods Ecol. Evol. 2018, 9, 1435–1441. [Google Scholar] [CrossRef]
- Zhou, Z.; Ma, L.; Fu, T.; Zhang, G.; Yao, M.; Li, M. Change Detection in Coral Reef Environment Using High-Resolution Images: Comparison of Object-Based and Pixel-Based Paradigms. ISPRS Int. J. Geo-Inf. 2018, 7, 441. [Google Scholar] [CrossRef]
- Beijbom, O.; Edmunds, P.J.; Roelfsema, C.; Smith, J.; Kline, D.I.; Neal, B.P.; Dunlap, M.J.; Moriarty, V.; Fan, T.-Y.; Tan, C.-J. Towards Automated Annotation of Benthic Survey Images: Variability of Human Experts and Operational Modes of Automation. PLoS ONE 2015, 10, e0130312. [Google Scholar] [CrossRef]
- González-Rivero, M.; Beijbom, O.; Rodriguez-Ramirez, A.; Holtrop, T.; González-Marrero, Y.; Ganase, A.; Roelfsema, C.; Phinn, S.; Hoegh-Guldberg, O. Scaling up Ecological Measurements of Coral Reefs Using Semi-Automated Field Image Collection and Analysis. Remote Sens. 2016, 8, 30. [Google Scholar] [CrossRef]
- González-Rivero, M.; Bongaerts, P.; Beijbom, O.; Pizarro, O.; Friedman, A.; Rodriguez-Ramirez, A.; Upcroft, B.; Laffoley, D.; Kline, D.; Bailhache, C.; et al. The Catlin Seaview Survey-kilometre-scale seascape assessment, and monitoring of coral reef ecosystems. Aquat. Conserv. 2014, 24, 184–198. [Google Scholar] [CrossRef]
- González-Rivero, M.; Rodriguez-Ramirez, A.; Beijbom, O.; Dalton, P.; Kennedy, E.V.; Neal, B.P.; Vercelloni, J.; Bongaerts, P.; Ganase, A.; Bryant, D.E. Seaview Survey Photo-quadrat and Image Classification Dataset. 2019. Available online: https://espace.library.uq.edu.au/view/UQ:734799 (accessed on 1 February 2020).
- Simonyan, K.; Zisserman, A. Very deep convolutional networks for large-scale image recognition. arXiv 2014, arXiv:1409.1556. [Google Scholar]
- Deng, J.; Dong, W.; Socher, R.; Li, L.-J.; Li, K.; Fei-Fei, L. ImageNet: A Large-Scale Hierarchical Image Database. In Proceedings of the IEEE Conference on Computer Vision and Pattern Recognition, Miami, FL, USA, 20–25 June 2009; pp. 248–255. [Google Scholar]
- Kohler, K.E.; Gill, S.M. Coral Point Count with Excel extensions (CPCe): A Visual Basic program for the determination of coral and substrate coverage using random point count methodology. Comput. Geosci. 2006, 32, 1259–1269. [Google Scholar] [CrossRef]
- Brown, E.K.; Cox, E.; Jokiel, P.; Rodgers, S.K.U.; Smith, W.R.; Tissot, B.N.; Coles, S.L.; Hultquist, J. Development of benthic sampling methods for the Coral Reef Assessment and Monitoring Program (CRAMP) in Hawai’i. Pac. Sci. 2004, 58, 145–158. [Google Scholar] [CrossRef][Green Version]
- Murdoch, T.J. Status and Trends of Bermuda Reefs and Fishes: 2015 Report Card; Bermuda Zoological Society: Flatts, Bermuda, 2017. [Google Scholar]
- Sweatman, H.H.; Burgess, S.S.; Cheal, A.A.; Coleman, G.G.; Delean, S.S.; Emslie, M.M.; McDonald, A.A.; Miller, I.I.; Osborne, K.K.; Thompson, A.A. Long-Term Monitoring of the Great Barrier Reef; Status Report Number 7; Australian Institute of Marine Science & CRC Reef Research Center: Townsville, Australia, 2005. [Google Scholar]
- R Core Team. R: A Language and Environment for Statistical Computing; R Foundation for Statistical Computing: Vienna, Austria, 2013. [Google Scholar]
- Obura, D.O.; Aeby, G.; Amornthammarong, N.; Appeltans, W.; Bax, N.; Bishop, J.; Brainard, R.E.; Chan, S.; Fletcher, P.; Gordon, T.A.C.; et al. Coral Reef Monitoring, Reef Assessment Technologies, and Ecosystem-Based Management. Front. Mar. Sci. 2019, 6. [Google Scholar] [CrossRef]
- NOAA Coral Program. National Coral Reef Monitoring Plan; NOAA Coral Reef Conservation Program: Silver Spring, MD, USA, 2014.
- Williams, I.D.; Couch, C.S.; Beijbom, O.; Oliver, T.A.; Vargas-Angel, B.; Schumacher, B.D.; Brainard, R.E. Leveraging Automated Image Analysis Tools to Transform Our Capacity to Assess Status and Trends of Coral Reefs. Front. Mar. Sci. 2019, 6, 222. [Google Scholar] [CrossRef]
- Aronson, R.B.; Edmunds, P.; Precht, W.; Swanson, D.; Levitan, D. Large-scale, long-term monitoring of Caribbean coral reefs: Simple, quick, inexpensive techniques. Oceanogr. Lit. Rev. 1995, 9, 777–778. [Google Scholar] [CrossRef]
- Diaz-Pulido, G.; McCook, L. Macroalgae (Seaweeds). In The State of the Great Barrier Reef On-Line; Chin, A., Ed.; Great Barrier Reef Marine Park Authority: Townsville, Australia, 2008. [Google Scholar]
- Todd, P.A. Morphological plasticity in scleractinian corals. Biol. Rev. 2008, 83, 315–337. [Google Scholar] [CrossRef]
- Foster, A.B. Phenotypic plasticity in the reef corals Montastraea annularis (Ellis & Solander) and Siderastrea siderea (Ellis & Solander). J. Exp. Mar. Biol. Ecol. 1979, 39, 25–54. [Google Scholar] [CrossRef]
- Zoph, B.; Vasudevan, V.; Shlens, J.; Le, Q.V. Learning transferable architectures for scalable image recognition. arXiv 2017, arXiv:1707.07012. [Google Scholar]
- Chennu, A.; Färber, P.; De’ath, G.; de Beer, D.; Fabricius, K.E. A diver-operated hyperspectral imaging and topographic surveying system for automated mapping of benthic habitats. Sci. Rep. 2017, 7, 7122. [Google Scholar] [CrossRef]
- Beijbom, O.; Treibitz, T.; Kline, D.I.; Eyal, G.; Khen, A.; Neal, B.; Loya, Y.; Mitchell, B.G.; Kriegman, D. Improving automated annotation of benthic survey images using wide-band fluorescence. Sci. Rep. 2016, 6, 23166. [Google Scholar] [CrossRef]
- Zhou, B.; Lapedriza, A.; Khosla, A.; Oliva, A.; Torralba, A. Places: A 10 Million Image Database for Scene Recognition. IEEE Trans. Pattern Anal. Mach. Intell. 2018, 40, 1452–1464. [Google Scholar] [CrossRef]
- Rassadin, A.; Savchenko, A. Deep neural networks performance optimization in image recognition. In Proceedings of the 3rd International Conference on Information Technologies and Nanotechnologies (ITNT), Samara, Russia, 25–27 April 2017. [Google Scholar]
- Erickson, B.J.; Korfiatis, P.; Akkus, Z.; Kline, T.; Philbrick, K. Toolkits and Libraries for Deep Learning. J. Digit. Imaging 2017, 30, 400–405. [Google Scholar] [CrossRef]
- Peterson, E.E.; Santos-Fernández, E.; Chen, C.; Clifford, S.; Vercelloni, J.; Pearse, A.; Brown, R.; Christensen, B.; James, A.; Anthony, K. Monitoring through many eyes: Integrating scientific and crowd-sourced datasets to improve monitoring of the Great Barrier Reef. arXiv 2018, arXiv:1808.05298. [Google Scholar]
- Vaughan, H.; Whitelaw, G.; Craig, B.; Stewart, C. Linking Ecological Science to Decision-Making: Delivering Environmental Monitoring Information as Societal Feedback. Environ. Monit. Assess. 2003, 88, 399–408. [Google Scholar] [CrossRef] [PubMed]
- Jackson, J.; Donovan, M.; Cramer, K.; Lam, V. Status and Trends of Caribbean Coral Reefs: 1970–2012; Global Coral Reef Monitoring Network: IUCN, Gland, Switzerland, 2014. [Google Scholar]
- Wilkinson, C. Status of Coral Reefs of the World: 2008; Global Coral Reef Monitoring Network and Reef and Rainforest Research Centre: Townsville, Australia, 2008. [Google Scholar]
- Zhu, X.X.; Tuia, D.; Mou, L.; Xia, G.-S.; Zhang, L.; Xu, F.; Fraundorfer, F. Deep learning in remote sensing: A comprehensive review and list of resources. IEEE Geosci. Remote Sens. Mag. 2017, 5, 8–36. [Google Scholar] [CrossRef]
- Dell, A.I.; Bender, J.A.; Branson, K.; Couzin, I.D.; de Polavieja, G.G.; Noldus, L.P.; Pérez-Escudero, A.; Perona, P.; Straw, A.D.; Wikelski, M. Automated image-based tracking and its application in ecology. Trends Ecol. Evol. 2014, 29, 417–428. [Google Scholar] [CrossRef] [PubMed]
- Madin, E.M.P.; Darling, E.S.; Hardt, M.J. Emerging Technologies and Coral Reef Conservation: Opportunities, Challenges, and Moving Forward. Front. Mar. Sci. 2019, 6. [Google Scholar] [CrossRef]
- Krouwer, J.S. Why Bland–Altman plots should use X, not (Y+X)/2 when X is a reference method. Stat. Med. 2008, 27, 778–780. [Google Scholar] [CrossRef]
- Giavarina, D. Understanding Bland Altman analysis. Biochem. Med. 2015, 25, 141–151. [Google Scholar] [CrossRef]


| Region | Country | Training Images | Test Images | Test Transects | Labels | Taxonomic Complexity |
|---|---|---|---|---|---|---|
| Western Atlantic Ocean | Anguilla | 449 | 50 | 5 | 38 | Moderate to Low |
| Aruba | 30 | 3 | ||||
| The Bahamas | 150 | 12 | ||||
| Belize | 115 | 13 | ||||
| Bermuda | 60 | 8 | ||||
| Bonaire | 115 | 8 | ||||
| Curacao | 90 | 7 | ||||
| Guadeloupe | 75 | 6 | ||||
| Mexico | 115 | 11 | ||||
| Saint Martin | 25 | 2 | ||||
| Saint Vincent and the Grenadines | 60 | 7 | ||||
| Saint Eustatius | 25 | 1 | ||||
| Turks and Caicos Islands | 50 | 4 | ||||
| Eastern Australia | Australia | 1234 | 1426 | 130 | 22 | High |
| Central Indian Ocean | The Chagos Archipelago | 359 | 331 | 29 | 33 | High |
| Maldives | 1125 | 540 | 52 | |||
| Southeast Asia | Taiwan | 350 | 300 | 27 | 35 | High |
| Timor-Leste | 547 | 330 | 29 | |||
| Indonesia | 752 | 600 | 50 | |||
| The Philippines | 300 | 24 | ||||
| The Solomon Islands | 439 | 300 | 29 | |||
| Central Pacific Ocean | United States | 501 | 660 | 60 | 21 | Moderate to Low |
| Total | 22 | 5756 | 5747 | 517 | 64 |
© 2020 by the authors. Licensee MDPI, Basel, Switzerland. This article is an open access article distributed under the terms and conditions of the Creative Commons Attribution (CC BY) license (http://creativecommons.org/licenses/by/4.0/).
Share and Cite
González-Rivero, M.; Beijbom, O.; Rodriguez-Ramirez, A.; Bryant, D.E.P.; Ganase, A.; Gonzalez-Marrero, Y.; Herrera-Reveles, A.; Kennedy, E.V.; Kim, C.J.S.; Lopez-Marcano, S.; et al. Monitoring of Coral Reefs Using Artificial Intelligence: A Feasible and Cost-Effective Approach. Remote Sens. 2020, 12, 489. https://doi.org/10.3390/rs12030489
González-Rivero M, Beijbom O, Rodriguez-Ramirez A, Bryant DEP, Ganase A, Gonzalez-Marrero Y, Herrera-Reveles A, Kennedy EV, Kim CJS, Lopez-Marcano S, et al. Monitoring of Coral Reefs Using Artificial Intelligence: A Feasible and Cost-Effective Approach. Remote Sensing. 2020; 12(3):489. https://doi.org/10.3390/rs12030489
Chicago/Turabian StyleGonzález-Rivero, Manuel, Oscar Beijbom, Alberto Rodriguez-Ramirez, Dominic E. P. Bryant, Anjani Ganase, Yeray Gonzalez-Marrero, Ana Herrera-Reveles, Emma V. Kennedy, Catherine J. S. Kim, Sebastian Lopez-Marcano, and et al. 2020. "Monitoring of Coral Reefs Using Artificial Intelligence: A Feasible and Cost-Effective Approach" Remote Sensing 12, no. 3: 489. https://doi.org/10.3390/rs12030489
APA StyleGonzález-Rivero, M., Beijbom, O., Rodriguez-Ramirez, A., Bryant, D. E. P., Ganase, A., Gonzalez-Marrero, Y., Herrera-Reveles, A., Kennedy, E. V., Kim, C. J. S., Lopez-Marcano, S., Markey, K., Neal, B. P., Osborne, K., Reyes-Nivia, C., Sampayo, E. M., Stolberg, K., Taylor, A., Vercelloni, J., Wyatt, M., & Hoegh-Guldberg, O. (2020). Monitoring of Coral Reefs Using Artificial Intelligence: A Feasible and Cost-Effective Approach. Remote Sensing, 12(3), 489. https://doi.org/10.3390/rs12030489