Article

Satellite-Based Operational Real-Time Drought Monitoring in the Transboundary Lancang–Mekong River Basin

1
China Institute of Water Resources and Hydropower Research, Beijing 100038, China
2
School of Geography and the Environment, University of Oxford, Oxford OX1 3QY, UK
3
Key Laboratory of Water Cycle and Related Land Surface Processes, Institute of Geographic Sciences and Natural Resources Research, Chinese Academy of Sciences, Beijing 100101, China
4
Water in the West, Woods Institute for the Environment, Stanford University, Stanford, CA 94305, USA
5
Institute of Surface-Earth System Science, Tianjin University, Tianjin 300072, China
*
Author to whom correspondence should be addressed.
Remote Sens. 2020, 12(3), 376; https://doi.org/10.3390/rs12030376
Submission received: 17 December 2019 / Revised: 20 January 2020 / Accepted: 21 January 2020 / Published: 24 January 2020
(This article belongs to the Special Issue Observations, Modeling, and Impacts of Climate Extremes)

Abstract

:
Existing gauging networks are sparse and not readily available in real-time over the transboundary Lancang–Mekong River (LMR) basin, making it difficult to accurately identify drought. In this study, we aimed to build an operational real-time Lancang–Mekong drought monitor (LMDM), through combining satellite real-time data and the Variable Infiltration Capacity (VIC) hydrological model at a 0.25° spatial resolution. Toward this, three VIC runs were conducted: (1) a 60-year (1951–2010) historical simulation driven by Princeton’s global meteorological forcing (PGF) for yielding ‘normal’ conditions (PGF-VIC), wherein the VIC was calibrated with 20-year observed streamflow at six hydrological stations; (2) a short-period (2011–2014) simulation to bridge the gap between the historical and the real-time modeling; (3) the real-time (2015–present) simulation driven by bias-corrected satellite data, wherein the real-time soil moisture (SM) estimate was expressed as percentile (relative to the ‘normal’) for drought monitoring. Results show that VIC can successfully reproduce the observed hydrographs, with the Nash–Sutcliffe efficiency exceeding 0.70 and the relative bias mostly within 15%. Assessment on the performance of LMDM shows that the real-time SM estimates bear good spatial similarity to the reference, with the correlation coefficient beyond 0.80 across >70% of the domain. In terms of drought monitoring, the LMDM can reasonably reproduce the two recorded droughts, implying extreme droughts covering the Lower LMR during 2004/05 and widespread severe 2009/10 drought across the upper domain. The percentage drought area implied by the LMDM and the reference is close, corresponding to 66% and 60%, 43% and 40%, and 44% and 36% for each typical drought month. Since January 2015, the LMDM was running in an operational mode, from which the 2016 unprecedented drought was successfully identified in Mekong Delta. This study highlights the LMDM’s capability for reliable real-time drought monitoring, which can serve as a valuable drought early warning prototype for other data-poor regions.

Graphical Abstract

1. Introduction

Drought is nothing more than a water deficit, but it can have tremendous social and economic impacts [1,2] because of its relations to agriculture [3,4], water supply [5], and the environment [6,7]. Globally, the reported annual economic loss from droughts is up to tens of billions, and the total number of people affected by droughts has exceeded one billion in the past two decades [8]. Particularly with the warming climate, regional droughts are expected to become more frequent and more severe [9,10,11,12,13,14], which will lead to more people being exposed to drought risk [15,16,17]. One possible way to mitigate drought impact is to properly recognize drought development and make prompt and comprehensive risk preparation and response [18]. Unlike other natural disasters, drought evolves slowly over a prolonged time period without early warning, until it becomes severe and begins to impact a region across a large spatial extent [19,20,21]. Therefore, accurately monitoring drought onset and tracking its propagation in real-time are critical for drought planning and mitigation.
Traditional drought monitoring relies on direct measurements of hydro-meteorological fields [22,23] from in situ gauging stations [24]. However, the sparse observation networks, together with scale inconsistency, inhibit the continuous drought diagnosis [25]. Alternatively, satellite remote sensing provides a promising way to measure different components of the terrestrial water cycle at high spatial resolution and in near real time [26,27]. To date, a substantial body of satellite-based products have been developed for key water-cycle components [28,29,30,31], and many efforts have been made to apply these products for regional drought monitoring [32,33,34]. Albeit with great potential to retrieve the specific variable, satellite remote sensing alone can hardly provide hydrologically consistent observations due to the retrieval errors [35,36], making it difficult to depict drought from a holistic view [37]. In contrast, land-surface hydrological modeling driven by high-quality meteorological inputs is able to provide closed (i.e., hydrologically consistent) and reliable estimates of water budgets via the built-in balance schemes [38]. To date, combining satellite real-time (RT) data and land surface hydrological modeling has been a routine for large-scale drought monitoring [39,40]. For instance, Princeton University made an early attempt to operate a regional drought monitoring over the conterminous United States (CONUS), through integrating bias-corrected satellite RT precipitation, with a land-surface model [18]. This operational framework was also applied to support regional water-resources management and food security in Sub-Saharan Africa [41]. In addition to these approaches, several recent studies attempted to integrate the available multiple satellite- and model-based precipitation and soil moisture (SM) data for operational global drought monitoring and prediction system [42,43,44], like Global Integrated Drought Monitoring and Prediction System (GIDMaPS) [45,46].
The Lancang–Mekong River (referred to as LMR) is an important transboundary river across six countries in Southeast Asia, where a large portion is rain-fed agriculture, and most people are engaged in agricultural work [47]. In this region, drought is not destructive as directly as a flood (or hurricane), but accounts for more than 80% of the total affected population [48]. Particularly over recent decades, a series of devastating droughts (e.g., during 2004/05, 2009/10, and 2015/16) hit LMR in the dry season (November–April) [49,50], posing a huge threat to regional water and food security [51]. When it comes to drought analysis in LMR, early studies were primarily conducted to characterize drought patterns [52,53,54] or assess drought impacts on various sectors [51,55]. Coinciding with the changing climate, the focus was changed to assess how global warming will affect regional droughts (in terms of frequency, severity, and duration) [56]. Recently, the complex issue on water–food–energy nexus in this transboundary basin also attracts much attention [57,58]. In contrast, current attempts toward drought monitoring in LMR are still in their infancy. Although there have been few efforts devoted to exploring the applicability of satellite-based land-surface products (i.e., MODIS NDVI and LST) for agricultural drought monitoring [59] or enabling regional hydrologic extreme assessment system through model couple [60], the operational drought-monitoring practices in LMR are still mostly dependent on the low-density hydrological gauging networks archived in the Mekong River Commission (MRC). Albeit the Global Drought Monitor [39,45] may cover the domain of LMR, these products aim to depict drought from a global perspective, at a relatively coarse (e.g., 0.5° × 0.5°) spatial resolution. More importantly, detailed local in situ information is usually not included in the global products (e.g., lack of model calibration), making it difficult to provide accurate hydrological estimates at basin and regional scales.
To fill this gap, this study attempted to create a high-resolution real-time drought monitor over the LMR basin, through combining satellite near-real-time meteorological data and accurate hydrological modeling. This attempt can improve the outdated drought-monitoring schemes in LMR and provides a prototype for other drought-prone regions with sparse gauging networks.

2. Materials and Methods
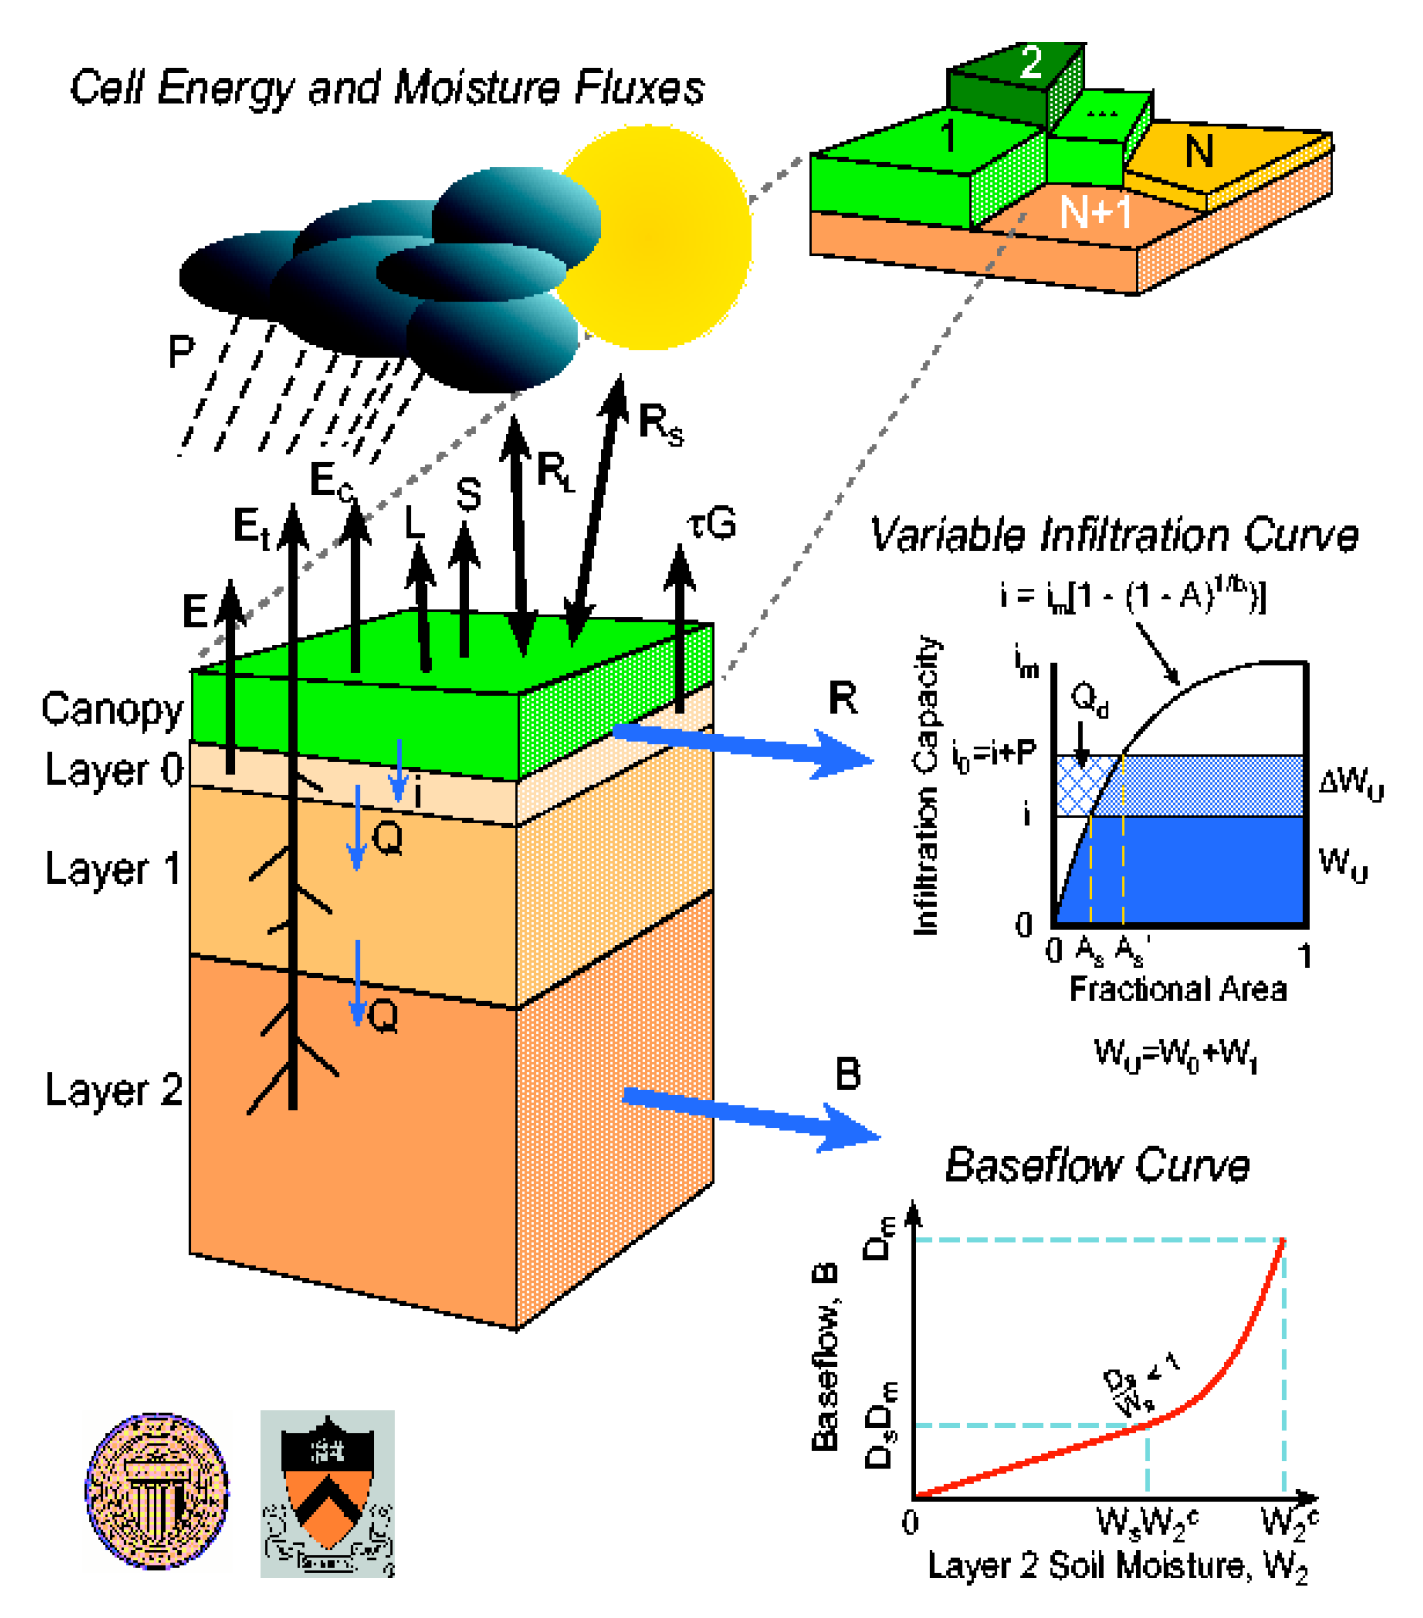
2.1. VIC Model

In this study, the Variable Infiltration Capacity (VIC) hydrological model (version 4.1.2.a) [61] is used. VIC is a macroscale, semi-distributed land-surface hydrological model, characterized by sub-grid heterogeneity (e.g., local water holding capacity) in representing the saturation and infiltration-excess runoff generation processes at each grid cell (see Figure 1). One prominent feature of VIC is that both water and surface energy budgets are resolved at each simulation time step. Moreover, VIC includes a nonlinear ARNO model [62] to depict the recession process of baseflow. To date, the VIC model has been widely applied to reconstruct water budgets over major global river basins [63].

2.2. Data

2.2.1. Meteorological Forcings

In this study, a set of 60-year (1951–2010) global gridded meteorological forcing data, Princeton Global Forcing (hereafter referred to as PGF), at a 0.25° spatial resolution and with a 3-hourly time step, was used to calibrate the VIC model and reconstruct long-term climatology. The PGF data were constructed by combining a suite of most recent global observation-based datasets (CRU data) with the state-of-the-art reanalysis data [64], and was successfully employed to drive VIC for closing terrestrial water budget over major global river basins [65].
To enable real-time VIC modeling, the latest version of TRMM Multisatellite Precipitation Analysis (TMPA) real-time (RT) product (3B42RTv7) was utilized. Note that, although several satellite-based precipitation research products like CHIRPS [66] have been made available after controlling data quality against in situ rain-gauge measurements, these products are barely accessible in real time due to the long time lag (several days or months) used for quality control. In contrast, the TMPA-RT data can provide quasi-global (50°S–50°N), 0.25°, 3-hourly near real-time precipitation measurements (only with 9-hour time lag) since March 2000 [29]. It has been broadly applied in near-real-time drought detection [39,41] and flood prediction [67,68]. In addition, the National Centers for Environmental Prediction-National Center for Atmospheric Research (NCEP-NCAR) reanalysis, with data record available from January 1948 to the near-real-time moment (about 3-day time lag), was employed as the near real-time source of the other three climatic drivers (i.e., daily maximum temperature (Tmax), daily minimum temperature (Tmin), and daily wind speed (W)).

2.2.2. Land-Surface Characteristics

Here, the land-cover characterization was specified based on the University of Maryland global land-cover classification [69]. From this global product, we identified the land-cover types and the areal proportion occupied by each type within the 0.25° grid cell, as described in our previous study [38]. The additional parameters for each vegetation type, like leaf area index (LAI), rooting depth, roughness length and displacement height, architectural resistance, and minimum stomatal resistance, were specified and assembled from the available global source [70]. Note that the land-cover types and parameters do not change during model simulation in this study.
The soil texture types used here were directly specified from the 5-arc-min Food and Agriculture Organization of the United Nations dataset [71]. For each soil-texture class, the soil physical parameters (e.g., field capacity, wilting point, and saturated hydraulic conductivity) were identified based on our previous studies [38] and kept constant during model implementation. The remaining six numerical parameters (i.e., the infiltration parameter, the second and third soil layer depths, and the three baseflow parameters) were determined through calibrating the simulated streamflow with the observed record at the in situ hydrological gauging stations [72]. The topography information at each 0.25° grid cell was resampled from HYDRO1k global 1 km digital elevation model (DEM) data.

2.2.3. Model calibration and validation

To enable model calibration, the VIC model was coupled with a separated routing model [73] to access the routed runoff (i.e., streamflow) at the specific location. The LMR’s digital river network information (e.g., flow direction) required by the routing model was directly taken from a set of 0.25° (commensurate with VIC resolution) global river network product. This global database was produced by upscaling the combined HydroSHEDS and HYDRO1k global fine-scale hydrography inputs through hierarchical dominant-river-tracing (DRT) algorithm [74]. In this study, we selected six in situ hydrological gauging stations with long-term daily observed streamflow records (see details in Table 1 and Figure 2) to calibrate the six unspecific model parameters (as mentioned in Section 2.2.2).
Figure 3 illustrates the details on model calibration and validation. Specifically, a 20-year calibration period was specified in the historical period, varying from 1981 to 2000, for the Changdu station (in Upper LMR) and from 1985 to 2004 for the remaining five stations (Chiangkhan, NongKhai, Mudahan, Parkse, and StungTreng) in the lower portion. During the calibration period, the PGF data was used to drive VIC for an off-line simulation, and an optimization algorithm (multi-objective complex evolution of the University of Arizona; MOCOM-UA) [75] was employed to find the optimal parameter set by comparing the simulated flow with the observed one. Beyond the calibration period, an additional 10-year period (2005-2014) was specified to validate model robustness at the lower five gauging stations, where observed flow record is greater than 20-year. Given that the limited PGF data record before 2010, the bias-corrected TMPA-RT data were used as model driver, to enable the validation simulation. Here, we introduced two quantitative metrics, i.e., Nash–Sutcliffe efficiency, Ef and relative error, Er, to evaluate the model performance, either during the calibration or the validation period. Following the guidelines from [76], the performance of VIC model was considered as satisfactory when the Nash–Sutcliffe efficiency, Ef, was greater than 0.50 and the magnitude of relative error, Er, was less than 25%.

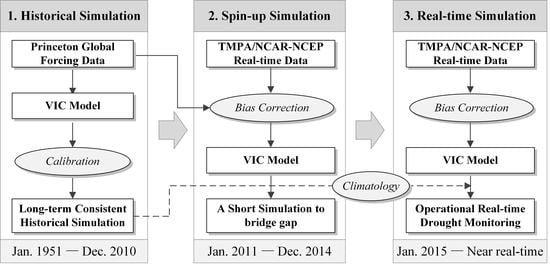
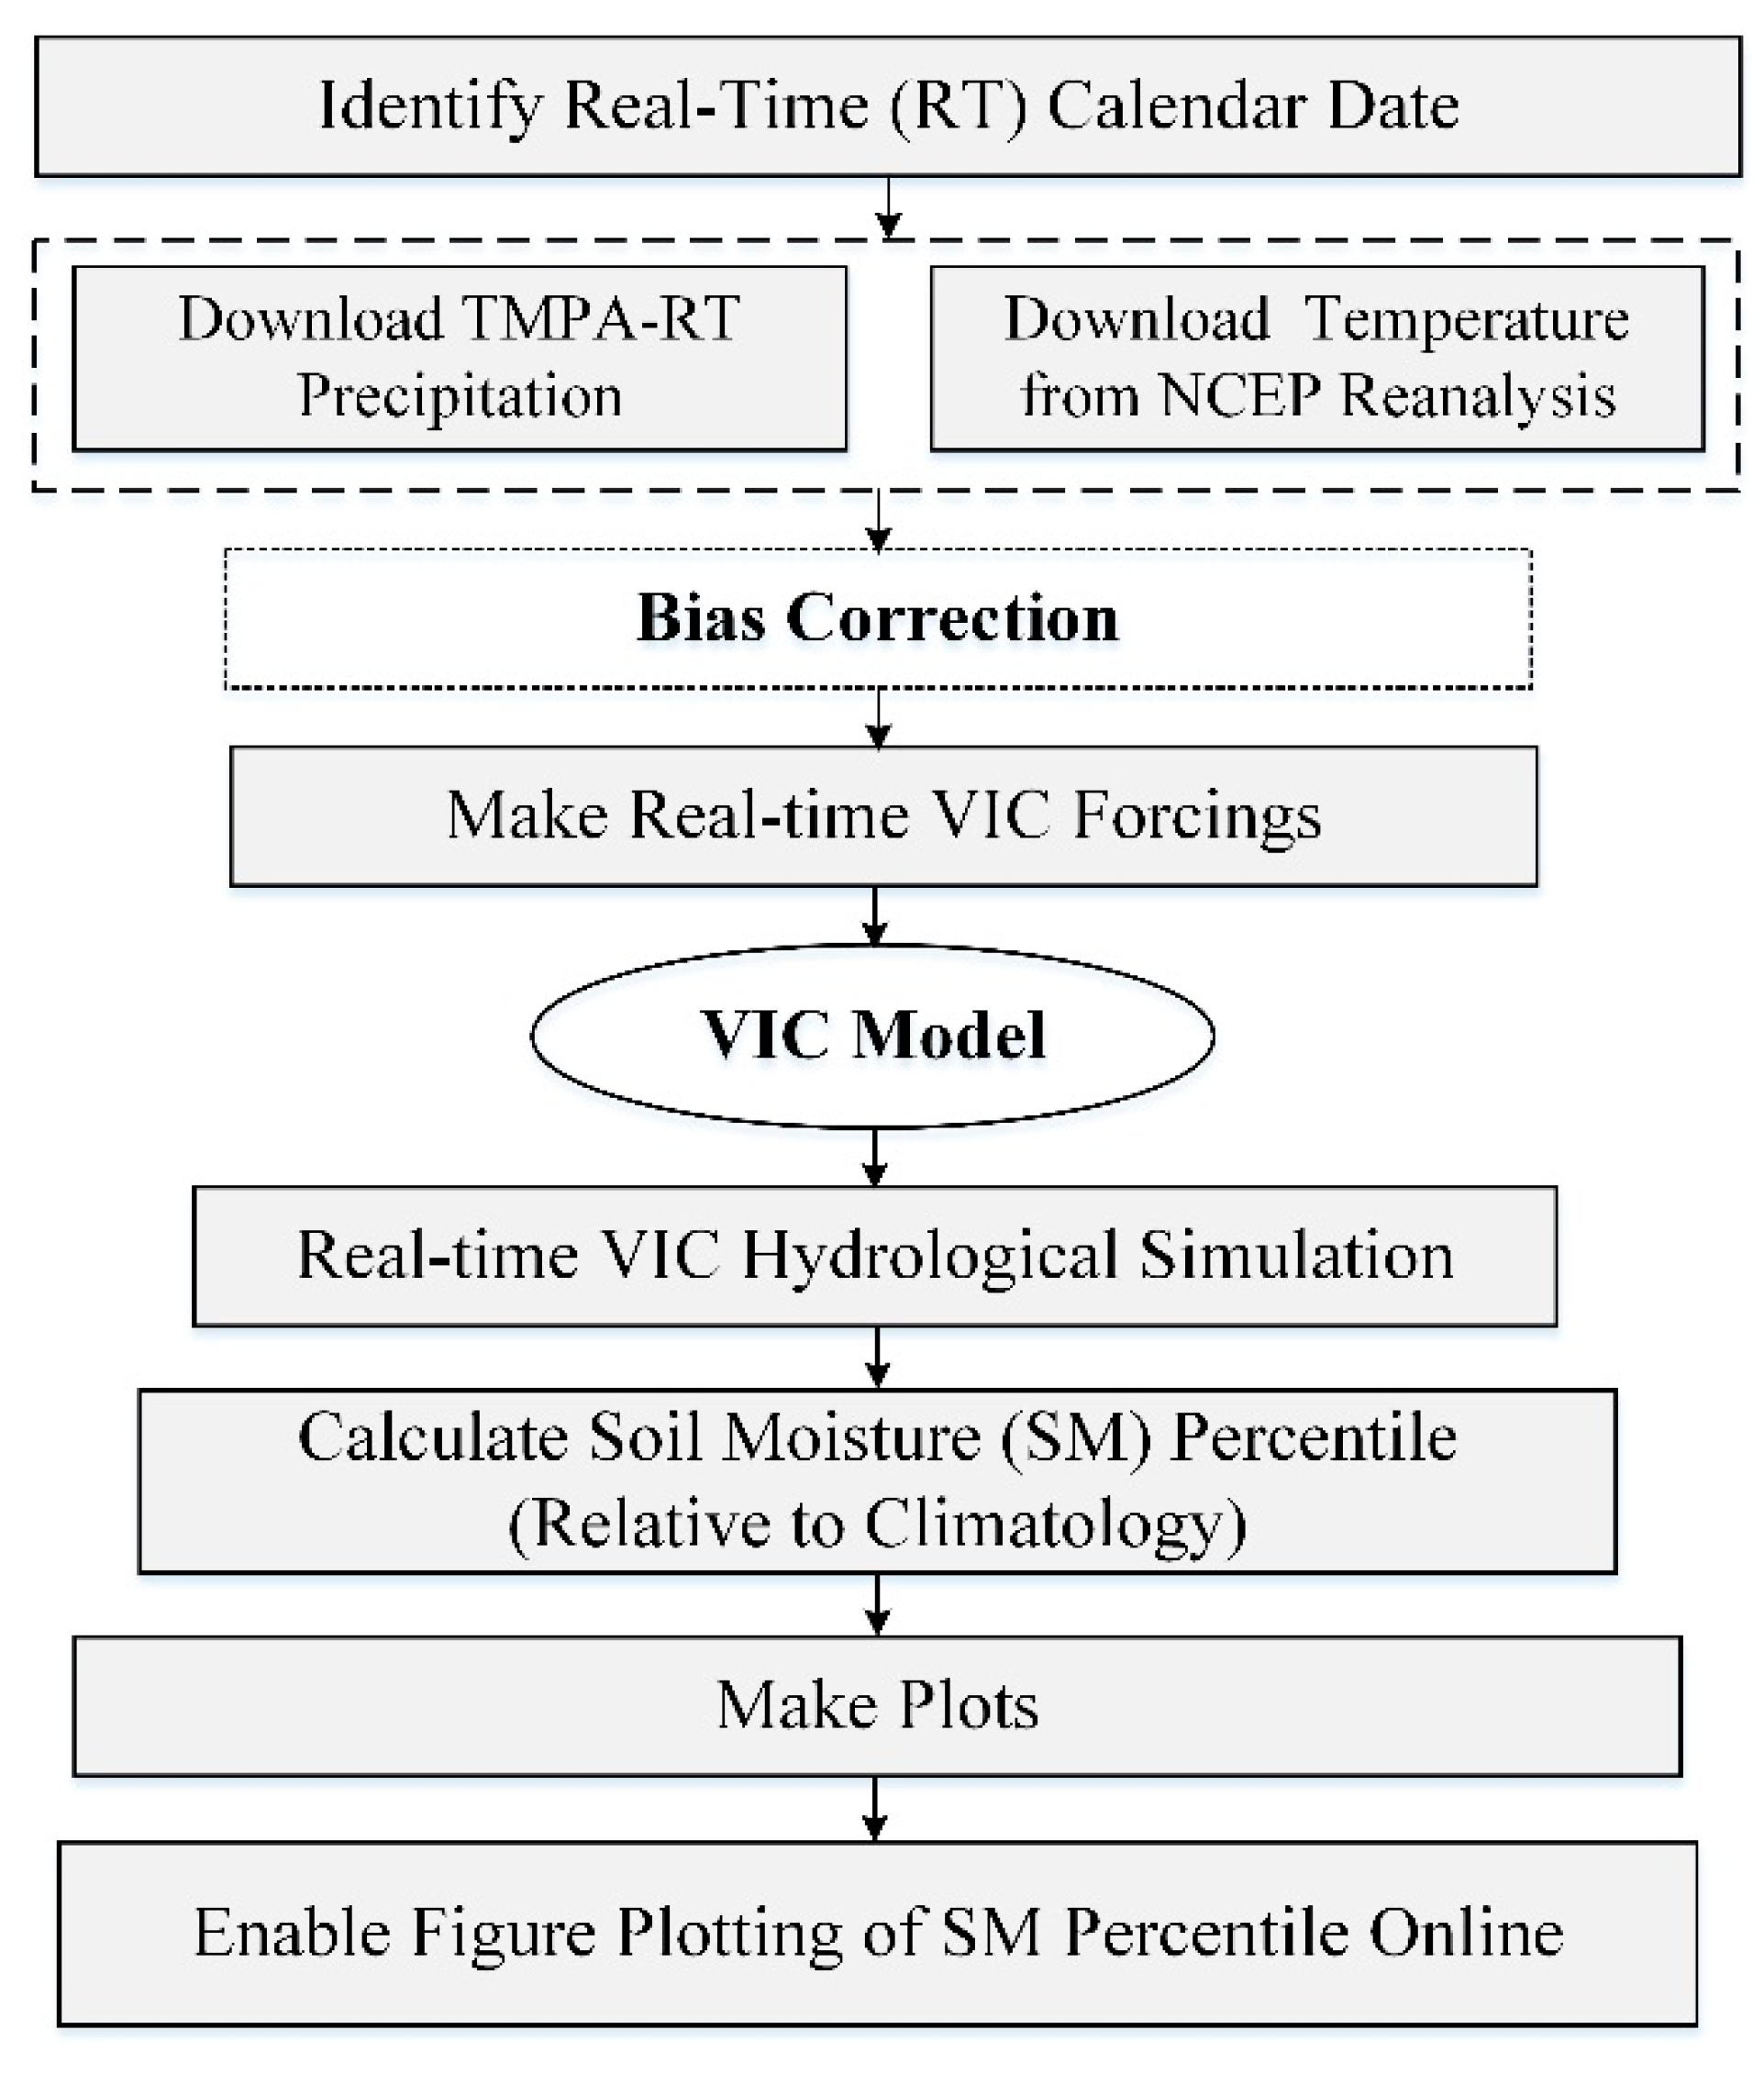
2.3. Operational Lancang–Mekong Drought Monitor (LMDM)

Given that drought is expressed as to what degree current conditions depart from the ‘normal’, the configuration of LMDM is designed with three types of simulations, using the calibrated VIC model at a 0.25° spatial resolution (see Figure 4):
(1) A daily retrospective simulation from 1951 to 2010, driven by daily gridded meteorological forcings from the PGF data (hereafter referred as to PGF-VIC). This 60-year historical simulation yields the climatology or ‘normal’, which is used to derive percentiles of real-time soil moisture (SM).
(2) A short simulation from the end of retrospective simulation to the start date of monitoring (i.e., from January 2011 to December 2014). This round of VIC simulation is used to bridge the gap of retrospective and near-real-time simulations.
(3) The near-real-time simulation since January 2015, driven by the RT forcing data (i.e., TMPA-RT and NCEP-NCAR reanalysis). In this study, the real-time climatic drivers for VIC runs, including TMPA-RT precipitation (P) and three other reanalysis fields (Tmax, Tmin, and W), were all bias-corrected against the gauge-based PGF data, using an equal-quantile mapping (QM) approach [77], in order to remove their systematic errors (inconsistency). To realize operational drought monitoring, real-time SM estimates driven by the corrected RT forcings were firstly aggregated to the monthly scale and then converted to percentiles after directly comparing with the ‘normal’ condition (i.e., the 60-year climatology produced by the first simulation) [78]. Based on the estimated SM percentile, four drought categories are identified by the LMDM, following the U.S. Drought Monitor (USDM) [79]: moderate drought (10–20%), severe drought (5–10%), extreme drought (2–5%), and exceptional drought (<2%).
In this study, we selected two reported severe droughts in the 2004/05 [80] and the 2009/10 dry seasons [49], to assess LMDM’s reliability in drought monitoring and tracking. The corresponding SM droughts identified from the 60-year climatology were taken as the surrogated observational reference.

3. Results

3.1. Historical Reconstruction

3.1.1. Model Calibration

Figure 5 compares the VIC-simulated and gauge observed monthly hydrographs at six hydrological gauging stations during the 20-year calibration period. Results show that the Nash–Sutcliffe efficiency (Ef) of monthly streamflow between simulation and observation is greater than 0.70 at all stations, suggesting that the calibrated VIC model can well capture the monthly variation and seasonal cycle of the observed streamflow. The relative error (Er) of 20-year monthly mean fluxes at almost all stations (except for Changdu station in the Upper LMR) is less than 15%, suggesting that the magnitude of VIC estimates after calibration is close to the observations. The Changdu station with large Er value is located in the mountainous upper basin, where the meteorological forcing data might be more uncertain due to limited ground stations. In addition, the imperfect frozen algorithm in the VIC model [81] may be another source of the streamflow underestimation in cold winter over high-elevation areas (the case for Changdu station) [82]. Here, we also compared the performance of VIC calibration with previous studies of similar nature [83,84] that focused on LMR’s hydrological process modeling with a distributed model driven by satellite/gauging data. Note that the model calibration in [83] is based on the daily discharge records over a four-year (1998–2001) period. Despite the varying calibration period, the comparison shows that the performance of VIC modeling in our study is comparable with that from these similar studies, with the Nash–Sutcliffe efficiency, Ef, greater than 0.60 and the relative error, Er, less than 10% at the majority of the selected in situ gauging stations. These analyses suggest that the performance of VIC model is satisfactory in reproducing the observed hydrographs over the LMR basin, in terms of both interannual variations and long-term means.

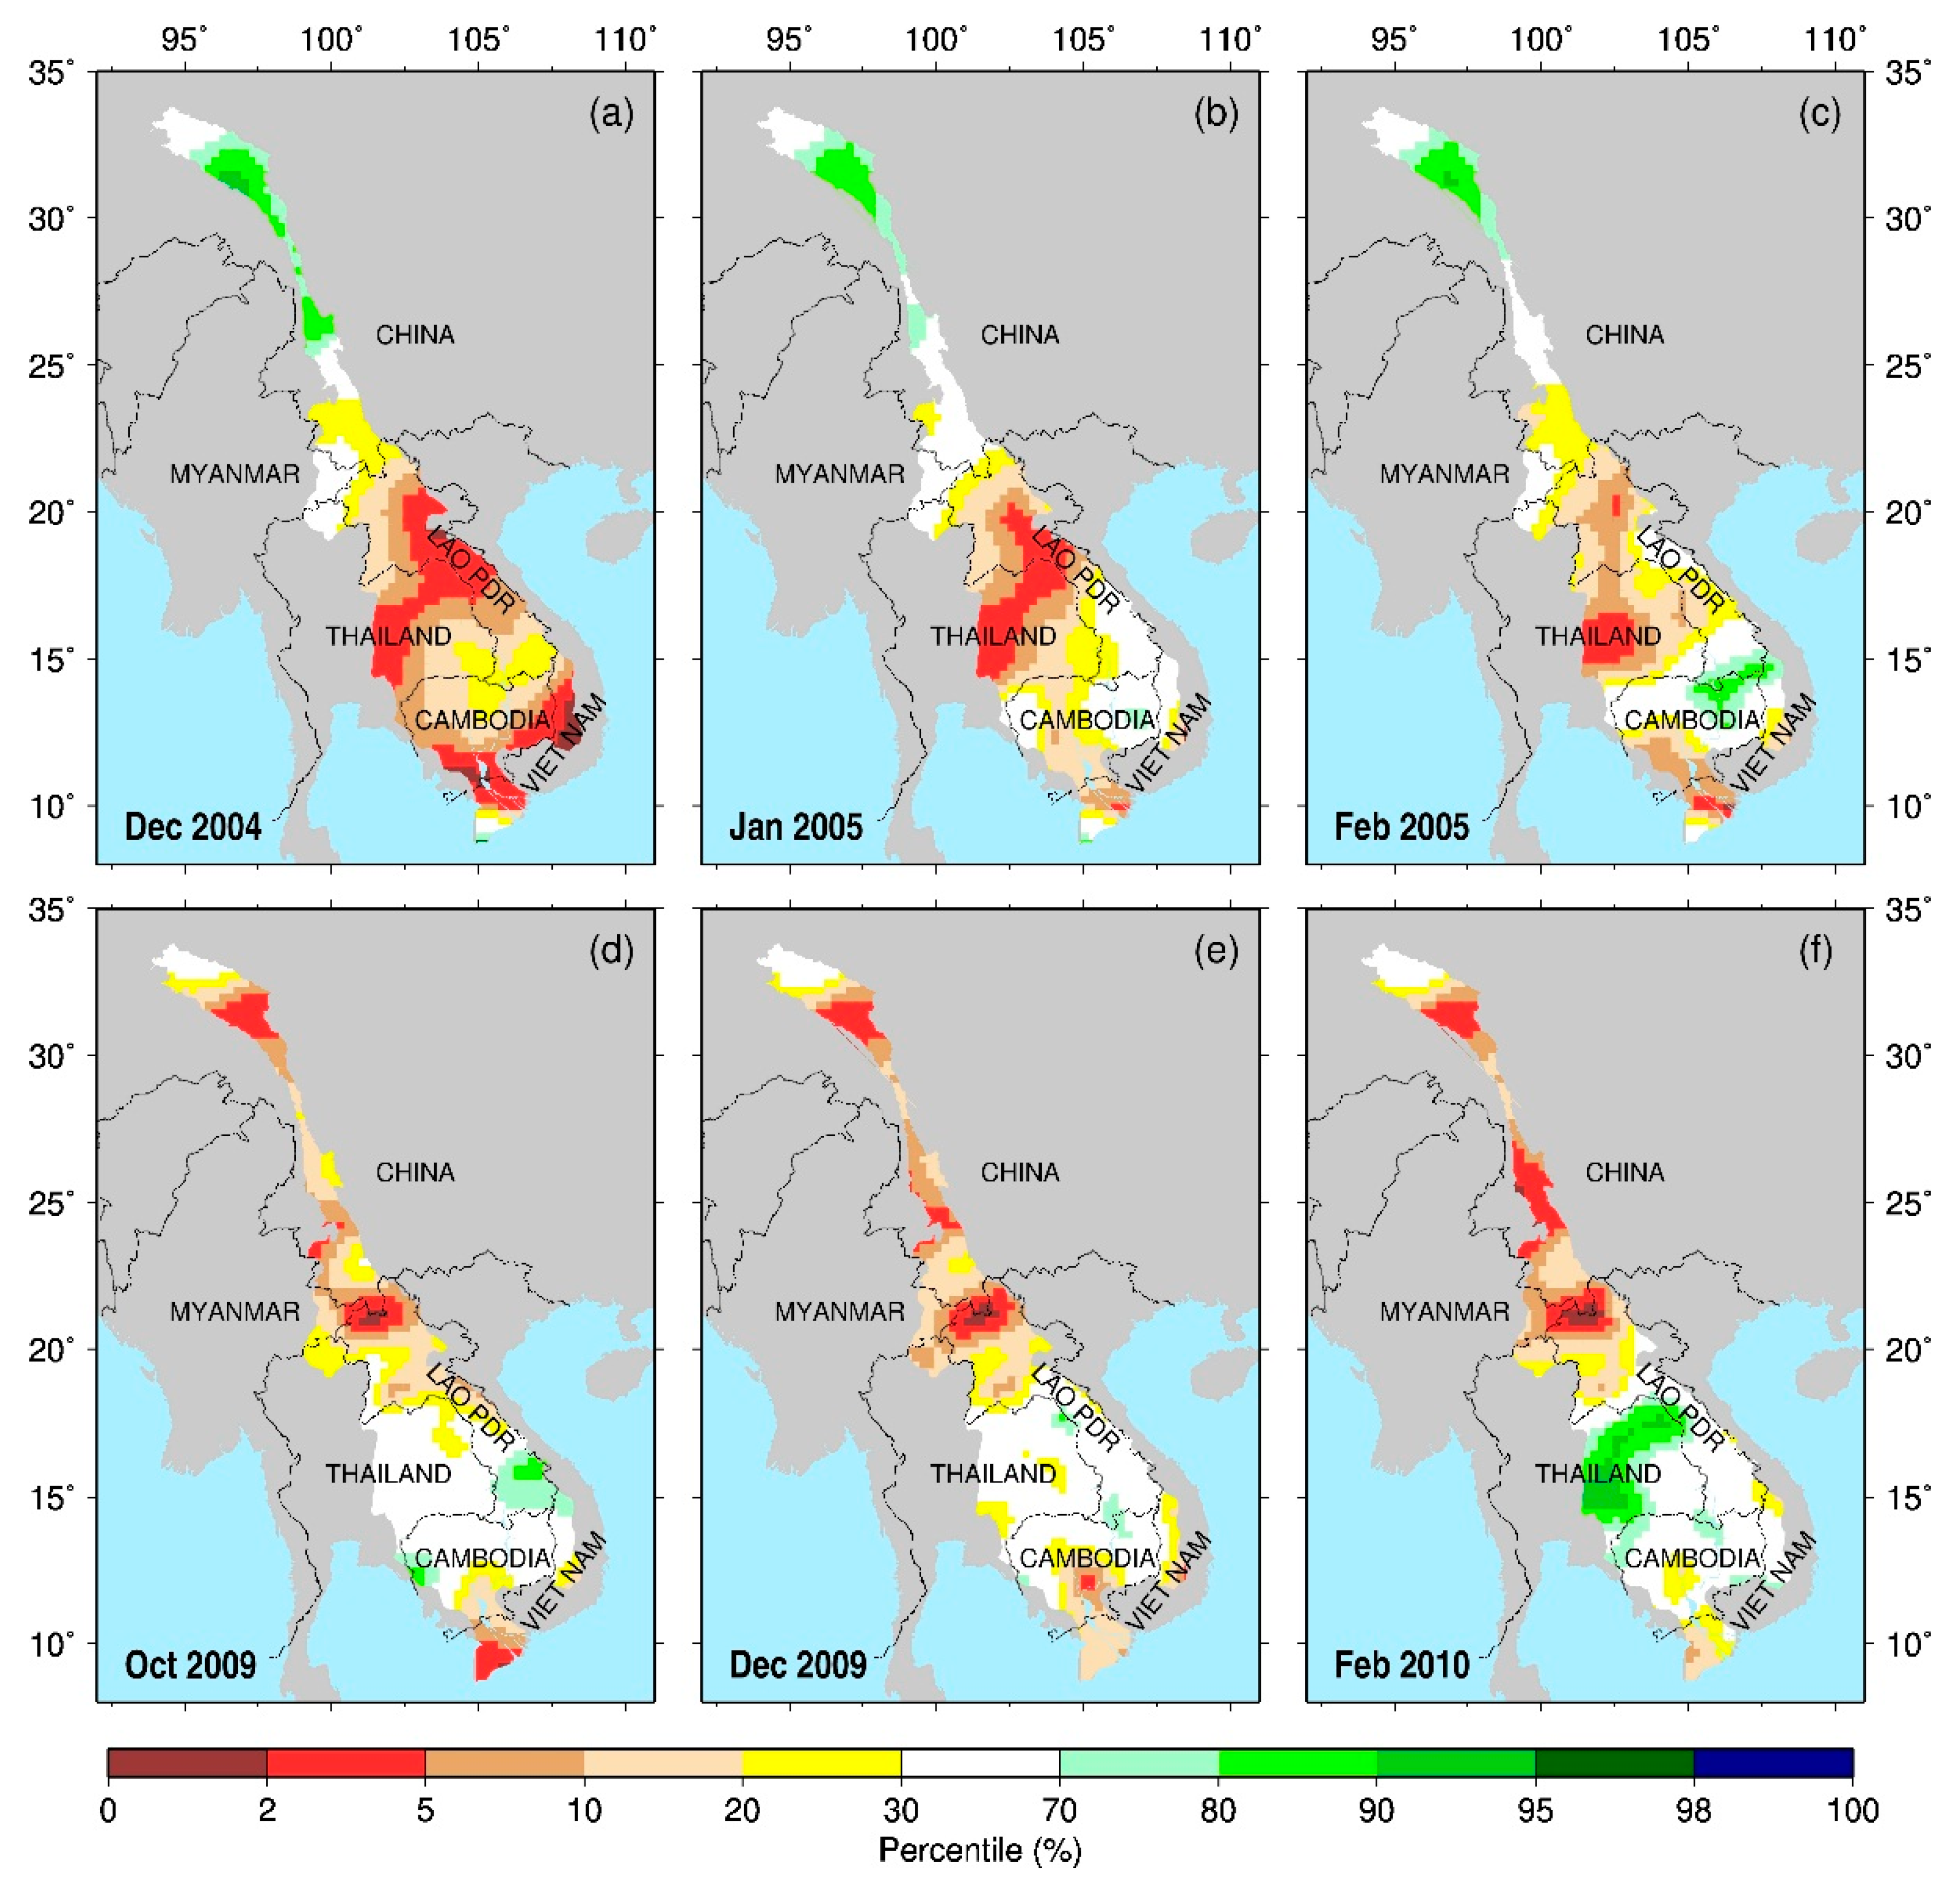
3.1.2. Reproduction of Major Historical Droughts

Figure 6 presents the monthly drought conditions estimated from the 60-year climatology reconstructed by PGF-driven VIC simulation (i.e., PGF-VIC) during the reported 2004/05 and 2009/10 drought periods. To assess its reliability in reproducing major historical droughts, the drought information identified based on the standardized soil moisture index (SSI) was extracted from the coarse-scale (2/3° × 1/2°) Global Integrated Drought Monitoring and Prediction System (GIDMaPS; http://drought.eng.uci.edu/) for comparison. Note that, although the quantitative drought information (e.g., drought area) is not available in GIDMaPS, this global product can provide the drought pattern, and its temporal evolution month-by-month, for the period of 1980–2016. Comparison shows that the drought characteristics revealed by PGF-VIC and GIDMaPS is broadly in consistent manner. During the 2004/05 dry season, they both indicate that the extreme drought swept across almost the whole lower region (about 60% of the total LMR basin) in December 2004, primarily lying in the Northeastern Thailand, Lao PDR, and Southern Cambodia. In the following two months (January and February 2005), the extreme drought still dominated over large portions of Northeastern Thailand and Lao PDR. However, the drought pattern was found with inconsistency over parts of Cambodia, where the global system indicated persistent exceptional drought, while our result implied slight recovery of drought. As for the 2009/10 drought, the PGF-VIC implied two hotspot regions with SM percentile less than 10%, shown as much of upper portion and lower Mekong Delta suffering from severe drought at the end of the wet season. When it comes to the dry season, drought in the Mekong Delta gradually evolves from severe to moderate, while the upper severe drought expands to even larger regions than before. These drought implications agree well with the GIDMaPS global product. In addition to the global product, one similar regional study aided by MODIS NDVI and LST data [59] was also used to assess PGF-VIC’s reliability. The comparison shows that the PGF-VIC and MODIS-based monitor, albeit with disparity in the Mekong Delta, can both reasonably identify the large areas of severe drought in Thailand and Cambodia during the 2004/05 dry season (see Figure 9 in reference [59]). These analyses above suggest that the PGF-VIC (i.e., historical component of LMDM) is able to reasonably reproduce the historical droughts in the LMR basin, either in terms of spatial pattern or with respect to temporal evolution.

3.2. Real-Time Drought Monitoring

3.2.1. Bias-Correction for Real-Time Meteorological Forcings

Figure 7a compares the cumulative density functions (CDFs) of daily precipitation intensity (P) derived from the raw (uncorrected) (green dash line) and corrected TMPA-RT data (red dash line) against the gauge-based PGF data (black solid line) during the 10-year (2001–2010) overlapping period. Obviously, the CDF of TMPA-RT data after bias-correction shows closer agreement to the precipitation distribution from PGF than before. Compared to PGF, the raw TMPA-RT tends to imply 11% fewer days of light precipitation (<10 mm/d), but suggests a moderate overestimation (~8%) of heavy-precipitation days (>50 mm/d). After bias-correction, the difference in the number of light- and heavy-precipitation days reduces to 4% and 2%, respectively. Likewise, the reanalysis data show an evident frequency overestimation of daily temperature [see Tmax in Figure 7b and Tmin in Figure 7c], with about 30% more days with Tmax below 30 °C/d and nearly 10% more days with Tmin below 20 °C/d. Nevertheless, such overestimations can be significantly removed with bias-correction. The comparison above suggests that the RT data, either from TMPA-RT or NCEP-NCAR reanalysis, are more consistent with the gauge-based PGF dataset than the raw one through the bias-correction scheme.

3.2.2. Validation of Hydrological Simulation

Figure 8 compares the VIC-simulated monthly streamflow forced by raw (rawRT-VIC; blue line) and bias-corrected (correctRT-VIC; red line) RT forcings against in situ observations (black line) during a 10-year (2005–2014) validation period (independent from the calibration period) at five gauging stations. For the simulation with bias-corrected RT forcings, the metrics Ef and Er are both within the satisfactory catalog for all gauging stations, with the value of Ef greater than 0.70, and the magnitude of Er less than 20%. This suggests that the VIC model constrained by bias-corrected RT data can reproduce the observed monthly hydrographs beyond the calibration period well. In contrast, the negative Nash–Sutcliffe efficiency (Ef < 0) and the large relative error (Er > 70%) are found at almost all gauging stations for the rawRT-VIC, suggesting its poor performance to capture the variability of observed streamflow. Overall, the performance of correctRT-VIC is satisfactory and much superior to the rawRT-VIC, as indicated by the Nash–Sutcliffe efficiency (Ef) much closer to 1 and the relative error (Er) closer to zero at all gauging stations.
In addition to streamflow, the SM estimates derived from correctRT-VIC were also assessed by comparing with the reference PGF-VIC during the overlapping period (2001–2010) (See Figure 9). To quantify their spatial distribution similarity, the Pearson’s correlation coefficient (R) of SM was calculated between the estimates from correctRT-VIC and PGF-VIC at each 0.25° grid cell. The correlation analysis shows that the LMR region is dominant with widespread high positive R, and the low R is only scattered across a small portion of source region. In particular, across more than 70% of regions, the magnitude of R exceeds 0.80, suggesting that the correctRT-VIC and PGF-VIC bear good spatial resemblance in terms of SM estimates. In addition, we also quantified the relative difference (%) of 10-year SM mean between the correctRT-VIC and PGF-VIC. The result shows the mean SM estimate from the correctRT-VIC and the reference is close, with more than 90% of regions dominant with the bias less than 10%. In sum, the assessment either on streamflow or on SM suggests that a combination of the bias-corrected satellite RT forcings and the calibrated VIC model is capable of reasonable hydrological predictions, thus providing confidence of using LMDM for near-real-time drought monitoring.

3.2.3. Drought-Monitoring Evaluation

To test the LMDM’s reliability in drought monitoring, Figure 10 compares the SM drought identified from the LMDM prototype monitor (i.e., correctRT-VIC) with that from the reconstructed climatology (see Figure 6) during the 2004/05 and 2009/10 historical drought periods. Consistent with the reference, the LMDM prototype monitor detects large areas of severe (or even extreme) drought over almost the entire Lower LMR in December 2004. The spatial extent of drought dramatically shrinks, and a small portion of Northeastern Thailand and Lao PDR are affected in January and February 2005. Moreover, the monthly drought condition identified by the prototype monitor agrees well with reference for the 2009/10 drought, with severe drought detected in the Upper LMR (mostly in China domain) and Mekong Delta in October 2009. As it evolves to February 2010, the severe drought exacerbates and extends to the Southwest China, but weakens to the moderate level in the Mekong Delta. Notably, the areas experiencing significant wet conditions within the Thailand domain are also well reproduced by the prototype monitor. To quantify their spatial similarity, we calculated the spatial correlation coefficient (R) of SM percentile across all 0.25° grid cells within domain. Result shows the R value is greater than 0.75 for all drought months, and even around or beyond 0.90 during the 2004/05 drought period, suggesting that the LMDM’s drought monitoring has a similar pattern to the reference. In line with the spatial analyses, the percentage area under drought (SM percentile less than 20%) simulated by the prototype monitor is similar to that by the reference, corresponding to 66% and 60% (in December 2004), 43% and 40% (in January 2005), 44% and 36% (in February 2005) during the 2004/05 drought, and 41% and 38% (in October 2009), 52% and 43% (in December 2009), and 41% and 35% (in February 2010) during the 2009/10 drought, respectively. The above analyses suggest that the proposed prototype drought monitor achieved through the combination of VIC model with bias-corrected RT forcings bears an overall resemblance with the observational reference in terms of drought location, severity, and evolution.

3.2.4. Drought Monitoring in Operational Mode

Figure 11 presents the LMDM’s operational mode from 1 January 2015 to 31 December 2018. Here, the operational mode indicates the automatic feature of LMDM real-time running mode, consisting of seven steps in sequence (see Figure 12): (1) identify the current calendar date; (2) freely download the TMPA real-time (RT) precipitation and NCAR-NCEP reanalysis data (Tmax, Tmin, and W) on the target date (identified in step 1); (3) bias-correct the RT forcing data; (4) drive the VIC hydrological model; (5) enable the real-time SM estimate expressed as percentile (relative to the climatology); (6) make plots; and (7) enable figure plotting of SM percentile online. These steps are integrated into the LMDM framework and will be automatically updated at the specific time per day. The figures produced in operational LMDM mainly include the daily percentage area within a percentile range [Figure 11a] and its spatial pattern [Figure 11(b–e)]. The percentage area within a given percentile range is calculated as the sum of grid areas with SM percentile falling into the corresponding interval divided by the total area of LMR. The percentage area under drought is calculated based on grid cells whose SM percentile is lower than 20%. Overall, during the four-year operational period, the LMDM identifies four significant drought episodes (i.e., the 2015 wet season, the 2015/16 dry season, the 2017/18 dry season, and the 2018/19 dry season), during which more than 30% of the LMR is hit by severe droughts [see horizontal dash line in Figure 11a]. Particularly in April 2016, the areas affected by drought could even account for more than half of the LMR region, with nearly 40% of the LMR hit by extreme (2–5%) and more severe (i.e., exceptional) droughts. To highlight the location of drought, LMDM presents the spatial patterns of SM percentile on selected dates from the above significant drought episodes [Figure 11(b–e)]. From 1 July’s monitoring, the significant drought in the 2015 wet season is dominant over the Upper Lancang River basin within China. In line with the reported 2015/16 drought records from the official MRC [50], the monitoring system indicates that a large portion of Lower Mekong River basin (lying in Cambodia and the Mekong Delta) was suffering an unprecedented exceptional drought in April. In the recent 2018/19 dry season, the monitoring in November detects significant drought occurring mostly in the lower portion, including the Southern Lao PRD and Cambodia. Overall, the real-time monitoring results suggest that the LMDM can operationally track drought evolutions and provide reasonable estimates of the percentage area affected by droughts with different intensities and the corresponding spatial distribution pattern in the near-real-time mode.

4. Discussion

In this study, the LMDM was developed based on three types of VIC hydrological simulations. Thus, the reliability and robustness of VIC model is critical for the performance of the LMDM system. Overall, the VIC is capable of reproducing the observed hydrographs in LMR, with the Nash–Sutcliffe efficiency, Ef, greater than 0.70 and the Er magnitude lower than 25% across almost all gauging stations, either during the 20-year calibration period or over the additional 10-year validation period. However, among all gauging stations, the VIC model exhibits evident bias in streamflow at the Changdu and Mukdahan station, respectively. The Changdu station lies in the high-elevation mountainous Tibetan Plateau region, where the PGF global product used was demonstrated with considerable biases in temperature (4–5 °C) and in precipitation (1 mm/day). Thus, the uncertainties in meteorological inputs may partly contribute to the poor model performance. In addition, previous studies [81,82] implied that frozen soil parameterization scheme in VIC model may be another source of the model bias. As for the Mukdahan station, the evident bias in flow mainly comes from the underestimation of peak flow during the unprecedented flood (e.g., during 2009–2011). Such bias in flood peak may be partly due to the model parameters that were calibrated over a 20-year climatological period.
As for the drought assessment, the open-public GIDMaPS global system was introduced to validate the drought characteristics estimated from PGF-VIC (i.e., the climatology in LMDM). Noted that the drought information is identified by the standardized soil-moisture index (SSI) and the associated classification threshold, while in our LMDM, the index used to identify drought is SM percentile and the threshold used for drought classification is from the U.S. Drought Monitor (USDM). Thus, the difference in diagnosis indicator and classification threshold may lead to some uncertainties in the comparison.
In addition, the assessment in this study is based on a small number of samples. Future efforts should be devoted to summarize more drought events and the relevant official information to test LMDM’s robustness. Moreover, the TMPA-RT precipitation was employed as real-time climate driver in current LMDM. With the availability of long-term retrospective RT record from GPM product, the following version should be updated with the GPM real-time data.

5. Conclusions

In this study, we developed a 0.25° operational Lancang–Mekong drought monitor (LMDM) based on the VIC hydrological model, in which a set of 60-year historical simulation forced by the high-quality PGF global forcing data, a short simulation to bridge the historical and real-time modeling, and the real-time simulation driven by the bias-corrected TMPA and NCEP-NCAR real-time (RT) forcings were integrated within a consistent framework. Two devastating droughts reported in the 2004/05 and 2009/10 dry seasons were used to evaluate the LMDM’s ability in real-time drought diagnosis and detection.
Specifically, we firstly calibrated the VIC model by comparing the PGF-driven off-line simulation with the 20-year (corresponding to 1981–2000 for Changdu station and 1985–2014 for the remaining five stations) observed streamflow at six in situ gauging stations in LMR. The result shows the Nash–Sutcliffe efficiency (Ef) between VIC simulations and observations is above 0.70 and the relative error (Er) of monthly mean fluxes is mostly within 15%, suggesting that the VIC model after calibration can successfully reproduce the observed hydrographs. Note that an obvious flow underestimation was found for VIC at the mountainous Changdu station, which may be partly attributed to the uncertain meteorological inputs due to the limited ground stations in Tibetan Plateau (see more details in Section 4). Based on the calibrated VIC model, we conducted a 60-year retrospective simulation to form the ‘normal’ SM condition (e.g., SM climatology), from which the real-time SM estimate can be converted into percentile used for drought monitoring in LMDM. Comparisons with the available GIDMaPS global product and MODIS-aided regional study show that the LMDM is broadly consistent with the GIDMaPS to reproduce the drought pattern and evolution, with evident severe and extreme droughts across Northeastern Thailand, Lao PDR, and Southern Cambodia in December 2004 and persistent in the early two months of 2005. Moreover, they both indicate widespread severe drought across the Upper LMR within China domain during the 2009/10 dry season. This suggests that the climatology (reconstructed from VIC retrospective simulation) can provide reliable reference for real-time monitoring.
To enable the real-time monitoring consistent with the PGF-derived climatology, the real-time meteorological forcing data, i.e., TMAP satellite/NCEP-NCAR reanalysis data, employed in LMDM was bias-corrected against the PGF data. Results show that the raw TMPA-RT precipitation is subject to evident systematic errors, with about 10% overestimation (underestimation) of heavy precipitation (light precipitation), while such bias was reduced to around 2% after bias correction. Likewise, an evident frequency overestimation was also found for the daily temperature (about 30% for Tmax and 10% for Tmin) from NCEP-NCAR reanalysis, whereas with bias correction such overestimation was significantly reduced. This suggests the bias-correction approach can effectively remove the inconsistency between the RT forcing data and the PGF historical record. Furthermore, the VIC-simulated streamflow driven by the raw (rawRT-VIC) and corrected RT data (correctRT-VIC) were compared with the in situ gauging records during a 10-year (2005–2014) validation period (beyond the calibration period). The result shows the rawRT-VIC suffers from large positive bias (Er > 70%) and negative Nash–Sutcliffe efficiency (Ef < 0), whereas the correctRT-VIC is much superior to the rawRT-VIC, with the two metrics both falling into the satisfactory category. In addition to streamflow validation, we also evaluated the performance of correctRT-VIC in terms of reproducing SM pattern by comparing with the reference PGF-VIC estimates. Result shows the correctRT-VIC bears good spatial similarity to the PGF-VIC, with the correlation coefficient R exceeding 0.80 over about 70% of the domain and the bias magnitude less than 10% across almost all total region (about 90%). These assessments on hydrological performance suggest that the correctRT-VIC (i.e., combining the bias-corrected RT forcings and the calibrated VIC model) is capable of providing reasonable hydrological response, and thus can serve as LMDM prototype monitor for reliable drought monitoring.
When it comes to drought monitoring, our validation analysis show that the LMDM is able to reproduce the reported two droughts, with extreme (or even exceptional) drought covering a large portion of Lower LMR (Thailand and Lao PDR) during the 2004/05 dry season and the significant 2009/10 drought across much of the Upper portion and the Mekong Delta. Further quantitative analysis shows that the spatial correlation coefficient R is greater than 0.75 for all drought months, suggesting the LMDM monitor and the reference can reproduce a similar drought pattern. Consistently, the percentage drought area implied by the LMDM and the reference is close, corresponding to 66% and 60% (December 2004), 43% and 40% (January 2005), and 44% and 36% (February 2005) during the 2004/05 drought, and 41% and 38% (October 2009), 52% and 43% (December 2009), and 41% and 35% (February 2010) during the 2009/10 drought, respectively. In addition, we present LMDM’s operational mode from 1 January 2015 to 31 December 2018. In this operational period, the LMDM identifies four time periods with more than 30% regions experiencing significant drought conditions. In particular, more than half of the basin (primarily in the Mekong Delta) was detected under extreme and exceptional drought conditions during the 2015/16 dry season, which are consistent with the reported 2015/16 drought records from the official MRC. This suggests the value of operational LMDM in real-time tracking and quantifying drought conditions.
Overall, our results indicate that the satellite-based LMDM framework can reasonably monitor drought evolutions and summarize the percentage drought area in a real-time manner across the LMR basin. In the future, the LMDM will be made operationally available to the public with an online and user-friendly interface to support drought tracking in LMR. It also provides a valuable prototype for large-scale early warning of drought over other regions where ground observations are not readily accessible in real time.

Author Contributions

Conceptualization, X.Z. and G.L.; funding acquisition, Z.S. and J.L.; methodology, X.Z. and M.M.; validation, X.Z., Y.Q. and H.L.; writing—original draft, X.Z.; writing—review and editing, All authors. All authors have read and agree to the published version of the manuscript.

Funding

This research was funded by the National Key Research & Development Program of China (2017YFC1502406, 2018YFC1508702, and 2016YFC0400106-2); the National Natural Science Foundation of China (51609257, 51609259; 41701023; 41901016); and the IWHR Research & Development Support Program (JZ0145B582017, JZ0145B472016, and JZ0145B862017).

Acknowledgments

The in situ runoff measurement data were provided by the Mekong River Commission (MRC; http://www.mrcmekong.org/). The Princeton’s global meteorological forcing (PGF) is provided by the Terrestrial Hydrology Research Group of Princeton University (http://hydrology.princeton.edu/). An updated version of PGF is available: http://hydrology.princeton.edu/data/hexg/GDFC/index.html. The TMPA-RT precipitation and the reanalysis RT data are accessible at NASA Goddard Space Flight Center (GSFC; https://trmm.gsfc.nasa.gov/) and the NCAR/UCAR Research Data Archive (https://rda.ucar.edu/datasets/ds090.0/).

Conflicts of Interest

The authors declare no conflict of interest.

References

  1. Mishra, A.K.; Singh, V.P. A review of drought concepts. J. Hydrol. 2010, 391, 204–216. [Google Scholar] [CrossRef]
  2. Dai, A. Drought under global warming: A review. Wiley Interdiscip. Rev. Clim. Chang. 2011, 2, 45–65. [Google Scholar] [CrossRef] [Green Version]
  3. Lesk, C.; Rowhani, P.; Ramankutty, N. Influence of extreme weather disasters on global crop production. Nature 2016, 529, 84. [Google Scholar] [CrossRef] [PubMed]
  4. Leng, G.; Hall, J. Crop yield sensitivity of global major agricultural countries to droughts and the projected changes in the future. Sci. Total Environ. 2019, 654, 811–821. [Google Scholar] [CrossRef] [PubMed]
  5. Orth, R.; Destouni, G. Drought reduces blue-water fluxes more strongly than green-water fluxes in Europe. Nat. Commun. 2018, 9, 3602. [Google Scholar] [CrossRef] [PubMed]
  6. Yang, Y.; Guan, H.; Batelaan, O.; McVicar, T.R.; Long, D.; Piao, S.; Liang, W.; Liu, B.; Jin, Z.; Simmons, C.T. Contrasting responses of water use efficiency to drought across global terrestrial ecosystems. Sci. Rep. 2016, 6, 23284. [Google Scholar] [CrossRef] [PubMed] [Green Version]
  7. Fang, W.; Huang, S.Z.; Huang, Q.; Huang, G.H.; Wang, H.; Leng, G.; Wang, L.; Guo, Y. Probabilistic assessment of remote sensing-based terrestrial vegetation vulnerability to drought stress of the Loess Plateau in China. Remote Sens. Environ. 2019, 232, 111290. [Google Scholar] [CrossRef]
  8. Centre for Research on the Epidemiology of Disasters (CRED) and United Nations Office for Disaster Risk Reduction (UNISDR). The Human Cost of Weather Related Disasters: 1995–2015; Centre for Research on the Epidemiology of Disasters and United Nations Office for Disaster Risk Reduction: Geneva, Switzerland, 2015; p. 30. [Google Scholar]
  9. Cayan, D.R.; Das, T.; Pierce, D.W.; Barnett, T.P.; Tyree, M.; Gershunov, A. Future dryness in the southwest US and the hydrology of the early 21st century drought. Proc. Natl. Acad. Sci. USA 2010, 107, 21271–21276. [Google Scholar] [CrossRef] [PubMed] [Green Version]
  10. Prudhomme, C.; Giuntoli, I.; Robinson, E.L.; Clark, D.B.; Arnell, N.W.; Dankers, R.; Fekete, B.M.; Franssen, W.; Gerten, D.; Gosling, S.N.; et al. Hydrological droughts in the 21st century, hotspots and uncertainties from a global multimodel ensemble experiment. Proc. Natl. Acad. Sci. USA 2014, 111, 3262–3267. [Google Scholar] [CrossRef] [Green Version]
  11. Leng, G.; Tang, Q.; Rayburg, S. Climate change impacts on meteorological, agricultural and hydrological droughts in China. Glob. Planet. Chang. 2015, 126, 23–34. [Google Scholar] [CrossRef]
  12. Wanders, N.; Wada, Y.; Van Lanen, H.A.J. Global hydrological droughts in the 21st century under a changing hydrological regime. Earth Syst. Dyn. 2015, 6, 1–15. [Google Scholar] [CrossRef] [Green Version]
  13. Zhang, X.; Tang, Q.; Liu, X.; Leng, G.; Di, C. Nonlinearity of runoff response to global mean temperature change over major global river basins. Geophys. Res. Lett. 2018, 45, 6109–6116. [Google Scholar] [CrossRef]
  14. He, X.; Pan, M.; Wei, Z.; Wood, E.F.; Sheffield, J. A Global Drought and Flood Catalogue from 1950 to 2016. Bull. Am. Meteorol. Soc. 2020. [Google Scholar] [CrossRef] [Green Version]
  15. Schewe, J.; Heinke, J.; Gerten, D.; Haddeland, I.; Arnell, N.W.; Clark, D.B.; Dankers, R.; Eisner, S.; Fekete, B.M.; Colón-González, F.J.; et al. Multi-model assessment of water scarcity under climate change. Proc. Natl. Acad. Sci. USA 2014, 111, 3245–3250. [Google Scholar] [CrossRef] [PubMed] [Green Version]
  16. Liu, W.; Sun, F.; Lim, W.H.; Zhang, J.; Wang, H.; Shiogama, H.; Zhang, Y. Global drought and severe drought-affected populations in 1.5 and 2 °C warmer worlds. Earth Syst. Dyn. 2018, 9, 267–283. [Google Scholar] [CrossRef] [Green Version]
  17. Evans, G.W. Projected behavioral impacts of global climate change. Annu. Rev. Psychol. 2019, 70, 449–474. [Google Scholar] [CrossRef] [PubMed]
  18. Luo, L.; Wood, E.F. Monitoring and predicting the 2007 U.S. drought. Geophys. Res. Lett. 2007, 34, L22702. [Google Scholar] [CrossRef] [Green Version]
  19. Yuan, X.; Wood, E.F. Multimodel seasonal forecasting of global drought onset. Geophys. Res. Lett. 2013, 40, 4900–4905. [Google Scholar] [CrossRef]
  20. Huang, S.; Li, P.; Huang, Q.; Leng, G.; Hou, B.; Ma, L. The propagation from meteorological to hydrological drought and its potential influence factors. J. Hydrol. 2017, 547, 184–195. [Google Scholar] [CrossRef]
  21. He, X.; Estes, L.; Konar, M.; Tian, D.; Anghileri, D.; Baylis, K.; Evans, T.; Sheffield, J. Integrated approaches to understanding and reducing drought impact on food security across scales. Curr. Opin. Environ. Sustain. 2019, 40, 43–54. [Google Scholar] [CrossRef]
  22. Robock, A.; Vinnikov, K.Y.; Srinivasan, G.; Entin, J.K.; Hollinger, S.E.; Speranskaya, N.A.; Liu, S.; Namkhai, A. The Global Soil Moisture Data Bank. Bull. Am. Meteorol. Soc. 2000, 81, 1281–1299. [Google Scholar] [CrossRef] [Green Version]
  23. Baldocchi, D.; Falge, E.; Gu, L.; Olson, R.; Hollinger, D.; Running, S.; Anthoni, P.; Bernhofer, C.; Davis, K.; Evans, R.; et al. FLUXNET: A new tool to study the temporal and spatial variability of ecosystem-scale carbon dioxide, water vapor, and energy flux densities. Bull. Am. Meteorol. Soc. 2001, 82, 2415–2434. [Google Scholar] [CrossRef]
  24. Sheffield, J.; Wood, E.; Roderick, M. Little change in global drought over the past 60 years. Nature 2012, 491, 435–438. [Google Scholar] [CrossRef] [PubMed]
  25. Tang, Q.; Oki, T. Terrestrial water cycle and climate change: Natural and human-induced impacts. In AGU Geophysical Monograph Series; John Wiley: Hoboken, NJ, USA, 2016; Volume 221. [Google Scholar]
  26. Tang, Q.; Gao, H.; Lu, H.; Lettenmaier, D.P. Remote sensing: Hydrology. Prog. Phys. Geogr. 2009, 33, 490–509. [Google Scholar] [CrossRef]
  27. Peng, J.; Loew, A.; Merlin, O.; Verhoest, N.E. A review of spatial downscaling of satellite remotely sensed soil moisture. Rev. Geophys. 2017, 55, 341–366. [Google Scholar] [CrossRef]
  28. Tapley, B.D.; Bettadpur, S.; Ries, J.C.; Thompson, P.F.; Watkins, M.M. GRACE measurements of mass variability in the Earth system. Science 2004, 305, 503–505. [Google Scholar] [CrossRef] [Green Version]
  29. Huffman, G.J.; Bolvin, D.T.; Nelkin, E.J.; Wolff, D.B.; Adler, R.F.; Gu, G.; Stocker, E.F. The TRMM multisatellite precipitation analysis (TMPA): Quasi-global, multiyear, combined-sensor precipitation estimates at fine scales. J. Hydrometeorol. 2007, 8, 38–55. [Google Scholar] [CrossRef]
  30. Mu, Q.; Zhao, M.; Running, S.W. Improvements to a MODIS global terrestrial evapotranspiration algorithm. Remote Sens. Environ. 2011, 115, 1781–1800. [Google Scholar] [CrossRef]
  31. Hou, A.Y.; Kakar, R.K.; Neeck, S.; Azarbarzin, A.A.; Kummerow, C.D.; Kojima, M.; Iguchi, T. The global precipitation measurement mission. Bull. Am. Meteorol. Soc. 2014, 95, 701–722. [Google Scholar] [CrossRef]
  32. Mu, Q.; Zhao, M.; Kimball, J.S.; McDowell, N.G.; Running, S.W. A remotely sensed global terrestrial drought severity index. Bull. Am. Meteorol. Soc. 2013, 94, 83–98. [Google Scholar] [CrossRef] [Green Version]
  33. Long, D.; Shen, Y.; Sun, A.; Hong, Y.; Longuevergne, L.; Yang, Y.; Li, B.; Chen, L. Drought and flood monitoring for a large karst plateau in Southwest China using extended GRACE data. Remote Sens. Environ. 2014, 155, 145–160. [Google Scholar] [CrossRef]
  34. Zhang, X.; Su, Z.; Lv, J.; Liu, W.; Ma, M.; Peng, J.; Leng, G. A set of satellite-based near real-time meteorological drought monitoring data over China. Remote Sens. 2019, 11, 453. [Google Scholar] [CrossRef] [Green Version]
  35. Sheffield, J.; Ferguson, C.; Troy, T.; Wood, E.; McCabe, M. Closing the terrestrial water budget from satellite remote sensing. Geophys. Res. Lett. 2009, 36, L07403. [Google Scholar] [CrossRef]
  36. Sheffield, J.; Wood, E.F.; Pan, M.; Beck, H.; Coccia, G.; Serrat-Capdevila, A.; Verbist, K. Satellite remote sensing for water resources management: Potential for supporting sustainable development in data-poor regions. Water Resour. Res. 2018, 54, 9724–9758. [Google Scholar] [CrossRef] [Green Version]
  37. AghaKouchak, A.; Farahmand, A.; Melton, F.S.; Teixeira, J.; Anderson, M.C.; Wardlow, B.D.; Hain, C.R. Remote sensing of drought: Progress, challenges and opportunities. Rev. Geophys. 2015, 53, 452–480. [Google Scholar] [CrossRef] [Green Version]
  38. Zhang, X.; Tang, Q.; Pan, M.; Tang, Y. A long-term land surface hydrologic fluxes and states dataset for China. J. Hydrometeorol. 2014, 15, 2067–2084. [Google Scholar] [CrossRef]
  39. Nijssen, B.; Shukla, S.; Lin, C.; Gao, H.; Zhou, T.; Sheffield, J.; Wood, E.F.; Lettenmaier, D.P. A prototype global drought information system based on multiple land surface models. J. Hydrometeorol. 2014, 15, 1661–1676. [Google Scholar] [CrossRef]
  40. Zhang, X.; Tang, Q.; Liu, X.; Leng, G.; Li, Z. Soil moisture drought monitoring and forecasting using satellite and climate model data over southwestern China. J. Hydrometeorol. 2017, 18, 5–23. [Google Scholar] [CrossRef]
  41. Sheffield, J.; Wood, E.F.; Chaney, N.; Guan, K.; Sadri, S.; Yuan, X.; Olang, L.; Amani, A.; Ali, A.; Demuth, S.; et al. A drought monitoring and forecasting system for sub-Sahara African water resources and food security. Bull. Am. Meteorol. Soc. 2014, 95, 861–882. [Google Scholar] [CrossRef]
  42. Funk, C.; Shukla, S.; Thiaw, W.M.; Rowland, J.; Hoell, A.; McNally, A.; Husak, G.; Novella, N.; Budde, M.; Peters-Lidard, C.; et al. Recognizing the Famine Early Warning Systems Network (FEWS NET): Over 30 Years of drought early warning science advances and partnerships promoting global food security. Bull. Am. Meteorol. Soc. 2019, 100, 1011–1027. [Google Scholar] [CrossRef]
  43. Hao, Z.; Singh, V.P.; Xia, Y. Seasonal drought prediction: Advances, challenges, and future prospects. Rev. Geophys. 2018, 56, 108–141. [Google Scholar] [CrossRef] [Green Version]
  44. Wood, E.F.; Schubert, S.D.; Wood, A.W.; Peters-Lidard, C.D.; Mo, K.C.; Mariotti, A.; Pulwarty, R.S. Prospects for advancing drought understanding, monitoring, and prediction. J. Hydrometeorol. 2015, 16, 1636–1657. [Google Scholar] [CrossRef]
  45. Hao, Z.; AghaKouchak, A.; Nakhjiri, N.; Farahmand, A. Global integrated drought monitoring and prediction system. Sci. Data 2014, 1, 140001. [Google Scholar] [CrossRef] [PubMed]
  46. Hao, Z.; Yuan, X.; Xia, Y.; Hao, F.; Singh, V.P. An overview of drought monitoring and prediction systems at regional and global scales. Bull. Am. Meteorol. Soc. 2017, 98, 1879–1896. [Google Scholar] [CrossRef]
  47. Mekong River Commission (MRC). Planning Atlas of the Lower Mekong River Basin; Mekong River Commission: Phnom Penh, Cambodia, 2011; p. 116. [Google Scholar]
  48. Hundertmark, W. Building drought management capacity in the Mekong River basin. Irrig. Drain. 2008, 57, 279–287. [Google Scholar] [CrossRef]
  49. Qiu, J. China drought highlights future climate threats. Nature 2010, 465, 142–143. [Google Scholar] [CrossRef] [Green Version]
  50. Paradis, S.; Li, Z.; Liu, H. Joint Observation and Evaluation of the Emergency Water Supplement from China to the Mekong River; Mekong River Commission (MRC) and Ministry of Water Resources (MWR) of the People’s Republic of China (PRC): Beijing, China, 2016; p. 74. [Google Scholar]
  51. Terink, W.; Immerzeel, W.; Droogers, P. Drought monitoring and impact assessment in the Mekong River basin. Rep. Future Water 2011, 104, 1–59. [Google Scholar]
  52. Zhou, T.; Zhou, C.; Yu, F.; Zhao, Y. Spatial and temporal distribution characteristics analysis of meteorological drought in Lancang-Mekong River basin. Water Resour. Power 2011, 29, 4–7. (In Chinese) [Google Scholar]
  53. Li, B.; Su, H.; Chen, F.; Li, S.; Tian, J.; Qin, Y.; Zhang, R.; Chen, S.; Yang, Y.; Rong, Y. The changing pattern of droughts in the Lancang River Basin during 1960–2005. Theor. Appl. Climatol. 2013, 111, 401–415. [Google Scholar] [CrossRef]
  54. Guo, H.; Bao, A.; Liu, T.; Ndayisaba, F.; He, D.; Kurban, A.; De Maeyer, P. Meteorological drought analysis in the Lower Mekong basin using satellite-based long-term CHIRPS product. Sustainability 2017, 9, 901. [Google Scholar] [CrossRef] [Green Version]
  55. Zhang, B.; Zhang, L.; Guo, H.; Leinenkugel, P.; Zhou, Y.; Li, L.; Shen, Q. Drought impact on vegetation productivity in the Lower Mekong Basin. Int. J. Remote Sens. 2014, 35, 2835–2856. [Google Scholar] [CrossRef]
  56. Thilakarathne, M.; Sridhar, V. Characterization of future drought conditions in the Lower Mekong River Basin. Weather Clim. Extrem. 2017, 17, 47–58. [Google Scholar] [CrossRef]
  57. Schmitt, R.; Bizzi, S.; Castelletti, A.; Kondolf, G. Improved trade-offs of hydropower and sand connectivity by strategic dam planning in the Mekong. Nat. Sustain. 2018, 1, 96–104. [Google Scholar] [CrossRef]
  58. Schmitt, R.; Kittner, N.; Mathias Kondolf, G.; Kammen, D. Deploy diverse renewables to save tropical rivers. Nature 2019, 569, 330–332. [Google Scholar] [CrossRef] [PubMed]
  59. Son, N.T.; Chena, C.F.; Chenb, C.R.; Changa, L.Y.; Minhc, V.Q. Monitoring agricultural drought in the Lower Mekong Basin using MODIS NDVI and land surface temperature data. Int. J. Appl. Earth Obs. Geoinf. 2012, 18, 417–427. [Google Scholar] [CrossRef]
  60. Jayasinghe, S.; Dutta, R.; Basnayake, S.B.; Granger, S.L.; Andreadis, K.M.; Das, N.; Markert, K.N.; Cutter, P.G.; Towashiraporn, P.; Anderson, E. Application of Regional Drought and Crop Yield Information System to enhance drought monitoring and forecasting in Lower Mekong region. In AGU Fall Meeting 2017; New Orleans, LA, USA, abstract #GC42C-03.
  61. Liang, X.; Lettenmaier, D.P.; Wood, E.F.; Burges, S.J. A simple hydrologically based model of land surface water and energy fluxes for general circulation models. J. Geophys. Res. 1994, 99, 14415–14428. [Google Scholar] [CrossRef]
  62. Todini, E. The ARNO rainfall-runoff model. J. Hydrol. 1996, 175, 339–382. [Google Scholar] [CrossRef]
  63. Sheffield, J.; Wood, E.F. Characteristics of global and regional drought, 1950-2000: Analysis of soil moisture data from off-line simulation of the terrestrial hydrologic cycle. J. Geophys. Res. 2007, 112, D17115. [Google Scholar] [CrossRef]
  64. Sheffield, J.; Goteti, G.; Wood, E.F. Development of a 50-year high-resolution global dataset of meteorological forcings for land surface modeling. J. Clim. 2006, 19, 3088–3110. [Google Scholar] [CrossRef] [Green Version]
  65. Pan, M.; Sahoo, A.K.; Troy, T.J.; Vinukollu, R.K.; Sheffield, J.; Wood, E.F. Multisource estimation of long-term terrestrial water budget for major global river basins. J. Clim. 2012, 25, 3191–3206. [Google Scholar] [CrossRef]
  66. Dandridge, C.; Lakshmi, V.; Bolten, J.; Srinivasan, R. Evaluation of satellite-based rainfall estimates in the Lower Mekong River basin (Southeast Asia). Remote Sens. 2019, 11, 2709. [Google Scholar] [CrossRef] [Green Version]
  67. Hong, Y.; Adler, R.F.; Hossain, F.; Curtis, S.; Huffman, G.J. A first approach to global runoff simulation using satellite rainfall estimation. Water Resour. Res. 2007, 43, W08502. [Google Scholar] [CrossRef] [Green Version]
  68. Wu, H.; Adler, R.F.; Tian, Y.; Huffman, G.J.; Li, H.; Wang, J. Real-time global flood estimation using satellite-based precipitation and a coupled land surface and routing model. Water Resour. Res. 2014, 50, 2693–2717. [Google Scholar] [CrossRef] [Green Version]
  69. Hansen, M.; DeFries, C.R.S.; Townshend, J.R.G.; Sohlberg, R. Global land cover classification at 1 km spatial resolution using a classification tree approach. Int. J. Remote Sens. 2000, 21, 1331–1364. [Google Scholar] [CrossRef]
  70. Nijssen, B.; Schnur, R.; Lettenmaier, D.P. Global retrospective estimation of soil moisture using the Variable Infiltration Capacity land surface model, 1980–1993. J. Clim. 2001, 14, 1790–1808. [Google Scholar] [CrossRef]
  71. FAO. Digital Soil Map of the World and Derived Soil Properties; Land and Water Digital Media Series 1; Food and Agriculture Organization: Rome, Italy, 1998; CD-ROM.
  72. Shi, X.; Wood, A.W.; Lettenmaier, D.P. How essential is hydrologic model calibration to seasonal streamflow forecasting? J. Hydrometeorol. 2008, 9, 1350–1363. [Google Scholar] [CrossRef]
  73. Lohmann, D.; Nolte-Holube, R.; Raschke, E. A large scale horizontal routing model to be coupled to land surface parameterization schemes. Tellus A 1996, 48, 708–721. [Google Scholar] [CrossRef]
  74. Wu, H.; Kimball, J.S.; Li, H.; Huang, M.; Leung, L.R.; Adler, R.F. A new global river network database for macroscale hydrologic modeling. Water Resour. Res. 2012, 48, W09701. [Google Scholar] [CrossRef] [Green Version]
  75. Yapo, P.O.; Gupta, H.V.; Sorooshian, S. Multi-objective global optimization for hydrologic models. J. Hydrol. 1998, 204, 83–97. [Google Scholar] [CrossRef] [Green Version]
  76. Moriasi, D.N.; Arnold, J.G.; Van Liew, M.W.; Bingner, R.L.; Harmel, R.D.; Veith, T.L. Model evaluation guidelines for systematic quantification of accuracy in watershed simulations. Trans. ASABE 2007, 50, 885–900. [Google Scholar] [CrossRef]
  77. Zhang, X.; Tang, Q. Combining satellite precipitation and long-term ground observations for hydrological monitoring in China. J. Geophys. Res. Atmos. 2015, 120, 6426–6443. [Google Scholar] [CrossRef] [Green Version]
  78. Wood, A.W.; Lettenmaier, D.P. A test bed for new seasonal hydrologic forecasting approaches in the western United States. Bull. Am. Meteorol. Soc. 2006, 87, 1699–1712. [Google Scholar] [CrossRef]
  79. Svoboda, M.; LeComte, D.; Hayes, M.; Heim, R.; Gleason, K. The Drought Monitor. Bull. Am. Meteorol. Soc. 2002, 83, 1181–1190. [Google Scholar] [CrossRef] [Green Version]
  80. MRC. Lower Mekong Basin Drought Study: Analysis, Forecasting, Planning and Management; Mekong River Commission: Vientiane, Laos, 2005. [Google Scholar]
  81. Cherkauer, K.A.; Lettenmaier, D.P. Simulation of spatial variability in snow and frozen soil field. J. Geophys. Res. 2003, 108, 8858. [Google Scholar] [CrossRef]
  82. Su, F.G.; Adam, J.C.; Trenberth, K.E.; Lettenmaier, D.P. Evaluation of surface water fluxes of the pan-Arctic land region with a land surface model and ERA-40 reanalysis. J. Geophys. Res. 2006, 111, D05110. [Google Scholar] [CrossRef]
  83. Costa-Cabral, M.C.; Richey, J.E.; Goteti, G.; Lettenmaier, D.P.; Feldkotter, C.; Snidvongs, A. Landscape structure and use, climate, and water movement in the Mekong River basin. Hydrol. Process. 2008, 22, 1731–1746. [Google Scholar] [CrossRef]
  84. Wang, W.; Lu, H.; Yang, D.; Sothea, K.; Jiao, Y.; Gao, B.; Peng, X.; Pang, Z. Modelling Hydrologic Processes in the Mekong River Basin Using a Distributed Model Driven by Satellite Precipitation and Rain Gauge Observations. PLoS ONE 2016, 11, e0152229. [Google Scholar] [CrossRef] [Green Version]
Figure 1. Schematic structure of the Variable Infiltration Capacity (VIC) model (courtesy from https://www.hydro.washington.edu/Lettenmaier/Models/VIC/).
Remotesensing 12 00376 g001
Figure 2. The Lancang–Mekong River (LMR) basin and the six in situ hydrological stations (red triangles) with >20-year daily streamflow observations.
Remotesensing 12 00376 g002
Figure 3. Flowchart of VIC model calibration and validation.
Remotesensing 12 00376 g003
Figure 4. Configuration of the operational Lancang–Mekong drought monitor (LMDM).
Remotesensing 12 00376 g004
Figure 5. Comparisons of monthly streamflow between VIC simulations and observations at six hydrological gauging stations for the 20-year calibration period. (a) Changdu; (b) Chiangkhan; (c) NongKhai; (d) Mudahan; (e) Parkse; (f) StungTreng.
Remotesensing 12 00376 g005
Figure 6. Monthly drought conditions (expressed as SM percentile) estimated from the 60-year VIC retrospective simulation driven by the PGF forcing data in three typical months during the 2004/05 drought (ac) and the 2009/10 drought (df).
Remotesensing 12 00376 g006
Figure 7. Comparisons of cumulative density function (CDF) derived from the raw RT data (dark-green dash line), corrected RT data (red dash line), and the gauge-based PGF data (black solid line) during 2001–2010, for (a) daily precipitation intensity (P), (b) daily maximum temperature (Tmax), and (c) daily minimum temperature (Tmin). Note that the raw and corrected RT data refer to the TMPA-RT and NCEP-NCAR reanalysis products.
Remotesensing 12 00376 g007
Figure 8. Comparisons of VIC-simulated monthly streamflow driven by the TMPA and NCEP-NCAR RT forcings (Raw and Corrected) against in situ observations during the 10-year validation period (2005–2014) at five hydrological stations. (a) Chiangkhan; (b) NongKhai; (c) Mudahan; (d) Parkse; (e) StungTreng.
Remotesensing 12 00376 g008
Figure 9. Correlation coefficient (R) (a) and mean relative bias (%) (b) of SM estimates between the correctRT-VIC and PGF-VIC over the 10-year (2001–2010) overlapping period.
Remotesensing 12 00376 g009
Figure 10. Monthly drought monitoring estimated from the combination of the VIC model and the bias-corrected satellite real-time meteorological data in three typical months during 2004/05 drought (ac) and 2009/10 drought (df), respectively.
Remotesensing 12 00376 g010
Figure 11. The LMDM’s operational mode from 1 January 2015 to 31 December 2018. (a) Percentage area within a percentile range; for example, the red band indicates the fraction of total LMR region for which the SM percentile on a given day falls into the interval of 2–5%. (be) SM percentile pattern on the representative dates with significant droughts indicated by the vertical lines in Figure 11a.
Remotesensing 12 00376 g011
Figure 12. Flowchart of the LMDM operational real-time mode.
Remotesensing 12 00376 g012
Table 1. The six hydrological gauging stations.
No.NameLocationDrainage Area (103 km2)Data Record
Longitude
(°)
Latitude
(°)
1Changdu97.1831.1848.51981–2000
2Chiangkhan100.0920.271891985–2016
3NongKhai102.7317.883021985–2016
4Mudahan104.7316.583911985–2016
5Parkse105.8115.105451985–2016
6StungTreng105.9513.536351985–2016

