Multi-Temporal Analysis and Trends of the Drought Based on MODIS Data in Agricultural Areas, Romania
Abstract
1. Introduction
2. Materials and Methods
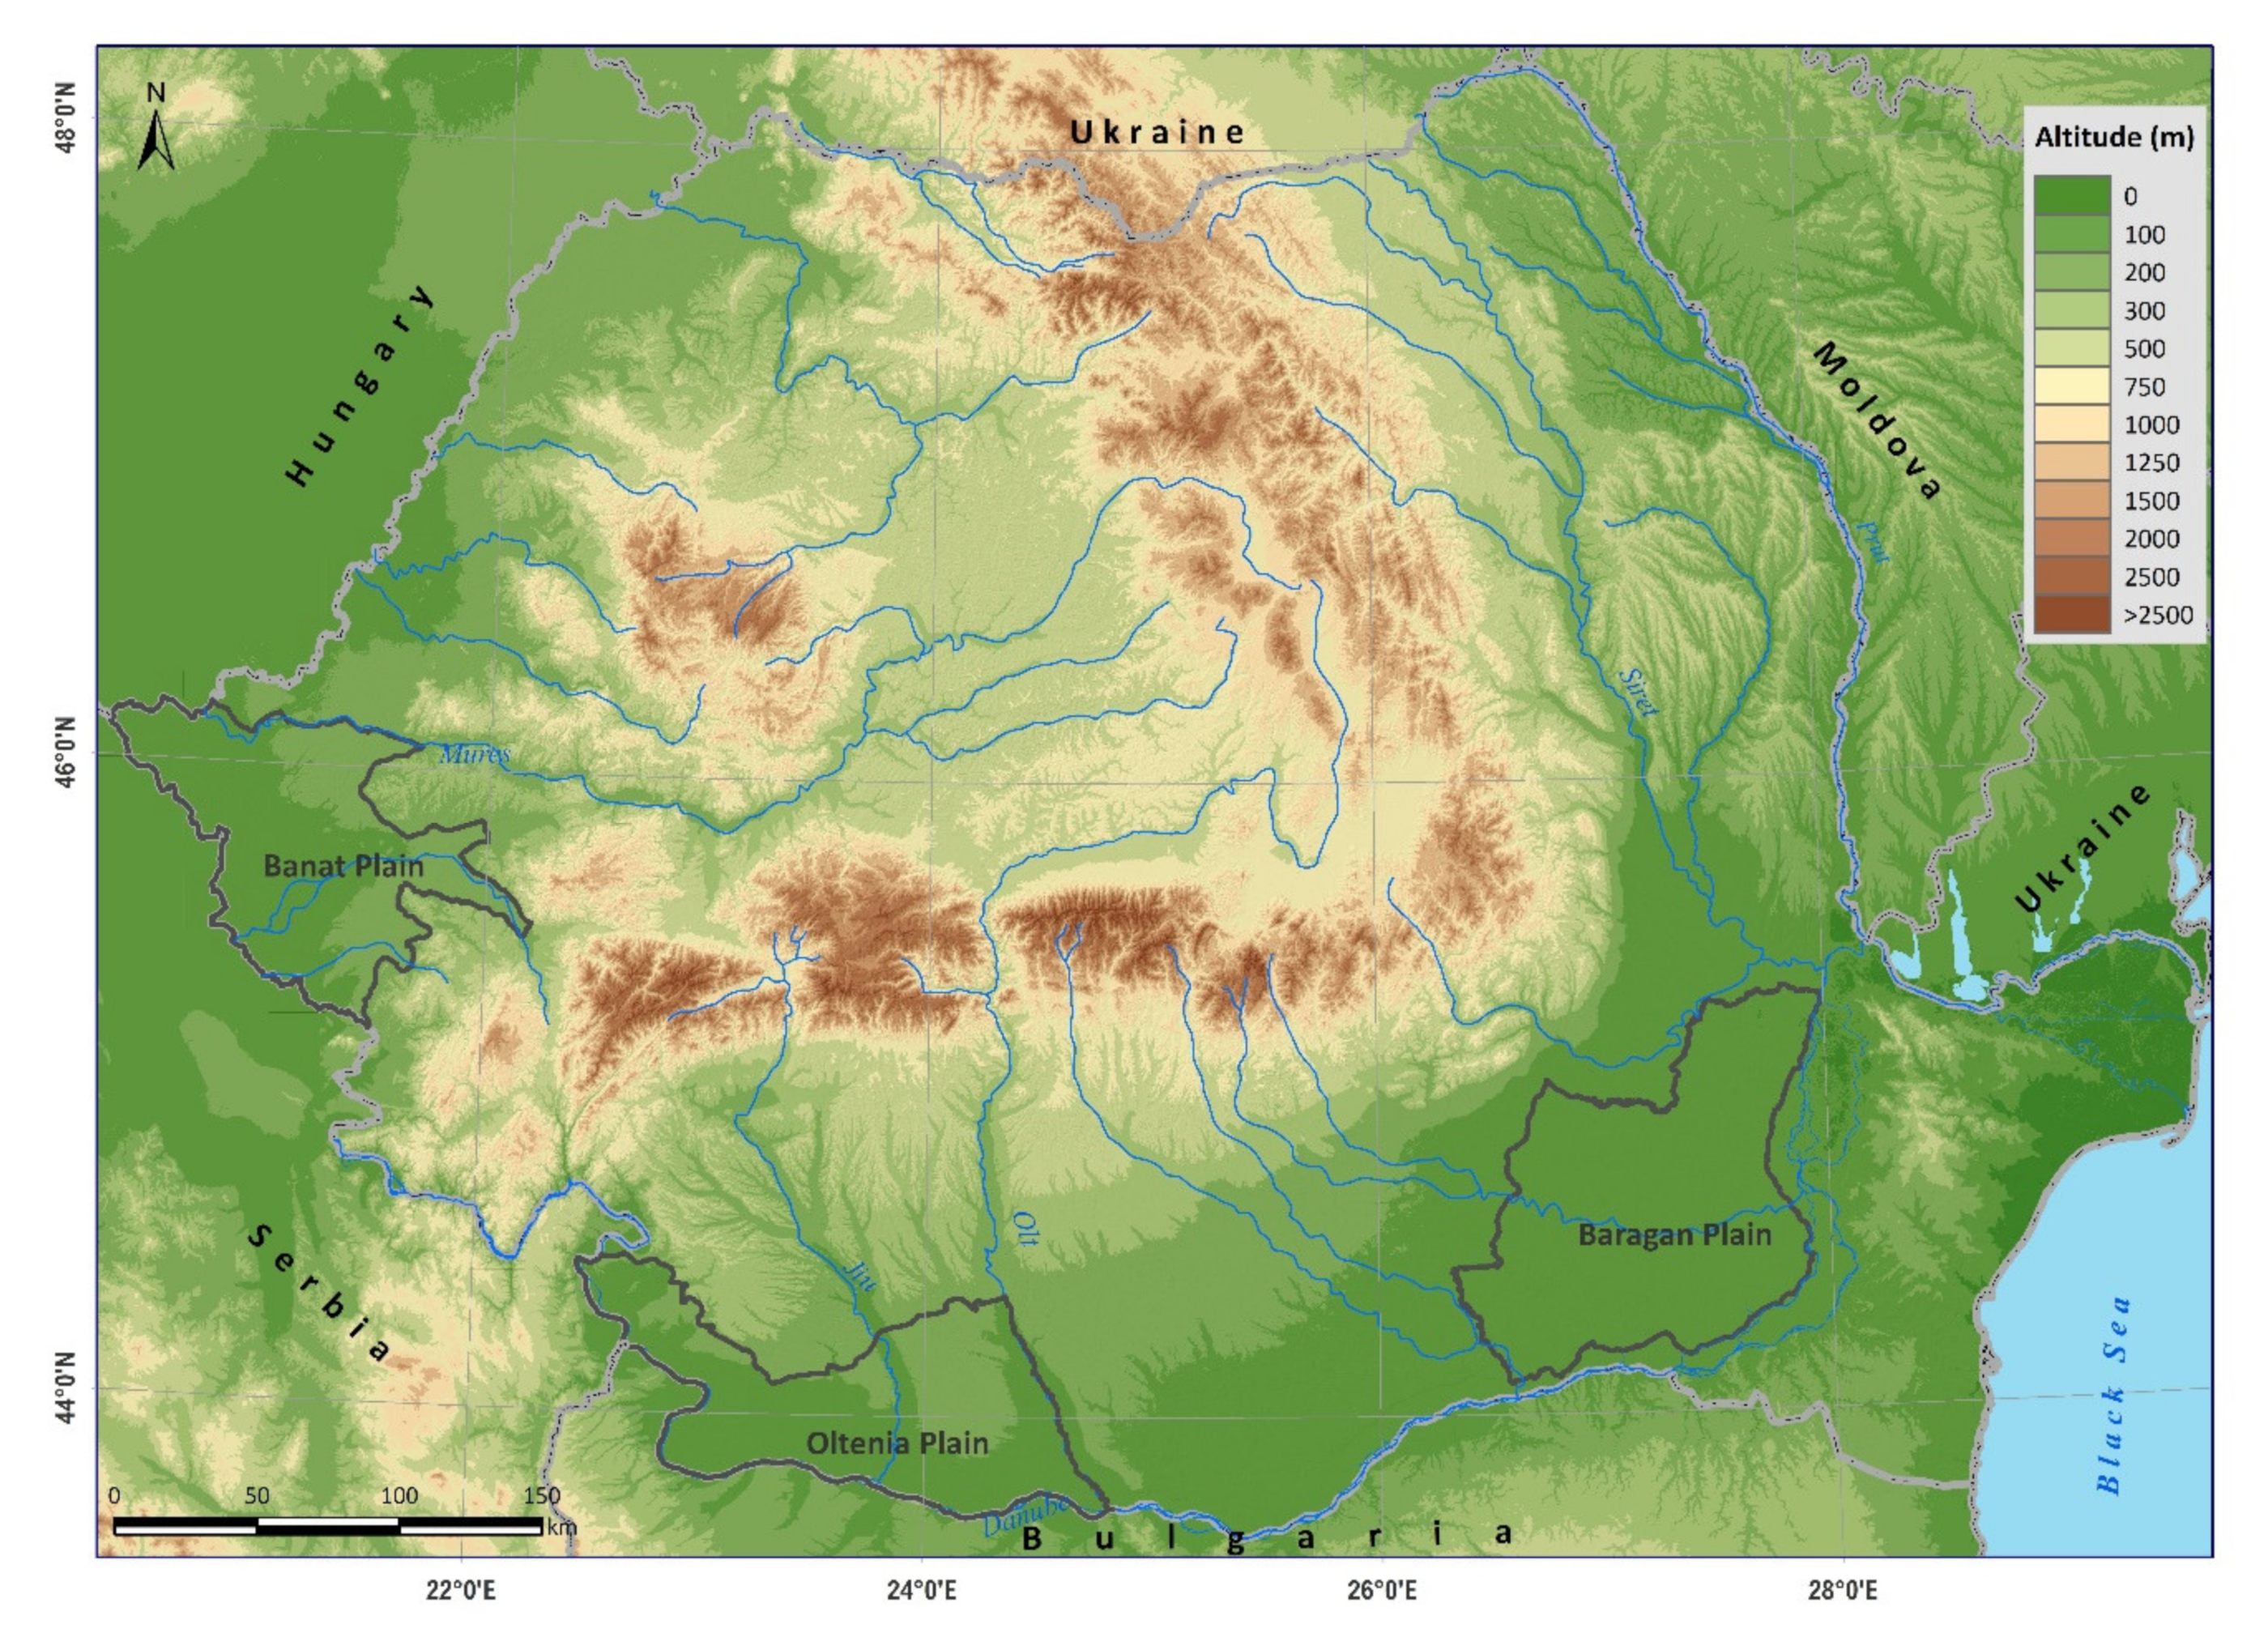
2.1. Study Areas
2.2. Data Collection
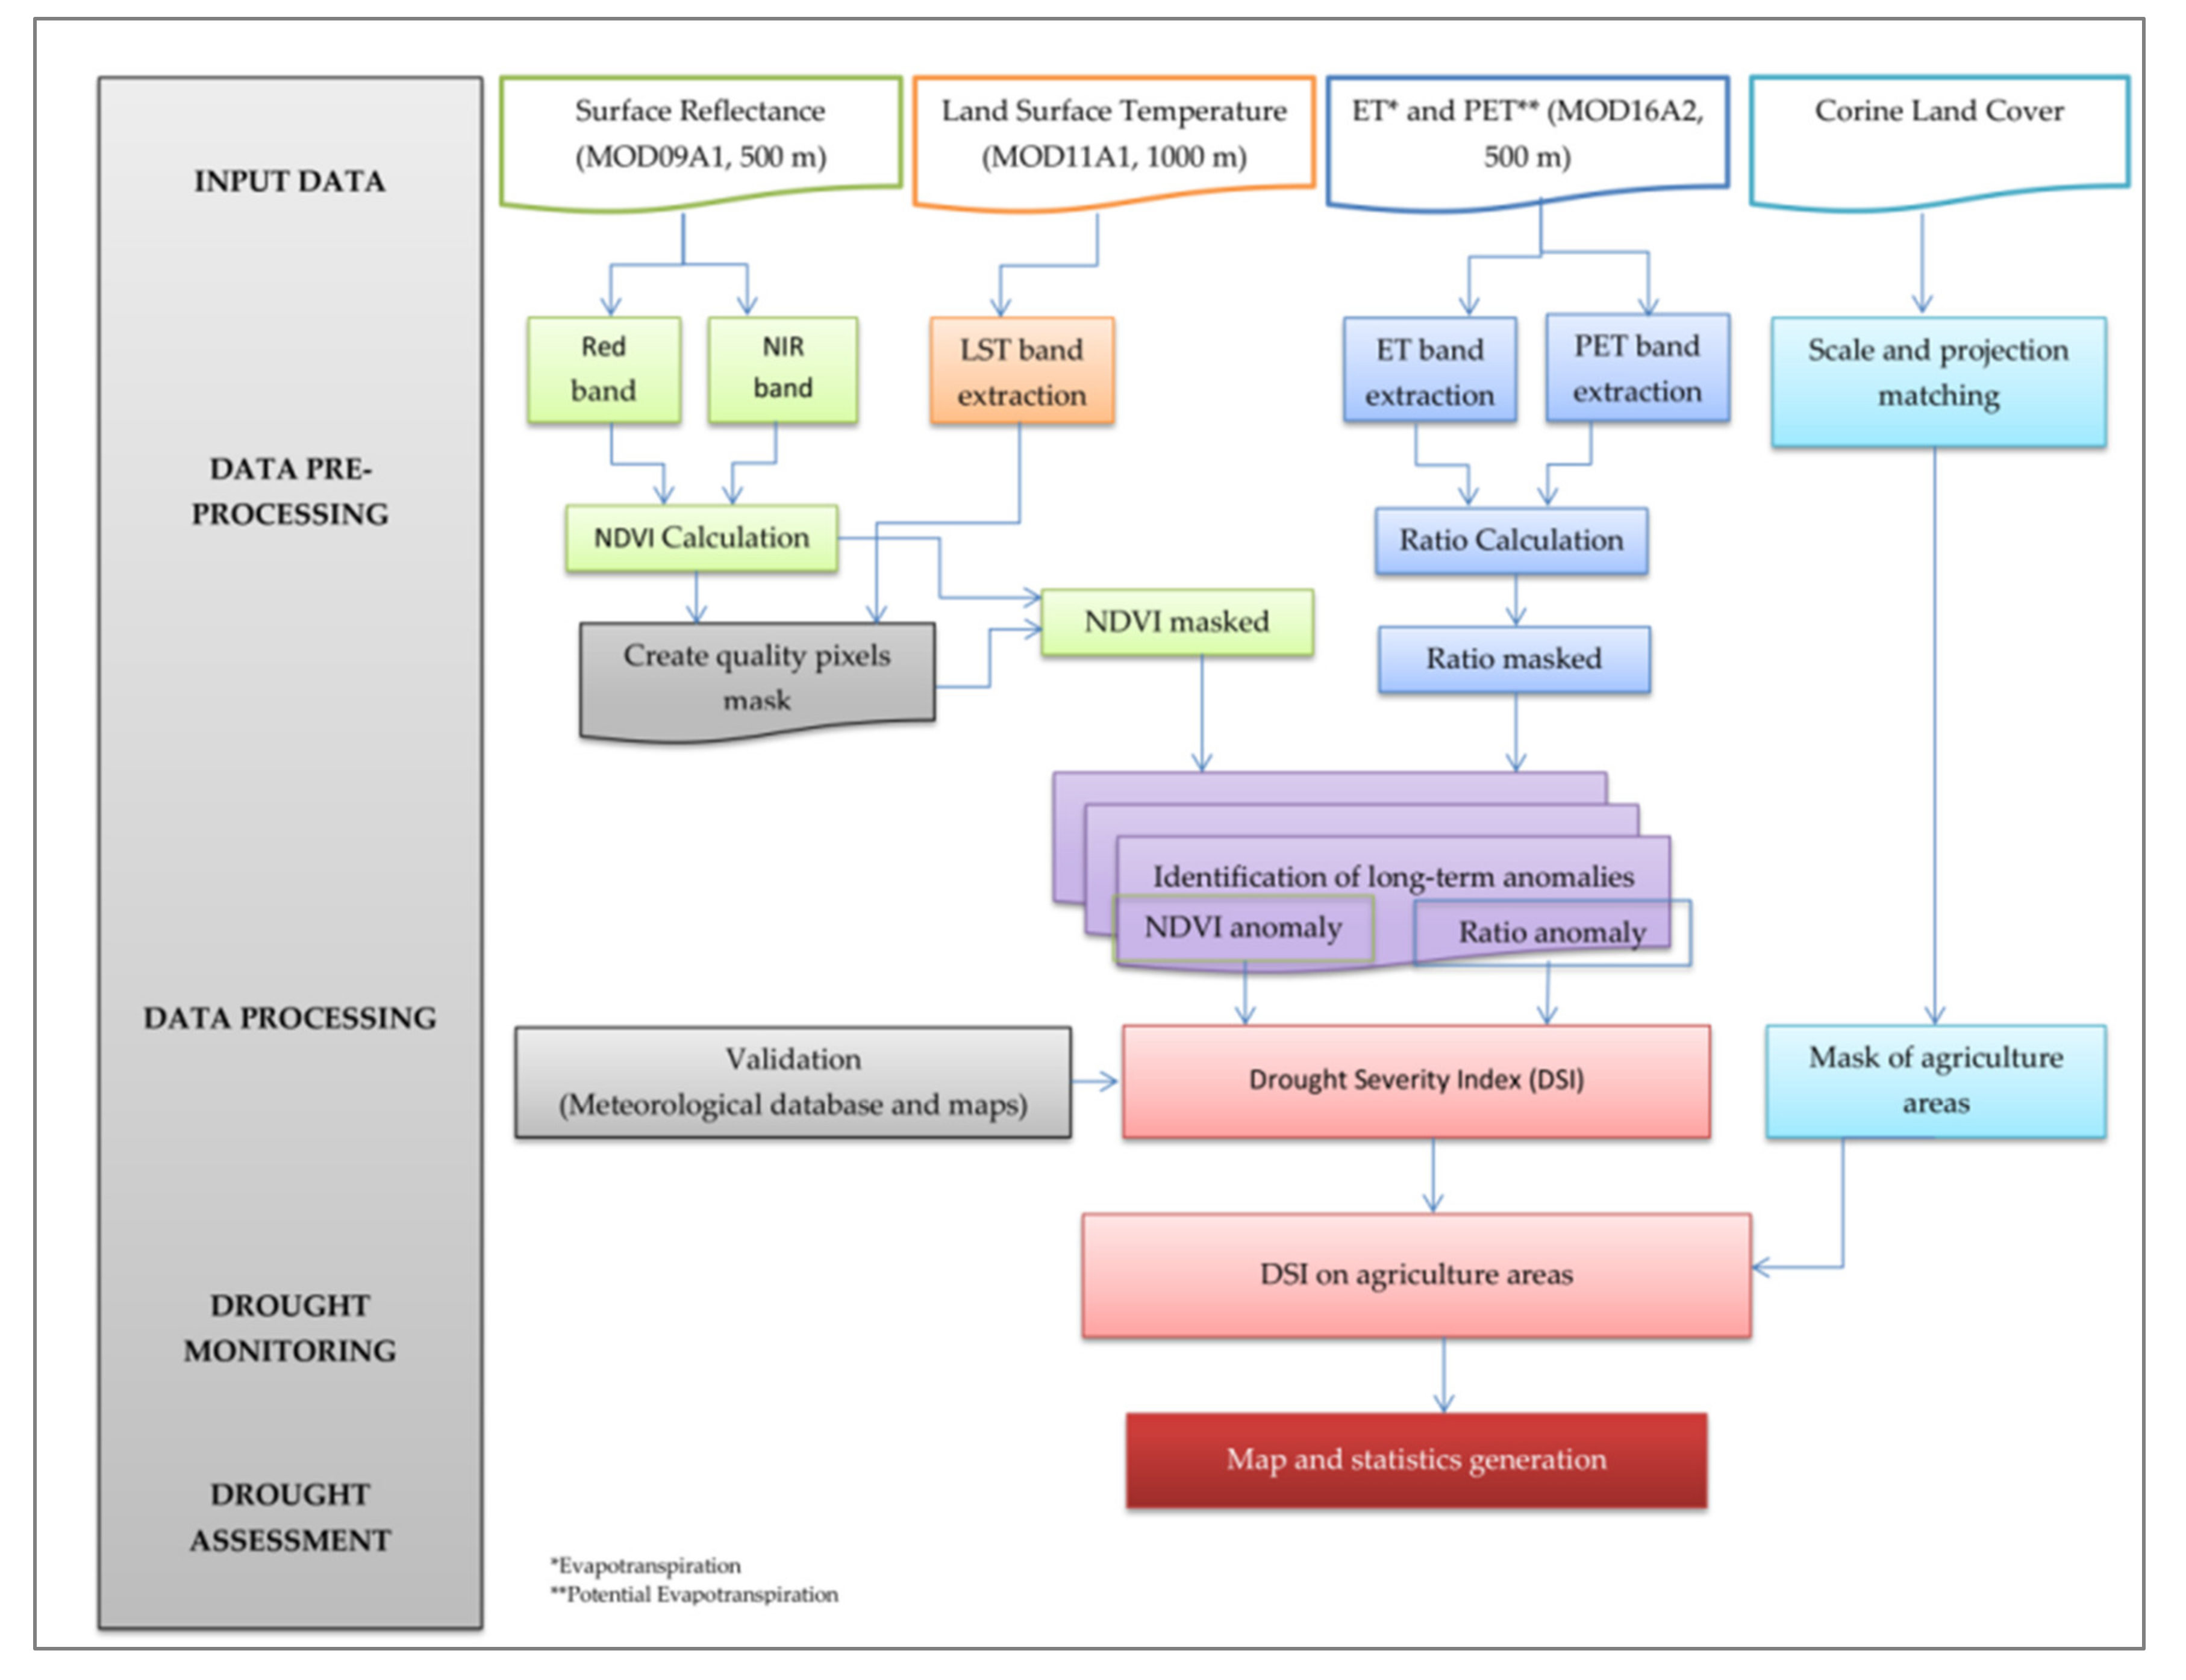
2.3. Methods
- ET—Evapotranspiration;
- PET—Potential Evapotranspiration;
- ET/PET—Ratio;
- —Ratio average (2001–2019);
- —Standard deviation of Ratio (2001–2019);
- NDVI—Normalized Difference Vegetation Index;
- —Average of the NDVI (2001–2019);
- —Standard deviation of NDVI (2001–2019);
- —Standard deviation of z (2001–2019);
- —Average of the z (2001–2019).
3. Results
3.1. Spatial Distribution of DSI, SMA and SPEI
3.2. Drought Frequency According to the Drought Severity Index
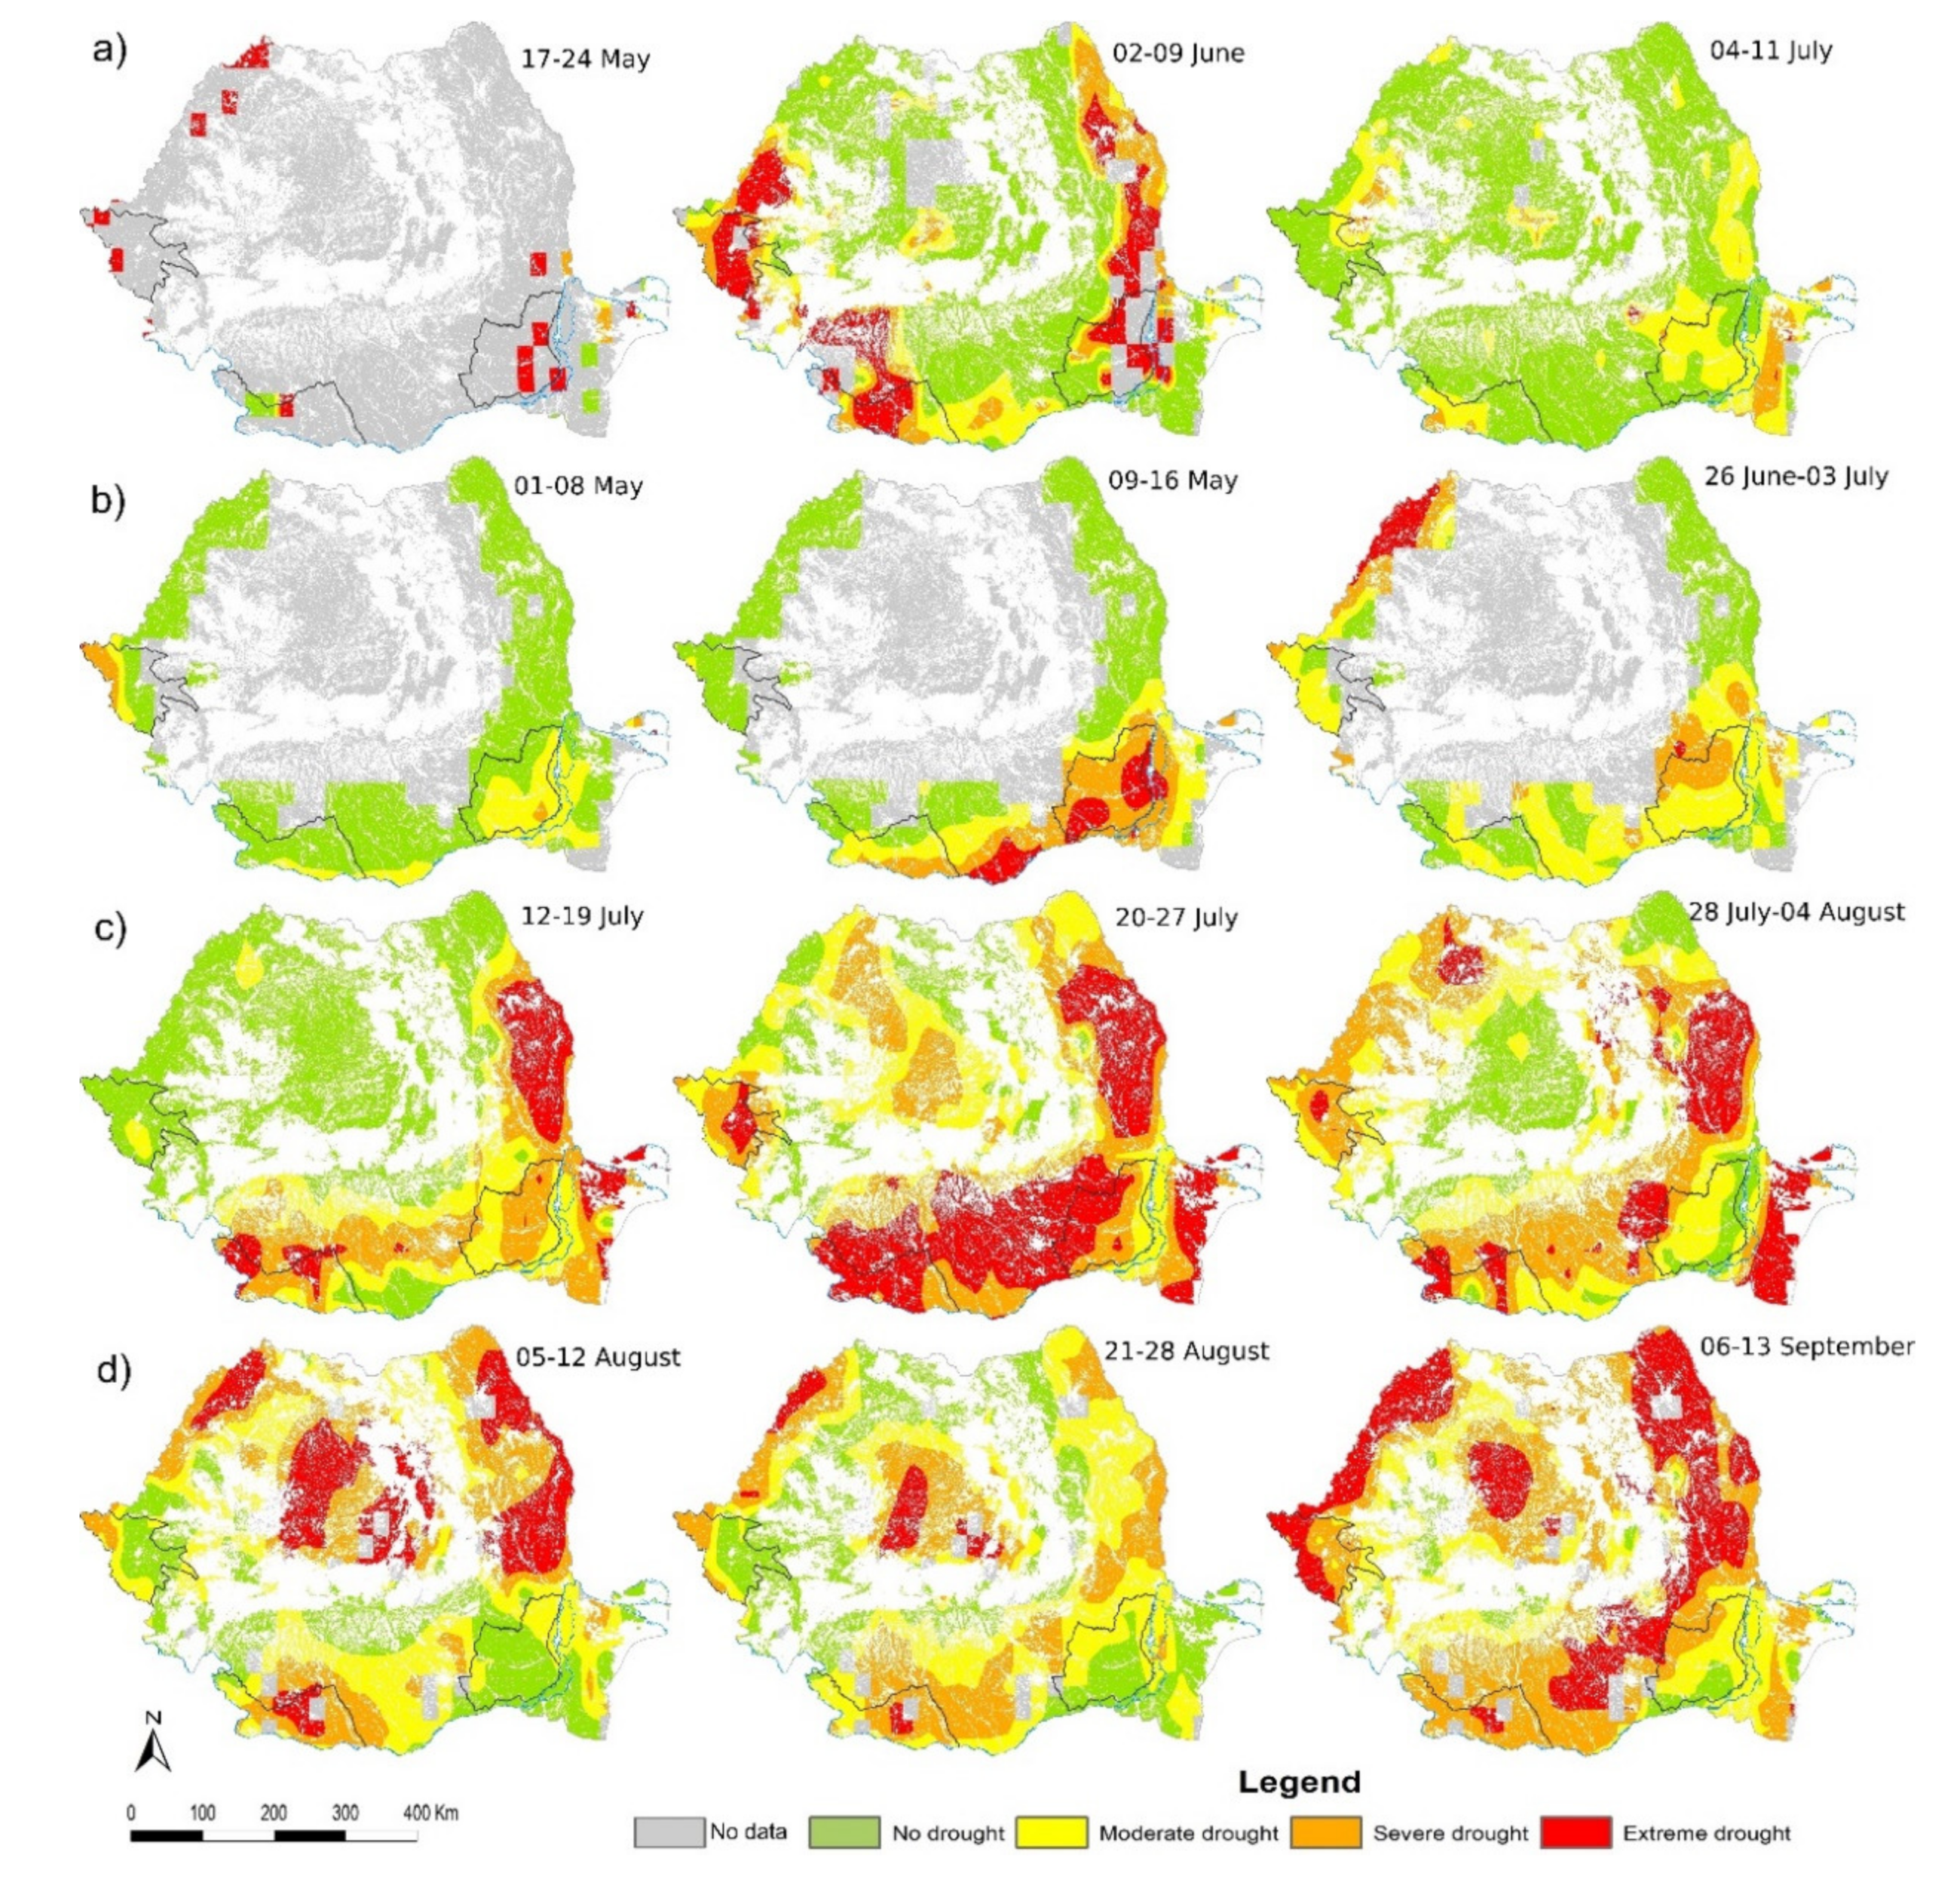
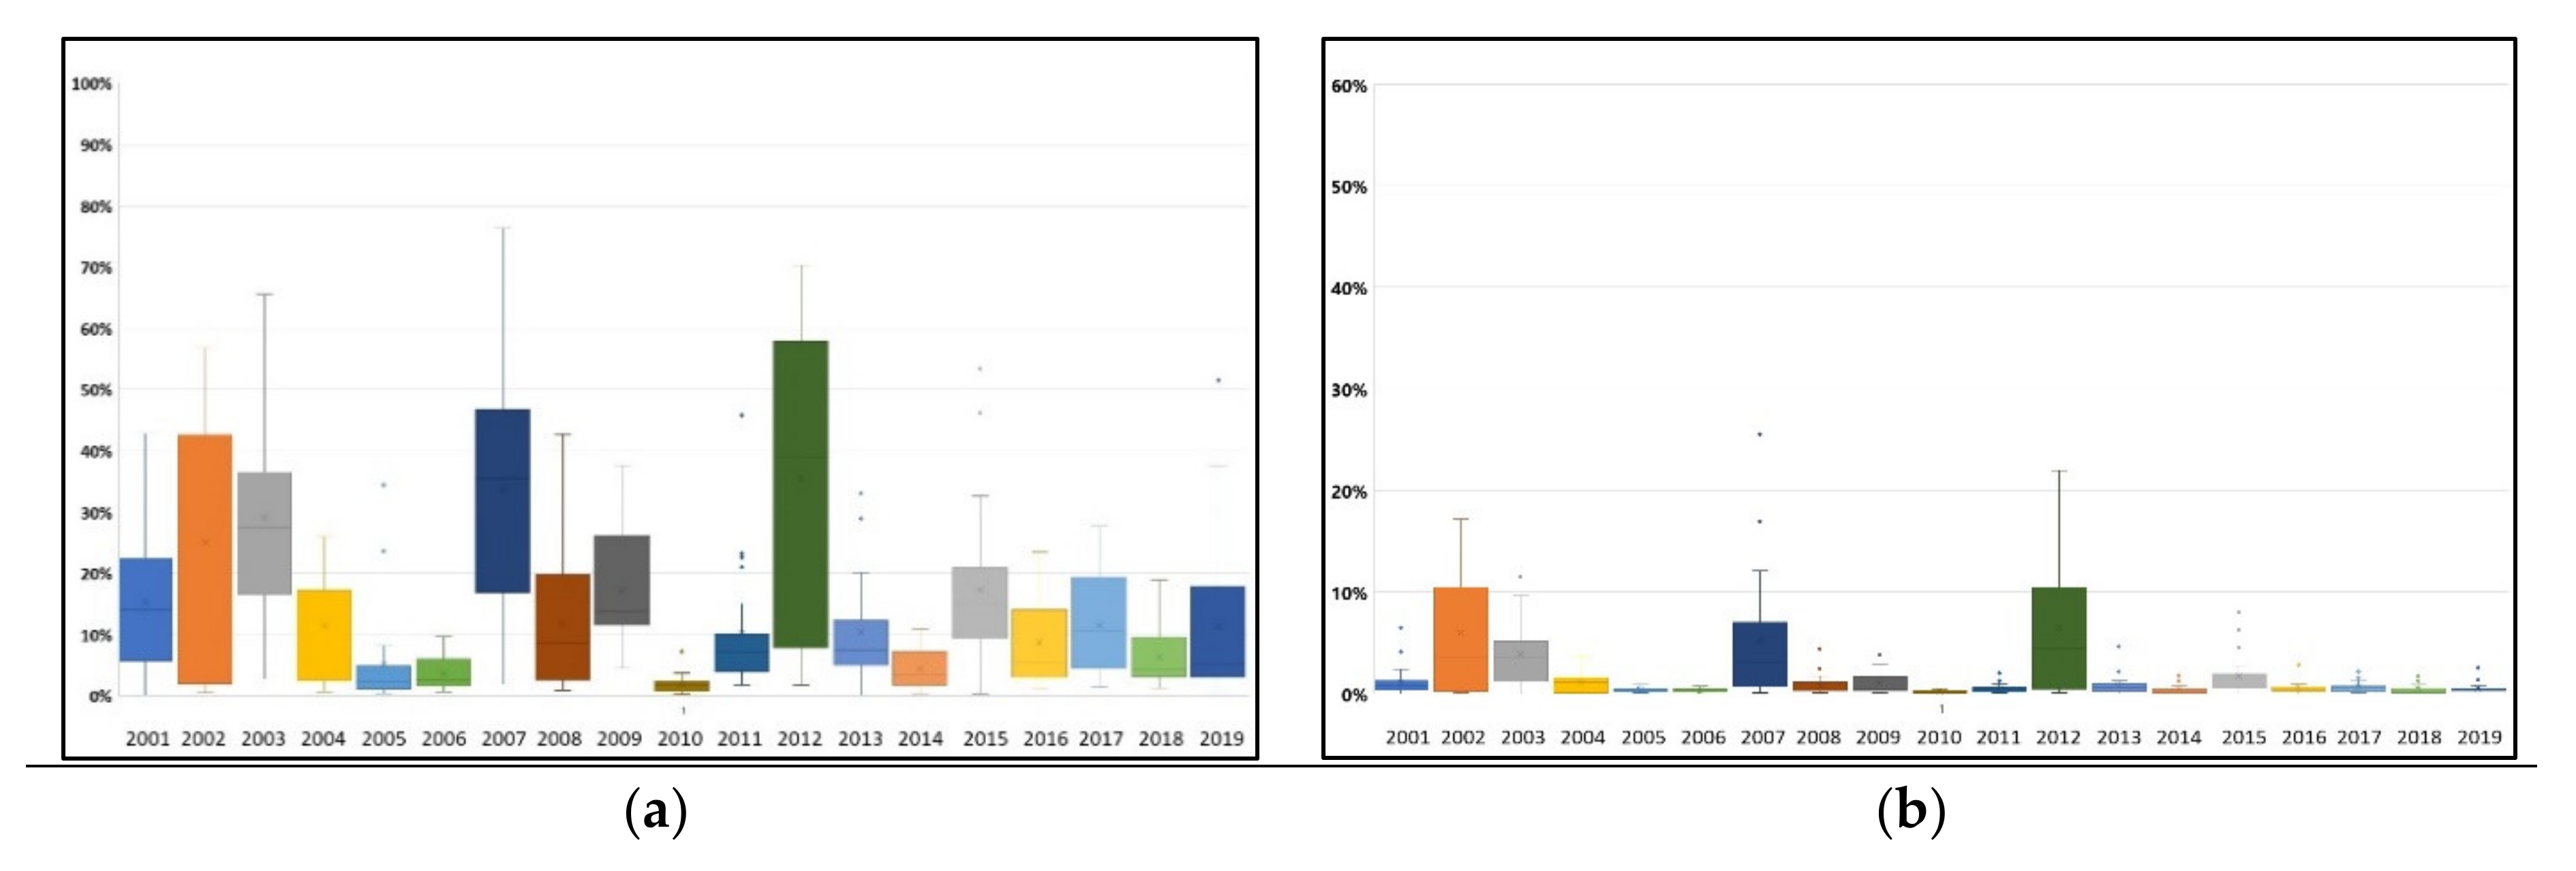
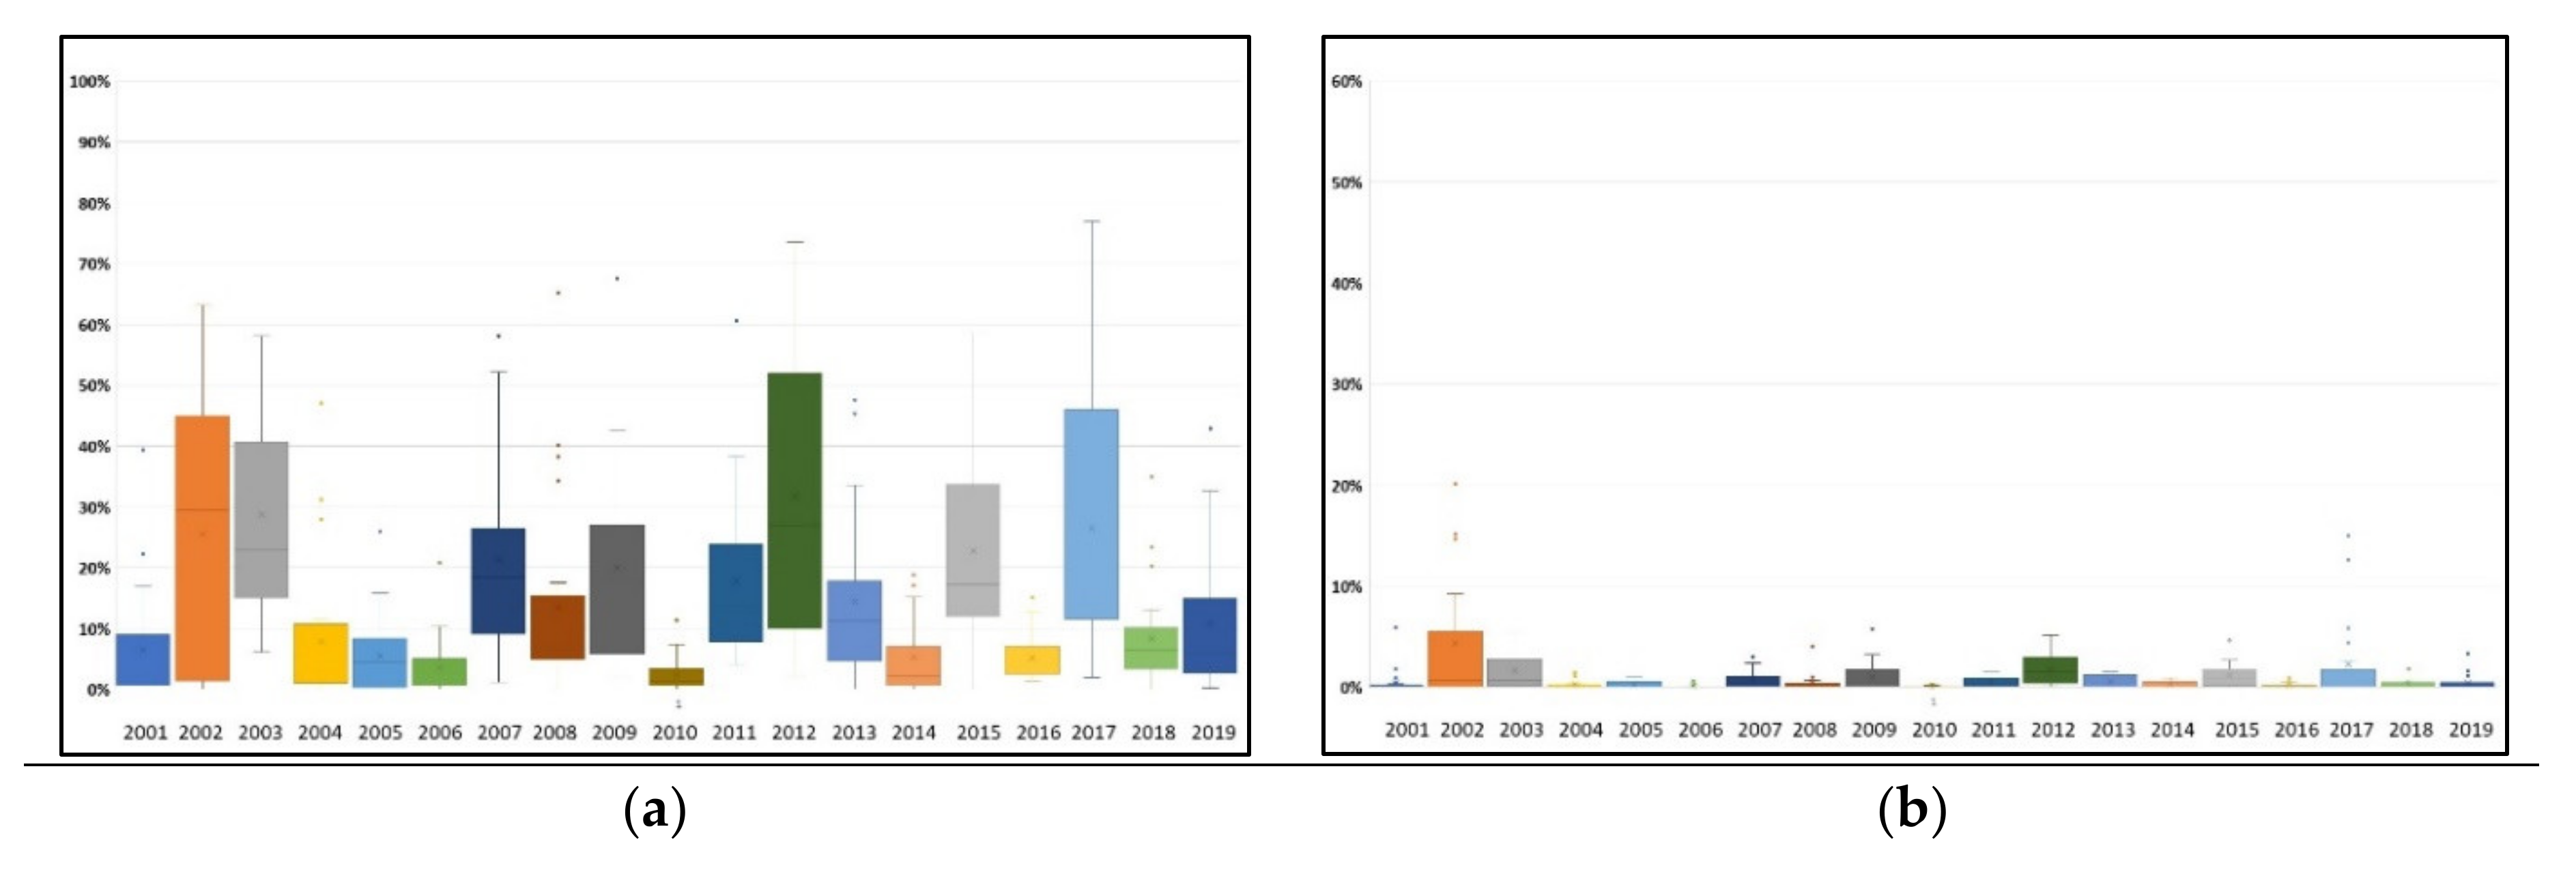
3.3. Drought Variability Over the Last Two Decades
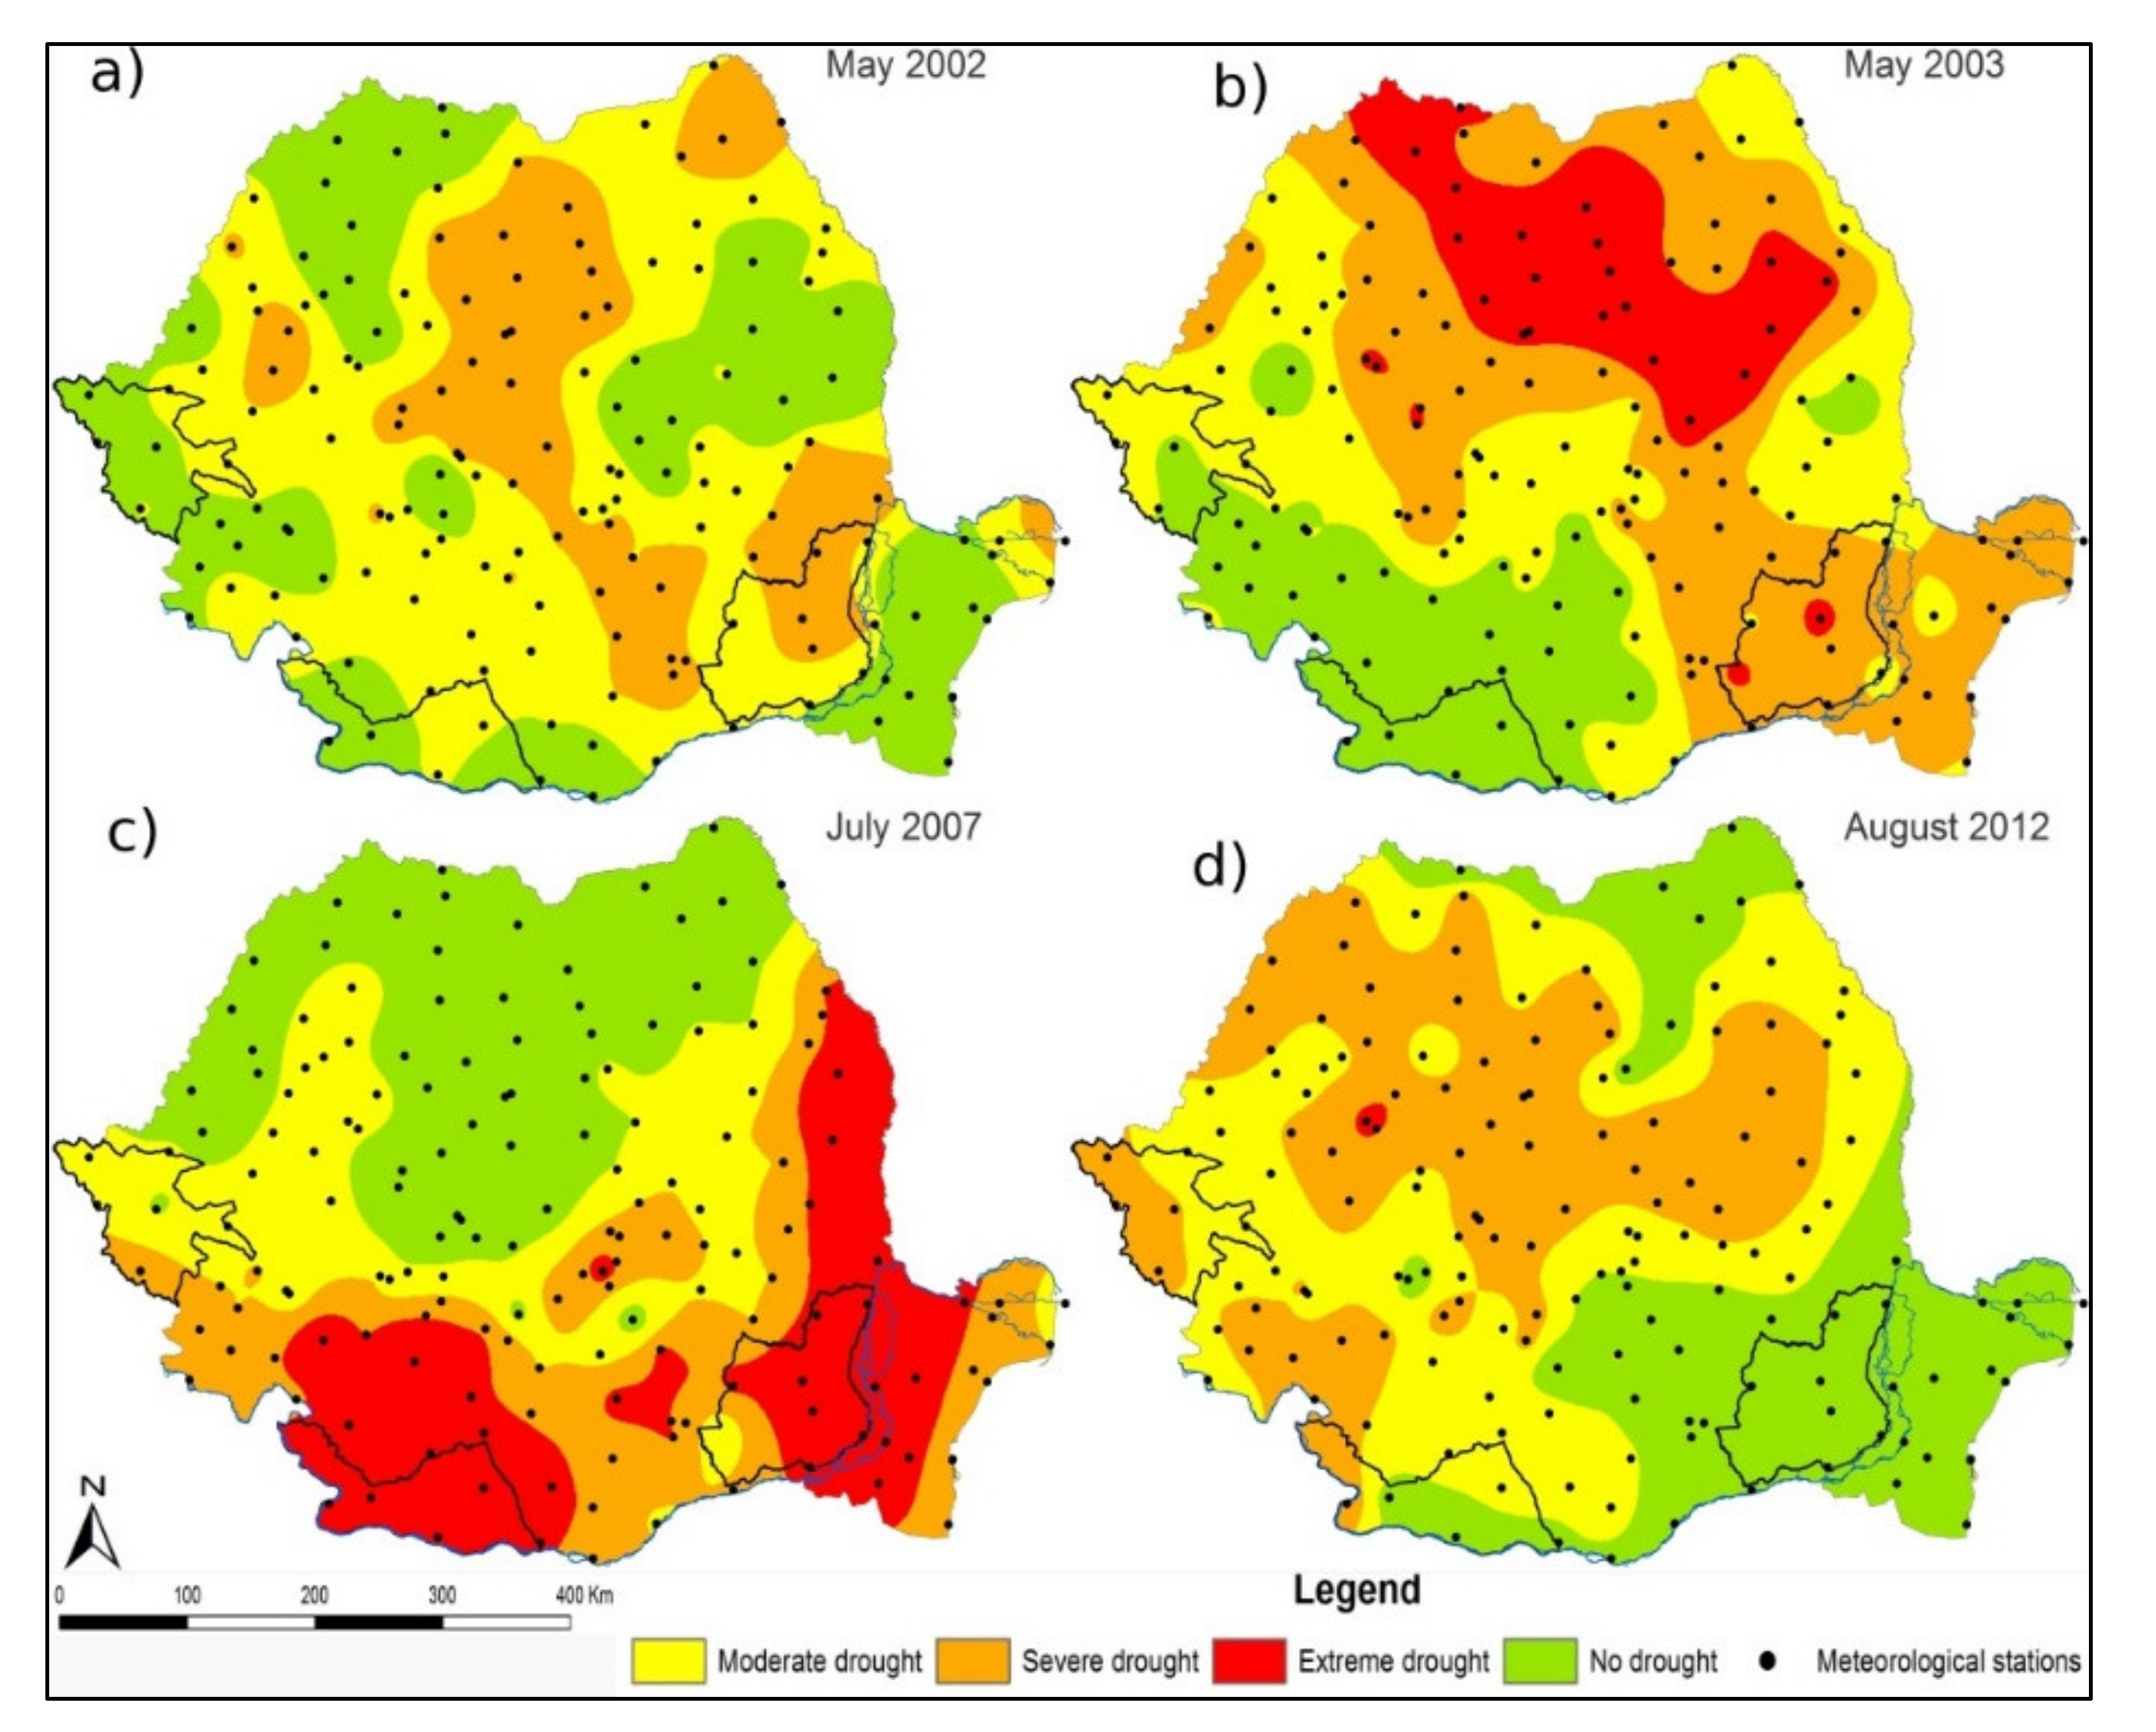
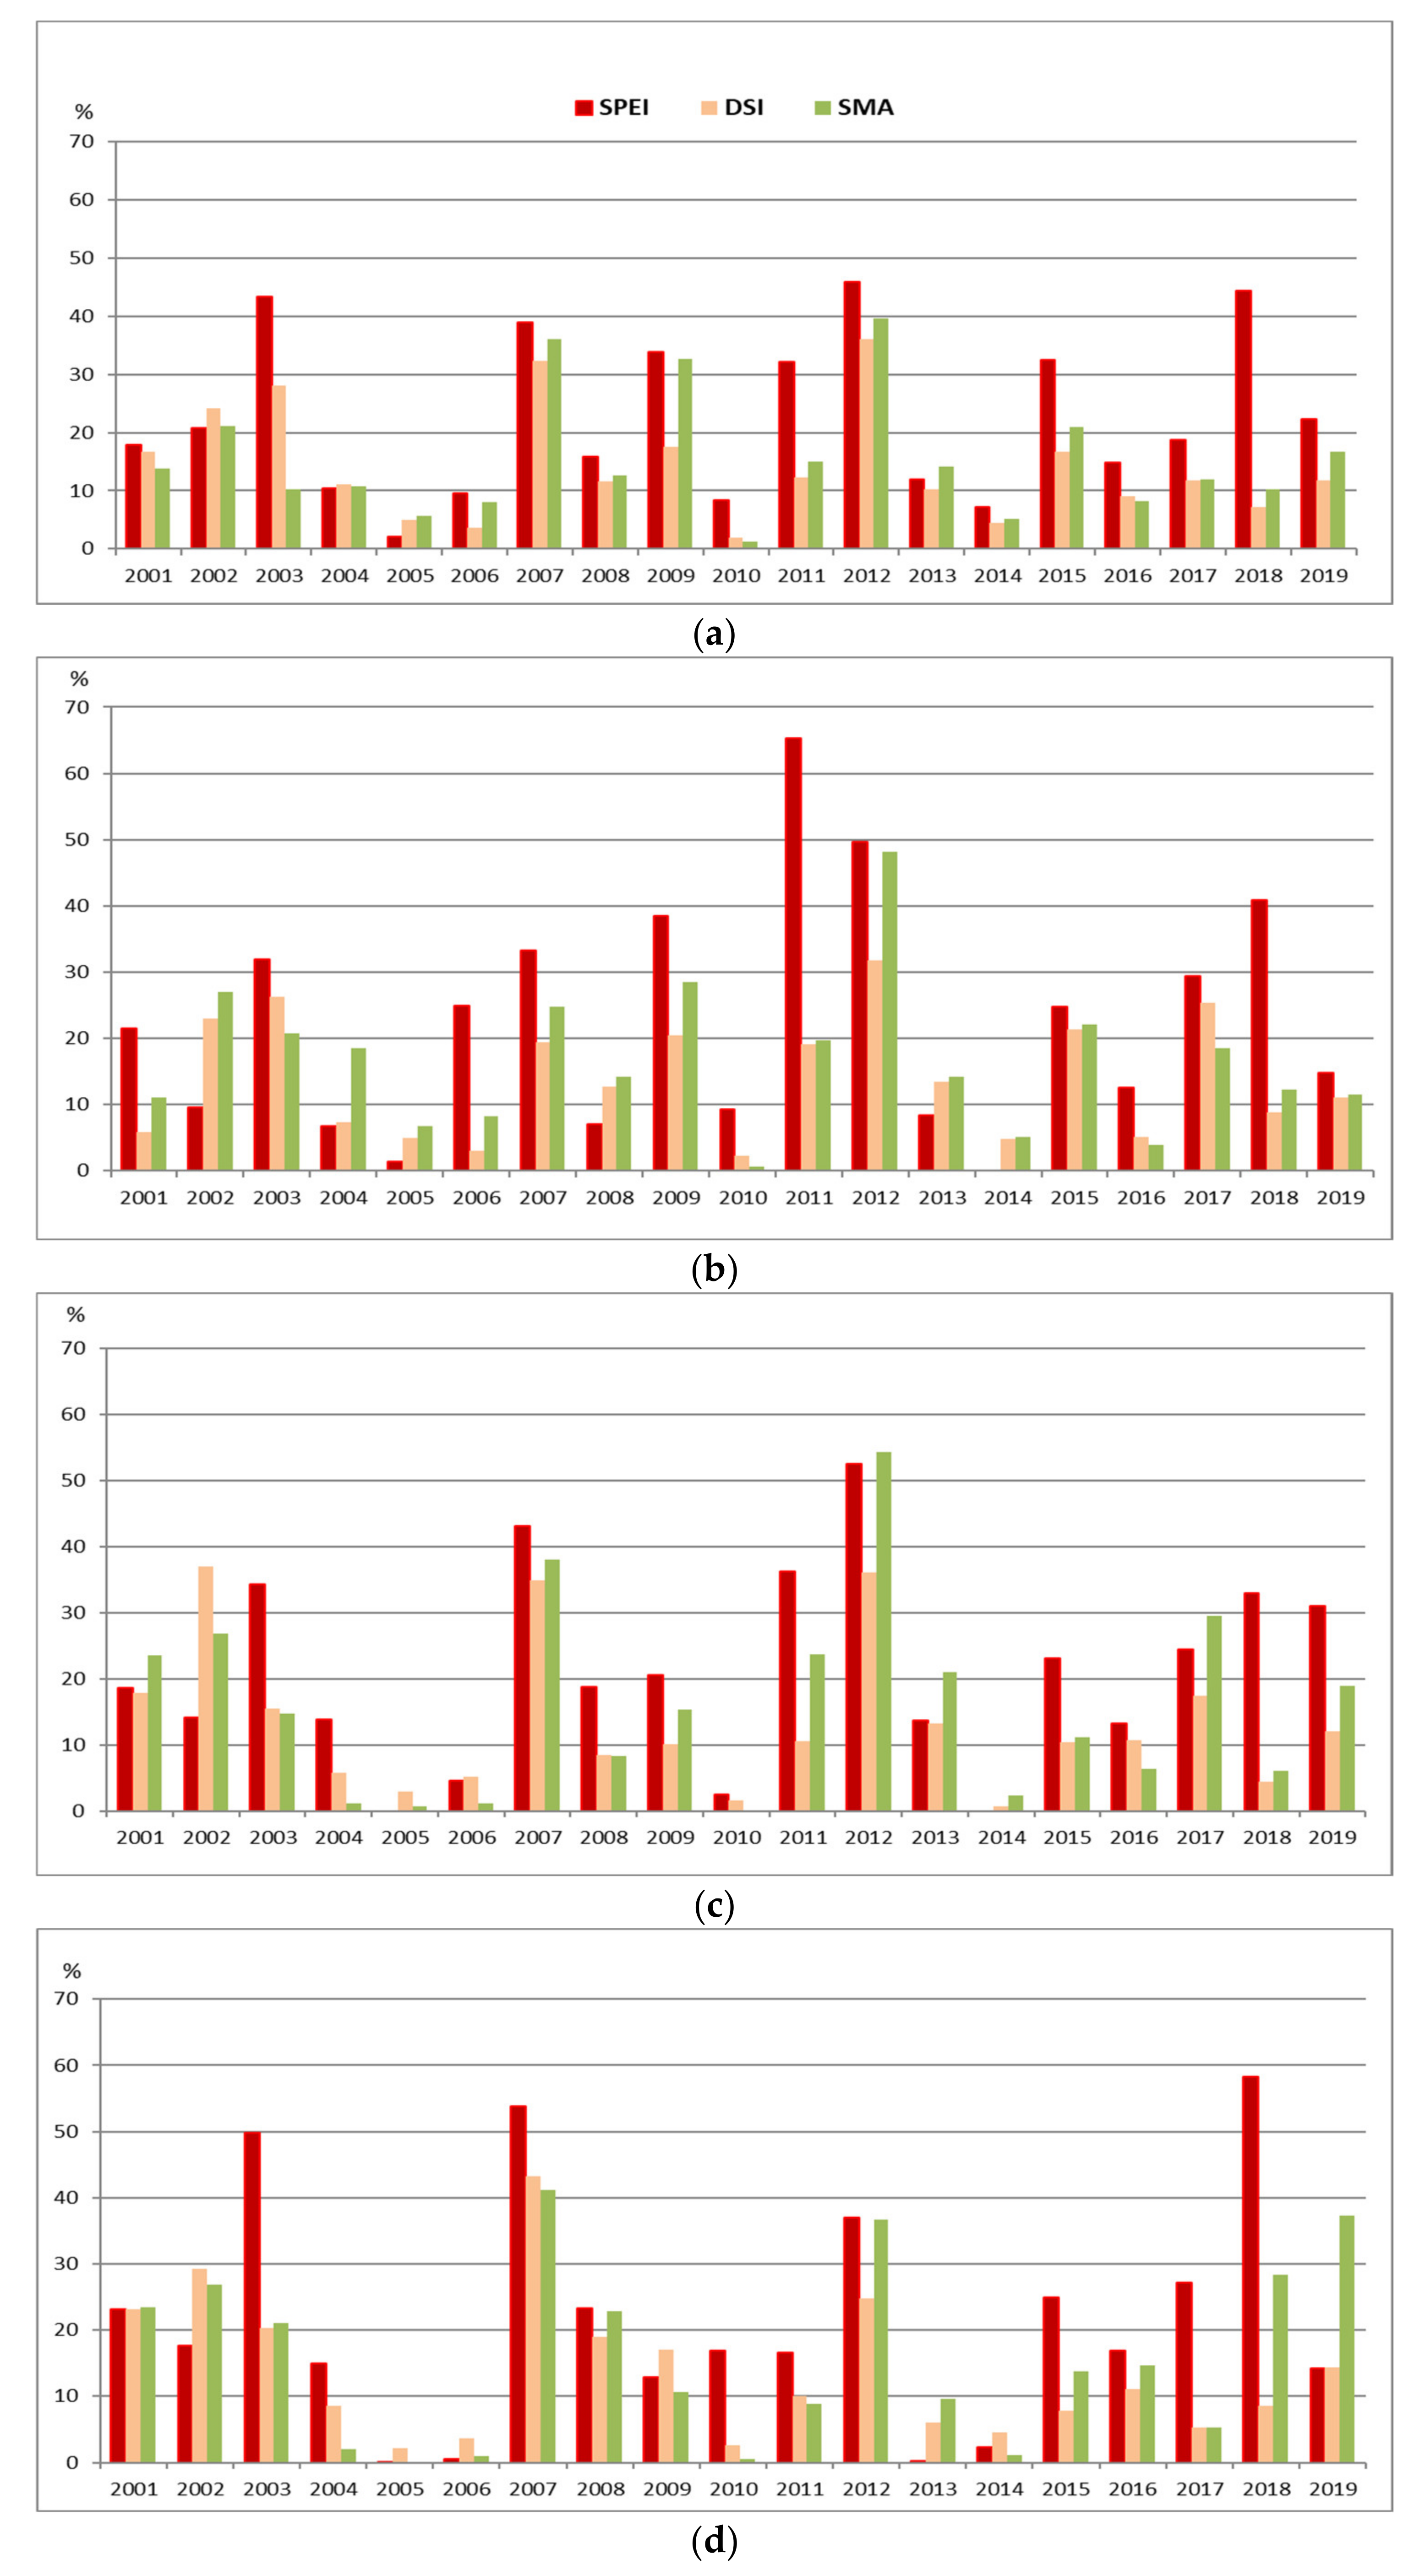
3.4. Drought Severity Index Validation
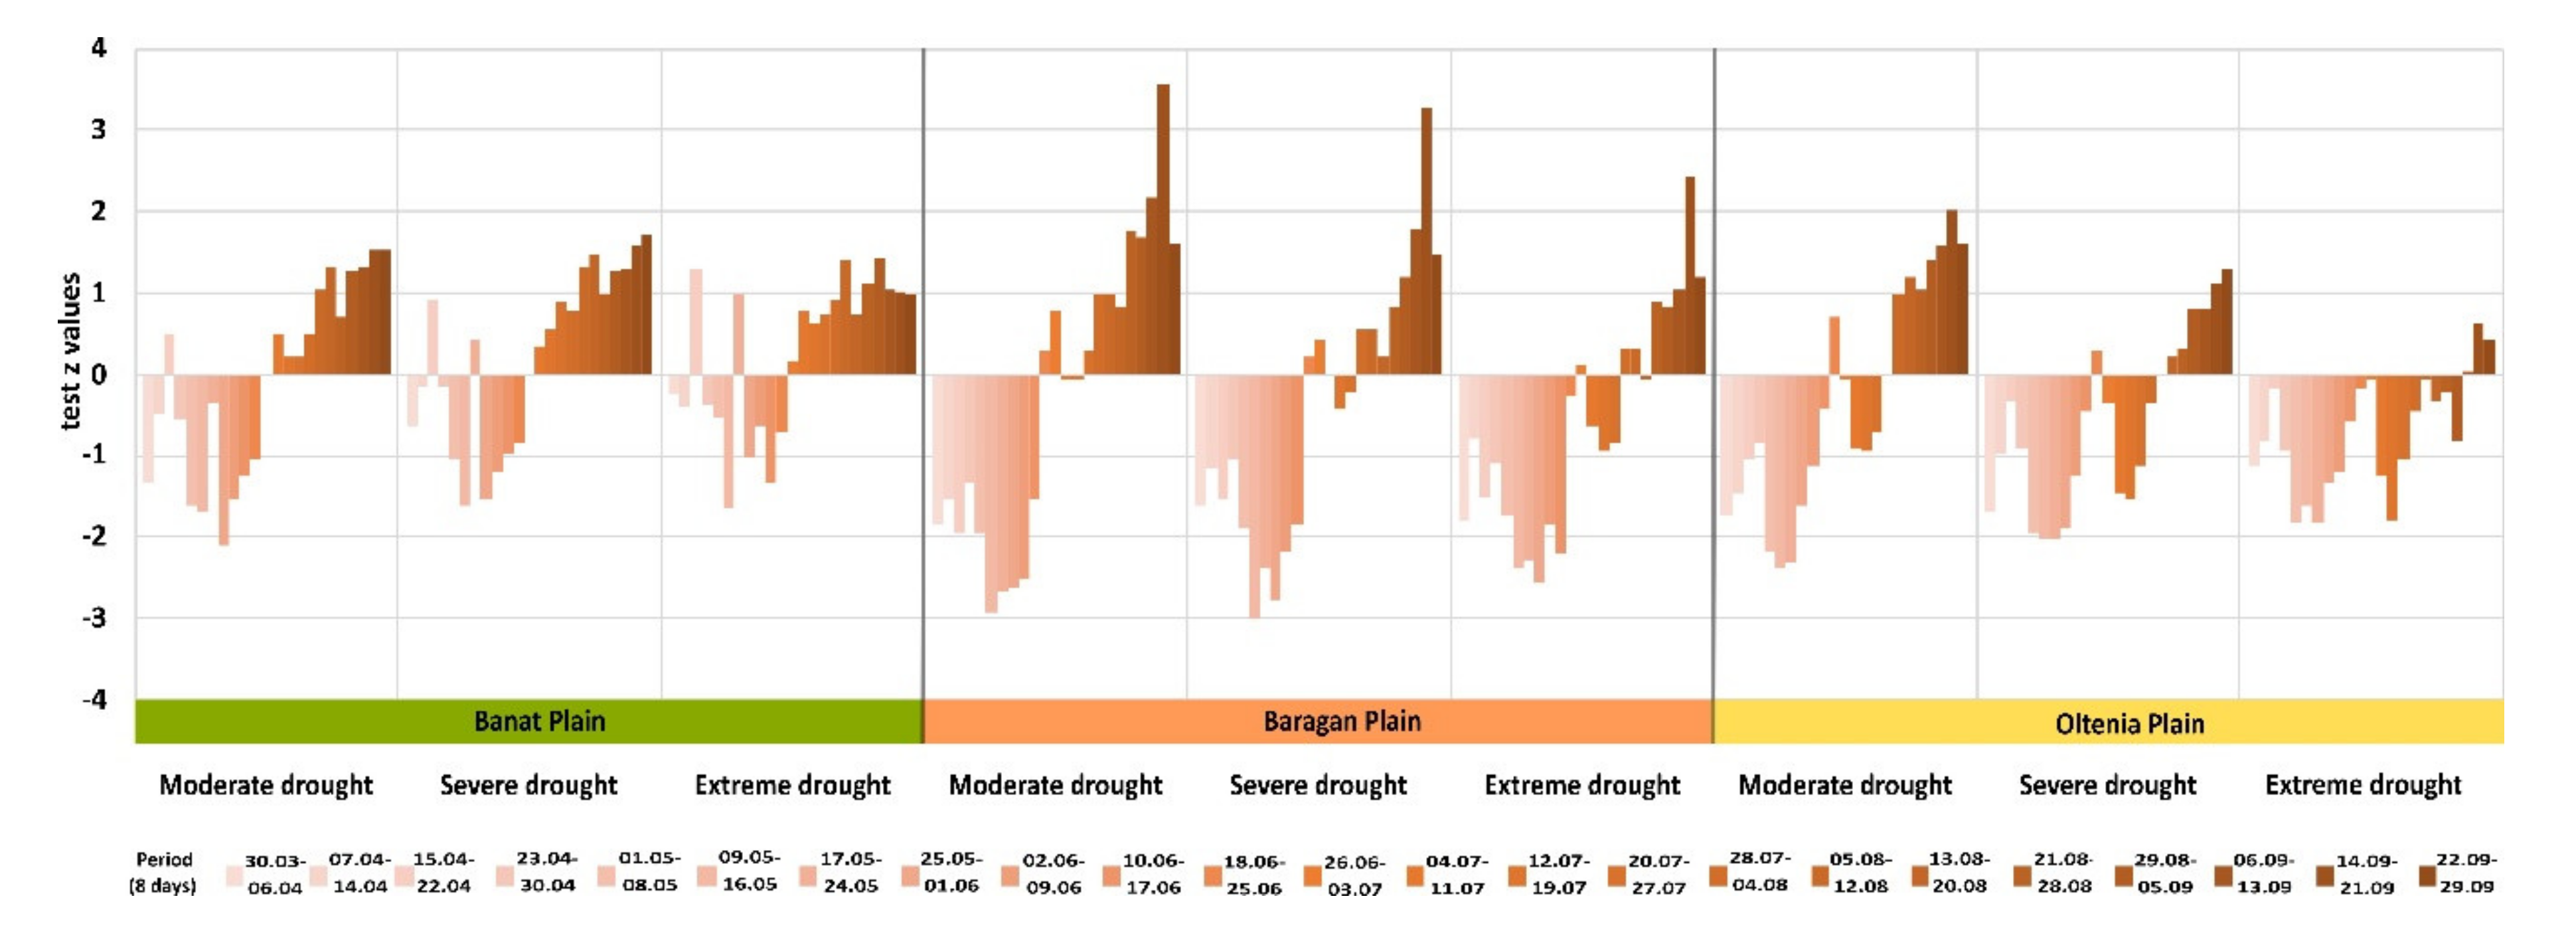
3.5. Drought Severity Index Trend According to the Mann-Kendall Test
4. Discussion
- The DSI takes into account the evapotranspiration, being one of the few remote sensing indices that take into account this parameter in drought analysis;
- The values of DSI are standardized, therefore the results may be comparable to those from other indices;
- DSI is useful to identify the spatial extent of agricultural drought, at 500 m spatial resolution, over different time intervals (weekly, monthly, seasonal etc.);
- It can be applied globally and also locally.
- Cloud cover (especially for daily products) and bare soil (it can offer wrong information-overestimate the drought). The cloud cover is a very well-known problem of the optical images; thus, 8-days synthesis and cloud mask filter have been used.
- Vegetation responds differently to the drought according to phenological phase, being necessary to identify the type of vegetation. The spatial resolution of MODIS data (500 m) does not allow the vegetation identification by species; therefore, limitation could not be solved.
- MK test cannot be applying for DSI on the spatial scale due to existing pixels with missing value.
- The short DSI samples (19), used in this case study, are not enough for the MK test.
5. Conclusions
Supplementary Materials
Author Contributions
Funding
Acknowledgments
Conflicts of Interest
References
- De Jager, A.; Naumann, G.; Vogt, J.V. Drought. In Recommendations for National Risk Assessment for Disaster Risk Management in EU; JRC Report; Publications Office of the European Union: Luxembourg, 2019. [Google Scholar]
- Vogt, J.V.; Naumann, G.; Masante, D.; Spinoni, J.; Cammalleri, C.; Erian, W.; Pischke, F.; Pulwarty, R.; Barbosa, P. Drought Risk Assessment. In A Conceptual Framework; EUR 29464 EN; Publications Office of the European Union: Luxembourg, 2018; ISBN 978-92-79-97469-4. [Google Scholar] [CrossRef]
- Wilhite, D. Preparing for Drought: A Guidebook for Developing Countries; UNEP: Nairobi, Kenya, 1992. [Google Scholar]
- Wilhite, D.; Glantz, M.H. Understanding the Drought Phenomenon: The Role of Definitions. Water Int. 1985, 10, 111–120. [Google Scholar] [CrossRef]
- World Meteorological Organization. International Meteorological Vocabulary; World Meteorological Organization: Geneva, Switzerland, 1992; Volume 182, pp. 1–802. [Google Scholar]
- IPCC. 2018: Summary for Policymakers. In Global Warming of 1.5 °C: An IPCC Special Report on the Impacts of Global Warming of 1.5 °C above Pre-Industrial Levels and Related Global Greenhouse Gas Emission Pathways, in the Context of Strengthening the Global Response to the Threat of Climate Change, Sustainable Development, and Efforts to Eradicate Poverty; Masson-Delmotte, V.P., Zhai, H.-O., Pörtner, D., Roberts, J., Skea, P.R., Shukla, A., Pirani, W., Moufouma-Okia, C., Péan, R., Pidcock, S., et al., Eds.; World Meteorological Organization: Geneva, Switzerland, 2018; p. 32. [Google Scholar]
- Palmer, W.C. Meteorological Drought; Research Paper; US Weather Bureau: Washington, DC, USA, 1965; Volume 45. [Google Scholar]
- Alley, W.M. The Palmer Drought Severity Index: Limitations and Assumptions. J. Clim. Appl. Meteorol. 1984, 23, 1100–1109. [Google Scholar] [CrossRef]
- Spinoni, J. Global Precipitation Climatology Centre and Potential Evapotranspiration Data from the Climate Research Unit of the University of East Anglia (CRUTSv3.20), WAD3-JRC. 2015. Available online: https://wad.jrc.ec.europa.eu/patternsaridity (accessed on 21 August 2020).
- McKee, T.B.; Doesken, N.J.; Kleist, J. The Relationship of Drought Frequency and Duration to Time Scales. In Proceedings of the 8th Conference on Applied Climatology, Anaheim, CA, USA, 17–22 January 1993. [Google Scholar]
- Vicente-Serrano, S.M.; Beguería, S.; López-Moreno, J.I. A Multi-scalar drought index sensitive to global warming: The Standardized Precipitation Evapotranspiration Index—SPEI. J. Clim. 2010, 23, 1696–1718. [Google Scholar] [CrossRef]
- West, H.; Quinn, N.; Horswell, M. Remote sensing for drought monitoring & impact assessment: Progress, past challenges and future opportunities. Remote Sens. Environ. 2019, 232, 1–14. [Google Scholar] [CrossRef]
- Svoboda, M.; Fuchs, B.A. Handbook of Drought Indicators and Indices; World Meteorological Organization and Global Water Partnership: Geneva, Switzerland, 2016. [Google Scholar]
- Reinermann, S.; Gessner, U.; Asam, S.; Kuenzer, C.; Dech, S. Analysis Based on Two Decades of Satellite Earth Observation Time Series and Crop Yield Statistics. Remote Sens. 2019, 11, 1783. [Google Scholar] [CrossRef]
- Podaebradská, M.; Wylie, B.; Hayes, M.J.; Wardlow, B.; Bathke, D.; Bliss, N.; Dahal, D. Monitoring Drought Impact on Annual Forage Production in Semi-Arid Grasslands: A Case Study of Nebraska Sandhills. Remote Sens. 2019, 11, 2106. [Google Scholar] [CrossRef]
- Zhang, L.; Yao, Y.; Bei, X.; Jia, K.; Zhang, X.; Xie, X.; Jiang, B.; Shang, K.; Xu, J.; Chen, X. Assessing the Remotely Sensed Evaporative Drought Index for Drought Monitoring over Northeast China. Remote Sens. 2019, 11, 1960. [Google Scholar] [CrossRef]
- Drought Management Centre for South-Eastern. Available online: http://www.dmcsee.org/en/home/ (accessed on 21 March 2020).
- U.S. Drought Monitor. Available online: https://droughtmonitor.unl.edu/ (accessed on 15 April 2020).
- European Drought Observatory. Available online: https://edo.jrc.ec.europa.eu/ (accessed on 20 April 2020).
- Global Drought Information System. Available online: https://www.drought.gov/gdm/content/welcome (accessed on 20 March 2020).
- Copernicus Global Drought Observatory. Available online: https://edo.jrc.ec.europa.eu/gdo/php/index.php?id=2000 (accessed on 20 March 2020).
- Sepulcre-Canto, G.; Horion, S.; Singleton, A.; Carrao, H.; Vogt, J.V. Development of a Combined Drought Indicator to detect agricultural drought in Europe. Nat. Hazards Earth Syst. Sci. 2012, 12, 3519–3531. [Google Scholar] [CrossRef]
- Drought Risk in the Danube Region. Available online: https://droughtwatch.eu/ (accessed on 2 July 2020).
- National Meteorological Administration. Available online: http://www.meteoromania.ro/despre-noi/cercetare/agrometeorologie/ (accessed on 30 April 2020).
- EUROSTAT. Statistics Explained. Available online: https://ec.europa.eu/eurostat/statistics-explained/pdfscache/26212.pdf (accessed on 15 June 2020).
- Alexandru, D.; Mateescu, E.; Tudor, R.; Leonard, I. Analysis of agroclimatic resources in Romania in the current and foreseeable climate change –concept and methodology of approaching. Agron. Ser. Sci. Res. 2019, 61, 221–229. [Google Scholar]
- Mateescu, E.; Smarandache, M.; Jeler, N.; Apostol, V. Drought conditions and management strategies in Romania. In Initiative on “Capacity Development to Support National Drought Management Policy” (WMO, UNCCD, FAO and UNW-DPC) Country Report, Romania, Bucharest, 2013. [Google Scholar]
- Carrão, H.; Naumann, G.; Barbosa, P. Mapping global patterns of drought risk: An empirical framework based on sub-national estimates of hazard, exposure and vulnerability. Glob. Environ. Chang. 2016, 39, 108–124. [Google Scholar] [CrossRef]
- Sima, M.; Popovici, E.A.; Balteanu, D.; Micu, D.M.; Kucsicsa, G.; Dragota, C.; Grigorescu, I. A farmer-based analysis of climate change adaptation options of agriculture in the Baragan Plain, Romania. Earth Perspect. 2015, 2, 1–21. [Google Scholar] [CrossRef]
- Ontel, I.; Vladut, A. Impact of drought on the productivity of agricultural crops within the Oltenia Plain, Romania. Geogr. Pannonica 2015, 19, 9–19. [Google Scholar] [CrossRef]
- Popa, V.; Borza, I. The Evolution of the Pluviometric Conditions in Connection with the Development of the Drought Phenomenon in the Plain of Banat. Bul. USAMV-CN 2006, 62, 132–137. [Google Scholar]
- Nichita, C.; Hauer, E.; Mircov, V. Analysis of the 2011 drought in western Romania. Res. J. Agric. Sci. 2014, 46, 38–46. [Google Scholar]
- Nertan, A.T.; Panaitescu, M.; Stancalie, G.; Irimescu, A.; Flueraru, C.; Panaitescu, V. Analysis of drought phenomenon using remote sensing data in Romania. In Recent Advances in Energy, Environment, Economics and Technological Innovation, Proceedings of the 4th International Conference on Development, Energy, Environment, Economics—DEEE’13, Paris, France, 29–31 October 2013; Neck, R., Ed.; WSEAS Press: Paris, France, 2013; pp. 204–213. ISBN 978-960-474-343-8. ISSN 227-4588. [Google Scholar]
- Stancalie, G.; Nertan, A.T.; Serban, F. Agricultural Drought Monitoring Using Satellite—Based Products in Romania. In Proceedings of the Third International Conference on Telecommunications and Remote Sensing, Luxembourg, 26–27 June 2014; ICTRS, SCITEPRESS: Luxembourg, 2014; Volume 1, pp. 100–106, ISBN 978-989-758-033-8. [Google Scholar] [CrossRef]
- Angearu, C.-V.; Irimescu, A.; Mihailescu, D.; Virsta, A. Evaluation of Droughts and Fires in the Dobrogea Region, Using Modis Satellite Data. Agric. Life Life Agric. Conf. Proc. 2018, 1, 336–345. [Google Scholar] [CrossRef][Green Version]
- Numerical Terradynamic Simulation Group (NTSG). Available online: https://www.ntsg.umt.edu/default.php (accessed on 30 April 2020).
- Mu, Q.; Zhao, M.; Kimball, J.; Running, S. MODIS Global Terrestrial Drought Severity Index. Available online: https://www.ntsg.umt.edu/project/modis/dsi.php (accessed on 30 April 2020).
- Nicholson, S.E.; Tucker, C.J.; Ba, M.B. Desertification, drought, and surface vegetation: An example from the West African Sahel. Bull. Am. Meteor. Soc. 1998, 79, 815–829. [Google Scholar] [CrossRef]
- Mu, Q.; Zhao, M.; KiMbal, J.S.; Mcdowell, N.G.; Running, S.W. A Remotely Sensed Global Terrestrial Drought Severity Index. Bull. Am. Meteor. Soc. 2013, 94, 83–98. [Google Scholar] [CrossRef]
- Bordun, C.; Nertan, A.T.; Cimpeanu, S.M. Evolution of Vegetation Fraction Cover in Agricultural Areas Affected by Prellonged Droughts in the South Regions of Romania. Agric. Life Life Agric. 2018. [Google Scholar] [CrossRef][Green Version]
- Pravalie, R.; Sîrodoev, I.; Peptenatu, D. Detecting climate change effects on forest ecosystems in Southwestern Romania using Landsat TM NDVI data. J. Geogr. Sci. 2014, 24, 815–832. [Google Scholar] [CrossRef]
- Ministerul Agriculturii și Dezvoltării Rurale. Available online: https://www.madr.ro/docs/agricultura/agricultura-romaniei-2015.pdf (accessed on 10 May 2020).
- CORINE Land Cover. Available online: https://land.copernicus.eu/pan-european/corine-land-cover/clc2018 (accessed on 20 February 2020).
- Administratia Nationala de Meteorologie. Clima Romaniei; Editura Academiei Române: Bucuresti, Romania, 2008; p. 365. [Google Scholar]
- Fraser, E.D.; Stringer, L.C. Explaining agricultural collapse: Macro-forces, micro-crises and the emergence of land use vulnerability in southern Romania. Glob. Environ. Chang. 2009, 19, 45–53. [Google Scholar] [CrossRef]
- Sandu, I.; Mateescu, E.; Vătămanu, V.V. Schimbări Climatice în România şi Efectele Asupra Agriculturii; Sitech: Craiova, Romania, 2010; p. 406. [Google Scholar]
- Balteanu, D.; Dragota, C.; Popovici, A.; Dumitrascu, M.; Kucsicsa, G.; Grigorescu, I. Land use and crop dynamics related to climate change signals during the post-communist period in the south Oltenia, Romania. Proc. Rom. Acad. 2013, 15, 265–278. [Google Scholar]
- Dumitrascu, M.; Mocanu, I.; Mitrica, B.; Dragota, C.; Grigorescu, I.; Dumitrica, C. The assessment of socio-economic vulnerability to drought in Southern Romania (Oltenia Plain). Int. J. Disaster Risk Reduct. 2018, 27, 142–154. [Google Scholar] [CrossRef]
- Popovici, E.A.; Costache, A.; Balteanu, D.; Dogaru, D.; Sima, M. Vulnerability Assessment of Rural Communities to Floods in the Western Part of Romania (Banat Plain). Int. Multidiscip. Sci. GeoConf. SGEM 2013, 1, 1161. [Google Scholar]
- National Institute of Statistics. Available online: https://insse.ro/cms/ (accessed on 20 January 2020).
- Wan, Z. MODIS Land Surface Temperature Products Users’ Guide. 2013. Available online: https://lpdaac.usgs.gov/documents/118/MOD11_User_Guide_V6.pdf (accessed on 20 January 2020).
- Vermote, E. MOD09A1 MODIS/Terra Surface Reflectance 8-Day L3 Global 500 m SIN Grid V006. [Data Set], NASA EOSDIS Land Processes DAAC. 2015. Available online: https://lpdaac.usgs.gov/products/mod09a1v006/ (accessed on 20 January 2020).
- Running, S.; Mu, Q.; Zhao, M. “MOD16A2 MODIS/Terra Net Evapotranspiration 8-Day L4 Global 500 m SIN Grid V006 [Data Set].” NASA EOSDIS Land Processes DAAC. 2017. Available online: https://lpdaac.usgs.gov/products/mod16a2v006/ (accessed on 20 February 2020).
- Earth Data. NASA’s Earth Science Data Systems. Available online: https://earthdata.nasa.gov/ (accessed on 15 January 2020).
- Vermote, E.F.; Roger, J.C.; Ray, J.P. MOD09A1—MODIS/Terra Surface Reflectance 8-Day L3 Global 500 m SIN Grid. 2015. Available online: http://modis-sr.ltdri.org/guide/MOD09_UserGuide_v1.4.pdf (accessed on 20 February 2020).
- Mu, Q.; Zhao, M.; Running, S.W. Improvements to a MODIS global terrestrial evapotranspiration algorithm. Remote Sens. Environ. 2011, 115, 1781–1800. [Google Scholar] [CrossRef]
- Monteith, J.L. Evaporation and environment. Symp. Soc. Exp. Biol. 1965, 19, 205–224. [Google Scholar]
- Kidd, R.; Scanlon, T.; Chung, D.; Paulik, C. Product User Guide and Specification Soil Moisture. 2018. Available online: http://datastore.copernicus-climate.eu/c3s/published-forms/c3sprod/satellite-soil-moisture/product-user-guide-v2.3.pdf (accessed on 15 August 2020).
- Rouse, J.W.; Haas, R.H.; Well, J.A.; Deering, D.W. Monitoring vegetation systems in the Great Plains with ERTS, NASA. Goddard Space Flight Cent. 3d ERTS-1 Symp. 1974, 1, 309–317. [Google Scholar]
- Mu, Q.; Heinsch, F.A.; Zhao, M.; Running, S.W. Development of a global evapotranspiration algorithm based on MODIS and global meteorology data. Remote Sens. Environ. 2007, 111, 519–536. [Google Scholar] [CrossRef]
- Beguería, S.; Vicente-Serrano, S.M.; Angulo-Martínez, M. A multi-scalar global drought data set: The SPEIbase: A new gridded product for the analysis of drought variability and impacts. Bull. Am. Meteor. Soc. 2010, 91, 1351–1354. [Google Scholar] [CrossRef]
- Vicente-Serrano, S.M.; Beguería, S.; López-Moreno, J.I.; Angulo-Martínez, M.; El Kenawy, A. A new global 0.5° gridded dataset (1901–2006) of a multiscalar drought index: Comparison with current drought index datasets based on the Palmer Drought Severity Index. J. Hydrometeorol. 2010, 11, 1033–1043. [Google Scholar] [CrossRef]
- Beguería, S.; Vicente-Serrano, S.M.; Reig, F.; Latorre, B. Standardized Precipitation Evapotranspiration Index (SPEI) revisited: Parameter fitting, evapotranspiration models, kernel weighting, tools, datasets and drought monitoring. Int. J. Climatol. 2014, 34, 3001–3023. [Google Scholar] [CrossRef]
- Vicente-Serrano, S.M.; Beguería, S. Comment on “Candidate Distributions for Climatological Drought Indices (SPI and SPEI)” by James H. Stagge et al. Int. J. Climatol. 2016, 36, 2120–2131. [Google Scholar] [CrossRef]
- Boroneant, C.; Ionita, M.; Brunet, M.; Rimbu, N. CLIVAR-SPAIN contributions: Seasonal drought variability over the Iberian Peninsula and its relationship to global sea surface temperature and large scale atmospheric circulation. In Proceedings of the WCRP OSC: Climate Research in Service to Society, Denver, CO, USA, 24–28 October 2011. [Google Scholar]
- Thornthwaite, C.W. An approach toward a rational classification of climate. Geogr. Rev. 1948, 38, 55–94. [Google Scholar] [CrossRef]
- Portela, M.M.; Santos, J.; Marinho de Carvalho Studart, T. Effect of the Evapotranspiration of Thornthwaite and of Penman-Monteith in the Estimation of Monthly Streamflows Based on a Monthly Water Balance Model, Current Practice in Fluvial Geomorphology—Dynamics and Diversity, Krishna Gopal Ghosh and Sutapa Mukhopadhyay. IntechOpen 2019. [Google Scholar] [CrossRef]
- Soil Moisture CCI. Available online: https://www.esa-soilmoisture-cci.org/node/50 (accessed on 15 June 2020).
- Dorigo, W.; Wagner, W.; Albergel, C.; Albrecht, F.; Balsamo, G.; Brocca, L.; Chung, D.; Ertl, M.; Forkel, M.; Gruber, A.; et al. ESA CCI Soil Moisture for improved Earth system understanding: State-of-the art and future directions. Remote Sens. Environ. 2017. [Google Scholar] [CrossRef]
- Gilbert, R.O. Statistical Methods for Environmental Pollution Monitoring; VanNostrand Reinhold: New York, NY, USA, 1987. [Google Scholar]
- MAKESENS-Application for Trend Calculation. Available online: https://en.ilmatieteenlaitos.fi/makesens (accessed on 15 June 2020).
- Miller, R.G., Jr. Beyond ANOVA—Basics of Applied Statistics; CRC Taylor & Francis Group Press: Boca Raton, FL, USA, 1997; 336p, ISBN 978-0-412-07011-2. [Google Scholar]
- Vizitiu, O.-P.; Calciu, I.C.; Simota, C.C. Drought intensity on arable land in Romania—Processes and tendencies. Lucr. Semin. Geogr. Dimitrie Cantemir 2016, 42, 67–80. [Google Scholar]
- Um, M.J.; Kim, Y.; Park, D. Evaluation and modification of the Drought Severity Index (DSI) in East Asia. Remote Sens. Environ. 2018, 209, 66–76. [Google Scholar] [CrossRef]
- Busuioc, A.; Birsan, M.-V.; Carbunaru, D.; Baciu, M.; Orzan, A. Changes in the large-scale thermodynamic instability and connection with rain shower frequency over Romania: Verification of the Clausius–Clapeyron scaling. Int. J. Climatol. 2016, 36, 2015–2034. [Google Scholar] [CrossRef]
- Spinoni, J.; Naumann, G.; Vogt, J.; Barbosa, P. Meteorological Droughts in Europe: Events and Impacts—Past Trends and Future Projections; Publications Office of the European Union: Luxembourg, 2016. [Google Scholar] [CrossRef]






| Study Area | Irrigation [%] |
|---|---|
| Oltenia Plain | 1.7 |
| Baragan Plain | 14 |
| Banat Plain | 0.15 |
| Input Data | Description | Units | Resolution (m) | Data Source |
|---|---|---|---|---|
| MOD16A2 | Total Evapotranspiration (ET) | mm/8 days | 500 | https://earthdata.nasa.gov |
| MOD16A2 | Total Potential Evapotranspiration (PET) | mm/8 days | 500 | https://earthdata.nasa.gov |
| MOD09A1 | Surface Reflectance (SR) | Unit less | 500 | https://earthdata.nasa.gov |
| MOD11A2 | Daytime Land Surface Temperature (LST) | Kelvin | 1000 | https://earthdata.nasa.gov |
| CLC2018 | CORINE Land Cover | ha | 100 | https://land.copernicus.eu/pan-european/corine-land-cover |
| Precipitation | Total precipitation | mm/month | 1000 | NMA |
| Air temperature | Mean air temperature | °C/month | 1000 | NMA |
| Soil moisture | Volumetric surface soil moisture | m3 water/m3soil | 25,000 | https://cds.climate.copernicus.eu/cdsapp#!/dataset/satellite-soil-moisture?tab=overview |
| Values | Drought Intensity |
|---|---|
| <−2.0. | Extreme drought |
| −2.0 to −1.5 | Severe drought |
| −1.49 to −1.0 | Moderate drought |
| −0.99 to 0.99 | Normal conditions/No Drought |
| >1 | Wetter than normal/No Drought |
| Synthesis (8 Days Composite Period) | Banat Plain | Oltenia Plain | Baragan Plain | Romania | ||||
|---|---|---|---|---|---|---|---|---|
| Test Z | Sig | Test Z | Sig | Test Z | Sig | Test Z | Sig | |
| 30.03–06.04 | 2.449 | * | 2.379 | * | 2.309 | * | 2.52 | * |
| 07.04–14.04 | 1.399 | 2.029 | * | 2.309 | * | 1.40 | ||
| 15.04–22.04 | 0.560 | 1.609 | 2.659 | ** | 2.03 | * | ||
| 23.04–30.04 | 1.329 | 1.679 | + | 2.659 | ** | 1.47 | ||
| 01.05–08.05 | 2.589 | ** | 2.519 | * | 2.939 | ** | 3.43 | *** |
| 09.05–16.05 | 2.729 | ** | 2.939 | ** | 3.359 | *** | 3.78 | *** |
| 17.05–24.05 | 1.819 | + | 2.799 | ** | 3.848 | *** | 2.87 | ** |
| 25.05–01.06 | 2.519 | * | 2.449 | * | 3.009 | ** | 2.17 | * |
| 02.06–09.06 | 2.029 | * | 1.819 | + | 3.009 | ** | 3.15 | ** |
| 10.06–17.06 | 1.819 | + | 1.259 | 2.029 | * | 3.01 | ** | |
| 18.06–25.06 | 1.030 | 0.865 | 0.618 | 1.85 | + | |||
| 26.06–03.07 | 1.607 | 1.607 | 0.124 | 2.27 | * | |||
| 04.07–11.07 | 0.630 | 1.819 | + | 0.770 | 2.03 | * | ||
| 12.07–19.07 | 0.700 | 2.029 | * | 0.700 | 1.75 | + | ||
| 20.07–27.07 | 0.560 | 1.399 | 0.560 | 1.54 | ||||
| 28.07–04.08 | −0.140 | 0.210 | −0.210 | −0.35 | ||||
| 05.08–12.08 | −0.840 | −0.980 | −0.630 | −0.91 | ||||
| 13.08–20.08 | −0.980 | −1.120 | −0.490 | −1.19 | ||||
| 21.08–28.08 | −0.700 | −1.329 | −1.679 | + | −1.40 | |||
| 29.08–05.09 | −1.329 | −1.259 | −1.749 | + | −1.61 | |||
| 06.09–13.09 | −1.469 | −1.889 | + | −1.959 | + | −1.61 | ||
| 14.09–21.09 | −1.591 | −1.894 | + | −2.803 | ** | −2.20 | * | |
| 22.09–29.09 | −1.749 | + | −2.099 | * | −2.589 | ** | −2.03 | * |
| Month | Banat Plain | Baragan Plain | Oltenia Plain | |||
|---|---|---|---|---|---|---|
| Test Z | Sig | Test Z | Sig | Test Z | Sig | |
| April | −1.33 | 0.63 | −0.77 | |||
| May | 1.68 | + | 0.77 | 0.84 | ||
| June | 0.07 | 0.21 | 0.91 | |||
| July | −0.84 | −0.14 | 0.00 | |||
| August | −0.84 | −0.84 | −0.98 | |||
| September | −1.19 | −2.59 | ** | −2.52 | ||
| Synthesis (8 Days Composite Period | Banat Plain | Oltenia Plain | Baragan Plain | |||
|---|---|---|---|---|---|---|
| Test Z | Signific. | Test Z | Signific. | Test Z | Signific. | |
| 30.03–06.04 | 0.630 | −0.210 | −0.420 | |||
| 07.04–14.04 | −0.530 | 0.140 | −0.420 | |||
| 15.04–22.04 | −1.539 | −0.840 | −0.210 | |||
| 23.04–30.04 | −1.889 | + | −1.679 | + | −0.560 | |
| 01.05–08.05 | 1.469 | 0.420 | 0.840 | |||
| 09.05–16.05 | 0.350 | 0.350 | 0.980 | |||
| 17.05–24.05 | 0.303 | −0.303 | 0.630 | |||
| 25.05–01.06 | 0.700 | 0.210 | 0.280 | |||
| 02.06–09.06 | 0.530 | −0.420 | −0.630 | |||
| 10.06–17.06 | 0.000 | −0.227 | 0.490 | |||
| 18.06–25.06 | 2.121 | * | 0.833 | 0.000 | ||
| 26.06–03.07 | 2.197 | * | 0.833 | −0.700 | ||
| 04.07–11.07 | −0.070 | 0.000 | 0.420 | |||
| 12.07–19.07 | 0.420 | −0.350 | −1.190 | |||
| 20.07–27.07 | −0.070 | −0.490 | −0.910 | |||
| 28.07–04.08 | 0.280 | −0.530 | −0.770 | |||
| 05.08–12.08 | −0.490 | −1.819 | + | −2.099 | * | |
| 13.08–20.08 | −0.140 | −1.120 | −1.399 | |||
| 21.08–28.08 | 0.070 | −0.630 | −0.770 | |||
| 29.08–05.09 | −0.560 | −2.029 | * | −1.959 | + | |
| 06.09–13.09 | 0.000 | −1.889 | + | −2.729 | ** | |
| 14.09–21.09 | −2.309 | * | −2.099 | * | −2.449 | * |
| 22.09–29.09 | −1.061 | −2.309 | * | −1.539 | ||
Publisher’s Note: MDPI stays neutral with regard to jurisdictional claims in published maps and institutional affiliations. |
© 2020 by the authors. Licensee MDPI, Basel, Switzerland. This article is an open access article distributed under the terms and conditions of the Creative Commons Attribution (CC BY) license (http://creativecommons.org/licenses/by/4.0/).
Share and Cite
Angearu, C.-V.; Ontel, I.; Boldeanu, G.; Mihailescu, D.; Nertan, A.; Craciunescu, V.; Catana, S.; Irimescu, A. Multi-Temporal Analysis and Trends of the Drought Based on MODIS Data in Agricultural Areas, Romania. Remote Sens. 2020, 12, 3940. https://doi.org/10.3390/rs12233940
Angearu C-V, Ontel I, Boldeanu G, Mihailescu D, Nertan A, Craciunescu V, Catana S, Irimescu A. Multi-Temporal Analysis and Trends of the Drought Based on MODIS Data in Agricultural Areas, Romania. Remote Sensing. 2020; 12(23):3940. https://doi.org/10.3390/rs12233940
Chicago/Turabian StyleAngearu, Claudiu-Valeriu, Irina Ontel, George Boldeanu, Denis Mihailescu, Argentina Nertan, Vasile Craciunescu, Simona Catana, and Anisoara Irimescu. 2020. "Multi-Temporal Analysis and Trends of the Drought Based on MODIS Data in Agricultural Areas, Romania" Remote Sensing 12, no. 23: 3940. https://doi.org/10.3390/rs12233940
APA StyleAngearu, C.-V., Ontel, I., Boldeanu, G., Mihailescu, D., Nertan, A., Craciunescu, V., Catana, S., & Irimescu, A. (2020). Multi-Temporal Analysis and Trends of the Drought Based on MODIS Data in Agricultural Areas, Romania. Remote Sensing, 12(23), 3940. https://doi.org/10.3390/rs12233940


