Abstract
Global climate change is expected to cause a strong temperature increase in the polar regions, accompanied by a reduction in snow cover. Due to a lower albedo, bare ground absorbs more solar energy and its temperature can increase more. Here, we show that vegetation growth in such bare ground areas can efficiently mitigate surface warming in the Arctic, thanks to plant evapotranspiration. In order to establish a comprehensive energy balance for the Arctic land surface, we used an ensemble of methods of ground-based measurements and multispectral satellite image analysis. Our estimate is that the low vegetation of polar tundra transforms 26% more solar energy into evapotranspiration than bare ground in clear sky weather. Due to its isolation properties, vegetation further reduces ground heat flux under the surface by ~4%, compared to bare areas, thus lowering the increase in subsurface temperature. As a result, ~22% less solar energy can be transformed into sensible heat flux at vegetated surfaces as opposed to bare ground, bringing about a decrease in surface temperature of ~7.8 °C.
1. Introduction
The increase in temperature in the Arctic region, as part of global climate change, results in lower albedo due to the reduction of sea ice, snow cover, and glacier retreats, which has an impact on the surface energy balance [1,2,3]. Following the disappearance of the snow and ice cover, the ground surface is subject to further changes, such as the seasonal growth of vegetation, with the amount increasing along with the continuous increase in temperature [3,4]. Vegetation with a sufficient water supply has a major impact on the ground surface energy balance in temperate zones because it absorbs a significant portion of solar energy for water evaporation in the evapotranspiration process [5,6,7,8], thus reducing heating of the Earth surface, as well as the adjacent atmospheric layers [9]. The process of vegetation cooling has been described for open landscapes [10,11] and urban environments [12,13,14,15], and has been found to occur at mesoclimatic [16] and continental scales [17,18]. Conversely, vegetation removal brings about a reduction of evaporation and increased surface temperature [19,20]. The vegetation cooling effect in polar regions has received little attention until present, even though the ground surface of the Arctic tundra has been monitored using satellite technologies when it comes to surface temperature [21,22] and studied by ground measurement methods for energy fluxes [23,24,25]. However, some studies have shown that the variability of the Arctic tundra surface can be reflected in the changes of the surface energy balance [26,27,28].
Here, we show that even a minimum amount of vegetation in Arctic tundra areas has a major impact on the mitigation of surface heating, despite the harsh climatic conditions, and we quantify the effect. The aim of our work was to compare typical recently deglaciated surfaces with and without vegetation from the perspective of the surface energy balance components. Our hypothesis was that the amount of solar radiation energy transformed into evaporation (i.e., latent heat flux) at a vegetated surface would be higher than at a vegetation-free surface. The amount of solar energy transformed into ground surface heating was presumed to be lower in areas covered with vegetation. However, the differences were supposed to be relatively small due to the minimum amount of low vegetation. In order to monitor and calculate land surface parameters and the energy balance components, we used LANDSAT multispectral satellite images and ground-based meteorological data.
2. Materials and Methods
2.1. The Study Sites
In order to assess energy fluxes and establish a comprehensive radiation and energy balance of different types of Arctic surfaces, varying in vegetation cover, the two study areas were located in places with a flat terrain situated several hundreds of meters from the coast of Petuniabukta, Billefjorden, Central Svalbard, at 10 to 20 m above the sea level (Figure 1). One of the areas, further identified as “bare ground” (B), belongs to the “Gravel Barren Communities” category [29]. It is continuously covered in bare rock and is free of vegetation. The mean slope of the area is 1.9° with a southeast exposition. The second area, further identified as the “vegetated surface” (V), belongs to the “Established Dryas Tundra” [29]. It is continuously covered in low vegetation belonging to typical Central Arctic tundra, with only two species: Dryas octopetala and Salix polaris. Local plants grow to a height of 5 cm above the surface of the shallow, skeletal tundra soil. The mean slope of the area is 4.3° with a northeast exposition. Both areas are located at the geographical coordinates 78°42′37″N; 16°27´28″E, comprising an area of several tens of hectares, and are sharply divided by a 2-m ravine. Both areas have only undergone natural processes and no human intervention has been carried out. An automatic weather station (AWS) is located in a vegetation area several tens of meters from this dividing line. The station continuously monitors basic meteorological parameters. The coastal zone of Petuniabukta belongs to the high Arctic climate region [30], with a mean annual air temperature of around −4.5 °C, mean summer temperature of 7.2 °C (July), mean wind speed exceeding 3.9 ms−1, and mean air relative humidity of 80% [31].
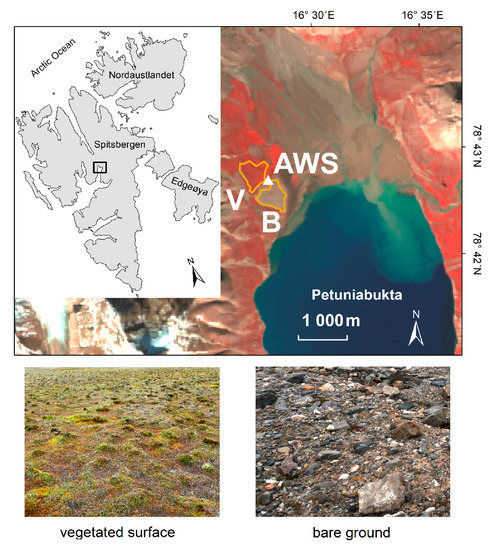
Figure 1.
Bare ground surface (B) and vegetated surface (V) on the western coast of Petuniabukta, Billefjorden, Central Svalbard, shown on a false color composition (near infrared-red-green channels) of a LANDSAT 8 satellite image. The triangle mark symbolizes the automatic weather station (AWS) at the interface of both surfaces.
2.2. Data Description
In order to calculate the energy fluxes and surface functional parameters of both areas, we used satellite data and ground-based observations measured at the moment of satellite passage. The multispectral images of the LANDSAT 8 Operational Land Imager (OLI) and Thermal Infra-Red Scanner (TIRS) sensors were used as the satellite data. The OLI and TIRS sensors have a suitable spatial resolution (OLI: 30 m/px; TIRS: 100 m/px) and composition of spectral ranges of visible and infrared spectra [32], convenient for the calculation of the net radiation components and ground surface energy balance components. In order to calculate all of the parameters, cloudless images were chosen, representing the examined region at the peak of the vegetation seasons between 2014 and 2017. Four satellite images were thus selected for these years, with the dates differing by a maximum of six days (15 July 2014, 9 July 2015, 9 July 2016, and 10 July 2017). Furthermore, five cloudless images were available to be used for 2016, in order to assess the development of the energy balance components throughout a single vegetation season (14 June, 2 July, 9 July, 27 July, and 10 August). Energy balance components were always calculated for the moment of satellite passage between 12:00 and 12:30 UTC using ground-based meteorological observations (Table 1).

Table 1.
Overview of meteorological conditions observed by an automatic weather station at the times of satellite image acquisition.
Satellite images are distributed in the UTM coordinate system, zone 33 N, WGS84 ellipsoid, and were obtained from the United States Geological Survey (USGS) server (see Appendix A). Channels of the visible and infrared spectra of satellite images were provided by a distributor in the form of at-surface reflectances with radiometric and atmospheric corrections already carried out, produced by the Landsat 8 Surface Reflectance Code–LaSRC model [33]. Radiometric and atmospheric corrections of thermal channel no. 10 were conducted during image processing using a radiative transfer model, developed by Barsi et al. [34]. The surface functional parameters (vegetation index and surface temperature) and radiation and surface energy balance were calculated based on the satellite images, providing satellite maps with each pixel giving the value of the studied parameter in the given place. In the satellite maps, two polygons were created above the surfaces with and without vegetation. Each of the two surfaces with the actual area of 21 hectares was represented by 236 pixels of the original satellite data. The differences between the surface parameters and energy balance components were then assessed for the two areas. Satellite image processing and calculations of the surface functional parameters and energy balance components were carried out using the ClarkLabs–TerrSet software.
2.3. Calculation of Surface Functional Parameters
The Normalized Difference Vegetation Index (NDVI, unitless) was used as a parameter for the estimation of vegetation cover and was calculated using the following equation [35]:
where “band NIR” and “band RED” represent the spectral reflectance values obtained from the 5th (NIR) and 4th (RED) channels of the LANDSAT 8 OLI satellite sensor, respectively.
Thermal band no. 10 of the LANDSAT 8 TIRS satellite sensor was used in order to calculate the surface radiation temperature. First, the spectral radiance at the top of the atmosphere was calculated using the digital number (DN) values of pixels of the thermal band using the following equation [32]:
where LTOA (W m−2 sr−1 μm−1) represents the spectral radiance at the top of the atmosphere (also called the “at-sensor spectral radiance”), the radiance multiplicative scaling factor (also called the “gain”) ML = 3.342 × 10⁻⁴ W m−2 sr−1 μm−1 DN−1, Qcal (DN) is the digital number value of the pixel, and the radiance additive scaling factor (also called the “offset”) AL = 0.1 W m−2 sr−1 μm−1. The ML and AL values were obtained from satellite image metadata [32].
The at-surface spectral radiance was calculated during the thermal band atmospheric correction process and the emissivity correction process as follows [34]:
where LS (W m−2 sr−1 μm−1) represents the at-surface spectral radiance, LU (W m−2 sr−1 μm−1) is the upwelling or atmospheric path radiance, τ (unitless) is the atmospheric transmission, ε (unitless) is the surface emissivity, and LD (W m−2 sr−1 μm−1) is the downwelling or sky radiance. τ, LU, and LD were obtained from the radiative transfer model defined by Barsi et al. [34], using the atmospheric condition data (Table 1) measured at the time of satellite image acquisition. The Web-Based Atmospheric Correction Tool for Single Thermal Band Instruments [36] was used for the calculation of the radiative transfer model parameters. Surface emissivity ε was calculated by the NDVI Threshold Method using the NDVI vegetation index [37].
The surface radiation temperature was calculated using the at-surface spectral radiance, as follows [32]:
where Ts (°C) is the surface radiation temperature, the thermal conversion constant K1 = 774.8853 W m−2 sr−1 μm−1, and the thermal conversion constant K2 = 1321.0789 K. The K1 and K2 constants were obtained from satellite image metadata [32].
2.4. Calculation of Net Radiation Components
The total net radiation Rnet (Wm−2) as a result of the balance of shortwave and longwave radiation could be determined as follows [38]:
where RS↓ stands for the incident shortwave radiation, RS↑ is the reflected shortwave radiation, RL↓ represents the incident longwave radiation, and RL↑ is the longwave radiation emitted by a land surface. Primary raw data of incident shortwave radiation RS↓ were obtained from an automatic weather station.
Corrections for the slope, aspect, solar radiation geometry, latitude and longitude, and date and time of satellite image acquisition were established for the primary raw RS↓ data using the method developed by Kumar et al. [39]. The RS↑ value was calculated as follows:
where α represents the albedo, calculated as follows [40]:
where b is the number of a LANDSAT 8 OLI channel, ρS,b represents values of the land surface spectral reflectance, and wb stands for weight coefficients (for a detailed description, see Tasumi et al. [40]).
The RL↓ value was calculated based on the Stefan–Boltzmann law using the following equation:
where εac is the emissivity of the atmosphere, σ stands for the Stefan–Boltzmann constant, and Ta represents the air temperature. The εac value was calculated as follows [41]:
where ea (kPa) is the atmospheric water vapor pressure.
The ea value was calculated as follows:
where Rh (%) is the air relative humidity measured by an automatic weather station and Ea is the saturation water vapor pressure in the air, calculated using the Magnus–Teten equation with coefficients, published by Buck [42], as follows:
The RL↑ value was also calculated based on the Stefan–Boltzmann law:
2.5. Calculation of Surface Energy Balance Components
The total net radiation, Rnet, represents the amount of energy transformed into different energy balance components on the surface of Earth, depending on the environmental conditions. These are the ground heat flux (heat flux into the soil), sensible heat flux (heat absorbed for an increase of the mass internal energy near the surface), latent heat flux (heat used for evapotranspiration), and energy used for photosynthesis. The amount of energy used for photosynthesis is very low, usually <1%, and it can thus be disregarded for the purpose of calculating the surface energy balance. Knowing Rnet, the individual surface energy balance components can be expressed using the following equation:
where G is the ground heat flux, H represents the sensible heat flux, and LE indicates the latent heat flux.
The ground heat flux, G (Wm−2), was calculated using the following equation [43]:
The latent heat flux, LE (Wm−2), was calculated using an adjusted equation for the evaporative fraction [44,45]:
where TS max stands for the highest value of the actual radiation temperature identified in a satellite image.
The sensible heat flux H (Wm−2) was calculated using the surface energy balance equation (Equation (13)) after calculating the other surface energy balance components.
3. Results
The bare ground surface significantly differed from the surface covered with vegetation in terms of the net radiation and surface energy balance, as well as physical parameters. Both surfaces differed from each other when compared during a single vegetation season, as well as in each of the studied years.
3.1. Mid-Seasonal Radiation Balance
From 2014 to 2017, the mean values of the incident short-wave radiation for the bare ground were around 26 to 31 Wm−2 higher in the individual years than for the surface covered with vegetation (Figure 2a). The albedo for the bare ground and vegetated tundra surfaces was between 13 and 14% and 10 and 11%, respectively (Figure 2g). The mean short-wave radiation reflected from the bare ground was 14 to 22 Wm−2 higher than for the vegetated surface each year (Figure 2b). The resulting mean net short-wave radiation was always higher for the bare ground, by 5 to 14 Wm−2, than for the vegetated tundra surface (Figure 2c).
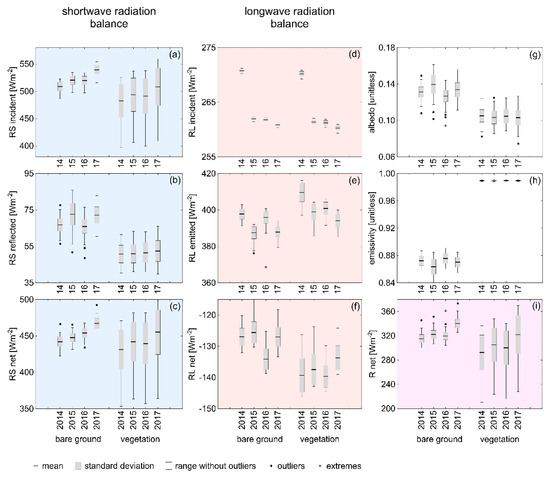
Figure 2.
Net radiation components of two different tundra surfaces estimated for 15 July 2014, 9 July 2015, 9 July 2016, and 10 July 2017. RS incident (a) stands for incident shortwave radiation, RS reflected (b) is reflected shortwave radiation, and RS net (c) is net shortwave radiation. RL incident (d) represents incident longwave radiation, RL emitted (e) is longwave radiation emitted by the land surface, and RL net (f) stands for net longwave radiation. Albedo (g) represents reflectance of the land surface, emissivity (h) stands for the ability of the land surface in terms of the emission of longwave radiation, and R net (i) is the total net radiation.
The mean values of incident long-wave radiation differed by less than 1 Wm−2 between the bare ground and vegetated surfaces each year (Figure 2d). Whereas the calculated emissivity, i.e., the ability to emit long-wave radiation, only reached 87% on average at the bare ground surface, it was 99% in the case of the vegetated surface (Figure 2h). The bare ground emitted 5 to 12 Wm−2 less long-wave radiation on average than the vegetated surface in the individual years (Figure 2e). The net long-wave radiation presented an energy deficit, which was 6 to 13 Wm−2 lower on average for the bare ground than the vegetated surface (Figure 2f). This means that, due to long-wave radiation emission, the vegetated surface lost more energy than the bare ground.
The total net radiation (Figure 2i) shows that the energy flux always reached higher mean values for the bare ground (from 315 to 340 Wm−2) than the vegetated surface (between 293 and 322 Wm−2) for each study year. The differences in total net radiation between the two types of tundra surfaces ranged from 17 to 23 Wm−2 in the individual years. Moreover, the values for the vegetated tundra surface were significantly more dispersed.
All radiation balance components significantly differed between the bare ground and vegetated surface on each reference date (Mann–Whitney test, p < 0.05), with the single exception of 9 July 2015, when the net short-wave radiation was similar for the bare ground and vegetated surface (Mann–Whitney test, p = 0.062).
3.2. Mid-Seasonal Surface Functional Parameters and Surface Energy Balance Components
Whereas the temperature of the bare ground, with mean NDVI values around 0.1, ranged from 25 and 26 °C, the temperature of the vegetated surface, with average NDVI values amounting to around 0.5, varied from 16 to 19 °C (Figure 3a,b).
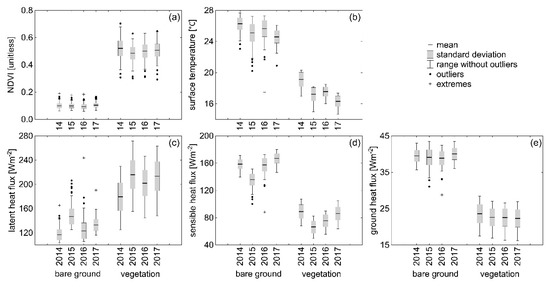
Figure 3.
Functional parameters and surface energy balance components of two different tundra surfaces estimated for 15 July 2014, 9 July 2015, 9 July 2016, and 10 July 2017. NDVI (a) stands for the Normalized Difference Vegetation Index and surface temperature (b) represents the radiation temperature of the land surface. Latent heat flux (c) stands for heat used for evapotranspiration, sensible heat flux (d) is heat absorbed for the increase of mass internal energy near the surface, and ground heat flux (e) represents heat flux into the soil.
The surface energy balance shows even larger differences between the bare ground and vegetated surface values than the radiation balance. The mean latent heat flux for the bare ground ranging from 117 to 147 Wm−2 was 63 to 81 Wm−2 lower than that for the vegetated surface each year, varying between 180 and 216 Wm−2 (Figure 3c). The mean sensible heat flux for the vegetation-free surface varied between 136 and 167 Wm−2, while that for the vegetated surface reached only 66 to 89 Wm−2, differing from the bare ground by 70 to 82 Wm−2 in different years (Figure 3d). The mean values of the ground heat flux for the bare ground ranged from 39 to 40 Wm−2 and were 16 to 18 Wm−2 higher than for the vegetated surface each year, which varied between 22 and 24 Wm−2 (Figure 3e).
All surface energy balance components and functional parameters significantly differed between the bare ground and vegetated surface on each reference date (Mann–Whitney test, p < 0.05).
3.3. Radiation Balance during the 2016 Vegetation Season
In the 2016 vegetation season, the mean intensities of incident short-wave radiation were 26 to 30 Wm−2 higher for the bare ground surface than the vegetated surface (Figure 4a,b). The reflected short-wave radiation from the bare ground was 13 to 16 Wm−2 higher compared to the vegetated surface throughout the vegetation season. The differences in the mean intensities of incident long-wave radiation between the bare ground and vegetated surface did not exceed 1 Wm−2. The bare ground emitted 5 to 14 Wm−2 less long-wave radiation on average than the vegetated surface. The radiation balance of the entire 2016 vegetation season shows that the total net radiation intensities always reached higher mean values for the bare ground (from 235 to 341 Wm−2) than the vegetated surface (between 206 and 320 Wm−2). The difference in total net radiation between the two types of surface ranged from 18 to 29 Wm−2 on average for the individual sampling dates.
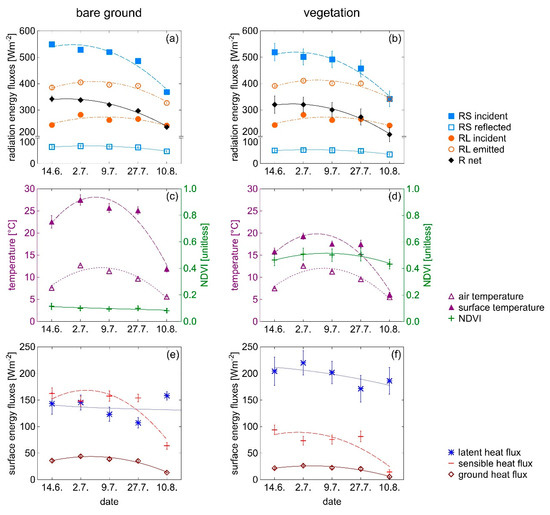
Figure 4.
Components of the net radiation, surface energy balance, and functional parameters of two different tundra surfaces estimated for 14 June, 2 July, 9 July, 27 July, and 10 August of the 2016 vegetation season (means and standard deviations with general trend of parameter values shown by trend lines). RS incident stands for incident shortwave radiation, RS reflected is reflected shortwave radiation, RL incident represents incident longwave radiation, RL emitted is longwave radiation emitted by the land surface, and R net stands for total net radiation (a,b). NDVI stands for the Normalized Difference Vegetation Index, surface temperature represents the radiation temperature of the land surface, and air temperature is the thermodynamic temperature of the air, measured 2 m above the ground (c,d). Latent heat flux stands for heat used for evapotranspiration, sensible heat flux is heat absorbed for the increase of mass internal energy near the surface, and ground heat flux represents heat flux into the soil (e,f). In th case of invisibility of the standard deviation mark, the range of standard deviation is lower than the size of the mean mark.
All radiation balance components significantly differed between the bare ground and vegetated surface on each reference date (Mann–Whitney test, p < 0.05).
3.4. Surface Functional Parameters and Surface Energy Balance Components during the 2016 Vegetation Season
Whereas the mean temperature of the bare ground with mean NDVI values around 0.1 ranged from 12 and 27 °C, the mean temperature of the vegetated surface with mean NDVI values between 0.43 and 0.5 varied from 6 to 19 °C (Figure 4c,d).
The surface energy balance components for the whole 2016 vegetation season show larger differences between the bare and vegetated surface values than the radiation balance, similar to the data obtained from the peaks of the vegetation seasons of different years (Figure 4e,f). The mean latent heat flux for the bare ground ranged from 107 to 158 Wm−2 and was 28 to 79 Wm−2 lower than that for the vegetated surface on the individual dates, varying between 171 and 220 Wm−2. The mean sensible heat flux for the bare ground varied between 64 and 163 Wm−2, while that for the vegetated surface reached 15 to 94 Wm−2, differing from the bare ground by 49 to 82 Wm−2 on different dates. The mean ground heat flux for the bare ground ranged from 13 to 44 Wm−2, being 7 to 18 Wm−2 higher than that for the vegetated surface on the individual dates, which varied between 6 and 26 Wm−2.
All surface energy balance components and functional parameters significantly differed between the bare ground and vegetated surface on each reference date (Mann–Whitney test, p < 0.05).
4. Discussion
As expected, the results showed that the impact of vegetation on the solar radiation and heat fluxes of the surface energy balance was evident in the Arctic tundra environment. However, what was surprising was the level of impact of heat fluxes.
4.1. Radiation Balance
Since the exposition of both the surfaces towards the sun is different due to their slightly different slopes, and since the sun position is very low, the calculated amount of incident short-wave radiation was lower for the vegetated surface (Figure 2a). In addition, the more uneven terrain of the vegetated surface brought about a larger variability of the surface exposition to incident short-wave radiation, and thus a wider range of values. Due to the lower albedo (Figure 2g), the vegetated surface reflected less short-wave radiation than the bare ground, which lost more energy in this way (Figure 2b). The difference in the net short-wave radiation balance was not very high (Figure 2c), because the difference in albedo of the vegetation-free and vegetation-covered surface was relatively small (3%). Moreover, the difference was eliminated due to the inclination of the vegetated surface, as mentioned above. This is probably the reason for the non-significant difference between values of net short-wave radiation in one case (9 July 2015).
The energy from incident long-wave radiation differed little between the surfaces (by less than 1 Wm−2) given the fact that long-wave radiation—as opposed to short-wave radiation—is omnidirectional, as it comes from the atmosphere. However, the most significant difference was seen for the emissivity of the two surfaces, i.e., the ability to emit long-wave radiation. It was 12% higher for the vegetation-covered surface than the bare surface (Figure 2h). The vegetation gets rid of energy by emitting long-wave radiation much more efficiently than the bare ground, and the difference in the efficiency (12%) was thus much higher than the difference between the albedo of the two surfaces (3%). Despite the large difference in emissivity of the two surfaces, the absolute difference in the emitted long-wave radiation was relatively small (5 to 12 Wm−2). The reason for this is the fact that the vegetated surface always had a lower surface temperature (Figure 3b), and thus—following the Stefan–Boltzmann law (Equation (12))—a much smaller amount of inner energy available for emission. In line with the increasing temperature of the vegetation cover, the amount of emitted long-wave radiation would exceed the long-wave radiation of the bare ground much more significantly. The total radiation balance (Figure 2i) shows that the amount of total net radiation (Rnet), entering the heat fluxes of the surface, was always higher for the bare ground than for the vegetated surface. On average, the vegetated surface uses about 1% less energy than the bare ground due to differences in the albedo, emissivity, and temperature in the form of the total net radiation for surface energy balance components (Figure 5). The impact of different surface types on net radiation can be observed in the data collected at the peaks of the vegetation seasons, as well as in the data collected during the season (Figure 4). The trend lines do not precisely represent the trends in parameter development during the season due to changing weather conditions and irregular time intervals of satellite image acquisition. However, these trend lines show some general seasonal development, and a decrease in solar energy input is evident at the end of the vegetation season.
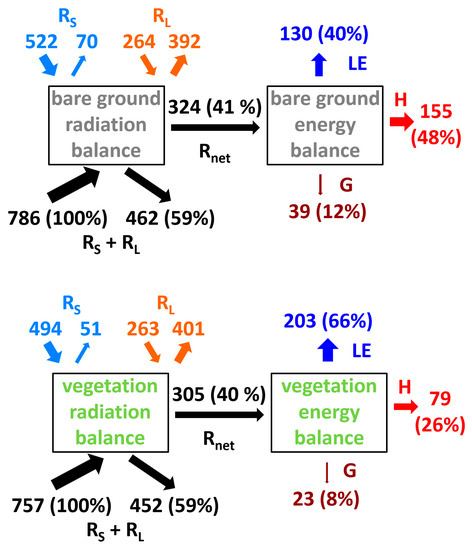
Figure 5.
Components of the net radiation and surface energy balance of two different types of Arctic land surface. Mean values of the radiation energy balance and surface energy balance components (in Wm−2) were calculated using the values from the dates of 15 July 2014, 9 July 2015, 9 July 2016, and 10 July 2017. RS stands for shortwave radiation, RL is longwave radiation, and Rnet is the total net radiation. LE stands for the latent heat flux, H means the sensible heat flux, and G is the ground heat flux. The total radiation energy balance and the surface energy balance component values are also shown in % in brackets. Rnet represents 100% of the surface energy balance.
4.2. Surface Energy Balance Components
Much higher differences in energy flux ratios between the two areas could be observed when it comes to the surface energy balance components (Figure 3 and Figure 4). The transformation of around 12% of the total net radiation into ground heat flux in the bare ground areas, established by spectral data analysis (Equation (14)), is comparable to values acquired by ground measurement methods [24,46]. In Arctic tundra, the ground heat flux usually forms 10–20% of the total net radiation during the summer period [24,46,47,48]. The difference in the ground heat flux (Figure 3e) between the bare and vegetated areas can be attributed to the fact that vegetation has an insulation impact [26,49,50], causing the transfer of total net radiation to be higher for bare ground than in a vegetation-covered area.
The surfaces also differed in terms of latent heat flux, which was about one third higher for vegetated surfaces than bare ground (Figure 3c). This difference was caused by a more intense evaporation from the soil surface and plant transpiration, compared to bare ground. The vegetated surface was evenly covered by plants, but the vegetation was relatively sparse, reaching a height of several centimeters. According to the approaches of different authors, the amount of biomass calculated based on our spectral data using the NDVI index values ranges from 0.25 to 0.3 kg.m−2 [51] up to 0.5 to 0.6 kg.m−2 [52]. The question remains as to what extent the significant evaporation from the vegetated surface was due to plant transpiration and net evaporation from the surface, i.e., the transpiration/evaporation ratio; in other words, if, in the given conditions of the small amount of vegetation, it could be evaporation that caused the high value of the latent heat flux. If this was the case, a significant part of the effect could be attributed to vegetation. Vegetation helps maintain a shallow soil profile in demanding climatic conditions, increasing the surface roughness and preventing erosion. In addition, it absorbs a certain amount of water in plant bodies and the rhizosphere [53,54], limiting rapid direct water run-off and helping to maintain surface moisture and thus the process of evaporation. Moreover, soil moisture alone only influences the evapotranspiration rate a little when the water in the soil is in excess, plentiful, or at least above the wilting point [55,56]. The availability of water in the root zone and the condition of vegetation are far more important for the evapotranspiration rate [57]. In this sense, vegetation cover proves to be a key factor in the rate of latent heat flux.
The higher loss of energy during the evapotranspiration process for the vegetated surface leads to a significantly lower residual inner energy of the vegetation and soil mass. That is why a vegetated surface has only half the values of sensible heat flux than bare ground (Figure 3d) and has a significantly lower surface temperature than bare ground (Figure 3b).
In our study, the vegetated surface displayed mean values of 66% and 26% of the total net radiation to the latent heat flux and sensible heat flux, respectively, at the peak of the vegetation season (Figure 5). However, only 40% of the total net radiation striking the bare ground was converted to the latent heat flux, while the sensible heat flux, on the contrary, reached up to 48% (Figure 5). These results showed the importance of vegetation. These findings, based on surface energy balance calculation methods using spectral data, are consistent with other types of heat flux determinations in the Svalbard region. Spot measurements of energy fluxes for a surface with a shallow humus profile and a thin layer of moss at midday at the peak of the vegetation season in the Svalbard region showed a very similar distribution of total net radiation into heat fluxes (latent heat flux and sensible heat flux of around 62% and 20%, respectively) [26]. Similarly, measurements using eddy covariance techniques in Svalbard showed an increase of evaporation values and a divergence of latent heat flux and sensible heat flux values in vegetated areas during the vegetation season [28]. Our observation of the surface energy balance components during a single vegetation season shows that this phenomenon is significant for the entire vegetation season. Even at the very end of the season, with a decreased input of solar radiation energy, there is still a significant difference between the sensible heat flux of the bare ground and vegetated surface (Figure 4e,f). Similarly, temperatures of both surfaces still differed at the end of the season, even though they were approaching the air temperature (Figure 4c,d). The mean value (1.2) of the Bowen ratio (H/LE ratio) for the bare ground surface in our study is comparable to values acquired by ground measurement methods on similar surfaces in polar regions during the summer period (e.g., [28,50]), which suggests a consistency of the spectral calculation method and other types of sensible and latent heat flux determinations.
Therefore the results show that, in the vegetation season, tundra vegetation efficiently and significantly mitigates surface heating through the evapotranspiration process, even in the latitudes of the High Arctic. Heat fluxes of an active surface in polar regions play a main role in the distribution of incident radiation energy [24], and in this study, we have shown the important degree to which a relatively small amount of vegetation contributes to the final surface energy balance. The higher input of short-wave radiation due to the smaller reflectance of the vegetation is largely compensated for by its much more significant ability to lose energy through long-wave radiation emission. When it comes to the values of energy loss through evaporation, a vegetated surface exceeds bare ground by tens of percent, limiting its overheating and heat penetration under the surface. Although some works have shown that warming of the Arctic region does not necessarily mean an increase in biomass production, depending on local conditions [58], in general, an increase of temperatures in the Arctic region is associated with an increase in green biomass [4,51,59]. It can therefore be presumed that the process of warming mitigation due to vegetation will progress in such areas and will represent some feedback to the warming of the local climate.
5. Conclusions
The results of the study showed that, in the conditions of high latitudes, even a small amount of vegetation can have a major impact on the fate of solar radiation energy in the environment. Recently, rapid climate change has taken place in the High Arctic at local and regional scales with increased air temperatures, as part of the wider global climate change. Such a change of environmental conditions can have an impact on the future distribution and amount of polar tundra vegetation. As part of an active ground surface, vegetation can trigger feedback on both microclimate and local climate processes of the region, in terms of mitigating surface warming, and become one of the factors involved in the future projections of climate change. It is therefore evident that further research is necessary when it comes to this specific role of vegetation in the formation of the local climate of polar regions, which has been rather overlooked.
Author Contributions
Conceptualization, V.N.; methodology, V.N., K.L., and J.B.; formal analysis, V.N.; investigation, V.N., K.L., and J.B.; resources, V.N. and K.L.; data curation, V.N. and K.L.; writing—original draft preparation, V.N.; visualization, V.N.; project administration, K.L.; funding acquisition, K.L. All authors have read and agreed to the published version of the manuscript.
Funding
This research was funded by the Ministry of Education, Youth and Sports (projects no. LM2015078 and CZ.02.1.01/0.0/0.0/16_013/0001708).
Acknowledgments
The authors would like to thank the staff of the Centre for Polar Ecology, Faculty of Science, University of South Bohemia in České Budějovice for their logistical support and to Assoc. Keith Edwards and Ing. Kateřina Křováková for proof-reading of the manuscript.
Conflicts of Interest
The authors declare no conflict of interest.
Appendix A
The meteorological data for all of the calculations are available in Table 1 (see Materials and Methods chapter). The LANDSAT 8 OLI/TIRS satellite data are available for free at the United States Geological Survey, ESPA ordering interface: https://espa.cr.usgs.gov/index/ (see Materials and Methods chapter for a detailed data processing description).
Original codes for satellite data downloaded for dates used in the study:
15 July 2014: LC08_L1TP_214004_20140715_20170421_01_T1
9 July 2015: LC08_L1TP_215003_20150709_20170407_01_T1
14 June 2016: LC08_L1TP_218003_20160614_20170324_01_T1
2 July 2016: LC08_L1TP_216003_20160702_20170323_01_T1
9 July 2016: LC08_L1TP_217003_20160709_20170323_01_T1
27 July 2016: LC08_L1TP_215003_20160727_20170322_01_T1
10 August 2016: LC08_L1TP_217003_20160810_20170322_01_T1
10 July 2017: LC08_L1TP_219003_20170710_20170725_01_T1
References
- Serreze, M.C.; Walsh, J.E.; Chapin, F.S., III; Osterkamp, T.; Dyurgerov, M.; Romanovsky, V.; Oechel, W.C.; Morison, J.; Zhang, T.; Barry, R.G. Observational Evidence of Recent Change in the Northern High-Latitude Environment. Clim. Change 2000, 46, 159–207. [Google Scholar] [CrossRef]
- Chapin, F.S., III; Sturm, M.; Serreze, M.C.; McFadden, J.P.; Key, J.R.; Lloyd, A.H.; McGuire, A.D.; Rupp, T.S.; Lynch, A.H.; Schimel, J.P.; et al. Role of Land-Surface Changes in Arctic Summer Warming. Science 2005, 310, 657–660. [Google Scholar] [CrossRef]
- Serreze, M.C.; Barry, R.G. Processes and impacts of Arctic amplification: A research synthesis. Glob. Planet Change 2011, 77, 85–96. [Google Scholar] [CrossRef]
- Walker, D.A.; Epstein, H.E.; Jia, G.J.; Balser, A.; Copass, C.; Edwards, E.J.; Gould, W.A.; Hollingsworth, J.; Knudson, J.; Maier, H.A.; et al. Phytomass, LAI, and NDVI in northern Alaska: Relationships to summer warmth, soil pH, plant functional types, and extrapolation to the circumpolar Arctic. J. Geophys. Res. Atmos. 2003, 108, 8169. [Google Scholar] [CrossRef]
- Vegetation and the Atmosphere; Monteith, J.L., Ed.; Principles; Academic Press Inc.: London, UK, 1975; Volume 1, pp. 13–150. [Google Scholar]
- Gates, D.M. Biophysical Ecology; Dover Publications Inc.: Mineola, NY, USA, 1980; pp. 12–54. [Google Scholar]
- Monteith, J.L.; Unsworth, M. Principles of Environmental Physics, 2nd ed.; Butterworth-Heinemann: Oxford, UK, 1990; pp. 177–217. [Google Scholar]
- Jones, H.G. Plants and Microclimate, 2nd ed.; Cambridge University Press: Cambridge, UK, 1992; pp. 106–131. [Google Scholar]
- Pokorný, J. Dissipation of solar energy in landscape—Controlled by management of water and vegetation. Renew. Energ. 2001, 24, 641–645. [Google Scholar] [CrossRef]
- Brom, J.; Pokorný, J. Temperature and humidity characteristics of two willow stands, a peaty meadow and a drained pasture and their impact on landscape functioning. Boreal Environ. Res. 2009, 14, 389–403. [Google Scholar]
- Hesslerová, P.; Pokorný, J.; Brom, J.; Rejšková-Procházková, A. Daily dynamics of radiation surface temperature of different land cover types in a temperate cultural landscape: Consequences for the local climate. Ecol. Eng. 2013, 54, 145–154. [Google Scholar] [CrossRef]
- Oke, T.R. The heat island of the urban boundary layer: Characteristics, causes and effects. In Wind Climate in Cities; Cermak, J.E., Davenport, A.G., Plate, E.J., Domingos, X.V., Eds.; Springer: Dordrecht, The Netherlands, 1995; pp. 81–107. [Google Scholar]
- Armson, D.; Stringer, P.; Ennos, A.R. The effect of tree shade and grass on surface and globe temperatures in an urban area. Urban For. Urban Green. 2012, 11, 245–255. [Google Scholar] [CrossRef]
- Rahman, M.A.; Armson, D.; Ennos, A.R. A comparison of the growth and cooling effectiveness of five commonly planted urban tree species. Urban Ecosyst. 2015, 18, 371–389. [Google Scholar] [CrossRef]
- Mariani, L.; Parisi, S.G.; Cola, G.; Lafortezza, R.; Colangelo, G.; Sanesi, G. Climatological analysis of the mitigating effect of vegetation on the urban heat island of Milan, Italy. Sci. Total Environ. 2016, 569–570, 762–773. [Google Scholar] [CrossRef] [PubMed]
- Pielke, R.A.; Avissar, R. Influence of landscape structure on local and regional climate. Landsc. Ecol. 1990, 4, 133–155. [Google Scholar] [CrossRef]
- Kalnay, E.; Cai, M. Impact of urbanization and land-use change on climate. Nature 2003, 423, 528–531. [Google Scholar] [CrossRef] [PubMed]
- Makarieva, A.M.; Gorshkov, V.G. The Biotic Pump: Condensation, atmospheric dynamics and climate. Int. J. Water 2010, 5, 365–385. [Google Scholar] [CrossRef]
- Hesslerová, P.; Pokorný, J. Forest clearing, water loss, and land surface heating as development costs. Int. J. Water 2010, 5, 401–418. [Google Scholar] [CrossRef]
- Nedbal, V.; Brom, J. Impact of highway construction on land surface energy balance and local climate derived from LANDSAT satellite data. Sci. Total Environ. 2018, 633, 658–667. [Google Scholar] [CrossRef] [PubMed]
- Westermann, S.; Langer, M.; Boike, J. Spatial and temporal variations of summer surface temperatures of high-arctic tundra on Svalbard—Implications for MODIS LST based permafrost monitoring. Remote Sens. Environ. 2011, 115, 908–922. [Google Scholar] [CrossRef]
- Hachem, S.; Duguay, C.R.; Allard, M. Comparison of MODIS-derived land surface temperatures with ground surface and air temperature measurements in continuous permafrost terrain. Cryosphere 2012, 6, 51–69. [Google Scholar] [CrossRef]
- Vourlitis, G.L.; Oechel, W.C. Eddy covariance measurements of CO2 and energy fluxes of an Alaskan tussock tundra ecosystem. Ecology 1999, 80, 686–701. [Google Scholar] [CrossRef]
- Westermann, S.; Lüers, J.; Langer, M.; Piel, K.; Boike, J. The annual surface energy budget of a high-arctic permafrost site on Svalbard, Norway. Cryosphere 2009, 3, 245–263. [Google Scholar] [CrossRef]
- Lüers, J.; Bareiss, J. Direct near-surface measurements of sensible heat fluxes in the Arctic tundra applying eddy covariance and laser scintillometry—The Arctic Turbulence Experiment 2006 on Svalbard (ARCTEX-2006). Theor. Appl. Climatol. 2011, 105, 387–402. [Google Scholar] [CrossRef]
- Brázdil, R.; Chmal, H.; Kida, J.; Klementowski, J.; Konečný, M.; Pereyma, J.; Piasecki, J.; Prošek, P.; Sobik, M.; Szczepankiewicz-Szmyrka, A. Results of Investigation of the Geographical Research Expedition Spitsbergen 1985; University of J.E. Purkyně: Brno, Czech Republic, 1988; pp. 152–178. [Google Scholar]
- McFadden, J.P.; Chapin, F.S., III; Hollinger, D.Y. Subgrid-scale variability in the surface energy balance of arctic tundra. J. Geophys. Res. Atmos. 1988, 103, 28947–28961. [Google Scholar] [CrossRef]
- Lloyd, C.R.; Harding, R.J.; Friborg, T.; Aurela, M. Surface fluxes of heat and water vapour from sites in the European Arctic. Theor. Appl. Climatol. 2001, 70, 9–33. [Google Scholar] [CrossRef]
- Johansen, B.; Karlsen, S.; Tømmervik, H. Vegetation mapping of Svalbard utilising Landsat TM/ETM data. Polar Rec. 2012, 48, 47–63. [Google Scholar] [CrossRef]
- Nordli, Ø.; Przybylak, R.; Ogilvie, A.E.J.; Isaksen, K. Long-term temperature trends and variability on Spitsbergen: The extended Svalbard Airport temperature series, 1898–2012. Polar Res. 2014, 33, 21349. [Google Scholar] [CrossRef]
- Láska, K.; Witoszová, D.; Prošek, P. Weather patterns of the coastal zone of Petuniabukta, central Spitsbergen in the period 2008–2010. Pol. Polar Res. 2012, 33, 297–318. [Google Scholar] [CrossRef]
- USGS. LANDSAT 8 (L8) Data Users Handbook; Department of the Interior U.S. Geological Survey: Sioux Falls, SD, USA, 2016; pp. 9–98.
- USGS. Product Guide. LANDSAT 8 Surface Reflectance Code (LaSRC) Product; Department of the Interior U.S. Geological Survey: Sioux Fall, SD, USA, 2018; pp. 13–27.
- Barsi, J.A.; Schott, J.R.; Palluconi, F.D.; Hook, S.J. Validation of a Web-Based Atmospheric Correction Tool for Single Thermal Band Instruments. Proc. SPIE 2005, 58820. [Google Scholar] [CrossRef]
- Tucker, C.J. Red and photographic infrared linear combinations for monitoring vegetation. Remote Sens. Environ. 1979, 8, 127–150. [Google Scholar] [CrossRef]
- NASA. Atmospheric Correction Parameter Calculator. 2019. Available online: https://atmcorr.gsfc.nasa.gov/ (accessed on 5 September 2020).
- Sobrino, J.A.; Jiménez-Muñoz, J.C.; Paolini, L. Land surface temperature retrieval from LANDSAT TM 5. Remote Sens. Environ. 2004, 90, 434–440. [Google Scholar] [CrossRef]
- Arya, S.P. Introduction to Micrometeorology, 2nd ed.; Academic Press: London, UK, 2001; pp. 28–45. [Google Scholar]
- Kumar, L.; Skidmore, A.K.; Knowles, E. Modelling topographic variation in solar radiation in a GIS environment. Int. J. Geogr. Inf. Sci. 1997, 11, 475–497. [Google Scholar] [CrossRef]
- Tasumi, M.; Allen, R.G.; Trezza, R. At-Surface Reflectance and Albedo from Satellite for Operational Calculation of Land Surface Energy Balance. J. Hydrol. Eng. 2008, 13, 51–63. [Google Scholar] [CrossRef]
- Brutsaert, W. Evapotranspiration into the Atmosphere. Theory, History and Applications; Kluwer Academic publishers: Dordrecht, The Netherlands, 1982; pp. 138–141. [Google Scholar]
- Buck, A.L. New Equations for Computing Vapor Pressure and Enhancement Factor. J. Appl. Meteor. 1981, 20, 1527–1532. [Google Scholar] [CrossRef]
- Bastiaanssen, W.G.M. SEBAL-based sensible and latent heat fluxes in the irrigated Gediz Basin, Turkey. J. Hydrol. 2000, 229, 87–100. [Google Scholar] [CrossRef]
- Lhomme, J.-P.; Elguero, E. Examination of evaporative fraction diurnal behaviour using a soil-vegetation model coupled with a mixed-layer model. Hydrol. Earth Syst. Sci. 1999, 3, 259–270. [Google Scholar] [CrossRef]
- Suleiman, A.; Crago, R. Hourly and Daytime Evapotranspiration from Grassland Using Radiometric Surface Temperatures. Agron. J. 2004, 96, 384–390. [Google Scholar] [CrossRef]
- Harding, R.J.; Lloyd, C.R. Fluxes of Water and Energy from Three High Latitude Tundra Sites in Svalbard. Hydrol. Res. 1998, 29, 267–284. [Google Scholar] [CrossRef]
- Hrbáček, F.; Kňažková, M.; Nývlt, D.; Láska, K.; Mueller, C.W.; Ondruch, J. Active layer monitoring at CALM-S site near J.G.Mendel Station, James Ross Island, eastern Antarctic Peninsula. Sci. Total Environ. 2017, 601–602, 987–997. [Google Scholar] [CrossRef]
- Rott, H.; Obleitner, F. The Energy Balance of Dry Tundra in West Greenland. Arct. Antarct. Alp. Res. 1992, 24, 352–362. [Google Scholar] [CrossRef]
- Migała, K.; Wojtuń, B.; Szymański, W.; Muskała, P. Soil moisture and temperature variation under different types of tundra vegetation during the growing season: A case study from the Fuglebekken catchment, SW Spitsbergen. Catena 2014, 116, 10–18. [Google Scholar] [CrossRef]
- Ambrožová, K.; Hrbáček, F.; Láska, K. The Summer Surface Energy Budget of the Ice-Free Area of Northern James Ross Island and Its Impact on the Ground Thermal Regime. Atmosphere 2020, 11, 877. [Google Scholar] [CrossRef]
- Epstein, H.E.; Raynolds, M.K.; Walker, D.A.; Bhatt, U.S.; Tucker, C.J.; Pinzon, J.E. Dynamics of aboveground phytomass of the circumpolar Arctic tundra during the past three decades. Environ. Res. Lett. 2012, 7, 015506. [Google Scholar] [CrossRef]
- Johansen, B.; Tømmervik, H. The relationship between phytomass, NDVI and vegetation communities on Svalbard. Int. J. Appl. Earth Obs. Geoinf. 2014, 27, 20–30. [Google Scholar] [CrossRef]
- Larcher, W. Physiological Plant Ecology, 4th ed.; Springer Verlag: Berlin, Germany, 2003. [Google Scholar]
- Kirkham, M.B. Principles of Soil and Plant Water Relations; Academic Press: Amsterdam, The Netherlands, 2004; pp. 67–240. [Google Scholar]
- Jaksic, V.; Kiely, G.; Albertson, J.; Oren, R.; Katul, G.; Leahy, P.; Byrne, K.A. Net ecosystem exchange of grassland in contrasting wet and dry years. Agric. For. Meteor. 2006, 139, 323–334. [Google Scholar] [CrossRef]
- Wang, K.; Wang, P.; Li, Z.; Cribb, M.; Sparrow, M. A simple method to estimate actual evapotranspiration from a combination of net radiation, vegetation index, and temperature. J. Geophys. Res. Atmos. 2007, 112. [Google Scholar] [CrossRef]
- Arora, V. Modeling Vegetation as a Dynamic Component in Soil-Vegetation-Atmosphere Transfer Schemes and Hydrological Models. Rev. Geophys. 2002, 40, 3-1–3-26. [Google Scholar] [CrossRef]
- Opała-Owczarek, M.; Pirożnikow, E.; Owczarek, P.; Szymański, W.; Luks, B.; Kępski, D.; Szymanowski, M.; Wojtuń, B.; Migała, K. The influence of abiotic factors on the growth of two vascular plant species (Saxifraga oppositifolia and Salix polaris) in the High Arctic. Catena 2018, 163, 219–232. [Google Scholar] [CrossRef]
- Zeng, Z.; Piao, S.; Li, L.Z.X.; Wang, T.; Ciais, P.; Lian, X.; Yang, Y.; Mao, J.; Shi, X.; Myneni, R.B. Impact of Earth Greening on the Terrestrial Water Cycle. J. Climate 2018, 31, 2633–2650. [Google Scholar] [CrossRef]


Publisher’s Note: MDPI stays neutral with regard to jurisdictional claims in published maps and institutional affiliations. |
© 2020 by the authors. Licensee MDPI, Basel, Switzerland. This article is an open access article distributed under the terms and conditions of the Creative Commons Attribution (CC BY) license (http://creativecommons.org/licenses/by/4.0/).