Article

An Ensemble Learning Approach for Urban Land Use Mapping Based on Remote Sensing Imagery and Social Sensing Data

1
Institute of Remote Sensing and Geographical Information Systems, School of Earth and Space Sciences, Peking University, Beijing 100871, China
2
Beijing Key Lab of Spatial Information Integration & Its Applications, Peking University, Beijing 100871, China
3
Engineering Research Center of Earth Observation and Navigation, Ministry of Education, Peking University, Beijing 100871, China
4
School of Remote Sensing and Information Engineering, Wuhan University, Wuhan 430079, China
5
Center for Urban Science + Progress, New York University, New York, NY 10012, USA
6
AutoNavi Software Co., Ltd., Beijing 100102, China
*
Author to whom correspondence should be addressed.
Remote Sens. 2020, 12(19), 3254; https://doi.org/10.3390/rs12193254
Submission received: 7 August 2020 / Revised: 16 September 2020 / Accepted: 28 September 2020 / Published: 7 October 2020
(This article belongs to the Section Urban Remote Sensing)

Abstract

:
Urban land use mapping is crucial for effective urban management and planning due to the rapid change of urban processes. State-of-the-art approaches rely heavily on the socioeconomic, topographical, infrastructural and land cover information of urban environments via feeding them into ad hoc classifiers for land use classification. Yet, the major challenge lies in the lack of a universal and reliable approach for the extraction and combination of physical and socioeconomic features derived from remote sensing imagery and social sensing data. This article proposes an ensemble-learning-approach-based solution of integrating a rich body of features derived from high resolution satellite images, street-view images, building footprints, points-of-interest (POIs) and social media check-ins for the urban land use mapping task. The proposed approach can statistically differentiate the importance of input feature variables and provides a good explanation for the relationships between land cover, socioeconomic activities and land use categories. We apply the proposed method to infer the land use distribution in fine-grained spatial granularity within the Fifth Ring Road of Beijing and achieve an average classification accuracy of 74.2% over nine typical land use types. The results also indicate that our model outperforms several alternative models that have been widely utilized as baselines for land use classification.

Graphical Abstract

1. Introduction

Automatic urban land use mapping is crucial for effective urban management and planning. It provides an essential tool for examining the way social, economic and ecological factors shape the spatial structure and change of urban processes under both empirical and simulation scenarios [1].State-of-the-art approaches heavily rely on the socioeconomic, topographical, infrastructural and land cover information of urban environments via feeding them into ad hoc classifiers for land use classifications. Examples include the derivation of the physical characteristics (i.e., urban structure) of the built-up environments from remote sensing imagery [2], and the extraction of spatiotemporal characteristics (i.e., urban dynamics) from social sensing data [3], in order to determine the functional characteristics (i.e., land use) of urban areas [4,5,6].
Yet, the performance of existing approaches strongly depends on the availability of different types of data, as well as the derived features of urban built environments for the parameterization, calibration and validation of the land use mapping process [7]. Landscape is considered to be closely related to urban dynamics, and the landscape metrics abstracted from remote sensing imagery or building data could be used for modelling and inferring urban functions [8,9,10,11,12]. A popular branch of study applies computer vision techniques to remote sensing imagery, quantifies the similarities and differences of different objects in each band of the image and obtains pixel-wise or patch-wise land cover information with fine spatial granularity [13]. In particular, the rapid development of machine learning approaches in the domain of computer vision has further enriched land-cover-based land use classification studies in the last decade. For instance, Huang et al. [14] developed a novel semitransfer deep convolutional neural network (STDCNN) model to process multispectral remote sensing images with more than three channels and recognized land uses in Shenzhen and Hong Kong at the street block level. Zhang et al. [15] proposed an innovative object-based convolutional neural network (OCBN) method to improve the accuracy and computational efficiency of urban land use classification from very fine spatial resolution remotely sensed imagery. It is also noteworthy that auxiliary physical information regarding land parcels, such as the semantic features derived from sparsely distributed street-view images, has also been adopted or fused with land cover information through deep neural network to improve land use classification resolution and accuracy [16]. For instance, Li et al. [17] extracted GIST, histograms of oriented gradients (HoG), scale-invariant feature transform-Fisher (SIFT-Fisher) and other image features from street-view images to train a support vector machine (SVM) classifier, which can distinguish between residential and nonresidential buildings and further divide the former into single family and multifamily buildings. Kang et al. [18] classified façade structure from street-view images in addition to roof structures from remote sensing images to generate land use maps at the individual building level, as well as on region and city scales. Zhang et al. [19] tested the performance of a parcel-based land use classification method using a random forest classifier combining airborne light detection and ranging (LiDAR) data, high resolution orthoimage (HRO) and Google Street View (GSV) images, and evaluated the use of GSV to separate parcels of mixed residential and commercial buildings from other land use parcels.
Unfortunately, land cover and place scene-based physical information alone is insufficient to fully determine urban land uses due to the fact that socioeconomic attributes play an important role, yet are not captured in remote sensing or street-view imageries. Recognizing this limitation, another branch of studies concentrates on deriving socioeconomic features from social sensing data and then examines the connections between socioeconomic features and land use types [20,21,22]. Popular data sources include points-of-interest (POIs), social media check-ins, global positioning system (GPS) trajectories, mobile phone positioning records and many other user generated content (UGC) types. For instance, Yao et al. [23] applied topic models to POI data and extracted high-dimensional thematic characteristics of each land parcel to infer urban land use types. Ge et al. [24] proposed a fuzzy comprehensive evaluation (FCE) approach, as well as taxi trajectory data to integrate multiple human activity features for land use classification. By using POI data, Chen et al. [25] implemented a comparative analysis with 25 major cities in China to determine their commonness/distinctiveness in the spatial organization of urban functions. Frias-Martinez and Frias-Martinez [26] applied K-means clustering to the time-series curves of tweets generated by Twitter users and revealed that the curves of different urban functional zones were quite different. Yuan et al. [27] developed a topic-modeling-based approach to cluster the urban street blocks into different functional zones by leveraging mobility and location semantics mined from latent activity trajectory. Liu et al. [28] proposed an automated method for delineating parcel functions based on OpenStreetMap and POI data. Xing et al. [29] integrated landscape metrics from building data and socioeconomic features from POI data for urban functional region classification. Similarly, mobile phone data, which is more sophisticated and information-intensive, can be used to effectively label land use and urban patterns [30,31,32].
Furthermore, relevant studies have demonstrated that advanced approaches with a combination of remote sensing and social sensing data for urban land use discrimination can yield significantly improved performance compared with previous approaches. For instance, Hu et al. [33] constructed POI density, NDVI, NVBI and other characteristics from Sina Weibo POIs and Landsat remote sensing images to measure and explore the feature similarity between different land use types. Xia et al. [34] developed an approach to combine multisource features from remote sensing and geolocation datasets, including night-time lights, vegetation cover, land surface temperature, population density, LRD, accessibility and road networks, to extract urban areas at large scales. Zhang et al. [35] proposed a Hierarchical Semantic Cognition framework for the classification of urban functional zones based on objects segmented from the remote sensing images and labeled with nearby POI information. Liu et al. [36] developed a new classification framework to identify dominant urban land use type at the level of traffic analysis zones by integrating natural-physical features from remote sensing images and socioeconomic features from social media data. Zhang et al. [37] developed a method to synthetically utilize spectral and structural features from GF2 image data and spatiotemporal distributions of Weibo check-ins and POI data as the input of random forest to differentiate land use types. Nonetheless, the major challenge lies in the fact that existing research lacks a universal and reliable approach for the extraction and combination of physical and socioeconomic features derived from remote sensing and social sensing data sources. It is still challenging to accurately identify fine-grained urban land use based on the comprehensive information of urban environments derived from multisourced remote sensing and social sensing data.
To fill the research gap, this article proposes an ensemble-learning-approach-based solution of integrating rich features in remote sensing and social sensing data for urban land use mapping tasks. We utilize diverse datasets including high resolution satellite images, street-view images, building footprints, POIs and social media check-ins in the ensemble framework. We then extract essential physical and socioeconomic features of urban environments from these datasets based on image segmentation and feature embedding methods. Last, we apply a state-of-the-art ensemble learning approach to determine urban land uses by weighting the derived physical and socioeconomic features of built-up environments. In addition, we empirically verified the efficacy of our proposed approach in the city of Beijing, China.
To the best of our knowledge, we used both the most extensive data sources and an indicator-sensitive ensemble model to achieve a comprehensive perception of urban land use. The contribution of this study lies mainly in the following aspects. First, in terms of delineating urban morphology and extracting physical features, we use high-resolution remote sensing images and street-view images, and extract land cover and scene attributes of city zones by deep learning approaches to construct a semantically rich physical feature space. Secondly, we integrate POI and check-in data to construct a socioeconomic feature space. In particular, check-in information with user classification is used as the socioeconomic feature for the first time, that is, temporal variations of check-in by locals and nonlocals. Thirdly, by using the ensemble learning model, we systematically discuss and quantitatively compare the effects of various physical and socioeconomic indicators on predictions of urban land use attributes.

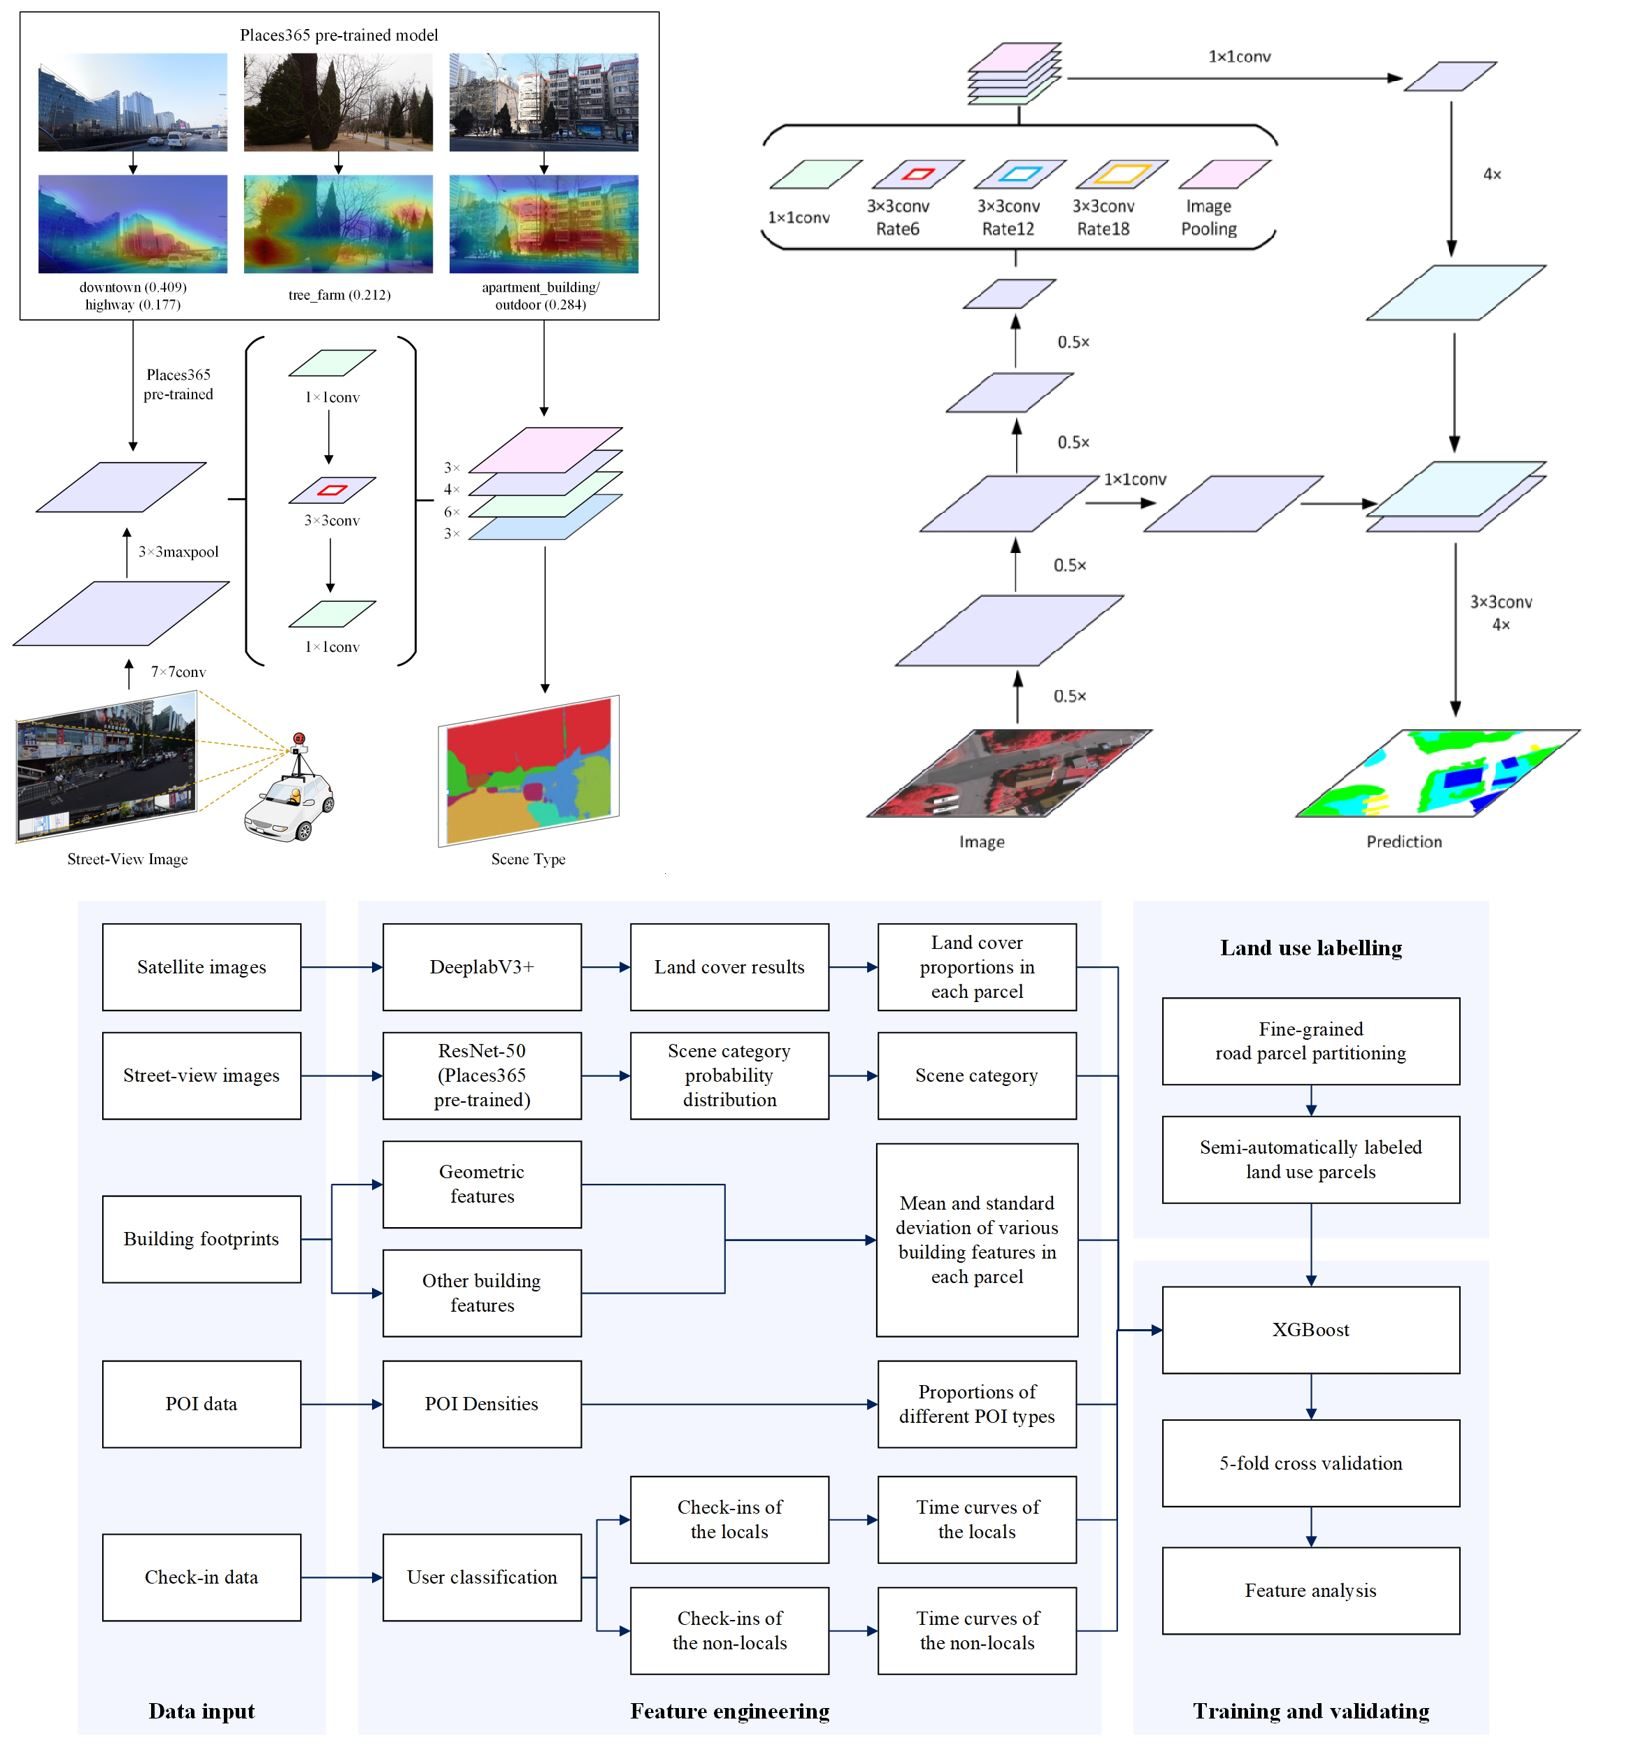
2. Materials and Methods

2.1. The Ensemble Learning Model

Ensemble learning is a popular and effective machine learning approach for classification problems. It builds and combines multiple machine learning algorithms to achieve the learning task, and therefore, is a suitable method for dealing with massive quantities of sparse remote and social sensing data. More importantly, it can statistically determine the importance of feature variables, thus providing a good explanation for the relationships between land cover, socioeconomic activities and land use.
Our proposed ensemble learning framework for urban land use mapping is illustrated in Figure 1. We first categorize the input data into two types as: (1) Image data. This consists of satellite images (from Google Earth with a spatial resolution of 1 m in 2018) and street-view images (from Tencent, one of the largest web mapping platforms in China), which capture the physical characteristic of the urban built-up environment; (2) Non-image data. This includes (publicly available) building footprints, POIs (from Baidu, one of the leading location service providers in China) and social media check-ins (from Weibo, one of the leading social media sharing platforms in China), which provide additional characteristics concerning the socioeconomic activities over urban land parcels. Then, we apply state-of-the-art image segmentation methods, i.e., DeepLabV3+ [38] and ResNet-50, for the extraction of physical features from the image data. Meanwhile, we calculate the spatial and temporal characteristics of the non-image data in order to extract the socioeconomic features. The resultant features include the land cover proportion of the land parcel, the geometric attributes of the building, scene categories of the street-view image, densities and types of the POIs, volumes and temporal variations of the check-ins (See Appendix A for the descriptions of our datasets and the full list of derived features). Last, we feed these features into a state-of-the-art ensemble learning model, XGBoost [39], for urban land use classification and validate the classification accuracy at both fine and coarse granularities using the five-fold cross validation method. We also compare the performance of our model with several alternative baseline models including K-means clustering, latent Dirichlet allocation (LDA) -based topic modeling and the random forest (RF) classifier.

2.2. Urban Feature Engineering

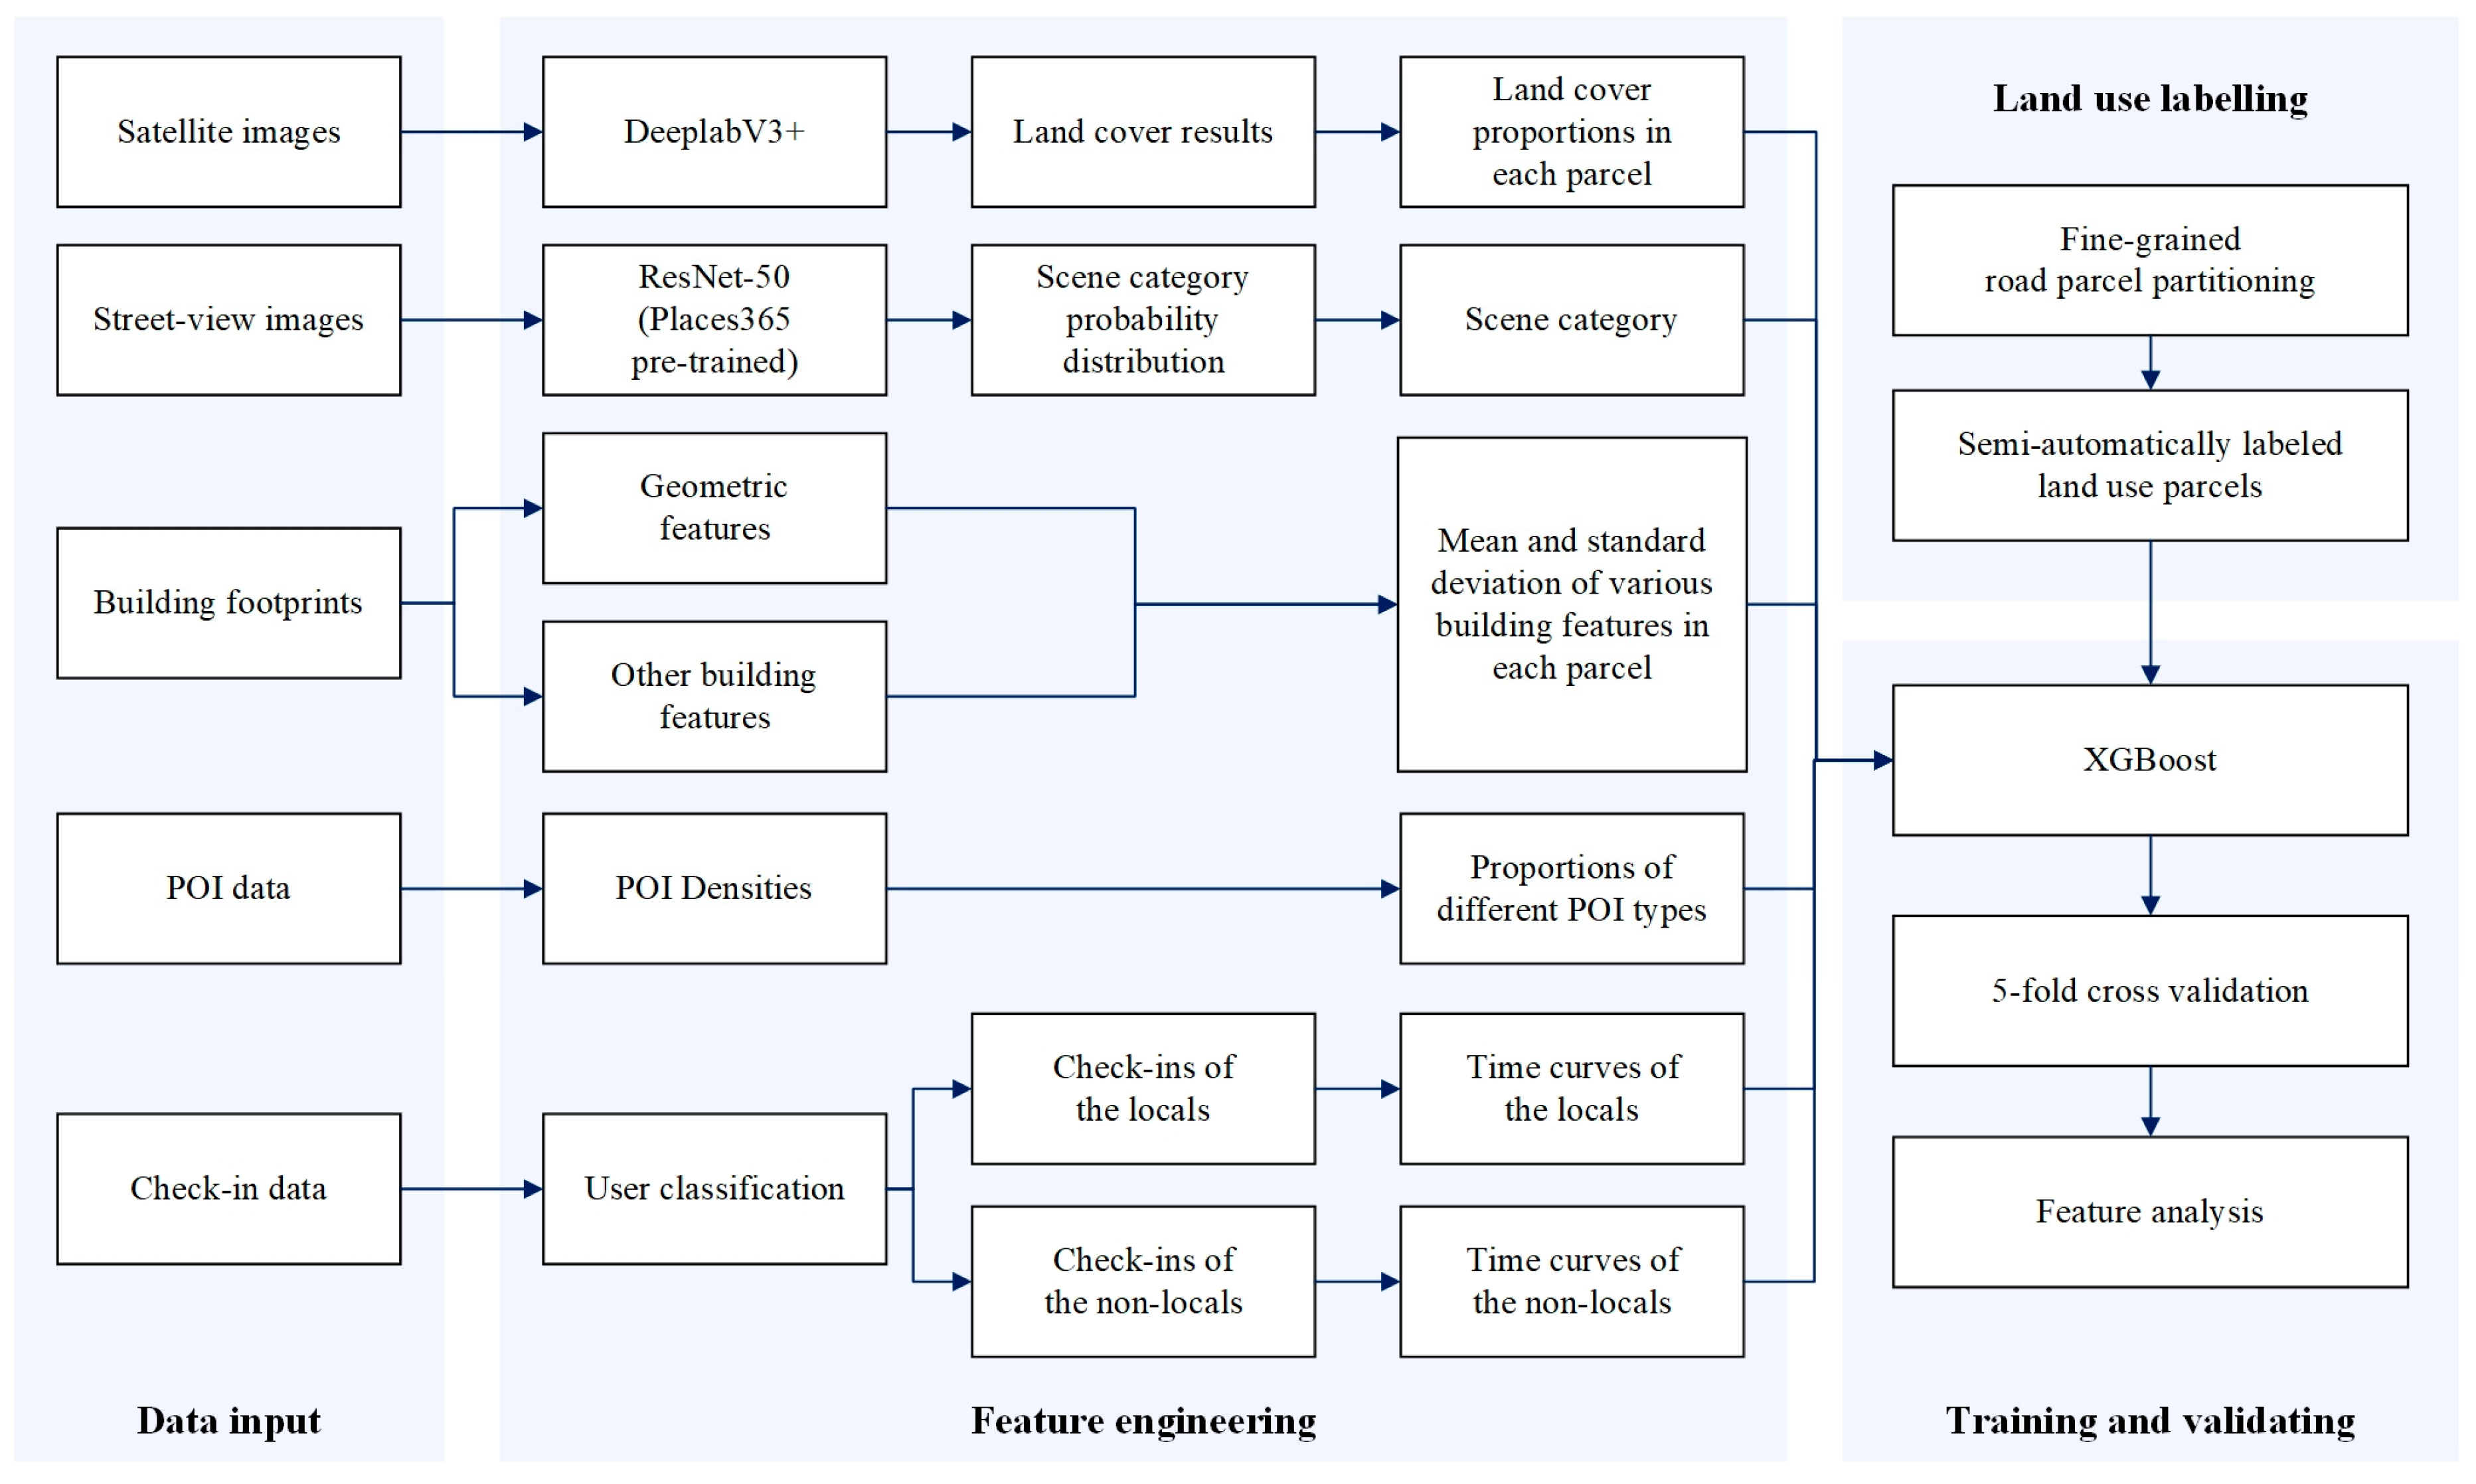
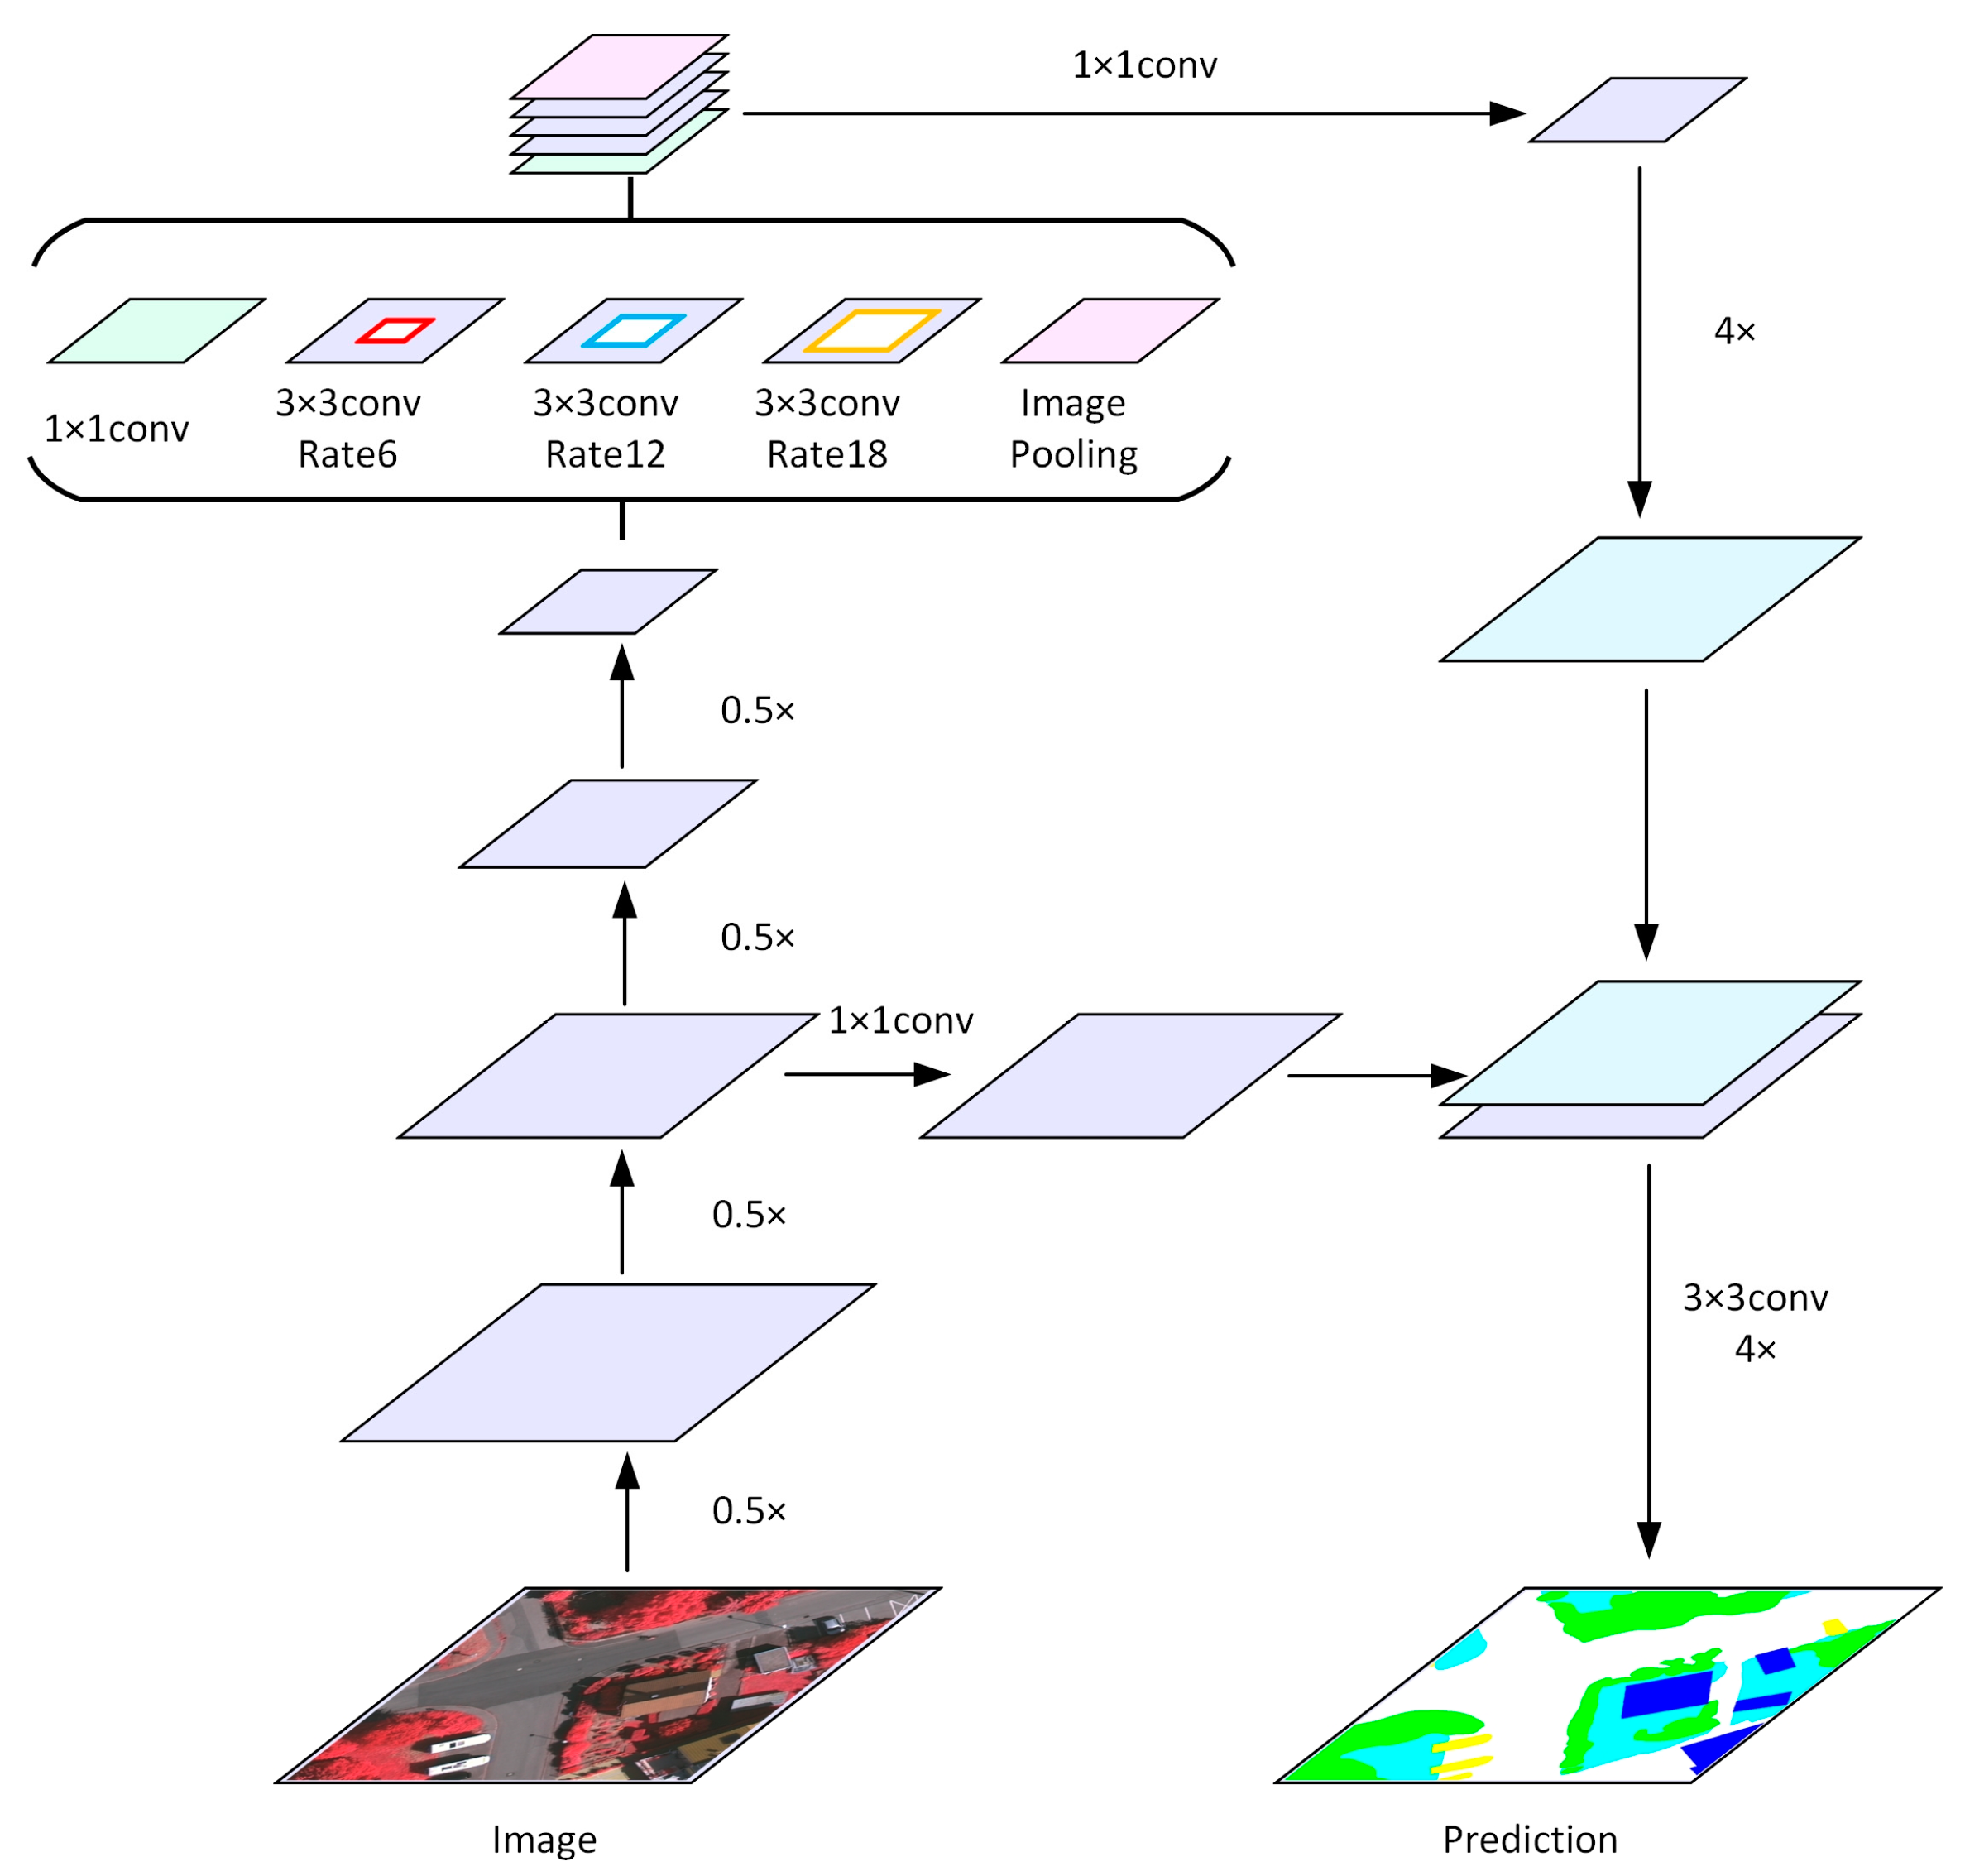
2.2.1. Extraction of Physical Features

Physical features include the 2D land cover information extracted from remote sensing images and the 3D scene information extracted from street-view images. The semantic segmentation model of remote sensing imagery can be used to obtain pixel-level land cover results. CNN-based models represented by FCN [40] have been applied to semantic segmentation of remote sensing imagery. Some subsequent improved models such as SegNet [41] introduced the encoder-decoder structure, and DeepLabV3+ [38] further improved the precision of semantic segmentation by combining encoder-decoder structure with SPP (Spatial Pyramid Pooling) [42]. The scene vectors of street blocks (parcels) can be gathered by using scene extraction models of street-view images. Since AlexNet, as a multilayer convolutional neural network, has been shown to have excellent performance [43], subsequent CNN networks such as VGG, GoogleNet and ResNet have continuously improved the scene classification precision [44,45].
The 2D land cover information is extracted using the DeepLabV3+ architecture (see Figure 2). The model follows the classical encoder-decoder structure, where the encoder captures semantic information and the decoder recovers spatial information. In detail, the encoder consists of two modules: (1) The Deep Convolution Neural Network (DCNN) module, which uses the Xception_65 backbone network to extract features. We remove the fully connected layer and replace the max-pooling operations with a depth-wise separable convolution to adapt the original Xception network to our classification task and to obtain more detailed local features. To accelerate the convergence of the network and to avoid overfitting, we further impose a batch normalization operation and the ReLU activation function after each 3 × 3 depth-wise convolution; (2) The Atrous Spatial Pyramid Pooling (ASPP) module, which processes the output features from DCNN and probes the convolutional features at multiple scales by applying Atrous convolution at different rates. After the encoder, the decoder up-samples the encoder features bilinearly by a factor of 4, and then concatenates them with the corresponding low-level features from the network backbone (whose number of channels is reduced by a 1 × 1 convolution) with the same spatial resolution. Thereafter, we apply 3 × 3 convolutions and another bilinear up-sampling by a factor of 4 to refine the feature and obtain the result with the same size of the input image.
To enrich the physical features of an urban built-up environment, the 3D scene of a street-view image is further recognized by the ResNet-50 model (see Figure 3). We pretrain the model using the Places2 dataset [46], which contains approximately 10 million images belonging to 365 common scene types. Applying the model, we obtain a 365-dimensional output, indicating the probabilities of each of the 365 scene types that a given input street-view image belongs to. We summarize the probabilities of all the street-view images in each parcel and take the predominate scene assignment as the final scene category of the land parcel. It is worth noting that although that street-view images are limited in their spatiotemporal coverages, they provide auxiliary information of the physical built-up environment from 2D nadir view to 3D dimensions for land use classification.

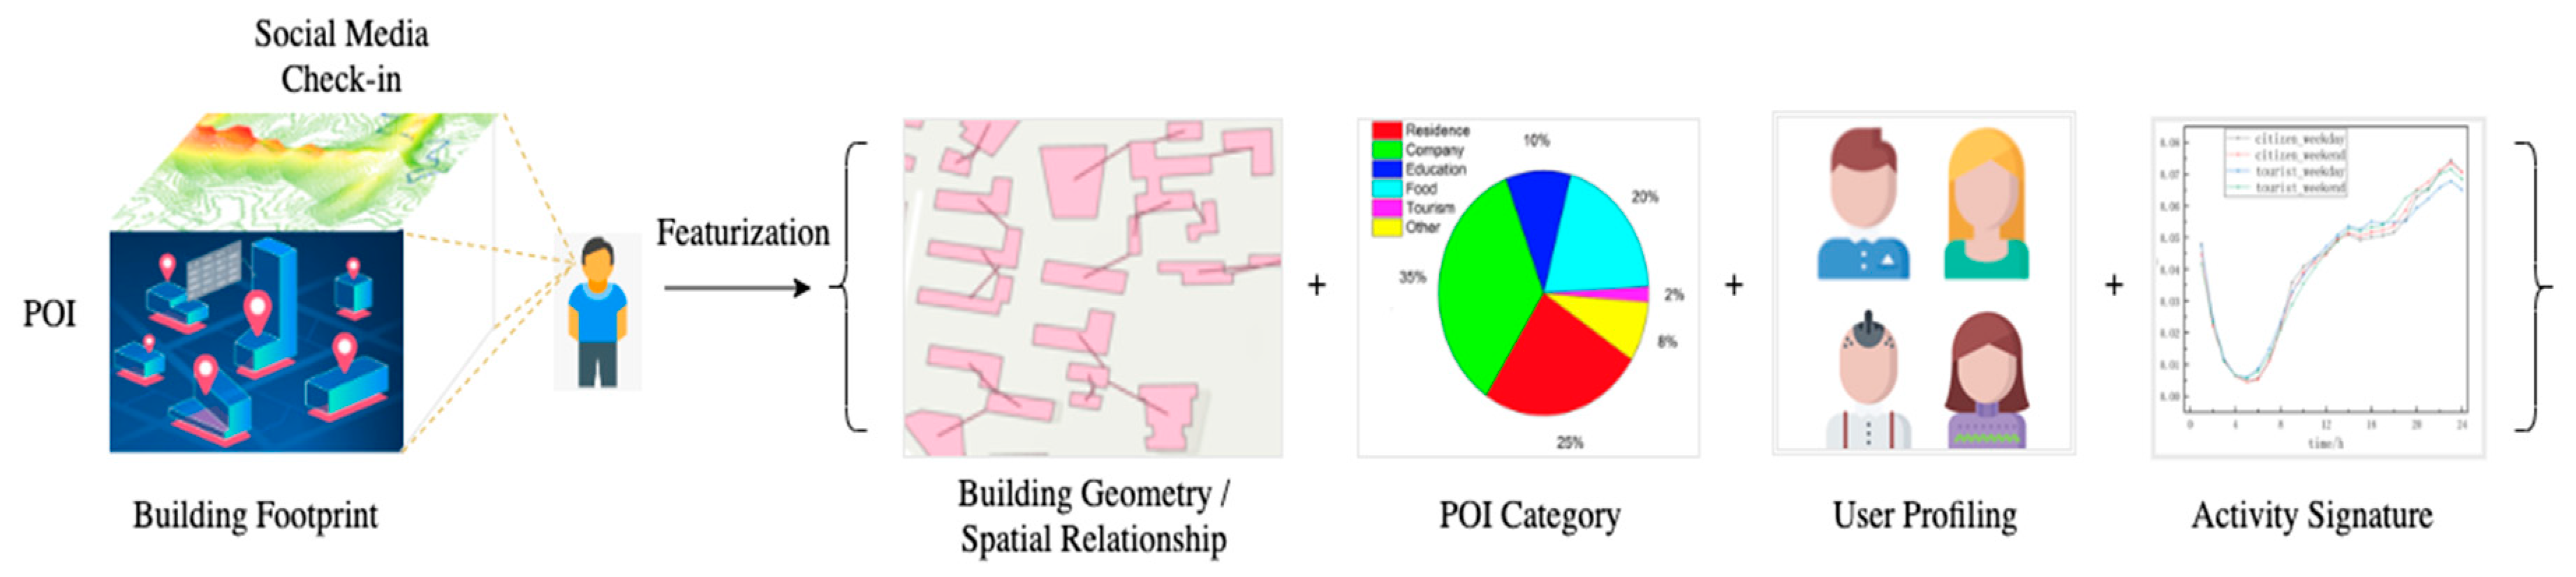
2.2.2. Extraction of Socioeconomic Features

The socioeconomic attributes associated with urban spaces provide essential evidence of the functional use of the urban land parcels. In this research, we first leverage building footprints to understand the spatiotemporal characteristics of urban facilities, including the geographical location, geometry, number of floors and year of completion information. For each building feature, we calculate the mean value and the standard deviation to reveal the spatiotemporal diversity of buildings in the land parcels and obtain a 15-dimentional feature vector. Beyond the spatiotemporal diversity, we also utilize the POI data to measure the socioeconomic diversity of urban facilities in each land parcel. Specifically, the POIs comprise 21 types, including catering, hotel, shopping, leisure and entertainment, cultural media, tourist attraction, education and training, beauty, college, enterprise, medical, automotive services, government and organization, kindergarten and primary schools, transportation facility, sports, life services, parking, finance and residence and office buildings. Thereafter, we calculate the density and the proportion of different POIs for each parcel and obtain a 46-dimentional feature vector. A detailed category scheme is described in the Appendix A, Table A1.
Considering that different POIs often have different attractions to human activities, we further differentiate the spatiotemporal and socioeconomic characteristics of urban land parcels using social media check-in data. Each check-in record contains a user ID, check-in time and spatial location. We use a random forest-based model proposed in the literature [47] to determine the residence city of each user. The model is based on the check-in frequency in different cities and the random forest algorithm, which yields a reliable separation of visitors from local residents in the target city. Based on the inferred user profiles, we divide check-ins into local and nonlocal. In so doing, we obtain the densities and temporal variations of check-ins by local and nonlocal users in each parcel (i.e., street block) as important socioeconomic features for the proposed ensemble learning model. We finally integrate the feature vectors derived from building, POI and check-in activity as the final socioeconomic feature of the learning model (as illustrate in Figure 4).

2.3. Land Use Taxonomy for Model Training and Validation

To train and validate the proposed land use classification model, we adopt a land use taxonomy predefined by the Land Administration Law of the People’s Republic of China (GBT 21010–2017). According to the taxonomy, land use types are classified in a hierarchical manner, consisting of cultivated land, garden land, woodland, grassland, commercial land, industrial land, residential land, public management and public service land, special land, transportation land, water and water conservancy facilities and other land. We filter our land use categories that are nonexistent in the case the studied city, Beijing, and generate nine refined land use categories at both coarse- and fine-grained scales to provide the final urban land use taxonomy (see Table 1).
According to the refined classification criteria, we semi-automatically label the land use type for each land parcel and construct training and testing sets. The labelling process is based on the land use planning map provided by the Beijing Municipal Commission of Planning and Natural Resources. We rescale the land use map into street block granularity by counting the area of each land use type, and assign the label based on the dominant land use type or by visual interpretation. The detailed procedure for land use labelling is shown in Algorithm 1. The two thresholds of parameter P[0] and that of parameter P[1] are determined by experiments. Firstly, 10% parcels are randomly selected, and different classification results can be obtained by manually assigning parameters. Then, the parameter combinations (i.e., 0.6, 0.4 and 0.2) which led to the highest labelling accuracy are selected through manual interpretation. Thereafter, during the training and testing procedures, we feed all the aforementioned features obtained by feature engineering (in Section 2.2) into the XGBoost classifier and use five-fold cross-validation to evaluate model performance. Several trials are made to tweak the hyperparameters of the XGBoost model to improve the final classification precision during our case study. For example, the maximum depth of the tree max_depth is set to 9, the learning rate eta is set to 0.01 and the number of iterations num_round is set to 5000.
Algorithm 1 Semi-Automatically Label Method
Input: Research units U, Land use type data in raster dataset LU
Output: Label of land use type for each unit L
Foreach unit u of U do
  I←the number of each raster cells intersects with u
  P←Proportion of each type in I
  P←sort(P)
  If P [0] > 0.6 do
  //Pure parcel
  L[u]←type of P[0]
  Else if P[0] > 0.4 and P[1] < 0.2 do
    //Mixed parcel with a major category
  L[u]←type of P[0]
  Else
  //Mixed parcel
    L[u]←Artificial discrimination considering multisource data such as
    POI and Street view
  End
End
Return L
There are several reasons for selecting XGBoost as the land use classifier. First, XGBoost, as an ensemble learning model, makes a decision based upon a combination of multiple tree-based classifiers, and so is more robust than a single classifier. Second, due to the imbalance in the number of each category of land use, the boosting sampling method adopted by XGBoost is more suitable, since it focuses more on the misclassification samples in the category with fewer total samples. This is conducive to maximizing the accuracy of each category. Third, XGBoost has a good effect on sparse data [39]. It especially fits the classification scenarios for fine-grained parcels where sample data are sparse in the case study.

3. Results

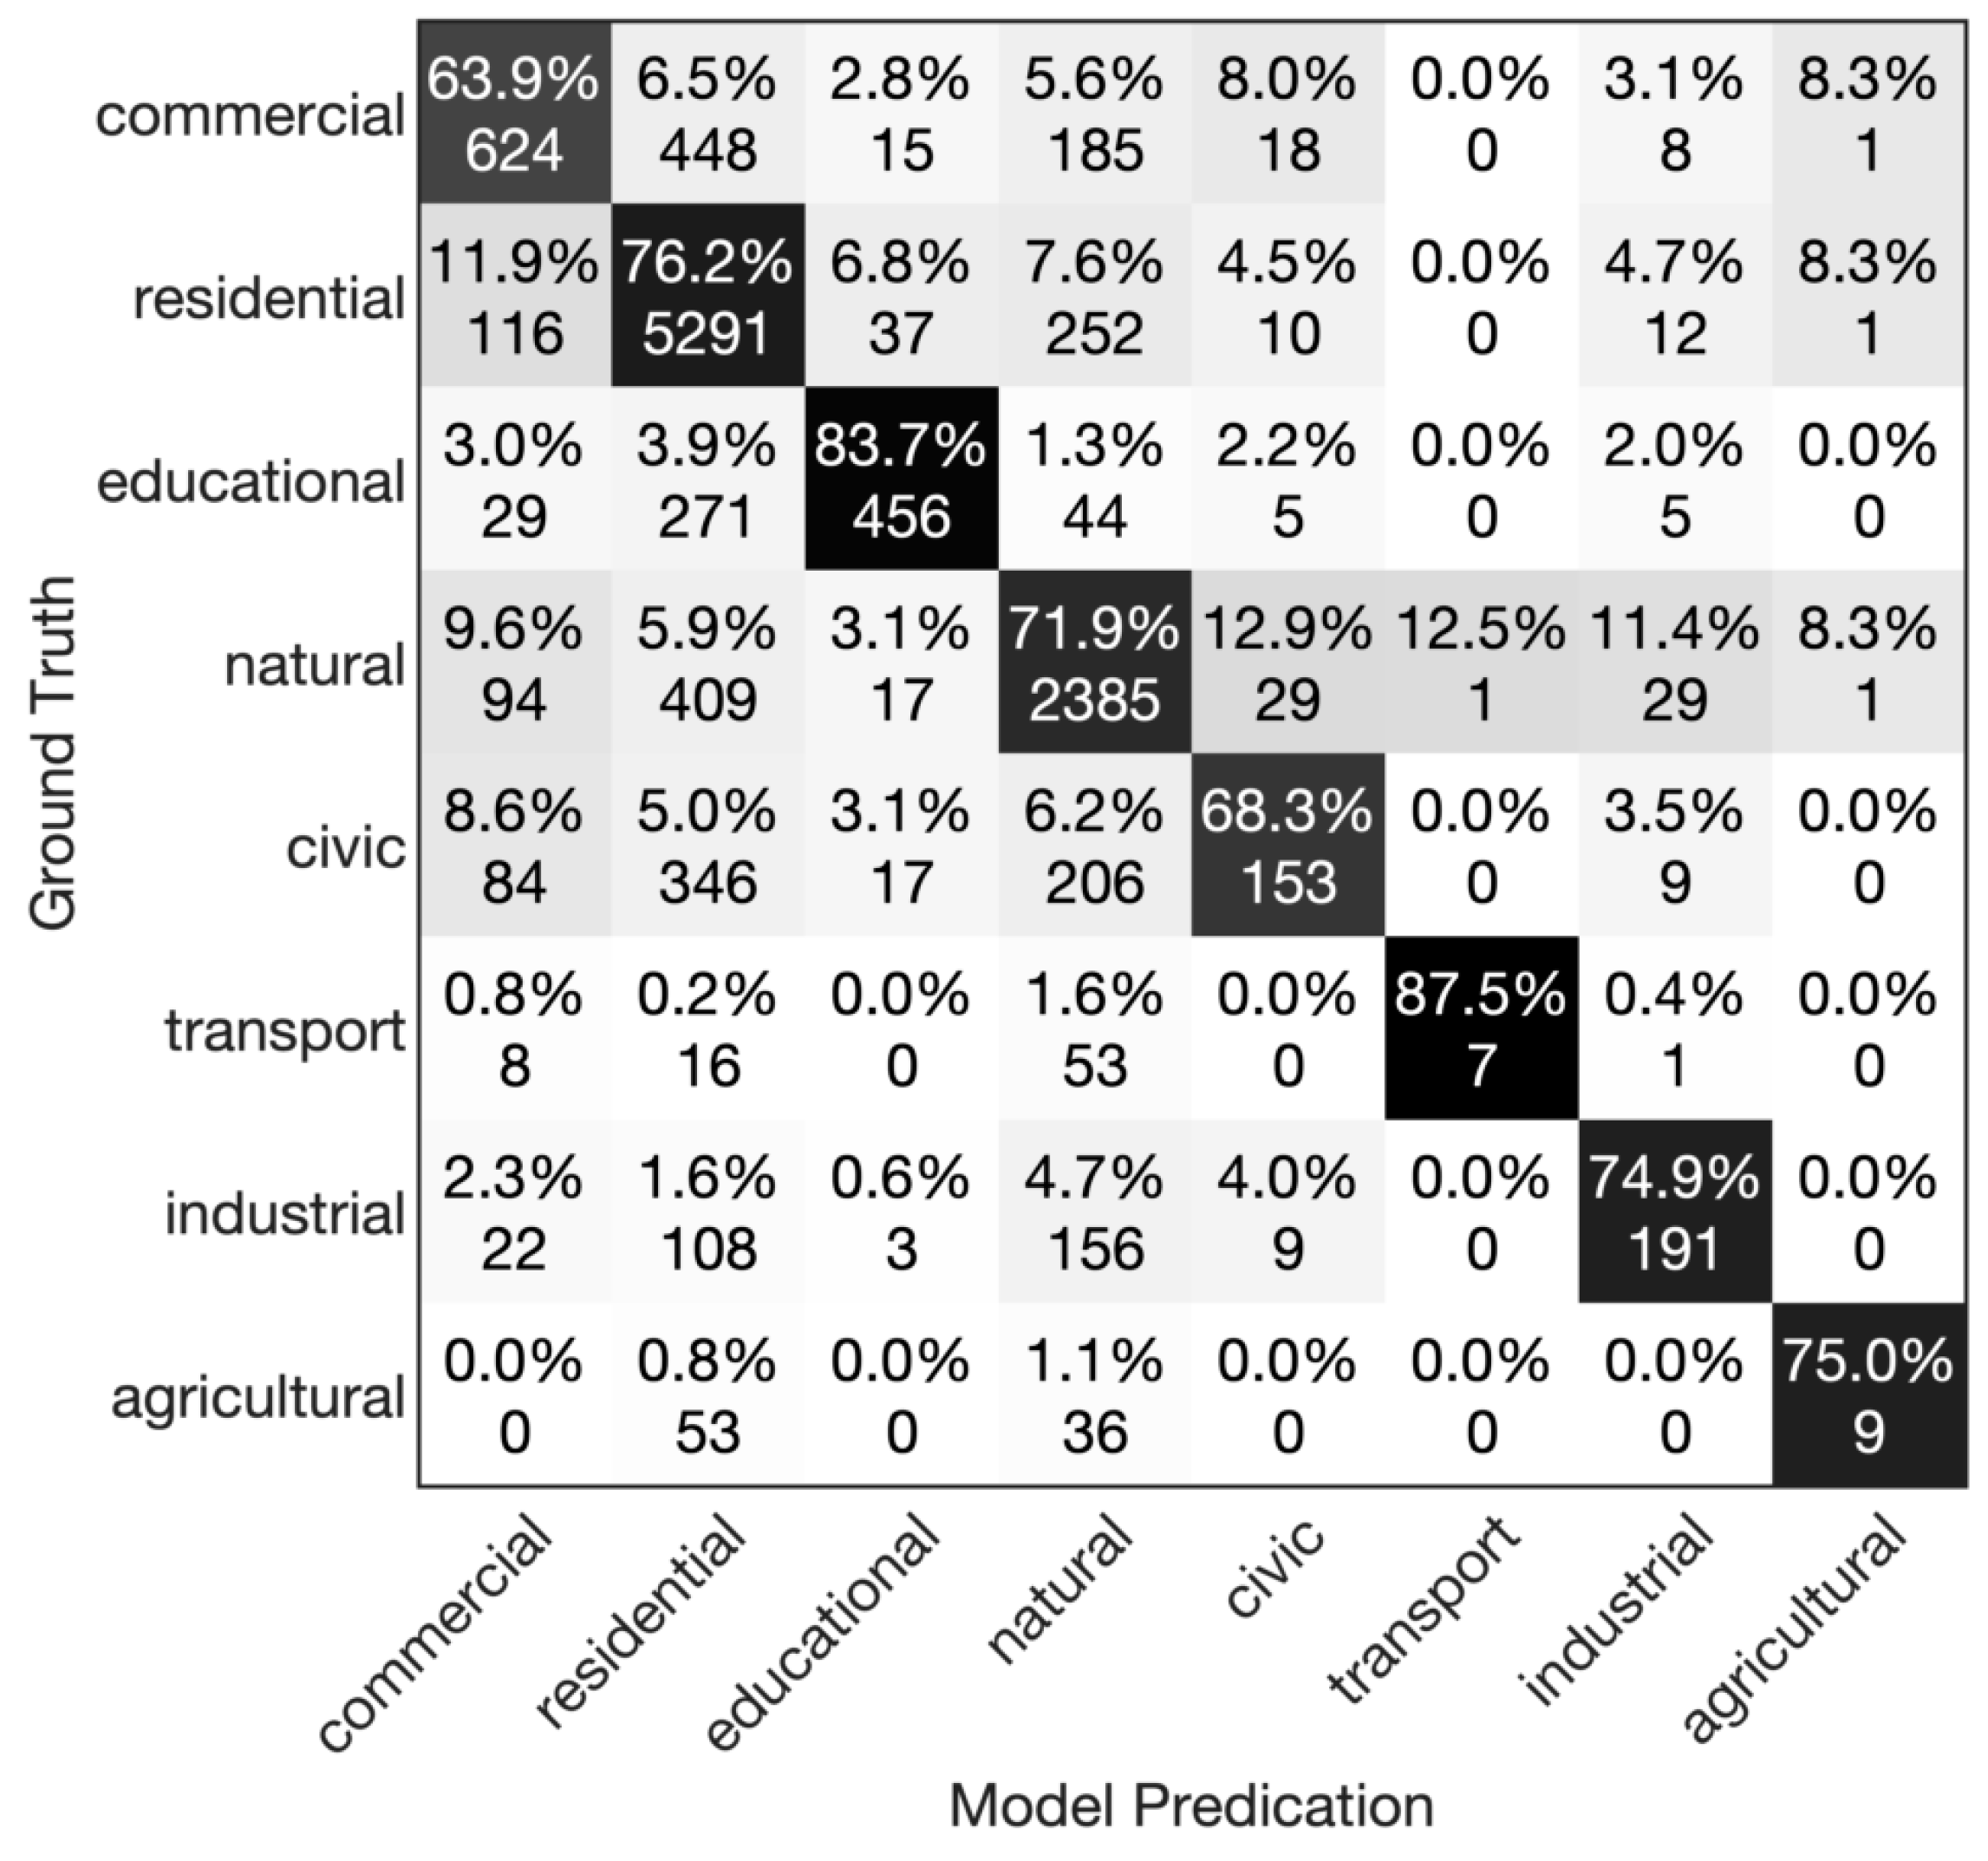
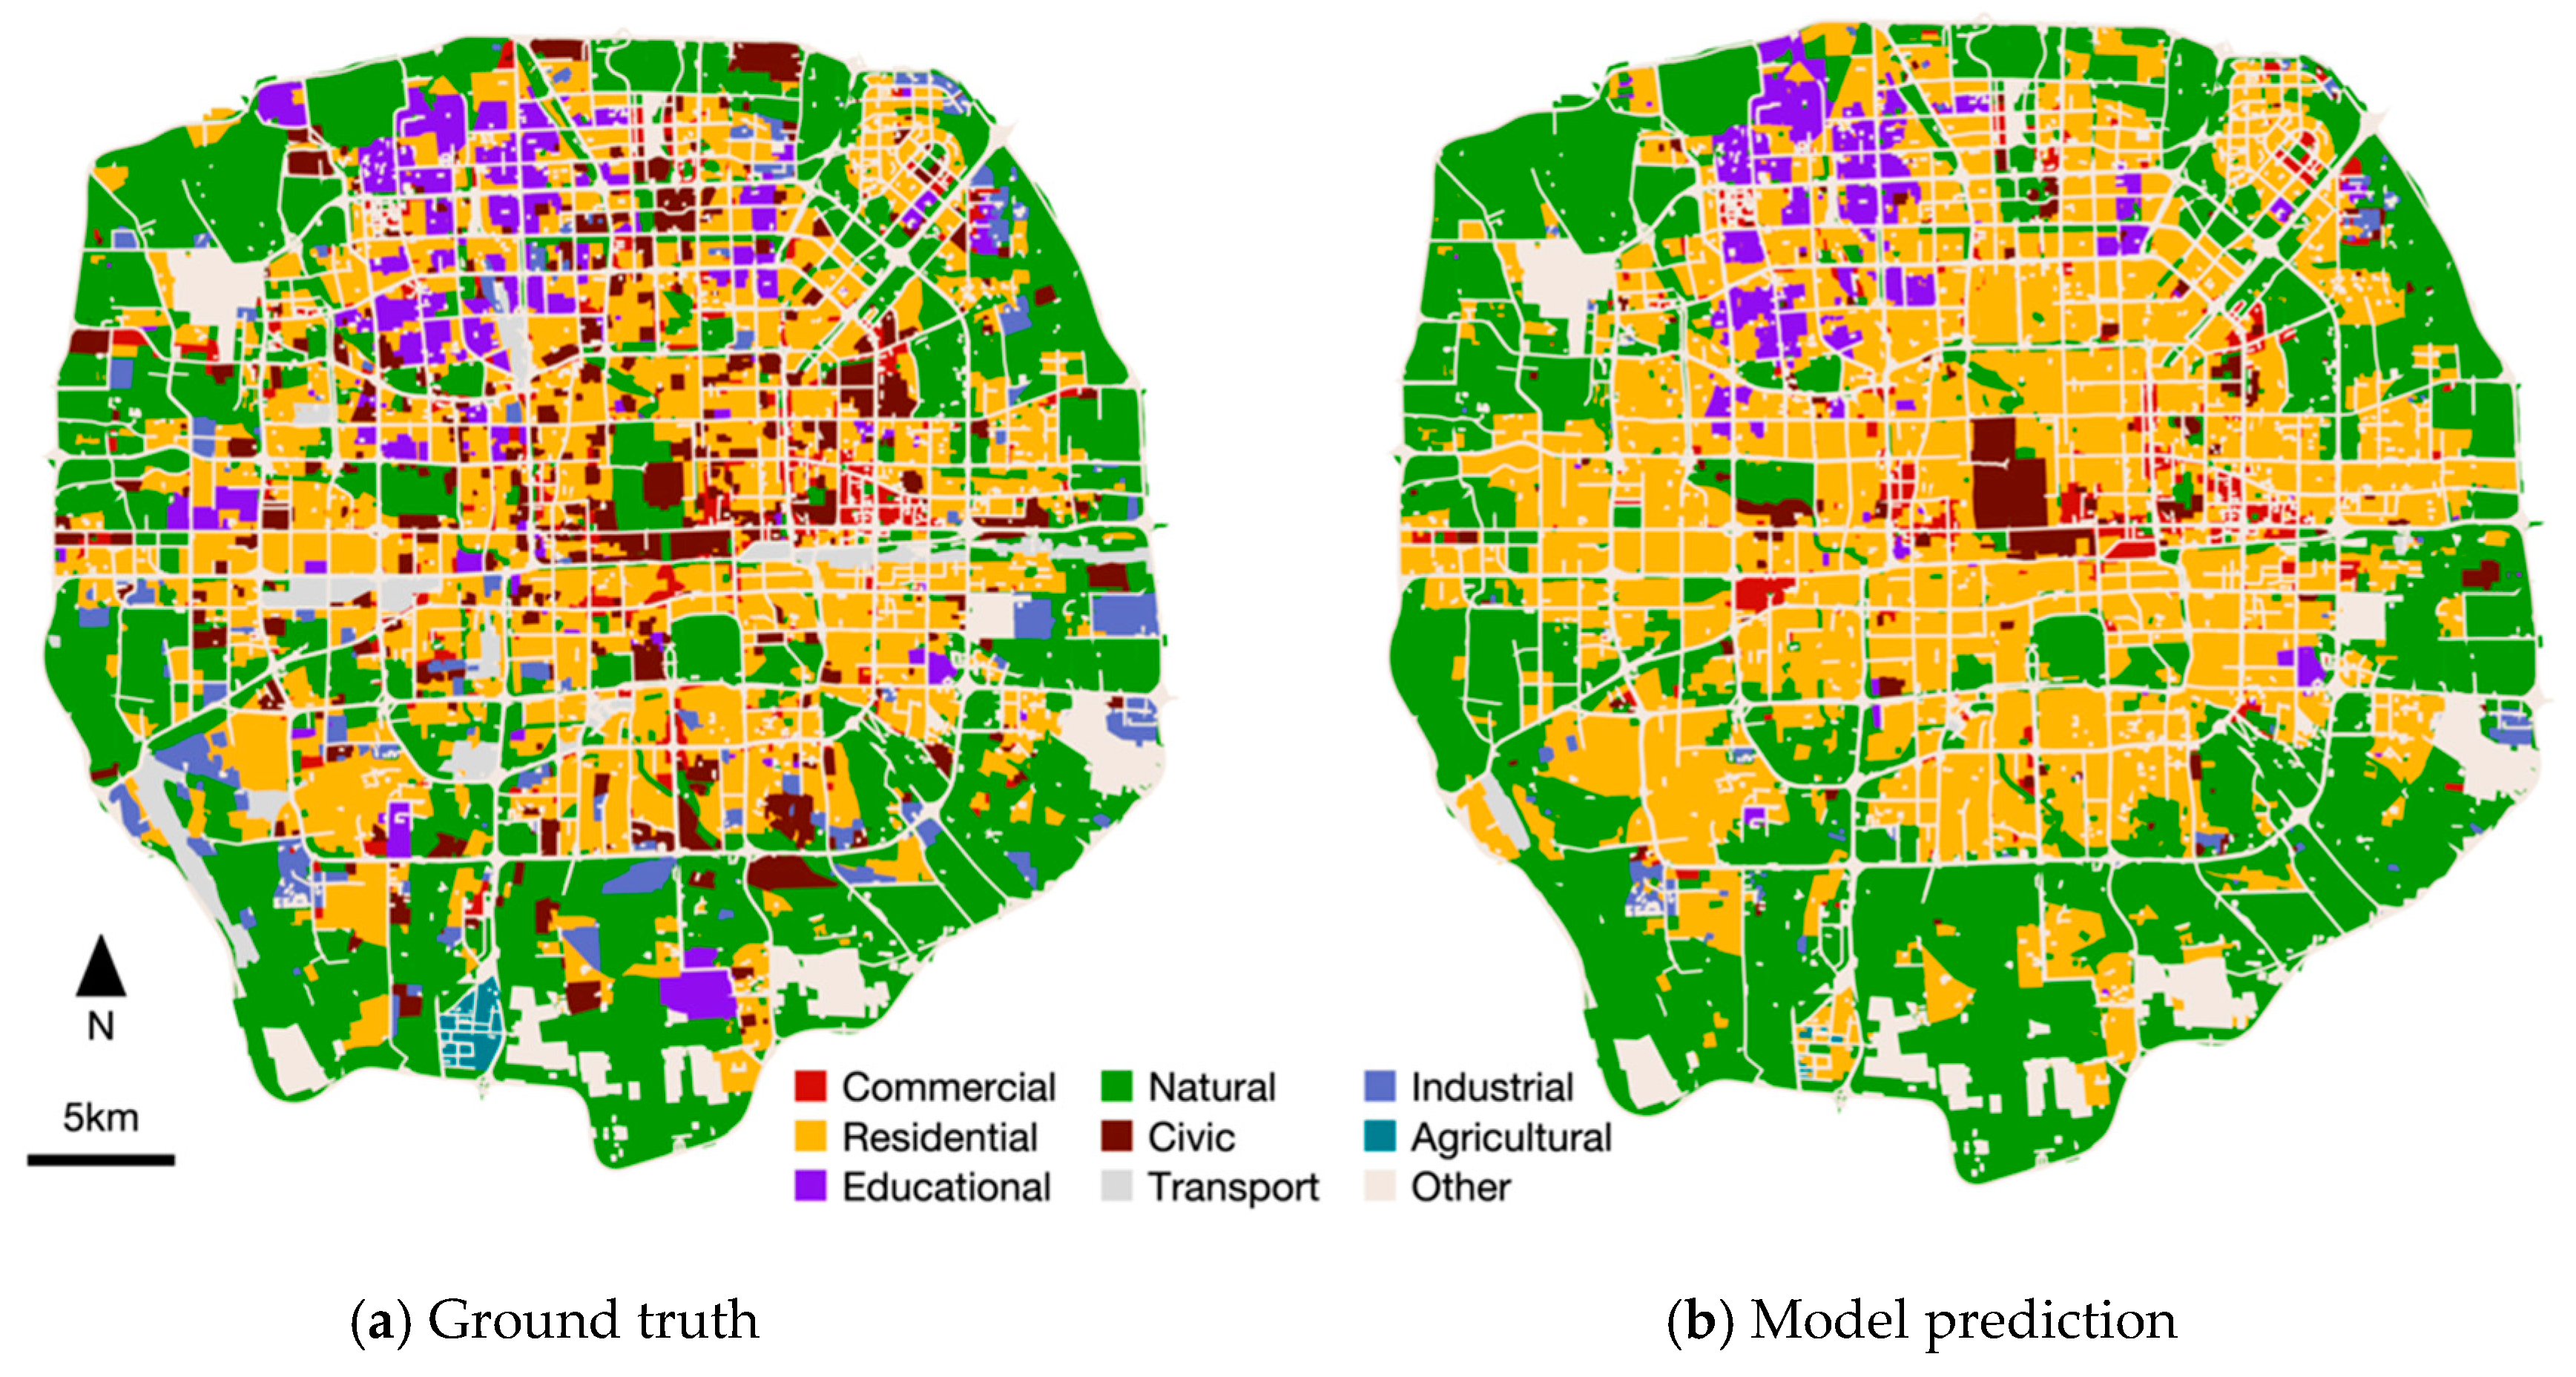
3.1. Classification Accuracy

In the empirical analysis, we apply the proposed method to infer the land use types of street blocks with fine granularity within the Fifth Ring Road of Beijing. The model performances for each land use type are reported in Figure 5. The average classification accuracy over the nine predefined land use types is 74.2%. Specifically, the classification accuracies of educational and transport land use types are about 85%, which are relative higher than those of other land use types. In contrast, the classification accuracies of commercial and civic land use types are lower than the average (about 65%), in that it is hard to differentiate residential and natural land parcels. Considering that most of the land parcels within the case study area are residential, our model yields a good prediction accuracy for residential land use, i.e., as high as 76.2%. It is also noteworthy that due to the effects of data sparsity and spatial heterogeneity, the classification accuracy in the coarse-grained spatial resolution (i.e., 80.4% for traffic analysis zone as an example) is slightly higher than that in the fine-grained spatial resolution (i.e., 74.2% for street blocks). We revisit this issue and discuss the differences between the model results of the two resolutions in the next section.
Based on the spatial distribution of land use classification results (see Figure 6), we notice that: (1) The majority of residential land parcels are located within the Fourth Ring Road; (2) Commercial land parcels are mainly located near the Second and the Third Ring Roads and other main roads; (3) The majority of natural land parcels (such as green space, water, etc.) are located outside the Fourth Ring Road and in parks within the Fourth Ring Road; (4) The land parcels for education and research are mainly located in northwest part of the study area (i.e., Haidian District); (5) Industrial land parcels are mainly in the southern part of Beijing, and there is no large-scale industrial zone; (6) Public facilities are scattered across all the districts within the case study area. These spatial patterns indicate that Beijing has a huge built-up area and a high proportion of residential land, which reflects the population pressure compared with other cities in China. In addition, by comparing our model predications with the ground truth data labeled by Algorithm 1 in Section 2.3, we find that the spatial distribution of land uses according to our model’s predictions is more cohesive, due to the derived physical and socioeconomic features, demonstrating significant spatial autocorrelations. In particular, civic land parcels are often misclassified as natural land at the periphery area due to the fact that civic facilities and small open/natural lands are usually colocated in space with each other. Additionally, commercial land parcels are often very small and mixed with residential and civic lands, making them hard to detect. The situation is similar for industrial land parcels; most of them are located in the periphery area, surrounded by natural lands. On the other hand, POI and check-in data are very sparse within these spaces, which undermines the benefit of integrating physical features and socio-economic features to differentiate among certain land use types.

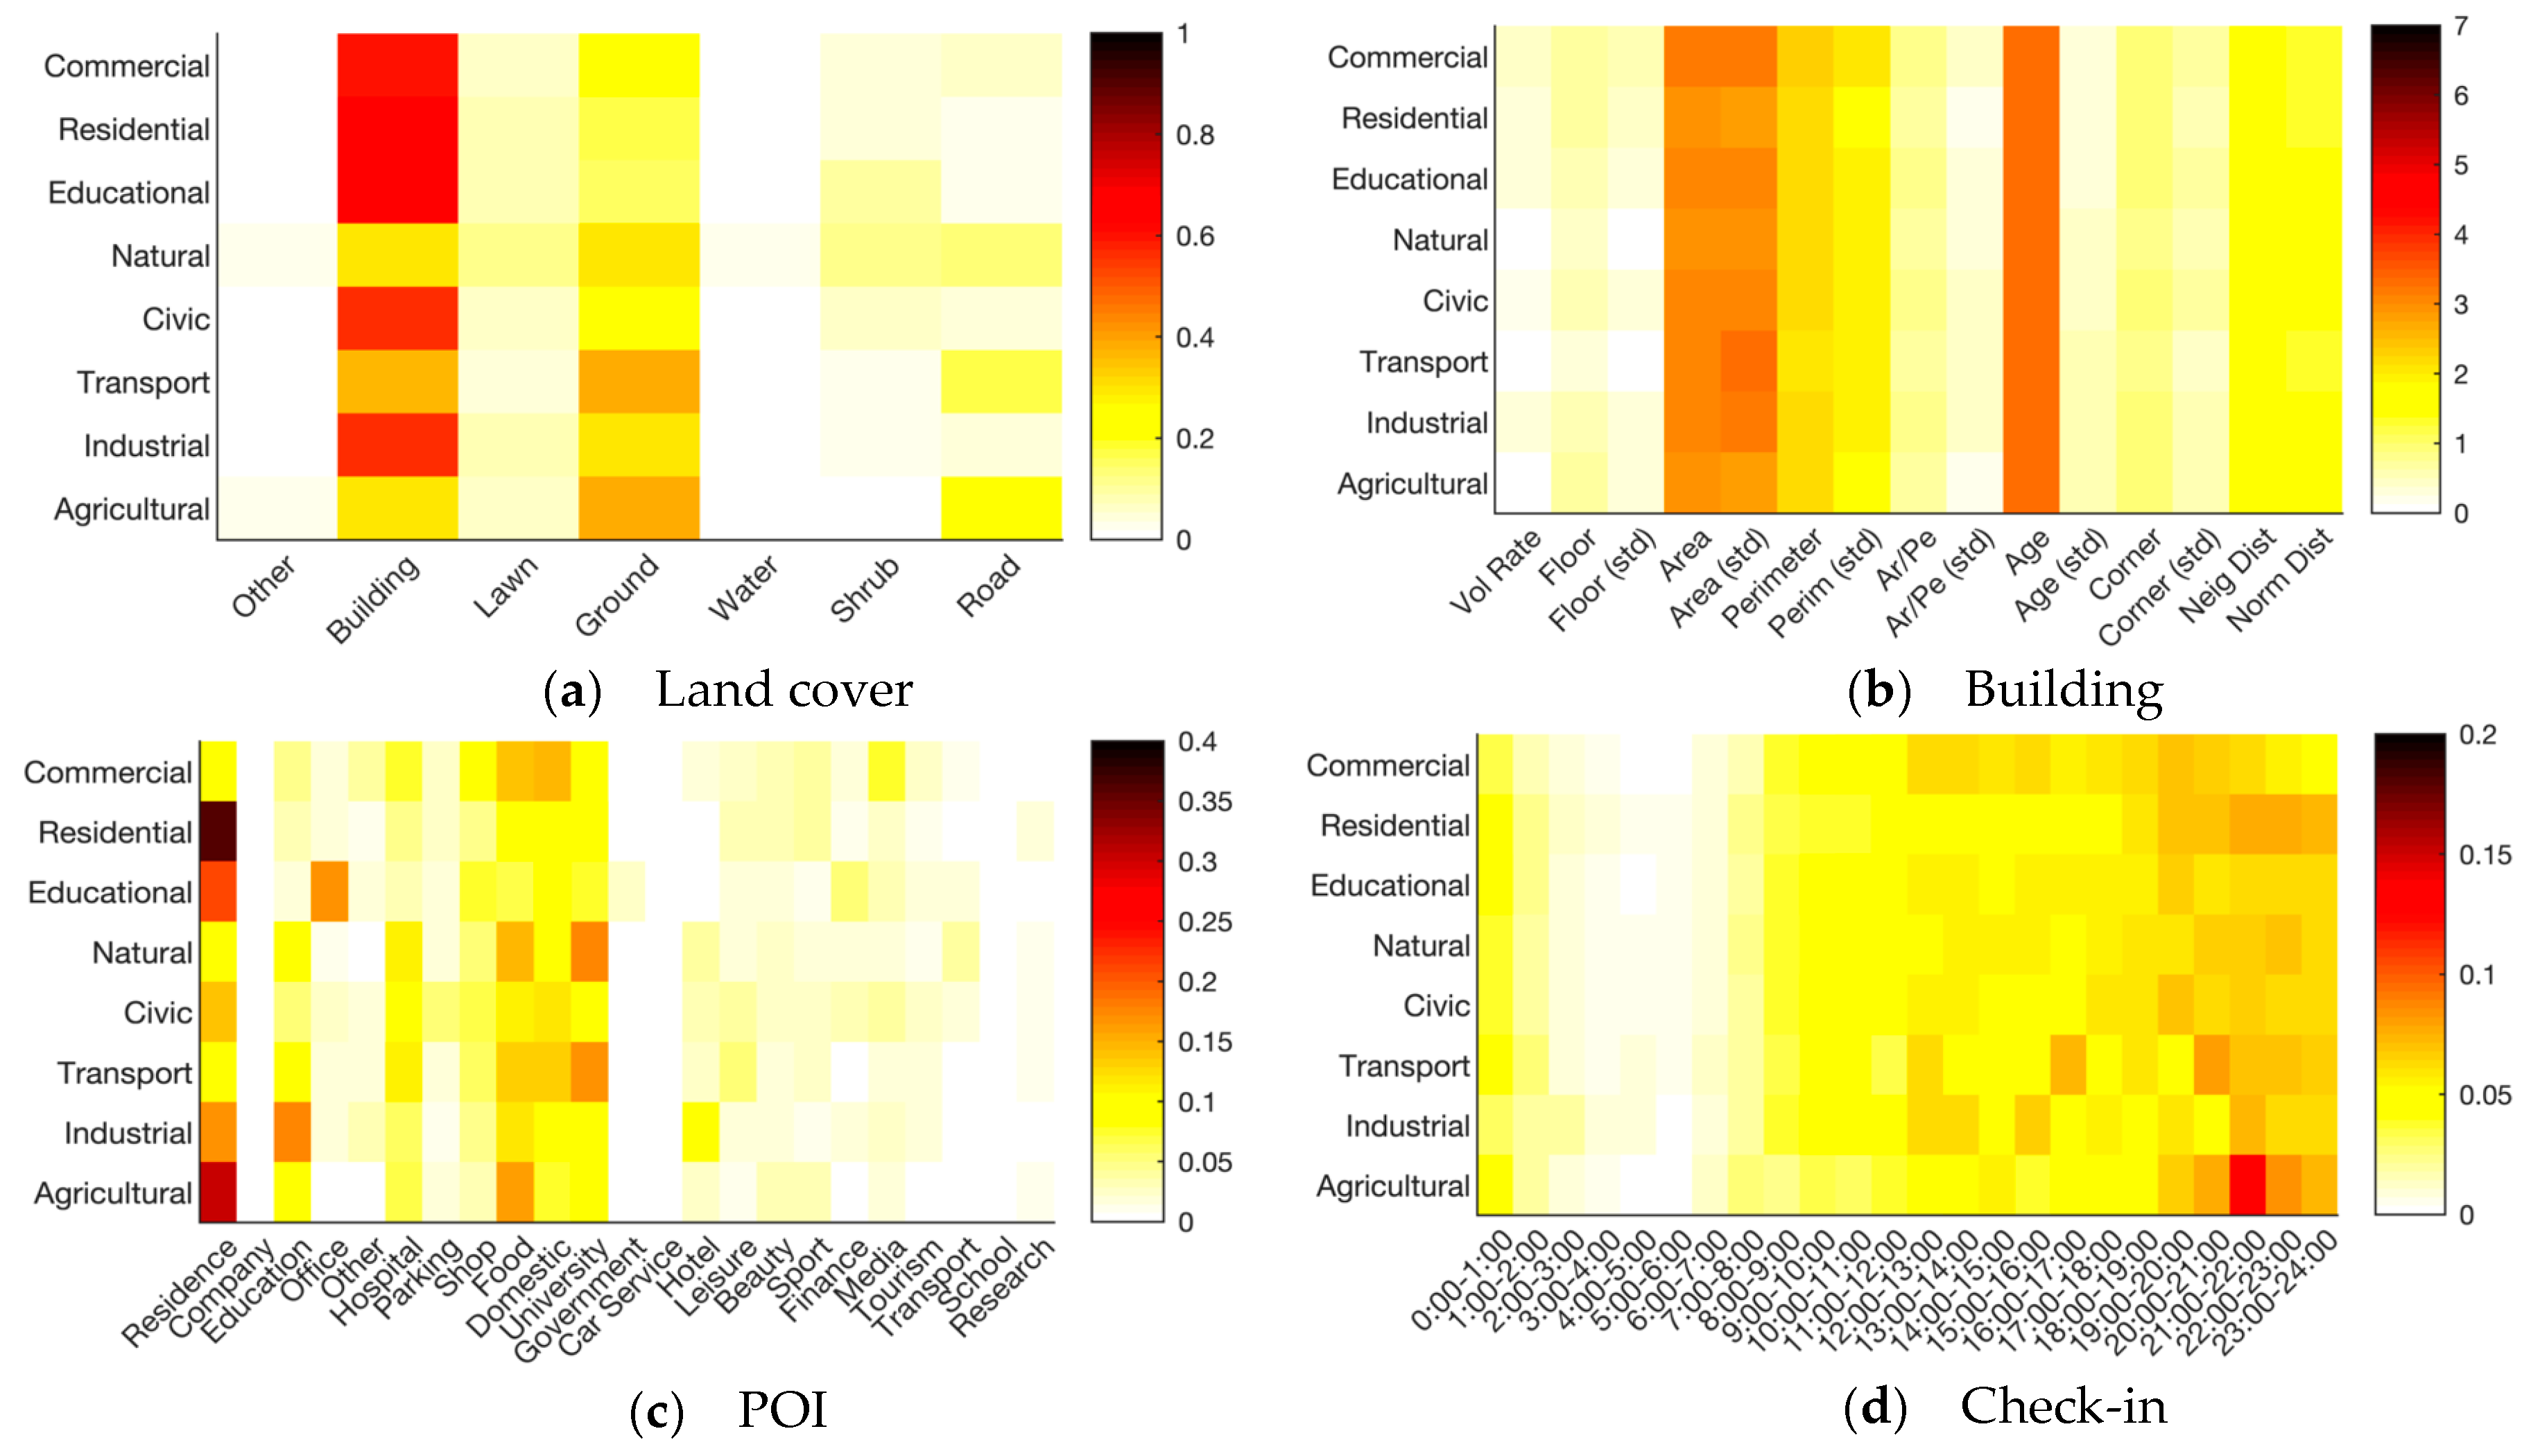
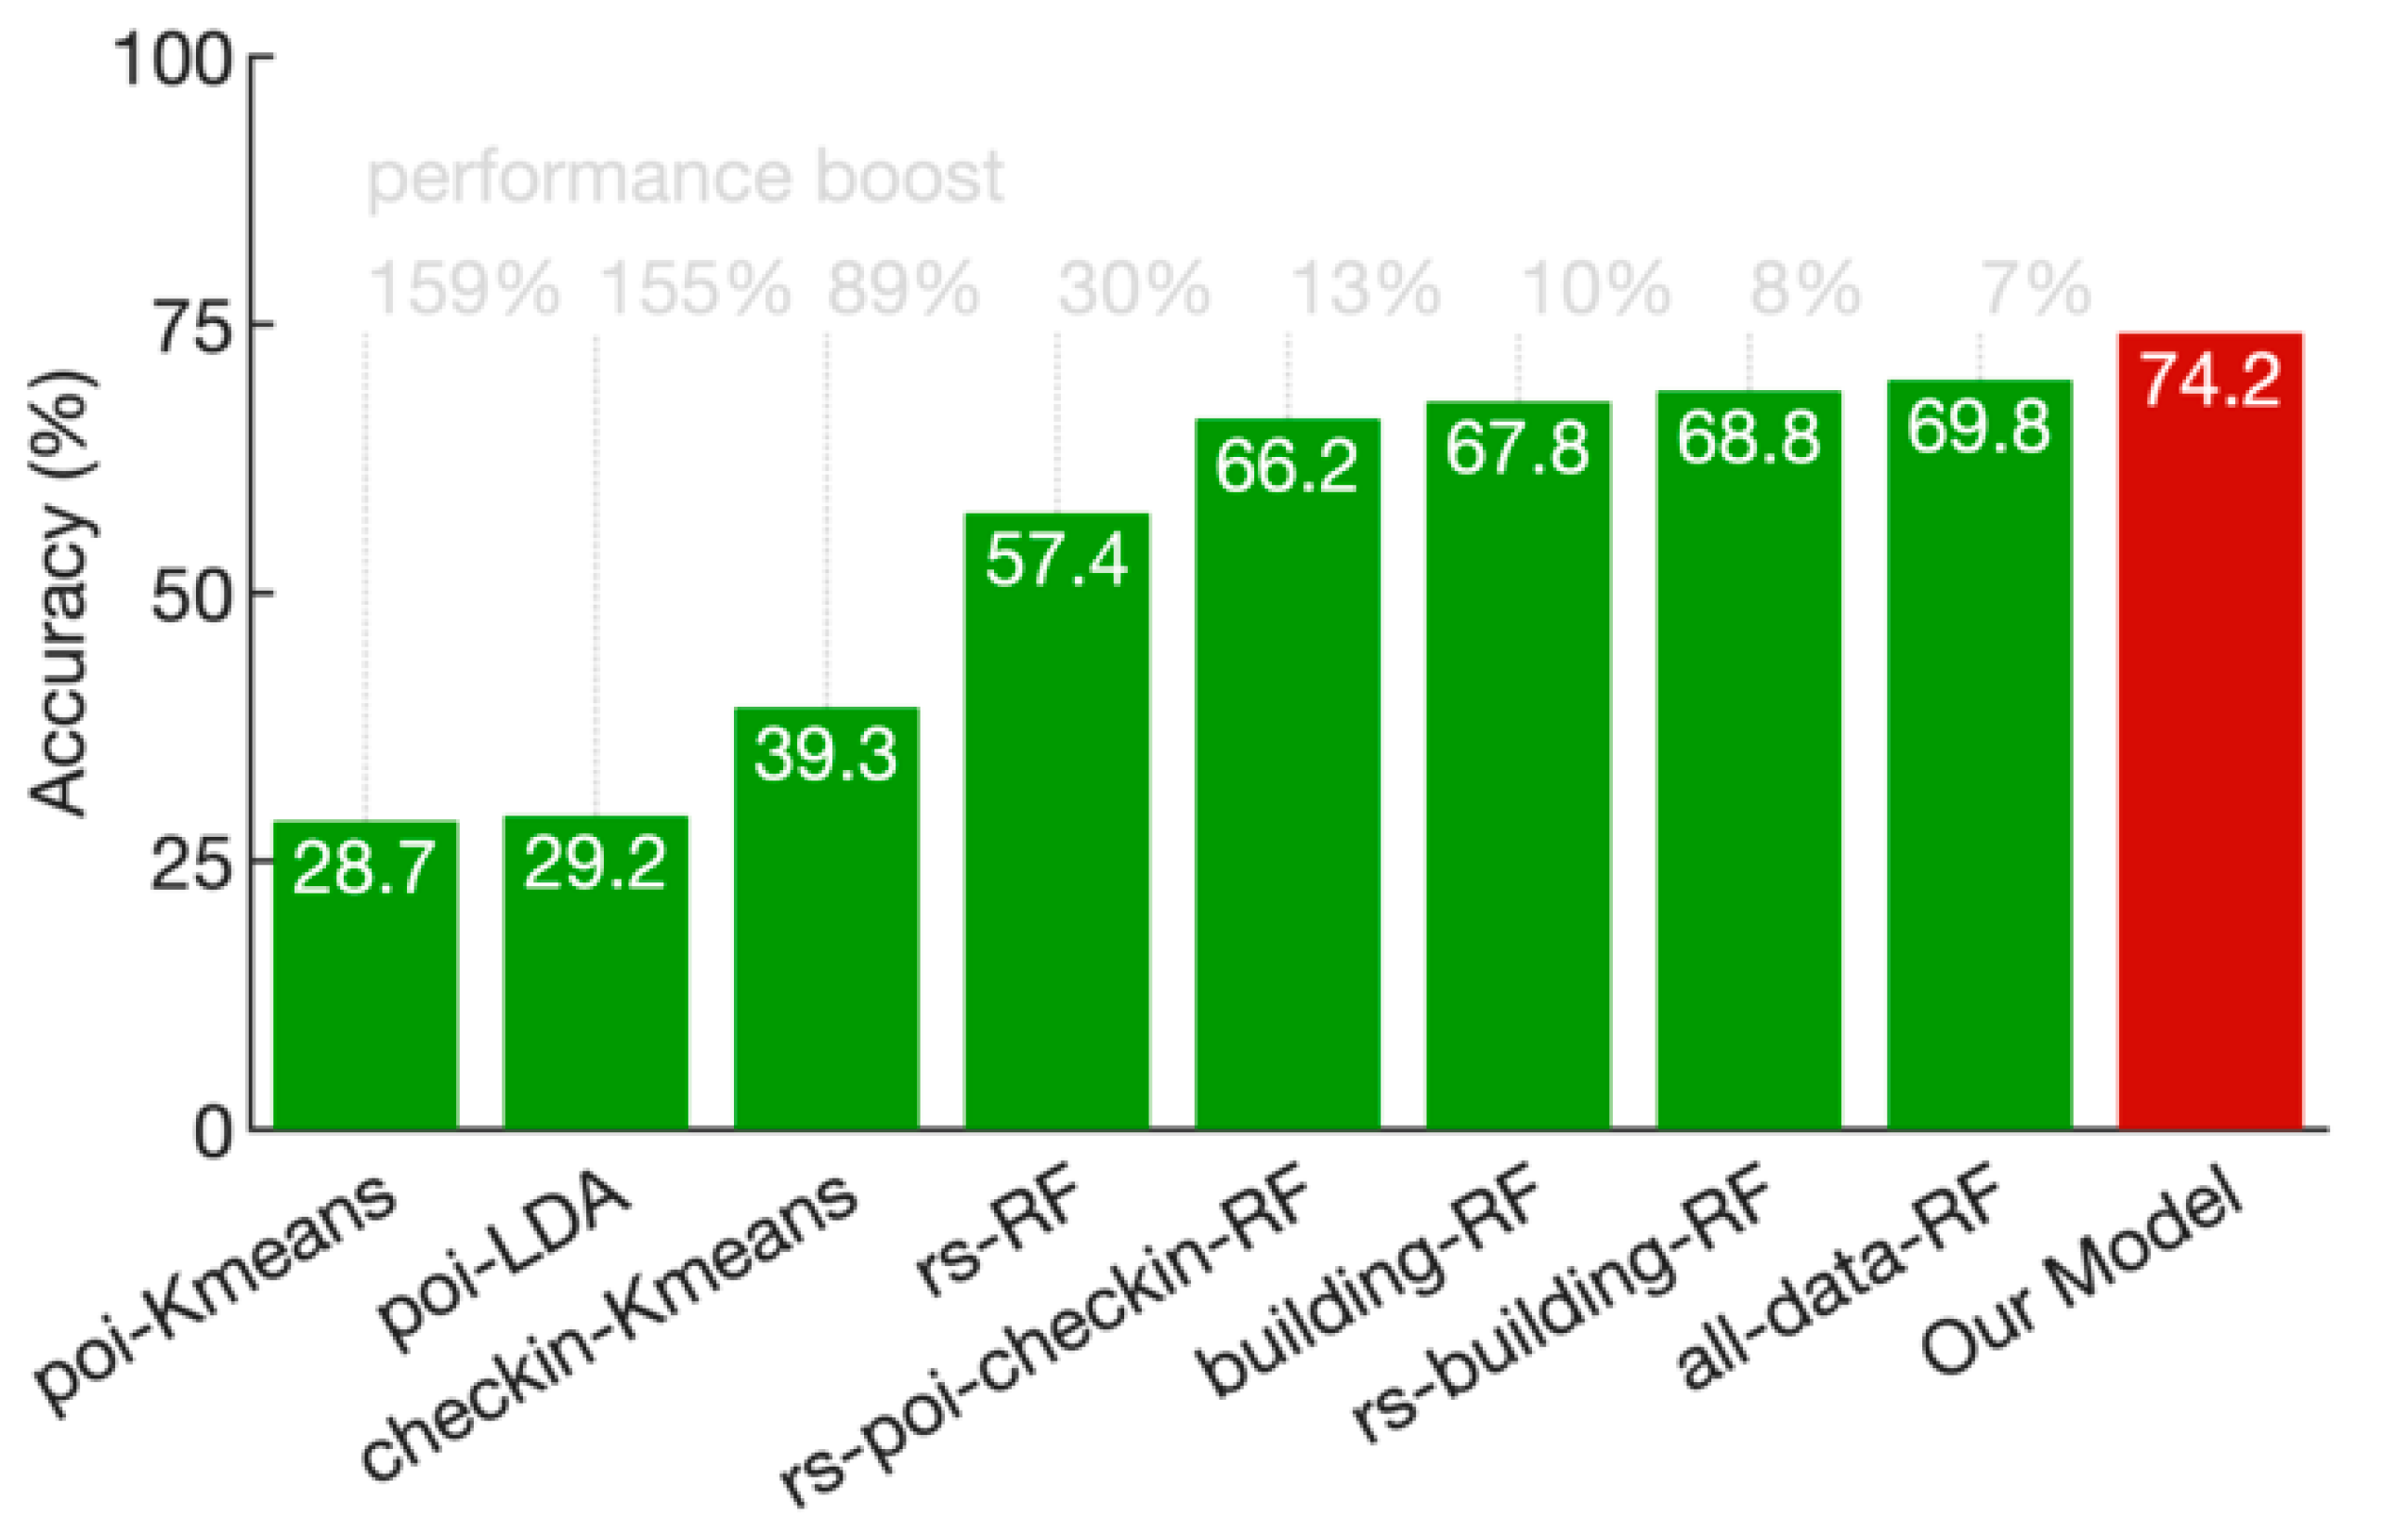
3.2. Analysis of Contributing Features

To further understand the primary features for determining different land use types, we inspect the information of land covers, buildings, POIs and check-ins in land parcels. This analysis enables us to distinguish the different features associated with each land use category. As shown in Figure 7a, the land cover categories in parcels of different land uses are distinct from each other. In detail, the built-up area in transportation facilities, natural and agricultural lands is relatively low, while roads are predominant therein. In educational and residential land types, the area of impervious surface is also low compared with other man-made land use types. Based on the statistics of building footprints illustrated in Figure 7b, we find that commercial and financial lands are associated with the largest value of building volume rates and floors, followed by residential areas. In contrast, the building volume rates in ecological and agricultural area are relatively low. In addition, the sizes of individual buildings in transportation facilities are significantly larger than those in other land use parcels. The ages of buildings in industrial areas are more similar to each other, a consequence of urban planning. In contrast, transportation facilities are built gradually, along with the development of urban areas. Furthermore, the shapes of buildings in commercial and educational land use parcels are much more irregular and complex compared to buildings in other land use types. Figure 7c demonstrates that the proportions of different POIs in each land use types are also distinctive. On the one hand, certain POI types such as catering services are widely distributed in several land use types. On the other hand, certain POI types are strongly concentrated within parcels of a specific land use type. For instance, the majority of sports related POIs are located in civic facilities, educational and research-related land use parcels. In contrast, office and financial POIs are clustered in commercial areas. Moreover, temporal fluctuations of check-in activities in different land use types show different patterns; see Figure 7d. In commercial and financial land parcels, the volume of local user check-in activities stays at a very high level between 9:00 a.m. and 7:00 p.m., while the corresponding check-in volume in residential and educational land parcels reaches the peak value after working hours.
We assume that richer data sources will enable more decision dimensions for the machine learning model to discover subtle differences between different categories of functionality. To verify this point, we construct three different feature sets. The first set uses Google remote sensing imagery alone. In the second set, Google remote sensing imagery and building footprint data are combined to observe the performance improvement. The third set uses the full range of Google remote sensing imagery, building footprint data, POIs, check-ins and street view images. Our experimental results confirm the above conjecture. With the addition of multisource features, the classification accuracy of the model is improved. The accuracy of the XGBoost classifier is 54.7%, 70.3% and 74.2%, respectively, on these three feature sets. In addition, in order to find the best classifier for this task, we also test the sensitivity of various classifiers such as random forest. By comparing different classifiers, we find that the XGBoost classifier achieves the highest overall accuracy on these datasets. With the exception of XGBoost, the best-performing random forest classifier has an accuracy of 57.4%, 68.8%, and 69.8%, respectively, on the three data sets.
Closer scrutiny of the experimental results indicates that an important reason for the performance difference among the different experiments lies in the data sparsity caused by small parcels. In this sense, prediction experiments on different scales of research units are carried out. On a coarse-grained scale of TAZ (traffic analysis zone), we construct three data sets as described above. On these three feature sets, the classification accuracy of XGBoost reaches 72.6%, 78.1% and 80.4% respectively. The overall accuracy is improved on the TAZ scale, indicating that data sparsity is indeed an important factor affecting classification accuracy. The comparison results of different experiments on the three feature sets are shown in Figure 8.

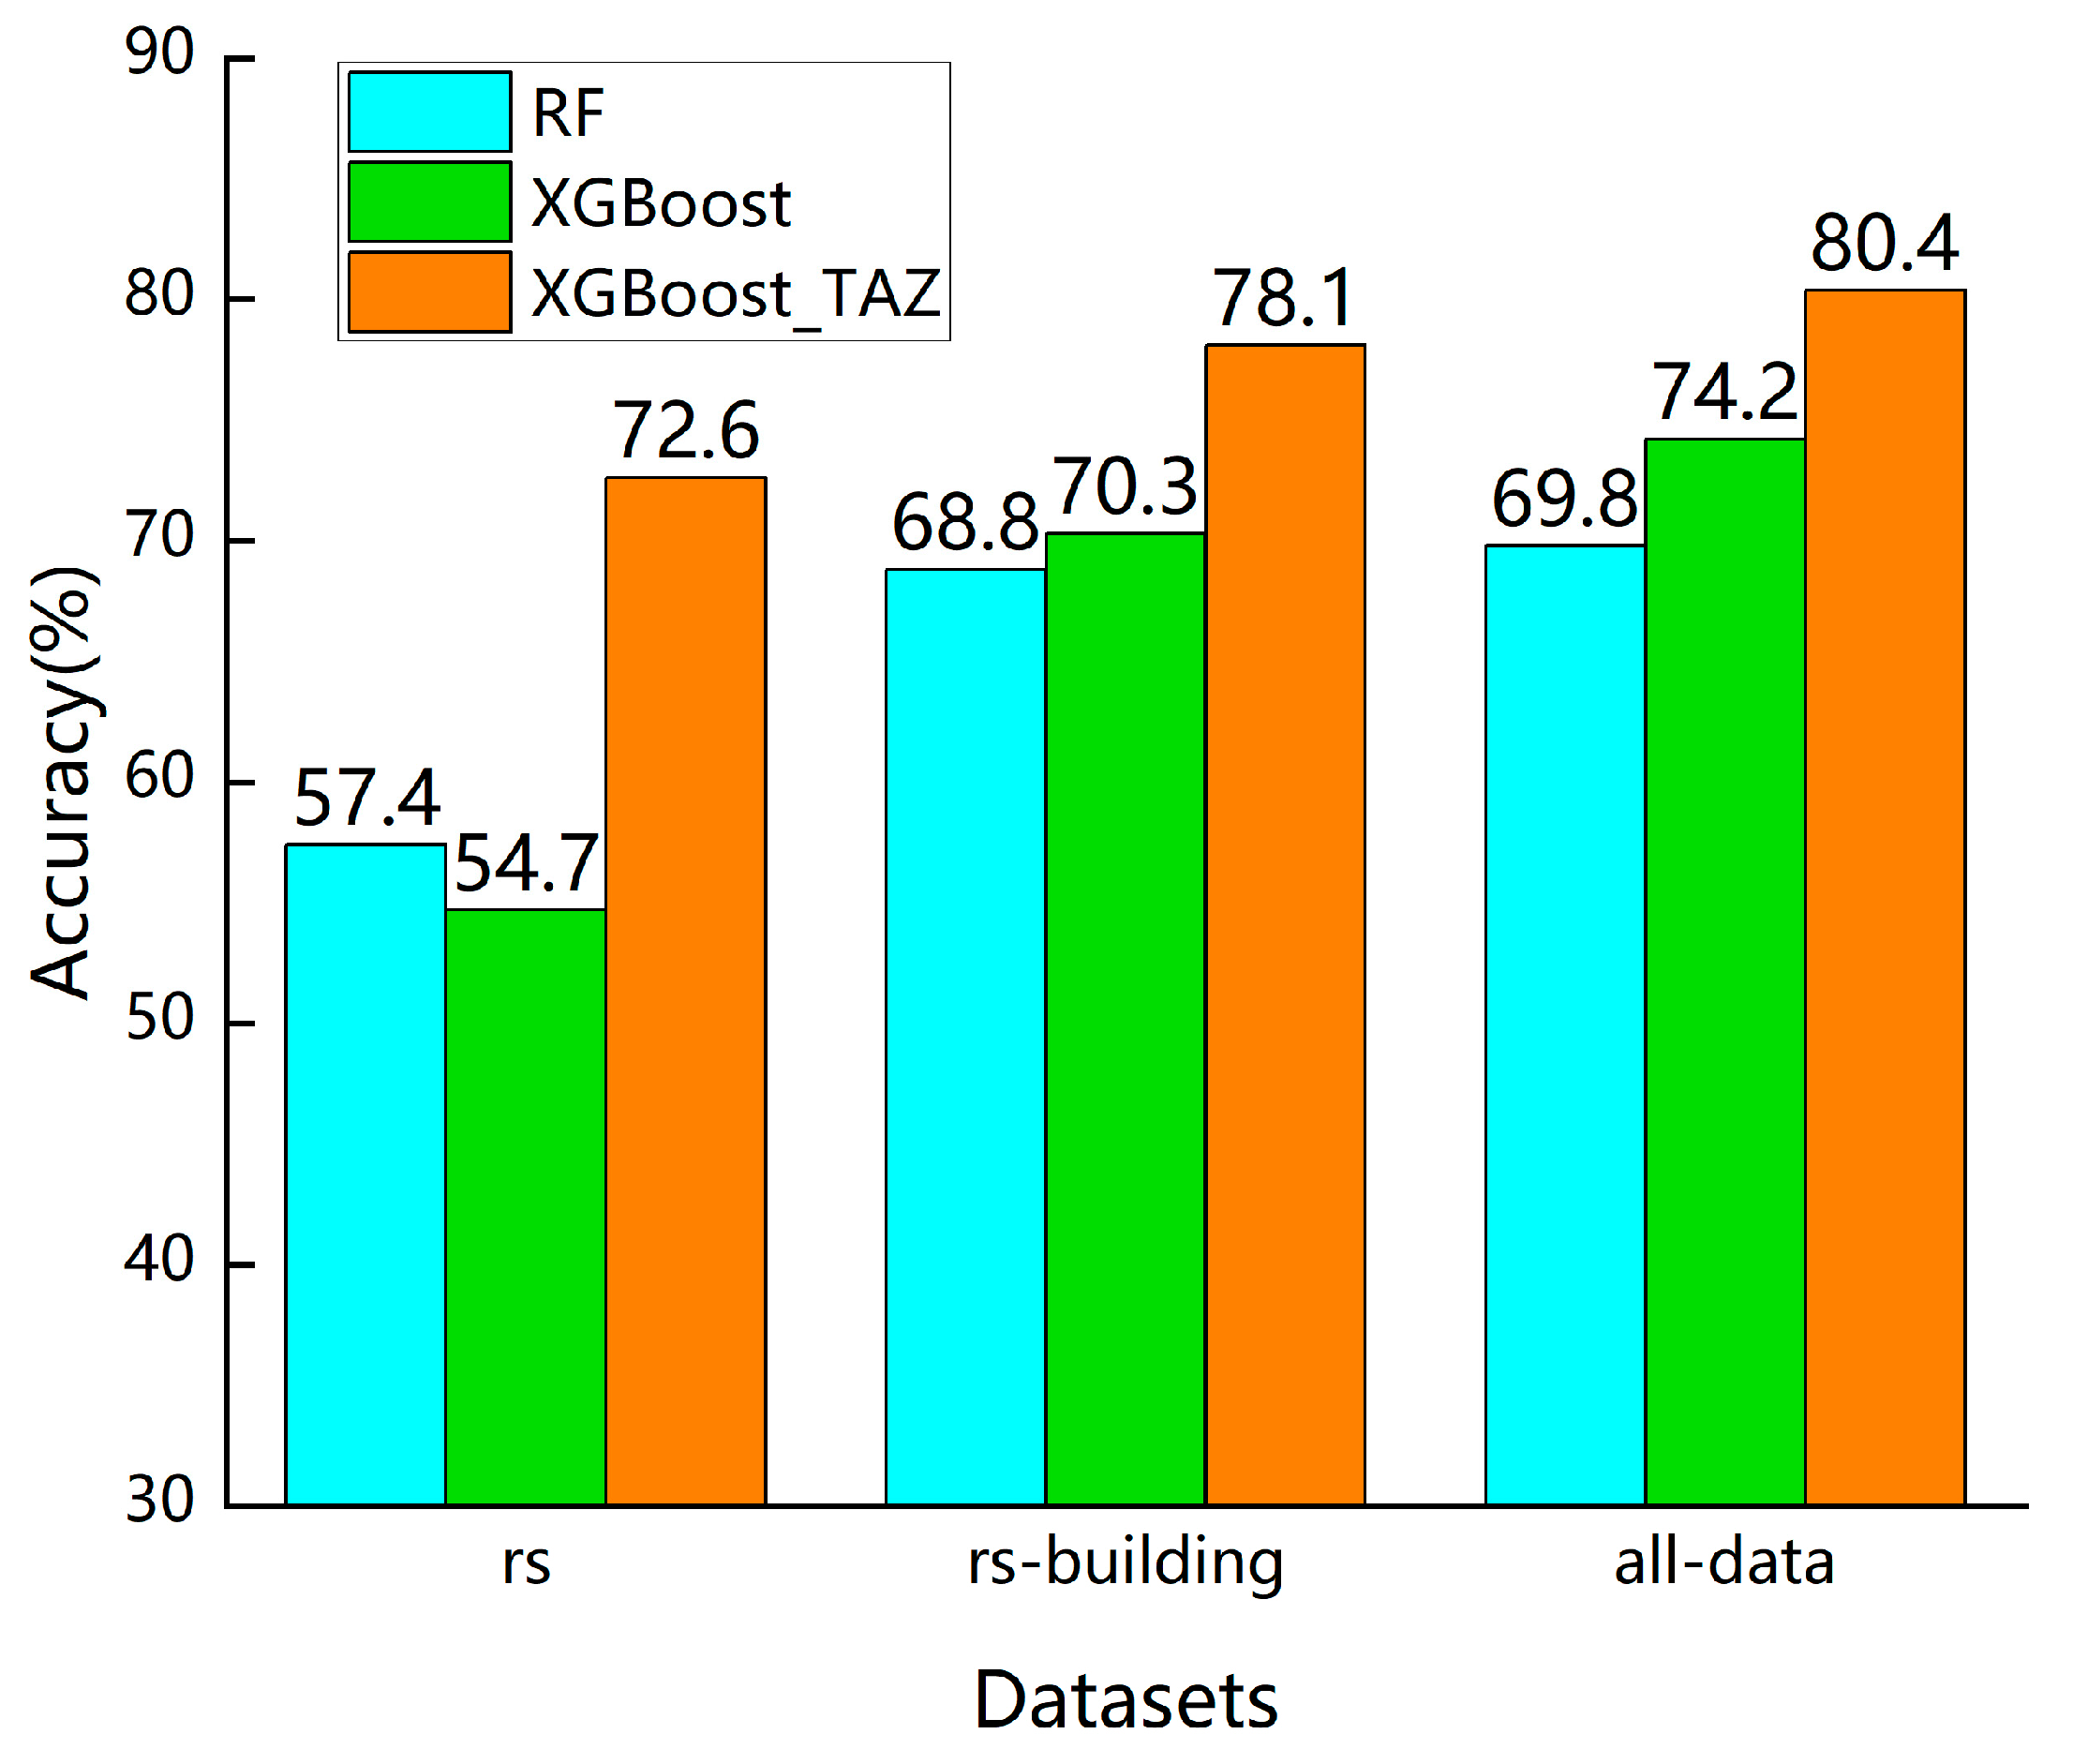
3.3. Comparison with Alternative Models

Figure 9 compares our XGBoost-based model’s performance with those of several alternative models that have been widely applied for land use mapping. We divide these baseline models into two categories: (1) Supervised models. These models feed urban features with regard to the landscape metrics (e.g., rs-RF), the proportion of POIs and the temporal variation of check-ins (e.g., rs-poi-checkin-RF), and the building characteristics (e.g., building-RF, rs-building-RF) to the random forest classifier; (2) Unsupervised models. These include K-means clustering (e.g., poi-Kmeans, checkin-Kmeans) and LDA-based topic modeling (e.g., poi-LDA). As shown in Figure 8, our model outperforms these models for land use classification in the case study area. Under closer scrutiny, we find that, due to the relatively coarse spatial resolution of social sensing data, the POI and check-in-based models yield very low classification accuracies (i.e., less than 50%). As a comparison, land cover and building information, as the most popular data source for land use mapping in the existing literature, yields a much higher classification accuracy (i.e., about 60% to 70%). Promisingly, our model can achieve an additional 7% to 13% performance improvement through efficiently integrating physical and socioeconomic features using the XGBoost classifier. We believe that our model can serve as an effective approach for the extraction and combination of physical and socioeconomic features from both remote sensing and social sensing data.

4. Conclusions

In this study, we integrate physical and socioeconomic features from Google remote sensing image, street-view image, building data, POI data and Weibo check-in data to develop an ensemble learning model to infer fine-grained urban land use distributions at the street block level. The experimental results show that the land use classification accuracy of the XGBoost-based model is greatly improved compared with those of other, state-of-the-art models, which include random forest classifiers, K-means clustering and LDA-based models, indicating that the proposed framework based on multisource data is an effective strategy for urban land use recognition. Specifically, the POI characteristics, land cover characteristics, architectural features, time curves and place scene categories extracted in this study are significantly different in different land use types, indicating their good distinguishing abilities for urban land use classification. Our empirical experiment proves that the model has high classification accuracy, strong discriminating ability and good robustness, which can be widely used to automatically generate urban land use maps in practice.
There are still some shortcomings that need to be overcome in the future. First, the current classification criteria of our model are limited to a few well-refined land use types. In future work, we need to extend the model’s ability to identify more comprehensive land use types. Secondly, there are potentially data quality problems in certain datasets, such as missing or incomplete data regarding certain building attributes. In addition, the spatial distribution of POIs and check-ins within each land use parcel are not effectively utilized in the current model. We look forward to further improving the classification ability and accuracy of the proposed ensemble model by refining the model architecture and improving the quality of data in future work.

Author Contributions

Z.H. and C.K. conceived and designed the experiments; H.Q. performed the experiments; Y.S. and Y.L. analyzed the data; Z.H. and C.K. wrote the paper. All authors have read and agreed to the published version of the manuscript.

Funding

This research was supported by grants from the National Key Research and Development Program of China (2017YFE0196100), the National Natural Science Foundation of China (41771425, 41601484, 41830645, 41625003).

Acknowledgments

This work was supported in part by Joint Laboratory for Future Transport and Urban Computing of AutoNavi.

Conflicts of Interest

The authors declare no conflict of interest.

Appendix A

Appendix A.1. Google Remote Sensing Images

Google Earth provides remote sensing images with a resolution of 1 m in 2018. The land cover classification is implemented using TensorFlow on Tesla K80 GPU. During the training phase, we collect remote sensing images with a resolution of 1 m in 7 different regions, and utilize a pre-trained Xception on the ImageNet-1k [48] data set as the backbone network of the DeepLabV3+ model.
Figure A1. 1 m-resolution remote sensing imagery within the Fifth Ring Road of Beijing.
Remotesensing 12 03254 g0a1

Appendix A.2. Tencent Street-View Images

Tencent provides 660,000 street view images in Beijing. We input the images into the ResNet-50 model and get the 365-dimensional output representing the probability that the image belongs to 365 different types of scenes. It is also noteworthy that many other scene datasets are developing rapidly including Scene15, MIT Indoor67 [49] and SUN [50] datasets, which can also be applied for our scene identification.

Appendix A.3. Building Footprints

We obtain about 220,000 buildings of Beijing in 2018 from public building data sources, out of which 161,000 buildings are within the fifth ring road. For a few missing data records, we apply the k-nearest neighbors (KNN) approach [51] for data imputation.

Appendix A.4. Baidu POIs

Baidu, Inc. provides a total of 554,000 POIs in Beijing, out of which 284,000 are within the Fifth Ring Road. Th Baidu POIs are organized using a hierarchical classification system. Please refer to http://lbsyun.baidu.com/index.php?title=lbscloud/poitags for details.

Appendix A.5. Sina Weibo Check-Ins

Sina Corp provides about 8.32 million Weibo check-in data from 2012 to 2017 in Beijing, out of which 5.8 million check-ins are within the Fifth Ring Road.

Appendix A.6. Derived Urban Features

Table A1. List of urban features derived from remote and social sensing data.
Data SourceVariableDescription
Remote sensing image LawnLawn, and small-scale permeable land inside a large lawn area
ShrubShrubs and trees
GroundBare land, farmland, construction site, etc.
Impervious surfaceImpervious surface except for roads, such as parking lot, square, cement floor
RoadArtificial paved and nonpaved pavement, Including trunk roads, feeder roads, airport runways
BuildingArtificial roofed buildings of various shapes and types, excluding open-air stadiums.
WaterLakes, oceans, rivers, sewage treatment plants, swimming pools, etc.
Street-view image365 scene categoriesSee the link for the full list: https://github.com/metalbubble/places_devkit/blob/master/categories_places365.txt
Building footprintVolume (area)Plot ratio of a parcel
Height (mean)The average height of all buildings in a parcel.
Height (std)The standard deviation of the height of all buildings within a parcel.
Height (mean/area)The average building height weighted by building area.
Height (std/area)The standard deviation of building height weighted by building area.
Building area (mean)The average building area of all the buildings in a parcel
Building area (std)The standard deviation of building area in a parcel
Perimeter (mean)The average perimeter of the buildings
Perimeter (std)The standard deviation of building circumference.
Corner (mean)The average number of buildings’ area/perimeter in a parcel.
Corner (std)The standard deviation of buildings’ area/perimeter in a parcel.
Age (mean)Average completion time of the building.
Age (std)The standard deviation of completion time.
Nearest distanceThe average of nearest-neighbor distance between buildings in a parcel
Zonal nearest distanceNeighborhood distance calculated by regional method
POIResidenceResidential buildings and apartments
CompanyCompanies
EducationEducation and training institutions
OfficeOffice buildings and other workplaces
HospitalHospitals, clinics and pharmacies
ParkingOpen or indoor parking lot
ShopRetail store, market or other shopping place
FoodRestaurants and snack bars
DomesticDomestic services and amenities
UniversityUniversities and colleges
GovernmentGovernment agencies and other organizations
Car serviceAutomobile sales and maintenance
HotelHotels, inns and other places for temporary accommodation
LeisureRecreation facilities and the bars
BeautyBeauty salons, hair salons
SportStadiums and other sports facilities
FinanceBanks and other financial institutions
MediaPress, TV station
TourismTourist attractions and museums
TransportTransportation facilities
SchoolKindergartens, primary schools and middle schools
ResearchResearch institutes
Check-inLocalVolumes of locals’ check-ins in 24 h
VisitorVolumes of visitor’ check-ins in 24 h

References

  1. Li, X.; Yeh, A.G.-O. Analyzing spatial restructuring of land use patterns in a fast growing region using remote sensing and GIS. Landsc. Urban Plan. 2004, 335–354. [Google Scholar] [CrossRef]
  2. Rogan, J.; Chen, D.M. Remote sensing technology for mapping and monitoring land-cover and land-use change. Prog. Plan. 2004, 61, 301–325. [Google Scholar] [CrossRef]
  3. Liu, Y.; Liu, X.; Gao, S.; Gong, L.; Kang, C.; Zhi, Y.; Chi, G.; Shi, L. Social Sensing: A New Approach to Understanding Our Socioeconomic Environments. Ann. Assoc. Am. Geogr. 2015, 105, 512–530. [Google Scholar] [CrossRef]
  4. Peng, X.; Huang, Z. A Novel Popular Tourist Attraction Discovering Approach Based on Geo-Tagged Social Media Big Data. ISPRS Int. J. Geo-Inf. 2017, 6, 216. [Google Scholar] [CrossRef] [Green Version]
  5. Wu, X.; Huang, Z.; Peng, X.; Chen, Y.; Liu, Y. Building a Spatially-Embedded Network of Tourism Hotspots from Geotagged Social Media Data. IEEE Access 2018, 6, 21945–21955. [Google Scholar] [CrossRef]
  6. Wu, L.; Cheng, X.; Kang, C.; Zhu, D.; Huang, Z.; Liu, Y. A framework for mixed-use decomposition based on temporal activity signatures extracted from big geo-data. Int. J. Digit. Earth 2020, 13, 708–726. [Google Scholar] [CrossRef]
  7. Cockx, K.; Van de Voorde, T.; Canters, F. Quantifying uncertainty in remote sensing-based urban land-use mapping. Int. J. Appl. Earth Obs. Geoinf. 2014, 31, 154–166. [Google Scholar] [CrossRef]
  8. Baus, P.; Kováč, U.; Pauditšová, E.; Kohutková, I.; Komorník, J. Identification of interconnections between landscape pattern and urban dynamics—Case study Bratislava, Slovakia. Ecol. Indic. 2014, 42, 104–111. [Google Scholar] [CrossRef]
  9. Li, M.; Stein, A.; Bijker, W.; Zhan, Q. Urban land use extraction from very high resolution remote sensing imagery using a Bayesian network. ISPRS-J. Photogramm. Remote Sens. 2016, 122, 192–205. [Google Scholar] [CrossRef]
  10. Vanderhaegen, S.; Canters, F. Mapping urban form and function at city block level using spatial metrics. Landsc. Urban Plan. 2017, 167, 399–409. [Google Scholar] [CrossRef]
  11. Wu, B.; Yu, B.; Wu, Q.; Chen, Z.; Yao, S.; Huang, Y.; Wu, J. An extended minimum spanning tree method for characterizing local urban patterns. Int. J. Geogr. Inf. Sci. 2018, 32, 450–475. [Google Scholar] [CrossRef]
  12. Zhang, X.; Du, S. A linear dirichlet mixture model for decomposing scenes: Application to analyzing urban functional zonings. Remote Sens. Environ. 2015, 169, 37–49. [Google Scholar] [CrossRef]
  13. Chen, F.; Wang, K.; Van de Voorde, T.; Tang, T.F. Mapping urban land cover from high spatial resolution hyperspectral data: An approach based on simultaneously unmixing similar pixels with jointly sparse spectral mixture analysis. Remote Sens. Environ. 2017, 196, 324–342. [Google Scholar] [CrossRef]
  14. Huang, B.; Zhao, B.; Song, Y. Urban land-use mapping using a deep convolutional neural network with high spatial resolution multispectral remote sensing imagery. Remote Sens. Environ. 2018, 214, 73–86. [Google Scholar] [CrossRef]
  15. Zhang, C.; Sargent, I.; Pan, X.; Li, H.; Gardiner, A.; Hare, J.; Atkinson, P.M. An object-based convolutional neural network (OCNN) for urban land use classification. Remote Sens. Environ. 2018, 216, 57–70. [Google Scholar] [CrossRef] [Green Version]
  16. Cao, R.; Zhu, J.; Tu, W.; Li, Q.; Cao, J.; Liu, B.; Zhang, Q.; Qiu, G. Integrating Aerial and Street View Images for Urban Land Use Classification. Remote Sens. 2018, 10, 1553. [Google Scholar] [CrossRef] [Green Version]
  17. Li, X.; Zhang, C.; Li, W. Building block level urban land-use information retrieval based on Google Street View images. GISci. Remote Sens. 2017, 54, 819–835. [Google Scholar] [CrossRef]
  18. Kang, J.; Körner, M.; Wang, Y.; Taubenböck, H.; Zhu, X.X. Building instance classification using street view images. ISPRS-J. Photogramm. Remote Sens. 2018, 145, 44–59. [Google Scholar] [CrossRef]
  19. Zhang, W.; Li, W.; Zhang, C.; Hanink, D.M.; Li, X.; Wang, W. Parcel-based urban land use classification in megacity using airborne LiDAR, high resolution orthoimagery, and Google Street View. Comput. Environ. Urban Syst. 2017, 64, 215–228. [Google Scholar] [CrossRef] [Green Version]
  20. Wang, Y.; Wang, T.; Tsou, M.-H.; Li, H.; Jiang, W.; Guo, F. Mapping dynamic urban land use patterns with crowdsourced geo-tagged social media (Sina-Weibo) and commercial points of interest collections in Beijing, China. Sustainability 2016, 8, 1202. [Google Scholar] [CrossRef] [Green Version]
  21. Chen, Y.; Liu, X.; Li, X.; Liu, X.; Yao, Y.; Hu, G.; Xu, X.; Pei, F. Delineating urban functional areas with building-level social media data: A dynamic time warping (DTW) distance based k-medoids method. Landsc. Urban Plan. 2017, 160, 48–60. [Google Scholar] [CrossRef]
  22. Gao, S.; Janowicz, K.; Couclelis, H. Extracting urban functional regions from points of interest and human activities on location-based social networks. Trans. GIS 2017, 21, 446–467. [Google Scholar] [CrossRef]
  23. Yao, Y.; Li, X.; Liu, X.; Liu, P.; Liang, Z.; Zhang, J.; Mai, K. Sensing spatial distribution of urban land use by integrating points-of-interest and Google Word2Vec model. Int. J. Geogr. Inf. Sci. 2017, 31, 825–848. [Google Scholar] [CrossRef]
  24. Ge, P.; He, J.; Zhang, S.; Zhang, L.; She, J. An Integrated Framework Combining Multiple Human Activity Features for Land Use Classification. ISPRS Int. J. Geo-Inf. 2019, 8, 90. [Google Scholar] [CrossRef] [Green Version]
  25. Chen, Y.; Chen, X.; Liu, Z.; Li, X. Understanding the spatial organization of urban functions based on co-location patterns mining: A comparative analysis for 25 Chinese cities. Cities 2020, 97, 102563. [Google Scholar] [CrossRef]
  26. Frias-Martinez, V.; Frias-Martinez, E. Spectral clustering for sensing urban land use using Twitter activity. Eng. Appl. Artif. Intell. 2014, 35, 237–245. [Google Scholar] [CrossRef] [Green Version]
  27. Yuan, N.J.; Zheng, Y.; Xie, X.; Wang, Y.; Zheng, K.; Xiong, H. Discovering urban functional zones using latent activity trajectories. IEEE Trans. Knowl. Data Eng. 2014, 27, 712–725. [Google Scholar] [CrossRef]
  28. Liu, X.J.; Long, Y. Automated identification and characterization of parcels with OpenStreetMap and points of interest. Environ. Plann. B Plan. Des. 2016, 43, 341–360. [Google Scholar] [CrossRef]
  29. Xing, H.F.; Meng, Y. Integrating landscape metrics and socioeconomic features for urban functional region classification. Comput. Environ. Urban Syst. 2018, 72, 134–145. [Google Scholar] [CrossRef]
  30. Pei, T.; Sobolevsky, S.; Ratti, C.; Shaw, S.-L.; Li, T.; Zhou, C. A new insight into land use classification based on aggregated mobile phone data. Int. J. Geogr. Inf. Sci. 2013, 28, 1988–2007. [Google Scholar] [CrossRef] [Green Version]
  31. Ríos, S.A.; Muñoz, R. Land use detection with cell phone data using topic models: Case Santiago, Chile. Comput. Environ. Urban Syst. 2017, 61, 39–48. [Google Scholar] [CrossRef]
  32. Tu, W.; Cao, J.; Yue, Y.; Shaw, S.-L.; Zhou, M.; Wang, Z.; Chang, X.; Xu, Y.; Li, Q. Coupling mobile phone and social media data: A new approach to understanding urban functions and diurnal patterns. Int. J. Geogr. Inf. Sci. 2017, 31, 2331–2358. [Google Scholar] [CrossRef]
  33. Hu, T.; Yang, J.; Li, X.; Gong, P. Mapping urban land use by using landsat images and open social data. Remote Sens. 2016, 8, 151. [Google Scholar] [CrossRef]
  34. Xia, N.; Cheng, L.; Li, M. Mapping Urban Areas Using a Combination of Remote Sensing and Geolocation Data. Remote Sens. 2019, 11, 1470. [Google Scholar] [CrossRef] [Green Version]
  35. Zhang, X.; Du, S.; Wang, Q. Hierarchical semantic cognition for urban functional zones with VHR satellite images and POI data. ISPRS-J. Photogramm. Remote Sens. 2017, 132, 170–184. [Google Scholar] [CrossRef]
  36. Liu, X.; He, J.; Yao, Y.; Zhang, J.; Liang, H.; Wang, H.; Hong, Y. Classifying urban land use by integrating remote sensing and social media data. Int. J. Geogr. Inf. Sci. 2017, 31, 1675–1696. [Google Scholar] [CrossRef]
  37. Zhang, Y.; Li, Q.; Huang, H.; Wu, W.; Du, X.; Wang, H. The combined use of remote sensing and social sensing data in fine-grained urban land use mapping: A case study in Beijing, China. Remote Sens. 2017, 9, 865. [Google Scholar] [CrossRef] [Green Version]
  38. Chen, L.C.; Zhu, Y.; Papandreou, G.; Schroff, F.; Adam, H. Encoder-decoder with atrous separable convolution for semantic image segmentation. Lect. Notes Comput. Sci. 2018, 11211, 833–851. [Google Scholar] [CrossRef] [Green Version]
  39. Chen, T.; Guestrin, C. Xgboost: A scalable tree boosting system. In Proceedings of the 22nd ACM SIGKDD International Conference on Knowledge Discovery and Data Mining; Association for Computing Machinery, San Francisco, CA, USA, 13–17 August 2016; pp. 785–794. [Google Scholar] [CrossRef] [Green Version]
  40. Long, J.; Shelhamer, E.; Darrell, T. Fully Convolutional Networks for Semantic Segmentation. IEEE T Pattern Anal. 2015, 39, 640–651. [Google Scholar] [CrossRef]
  41. Badrinarayanan, V.; Kendall, A.; Cipolla, R. SegNet: A Deep Convolutional Encoder-Decoder Architecture for Image Segmentation. IEEE T Pattern Anal. 2017, 39, 2481–2495. [Google Scholar] [CrossRef]
  42. He, K.; Zhang, X.; Ren, S.; Sun, J. Spatial Pyramid Pooling in Deep Convolutional Networks for Visual Recognition. IEEE T Pattern Anal. 2015, 37, 1904–1916. [Google Scholar] [CrossRef] [PubMed] [Green Version]
  43. Krizhevsky, A.; Sutskever, I.; Hinton, G. ImageNet classification with deep convolutional neural networks. Commun. ACM 2017, 60, 84–90. [Google Scholar] [CrossRef]
  44. Szegedy, C.; Liu, W.; Jia, Y.; Sermanet, P.; Reed, S.; Anguelov, D.; Erhan, D.; Vanhoucke, V.; Rabinovich, A. Going Deeper with Convolutions. In Proceedings of the 2015 IEEE Conference on Computer Vision and Pattern Recognition (CVPR), Boston, MA, USA, 7–12 June 2015. [Google Scholar] [CrossRef] [Green Version]
  45. He, K.; Zhang, X.; Ren, S.; Sun, J. Deep Residual Learning for Image Recognition. In Proceedings of the 2016 IEEE Conference on Computer Vision and Pattern Recognition (CVPR), Las Vegas, NV, USA, 27–30 June 2016; pp. 770–778. [Google Scholar] [CrossRef] [Green Version]
  46. Zhou, B.; Lapedriza, A.; Khosla, A.; Oliva, A.; Torralba, A. Places: A 10 million image database for scene recognition. IEEE Trans. Pattern Anal. Mach. Intell. 2017, 40, 1452–1464. [Google Scholar] [CrossRef] [PubMed] [Green Version]
  47. Peng, X.; Bao, Y.; Huang, Z. Perceiving Beijing’s “city image” across different groups based on geotagged social media data. IEEE Access 2020, 8, 93868–93881. [Google Scholar] [CrossRef]
  48. Deng, J.; Dong, W.; Socher, R.; Li, L.J.; Li, K.; Li, F.-F. Imagenet: A large-scale hierarchical image database. In Proceedings of the 2009 IEEE Conference on Computer Vision and Pattern Recognition, Miami, FL, USA, 20–25 June 2009; pp. 248–255. [Google Scholar] [CrossRef] [Green Version]
  49. Quattoni, A.; Torralba, A. Recognizing indoor scenes. In Proceedings of the 2009 IEEE Conference on Computer Vision and Pattern Recognition Workshops, Miami, FL, USA, 20–25 June 2009; pp. 413–420. [Google Scholar] [CrossRef] [Green Version]
  50. Xiao, J. Sun database: Exploring a large collection of scene categories. Int. J. Comput. Vis. 2016, 119, 3–22. [Google Scholar] [CrossRef] [Green Version]
  51. Crookston, N.L.; Finley, A.O. yaImpute: An R package for kNN imputation. J. Stat. Softw. 2007, 23, 16. [Google Scholar]
Figure 1. The ensemble learning based framework of urban land use mapping.
Remotesensing 12 03254 g001
Figure 2. The DeepLabV3+ model architecture of 2D physical feature extraction.
Remotesensing 12 03254 g002
Figure 3. The ResNet-50 model architecture of 3D physical feature extraction.
Remotesensing 12 03254 g003
Figure 4. The model architecture of socioeconomic feature extraction.
Remotesensing 12 03254 g004
Figure 5. Classification accuracy of model prediction.
Remotesensing 12 03254 g005
Figure 6. Spatial distribution of land use classification.
Remotesensing 12 03254 g006
Figure 7. Feature analysis for different land use types.
Remotesensing 12 03254 g007
Figure 8. Classification accuracy of XGBoost and RF on different feature sets.
Remotesensing 12 03254 g008
Figure 9. Comparison of model performances.
Remotesensing 12 03254 g009
Table 1. Classification criteria for urban land use types.
Land UseDescription
CommercialRetail, wholesale market, restaurant, office building, shopping center, hotel, entertainment (such as theatre, concert hall, recreational facilities)
EducationalUniversities, colleges, primary and secondary schools, kindergarten and its ancillary facilities
ResidentialUrban residential buildings (including bungalow, multistorey or high-rise buildings), homestead
NaturalNatural vegetation or artificial vegetation, water and water infrastructure
CivicGovernment agencies and organizations, hospitals, etc.
Transport Airport, railway station, bus stop, and other transportation facilities
IndustrialIndustrial land and storehouse
AgriculturalFarmland, natural or artificial grasslands and shrublands for grazing livestock
OtherVacant land, bare land, railway, highway, rural road, etc.

