Article

Classification of Active Fires and Weather Conditions in the Lower Amur River Basin

1
Arctic Research Center, Hokkaido University, Sapporo 0010021, Japan
2
Khabarovsk Federal Research Center, 680000 Khabarovsk, Russia
3
Center for International Forestry Research (CIFOR), Bogor 16115, Indonesia
4
Faculty/Graduate School of Agriculture, Kyoto University, Kyoto 6068502, Japan
*
Author to whom correspondence should be addressed.
Remote Sens. 2020, 12(19), 3204; https://doi.org/10.3390/rs12193204
Submission received: 7 September 2020 / Revised: 27 September 2020 / Accepted: 29 September 2020 / Published: 1 October 2020

Abstract

:
Most wildland fires in boreal forests occur during summer, but major fires in the lower Amur River Basin of the southern Khabarovsk Krai (SKK) mainly occur in spring. To reduce active fires in the SKK, we carried out daily analysis of MODIS (Moderate Resolution Imaging Spectroradiometer) hotspot (HS) data and various weather charts. HS data of 17 years from 2003 were used to identify the average seasonal fire occurrence. Active fire-periods were extracted by considering the number of daily HSs and their continuity. Weather charts, temperature maps, and wind maps during the top 12 active fire-periods were examined to clarify each fire weather condition. Analysis results showed that there were four active fire-periods that occurred in April, May, July, and October. Weather charts during the top active fire-periods showed active fires in April and October occurred under strong wind conditions (these wind velocities were over 30 km h−1) related to low-pressure systems. The very active summer fire at the end of June 2012 occurred related to warm air mass advection promoted by large westerly meandering. We showed clear fire weather conditions in the SKK from March to October. If a proper fire weather forecast is developed based on our results, more efficient and timely firefighting can be carried out.

1. Introduction

The strong amplification of global warming in the Arctic has accelerated the thaw rate of the permafrost [1]. Soils in the permafrost region hold twice as much carbon as the atmospheric carbon pool (~750 PgC) [2,3]. Ongoing degradation of permafrost due to recent Arctic warming [3,4] could release the large quantities of carbon stored in frozen soils into the atmosphere. Carbon release from thawing permafrost, over the past two decades, is due to boreal fires releasing substantial amounts of carbon in boreal Asia (124 TgC year−1) [5]. Fires will alter the thermal state of permafrost and can create thermokarst depressions and collapse scars in forested ecosystems [6]. The interactions between climate, fire, and permafrost should be carefully considered [7].
Fires in the northern circumpolar region show a distinct spatial distribution that consists of two major regions in Central Asia and southeastern Siberia, which has an observed burnt fraction of more than 10% year−1 over the past 20 years derived from the Global Fire Emissions Database version 4.1 with small fires (GFED4.1s) [8,9]. Central Asia has an extensive burnt area, but this is mostly from agricultural fires in Ukraine, Kazakhstan, and southern Russia (50°–57°N, 30°–85°E) [10,11]. In contrast, southeastern Siberia (45°–55°N, 100°–150°E, Figure 1) contains dense boreal forests and peatlands in the permafrost zone and has had substantial forest fires [8]. The great fire in China occurred on 6 May 1987, burning in excess of 1.3 million hectares of prime forest in the Greater Khingan Range [12]. The weather conditions prior to and during the great China fire were an extremely dry forest fuel situation from the beginning of May 1987, which was combined with increasing temperatures and strong winds. The response of China and the Soviet Union to this great Chinese fire was very different as China worked hard to extinguish the fire, and the Soviet Union did less. As a result, the burnt area of forest in China and the Soviet Union was 12,140 km2 and 60,702 km2, respectively, making a large difference. This difference in firefighting activities can also be seen in the 2003 fire distribution across the border (the Amur and Argun River) between the two countries (Figure 1).
In 2003, active fires occurred in southeastern Siberia [13]. Figure 1 clearly shows that many hotspots (HSs) were detected in Russia while few HSs were seen in northern China. Significant differences could be seen on both sides of the Russian–Chinese border. The study on high human impact on the forest through fires due to lack of control, ineffectual fire-management policies, and new socioeconomic conditions showed that there were more fires in years during which the weather was anomalous, but more than 87% of fires in boreal Russia were started by people [14,15]. Recent research on extensive fires in southeastern Siberia (45°–55°N, 100°–150°E) has also clarified the relationship between spring fire activities and Arctic Oscillation [8]. However, mechanisms and dynamics of boreal fires in the SKK need to be further investigated. Most fires in the SKK are also caused by human activities such as land reclamation, logging, camping, and hunting.
In July 2012, a very active fire broke out in the lower Amur River region (the easternmost area of southeastern Siberian in Figure 1 (48°–54°N, 128°–141°E), southern Khabarovsk Krai (SKK)), suggesting the need for more detailed fire analysis. According to the climate models [13,19], an increase in the average annual air temperature and the duration of the fire season in Russia [19], an increase in the frequency and strength of weather and climate anomalies [19,20,21] will contribute to increased forest fires. This has been confirmed in the southeastern Siberian forests of the Khabarovsk Krai where there is a long-term positive trend in the number of forest fires [22], despite the implementation of fire information campaigns and preventive work among the population, and the use of new technologies in detecting fires. These above-mentioned facts suggest that the development of a more effective fire forecast system is needed to prevent active fires in the SKK. We can say that protecting lower land in the lower Amur River region from fires is one of most urgent issues for the southern Khabarovsk Krai (SKK).
Previous research on active fires in southeastern Siberia have already reported on spring fire conditions [8,9,10,12]. However, most their results were based on monthly data analysis results for large region of southeastern Siberia. In this paper, we carried out daily-base analysis to grasp the fire weather conditions during the active fire-period. MODIS (Moderate Resolution Imaging Spectroradiometer) daily hotspot (HS) data were analyzed to clear spatial distribution and temporal occurrence of wildland fires in the lower Amur River region in the SKK. Daily HS data were used to identify the active fire days or fire-period. Weather conditions during active fire-periods were analyzed using various weather charts to clarify active fire weather conditions. The analysis results will help to carry out effective fire suppression before active fire occurrence.
Finally, we would like to describe the background of this research. We follow the previous research project “Fire management in high biodiversity value forests of the Amur–Shihote–Alin Ecoregion”. The objective of the project is to strengthen the conservation of the high biodiversity value forests of the Amur–Sikhote–Alin Ecoregion through improved forest fire management, reducing the frequency, size, and intensity of catastrophic fires in the areas of global conservation importance. We attempt to propose one method of fire management in this paper.

2. Methods and Data

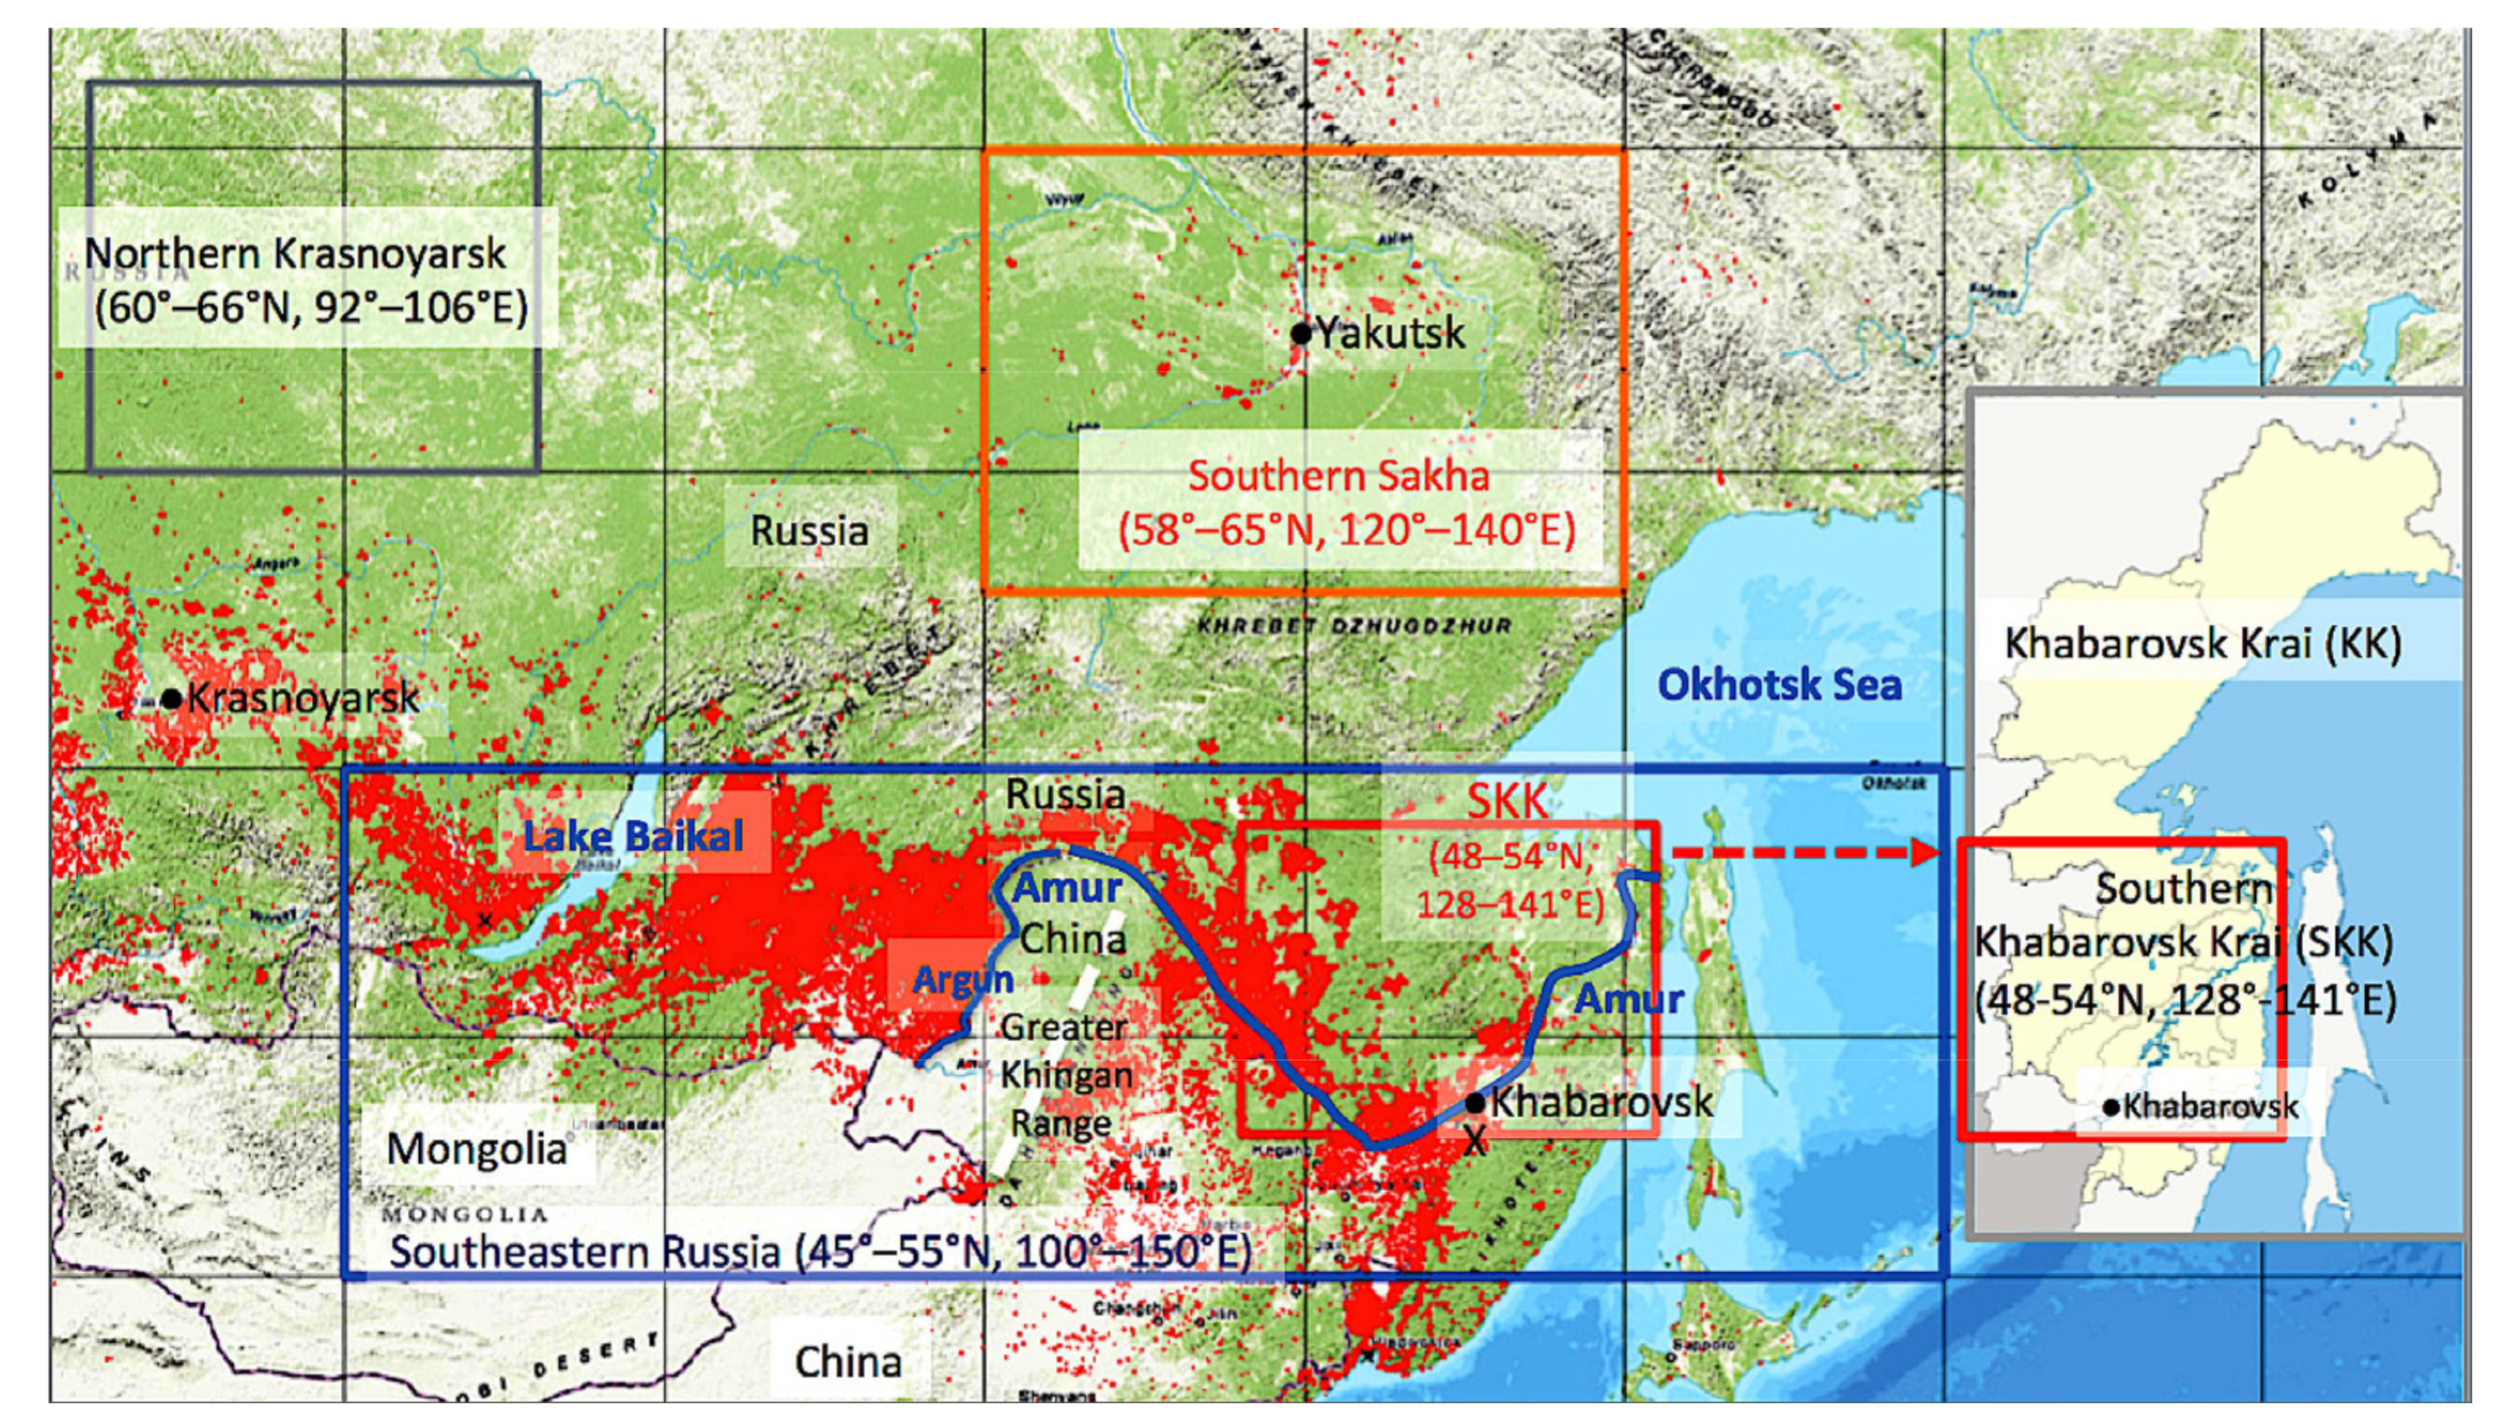
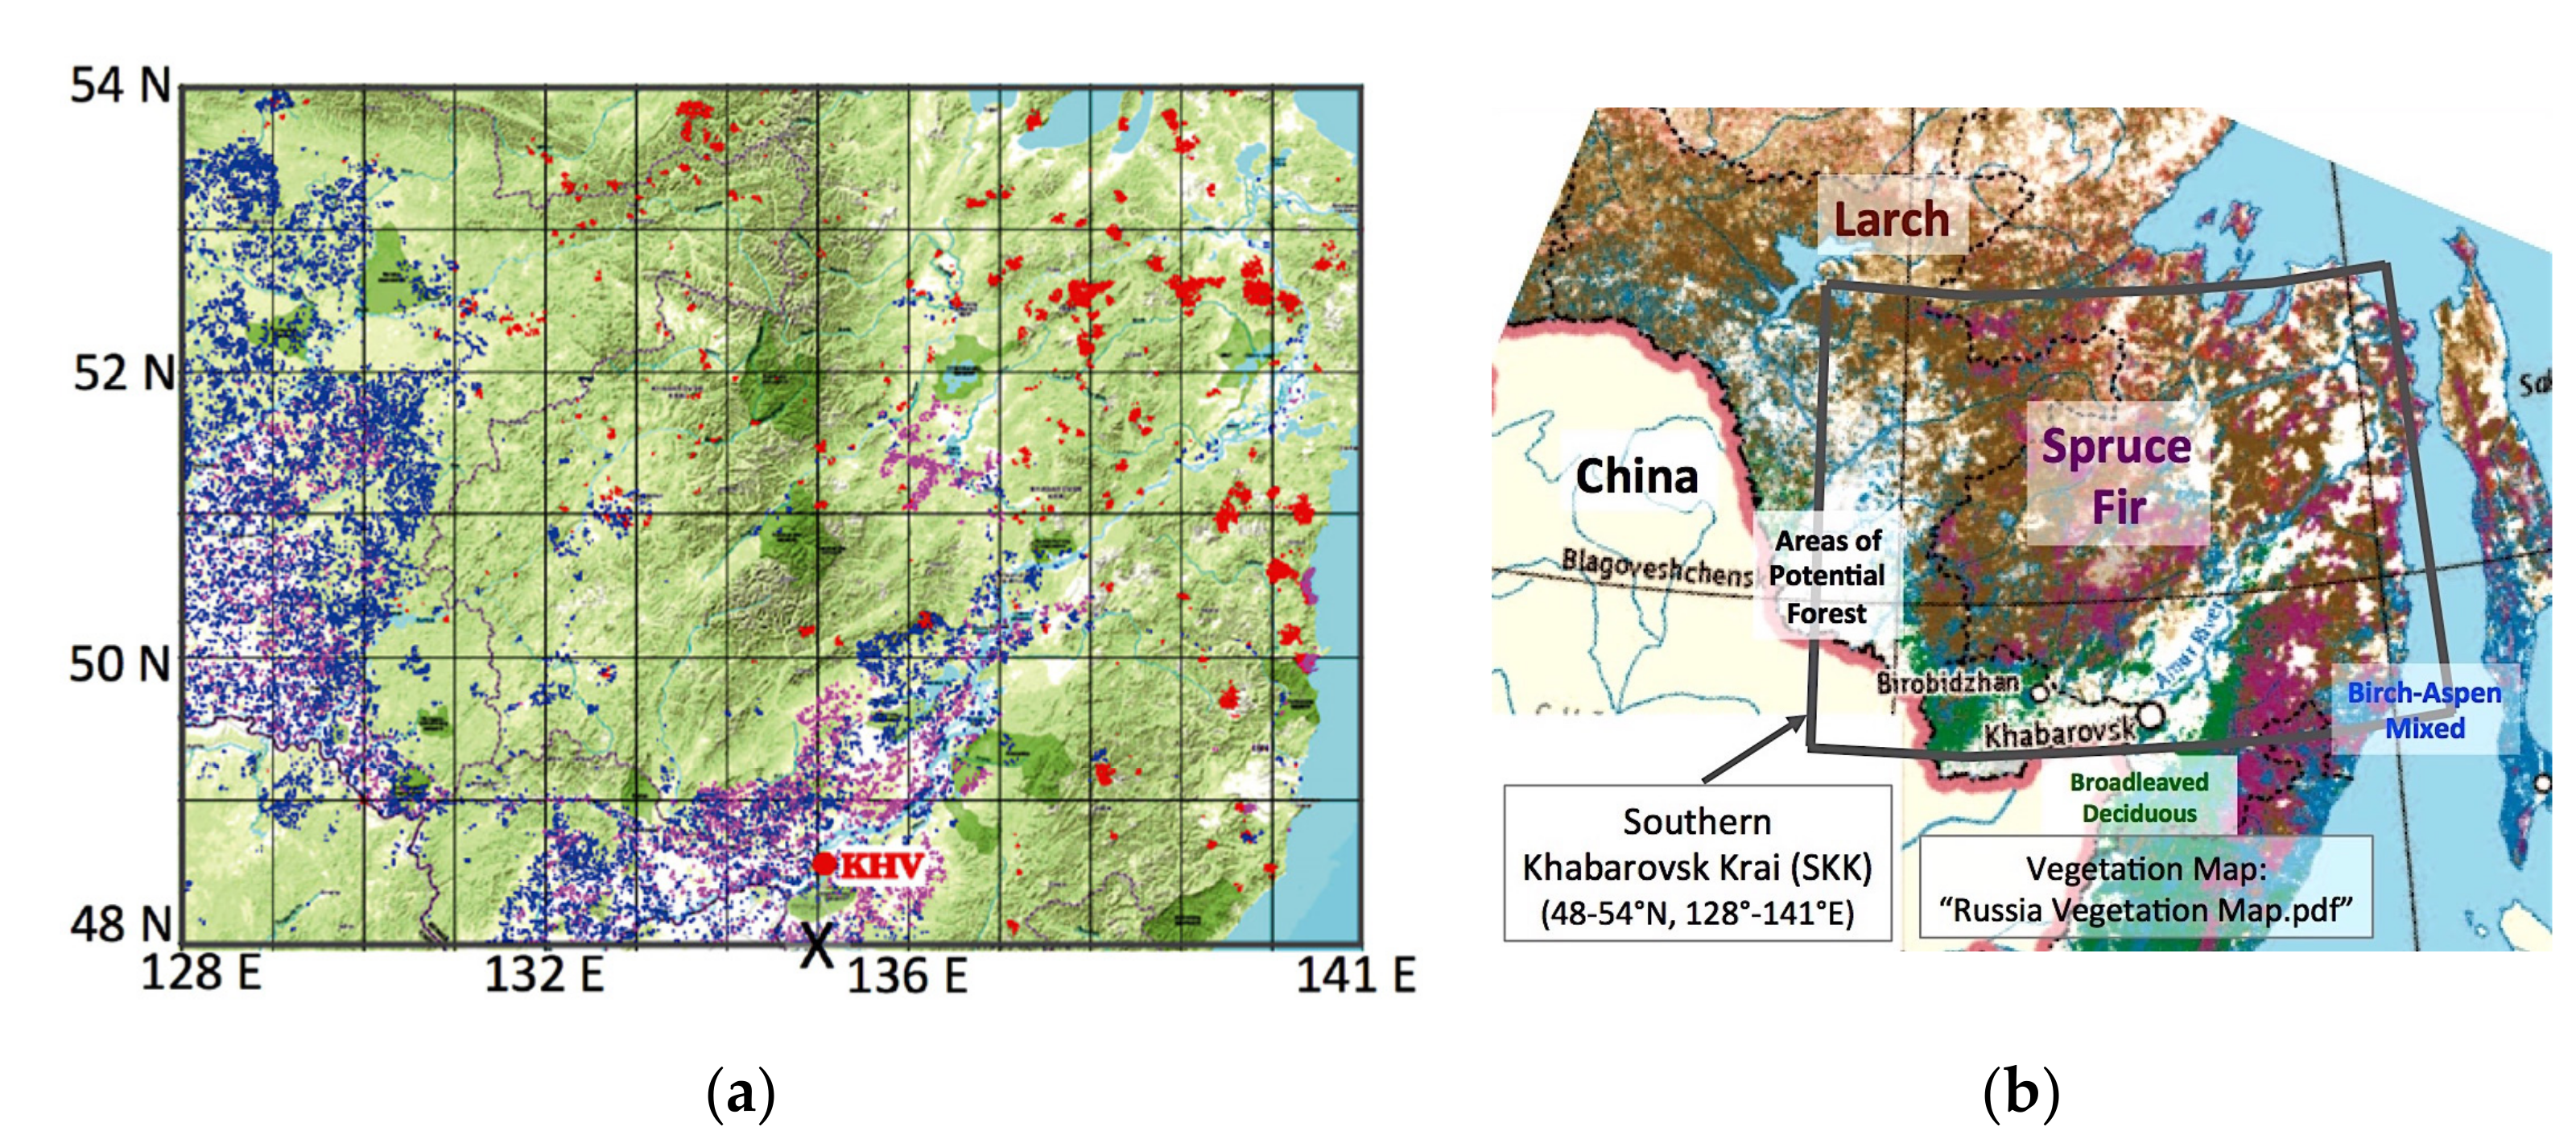
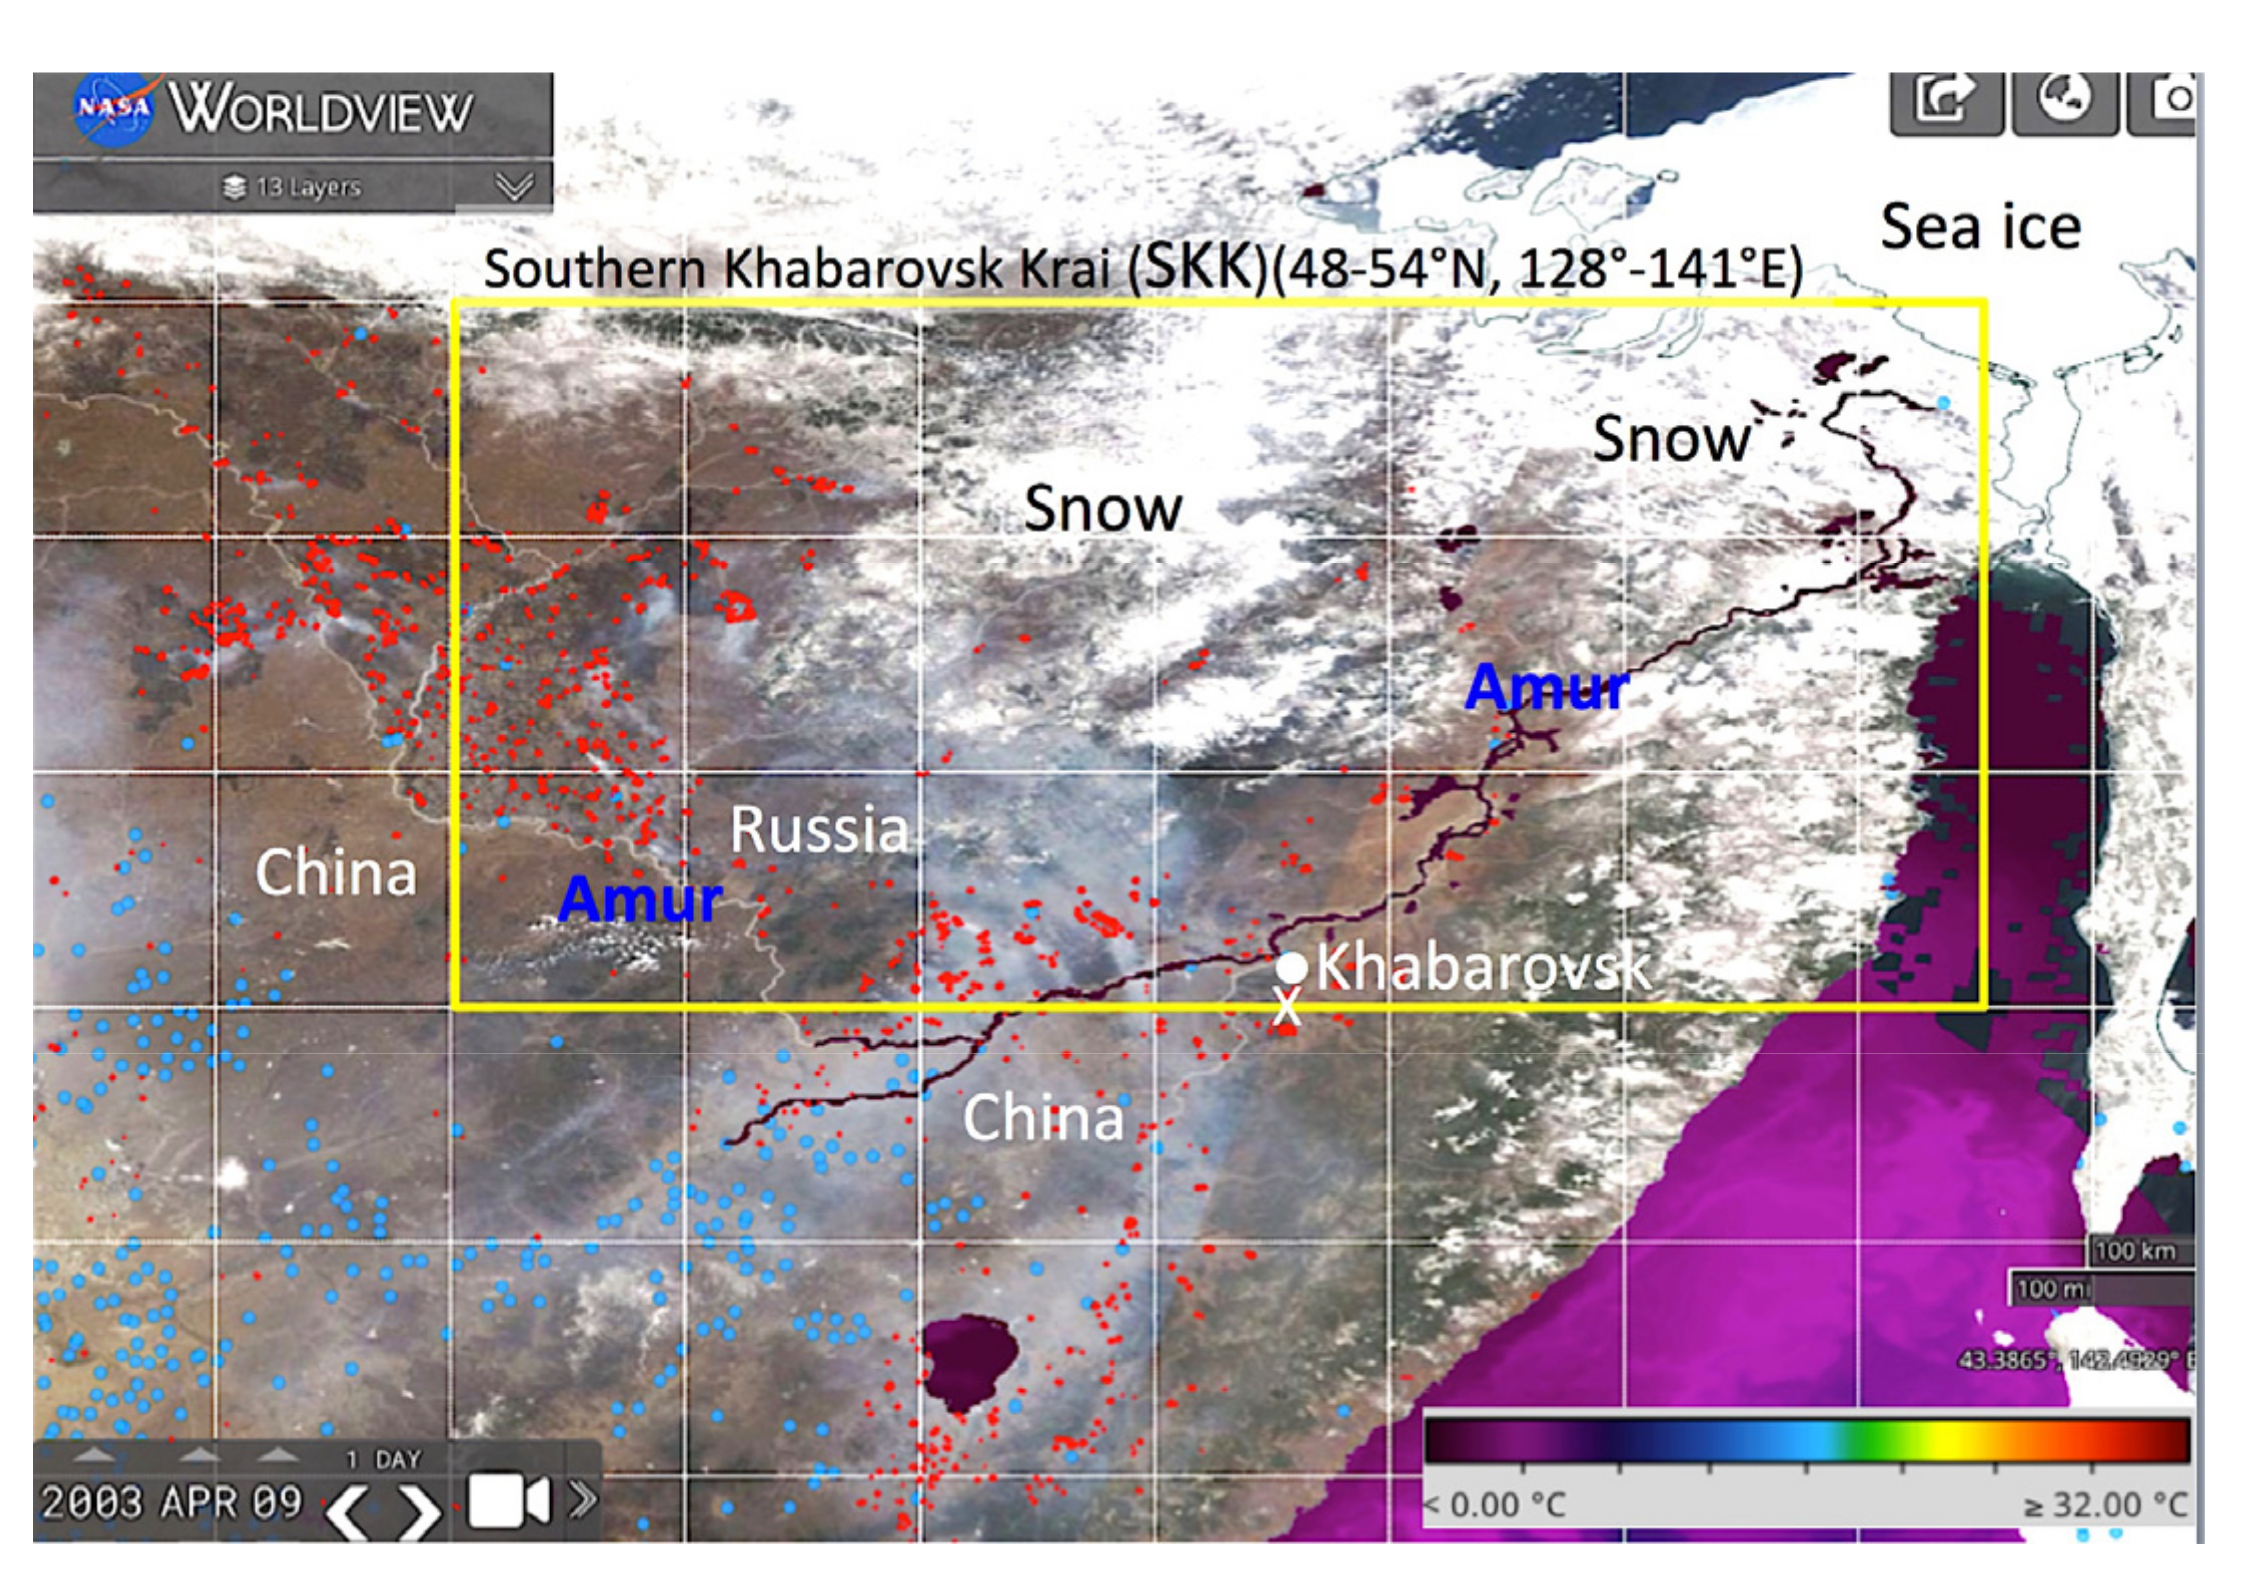
2.1. Study Region and Vegetation

Figure 2a shows the study region (the southern Khabarovsk Krai (SKK; 48°–54°N, 128–141°E). A base map was borrowed from the LandsatLook Viewer website [18]. The SKK is located at around 50°N and is the easternmost part of the Eurasian continent (Figure 1). Khabarovsk (KHV), the capital of the Khabarovsk Krai (KK), is located at 48.48°N, 135.08°E. The Amur River runs from 50°N,128°E to 48°N,131°E in the lower left corner of Figure 2a and is the Russian–Chinese border. Then, the Amur River runs from the west of KHV at 48°N, 132°E to the northeast of the river mouth at 53°N, 141°E.
Hotspot (HS) data in the study regions were analyzed to gather information about recent fire activities. In Figure 2a, the June 2012 fires (the top fire-period “(1)29Jun’12” in Table 1), the October 2005 fires (the second fire-period “(2)Oct’05”), and the April and May fires of the third to sixth fire-periods ((3)–(6)) in 2003, 2008, and 2018 are shown by red dots, purple dots, and blue dots, respectively. In Figure 2a, KHV is Khabarovsk, and ‘X’ is the wind reference site (48°N, 135°E).
Figure 2b shows the vegetation map of the SKK and surrounding region. The map is from “Russia Vegetation Map.pdf” [23]. Vegetation is shown by different colors: Larch in brown, Spruce fir in purple, areas of potential forest in white, Birch–Aspen mixed in blue, and Broadleaved deciduous in green. Fires in 2012 (red dots in Figure 2a) occurred mainly in the northeast side of the SKK where larch, spruce, and fir forests are located on permafrost (Figure 2b).
Understanding forest fires in the SKK will contribute to the identification of environmental influences that cause the decreasing size and increasing deterioration of forests. It is simply because the Khabarovsk Krai (KK) of the Far East region has a unique forest ecosystem compared with the rest of the widespread Russian Federation, where northern forests and temperate deciduous forests come together [24]. The taiga forest in KK, considered the most biologically diverse in Russia, is home to the endangered Amur tiger. Half of the world’s wild Pacific salmon ecosystems are in the Russian Far East. More significant than its length, is its biodiversity. The river basin is home to the largest species in the salmonid family (the Siberian taimen), one of the largest freshwater fish (the kaluga sturgeon), and rare and world-renowned species such as the Amur tiger, Amur leopard, Far Eastern forest cat, Blackiston’s fish owl, yellow-throated marten, etc. The basin is home to 130 fish species, 200 mammal species, at least 600 bird species, and about 6000 species of vascular plants. In addition, there is a unique combination of “Manchurian” and “Okhotsk-Kamchatka” flora in the territory of the SKK. The relict plant species of the Tertiary period, which are widespread in the subtropics (partly in the tropics of East Asia), can harmonize with relics and endemics of the taiga, having in common the taiga regions of the Pacific coast of North America. The wetlands of the SKK are the habitats of the populations of the Far Eastern stork, Japanese crane, Far Eastern soft-bodied turtle, and Komarov’s lotus.
According to the World Wildlife Fund’s Global 200 Study [25], the Amur Basin is one of the world’s 200 most valuable wilderness places. In other words, it has a high resource value, so increased deforestation is exacerbated by the demand for lumber, and the increased frequency of forest fires accompanied by human behavior has greatly increased influence in the region. This is also a region where indigenous and minority groups settled because of the diverse fauna long before the arrival of the Russian people, and there has long been a traditional hunting and fishing culture in place.

2.2. Hotspot (Fire) and Weather Data

Seventeen years of hotspot (HS) data (2003–2019) detected by MODIS on the Terra and Aqua satellites were used to evaluate fires in the study region (SKK). MODIS HS data collected during 2003–2019 were obtained from the NASA Fire Information for Resource Management System [26] Minimum size of the hotspot was 1 km. We used only the spatial and temporal HS data in this study. The daily HSs were used to identify spatial distribution and temporal occurrence in the SKK. A period of high fire activity was defined here as consecutive fire days when the number of daily hotspots was greater than 300 [16,17,27]. Several active fire-periods from 2003 to 2019 were identified and ranked by the total number of HSs of each active fire-period.
Active fire occurrence and conditions in the SKK were also confirmed by checking the satellite imageries (Corrected Reflectance (true color), MODIS on Terra) of Worldview) [28]. Worldview gives us various information related to fire, smoke from fire, wind direction, surface conditions, and so on.
Annual fire histories from 2003 to 2019 in the SKK were made by accumulating the daily number of HSs of each year. To evaluate fire activity during the active fire-period, the fire rate (HS day−1) obtained from the accumulated daily HS curve was used in this paper. We have already applied this fire rating to distinguish three fire stages in peatland fire regions in Indonesia [27].
Weather charts at the upper-level (500 hPa) and lower-level (925 hPa) layers, temperature maps at mid-level (850 hPa), and U and V wind distribution maps at the lower-level (925 hPa) were obtained from the website of the National Center for Environmental Prediction (NCEP)/National Center for Atmospheric Research (NCAR) Reanalysis 1: Pressure [29]. Coverage and spatial resolution of the NCEP reanalysis data spanned geographic longitude and latitude 0.0°E to 358.125°E and −88.542°N to 88.542°N. Spatial resolution was about 2.5° × 2.5°, and period and temporal resolution were 1 January, 1948 to the present, 6-hourly, daily, and monthly. These maps and charts were drawn with the help of an automatic drawing system on the above-mentioned web page. The main input data were cover area (latitude and longitude), level (500, 850, and 925 hPa), date (year, month, day), and plot type.
Weather charts at the upper-level (500 hPa) were used to identify the presence of high pressures, low pressures, troughs, ridges, and westerlies. Temperature maps at the mid-level (850 hPa) were used to monitor the movement of warm air masses cTe (continental temperate) [16,17]. Weather charts and wind distribution maps at the lower-level (925 hPa) were used to identify ground weather conditions.
Various weather conditions in Khabarovsk were obtained from Weather Spark.com [30]. Statistical weather data showed windy conditions in spring and autumn (highest average wind speed was 13.9 km h−1 on April 15 and about 13.5 km h−1 in the middle of October; lowest average wind speed was 9.4 km h−1 on July 11), and dry conditions in spring and autumn (nearly 100% dry days in April and October). August was wettest month, about 117 mm month−1. Reasons for the different fire activities in several fire seasons can be explained partially by the above unique weather conditions, namely the windy and dry climate in the SKK.

3. Results

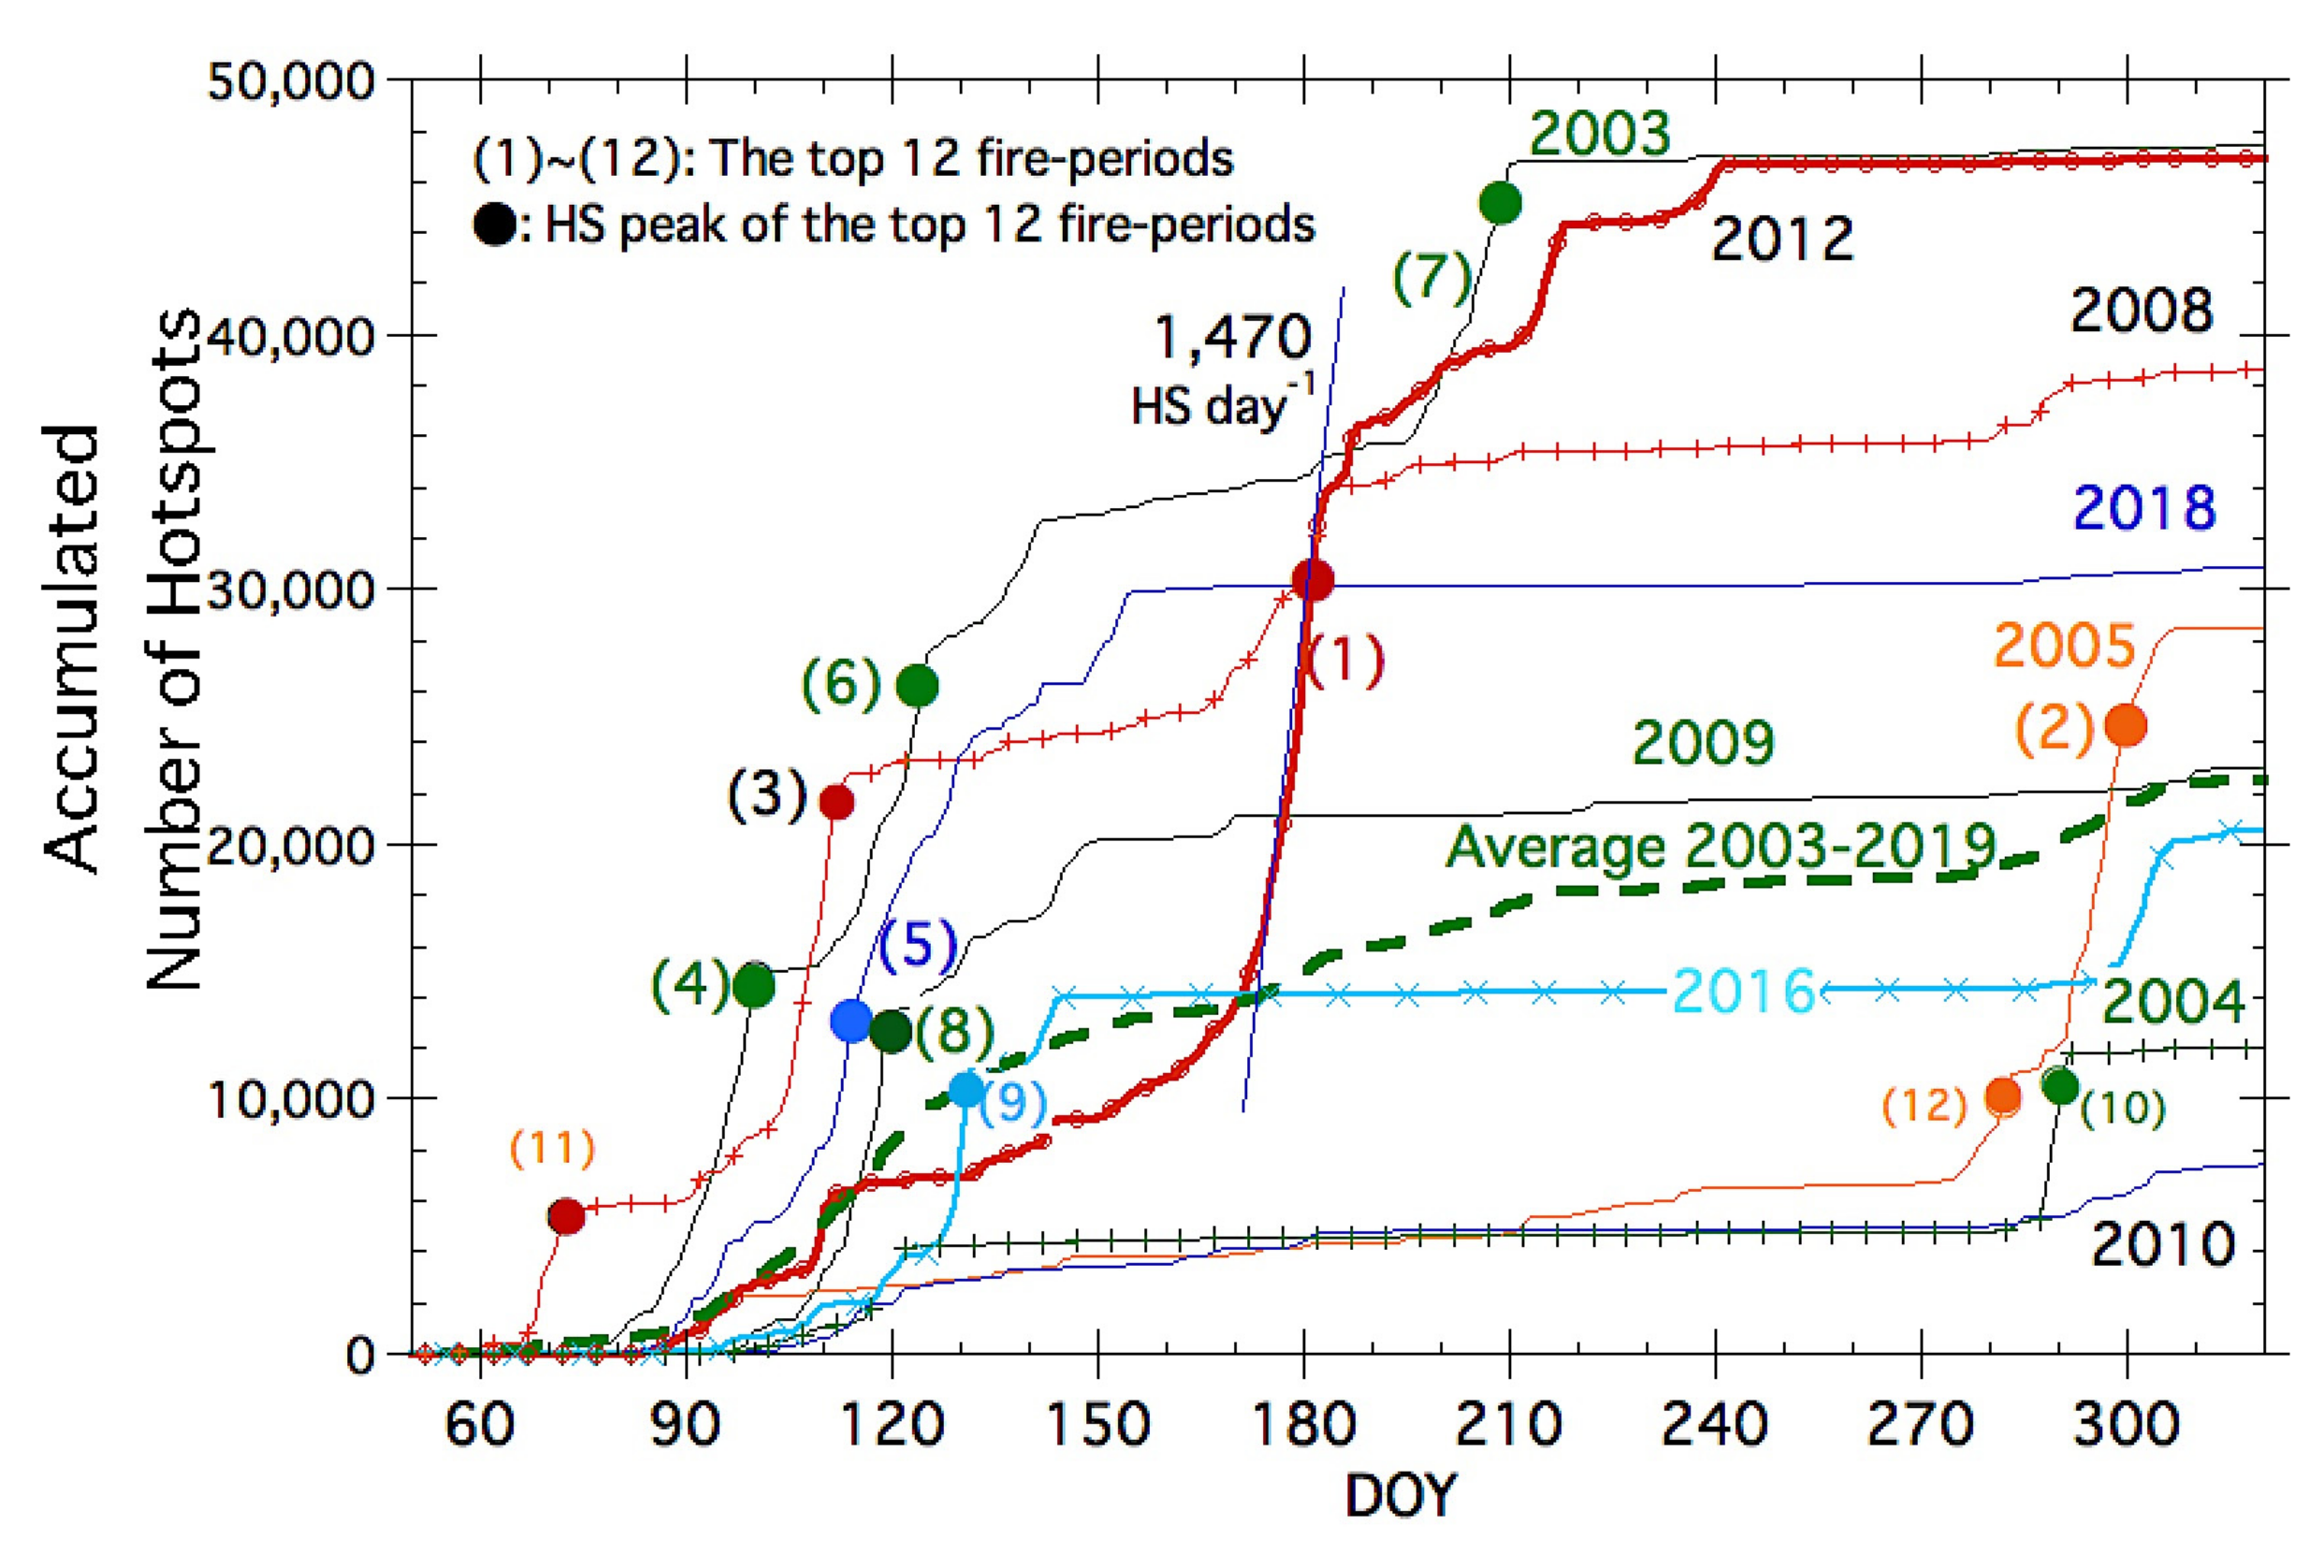
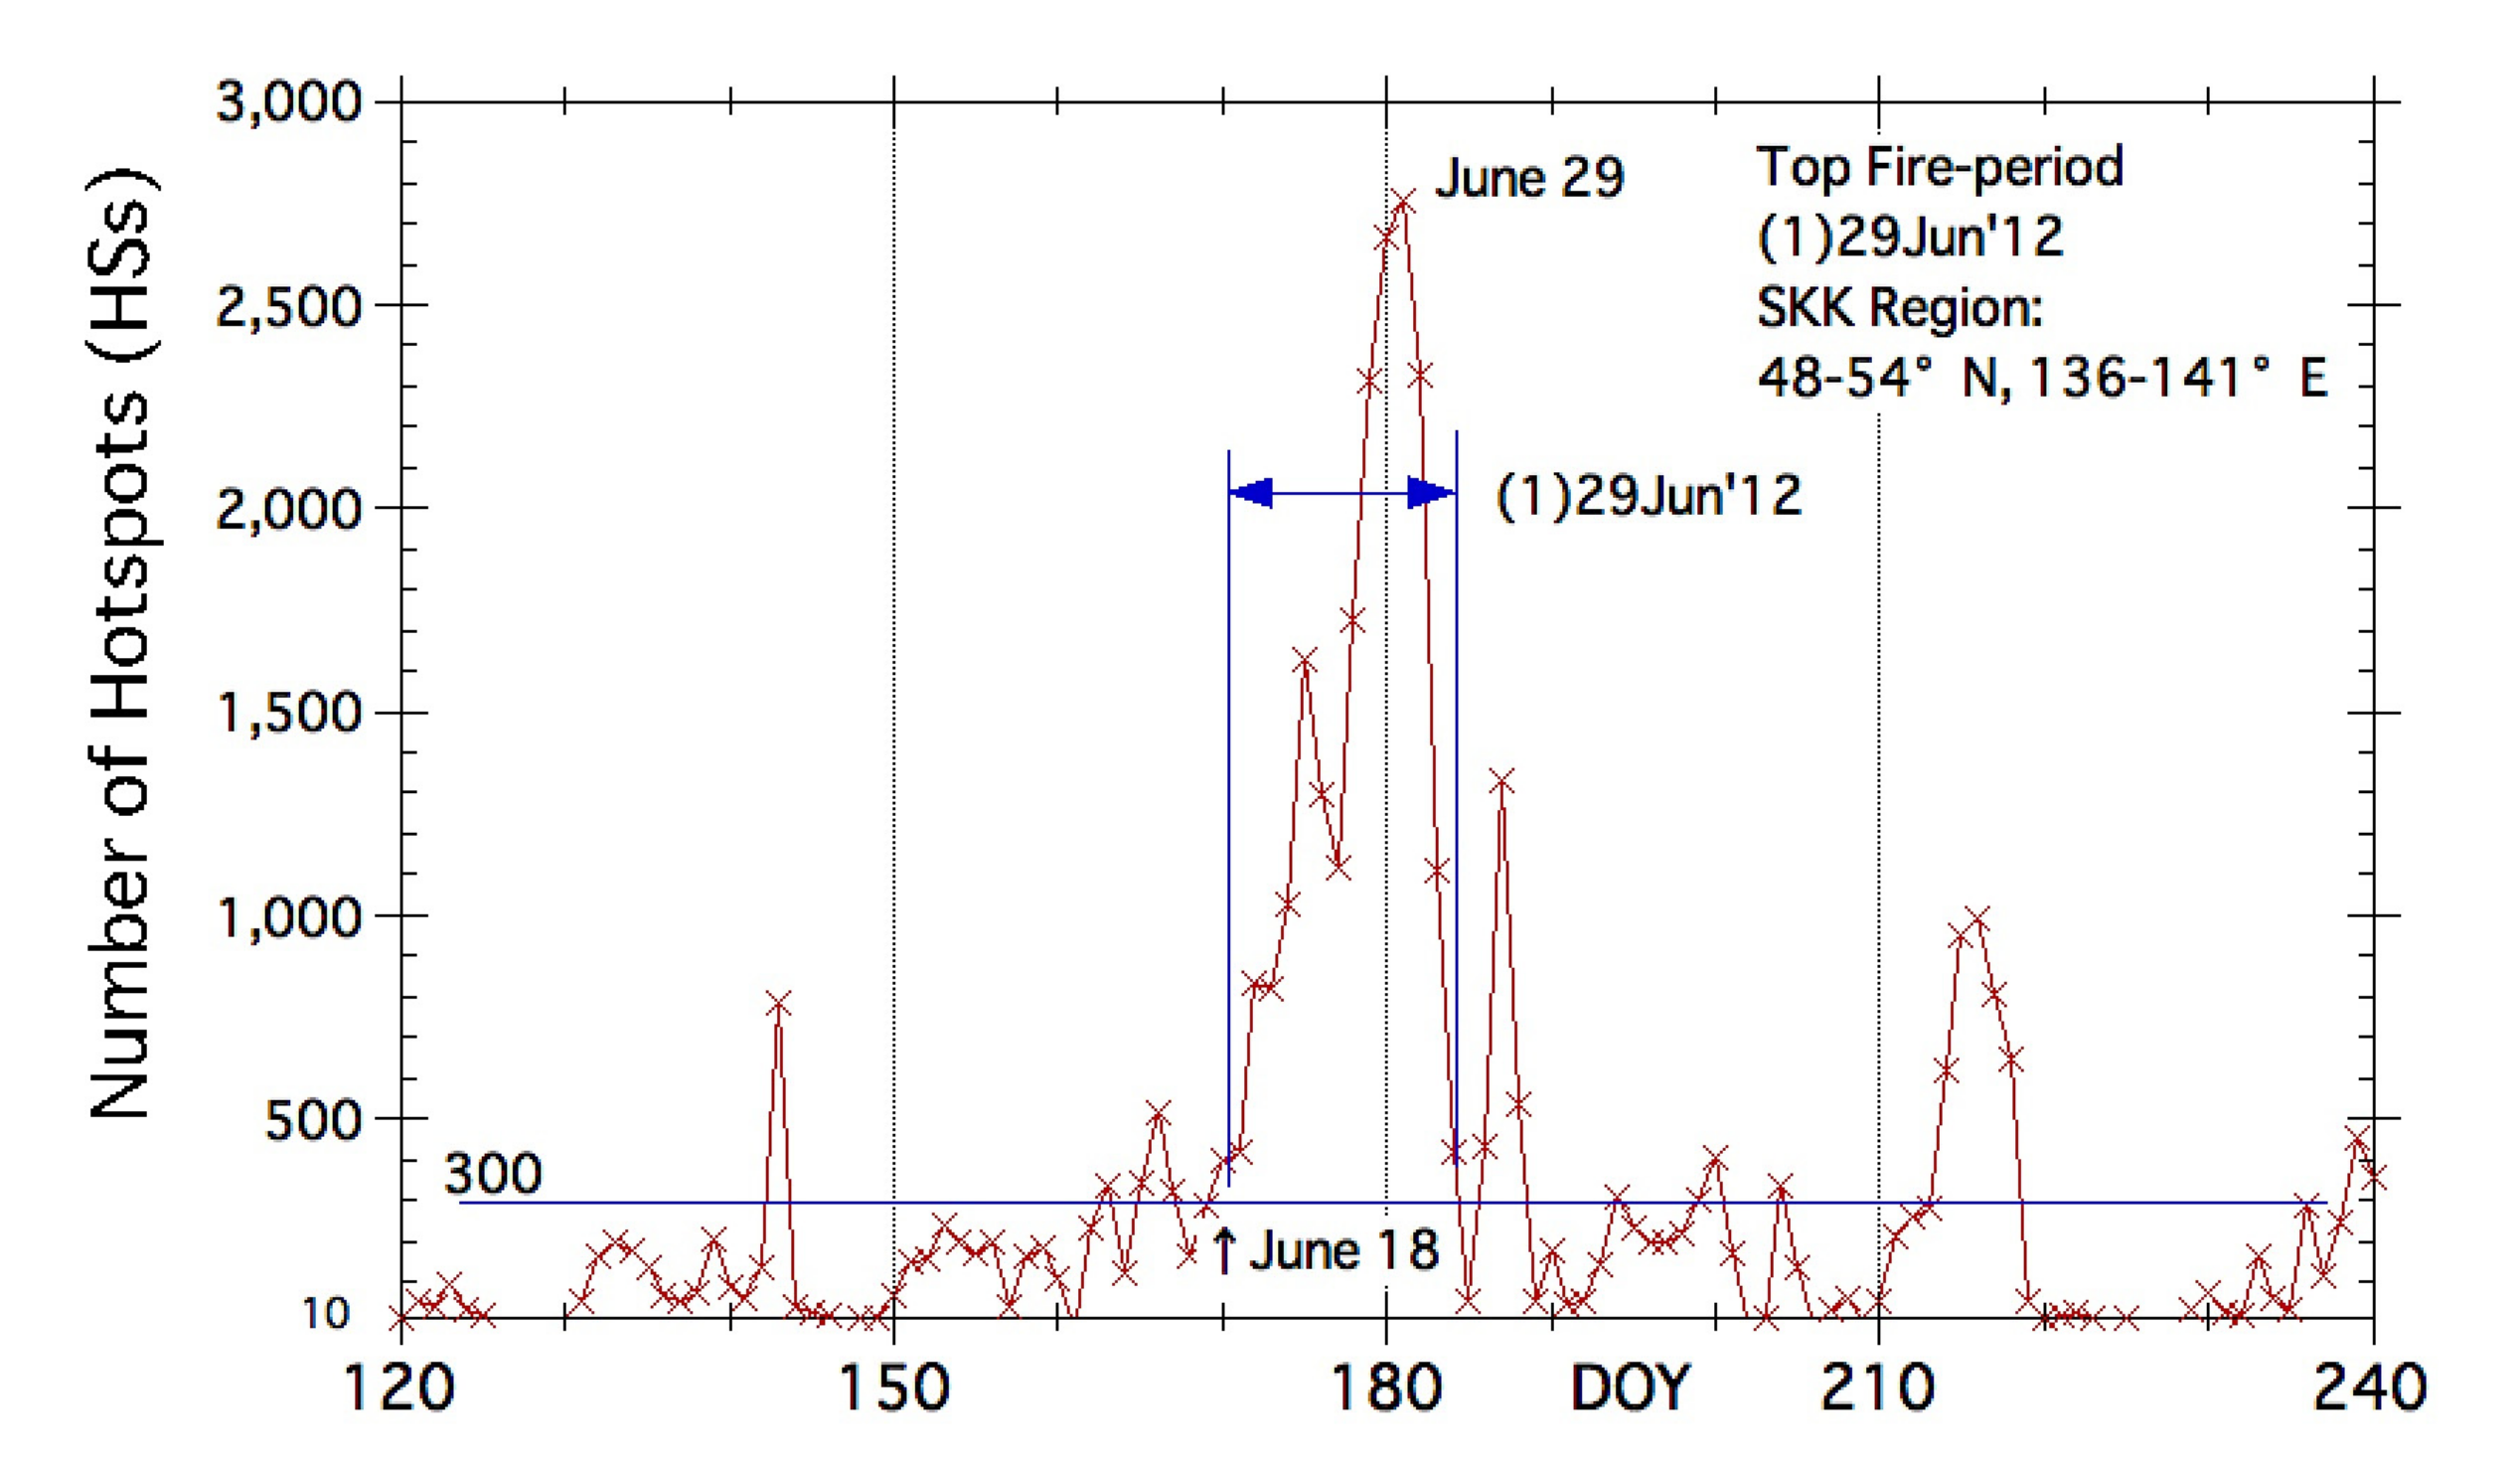
3.1. Top TwelveActive Fire-Periods

Accumulated daily hotspot (HS) curves of the selected years in Figure 3 show the fire occurrence trends in the SKK. Accumulated daily HS is simply calculated by adding the daily hotspots. A period of high fire activity is obtained as consecutive fire days when the number of daily hotspots is greater than 300 [6]. When the total number of HSs of a fire-period was less than 4000, the fire-period was excluded for simplicity. The 12 extracted active fire-periods are listed in Table 1.
Fire rate (HS day−1) [27] was introduced to understand fire activity during the fire-period. The fire rate is defined as follows:
Fire   rate   =   Accumulated   HSs   j     Accumulated   HSs i ) / j i
where i, j are the DOY (day of the year), j > i, i > DOY = 2.
The active fire-periods in Table 1 are ranked by the total number of HSs of each active fire-period. We named the active fire-periods using their ranking, hotspot peak date, month, and year, for example, “(1)29Jun’12”. Names for each fire-period came from the peak HS date and month. Hereinafter, abbreviations reflecting the rank of each fire-period in Table 1 such as (1), (2), (3), …, (12), were used to shorten the sentence and make simple figures like that in Figure 3.
Totals at the bottom of Table 1 show that the total number of HSs of the top 12 fires was 130,948, and that the fires were responsible for about 1/3 (34.2%) of 382,878 fires (total number of HSs of the past 17 years). As there were significant differences in the total HSs between the first and second fire-periods (4,825 HSs, about 1σ) and between the eighth and ninth, the top 12 active fire-periods (2950 HSs, about 0.6σ) could be divided into three categories. Here, we used two adjectives, ‘very strong’ for (1) and ‘strong’ for (2)–(8). Therefore, “(1)29Jun’12” is called a ‘very strong fire-period’ in this paper.
A straight line on the accumulated HS curve for 2012 in Figure 3 shows the fire rate for (1) in 2012. A very high fire rate of about 1500 HS day−1 was observed during (1) in 2012. Although similar high fire rates were also found during (3) in April and (9) in May, their periods (eleven and five days), were shorter than the period in (1) (15 days).

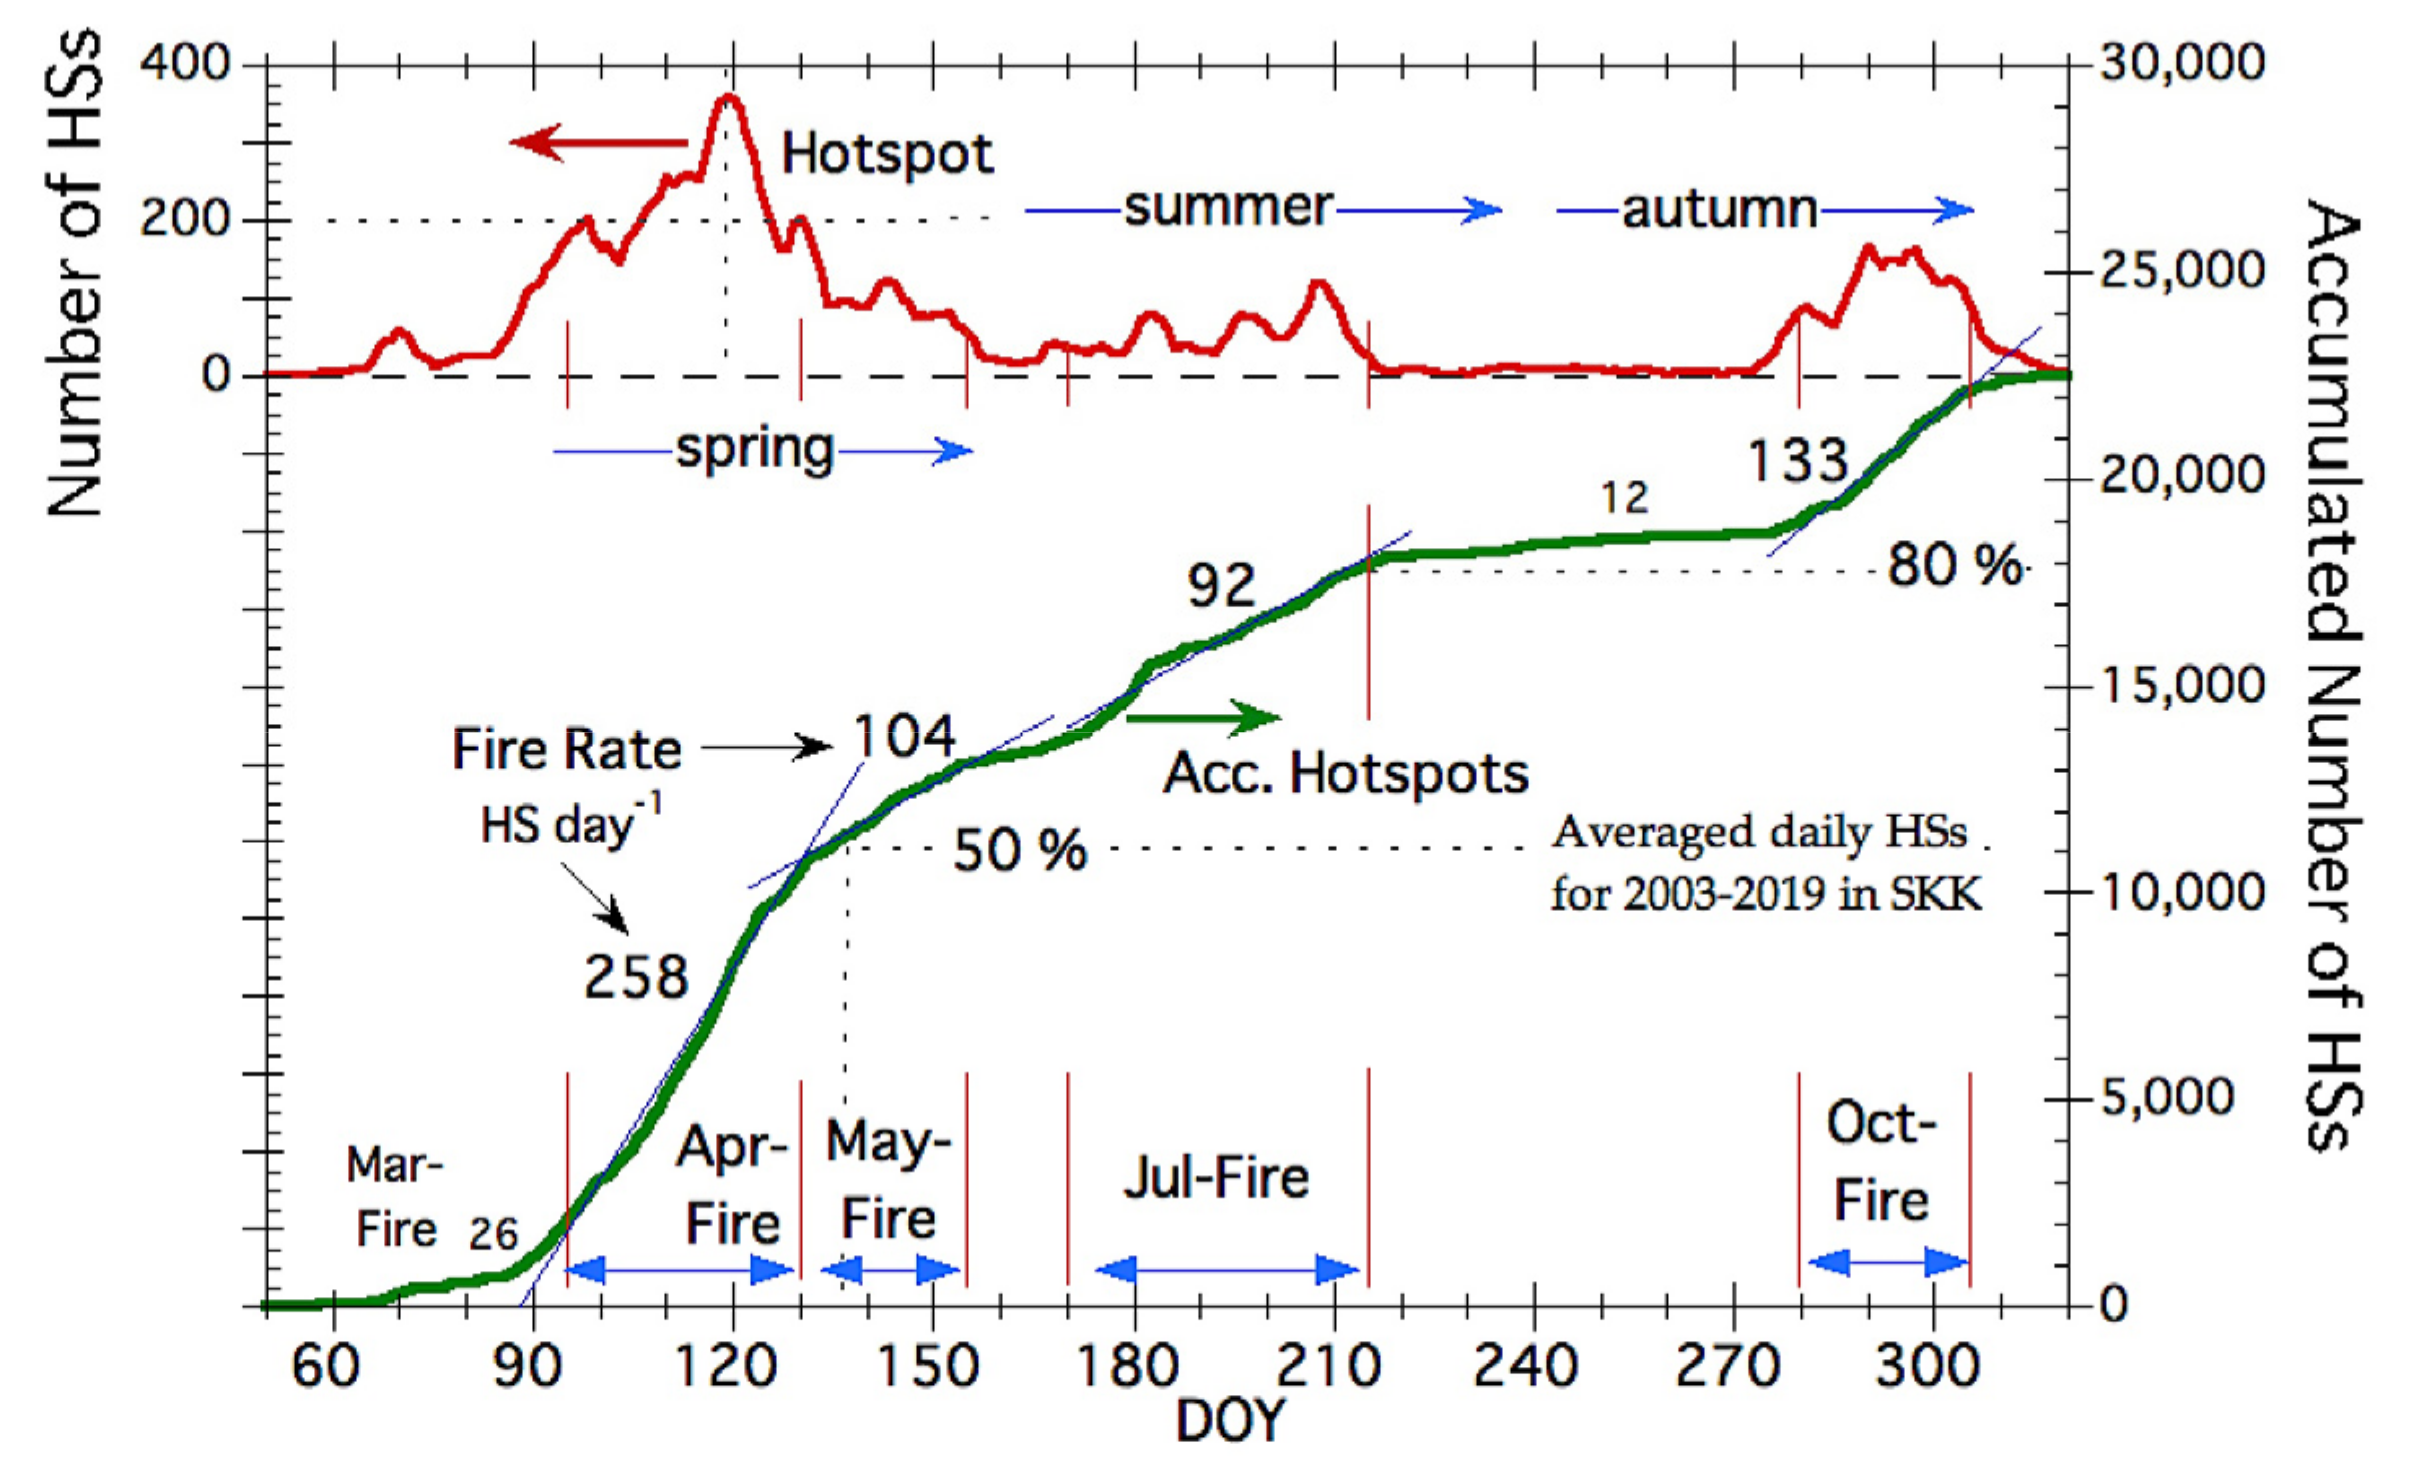
3.2. Classification of Fire-Periods

The top 12 fire periods (Table 1) occurred in March, April, May, July, and even October, so it was necessary to classify them into several fire periods and examine each weather condition for the three fire seasons (spring, summer, and autumn). This classification of active fire-periods is also needed to establish a fire-fighting strategy under different weather conditions of the three fire seasons. The averaged daily hotspots (HSs, the 5-day running mean values) of the last 17 years from 2003 to 2019 in the southern Khabarovsk Krai (SKK) is shown by a thick red curve in the upper part of Figure 4. The accumulated HS curve is shown by a thick green curve in the lower part of Figure 4. The total annual average number of HSs was 22,522 and the average maximum hotspot peak day was April 29 (DOY = 119) and number of HSs was about 360.
With the help of four blue straight lines (straight-line approximation) on the daily accumulated HS curve in Figure 4, we could define four major fire seasons (vertical orange lines show each fire-period, Mar-: March-, Apr-: April-, Jul-: July-, and Oct-: October-) in the SKK. Their fire rates (HS day−1) were derived from the gradients of each straight-line shown in Figure 4.
From Figure 4, the spring fires in April were very intense and their HS rate was about 258 HS day−1 (DOY = 95-130). From the beginning of May, the fire rate decreased to about 104 HS day−1 (DOY = 131–155). After a transitional fire-period from spring to summer in the middle of June (DOY = 156–170), the active fire-period with 92 HS day−1 (DOY = 170–215) started from the end of June to the top of August. The curve was almost flat for August and September, showing a weak fire activity of about 12 HS day−1 (DOY = 215–280) under noticeable summer precipitation related to the East Asian monsoon (August was the wettest month, about 117 mm month−1). The fires became active again from its peak in October with a rate of about 133 HS day−1 (DOY = 280–305). From four large fire rates (>90 HS day−1), we defined four major fire-periods and named them as April-Fire, May-Fire, July-Fire, and October-Fire in this paper. Fire activities of the other fire-periods were not so active. Here, we just classified them and called them March-Fire, June-Fire (transition fire-period from spring to summer), AS-Fire (August and September), and November-Fire.
April-Fire (DOY = 95–130) occurred from the beginning of April (April 5) to the middle of May (May 10). March-Fire and April-Fire were responsible for 10% and 40% of the total annual average number of fires (HSs,) respectively. Up to and including the peak in May, was when about 50% of fires occurred on average. May-Fire (DOY = 131–155) started from the middle of May (May 10) to the beginning of June (June 4) and was responsible for about 13%. After the transition fire-period in the middle of June, the July-Fire (DOY = 170–215) started from the end of June (June 19) to the beginning of August (August 3) and was responsible for about 15%. October-Fire (DOY = 280–304) occurred in October (from October 7 to November 1) and was responsible for about 20%. From these fire tendencies, April-Fire (DOY = 95–130) was the main fire event. This April-Fire in the SKK is a special feature that is different from summer fires in other northern regions in Siberia and Alaska [8,9,10,12,13,16,17,22].

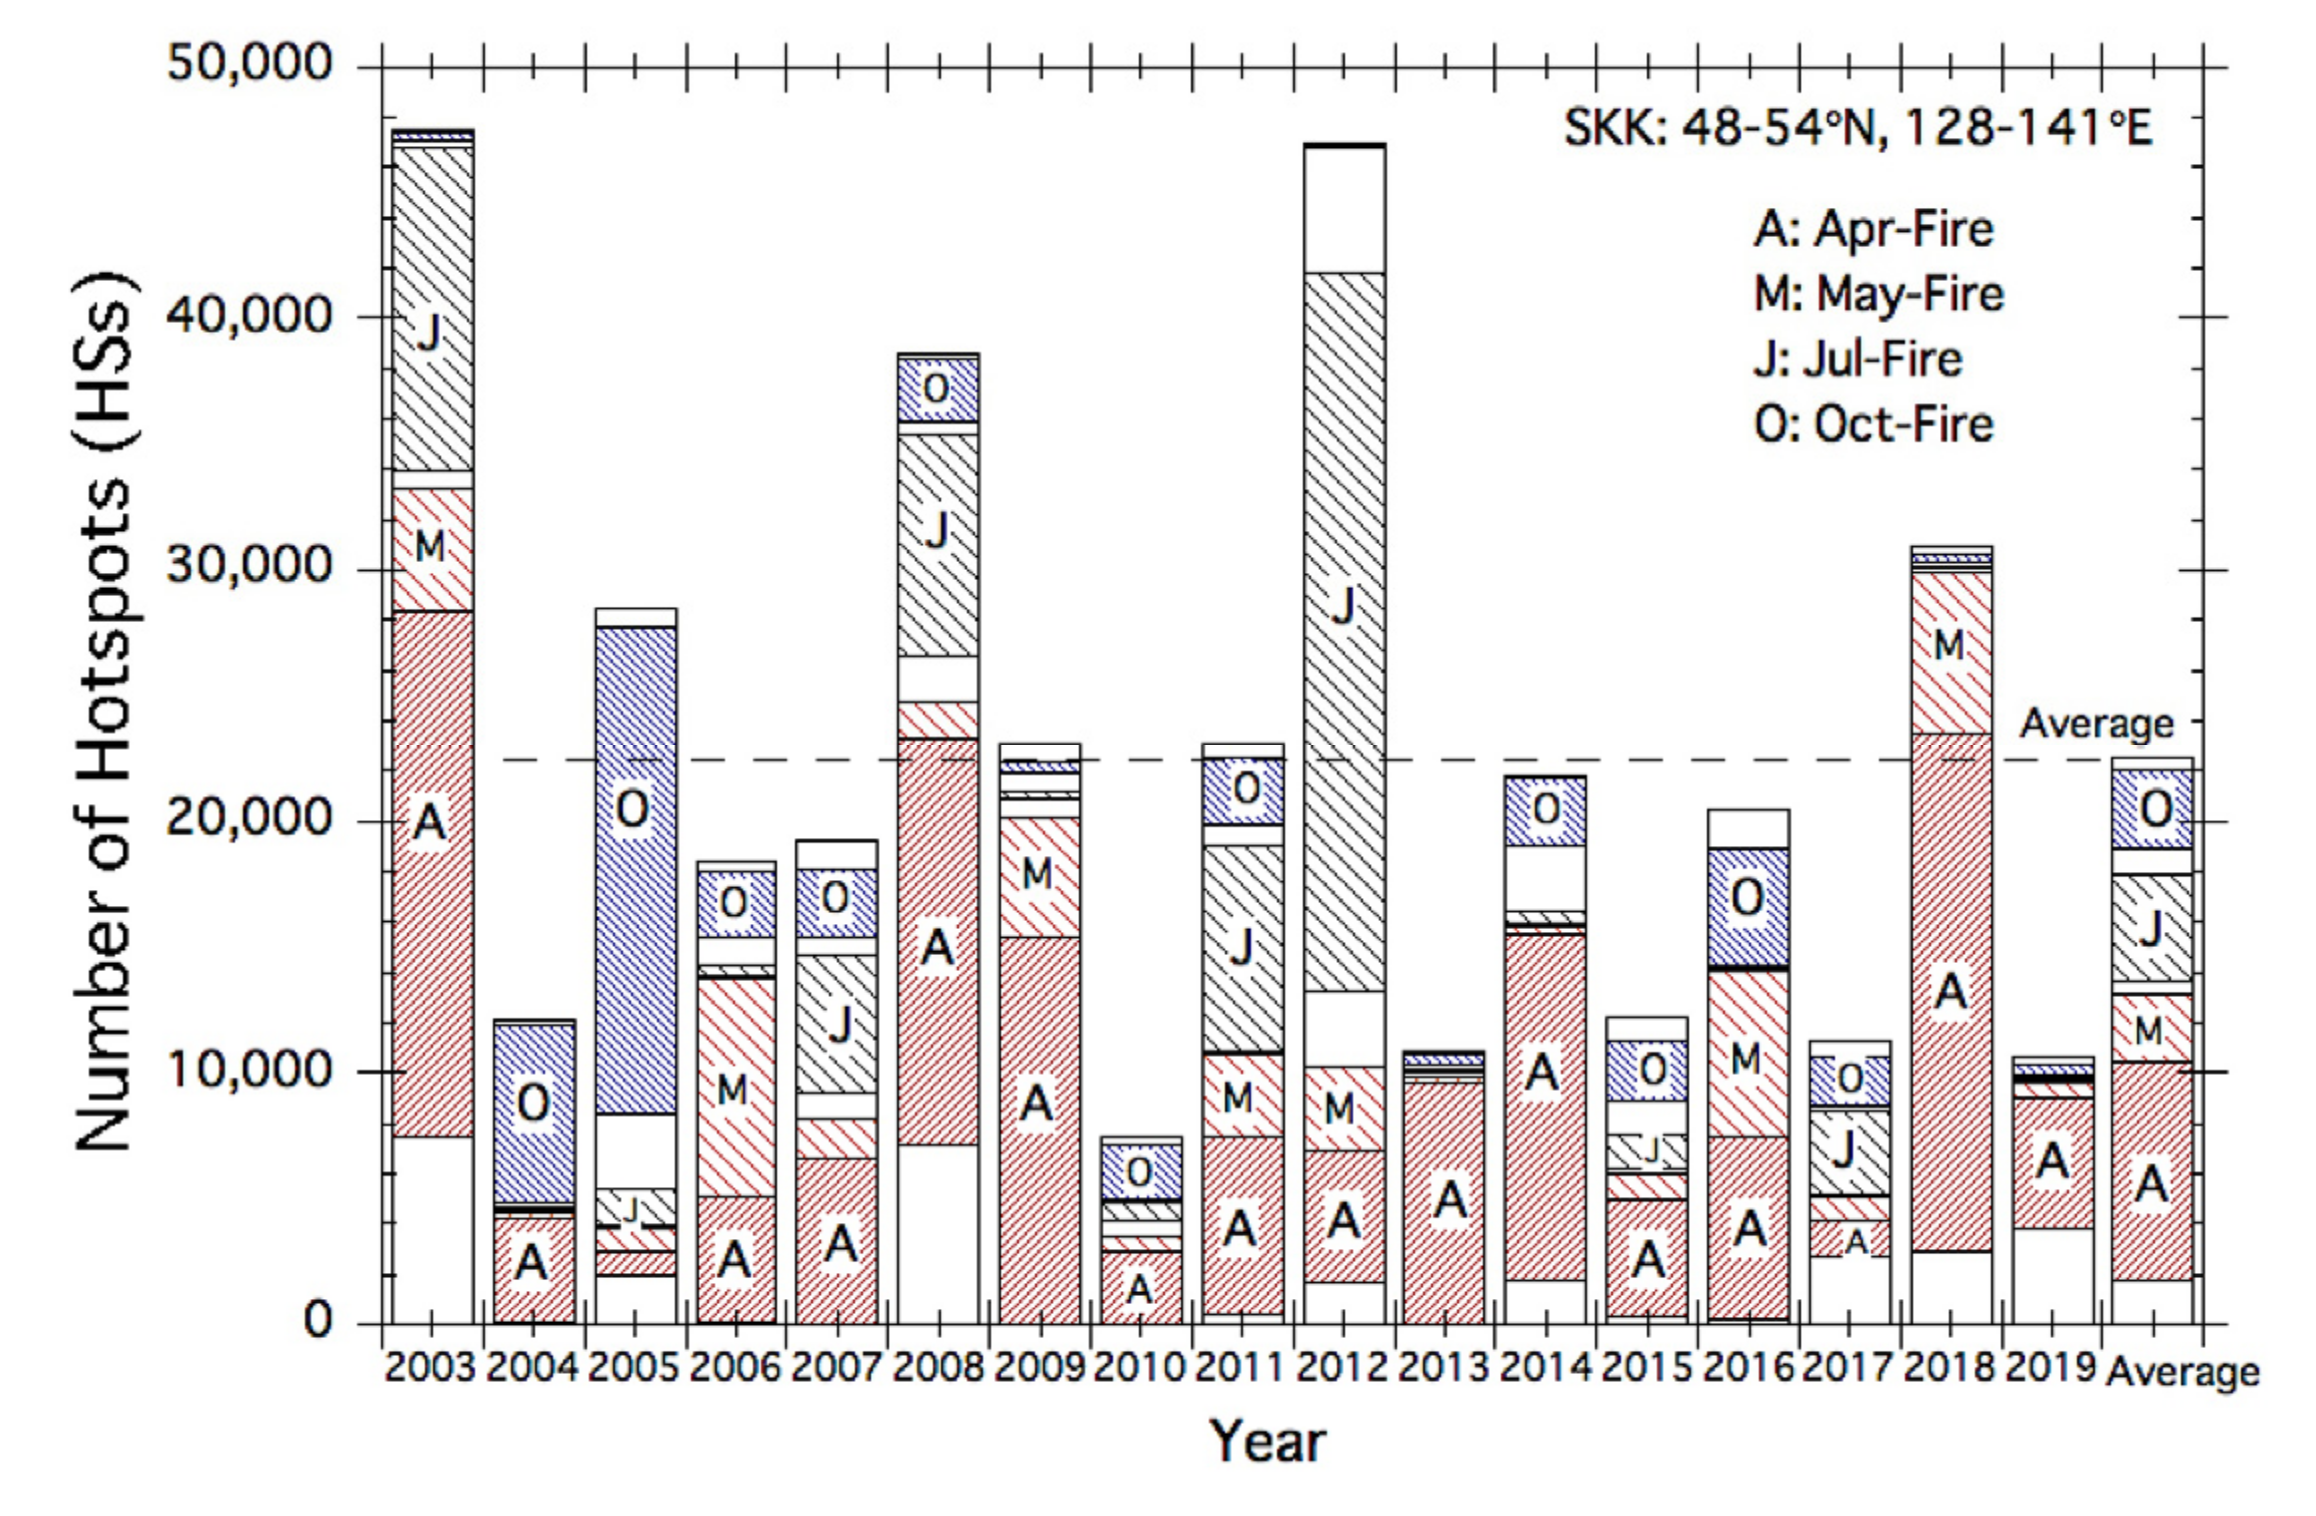
3.3. Recent Fire History

Fire occurrence trends of each year are depicted in Figure 5. In 2003 (the top fire year), the active fires occurred mainly in four active fire-periods (March-Fire, April-Fire, May-Fire, and July-Fire). Similar fire occurrences were found in 2008 (the top third fire year). The active July-Fire in 2012 made 2012 the top second fire year. In 2018 (the top fourth fire year), March-Fire, April-Fire, and May-Fire were active. Thus, 2005 became the top fifth fire year mainly due to the most active October-Fire during the 17 years from 2003.
The total number of HSs in 2003 was the largest and became the top fire year due to three active fire-periods: (4), (6), and (7) in April, May, and July, respectively. The active July-Fire in 2012 made 2012 the top second fire year. A typical autumn fire year was exemplified by 2005, which was the top fifth fire year due to two fire-periods: (2) and (12) in October. One of the weak fire years was 2004, found to be at (10) in October in Figure 3. We saw comparable fire trends in 2004 and 2010 (the weakest fire years; see Figure 3). Their common fire trends were weak fire activity in spring and small numbers of fire occurrences from May to October (see their flat accumulated curves in Figure 3).

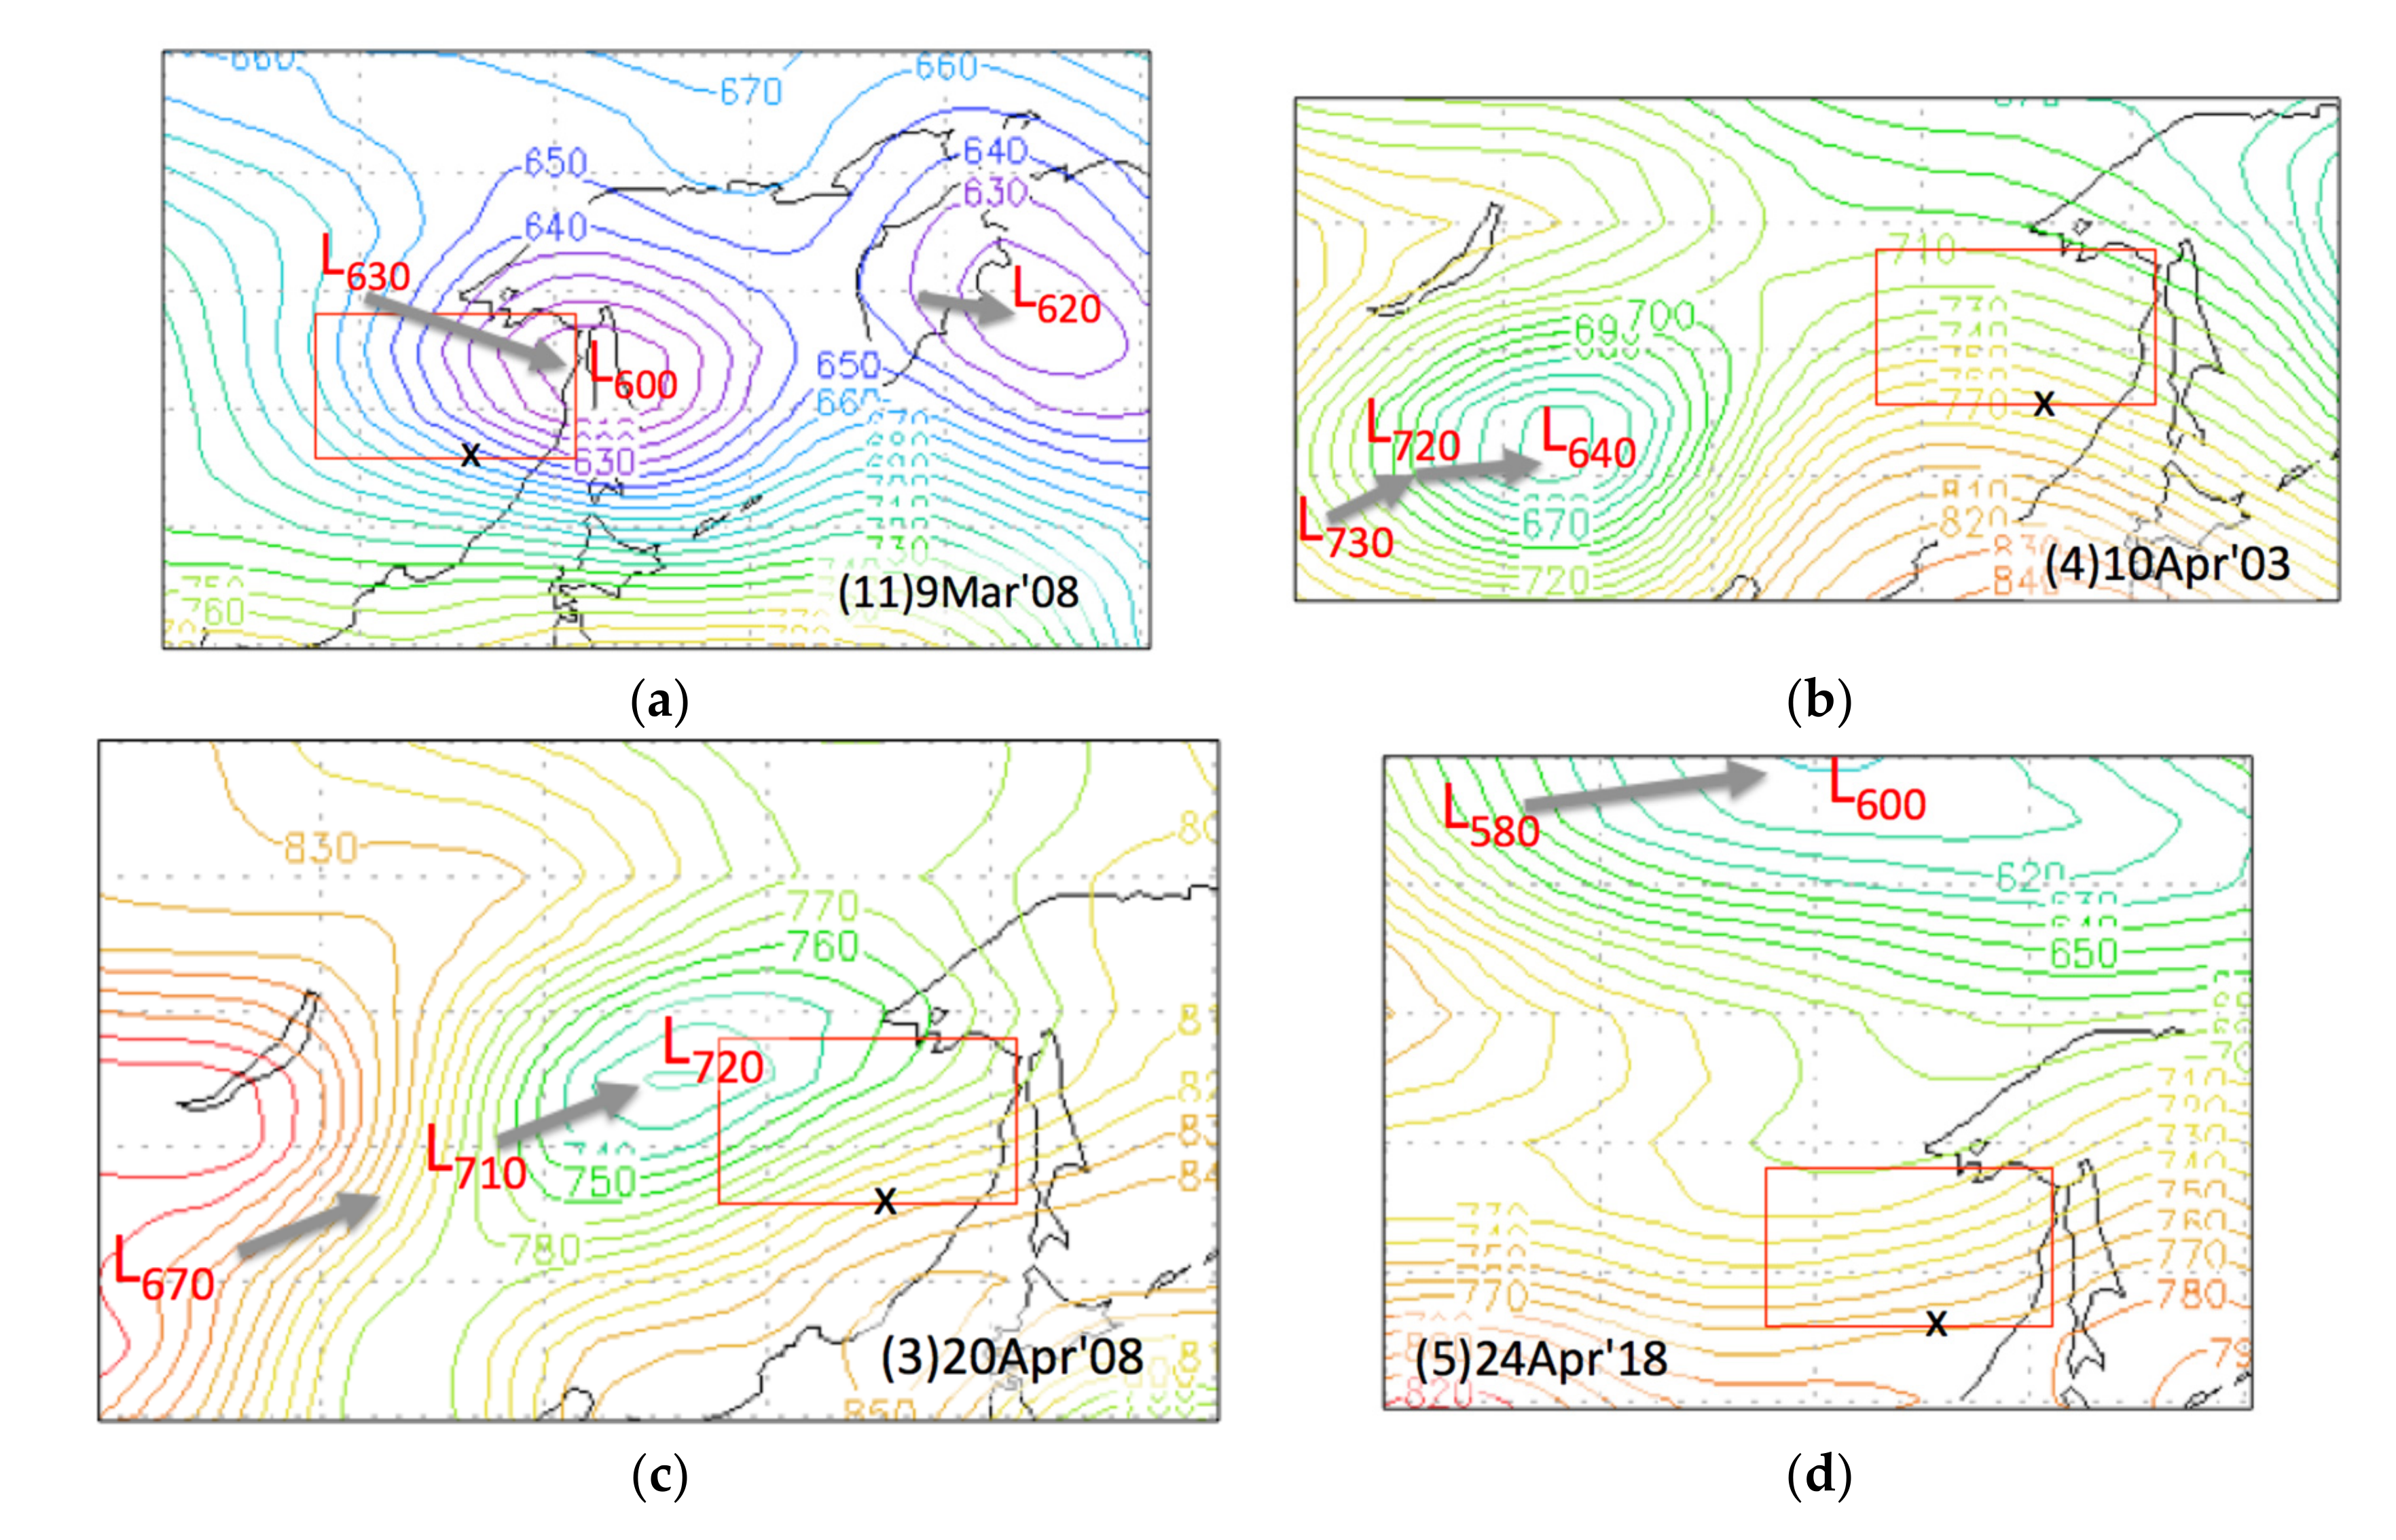
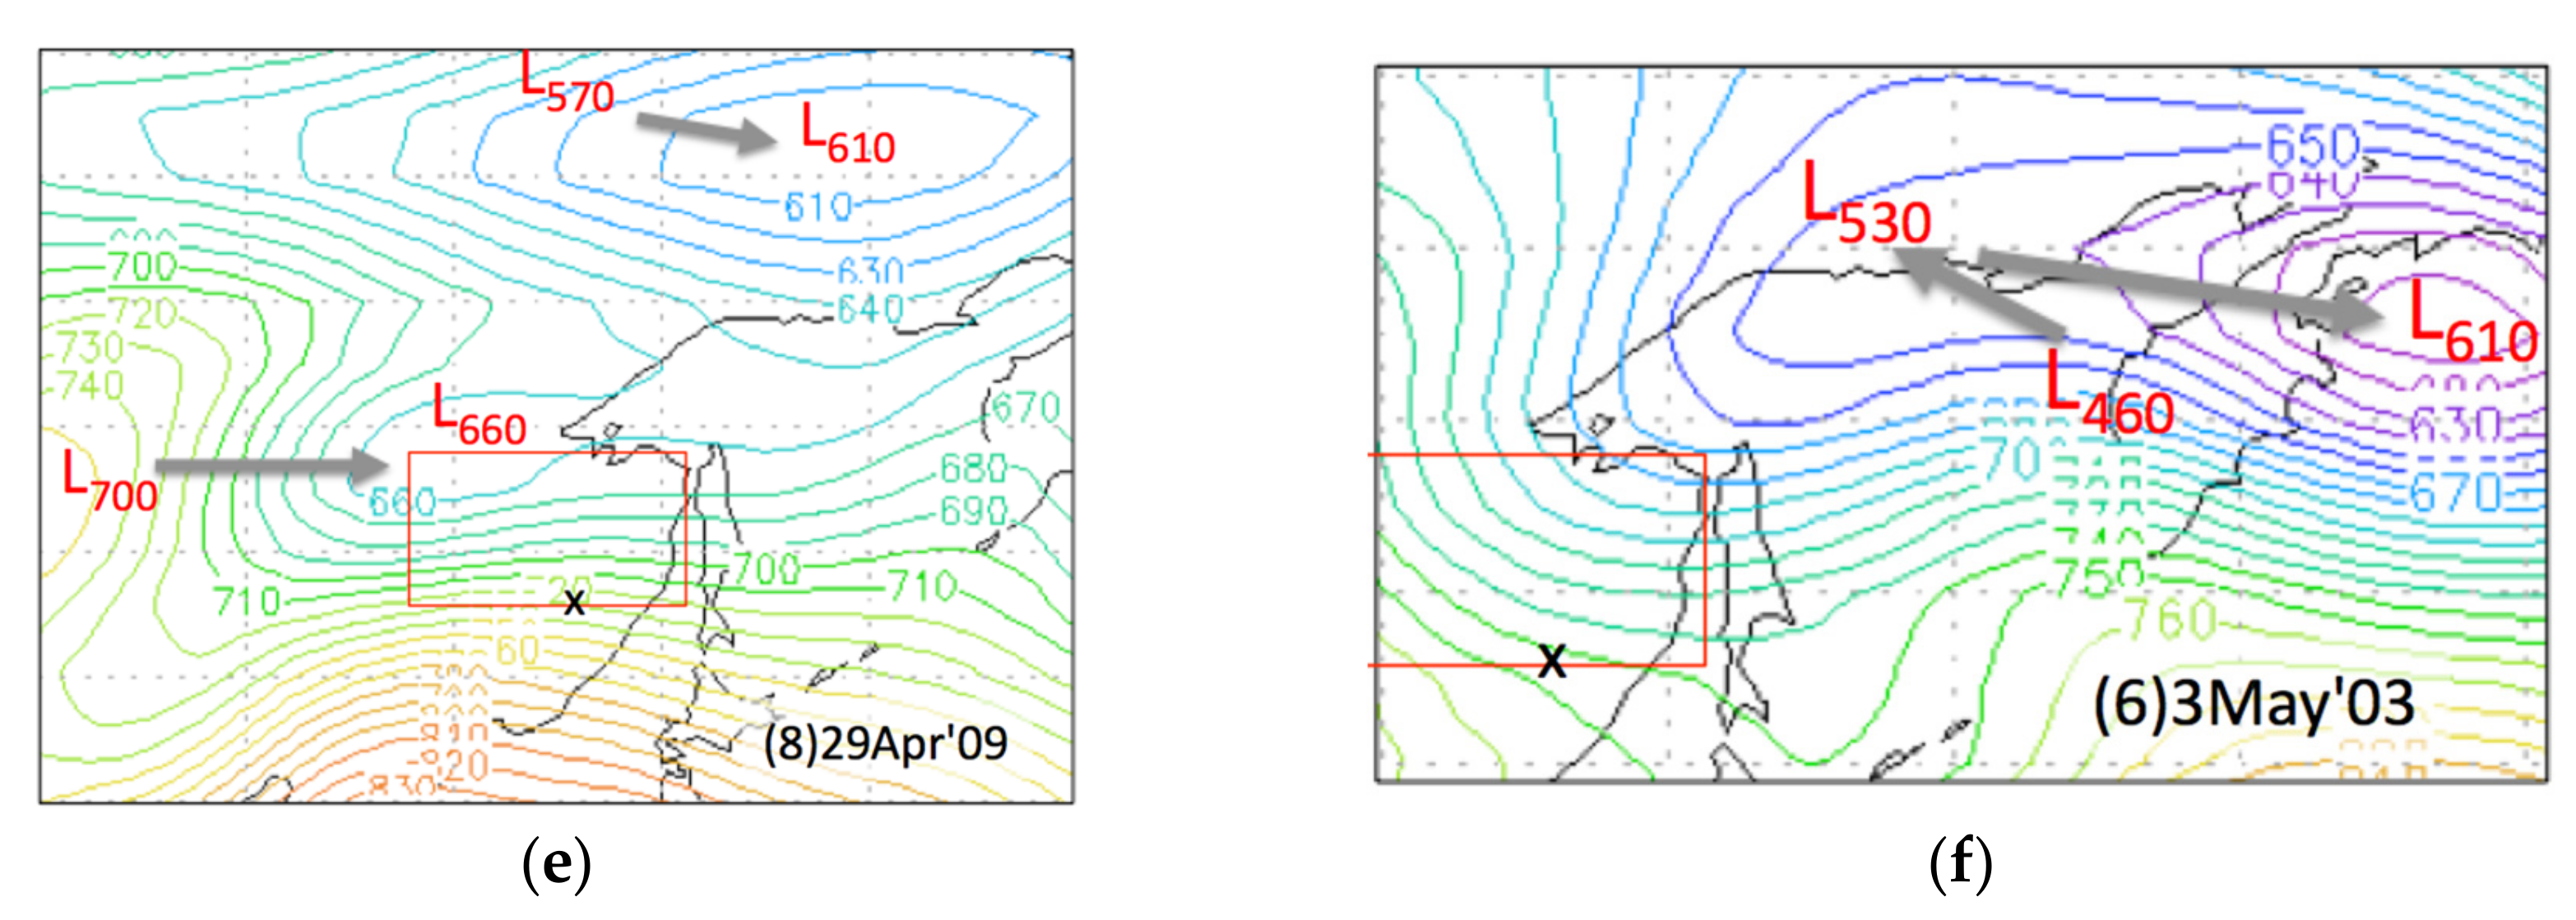
3.4. Weather Charts for Each Peak Hotspot Day

We tried to find common weather conditions for the top 12 active fire-periods. We checked weather charts at the upper-level (500 hPa) and temperature maps at the middle-level (850 hPa). However, we could not find any particular weather conditions at both levels, as we found in our previous papers [16,17,27]. Most wildland fires in northern regions occurred under warm and dry conditions related to warm air masses (cTe). However, most fires in the SKK occur in spring and autumn, suggesting strong winds and dry conditions. According to the statistical weather data obtained from Weather Spark.com (in 2.2 Hotspot (Fire) and Weather Data), the highest average wind speed was 13.9 km h−1, as observed on April 15 and average wind speed in the middle of October was about 13.5 km h−1. Most days in April and October were nearly 100% dry days. In this section, we focus on low-pressure systems that appeared on weather charts at the lower-level (925 hPa), and their wind velocity and direction.

3.4.1. Low-Pressure Systems in April-Fire

To explain April-Fire including March- and May-Fire in the interior southern Khabarovsk region (SKK), the MODIS imagery of Worldview on April 9 (one day before HS peak day of (4)10Apr′03), 2003 is shown in Figure 6. The white colors in Figure 6 are the colors of snow, sea ice, smoke from fire (haze), and clouds. The inland brown color along the Amur River indicates that the snow has disappeared. In contrast, snow still covered the mountain and costal area in the SKK. The different snow conditions in spring can explain the active spring fire occurrence confined to inland of the SKK, as shown in Figure 2a.
The weather charts at the lower-level (925 hPa) in March-, April-, and May-Fire are shown in Figure 7. In Figure 7, ‘X’ indicates the wind reference site (48N, 135E). Movements of low-pressure systems are shown by lines with arrows. The height of a low-pressure system is shown by ‘L’ and its height (e.g., ‘L630’), and the SKK study region is indicated by a rectangle.
From weather charts for six spring fires in Figure 7, we observed various low-pressure systems. Locations of each low-pressure system were classified into four categories: west, east, and north of the SKK, and over the SKK. Two cases of fire, (5)24Apr′18 and (6)3May′03 in Figure 6d,f were related to the trough extending from the low-pressure systems. All low-pressure systems in Figure 6 provided a large height gradient in the SKK, suggesting strong wind conditions. Approximate geostrophic wind direction was estimated from parallel to the isoline of height.

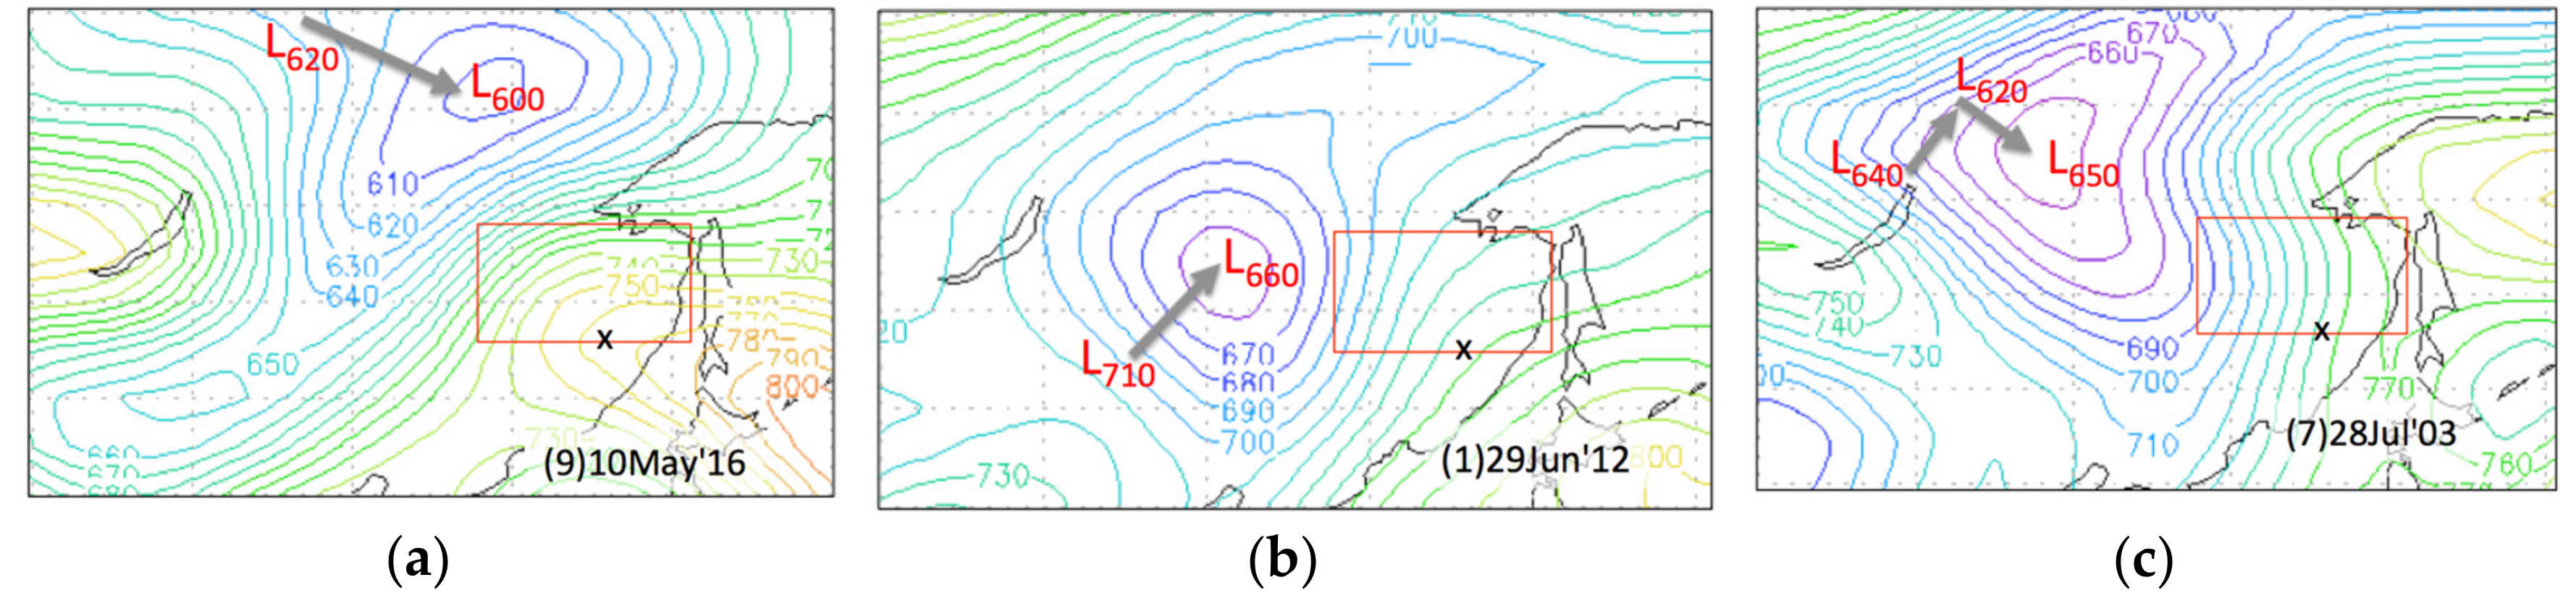
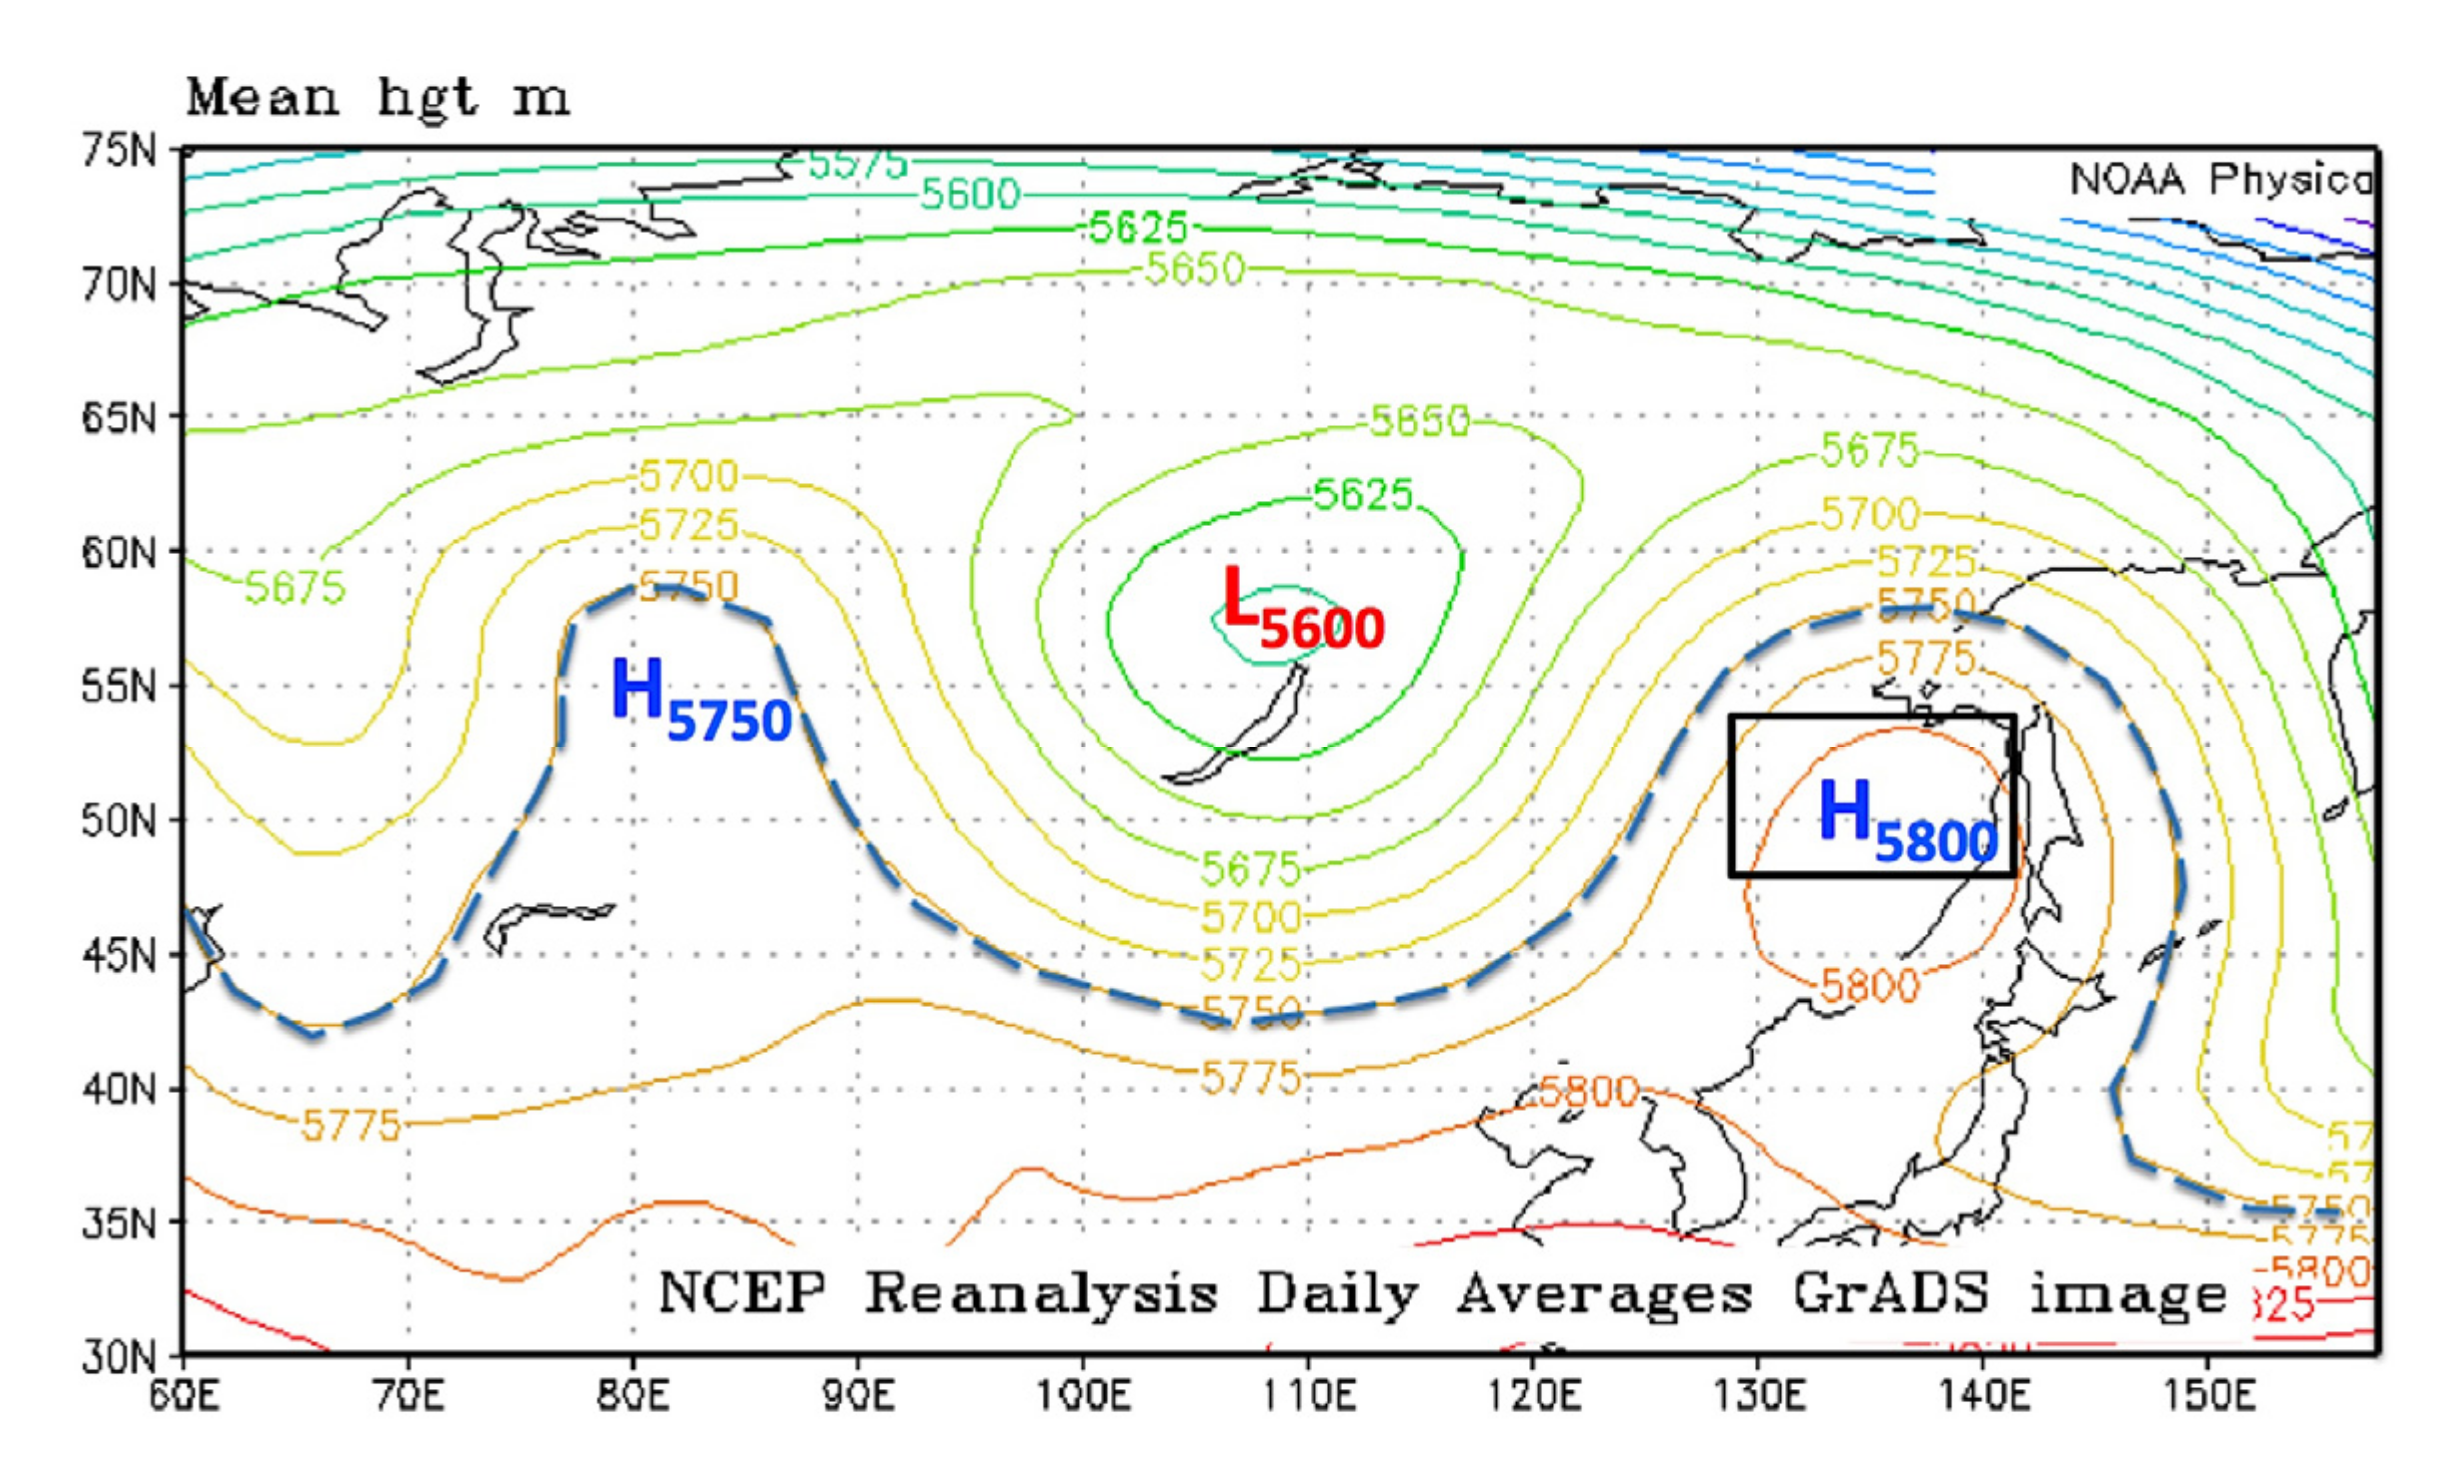
3.4.2. Low-Pressure Systems in May- and July-Fire

The weather charts at the lower-level (925 hPa) in May- and July-Fire are shown in Figure 8. Locations of each low-pressure system were in the west and the northwest of the SKK. The HS peak day of (9)10May′16 in Figure 8a occurred under the ridge from high-pressure systems in the Pacific Ocean, whereas (1)29Jun′12 in Figure 8b occurred under low-pressure systems approaching from the west. The large height gradient in the SKK (7)28Jul′03 in Figure 8c is suggestive of strong wind conditions.

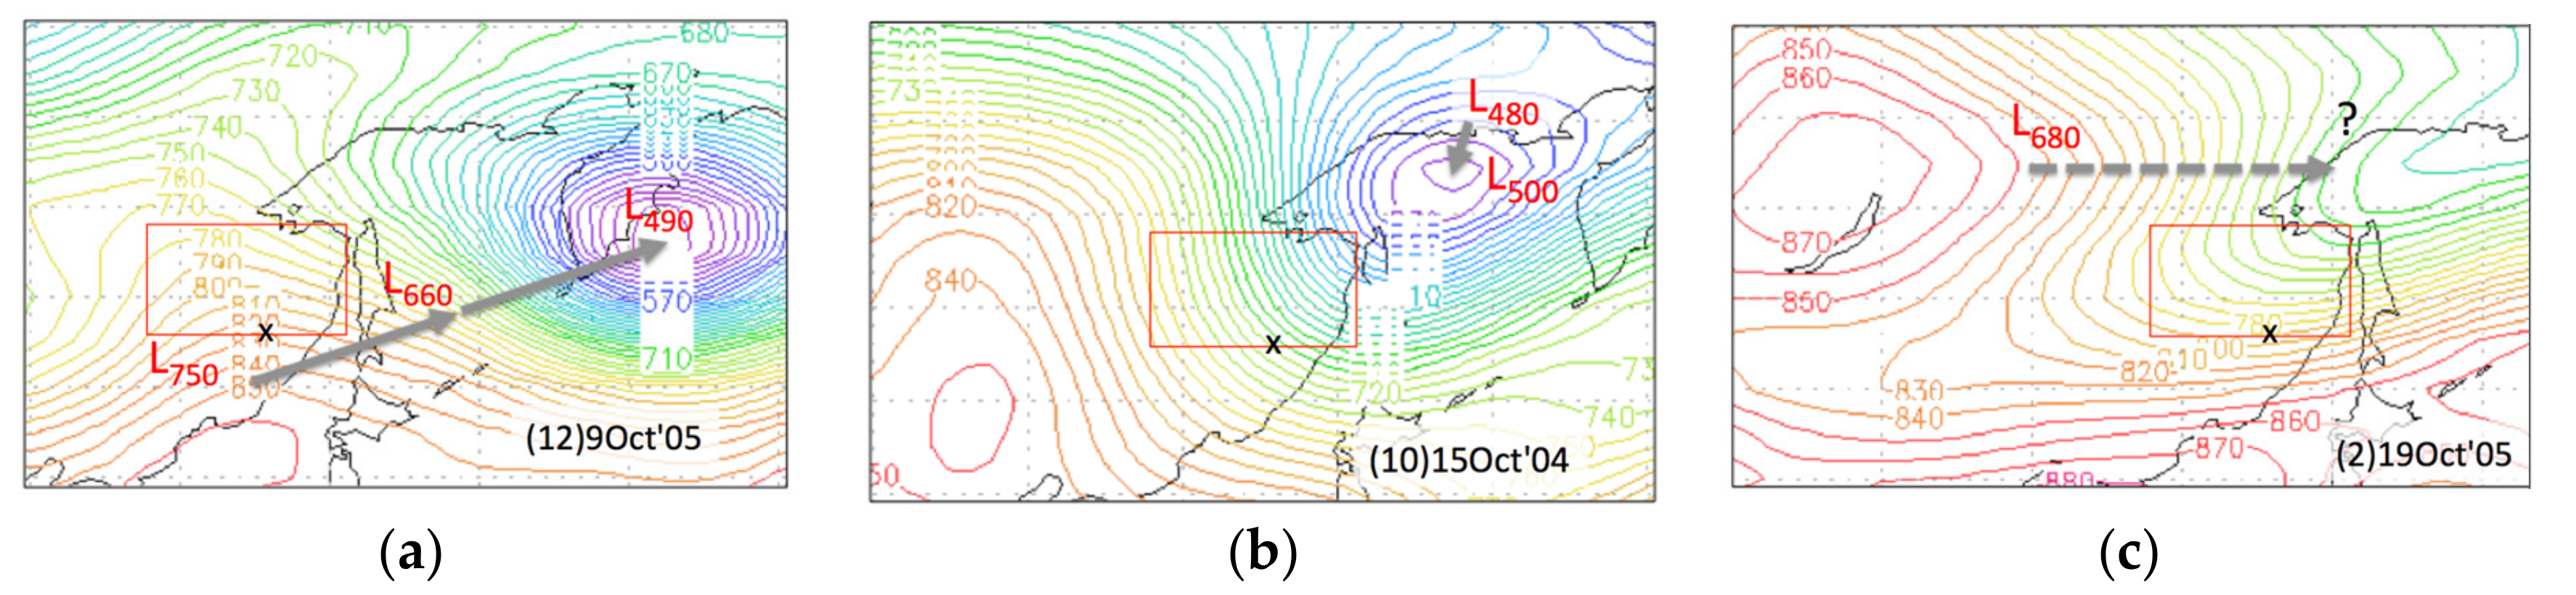
3.4.3. Low-Pressure Systems in October-Fire

The weather charts at the lower-level (925 hPa) in October are shown in Figure 9. The HS peak day of (12)9Oct′05 occurred under the ridge from high-pressure systems in the Sea of Japan and with the rapid development of low-pressure systems (L750 to L490, bomb cyclone). The very large height gradient in the SKK in Figure 9b suggests that (10)15Oct′04 occurred under very strong wind conditions, whereas (2)19Oct′05 in Figure 9c occurred under a trough extending from the Sea of Okhotsk.

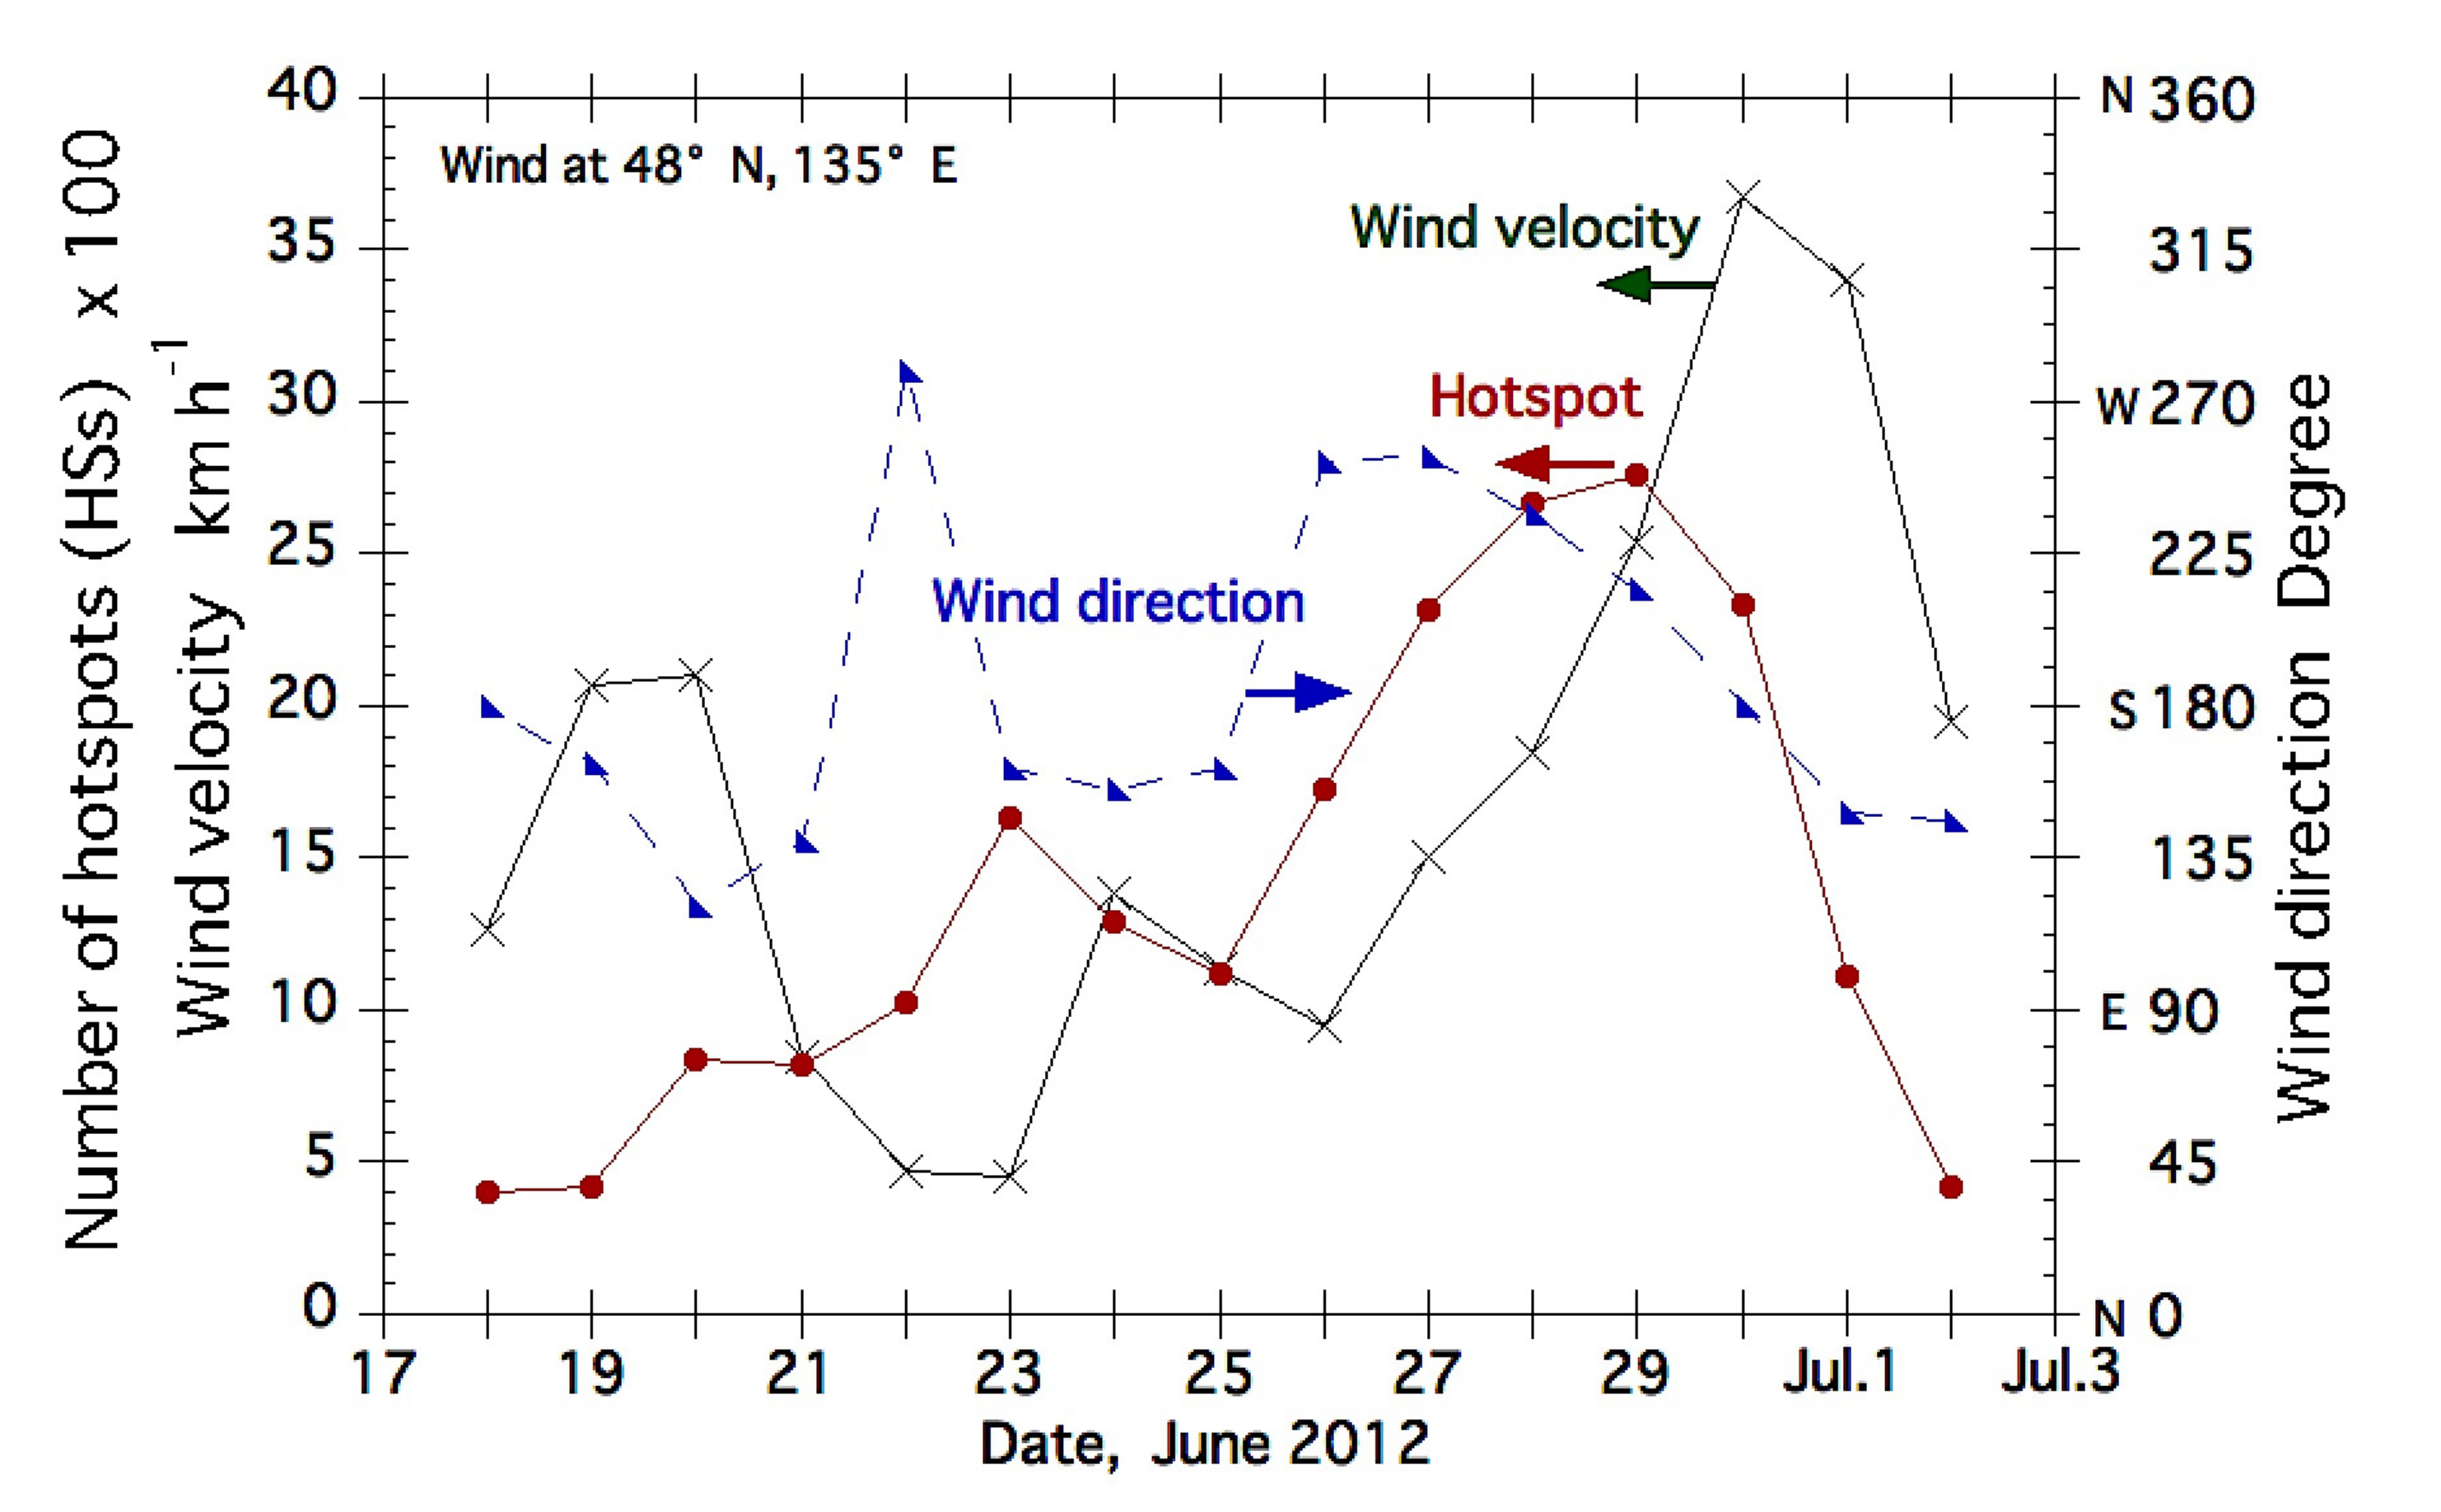
3.4.4. Wind Velocity and Direction

Wind velocity and direction on HS peak days of the top 12 fire-periods are shown in Figure 10. The reference site of the wind was temporarily fixed at 48N, 135E (about 55 km south of Khabarovsk, see Figure 1) to more easily read the U and V values derived from the U and V distribution maps at the lower-level (925 hPa). Wind velocity and direction were calculated using the U and V values.
Figure 10a shows the wind velocity for the top 12 fire-periods. The strongest wind velocity, about 48 km h−1, was observed for the HS maximum day of (2)19Oct′05 (the top second fire-period, October-Fire; see Figure 8c). Fire-periods (8)29Apr′09, (10)15Oct′04, and (11)9Mar′08 followed (2), and their wind velocities exceeded 40 km h−1. Wind velocities of (3), (4), (7), and (12) were more than 30 km h−1. In total, eight out of 12 HS peak days occurred under strong wind velocity conditions of more than 30 km h−1. These wind velocities were very fast compared with the highest averaged wind speed 13.9 km h−1 on April 15 (Weather Spark.com). The high wind velocities on hotspot peak days was one of the main fire characteristics in the SKK.
Wind directions of the top 12 fire-periods are shown in Figure 10b. These wind directions were almost the same as that of the prevailing winds in Khabarovsk. These are southerly winds during the summer (July-Fire-period) and westerly winds otherwise (periods of March-Fire, April-Fire, and October-Fire). This implies that the top 12 fire-periods occurred under strong winds from each seasonal wind direction. Several previous papers have also described active fires under the strong wind [8,10,12,13,14,16,17].

4. Discussion

July-Fire is not a major fire-period in the SKK, as shown in a previous part of this paper (Figure 4). However, the fire-period (1)29Jun’12 was the top fire-period (Table 1) and burnt the northern part of wetlands in the Amur River area (Figure 1, Figure 2a and Figure 6). This very strong fire-period ((1) 29Jun′12) could be described as an extreme fire event under climate change [13,19,20,21]. To protect the wetland in the SSK from fires, we applied the same analysis approach proposed by our group [16,17,27]. We examined the relationship between active fires (hotspots) and warm and dry air masses, and related weather conditions by analyzing weather charts, and temperature maps and wind maps during the active fire-period of (1)29Jun’12.

4.1. Active Fire-Period

Daily HSs for 2012 are plotted in Figure 11, where the active fire-period was from 18 June to 2 July . The number of HSs increased from 399 on 18 June (289 on 17 June) and exceeded 2000 on 27 June. The number of HSs reached a maximum of 2758 on 29 June. A rapid sevenfold increase of HSs occurred over 11 days. Due to rapid growth over 13 days from 18 June and a very steep HS rate, about 1500 HS day−1 was reached.

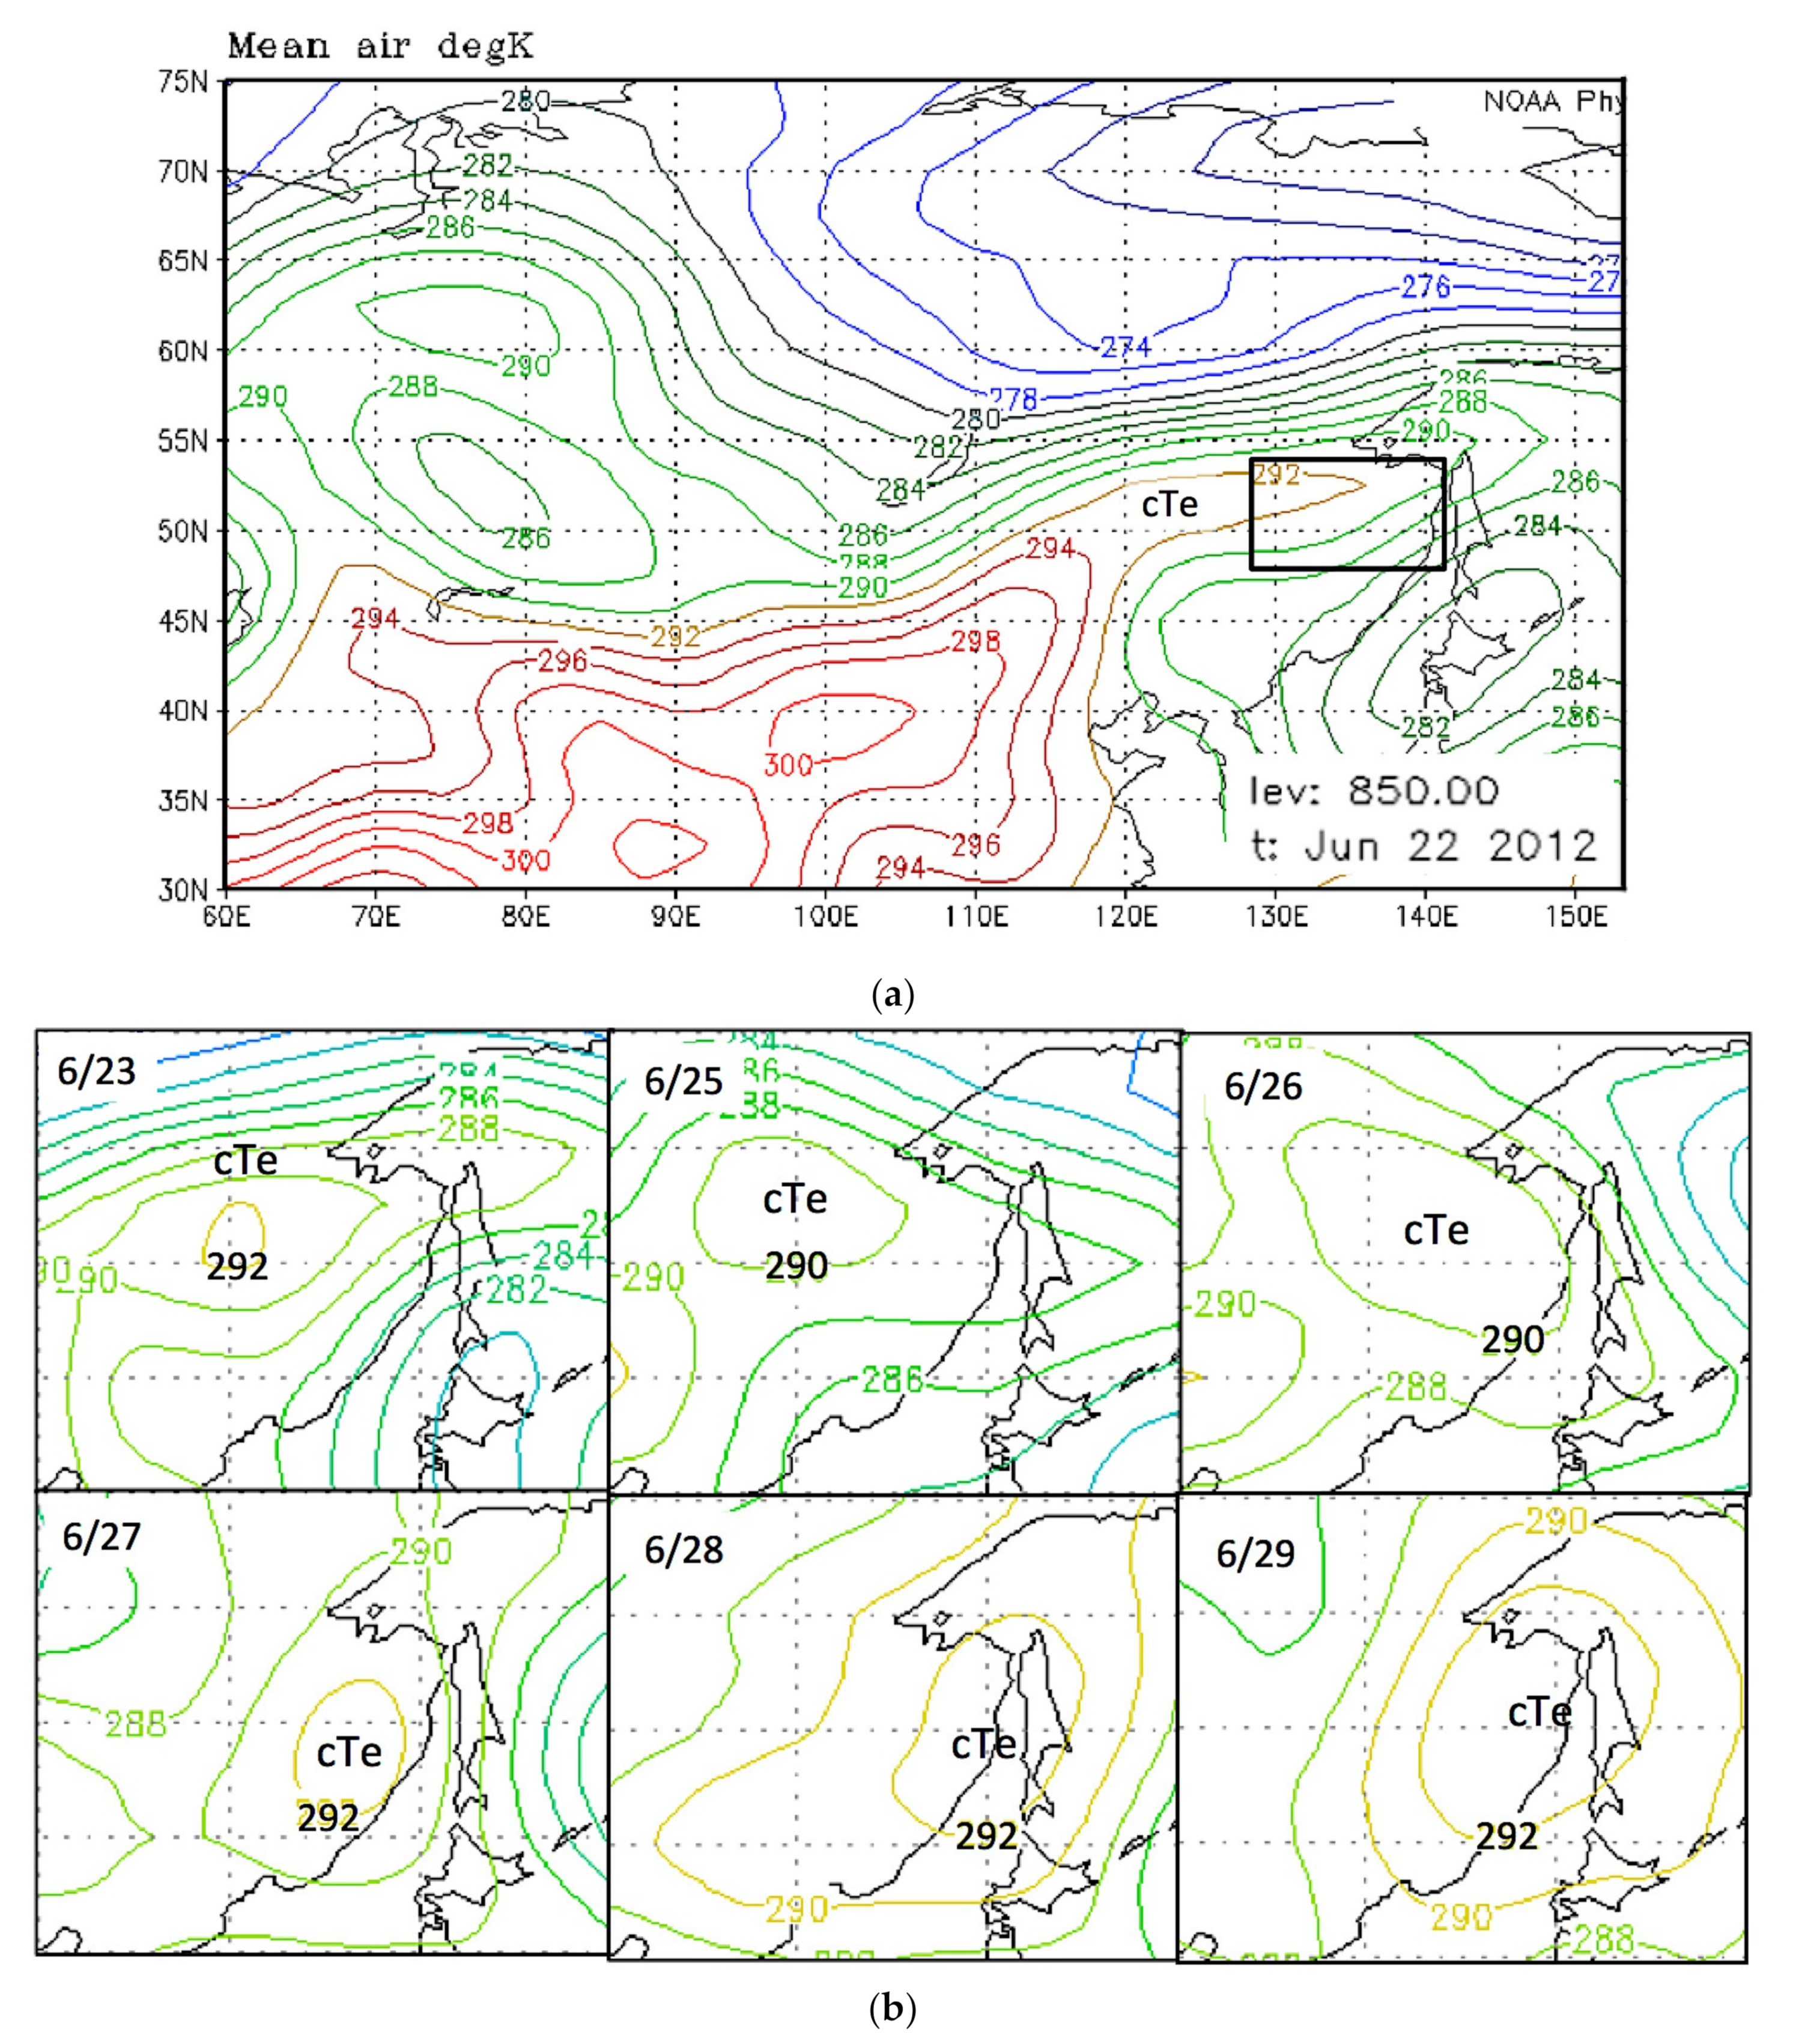
4.2. Warm Air Masses

Temperature maps at the middle-level (850 hPa) during the June fire-period of ((1)29Jun’12) are shown in Figure 12. Temperature map on June 22 in Figure 12a shows a ridge formation from around 40°N, 110°E to near the west side of the SKK (53°N, 135°E). On 23 June, a detached warm air mass (cTe = 292 K) had formed east of the lower Amur River (50 N 130 E). Warm air mass (cTe = 290 K) covered most of the SKK on June 26, and the temperature of cTe rose to 292 K on 27 June. From June 28, the warm air mass (cTe) became large and the temperature of cTe rose to 294 K on 30 June (not shown here). Figure 11 and Figure 12 show that active fires occurred under the existence of cTe. cTe will be one of the important fire indicators in the SKK, as in other regions [6,11,12].
Active fires in Sakha and Alaska at a higher latitude of about 63°N also occurred under warm air masses (cTe). We have already reported their relation (cTe and fires) in our previous paper [6,11,12]. From Figure 12, we can say that fires in the SKK at middle latitude (about 50°N) also became active under a warm air mass (cTe).

4.3. High-Pressure Systems

An average weather chart for the upper-level (500 hPa) during the June fire-period in 2012 is shown in Figure 13 and highlights the stagnant and persistent weather conditions. In Figure 13, each major high- and low-pressure system is marked with a ‘H’ and ‘L,’ respectively, and their average heights are indicated by the closest isoline. The dotted blue line was thickened to evaluate westerly meandering.
From average weather charts from 24 to 29 June in Figure 13, we can see that a large westerly meandered over Sakha due to a cutoff low (L5620 at 52°N, 108°E) from the Arctic, and a high-pressure system (H5800 at 48°N, 136°E) formed on 23 June (not shown here). The next day, a low-pressure system (L5600) formed over Lake Baikal and stagnated until 29 June. Large westerly meandering conditions due to the stagnated low-pressure system over Lake Baikal and large meandering conditions (a dotted blue line in Figure 13) promoted a warm air mass (cTe) to move from the southwest to the SKK (Figure 12a). Downward air flow from a high-pressure system over SKK (L5800) during the June active fire-period brought warm and dry conditions to the lower-level or surface-level [13].

4.4. Wind Conditions and Fire Activity

Wind velocity and wind direction at the lower-level (925 hPa) and fire activities during the top fire-period, (1)29Jun’12, are shown in Figure 14. The first fire (hotspot) peak on 23 June occurred when a warm air mass (cTe) arrived east of SKK (Figure 12b). From around 24 June, wind velocity increased from about 10 to 36 km h–1; then, the number of HSs increased from about 1000 to 2758 from 25 June to 29 June. This shows that fires were active mainly due to the strong wind conditions. From 26 June, the wind direction changed from west to south. This wind direction change is related to the movement of low-pressure systems (Figure 8b).

4.5. Fire Forecast

In this chapter, we showed the relationship between active fires (hotspots) and warm air mass (cTe), and related weather conditions during the top active fire-period ((1)29Jun’12). Fires became very active as cTe from the south approached the SKK region. Movement of cTe was mainly related to the meandering of large westerlies. These types of active fires occurred in the southern Sakha (SS), the northern Krasnoyarsk (NK), and Alaska. We have already reported a total of twelve active fire-periods, six in SS, five in Alaska, and one in NK [16,17]. All of them occurred related to cTe. As movements of cTe can be easily visualized by making a daily temperature map, we could forecast active fires just before a few days with high probability. We hope that Russian and Chinese fire managers would greatly benefit from fire weather predictions a few days in advance, and particularly in the reliable prediction of extreme fires based on the analytical results.

5. Conclusions

Comprehensive analysis using MODIS hotspot (HS) and fire weather data for the southern Khabarovsk Krai (SKK) was carried out with the aim of reducing active fires in the SKK. First, we analyzed MODIS daily hotspot (HS) data spanning 17 years from 2003 to 2019 and clearly showed four active fire months in the SKK. Second, the fire weather conditions during the top 12 active fire-periods were examined using weather and temperature charts as well as wind velocity maps. These analytical results permit the following conclusions:
  • Wildland fires in the SKK can be categorized into four major fire-periods in April, May, July, and October using their different fire rates of about 258, 104, 92, and 133 HS day−1, respectively.
  • Common fire weather conditions were not found in the top 12 active fire-periods. However, we showed that most hotspot peak days occurred under the fast wind velocity (>30 km h−1) related to low-pressure systems. As wind speed gradually increases from a few days before the HS peak day, accurate weather forecast could issue a high wind warning. This advance warning will lead to the prevention of active fire occurrence under strong winds.
  • For any future summer (July) fires like (1)29Jun’12, fire forecasts will be possible with the help of a temperature map to monitor the movement of a warm air mass, cTe. There are signs that warm air masses (cTe) move from the southwest. In addition, cTe will take a few days to reach the SKK.

Author Contributions

Conceptualization, H.H., G.V.S., A.O., and D.N.; Methodology, H.H.; Software, H.H.; Validation, H.H.; Formal analysis, H.H.; Investigation, H.H., G.V.S., and A.O.; Resources, H.H. and G.V.S.; Data curation, H.H., G.V.S., and A.O.; Writing—original draft preparation, H.H. and G.V.S.; Writing—review and editing, H.H.; Visualization, H.H. and G.V.S.; Supervision, D.N.; Project administration, D.N.; Funding acquisition, D.N. All authors have read and agreed to the published version of the manuscript.

Funding

This research received no external funding.

Acknowledgments

This research was partially supported by the Center for International Forestry Research (CIFOR) with funding from the Japanese government. We used reanalysis data provided by the NOAA/OAR/ESRL PSL, Boulder, Colorado, USA, from their website at https://psl.noaa.gov/.

Conflicts of Interest

The authors declare no conflict of interest.

References

  1. Dobricic, S.; Pozzoli, L. Arctic Permafrost Thawing; EUR 29940 EN; Publications Office of the European Union: Luxembourg, 2019. [Google Scholar] [CrossRef]
  2. Jobbagy, E.G.; Jackson, R.B. The vertical distribution of soil organic carbon and its relation to climate and vegetation. Ecol. Appl. 2000, 10, 423–436. [Google Scholar] [CrossRef]
  3. Schuur, E.A.G.; McGuire, A.D.; Schädel, C.; Grosse, G.; Harden, J.W.; Hayes, D.J.; Hugelius, G.; Koven, C.D.; Kuhry, P.; Lawrence, D.M.; et al. Climate change and the permafrost carbon feedback. Nature 2015, 520, 171–179. [Google Scholar] [CrossRef] [PubMed]
  4. Jeong, S.J.; Bloom, A.A.; Schimel, D.; Sweeney, C.; Parazoo, N.C.; Medvigy, D.; Schaepman-Strub, G.; Zheng, C.; Schwalm, C.R.; Huntzinger, D.N.; et al. Accelerating rates of Arctic carbon cycling revealed by long-term atmospheric CO2 measurements. Sci. Adv. 2018, 4, 7. [Google Scholar] [CrossRef] [Green Version]
  5. Van der Werf, G.R.; Randerson, J.T.; Giglio, L.; van Leeuwen, T.T.; Chen, Y.; Rogers, B.M.; Mu, M.; Van Marle, M.J.E.; Morton, D.C.; Collatz, G.J.; et al. Global fire emissions estimates during 1997–2016. Earth Syst. Sci. 2017, 9, 679–720. [Google Scholar] [CrossRef] [Green Version]
  6. Harden, J.W.; Manies, K.L.; Turetsky, M.R.; Neff, J.C. Effects of wildfire and permafrost on soil organic matter and soil climate in interior Alaska. Glob Chang Biol. 2006, 12, 2391–2403. [Google Scholar] [CrossRef]
  7. Myers-Smith, H.; Harden, J.W.; Wilmking, M.; Fuller, C.C.; McGuire, A.D.; Chapin, F.S., III. Wetland succession in a permafrost collapse: interactions between fire and thermokarst. Biogeosciences 2008, 5, 1273–1286. [Google Scholar] [CrossRef] [Green Version]
  8. Kim, J.S.; Kug, J.S.; Jeong, S.J.; Park, H.; Schaepman-Strub, G. Extensive fires in southeastern Siberian permafrost linked to preceding Arctic Oscillation. Sci. Adv. 2020, 6, 3308. [Google Scholar] [CrossRef] [PubMed] [Green Version]
  9. Randerson, J.T.; Chen, Y.; van der Werf, G.R.; Rogers, B.M.; Morton, D.C. Global burned area and biomass burning emissions from small fires. J. Geophys. Res. 2012, 117, G04012. [Google Scholar] [CrossRef]
  10. Warneke, C.; Bahreini, R.; Brioude, J.; Brock, C.A.; de Gouw, J.A.; Fahey, D.W.; Froyd, K.D.; Holloway, J.S.; Middlebrook, A.; Miller, L.; et al. Biomass burning in Siberia and Kazakhstan as an important source for haze over the Alaskan Arctic in April 2008. Earth Syst. Sci. 2009, 36, L02813. [Google Scholar] [CrossRef] [Green Version]
  11. Hayasaka, H. Recent Vegetation Fire Incidence in Russia. Glob. Environ. Res. 2011, 15, 5–13. [Google Scholar]
  12. Cahoon, D.R.; Levine, J.S.; Cofer, W.R., III; Minnis, P.; Miller, J.E.; Tennille, G.M.; Yip, T.W.; Heck, P.W.; Stocks, B.J. The great Chinese fire of 1987: A view from space. In Proceedings of the Global Biomass Burning: Atmospheric, Climatic, and Biospheric Implications, Williamsburg, VA, USA, 19–23 March 1991; pp. 61–66. [Google Scholar]
  13. Stocks, B.J.; Wotton, B.M.; Flannigan, M.D.; Fosberg, M.A.; Cahoon, D.R.; Goldammer, J.G. Boreal forest fire regimes and climate change. In Remote Sensing and Climate Modeling: Synergies and Limitations; Beniston, M., Verstraete, M.M., Eds.; Springer: Dordrecht, The Netherlands, 2001. [Google Scholar]
  14. Huang, S.; Siegert, F.; Goldammer, J.G.; Sukhinin, A.I. Satellite-derived 2003 wildfires in southern Siberia and their potential influence on carbon sequestration. Int. J. Remote Sens. 2009, 30, 1479–1492. [Google Scholar] [CrossRef]
  15. Mollicone, D.; Eva, H.D.; Achard, F. Human role in Russian wild fires. Nature 2006, 440, 436–437. [Google Scholar] [CrossRef] [PubMed]
  16. Hayasaka, H.; Yamazaki, K.; Naito, D. Weather conditions and warm air masses in Southern Sakha during active forest fire periods. J. Disaster Res. 2019, 14, 641–648. [Google Scholar] [CrossRef]
  17. Hayasaka, H.; Yamazaki, K.; Naito, D. Weather conditions and warm air masses during active fire-periods in boreal forests. Polar Sci. 2019, 22, 1–8. [Google Scholar] [CrossRef]
  18. LandsatLook Viewer. Available online: https://landlook.usgs.gov/landlook/viewer.html (accessed on 27 August 2020).
  19. Torzhkov, I.O.; Kushnir, E.A.; Konstantinov, A.V.; Koroleva, T.S.; Efimov, S.V.; Shkolnik, I.M. Assessment of future climate change impacts on forestry in Russia. Russ. Meteorol. Hydrol. 2019, 44, 180–186. [Google Scholar] [CrossRef]
  20. Mokhov, I.I.; Semenov, V.A. Weather and Climate Anomalies in Russian Regions Related to Global Climate Change. Russ. Meteorol. Hydrol. 2016, 41, 84–92. [Google Scholar] [CrossRef]
  21. Seneviratne, S.I.; Nicholls, N.; Easterling, D.; Goodess, C.M.; Kanae, S.; Kossin, J.; Luo, Y.; Marengov, J.; McInnes, K.; Rahimi, M.; et al. Changes in climate extremes and their impacts on the natural physical environment. In Changes in Climate Extremes and Their Impacts on The Natural Physical Environment; Field, C.B., Barros, V., Stocker, T.F., Qin, D., Dokken, D.J., Ebi, K.L., Mastrandrea, M.D., Mach, K.J., Plattner, G.-K., Allen, S.K., et al., Eds.; Cambridge University Press: Cambridge, UK, 2012; pp. 109–230. [Google Scholar]
  22. Sokolova, G.V.; Verkhoturov, A.L.; Korolev, S.P. Impact of deforestation on stream flow in the Amur River basin. Geosciences 2019, 6, 262. [Google Scholar] [CrossRef] [Green Version]
  23. Russia Vegetation Map. Available online: https://www.researchgate.net/publication/272680068_Russia%27s_Forests_Dominating_Forest_Types_and_Their_Canopy_Density (accessed on 27 August 2020).
  24. Simonov, E. One river, three countries (Amur Basin). In Conservation Investment Strategy for the Russian Far East; Sparling, E., Ed.; Pacific Environment: San Francisco, CA, USA, 2014. [Google Scholar]
  25. Olson, D.M.; Dinerstein, E. The Global 200: Priority ecoregions for global conservation. Ann. Mo. Bot. Gard. 2002, 89, 199–224. [Google Scholar] [CrossRef]
  26. NASA Fire Information for Resource Management System, FIRMS; MODIS Collection 6. Available online: https://firms.modaps.eosdis.nasa.gov/download/ (accessed on 20 April 2019).
  27. Hayasaka, H.; Usup, A.; Naito, D. New approach evaluating peatland fires in Indonesian factors. Remote Sens. 2020, 12, 2055. [Google Scholar] [CrossRef]
  28. Worldview Satellite image (Corrected Reflectance (true color), MODIS on Terra). Available online: https://worldview.earthdata.nasa.gov/ (accessed on 29 August 2020).
  29. National Center for Environmental Prediction (NCEP)/National Center for Atmospheric Research (NCAR) Reanalysis 1: Pressure. Available online: https://psl.noaa.gov/data/gridded/data.ncep.reanalysis.pressure.html (accessed on 20 April 2019).
  30. Weather Spark. Available online: https://weatherspark.com/y/143457/Average-Weather-in-Khabarovsk-Russia-Year-Round (accessed on 15 July 2020).
Figure 1. Map of the study region and other reference study regions in eastern Siberia and Khabarovsk Krai (SKK) [8,16,17]. The study region (48–54°N, 128–141°E, shown by the red rectangle) in the southern Khabarovsk Krai (SKK). Southeastern Russia (45°–55°N, 100°–150°E) is shown by the blue rectangle [8]; the southern Sakha (58°–65°N, 120°–140°E) is shown by thee orange rectangle [16,17]; the northern K (60°–66°N, 92°–106°E) is shown by the grey rectangle [17]; hotspots from March to June 2003 are shown by red dots; ‘X’: the wind reference site (48°N, 135°E); Amur: the Amur River is shown by blue line; the Greater Khingan Range is shown by the light yellow dotted line; Base map from LandsatLook Viewer website [18].
Remotesensing 12 03204 g001
Figure 2. The study region and vegetation map in the southern Khabarovsk Krai (SKK). (a) The study region (48–54°N, 128–141°E) in SKK.; (b) Vegetation map of SKK region [23].
Remotesensing 12 03204 g002
Figure 3. Accumulated number of hotspots (HSs) for nine years.
Remotesensing 12 03204 g003
Figure 4. The 17-year average fire tendency in thee SKK.
Remotesensing 12 03204 g004
Figure 5. Recent fire history from 2003 to 2019 in the southern Khabarovsk Krai (SKK).
Remotesensing 12 03204 g005
Figure 6. Satellite image (corrected reflectance (true color), MODIS on Terra, Sea Surface Temperature (L4, MUR), red dots; hotspots, blue dots; settlements) on April 9, 2003 (one day during (4)10Apr′03) [28].
Remotesensing 12 03204 g006
Figure 7. Low-pressure systems associated with March-Fire and April-Fire. (a) (11)9Mar′08; (b) (4)10Apr′03; (c) (3)20Apr′08; (d) (5)24Apr′18; (e) (8)29Apr′09; and (f) (6)3May′03.
Remotesensing 12 03204 g007aRemotesensing 12 03204 g007b
Figure 8. Low-pressure systems associated with July-Fire. (a) (9)10May′16; (b) (1)29Jun′12; (c) (7)28Jul′03.
Remotesensing 12 03204 g008
Figure 9. Low-pressure systems associated with October-Fire. (a) (12)9Oct′05; (b) (10)15Oct′04; (c) (2)19Oct′05.
Remotesensing 12 03204 g009
Figure 10. Wind conditions at the lower-level (925 hPa) for the top 12 active fire-periods. (a) Wind velocity; (b) Wind direction.
Remotesensing 12 03204 g010
Figure 11. Fire activity in 2012 in the SKK.
Remotesensing 12 03204 g011
Figure 12. Temperature maps at the middle level (850 hPa) during the (1) 29 Jun’12 fire-period (maximum number of daily HSs on 29 June was 2758). (a) Temperature ridge formation from the middle latitude (about 40°N) to the SKK region on 22 June 2012. (b) Size and temperature of cTe from 23 June to 29 June (peak HS day).
Remotesensing 12 03204 g012
Figure 13. Averaged weather chart from 24–29 June 2012 for the upper-level (500 hPa) during the June fire-period in 2012.
Remotesensing 12 03204 g013
Figure 14. Wind conditions at the lower-level (925 hPa) and active fires during the top fire-period (1)29Jun’12 (from June 18 to July 2, 2012).
Remotesensing 12 03204 g014
Table 1. The top 12 active fire-periods in the southern Khabarovsk Krai (SKK).
RankNameYearDaysTotal HSRatio to Total HS for 17 Years1 %Factor for σ2
1(1)29Jun′1220121520,8505.42.03
2(2)19Oct′0520051516,0254.21.05
3(3)20Apr′0820081113,7453.60.58
4(4)10Apr′0320031513,2623.50.48
5(5)24Apr′1820181512,2303.20.27
6(6)3May′0320031511,9813.10.22
7(7)28Jul′0320031410,6002.8−0.06
8(8)29Apr′0920091010,0092.6−0.18
9(9)10May′16201657,0591.8−0.79
10(10)15Oct′04200446,3421.7−0.94
11(11)9Mar′08200854,7291.2−1.27
12(12)9Oct′05200584,1161.1−1.39
Total132130,94834.2
1 Number of total HSs = 382,878 (total number for 17 years since 2003). 2 σ: standard deviation for the top 12 fire-periods (σ = 4884).

