Abstract
The information of building types is highly needed for urban planning and management, especially in high resolution building modeling in which buildings are the basic spatial unit. However, in many parts of the world, this information is still missing. In this paper, we proposed a framework to derive the information of building type using geospatial data, including point-of-interest (POI) data, building footprints, land use polygons, and roads, from Gaode and Baidu Maps. First, we used natural language processing (NLP)-based approaches (i.e., text similarity measurement and topic modeling) to automatically reclassify POI categories into which can be used to directly infer building types. Second, based on the relationship between building footprints and POIs, we identified building types using two indicators of type ratio and area ratio. The proposed framework was tested using over 440,000 building footprints in Beijing, China. Our NLP-based approaches and building type identification methods show overall accuracies of 89.0% and 78.2%, and kappa coefficient of 0.83 and 0.71, respectively. The proposed framework is transferrable to other China cities for deriving the information of building types from web mapping platforms. The data products generated from this study are of great use for quantitative urban studies at the building level.
1. Introduction
Buildings are a vital element in urban studies. As the fundamental structural element in the urban physical space [1], buildings are the basic spatial unit to monitor urban structure development in the horizontal and vertical dimensions. The product of urban 3D building structure, i.e., building footprint, height, and volume, is a proxy for analyzing structural specifics within cities and revealing their driving factors [2]. As the main venues of urban activities in the urban socioeconomic space, buildings are the basic measurement unit to study the impact of human activities in the process of quantitative urban modeling. The product of building type can be a proxy for analyzing urban socioeconomic features dominated by human activities (e.g., living, working, and recreation), which are represented by the building types. For example, in a bottom-up urban building energy use model developed by Li et al. [3], the information of building type is a key input for capturing spatial and temporal patterns of energy consumption for different types of buildings.
Although building type is one of the key input variables in quantitative urban studies [4,5,6], this information is largely available in the shared local governmental database (e.g., accessor’s parcel geodatabase). In countries without accurate and up-to-date governmental geodatabase, time-consuming and labor-intensive field surveys remain the main approach to obtain building type information [1]. To address this problem, recent studies have investigated the potential of remote sensing and social sensing data to map building type. Remote sensing data can be used to retrieve building type information (e.g., residential and commercial buildings) at large scales based on their physical features (e.g., textural, spectral, and structural) derived from high-resolution optical images [7,8,9], stereo optical images [10], and light detection and ranging (LiDAR) data [1]. However, their ability to identify detailed building types with similar spatial forms (e.g., hospital, hotel, and restaurant) is limited. In contrast, social sensing data (e.g., social media data and taxi trajectory data) can be used to derive detailed building type information. This is because social sensing data were collected from individuals and thus, they can capture different patterns of human activities at a fine scale [11]. By revealing the relationship between building types and spatiotemporal features of human activities, social sensing data were utilized to further identify building types with similar spatial forms. However, due to the limited availability of data records, most studies using social sensing data were conducted at local and regional scales, especially in big cities [12,13,14], where people are prone to take a taxi and use social media more frequently compared to living in small cities [6].
Fortunately, geospatial data from the web mapping platform (e.g., OpenStreetMap, Baidu Maps (https://map.baidu.com/), and Gaode Maps (https://www.amap.com/)), including building footprints [15], land use polygons, roads, and point-of-interest (POI) [16], offer an opportunity to map detailed building types over a large scale. These data are sufficient for building types mapping with its copiousness, large area coverage and reliability [17,18,19]. To meet the increasing demands for mobile navigation service in human’s daily life, web mapping platforms frequently update geospatial data, even in small cities. For instance, Baidu Maps has over 300 million active users and billions navigation service requests in China each day on average [17]. By virtue of this property, many studies utilized building footprints from web mapping platforms to map 3D building structure at a continental-scale [2] and utilized POI data from web mapping platforms to map urban functional regions [20] and population density [21] at a national-scale. POI is a specific point location that can be used to represent a venue (e.g., hotel and restaurant) in the physical world, with various attributes, such as, the name, address, coordinates, and category [22]. Among these attributes, the category attribute is cognized and conceptualized [8], and there are a growing body of literatures, in which this attribute was linked to urban function types for urban land use mapping [23,24,25,26,27,28]. Thus, in this study, the category attribute of POI data was used to infer detailed building types surrounding POIs.
However, the inconsistency between the POI categories defined by web mapping platforms and categories required in urban studies limits the use of POI data. For instance, gates and building numbers categories are defined by web mapping platforms to help users precisely find their desired locations within large industrial/commercial/residential region. In this occasion, researchers cannot link these POI categories to any human activities and therefore most of the POI data studies [21,23,29] always discard this part of POIs when they manually link POI categories to the human activity categories that they needed in urban studies. However, the human activity information of these POIs can be inferred under the help of the name attribute. This attribute in POI data is described by the natural language, so the human activities information can be extracted via natural language processing (NLP) techniques.
There are challenges in mapping building types. First, there are limitations to identify detailed building types using remote sensing data, while there are challenges to map building types over large areas using social sensing data. Second, POI categories may not be able to be linked directly to human activities, and additional processes are needed to derive the information of building types using POIs. In this study we aimed to address these challenges in two major areas. First, we developed NLP-based approaches to identify corresponding building types hidden in the name attribute of POIs. Second, we collected geospatial data from Gaode Maps and Baidu Maps and proposed new ratio-based approaches to derive the urban building types in Beijing, China. The remainder of this paper describes the study area and dataset used in this study (Section 2), the proposed POI categories reclassification approach (Section 3.1) and building type identification approach (Section 3.2), results (Section 4), discussion (Section 5), and concluding remarks (Section 6).
2. Study Area and Data
As the capital of China, Beijing is located in the north margin of the North China Plain (Figure 1). Along with rapid urbanization, this megacity in 2018 (696.63 km2) increased by approximately 30 times compared to the area in 1980 (23.53 km2) [30]. Meanwhile its ring road network gradually expanded to 6th Ring Road during the past 30 years. As the core area of economic development of Beijing, the area within the 6th Ring Road has a high density of buildings and a diversity of building types. Therefore, this city can serve as an ideal region for deriving building type information.
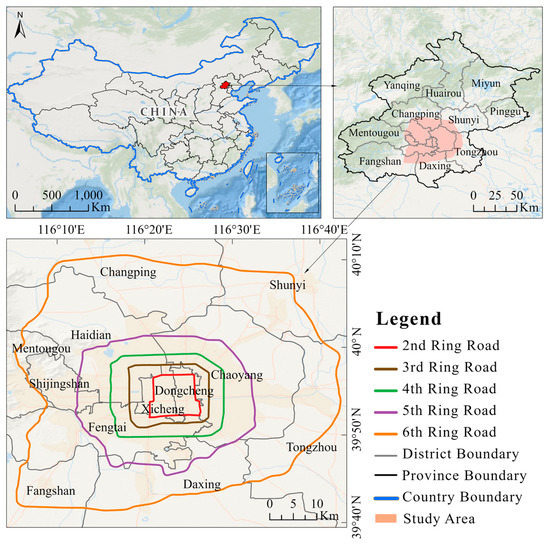
Figure 1.
The study area of Beijing, China.
The geospatial data used in this study include POIs, building footprints, land use parcels, and road networks. Baidu Maps and Gaode Maps are the two most popular web mapping platforms in China for collecting geospatial data (Figure 2A,B) to provide navigation services. We used web crawlers to collect POIs in Gaode Maps. A total of 1,455,461 POIs in 2019 were acquired via the application programming interface (API) provided by Gaode Maps, and these POIs can be grouped into the 23 big categories (e.g., food and beverages, shopping, daily life service, sports and recreation, medical service, accommodation service, tourist attraction, commercial house, governmental organization and social group, science/culture and education service, place name and address, and pass facilities). Its initial three-level category scheme can be found in its document (https://lbs.amap.com/api/webservice/download) and the 23 Level I categories were further classified into 264 Level II categories and 870 Level III categories.
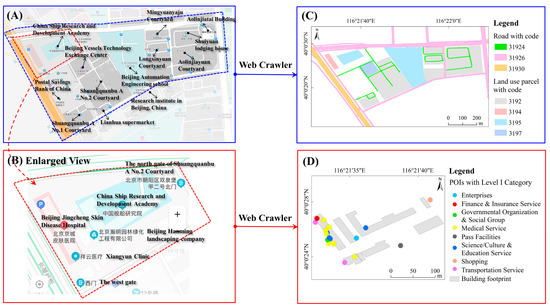
Figure 2.
Examples of geospatial data from online web mapping platforms (A) and (B) and in shapefiles after web crawlers processing (C) and (D).
We used web crawlers to collect roads, building footprints, and land use parcels from Baidu Maps. A total of 440,781 building footprints, 48,452 land use parcels (e.g., parks, companies, hotels, residential districts, greenspaces, parking lots, and schools), and 32,563 roads were acquired from Baidu Maps in 2019. The land use parcels and roads have a code attribute (Figure 2C) to infer land use types and road network levels, respectively.
3. Methodology
We developed a stepwise method to identify urban building types including residence, office, school, retail, hotel, restaurant, and hospital in Beijing, China as shown in Figure 3. First, the initial POI categories from Gaode Maps were reclassified to which can be used to directly infer building types by using a lookup table (Figure 4C). Then, NLP-based approaches (i.e., text similarity measurement and topic modeling) were developed to reclassify POI categories that cannot be reclassified by the lookup table (Figure 4D). Second, land use parcels were used to identify buildings types within parcels. Then, for buildings outside parcels, ratio-based approaches (i.e., type ratio and area ratio) were developed to identify buildings types with/without POIs nearby. More details about each step are presented in the following sections.
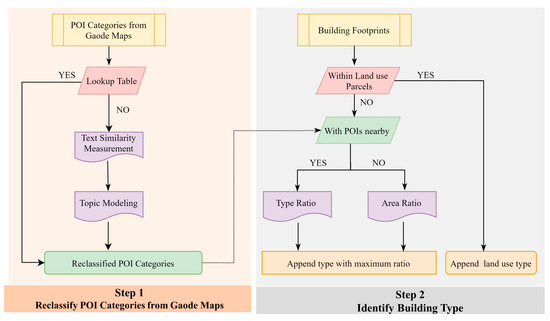
Figure 3.
The proposed framework for identifying building types.
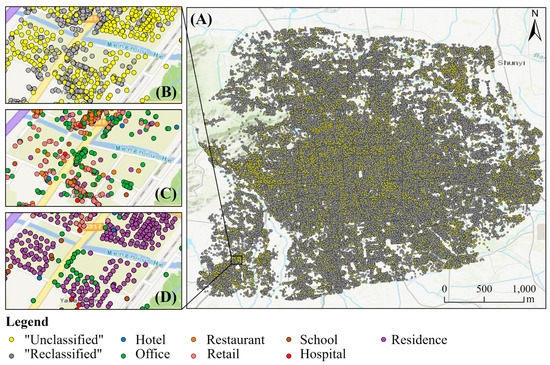
Figure 4.
(A) The distribution of ‘Unclassified’ and ‘Reclassified’ point-of-interests (POIs). (B) An enlarged view of ‘Unclassified’ and ‘Reclassified’ POIs. (C) POIs reclassified by the lookup table. (D) POIs reclassified by NLP-based approaches.
3.1. Reclassification of POI Categories
We built a lookup table (Table 1) to reclassify POI categories into corresponding building types. The category of ‘Unrelated’, accounting about 9.7% of total POIs, means POIs with this category are unrelated to buildings and were removed in our analysis. The category of ‘Unclassified’, accounting about 15.8% of total POIs (Figure 4A, B), means POIs with this category are needed to be reclassified into corresponding building types using the NLP-based approaches because ‘Unclassified’ POIs include those related to building numbers and gates and their initial categories cannot be used to directly infer building types. Via the text similarity measurement and topic modeling for POI names, we can identify their corresponding building types. In the rest of paper, we called POIs with corresponding building types in Table 1 as ‘Reclassified’ POIs and called POIs without corresponding building types in Table 1 as ‘Unclassified’ POIs.

Table 1.
The lookup table for reclassifying POI categories into corresponding building types.
3.1.1. Text Similarity Measurement
The text similarity measurement was used to identify the corresponding building types of ‘Unclassified’ POIs. This new approach was designed based on a special naming rule of ‘Unclassified’ POIs from web mapping platforms. ‘Unclassified’ POIs were collected by web mapping platforms to help users find their desired locations within a large region. For example, there is a large industrial district in Figure 5 with a POI named ‘Kangsheng Industrial District’. Two gates and eight buildings POIs are within this industrial district, and their names have same prefix of the name of industrial district POI. Their corresponding building types can be inferred by the reclassified category of industrial district POI. Three steps of the text similarity measurement using this rule are described in details below (Figure 6).
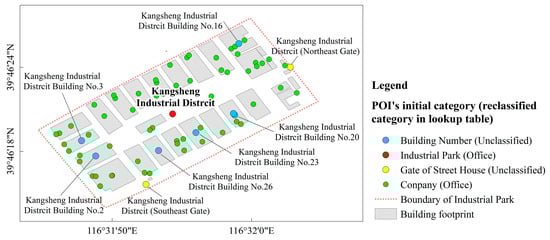
Figure 5.
Examples of POIs in a large industrial district.
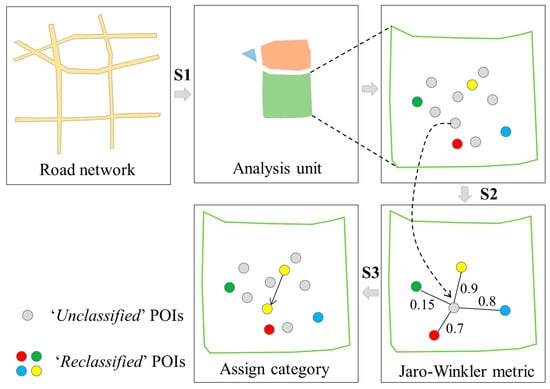
Figure 6.
An example to show the workflow of the text similarity measurement.
First, a total of 45 analysis units were generated using roads with ‘31930′ code (the main roads). The region enclosed by roads tends to have relatively homogeneous socioeconomic functions [31] so they can serve as an optimal search domain for text similarity measurement. Second, the Jaro–Winkler metric [32] in the Python package (https://pypi.org/project/pyjarowinkler/) was utilized to measure the similarity of POI names within one analysis unit. This metric considers the length of the common prefix of two texts and primarily for short texts [33]. Therefore, this metric is suitable to calculate the degree of similarity between two POI names (i.e., ‘Unclassified’ and ‘Reclassified’). Following Chen et al., [5], the similarity threshold of 0.85 was used. If the similarity value of two POI names is larger than 0.85, these two POI names were considered as ‘similar’ POIs. Third, we appended the corresponding building type of similar ‘Reclassified’ POI to the ‘Unclassified’ POI category.
3.1.2. Topic Modeling
The topic modeling was used to identify the corresponding building types of ‘Unclassified’ POIs without similar POIs within an analysis unit in four steps. We took the name of each POI as a sentence, the collection of POIs with the same category as a document, and the category as a topic. First, we used Jieba (https://github.com/fxsjy/jieba), a Python library for segmenting words in Chinese, to conduct words segmentation for each ‘Reclassified’ POI name. Each collection of words consists of words segmented from each reclassified POI category. Second, we used the term frequency-inverse document frequency (TF-IDF) calculated by Equation (1) in the in-house Python code to measure how relevant a word is to a POI reclassified category. Considering that place names (i.e., streets, districts, cities, or counties) and non-Chinese words in POI names cannot be used as theme words of the reclassified POI category, we removed them before calculating TF-IDF. Third, we generated sets of theme words for each reclassified POI category via sorting TF-IDF values. The larger the TF-IDF value of a word, the more important this word was to distinguish its corresponding building types. We sorted the TF-IDF value of words from high to low and extracted words with the TF-IDF value larger than turning points as theme words (Figure 7). Here, we explained theme words selection by taking hospital as an example. The first three words in the rank of hospital TF-IDF values were ‘Hospital’ (0.029),’ Stomatology department’ (0.023), and ‘Outpatient service (0.020) and they were used as theme words to identify hospital POIs from ‘Unclassified’ POIs. The TF-IDF values of ‘Community’ (6.03 × 10⁻⁴), ‘Health’ (5.79 × 10⁻⁴), and ‘Medicine’ (8.4 × 10⁻⁵) were smaller than 8.5 × 10⁻⁴, which means these words are not important enough to identify hospital POIs from ‘Unclassified’ POIs. Finally, we conducted the matching of theme words (Equations (2) and (3)) to determine corresponding building types of ‘Unclassified’ POIs.
where is the TF-IDF value of the word t in the reclassified POI category i; is the number of the word t in the reclassified POI category i; is the total number of words in the reclassified POI category i; is the total number of reclassified POI categories ( in this study); and is the number of reclassified POI categories with the word t.
where the is the corresponding building type of ‘Unclassified’ POI i; is the number of sets of theme words with the word w; is the word with the minimum ; is the number of ; is the TF-IDF value rank of in the corresponding set of theme words; and is the total number of words in the corresponding set of theme words.
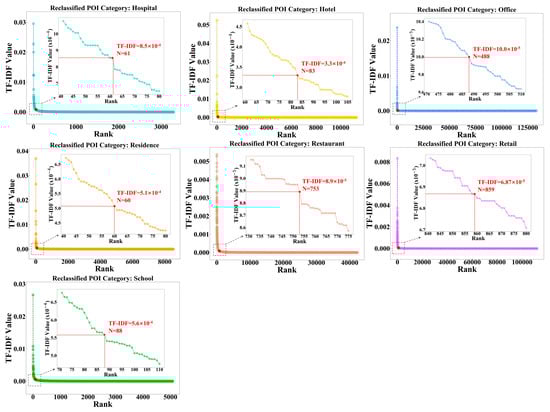
Figure 7.
TF-IDF Log curves of seven reclassified POI categories.
3.2. Identification of Building Types
We identified building types based on land use parcels and reclassified POIs. First, we interpreted code of land use parcels based on the Google Earth images and online Baidu Maps (Table 2). After performing overlay analysis, we appended land use types to building footprints within land use parcels to obtain building types. Second, for building footprints outside land use parcels, considering the uneven distribution of POI data shown in Figure 8A, we calculated the indicator of type ratio for each building with POIs nearby and the indicator of area ratio for each building without POIs nearby to obtain building types.
Table 2.
The codes and corresponding building types of land use parcels.
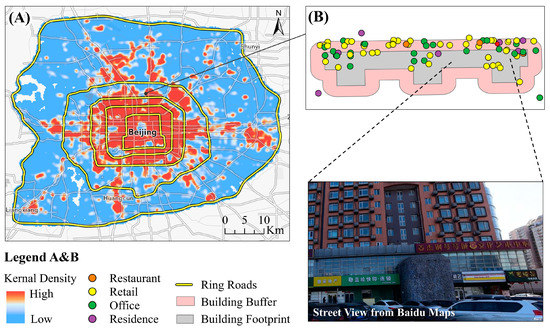
Figure 8.
The density of POIs (A) and an example of mix-used building in Beijing (B).
3.2.1. Type Ratio
For buildings with POIs nearby, type ratio (TR) was used to determine the reclassified POI category that can be appended to buildings. This ratio is calculated as the percentage of the reclassified category of POIs among the total number of POIs in the building’s buffer region (Equation (4)). Due to the geographical deviation between POIs and building footprints, not all POIs are exactly located within building footprints. Therefore, we generated the buffer for each building. The radius of the building’s buffer is the half of the Euclidean distance between this building and its nearest building because a POI is not likely to be shared by two buildings. In a mixed-use high-rise building (Figure 8), restaurants, retails, and offices dominate the bottom floors and residence dominates the remaining upper floors. The building type was determined by the major types (i.e., residence, school, and hospital) that dominate most floors. TR was calculated for POIs with the major types in each building buffer. The building type with the maximum type ratio was appended to the building footprint (Figure 9).
where is the number of the reclassified POI category ; and is the total number of POIs in the building’s buffer region
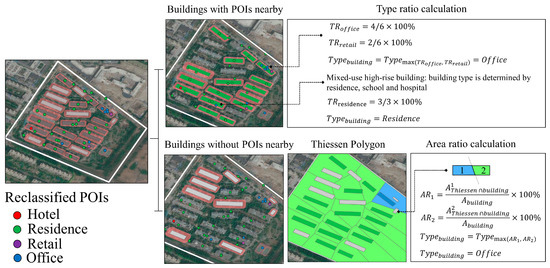
Figure 9.
An example of the type ratio and area ratio calculations.
3.2.2. Area Ratio
For buildings without POIs nearby, area ratio (AR) was used to determine the type of neighboring buildings that can be appended to these buildings. This ratio is calculated as the percentage of the building footprint that intersects with the Thiessen polygon of its neighboring buildings (Equation (5)). The regions with the sparse POI data shown in Figure 8 are distributed in urban fringe districts and mainly include old-fashioned dwellings and warehouses. Compared to the highly heterogeneous building types in urban core areas, building types in urban fringe districts are more homogenous. Therefore, in the regions with sparse POI data, the closer two buildings are to each other, the more similar building types of them are. We generated Thiessen polygons using the centroid of building footprints whose types have been identified by the indicator of TR, and appended building types to the corresponding Thiessen polygons. The larger a building area was covered by the Thiessen polygon, the larger this building type was influenced by this Thiessen polygon. Thus, the type of Thiessen polygon with the maximum area ratio was appended to the building footprint (Figure 9).
where is the total area of the building footprint; and is the area of building footprint covered by Thiessen polygon with type .
3.3. Accuracy Assessment
We evaluated the reclassified ‘Unclassified’ POIs and identified building types using the stratified random sampling method. First, a total of 500 ‘Unclassified’ POIs were used to assess the performance of NLP-based approach. The numbers of sample POIs for seven building types (i.e., Hospital, Hotel, Office, Residence, Restaurant, Retail, and School) are 20, 25, 95, 270, 20, 40, and 30, respectively. Second, a total of 500 building footprints were used to assess the performance of two building identification indicators. The numbers of sample buildings for seven building types are 20, 25, 165, 150, 35, 60, and 45, respectively. These sample buildings were manually interpreted based on the street view and online map of Baidu (https://map.baidu.com/). Confusion matrices, overall accuracy, producer’s accuracy (PA), user’s accuracy (UA), and kappa coefficient were calculated in the accuracy assessment.
4. Results
4.1. Spatial Pattern of Identified Building Types
Seven building types show significantly different patterns across the study area (Figure 10). Office and residence buildings accounted for the largest percentage of the total buildings. Compared to office buildings, residence buildings were mostly in clusters. Restaurant, retail, and hotel buildings were mainly inside the 2nd ring roads. School buildings were mainly clustered in the northwest corner of the region between the 2nd and 5th ring road. In comparison, hospital buildings were more homogeneously distributed in this study area. The patterns of retail and restaurant buildings are very similar. In terms of size, restaurant and retail buildings tended to be smaller than school and office buildings.
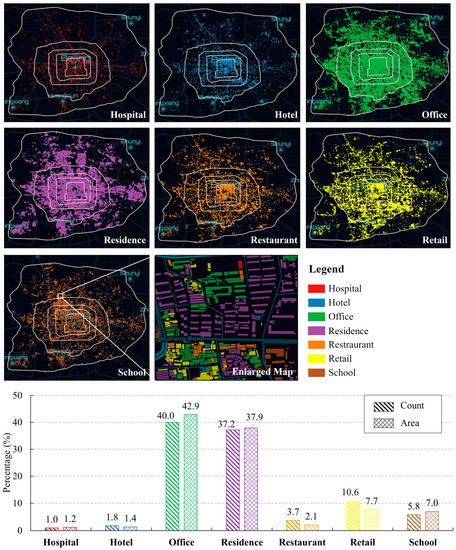
Figure 10.
The spatial patterns and statistics of identified building types in Beijing.
4.2. Performance of the NLP-Based Approach
The proposed NLP-based approach performed well in reclassifying ‘Unclassified’ POIs. For most ‘Unclassified’ POIs (83.0%), similar names were found in ‘Reclassified’ POIs, which proved the universality of the web mapping service rule we proposed in Section 3.1.1. The 15.3% of ‘Unclassified’ POIs were reclassified using topic modeling. The type of remaining 1.7% of ‘Unclassified’ POIs was reclassified as residence. The overall accuracy was 89.0%, with a kappa coefficient of 0.83 (Table 3). Specifically, identified hospital, residence, and school POIs showed the highest accuracy, and their producer accuracy (PA) and user accuracy (UA) were all around 90%. In general, hotel and restaurant POIs showed a low UA of 60% because they could easily be misclassified as office and residence POIs, respectively. Compared to PA, the UA of office POIs was lower, because office POIs could be easily misclassified as residence POIs.
Table 3.
The confusion matrix of POI reclassification via natural language processing (NLP) techniques.
4.3. Accuracy Assessment of Identified Building Types
The accuracy assessment indicates that our building type identification methods performed well in identifying building types. The percentage of buildings identified based on land use parcels was close to that based on the method of the area ratio (Figure 11). The overall accuracy was 78.2% with a kappa coefficient of 0.71 (Table 4). The high UA (80%, 91.1%) and PA (100%, 93.2%) of hospital and school buildings showed that our methods could identify hospital and school buildings well. The high UA (96.7%) and low PA (66.8%) of residence buildings indicated their high omittance. The omitted residence buildings were mostly misclassified as office buildings, leading to a low UA (69.1%) of office buildings. Moreover, the high PA (>95%) of hotel and restaurant buildings indicate that they were not easy to be omitted, but they could be misclassified as residence and office buildings. The UA and PA of retail buildings were both low, indicating that this building type could not be identified well.
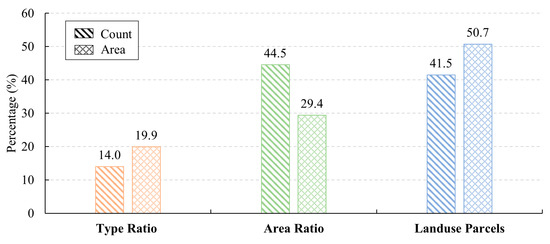
Figure 11.
The number and area percentage of identified from three methods.
Table 4.
The confusion matrix of building type identification.
5. Discussion
5.1. Comparisons with Other Methods
Our framework shows a good performance for identifying over 440,000 classified building footprints, especially for hospitals and schools. We summarized recent studies related to building type mapping in Table 5. Compared to remote sensing-based studies and map-based studies, our framework can identify more non-residential building types (e.g., school, hospital, hotel, restaurant and retail) with a comparable overall accuracy of 78.2% and kappa coefficient of 0.71. To be specific, previous studies typically required very high resolution (VHR) images (e.g., Quickbird and Worldview) to extract detailed physical characteristics (e.g., spectrum, texture, and geometry) of buildings or utilized building footprints data from topographic maps to extract geometry characteristics of buildings directly. The limitations of these studies exist in two aspects. First, the high cost of data source limited their applications over large areas. Second, although these studies utilized supervised or unsupervised machine learning approaches to fuse characteristics extracted from multiple data sources, socioeconomic characteristics related to human activities [11] were not considered in these characteristics. As a result, their building type maps mainly included residential and non-residential types because detailed buildings types (e.g., hospital and school) had similar physical characteristics and needed additional socioeconomic characteristics to be differentiated. For example, when the remote sensing-based study [16] included POI data, they identified two additional non-residential types (i.e., theater and shopping mall) because they used additional socioeconomic features (i.e., land use) from POI data. Compared to the social sensing-based methods, our framework is more transferrable to other China cities and has lower uncertainties in terms of identifying detailed building types. Due to the limitations of data availability, existing social sensing-based datasets (e.g., mobile phone data and taxi trajectory data) are mostly accessible in big cities, but the POI data used in our framework are available even in small cities [21]. Moreover, POI data can be used to infer building types more directly compared to social sensing data because they have a specific category attribute that can be linked with human activities. Social sensing-based methods identified building types via unsupervised clustering temporal human activity curves, the low representativeness and density of social sensing data had influence on the detection rate of building types such as schools, hotels, and hospitals. For example, hospital and school had low use of Tecent software [13] or educational trips were seldom shown in taxi trajectories [12], leading to the detection rate of school and hospital buildings being low. In contrast, our framework can identify hospital and school buildings well with a high UA (80%, 91.1%) and PA (100%, 93.2%).
Table 5.
The list of case studies related to building type identification.
5.2. Implications
The framework and product from this study have important implications for urban planning and management. The automatic approach proposed in our framework can maximize the usage of POI data in urban studies. When the category attribute of POIs is not enough to infer human activities, the name attribute is used to derive human activity information via the NLP-based approaches. As shown in Figure 4c,d, we used NLP-based approaches to classify ‘Unclassified’ POIs so that POIs can be used to infer the types of surrounding buildings. Moreover, the product of building type is one of the required inputs in urban studies at fine spatial scales. For example, Li, et al. [3] utilized the city-wide building type information obtained from the assessor’s database to estimate the building energy use at the building level. In other countries such as China, due to the lack of building information, the building energy use studies mainly used macro statics data over large scale [35,36] instead of using quantitative modeling at fine spatial scales. In addition, our product of building type provides the possibility to generate spatial datasets related to human activities. For example, human activities influence waste generation patterns, disaster loss amount, or population density of surrounding buildings. The information of building type can serve as an indicator to estimate waste construction [4], analyze damage and vulnerability [5], and map population [6] at the city scale.
5.3. Future Work
Further research can be focused on supervised learning algorithms to reclassify ‘Unclassified’ POIs. The topic modeling proposed in this study is a simple algorithm for matching words segmented from each POI name to theme words of the POI categories. In terms of reclassification of restaurant and hotel POIs, this algorithm performs not well with a UA of 60%. The classifier of supervised learning algorithms can be trained with TF-IDF values of words segmented from different reclassified POI categories, to automatically assign the most relevant reclassified POI category to each ‘Unclassified’ POI. Therefore, the TF-IDF extraction method coupled with a supervised learning algorithm could improve the performance of reclassification of ‘Unclassified’ POIs.
In addition, a further study is needed to improve the accuracy of identifying building types in regions with sparse POI data. The types of buildings in historical residential regions cannot be identified accurately because POIs of these buildings are not collected by the web mapping platform. Some historical residence buildings are misclassified into hotel, restaurant, retail or office buildings, leading to a low PA of residence buildings (66.8%) and low UAs of hotel (44.0%), restaurant (65.7%), retail (68.3%), and office (69.09%) buildings. Buildings of these types are sparsely scattered in the historical residential regions and their impacts on neighboring residence buildings can be considered in future studies. Moreover, the size of these buildings can be considered in the future improvement to mitigate their impacts because these small buildings are often used to provide service for residents.
6. Conclusions
Building type is of great use for analyzing urban socioeconomic features dominated by human activities. The products of building types can help researchers in studying human activities (e.g., population density mapping, building energy use modeling) at fine spatial scales. In this study, we proposed a new framework to identify building types in the urban region. First, we employed NLP-based approaches (i.e., text similarity measurement and topic modeling) to extract semantic information hidden in POI names. The derived information was used to better infer surrounding building types. Second, we proposed ratio-based approaches (i.e., type ratio and area ratio) to identify building types. The proposed framework is capable of identifying building types over large areas (e.g., the region within the 6th Ring Road of Beijing, China). The accuracy assessment indicates that our framework is reliable to reclassify POI categories with an overall accuracy of 89.0% and kappa coefficient of 0.83, and to identify building types with an overall accuracy of 78.2% and kappa coefficient of 0.71. NLP-based approaches can maximize the usage of POI data in identifying building types. The resulting product of building types is of great use for urban planning and management because building type information is one of the required inputs in quantitative urban studies. Future studies are needed to improve the performance of identifying building types in regions with sparse POI data and can be focused on potential techniques (e.g., supervised learning algorithm) to reclassify ‘Unclassified’ POIs and transferability of the approach in other countries.
Author Contributions
Conceptualization, Y.Z.; methodology, W.C. and Y.Z.; writing—original draft preparation, W.C.; writing—review and editing, W.C., Y.Z., Q.W., G.C., X.H. and B.Y.; visualization, W.C.; supervision, Y.Z.; project administration, Y.Z.; funding acquisition, Y.Z. All authors have read and agreed to the published version of the manuscript.
Funding
This study was supported by the National Science Foundation [1803920, 1854502].
Conflicts of Interest
The authors declare no conflict of interest.
References
- Lu, Z.; Im, J.; Rhee, J.; Hodgson, M. Building type classification using spatial and landscape attributes derived from LiDAR remote sensing data. Landsc. Urban. Plan. 2014, 130, 134–148. [Google Scholar] [CrossRef]
- Li, M.; Koks, E.; Taubenböck, H.; van Vliet, J. Continental-scale mapping and analysis of 3D building structure. Remote Sens. Environ. 2020, 245, 111859. [Google Scholar] [CrossRef]
- Li, W.; Zhou, Y.; Cetin, K.S.; Yu, S.; Wang, Y.; Liang, B. Developing a landscape of urban building energy use with improved spatiotemporal representations in a cool-humid climate. Build. Environ. 2018, 136, 107–117. [Google Scholar] [CrossRef]
- Vetter-Gindele, J.; Braun, A.; Warth, G.; Bui, T.T.Q.; Bachofer, F.; Eltrop, L. Assessment of household solid waste generation and composition by building type in Da Nang, Vietnam. Resources 2019, 8, 171. [Google Scholar] [CrossRef]
- Yeh, C.-H.; Loh, C.-H.; Tsai, K.-C. Overview of Taiwan earthquake loss estimation system. Nat. Hazards 2006, 37, 23–37. [Google Scholar] [CrossRef]
- Yao, Y.; Liu, X.; Li, X.; Zhang, J.; Liang, Z.; Mai, K.; Zhang, Y. Mapping fine-scale population distributions at the building level by integrating multisource geospatial big data. Int. J. Geogr. Inf. Sci. 2017, 31, 1220–1244. [Google Scholar] [CrossRef]
- Xie, J.; Zhou, J. Classification of urban building type from high spatial resolution remote sensing imagery using extended MRS and soft BP network. IEEE J. Sel. Top. Appl. Earth Obs. Remote Sens. 2017, 10, 3515–3528. [Google Scholar] [CrossRef]
- Du, S.; Zhang, F.; Zhang, X. Semantic classification of urban buildings combining VHR image and GIS data: An improved random forest approach. ISPRS J. Photogramm. Remote Sens. 2015, 105, 107–119. [Google Scholar] [CrossRef]
- Wurm, M.; Taubenbock, H.; Roth, A.; Dech, S. Urban structuring using multisensoral remote sensing data: By the example of the German cities Cologne and Dresden. In Proceedings of the 2009 Joint Urban Remote Sensing Event, Shanghai, China, 20–22 May 2009; pp. 1–8. [Google Scholar]
- Sritarapipat, T.; Takeuchi, W. Building classification in Yangon City, Myanmar using Stereo GeoEye images, Landsat image and night-time light data. Remote Sens. Appl. Soc. Environ. 2017, 6, 46–51. [Google Scholar] [CrossRef]
- Chen, W.; Huang, H.; Dong, J.; Zhang, Y.; Tian, Y.; Yang, Z. Social functional mapping of urban green space using remote sensing and social sensing data. ISPRS J. Photogramm. Remote Sens. 2018, 146, 436–452. [Google Scholar] [CrossRef]
- Zhuo, L.; Shi, Q.; Zhang, C.; Li, Q.; Tao, H. Identifying building functions from the spatiotemporal population density and the interactions of people among buildings. ISPRS Int. J. Geo-Inf. 2019, 8, 247. [Google Scholar] [CrossRef]
- Niu, N.; Liu, X.; Jin, H.; Ye, X.; Liu, Y.; Li, X.; Chen, Y.; Li, S. Integrating multi-source big data to infer building functions. Int. J. Geogr. Inf. Sci. 2017, 31, 1871–1890. [Google Scholar] [CrossRef]
- Liu, X.; Niu, N.; Liu, X.; Jin, H.; Ou, J.; Jiao, L.; Liu, Y. Characterizing mixed-use buildings based on multi-source big data. Int. J. Geogr. Inf. Sci. 2018, 32, 738–756. [Google Scholar]
- Steiniger, S.; Lange, T.; Burghardt, D.; Weibel, R. An approach for the classification of urban building structures based on discriminant analysis techniques. Trans. GIS 2008, 12, 31–59. [Google Scholar] [CrossRef]
- Arunplod, C.; Nagai, M.; Honda, K.; Warnitchai, P. Classifying building occupancy using building laws and geospatial information: A case study in Bangkok. Int. J. Disaster Risk Reduct. 2017, 24, 419–427. [Google Scholar] [CrossRef]
- Chao, H.; Cao, Y.; Zhang, J.; Xia, F.; Zhou, Y.; Shan, H. Population Density-Based Hospital Recommendation with Mobile LBS Big Data. In Proceedings of the 2018 IEEE International Conference on Big Data and Smart Computing (BigComp), Shanghai, China, 15–17 January 2018; pp. 37–44. [Google Scholar]
- He, Y.; Zheng, Y.; Deng, J.; Pan, H. Design and implementation of a POI collection and management system based on public map service. In Proceedings of the 2016 Fourth International Conference on Ubiquitous Positioning, Indoor Navigation and Location Based Services (UPINLBS), Shanghai, China, 3–4 November 2016; pp. 197–200. [Google Scholar]
- Wang, C.; Li, Y.; Shi, X. Information Mining for Urban Building Energy Models (UBEMs) from Two Data Sources: OpenStreetMap and Baidu Map. Energy Buding. 2017, 157, 166–175. [Google Scholar]
- Liu, X.; Long, Y. Automated identification and characterization of parcels with OpenStreetMap and points of interest. Environ. Plan. B Plan. Des. 2016, 43, 341–360. [Google Scholar] [CrossRef]
- Ye, T.; Zhao, N.; Yang, X.; Ouyang, Z.; Liu, X.; Chen, Q.; Hu, K.; Yue, W.; Qi, J.; Li, Z. Improved population mapping for China using remotely sensed and points-of-interest data within a random forests model. Sci. Total Environ. 2019, 658, 936–946. [Google Scholar] [CrossRef]
- Zheng, Y.; Liu, F.; Hsieh, H.-P. U-air: When urban air quality inference meets big data. In Proceedings of the 19th ACM SIGKDD International Conference on Knowledge Discovery and Data Mining, Chicago, IL, USA, 13–14 August 2013; pp. 1436–1444. [Google Scholar]
- Hu, T.; Yang, J.; Li, X.; Gong, P. Mapping urban land use by using landsat images and open social data. Remote Sens. 2016, 8, 151. [Google Scholar] [CrossRef]
- Zhang, Y.; Li, Q.; Huang, H.; Wu, W.; Du, X.; Wang, H. The combined use of remote sensing and social sensing data in fine-grained urban land use mapping: A case study in Beijing, China. Remote Sens. 2017, 9, 865. [Google Scholar] [CrossRef]
- Chen, Y.; Chen, X.; Liu, Z.; Li, X. Understanding the spatial organization of urban functions based on co-location patterns mining: A comparative analysis for 25 Chinese cities. Cities 2020, 97, 102563. [Google Scholar] [CrossRef]
- Gao, S.; Janowicz, K.; Couclelis, H. Extracting urban functional regions from points of interest and human activities on location-based social networks. Trans. GIS 2017, 21, 446–467. [Google Scholar] [CrossRef]
- Deng, X.; Newsam, S. Quantitative comparison of open-source data for fine-grain mapping of land use. In Proceedings of the 3rd ACM SIGSPATIAL Workshop on Smart Cities and Urban Analytics, Redondo Beach, CA, USA, 7 November 2017; pp. 1–8. [Google Scholar]
- Vaz, E.; Arsanjani, J.J. Crowdsourced mapping of land use in urban dense environments: An assessment of Toronto. Can. Geogr. Géographe Can. 2015, 59, 246–255. [Google Scholar] [CrossRef]
- Zhao, Y.; Li, Q.; Zhang, Y.; Du, X. Improving the accuracy of fine-grained population mapping using population-sensitive POIs. Remote Sens. 2019, 11, 2502. [Google Scholar] [CrossRef]
- Wang, Y.; Xie, X.; Liang, S.; Zhu, B.; Yao, Y.; Meng, S.; Lu, C. Quantifying the response of potential flooding risk to urban growth in Beijing. Sci. Total Environ. 2019, 705, 135868. [Google Scholar] [CrossRef]
- Zhang, Y.; Li, Q.; Wang, H.; Du, X.; Huang, H. Community scale livability evaluation integrating remote sensing, surface observation and geospatial big data. Int. J. Appl. Earth Obs. Geoinf. 2019, 80, 173–186. [Google Scholar] [CrossRef]
- Winkler, W.E. The State of Record Linkage and Current Research Problems. In Statistical Research Division, US Census Bureau; Citeseer: Tokyo, Japan, 1999. [Google Scholar]
- Cohen, W.W.; Ravikumar, P.; Fienberg, S.E. A Comparison of string distance Metrics for Name-Matching Tasks. In Proceedings of the IIWeb, Acapulco, Mexico, 9–10 August 2003; Volume 2003, pp. 73–78. [Google Scholar]
- Hecht, R.; Meinel, G.; Buchroithner, M. Automatic identification of building types based on topographic databases—a comparison of different data sources. Int. J. Cartogr. 2015, 1, 18–31. [Google Scholar] [CrossRef]
- Huo, T.; Ren, H.; Zhang, X.; Cai, W.; Feng, W.; Zhou, N.; Wang, X. China’s energy consumption in the building sector: A Statistical Yearbook-Energy Balance Sheet based splitting method. J. Clean. Prod. 2018, 185, 665–679. [Google Scholar] [CrossRef]
- Chen, S.; Li, N.; Guan, J.; Xie, Y.; Sun, F.; Ni, J. A statistical method to investigate national energy consumption in the residential building sector of China. Energy Build. 2008, 40, 654–665. [Google Scholar] [CrossRef]


© 2020 by the authors. Licensee MDPI, Basel, Switzerland. This article is an open access article distributed under the terms and conditions of the Creative Commons Attribution (CC BY) license (http://creativecommons.org/licenses/by/4.0/).