Article

Pyroclastic Density Current Hazard Assessment and Modeling Uncertainties for Fuego Volcano, Guatemala

Department of Geology and Environmental Science, University of Pittsburgh, 4107 O’Hara Street, Pittsburgh, PA 15260-3332, USA
*
Author to whom correspondence should be addressed.
Remote Sens. 2020, 12(17), 2790; https://doi.org/10.3390/rs12172790
Submission received: 9 July 2020 / Revised: 20 August 2020 / Accepted: 24 August 2020 / Published: 27 August 2020

Abstract

:
On 3 June 2018, Fuego volcano experienced a VEI = 3 eruption, which produced a pyroclastic density current (PDC) that devastated the La Réunion resort and the community of Los Lotes, resulting in over 100 deaths. To evaluate the potential hazard to the population centers surrounding Fuego associated with future PDC emplacement, we used an integrated remote sensing and flow modeling-based approach. The predominate PDC travel direction over the past 15 years was investigated using thermal infrared (TIR) data from the Advanced Spaceborne Thermal Emission and Reflection Radiometer (ASTER) instrument validated with ground reports from the National Institute of Seismology, Volcanology, Meteorology, and Hydrology (INSIVUMEH), the government agency responsible for monitoring. Two different ASTER-derived digital elevation model (DEM) products with varying levels of noise were also used to assess the uncertainty in the VolcFlow model results. Our findings indicate that the recent historical PDC travel direction is dominantly toward the south and southwest. Population centers in this region of Fuego that are within ~2 km of one of the volcano’s radial barrancas are at the highest risk during future large eruptions that produce PDCs. The ASTER global DEM (GDEM) product has the least random noise and where used with the VolcFlow model, had a significant improvement on its accuracy. Results produced longer flow runout distances and therefore better conveys a more accurate perception of risk. Different PDC volumes were then modeled using the GDEM and VolcFlow to determine potential inundation areas in relation to local communities.

1. Introduction

Explosive volcanic eruptions commonly produce one or more products (e.g., tephra fallout, pyroclastic flows, lava flows/domes, etc.) that pose risks to the lives and livelihood of local populations. These products can threaten thousands of lives in highly populated regions [1]. For example, pyroclastic density currents (PDCs) have caused ~90,000 fatalities historically, the most of any volcanic hazard [2]. PDCs are high-temperature (200–800 °C), high-velocity (80–750 km/h) mixtures of rocks, ash and gas that typically have runout distances between 10–15 km, but in some cases, as long as 100s of kilometers [3,4]. PDCs are comprised of a dense and dilute component. The latter is not confined by topography and is known as either a pyroclastic surge (PS) or a dilute PDC [5,6]. The dense portion, also known as a pyroclastic flow (PF) or dense PDC, tends to follow existing topographic lows. The formation of PDCs commonly occurs as the result of either the collapse of a large convecting eruptive column, a “boiling-over” of PDC material over the crater rim, or the presence of a lava dome that decompresses from gravitational collapse, or serves to increase the magnitude of an explosive eruption following its emplacement.
Because of the extreme hazard potential of PDCs it is critical to investigate volcanoes that have a history of producing these events, one recent example is Fuego volcano in Guatemala. The June 2018 eruption of Fuego produced a large PDC, resulting in the mass casualty event. Approximately 50,000 people live within 10 km and ~1,000,000 within 30 km of the summit of Fuego [7]. Numerous communities (e.g., El Rodeo, La Reina, Los Lotes) are located within ~5 km and are at the highest risk. However, any individuals living within ~8 km are at risk from a PDC due to the long runout distances at this volcano because of the volcanic geomorphology [
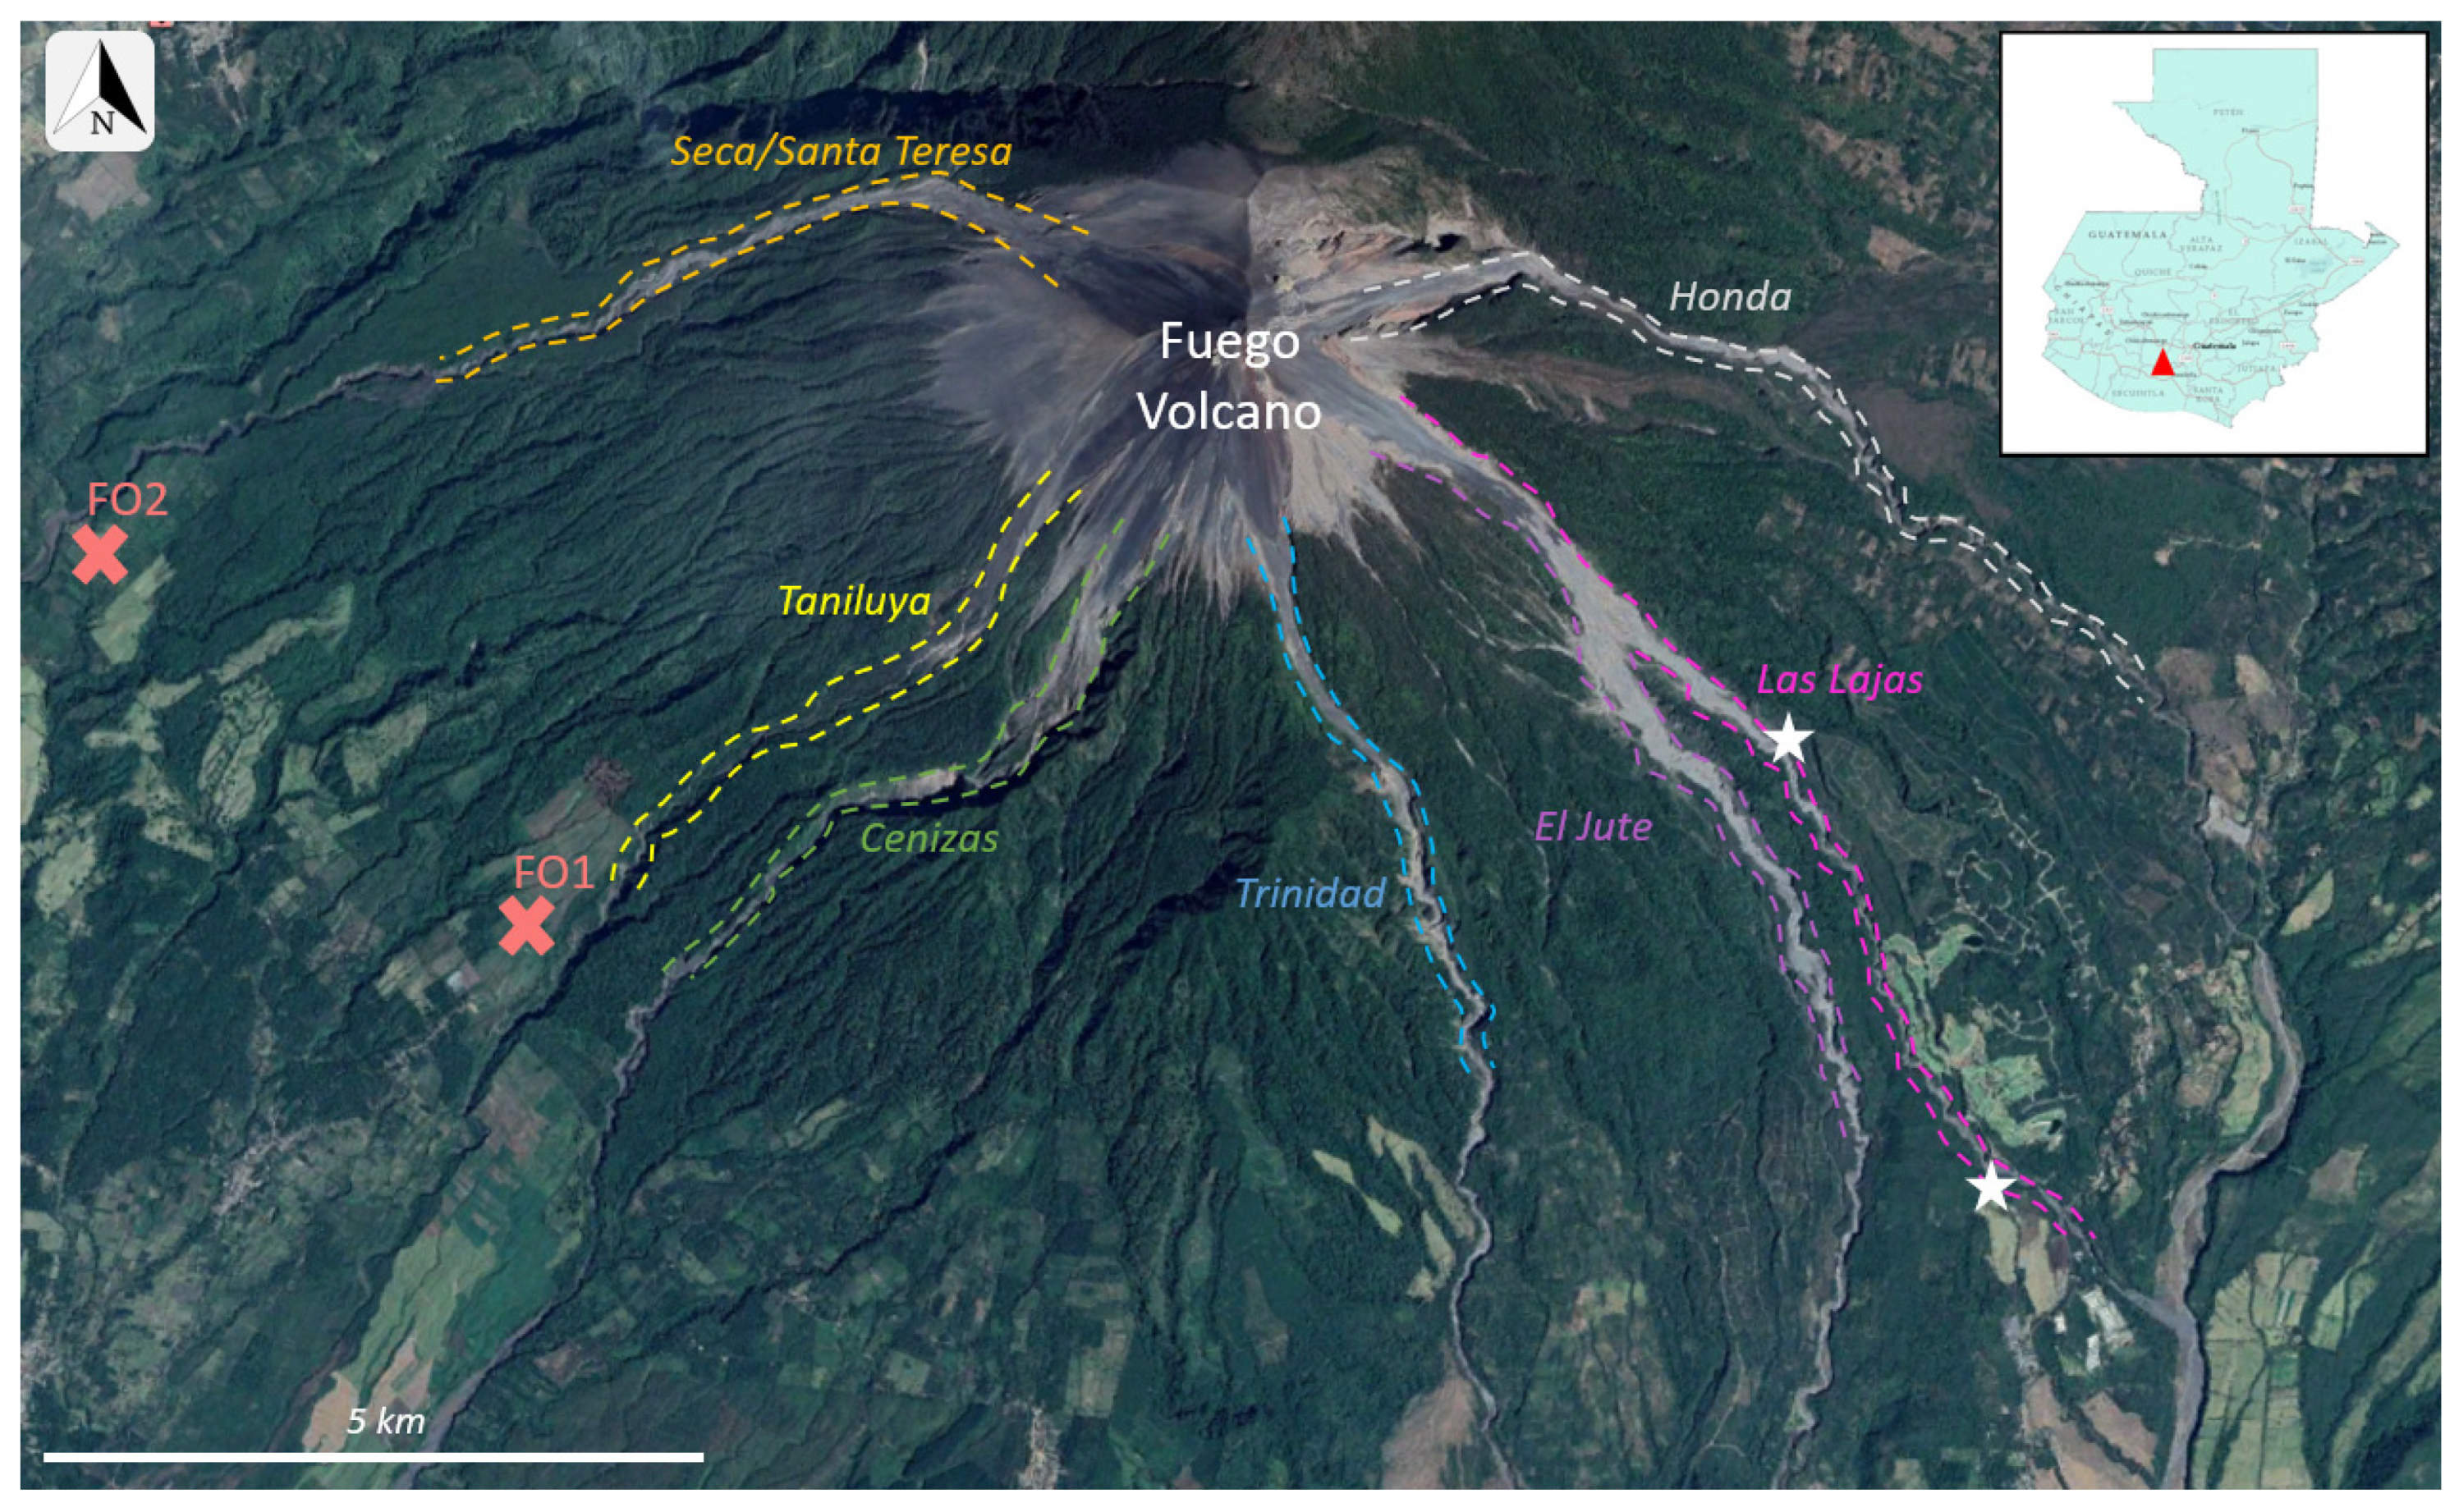
8]. Historically, PDCs and other eruptive products have been confined to Fuego’s large drainage ravines (barrancas) that are distributed radially around the summit in all but the northerly direction, as shown in Figure 1 [9]. However, if these flows leave the confines of the barrancas (as happened in 2018), the threat increases significantly to a larger area and more people.
Over the past five decades, the quantity of data available on volcanic eruptions via satellite-based remote sensing has increased exponentially [10]. Multiple studies have made use of these data to investigate specific events or styles of activity (e.g., [11,12,13]). These studies have either examined volcanic activity globally or focused on a specific geographic region or individual volcano. Several more recent studies (e.g., [7,14,15]) have used remote sensing to investigate the eruptions, emissions, and eruptive history at Fuego, specifically, utilizing a variety of satellite remote sensing instruments, such as the Moderate Resolution Imaging Spectroradiometer (MODIS), the Infrared Atmospheric Sounding Interferometer (IASI), and CubeSats. These have helped to fill a knowledge gap that existed for this volcano; specifically, the increase of volcanic activity since 1999.
Our study uses data from the Advanced Spaceborne Thermal Emission and Reflection Radiometer (ASTER) instrument. ASTER is one of the five instruments on the National Aeronautics and Space Administration (NASA) Terra satellite [16]. These data have been used to monitor and assess volcanic activity during numerous past eruptions (e.g., [11,12,17]). ASTER has a 15 m per pixel spatial resolution in the visible/near infrared (VNIR), which is also used to create digital elevation models (DEMs), and a 90 m resolution in the thermal infrared (TIR). The TIR sensor has a noise equivalent delta temperature of ~0.15 °C, allowing derivation of accurate temperatures following atmospheric correction and temperature/emissivity separation of the radiance-at-sensor data (e.g., [18]). These data saturate at pixel-integrated brightness temperatures in excess of 100 °C.
The ASTER data are critical to assess the directional tendency of PDCs over the past 15 years. The volcanic process and product causing each thermal anomaly detected by ASTER were determined and then validated by comparing them to ground-based reports. This allowed the number and direction of all PDC events to be determined. The ASTER DEM data also provided the pre-flow topography for the subsequent modeling using VolcFlow. The ultimate goal of this study was not to refine a flow model that perfectly matched the 2018 deposit, but rather to assess how such numerical flow model freeware performs using free, globally-available DEMs of varying quality. This provides a basis from which future studies at other volcanoes could be assessed. We performed modeling at Fuego on two different ASTER-DEM products to quantify the DEM quality errors, as well as the most common direction of future events. The historical TIR data analysis, therefore, directly informed the flow modeling of future PDCs. The combination of remote sensing with a DEM uncertainty analysis is unique and important for the creation of a PDC-specific hazard map, which shows that the greatest threat is to the populations nearest the summit and those closest to the barrancas.

1.1. 3 June 2018, Eruption

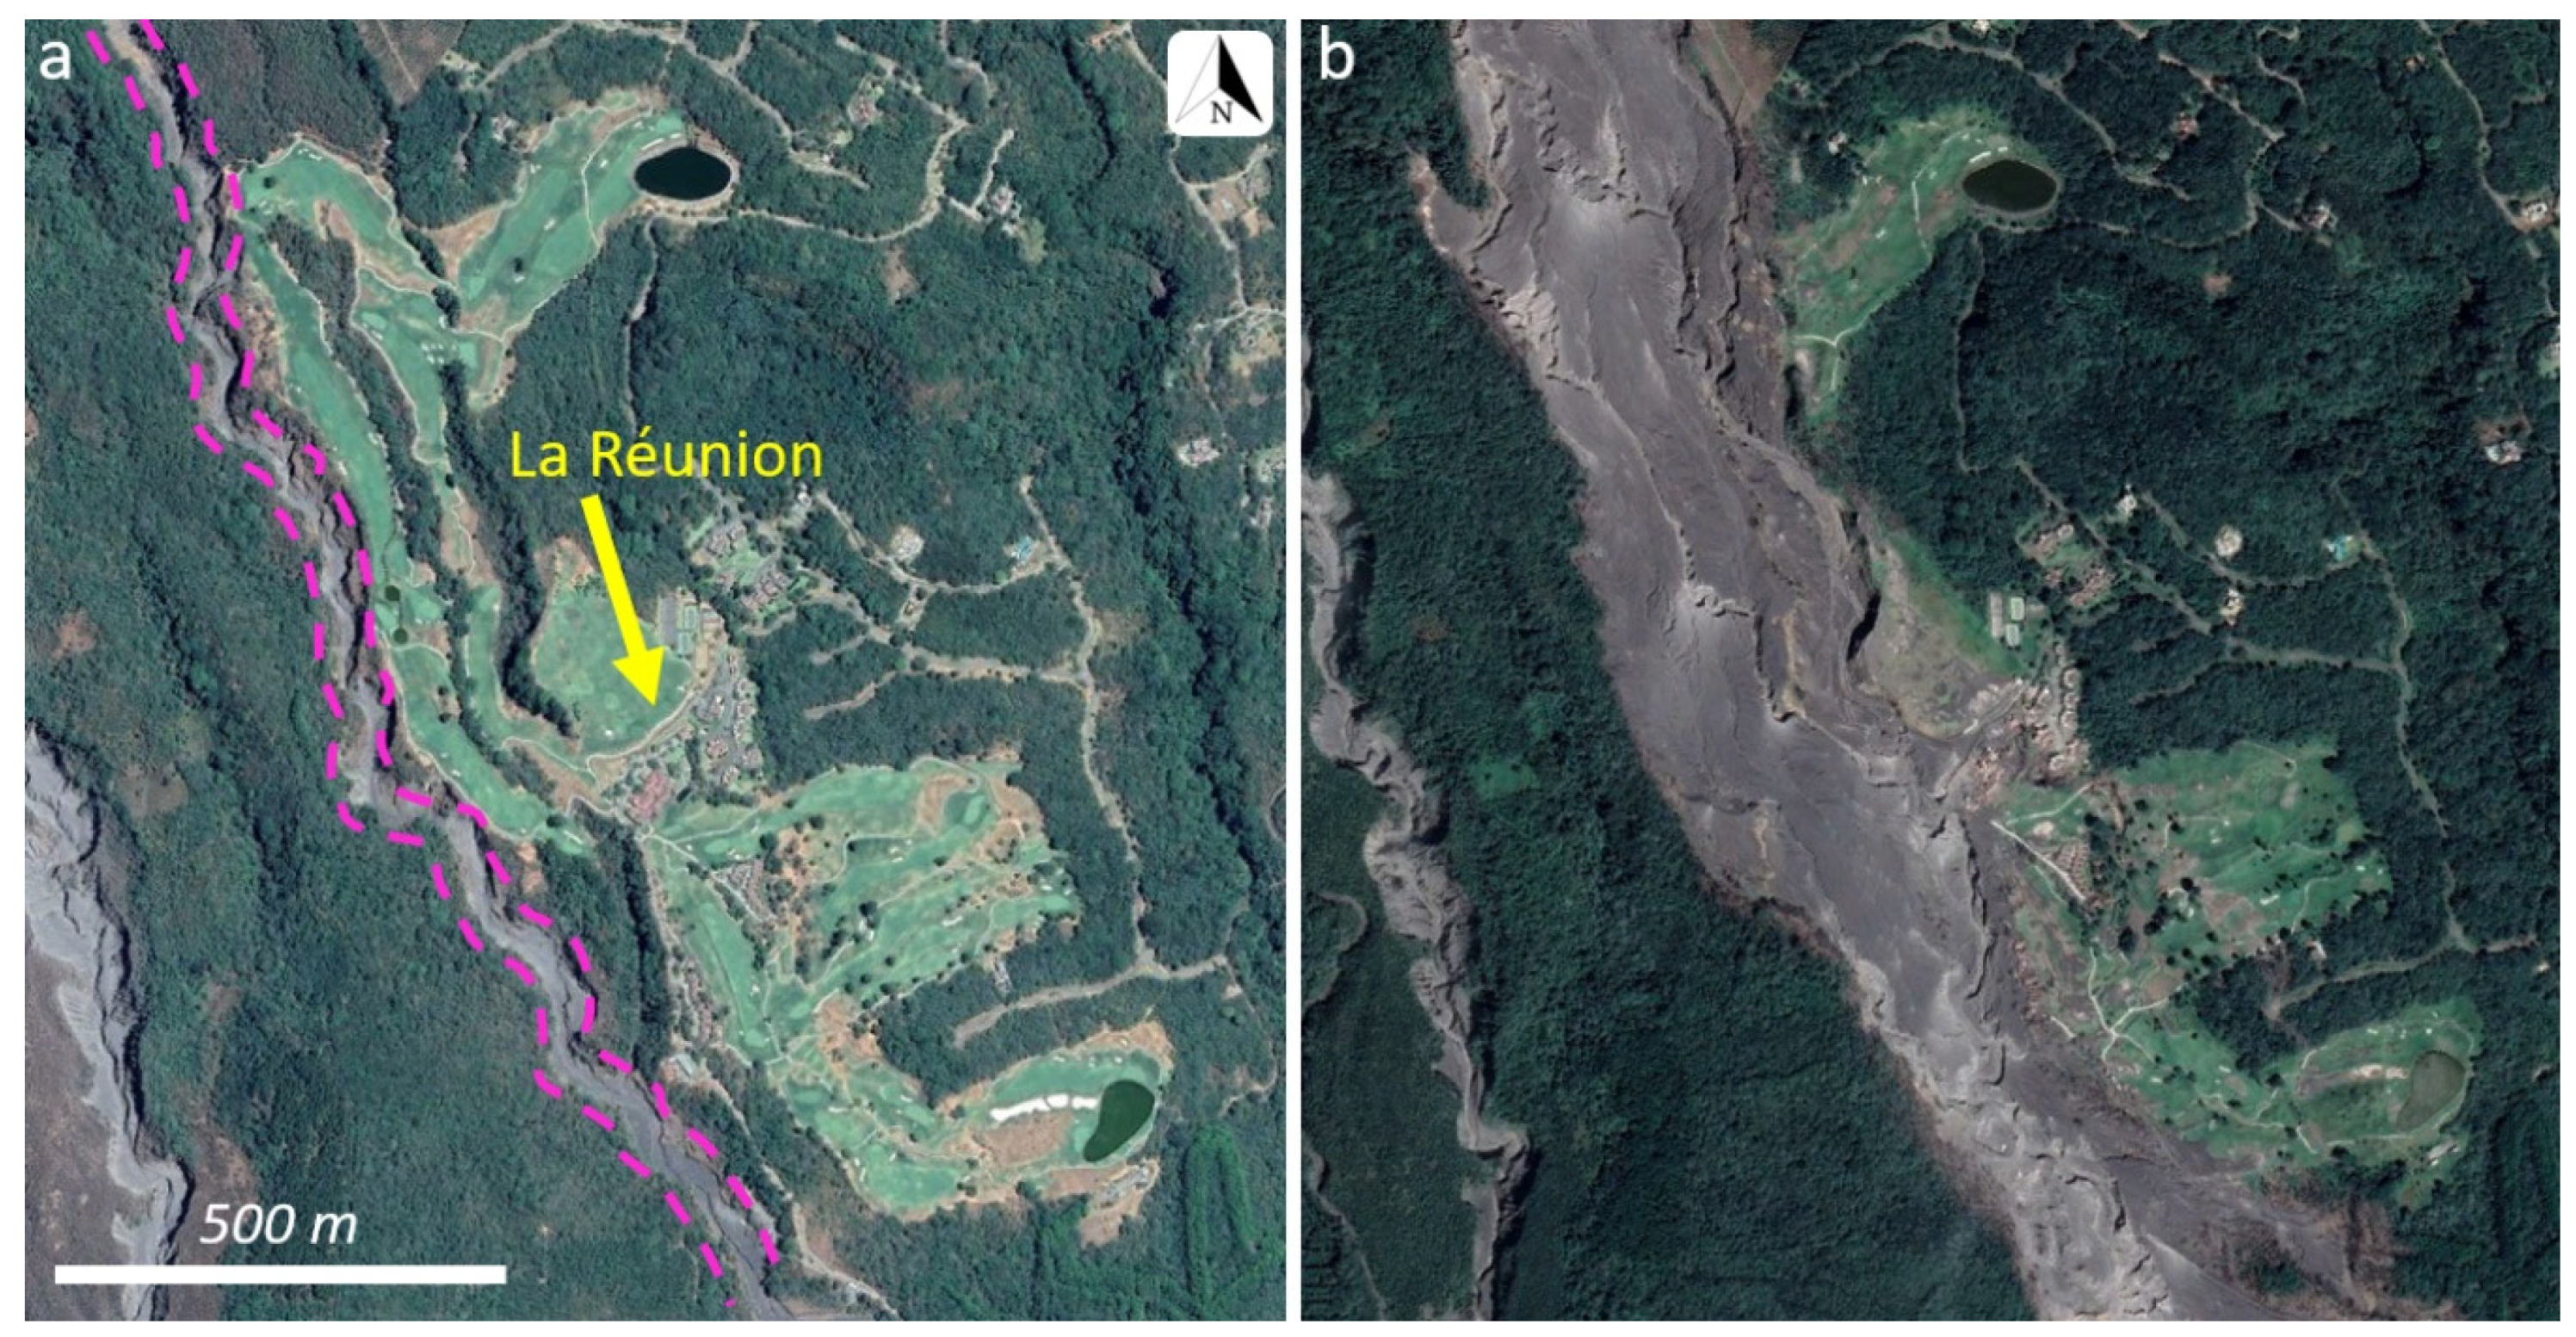
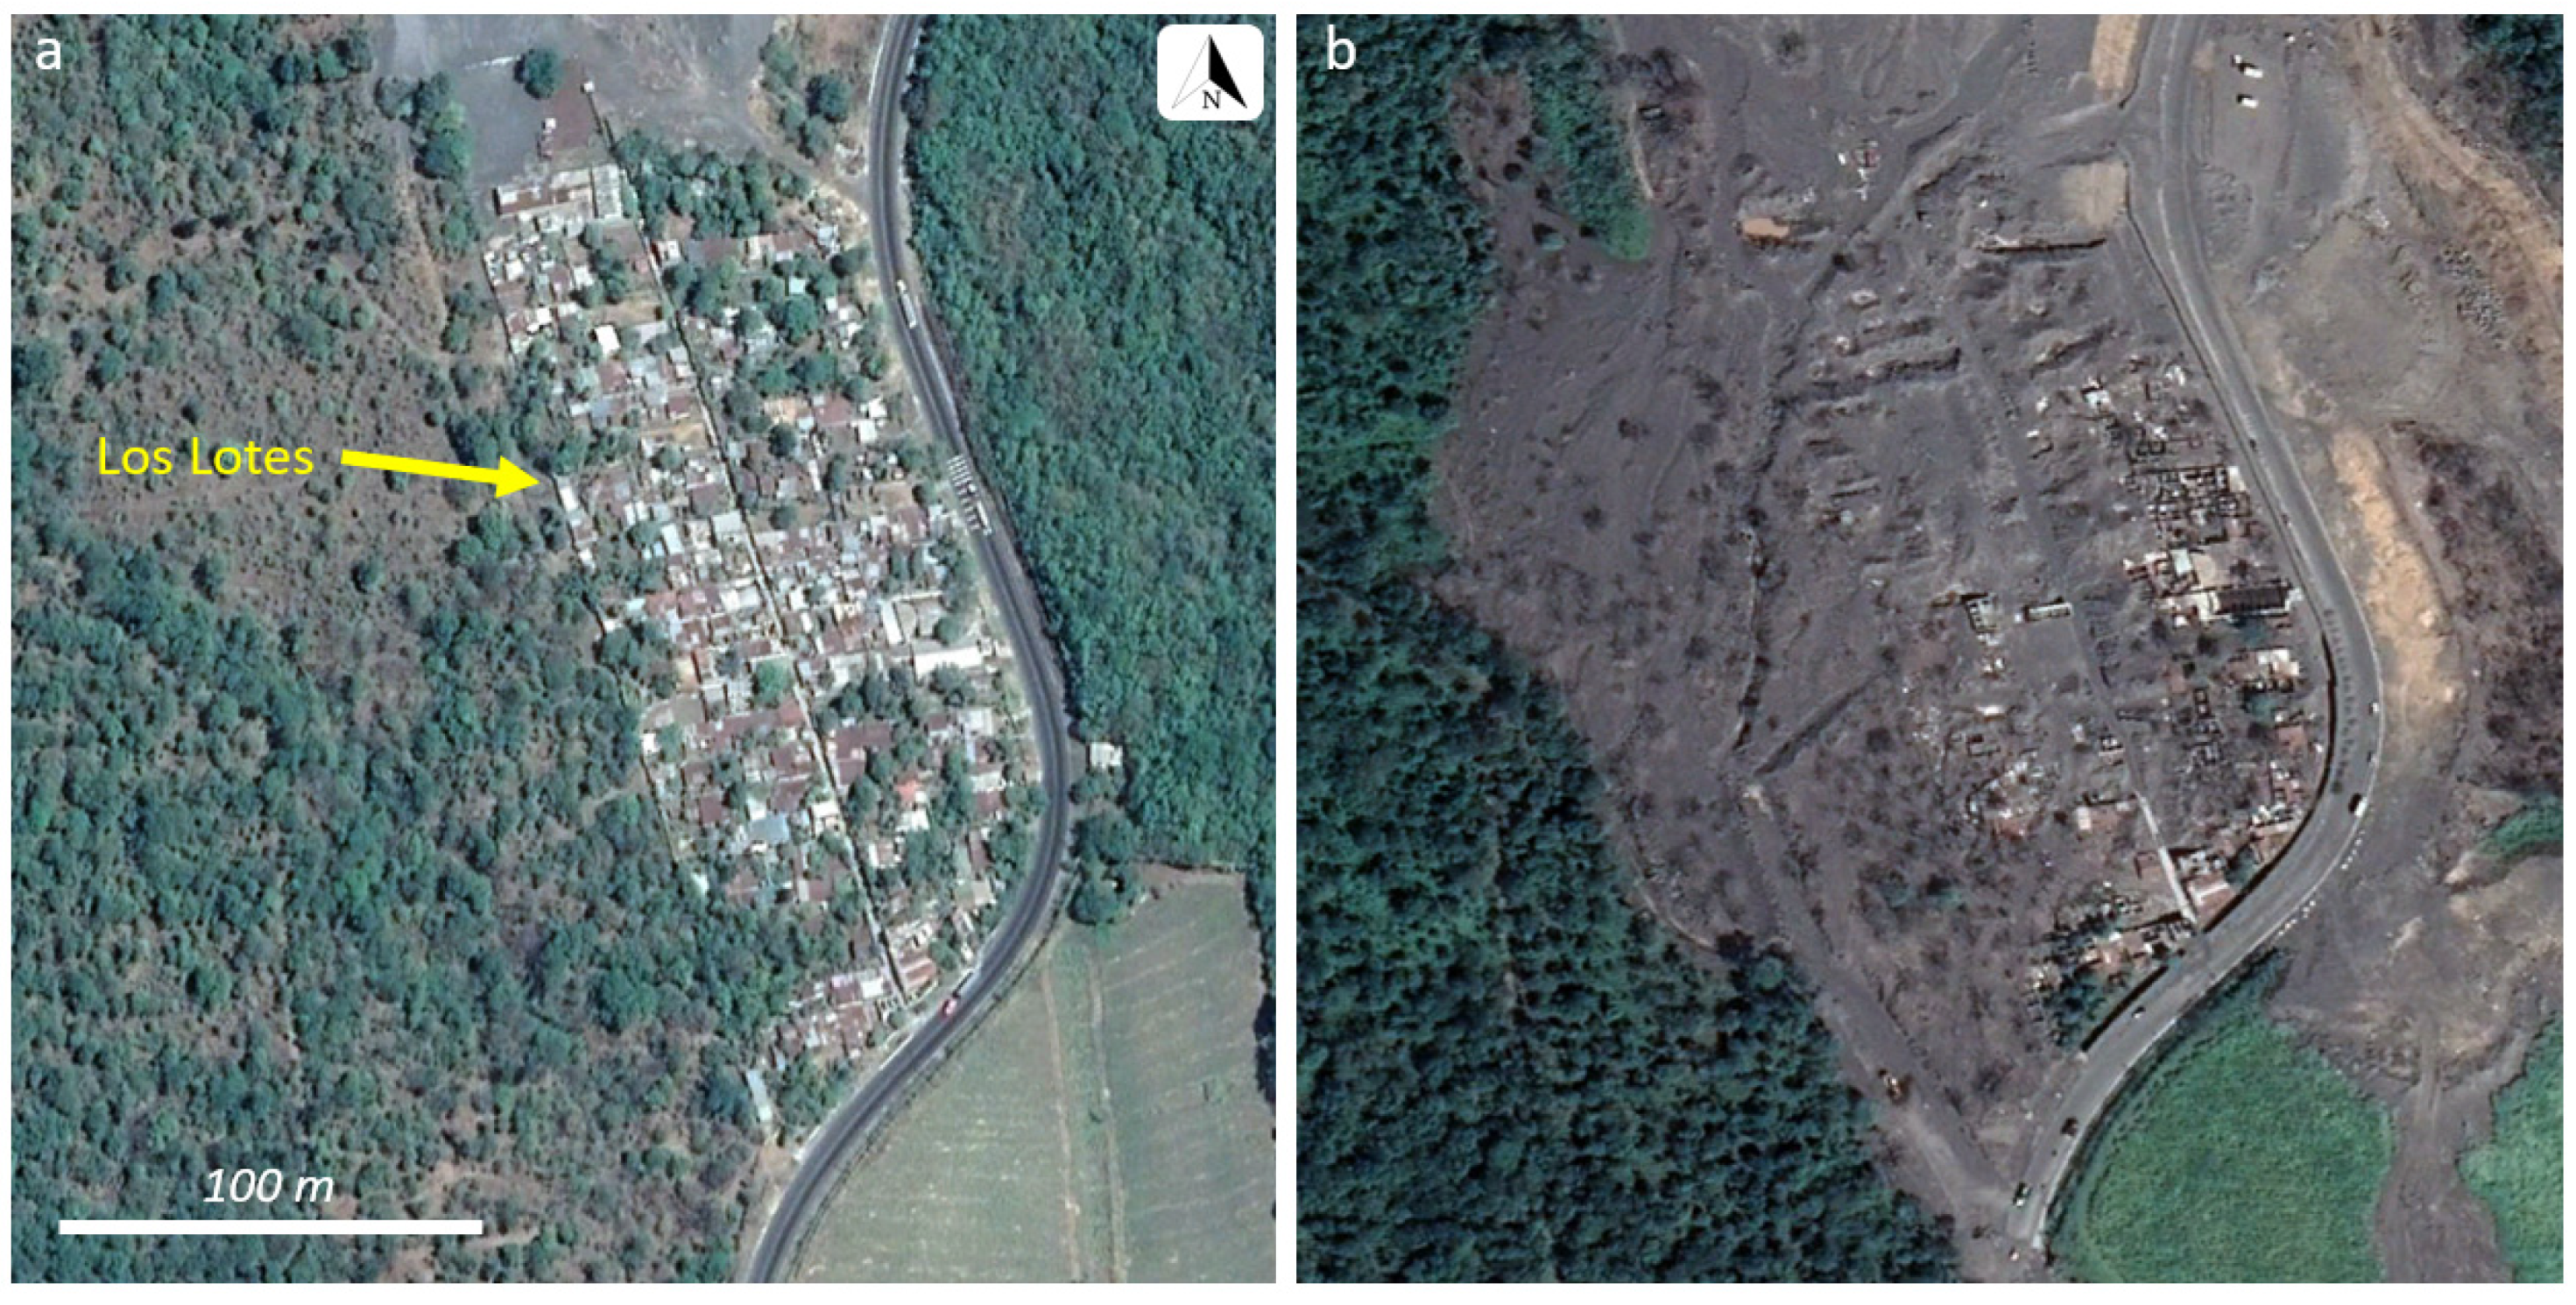
The 3 June 2018, eruption of Fuego produced a large explosive phase resulting in a column collapse and generation of a PDC, which also incorporated material from a partial collapse of the SE flank. Unlike previous PDCs that commonly remain confined to the barrancas, the volume of this PDC caused it to leave the confines of the Las Lajas barranca in two locations (white stars in Figure 1). The first at ~5 km from the summit, and the second ~3.5 km further downslope. The first exit point devastated the La Réunion Resort (Figure 2). There were no reported fatalities at this location, because of the successful evacuation of the resort staff and guests prior to the PDC emplacement. The second exit point was ~1.5 km to the north of the village of Los Lotes (Figure 3). Unlike the La Réunion Resort, Los Lotes was not evacuated and experienced the majority of casualties.
Official incident reports issued by the United Nations Office for the Coordination of Humanitarian Affairs (OCHA) determined 113 were killed from the event (Table 1). News reports following the incident placed the death toll closer to 200. As of the final OCHA report covering 19–27 June 2018, there were still 197 people missing. However, the most recent study documents more than 400 deaths [19].

1.2. Background

Fuego volcano is located in central Guatemala and has a well-defined summit crater at an elevation of 3763 m. It forms half of the Fuego-Acatenango volcanic complex and is located within the second of eight segments of the Central American Volcanic Arc [20,21,22]. Fuego has experienced five VEI = 4 eruptions in 1581–2, 1717, 1880, 1932, and 1974 [8,23,24]. During its history Fuego has also had more than 60 subplinian eruptions and longer periods (months to years) of low-level strombolian volcanism [20]. This more common activity occurs many times daily and has little to no effect on the local people living in close proximity to the volcano. Since 1999, a new eruptive style began that consists of persistent strombolian activity, lava fountaining, and explosions [20]. It is punctuated by the occasional paroxysmal eruption of greater energy that can produce lava flows and PDCs [8]. Naismith et al. (2019) proposed that starting in 2015 Fuego entered into a different period of even greater volcanic activity. This period follows eruptive activity described by Lyons et al. (2009) but is characterized by a greater frequency of paroxysmal eruptions with the following series of events: (i) effusion of lava flows and an increase in summit activity, (ii) an intense paroxysmal eruption lasting 24–48 h that produces a sustained eruptive column and PDCs, followed by (iii) a decrease in activity [7]. Our study focuses on the PDCs that formed during one of these paroxysmal eruptions on 3 June 2018.

2. Methods

A combination of orbital ASTER TIR data from 31 January 2003, to 30 April 2018, and weekly reports from the National Institute of Seismology, Volcanology, Meteorology, and Hydrology (INSIVUMEH) were used to first assess the predominant direction of PDC travel. Thermal activity seen in the ASTER data was validated using the INSIVUMEH reports, wherein anything named as a PDC, a pyroclastic flow, or an incandescent avalanche was classified as a PDC for this study. Following this analysis, the VolcFlow numerical model [25,26] was paired with different ASTER DEM products to assess the resulting uncertainty in the model’s results. In order to judge this uncertainty in the modeling outcomes, both the ASTER global DEM (GDEM) product, as well as an ASTER single-scene DEM, were used as the base for the VolcFlow modeling. The GDEM product is an average of all single-scene DEMs produced over the region from 2000 to 2011 [27]. The GDEM is cloud-free and the pixel to pixel noise, which is present in the single-scene DEMs, is greatly reduced. However, any topographic change occurring from 2000–2011 is averaged over the study period and potentially lost. Therefore, any single-scene DEM post-2011 will capture all significant topographic changes that may have occurred since the GDEM creation. Which flow model and which DEM to use with that model is a critical choice for any future hazard study of another volcano.

2.1. INSIVUMEH Reports

The National Institute of Seismology, Volcanology, Meteorology and Hydrology (INSIVUMEH) is the official scientific monitoring agency for Guatemala. It operates two volcano observatories for Fuego, both located on the SW flank approximately 9 km and 10 km from the summit (Figure 1). INSIVUMEH has trained local observers who generate reports on the volcanic activity [28]. Guatemala is the only country in Central America that has such a monitoring program. These reports are vital not only to local authorities for accurate hazard assessment and mitigation, but also to international science investigators studying these volcanoes. An observer records the state of the volcano three times per day and sends that information to INSIVUMEH headquarters. Formal reports, compiled from these daily observations, also include the seismic activity over that period, any change in the daily eruptive style/frequency, as well as the intensity and direction of any volcanic events. Reports of Fuego’s activity may also note if the events traveled down a specific barranca and any evacuations that were necessary, but they do not record the lengths or temperatures of any of the flow products emplaced.

2.2. ASTER Data Analysis

The ASTER surface kinetic temperature data product (AST_08) from 31 January 2003, to 30 April 2018, was used in this study. This dataset is produced by the ASTER temperature emissivity separation (TES) algorithm, which operates on the atmospherically-corrected ASTER TIR radiance-at-surface data product (AST_09T). The AST_08 data are accurate to ±1–2 °C and are at the same 90-m spatial resolution as all ASTER TIR data [18,29].
Initially, each scene was examined for the presence of regions that were thermally-elevated over the average temperature of the scene’s background. The flow-scale morphology and temperature distribution of these regions were also noted (e.g., short, hotter, linear lava flows versus longer, lower temperature, more sinuous PDCs). Lava flows from Fuego tend to travel at most a few kilometers, have multiple saturated pixels (pixels with an integrated brightness temperature > 100 °C), have many more pixels with high (near 100 °C) temperatures, and travel in a relatively linear manner, confined to the upper barrancas. PDCs have longer runout distances, lower more diffuse temperature profiles, and travel sinuously following the length of the barrancas. We have limited our analysis to nighttime overpasses only to reduce complications commonly encountered in daytime TIR data, such as residual solar heating, topographic effects, and the increased chance of higher cloud percentages [11]. If a scene had what appeared to be a flow, the direction of travel, length, and maximum temperature were all noted for later comparison to the INSIVUMEH reports. Similarly, scenes that had thermally-elevated pixels at the summit were also compared to these reports. The reports were then used to confirm the activity type derived from the ASTER data that occurred on that date, the direction of travel (if a flow), and specifically, which barranca was occupied by that flow. With this compiled dataset, all PDC flow directions were determined over the last 15 years. In the case where an ASTER scene had cloud cover partially obscuring the volcanic activity, priority was given to the INSIVUMEH report.
The other ASTER data product used in this study is the DEM, which is produced from any daytime VNIR scene acquired. ASTER is able to acquire along-track stereo pair images of each individual VNIR scene by way of a nadir-viewing and backward-viewing telescope. The horizontal and vertical resolution of the individual scene DEMs is 30 m and ~25 m, respectively [30]. The vertical accuracy is highly dependent on errors present in the scene. These individual scene DEMs can contain random pixel and scan line noise that can result in topographic errors up to ~30 m [31] but with averages of ~10 m [32]. Thick clouds when present can completely obscure a study area or add false topographic highs well outside of the norm for the region. However, the single-scene DEM is extremely useful for capturing the most-recent topography of a target, including any dynamic changes that may have recently occurred (e.g., landslides, lava dome formation, slope collapse). Global elevation datasets that are either captured at one time like the Shuttle Radar Topography Mission (SRTM) or created from a time average of data like the ASTER GDEM will miss or average out any topographic changes that occur outside the time window of the data acquisition. The ASTER GDEM version 2 product does, however, reduce or eliminate most of the random noise errors associated with single-scene DEMs by averaging the cloud-free portions of individual ASTER scenes from 2000–2011. Version 2 also fills holes and other errors that were present in version 1 [33,34]. The vertical accuracy of the GDEM is estimated to improve to ~20 m [34]. However, in many locations, the accuracy is better than 10 m [34]. In order to assess the VolcFlow model’s uncertainty with respect to the two ASTER DEM products, the same modeling was performed using the GDEM, as well as a relatively cloud-free, single-scene DEM from 24 January 2018.

2.3. VolcFlow Model

Several computational models have been developed to investigate PDCs, including VolcFlow [25,26], Flow3D [35], and Titan2D [36,37]. For our investigation, we chose VolcFlow, which runs inside the MATLAB programing environment, because of its extensive history in volcanic flow modeling. The VolcFlow model is freely available for download online while MATLAB requires a license to operate. VolcFlow has been used to model debris avalanches at Socompa, Chile [25], as well as PDCs at Tungurahua, Ecuador [26], and Merapi, Indonesia [38], to name a few.
VolcFlow solves depth-averaged equations of mass and momentum using a topography-linked coordinate system in time and space, similar to how TITAN2D operates [39]. It utilizes the mass and momentum conservation equations counterbalanced by retarding stresses (e.g., viscous, frictional, and turbulent stresses) that slow down the flow, as well as the gravity, rheology, and local topography (obtained from the user input DEM). The model starts a flow simulation at a fixed location and with an initial velocity of zero. The specific equations and mathematical methods used in VolcFlow are described in Kelfoun and Druitt (2005) and Kelfoun et al. (2009). The present version of VolcFlow models only the dense portion of PDCs that is confined to a channel and, therefore, most influenced by the topography [35]. Because the PDC that occurred on 3 June 2018, is best classified as a dense PDC, the use of the VolcFlow model was deemed appropriate.
The modeling of the PDC is performed using two stages. The first runs the VolcFlow model to determine the PDC travel paths. The second runs the model in an iterative manner with each iteration modeling a different eruptive volume, thereby creating a PDC hazard map as a function of eruption magnitude/erupted volume. For this study, 20, 30, and 40 (×106) m3 were used to create an approximate hazard map for the volcano. These values are based on a range of potential volumes reported for Fuego [7,8,40]. Naismith et al. (2019) estimated the 3 June 2018, pyroclastic eruptive volume travelling down Las Lajas was between 20 and 30 (×106) m3, which is also consistent with the past eruptive history of Fuego [8]. We, therefore, used 30 × 106 m3 for the single VolcFlow model run. The other variables required for the model are shown in Table 2 and were kept consistent with previous investigations of PDC flows using the model [25,26]. Several model iterations were performed that varied the input parameters seen in Table 2. We also compared the modeled flow travel direction to the ASTER data, historical trends, as well as the approximate runout distance of the 3 June 2018, PDC.

3. Results

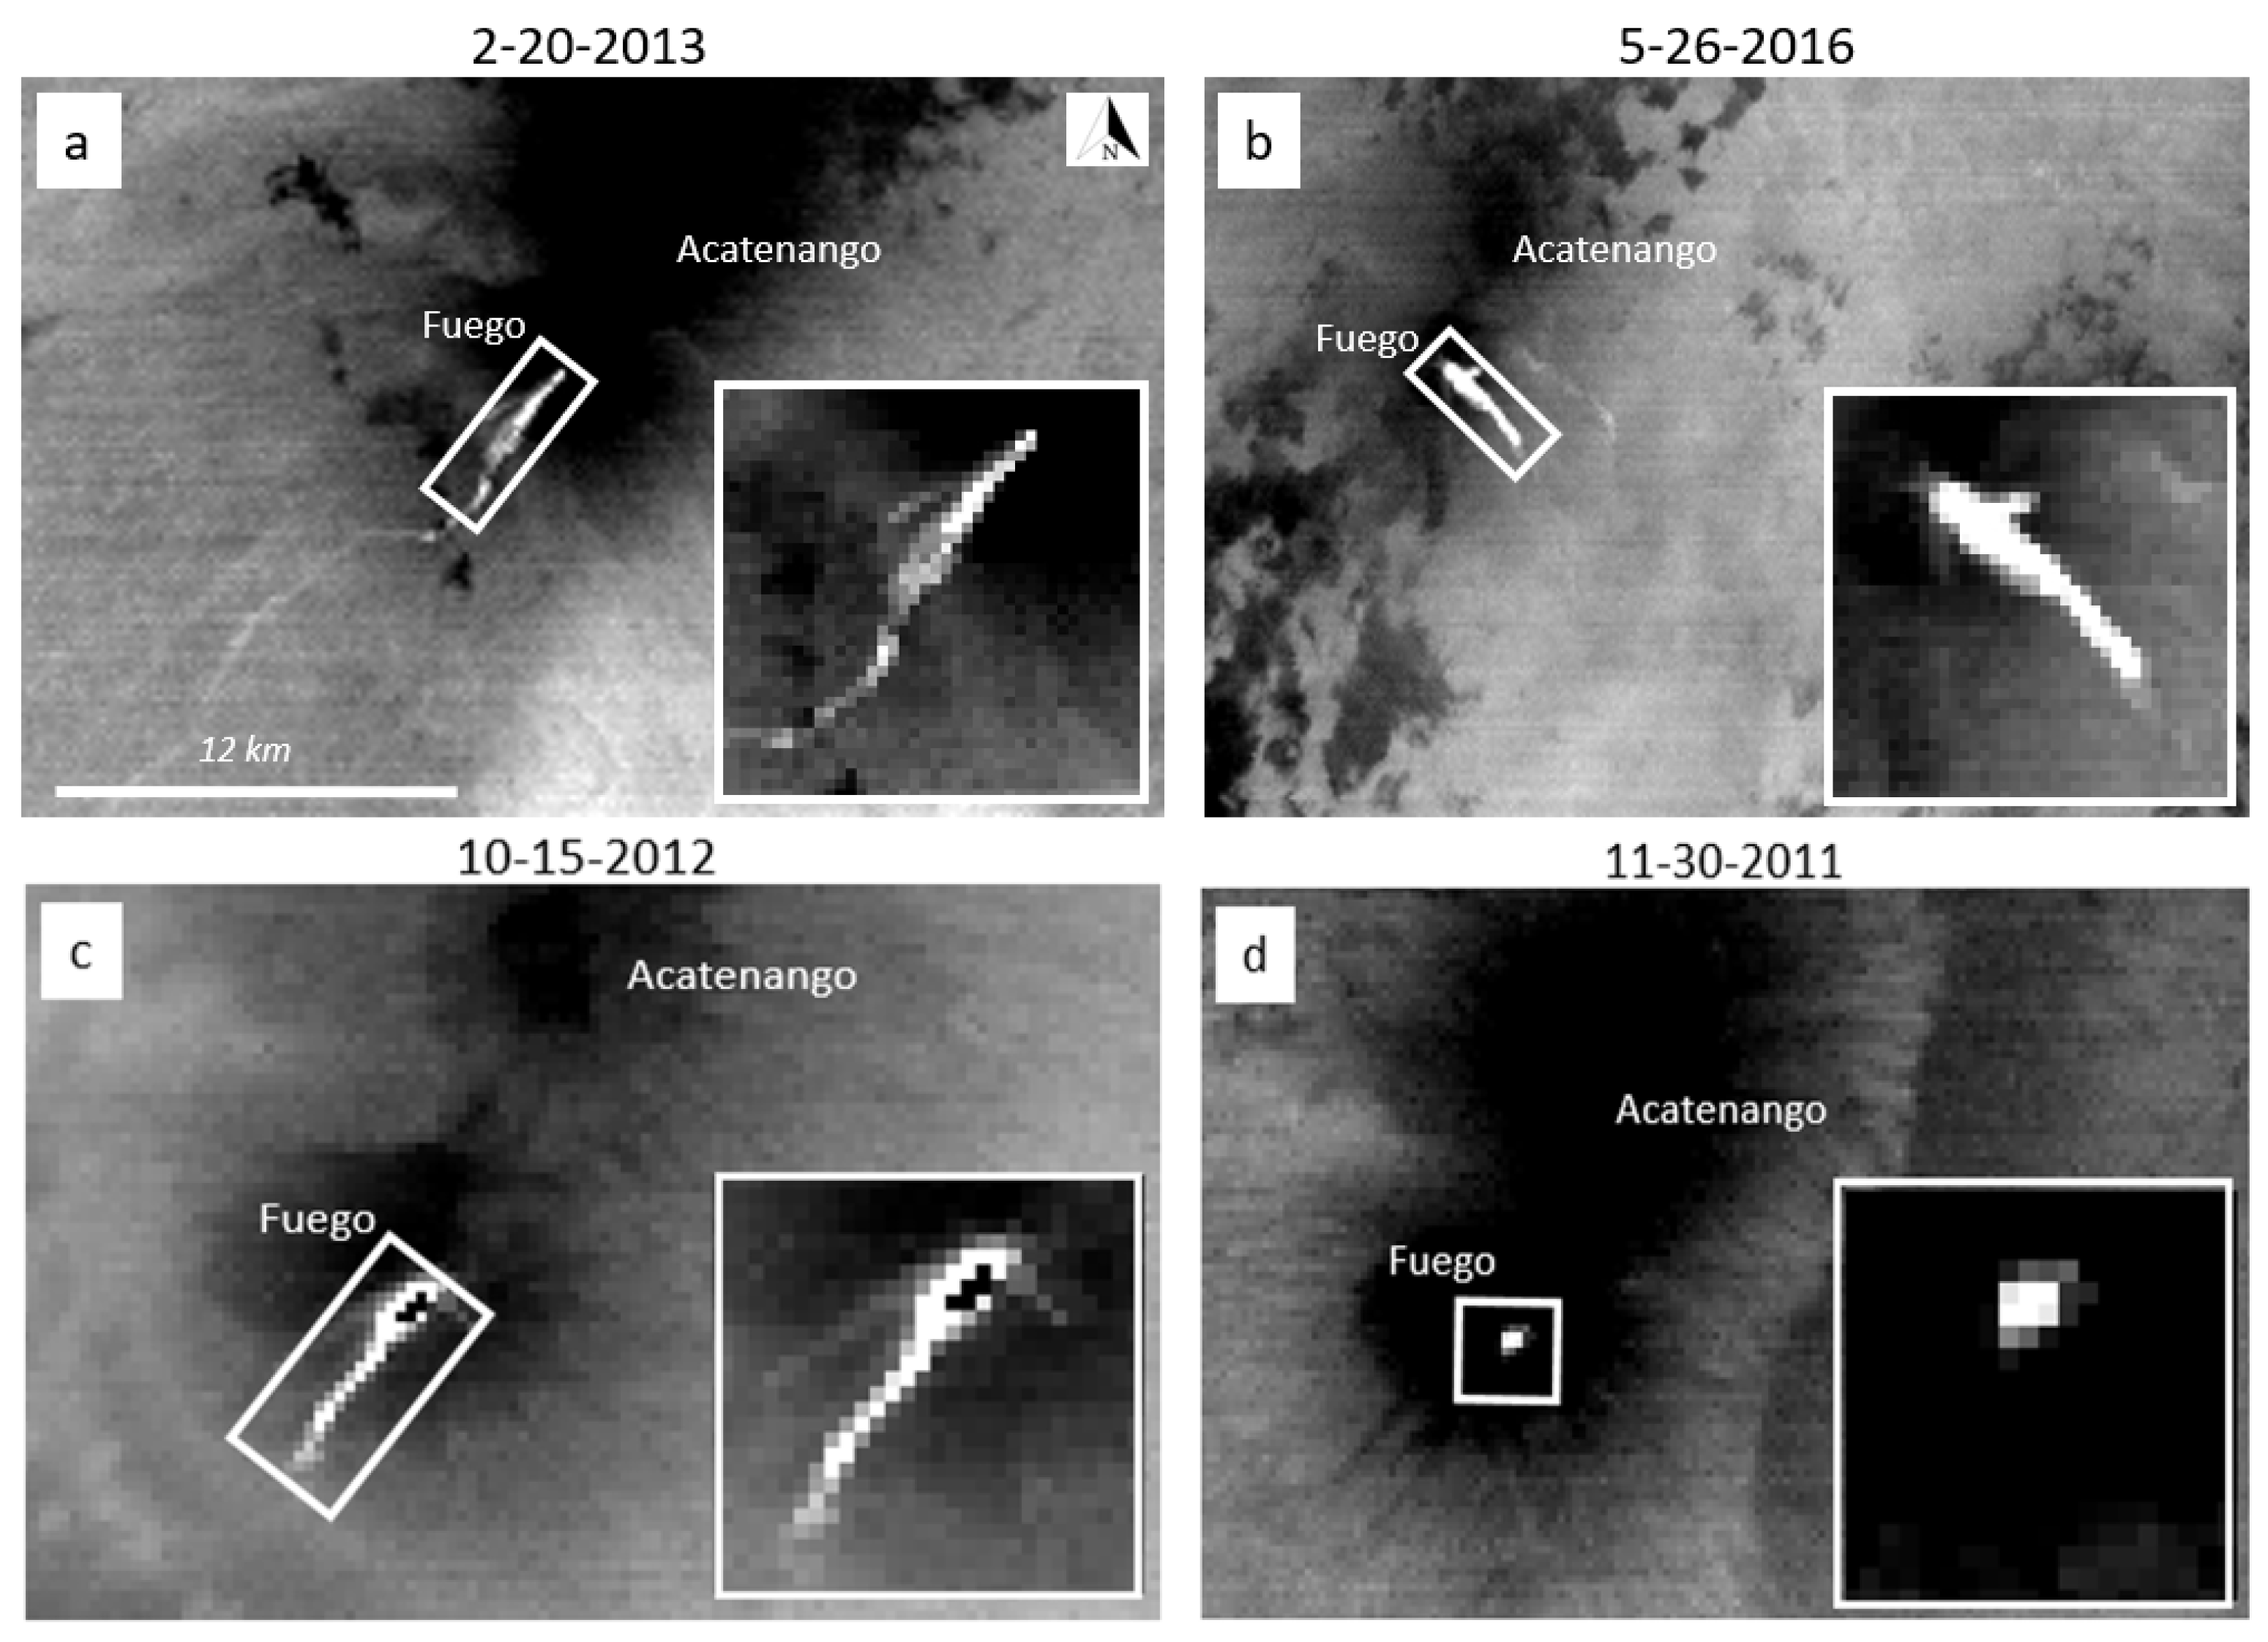
For the study period of 31 January 2003, to 30 April 2018, 193 nighttime ASTER TIR scenes were found. Of those, ~57% (109) had thermally-elevated regions above the scene’s background temperature, whereas the others either had cloud cover that obscured the summit or had no detectable activity. Within the subset that had detected activity, 47 were single to multipixel summit-confined hot spots, and 62 showed evidence of a flow. Figure 4 shows examples of four volcanic events: a lava flow, a summit thermal anomaly, and two positively identified PDCs confirmed using INSIVUMEH reports.
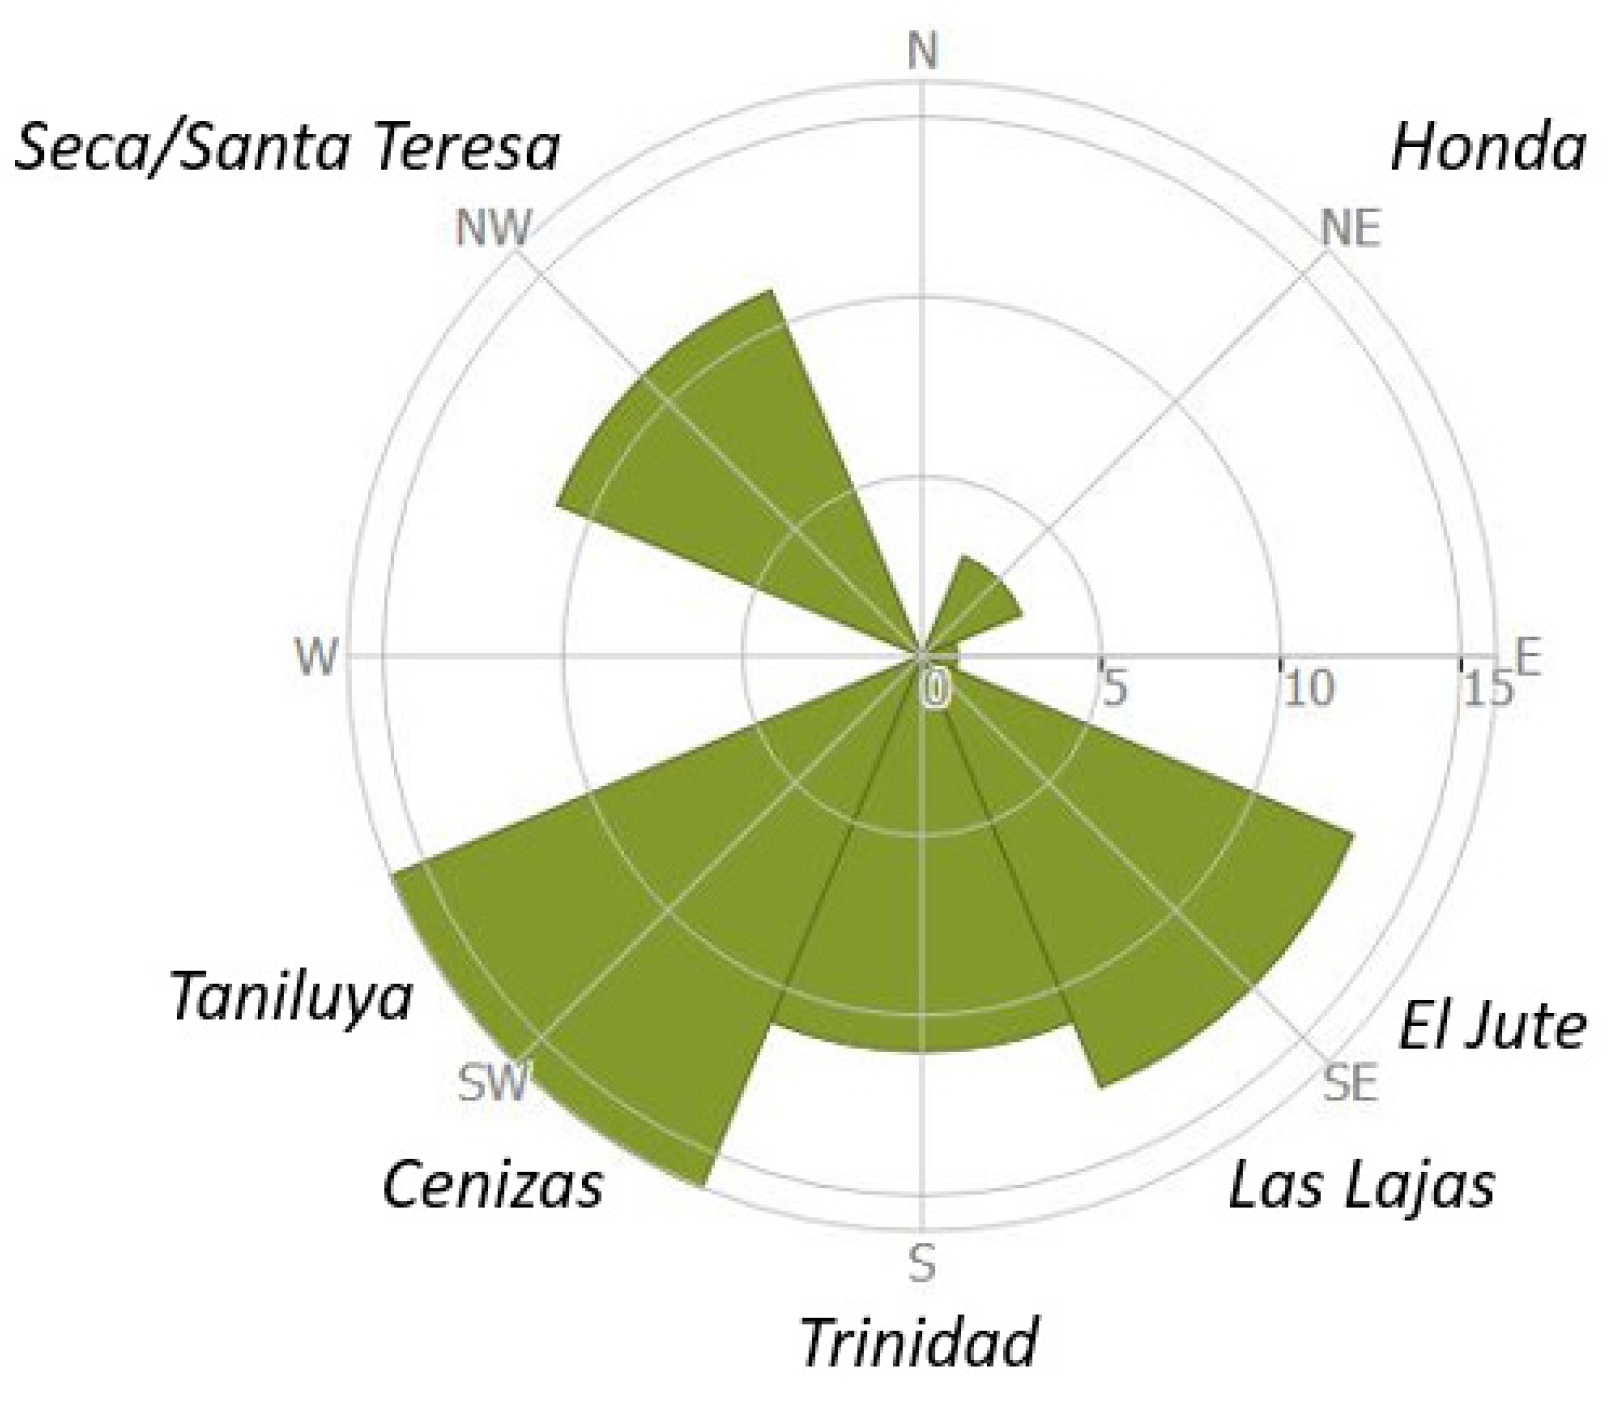
After the analysis of each scene and comparison with the INSIVUMEH reports, a total of 54 PDCs were confirmed during the ~15-year study period. The average flow length measured from the ASTER data was ~5 km. Their directional distribution is dominantly southward as might be expected based on the topography of the Fuego-Acatenango complex (Figure 5). The largest number of events (16) traveled southwest down the Taniluya and Cenizas barrancas. Due to the spatial resolution of the ASTER TIR data, it is not always possible to differentiate between these two barrancas; in which case, the INSIVUMEH reports were used for validation. The remaining PDCs were nearly equally distributed to the northwest, south, and southeast, with very little activity in the Honda barranca to the northeast.
The VolcFlow model runs correlate with the historical reports and findings of previous studies, which indicate PDC events generally remain inside the barrancas as they were emplaced [9]. This is expected because PDCs at Fuego are generally more PF-dominated as opposed to PS-dominated. The observation that most PDC’s from Fuego are dominated by dense material is also supported by a lack of PS deposits seen in the remote sensing data or reported by INSIVUMEH.
VolcFlow was first run using the 30 × 106 m
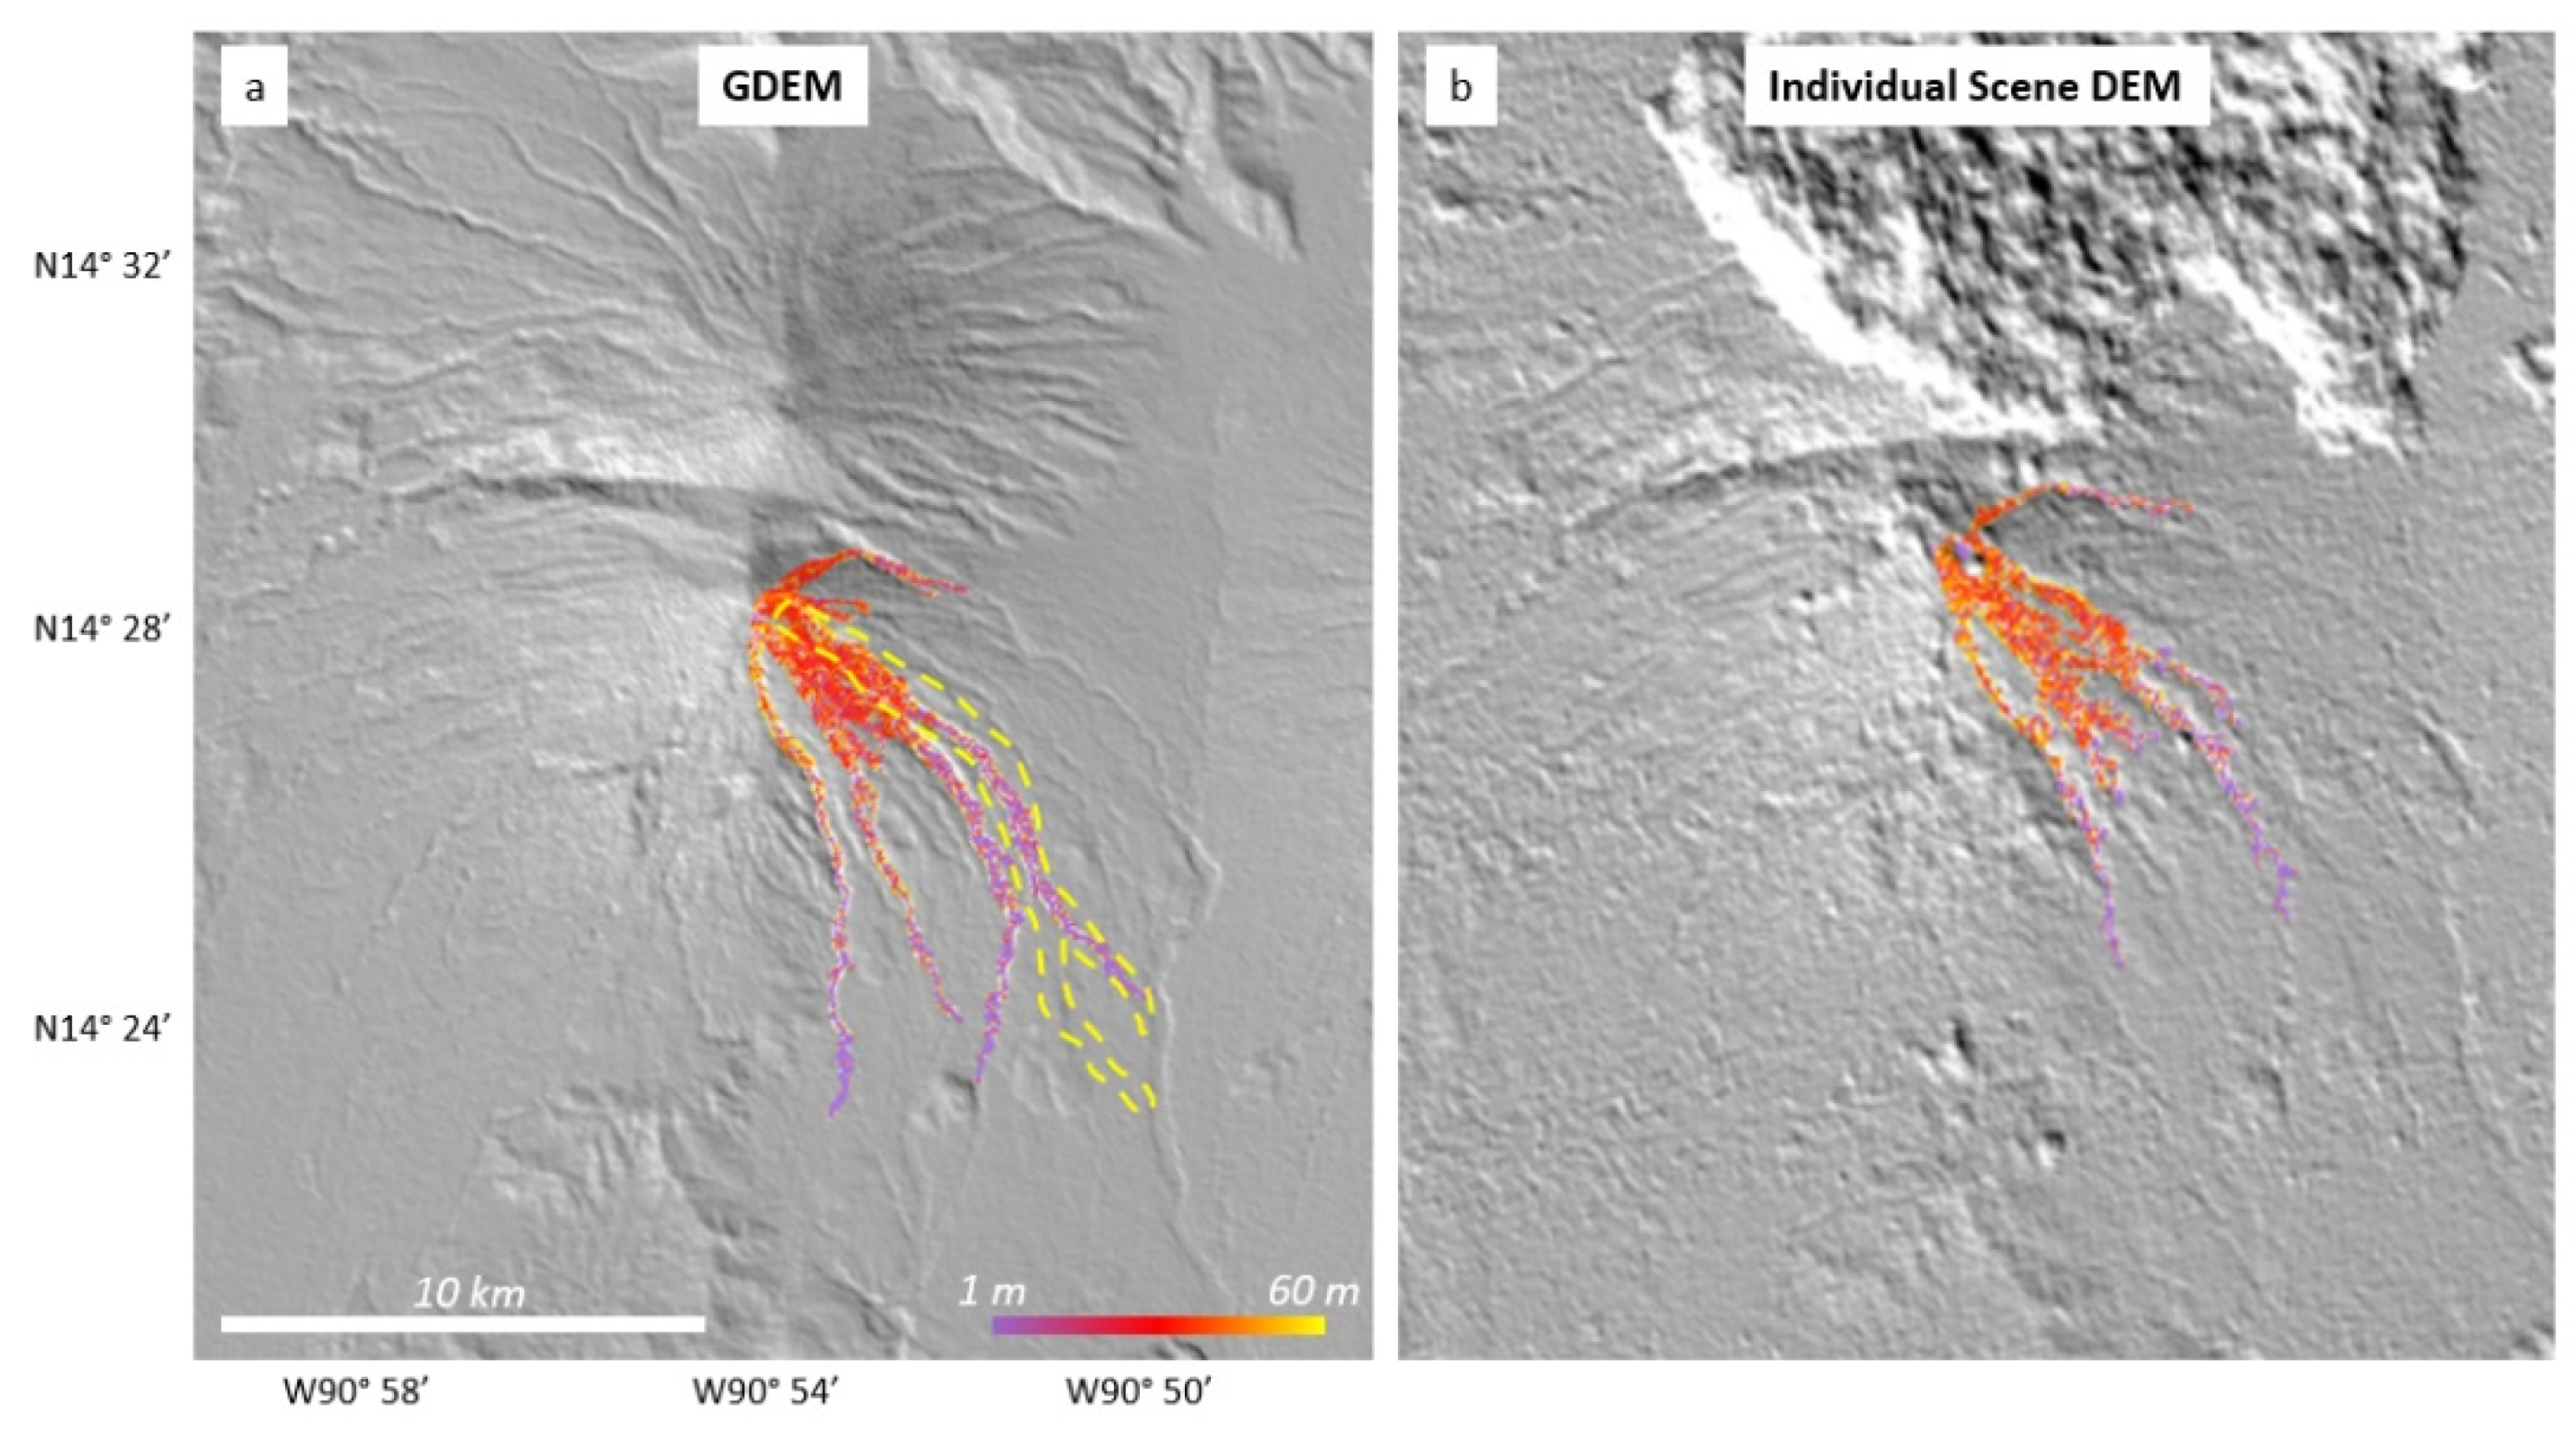
3 volume estimate of the 3 June 2018, PDC and using the ASTER GDEM product for the topographic base. A starting location/elevation was chosen to coincide with the head of the Las Lajas barranca, rather than directly at the summit. The PDC flow coverage for this initial result is shorter and distributed in more barrancas than what was observed following the June 2018 eruption (Figure 6). Furthermore, the model was unable to replicate the PDC leaving the barranca at the two locations during that event.
A single-scene DEM was chosen to assess how the higher amounts of pixel to pixel noise (compared to the GDEM) would affect the model results. By the ASTER day overpass time (~10:45 am local time), higher percentages of clouds are commonly encountered over the mountainous regions of Guatemala, even during the winter dry season. The formation of these orographic clouds typically begins about an hour earlier. Therefore, it is difficult to find scenes that are cloud-free. The scene closest to the eruption date with the least cloud cover was acquired on 24 January 2018 (Figure 6b). The DEM generated from this scene has the typical minor topographic errors caused by the pixel to pixel noise, as well as dense clouds north of the summit and much smaller clouds elsewhere (Figure 7). The presence of dense clouds to the north create a large false topographic high over Acatenango, which did not affect the VolcFlow results. The pixel noise, however, did result in modeled flow paths and lengths that were inconsistent compared to the GDEM model run. Use of the DEM with VolcFlow resulted in ~28% less area covered by the deposit and flow lengths that were ~54% shorter than the results using GDEM.
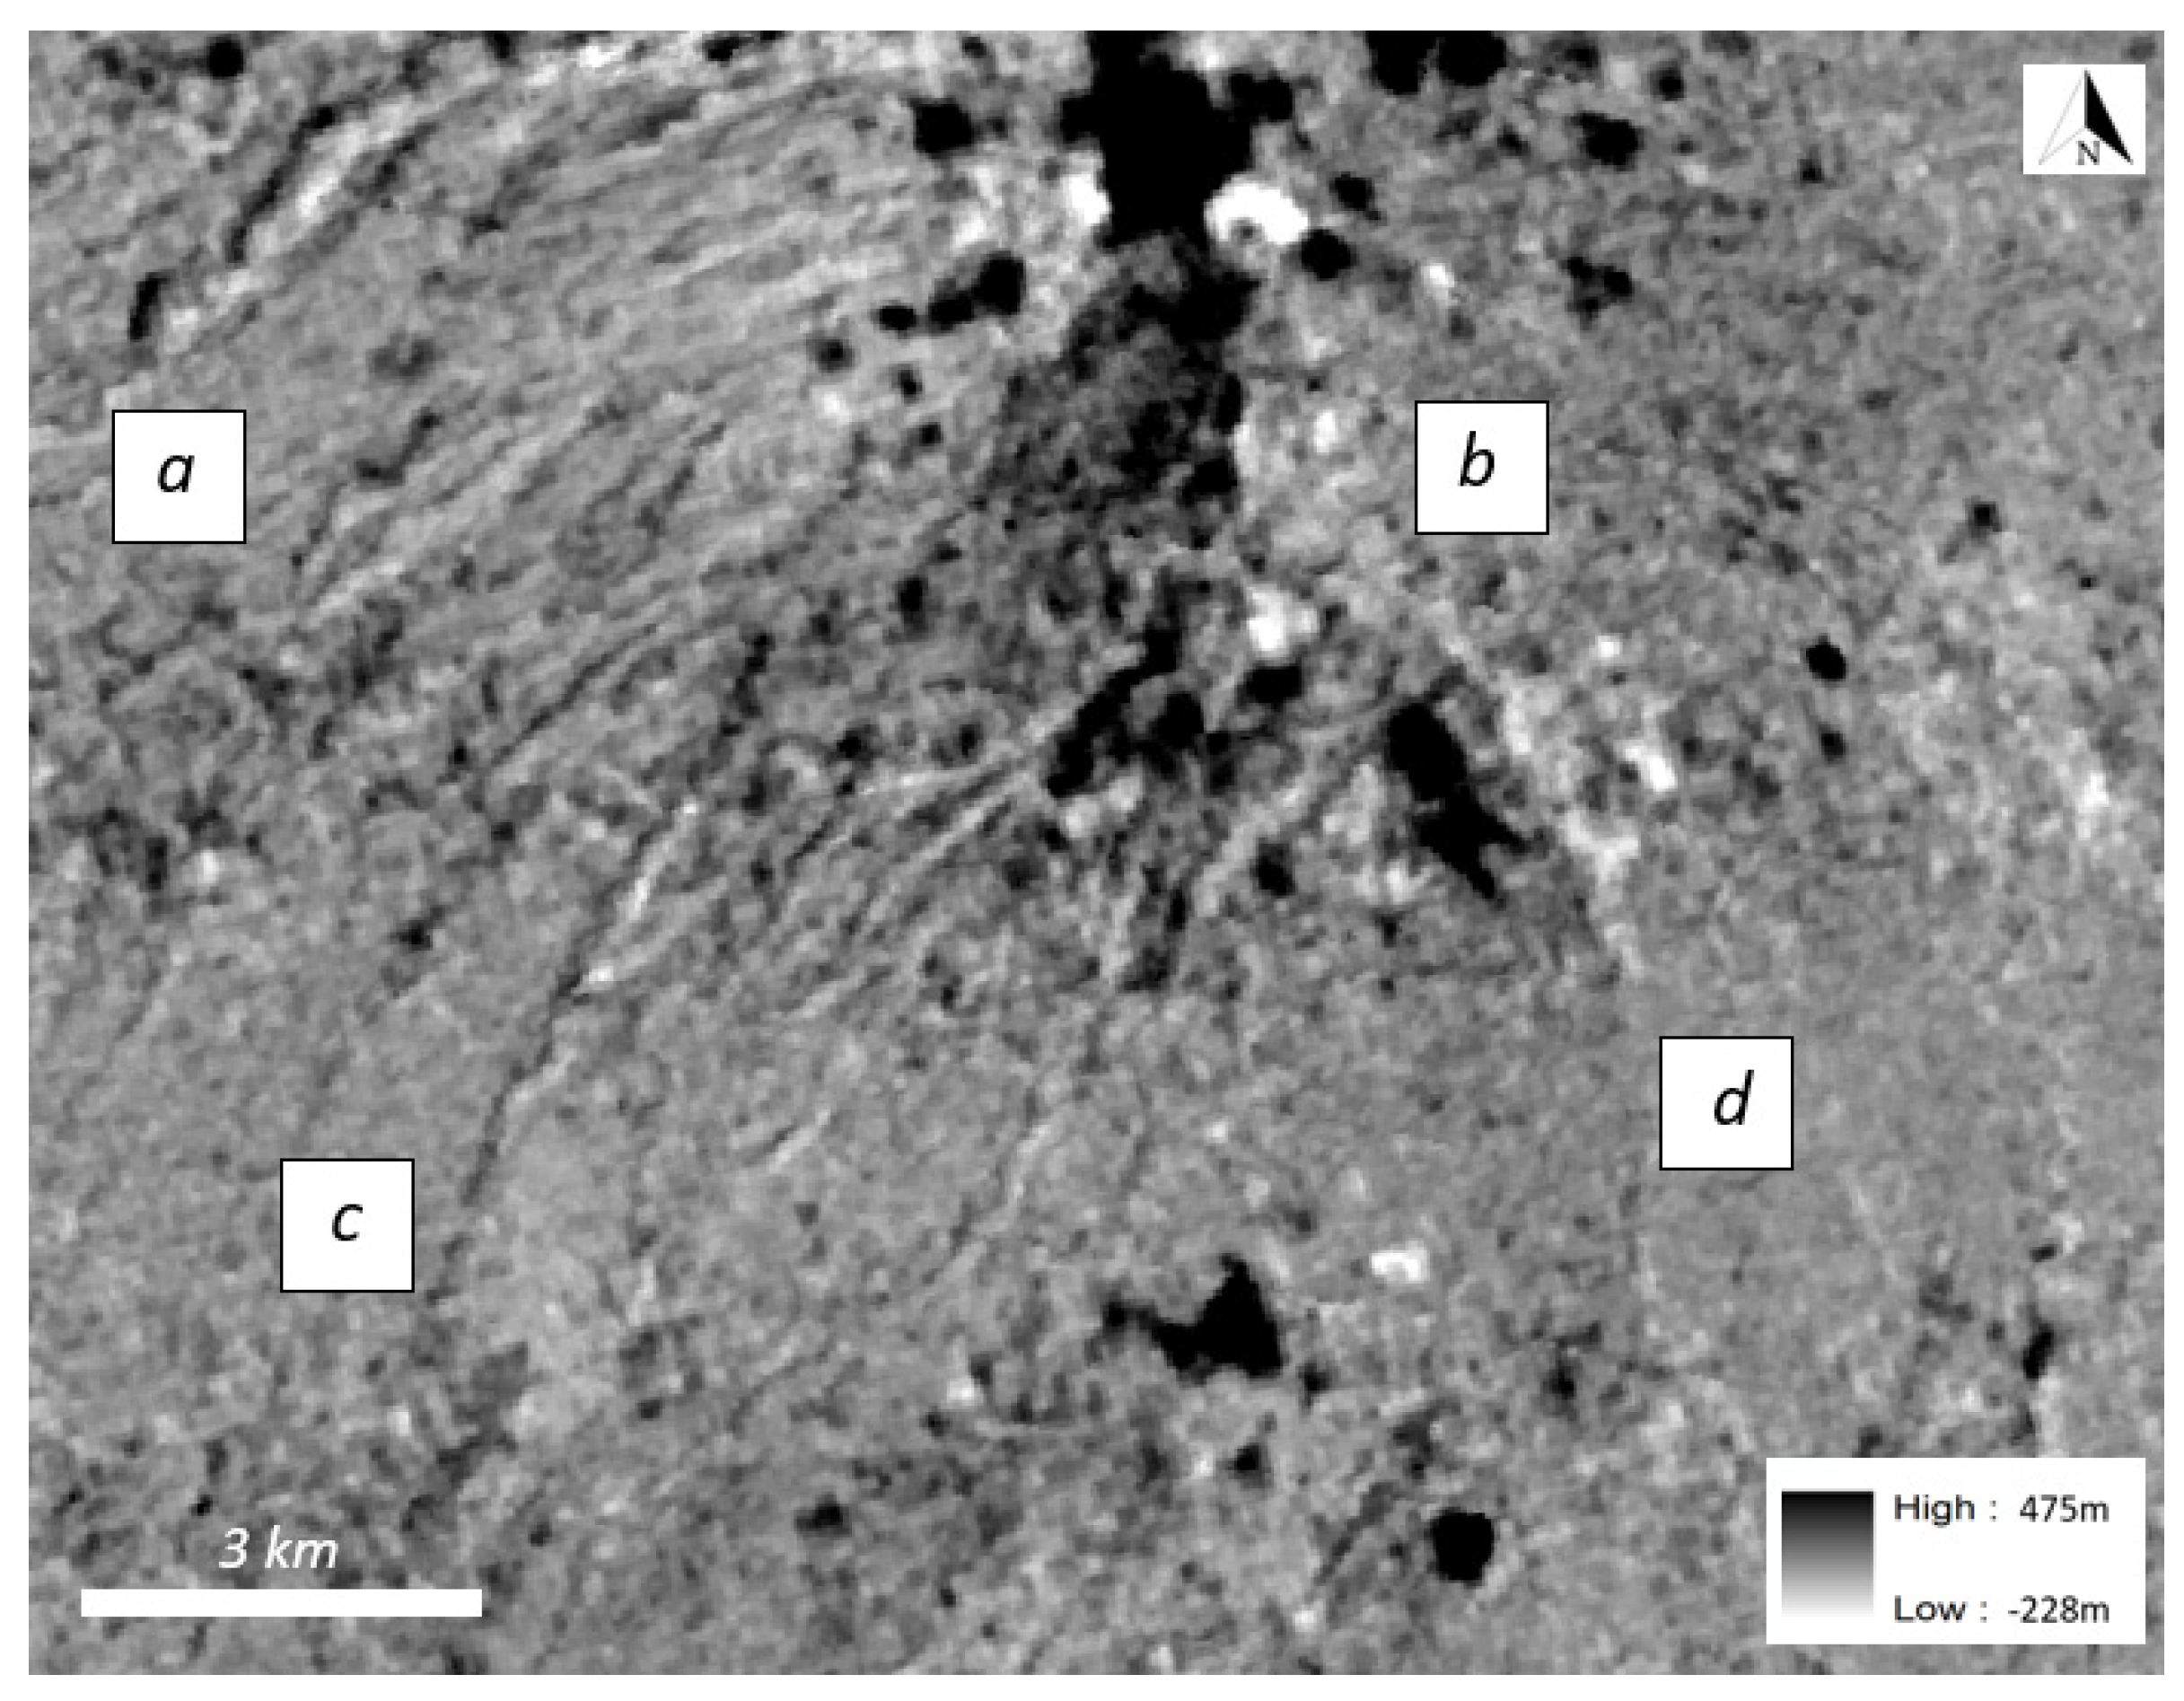
To quantify the impact of this DEM topographic error on the model, the single-scene DEM data were subtracted from the GDEM data (Figure 7). The minor cloud cover around the summit created positive topographic errors as high as 475 m above the baseline, whereas shadows from these clouds caused negative errors as low as 238 m below. To determine the average difference between the GDEM and the single-scene DEM, four 1 km2 regions of interest (ROI) were chosen in areas of relatively consistent terrain that were free of clouds and cloud shadows. The results are shown in Table 3.
The pixel/scan line noise present in the single-scene DEM did cause artificial elevation changes that resulted in modeled flow paths that were shorter and with different routings. Although the average elevation change in the ROIs is within the estimated error, the GDEM contains less random noise and more clearly defines the barrancas. The minor amount of cloud cover in the single-scene DEM, however, did not have a significant impact on the individual model run. This despite the clouds/shadows producing the extremes in the difference image, which are significantly outside ASTER DEM error estimates [30].
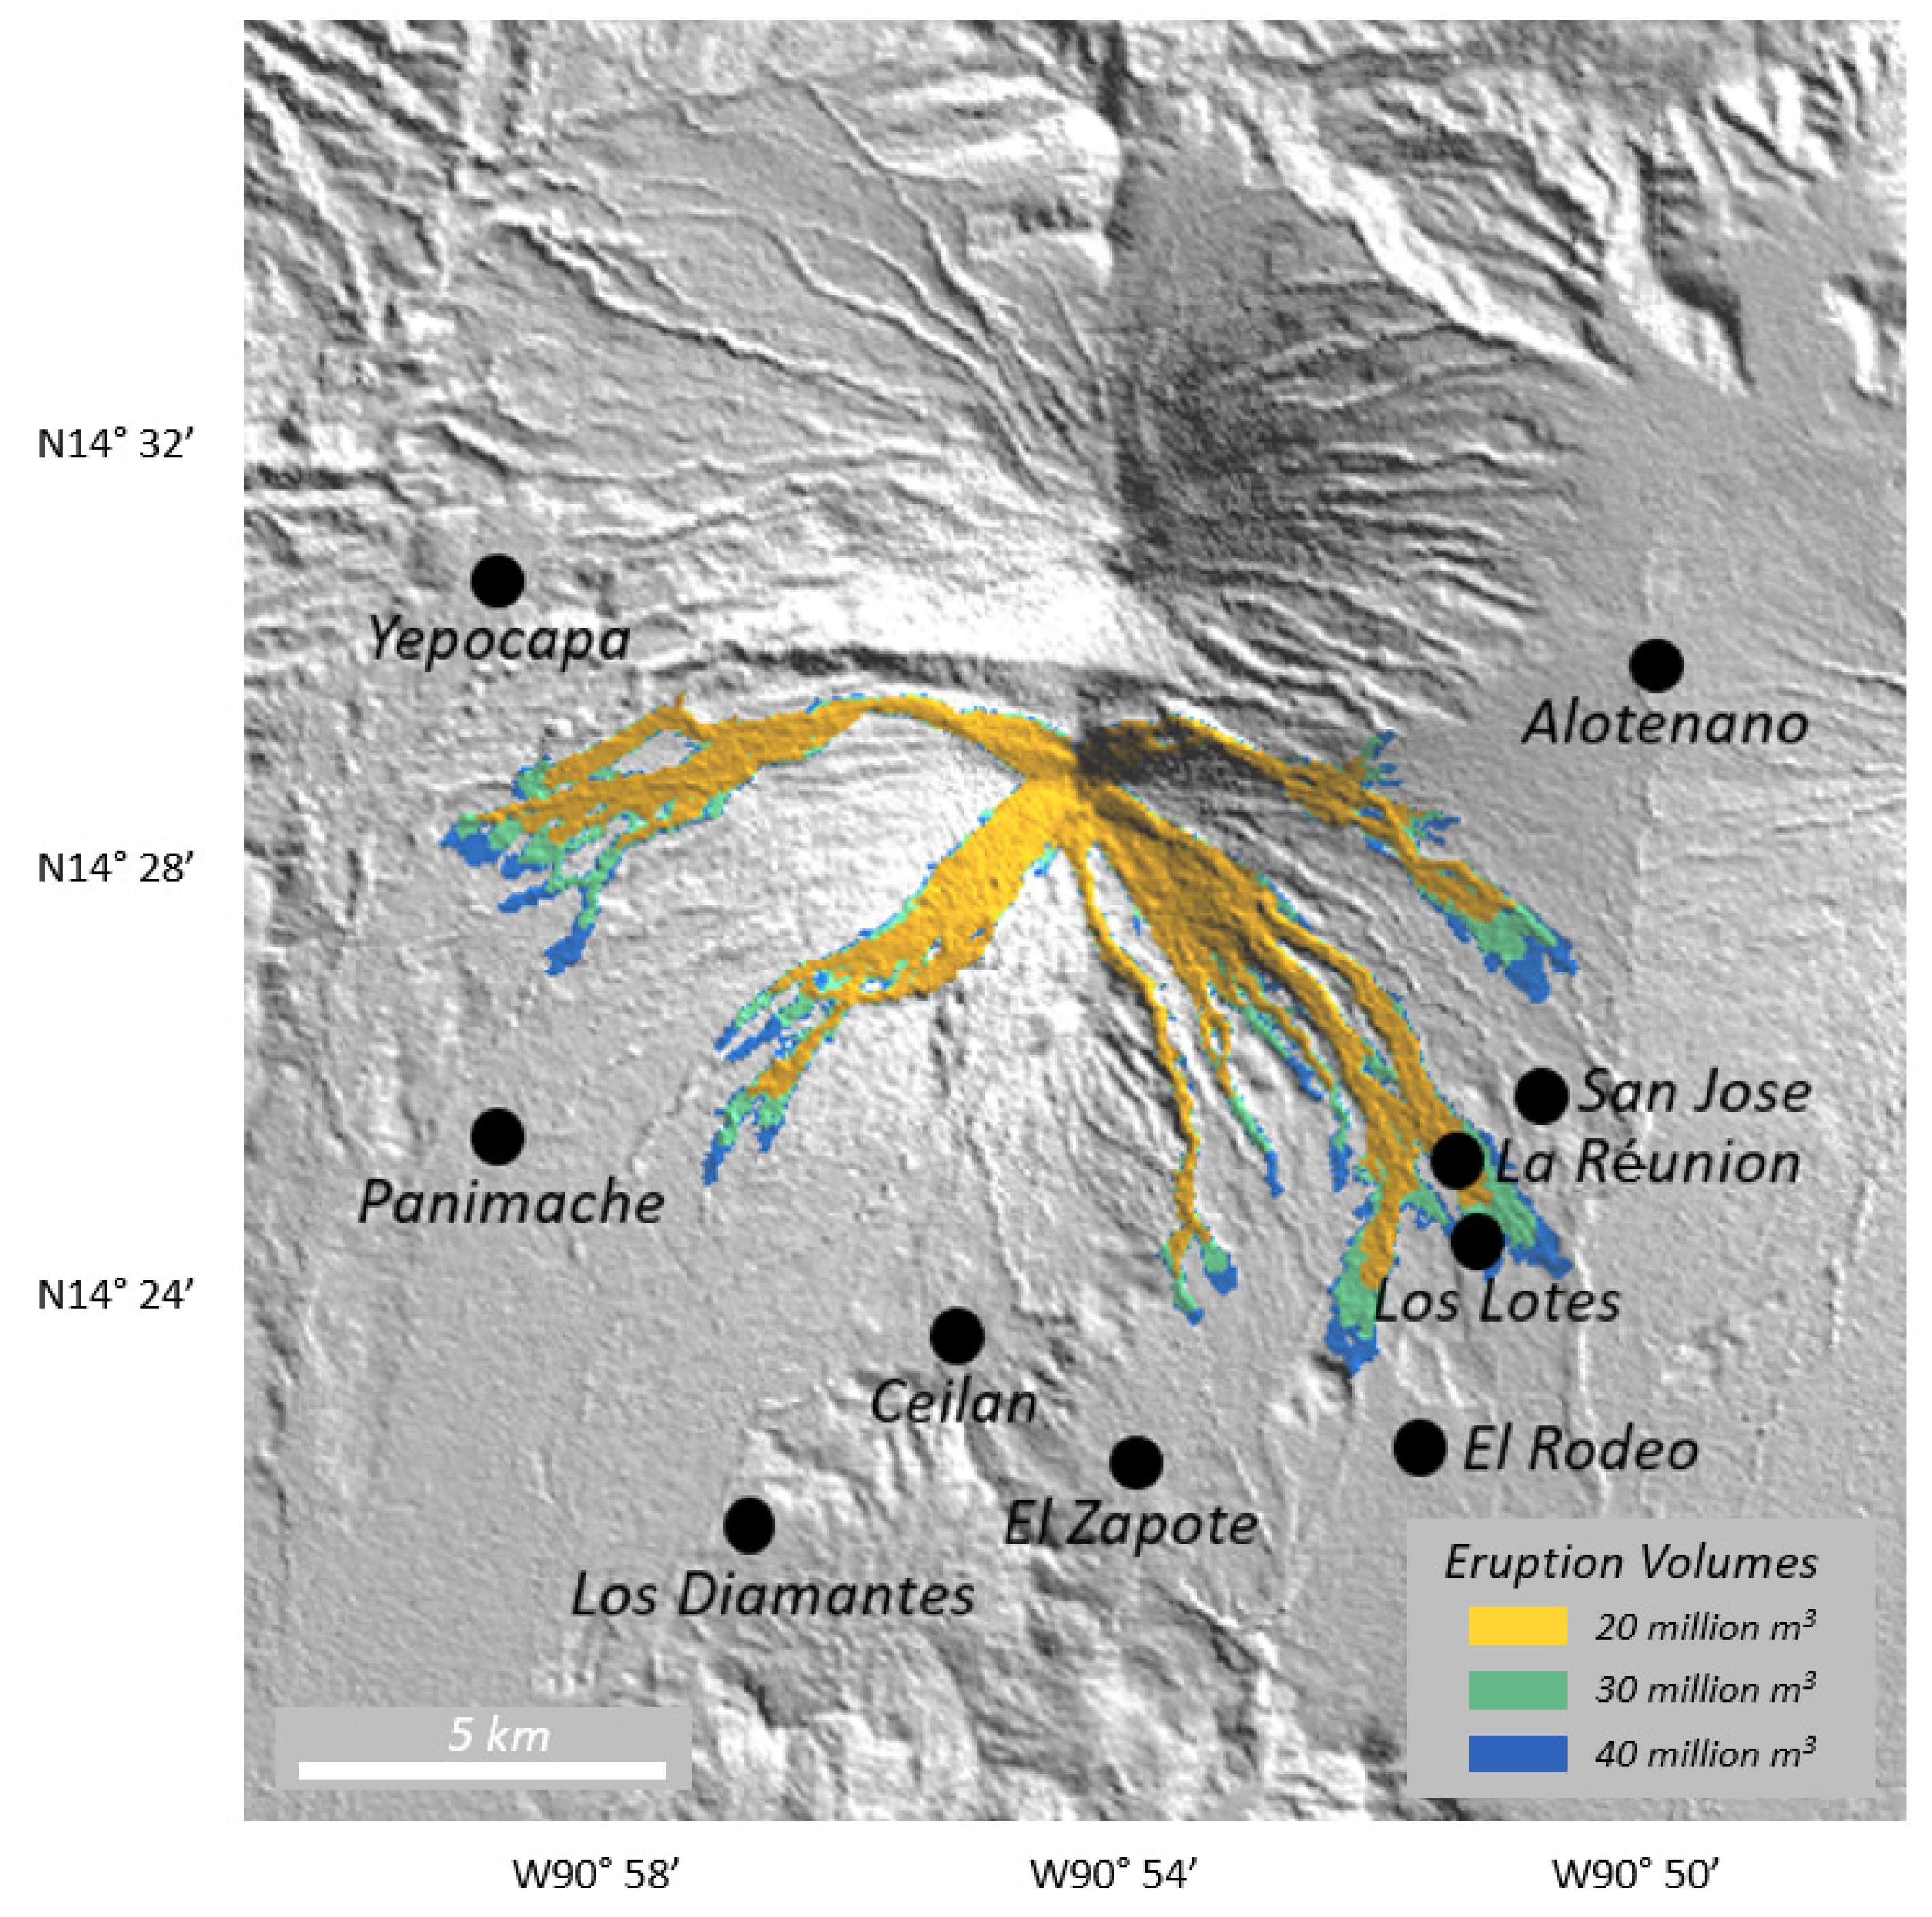
VolcFlow was next run using the GDEM for three increasing volumes to produce a generalized hazard map (Figure 8). For this facet of the analysis, the summit location and elevation were used for the model starting point. The hazard map tends to follow topographic lows as expected. Slight deviations from these occur where the forward momentum of the modeled flow approaches zero and/or where the flows extend beyond the confines of a topographic low. Model results with higher eruptive volumes do increase the potential risk to communities further from the summit of Fuego, as would be expected. The maximum modeled runout distance for a 40 × 106 m3 volume flow is ~10 km from the summit, for example. However, even the smallest volume produces modeled flows that reach the two population centers (Los Lotes and the La Réunion resort) that were directly impacted by the 3 June 2018, eruption, confirming the usefulness of this simplified approach (Figure 8).

4. Discussion

Satellite-based remote sensing is an effective method for observing synoptic volcanic activity, including eruptions and eruptive precursors (e.g., [12,17,41]). However, sensors with the higher spatial resolution needed to resolve smaller-scale details commonly have poorer temporal resolution, which can result in events being missed. In contrast, those with a higher temporal cadence, such as MODIS or the Advanced Very-High-Resolution Radiometer (AVHRR), needed for capturing all phases of an eruption, have much lower spatial resolution that precludes resolving details, such as accurate flow dimensions and direction. Direct ground-based observations (where possible) of volcanic deposits following an eruption do provide a much greater understanding of the event (e.g., [42,43]). However, where continuous ground observations are not feasible, reliance on local monitoring groups/agencies and activity reports are helpful. Having ground reports available from INSIVUMEH to validate the remote sensing data used here, for example, was important for this study. However, both the ASTER data and INSIVUMEH reports do have limitations.
ASTER has an average temporal resolution of ~8 days for Fuego, which is higher than the reported value of ~16 days [16]. The higher volume of ASTER TIR data was possible because of the presence of the ASTER Urgent Request Protocol (URP) program [44,45]. The URP integrates ASTER into a sensor web architecture, being triggered by thermal detections from MODIS. These triggers, which happen continuously during a larger eruption, produce dozens more scheduling requests for ASTER data. By providing higher temporal, high spatial resolution TIR data, the URP program becomes an important tool for monitoring volcanic trends. However, even with this improved temporal cadence, volcanic events can still be missed entirely and/or only partially captured if an eruptive product (e.g., lava flow or PDC deposit) cools to become undetectable in the TIR wavelength region. We believe this influenced our PDC measured lengths somewhat resulting in slightly shorter average values.
The ability to remotely observe these volcanic products in the TIR data at a high spatial resolution is critical to this study. Without the high spatial resolution and accurate radiometric resolution of the ASTER TIR data, it would be impossible to determine the flow direction and deposit type produced from each eruption. The only other publicly available TIR data near this spatial scale and acquired over a long time period are the data from the Landsat satellites. In the past, the Landsat TIR data were not routinely acquired at night, although this is becoming more common for volcanic and fire activity. The Landsat TIR data do not have the ability to point off-nadir as ASTER TIR does, which decreases the time between observations. Furthermore, the limit of one or two TIR spectral bands, depending on the Landsat TIR instrument design and/or the health of that instrument, fundamentally reduces the accuracy of derived temperatures from those data. Despite those limitations, a long-term TIR study, such as this one, conducted at other volcanoes, could be augmented by Landsat data over the same time period studied or extended earlier in time using Landsat TIR data acquired before 2000.
The Naismith et al. (2019) study concluded that starting in 2015 Fuego entered a new period of increased activity that produces more lava flows and PDCs [7]. This was partially concluded using the MIROVA monitoring system, an automatic volcanic hotspot detection system based on the 1 km TIR data from MODIS [46]. Based on our analysis of the ASTER archive, we see a ~50% rise in the number of scenes containing elevated thermal data (e.g., lava flows, PDCs, and lahars) beginning in 2015, which supports the findings of Naismith et al. (2019).
Satellite remote sensing of volcanic activity is not without limitations and whenever possible should be collaborated with ground reports. However, INSIVUMEH reports also have limitations. Nine events identified as potential lava flows or PDCs were observed with ASTER but had no corresponding INSIVUMEH report. This could be due to a number of factors, such as the summit being obscured by clouds or the event being too small for ground observers to see. Furthermore, on the morning of the 2018 eruption, authorities announced that the volcano “looked fine”. These human-induced limitations emphasize the usefulness of data synthesis between satellite and human monitoring at Fuego, each at different time and spatial scales, to provide a much more accurate chronology of the volcanic activity over the study period. The nearly 15 years of ASTER TIR data of Fuego volcano compared to and validated by the INSIVUMEH ground reports indicate that the most common PDC flow direction is to the south, closely followed by flows to the southwest and southeast. This information, combined with continued TIR data and DEM collections, can be used in future developments of disaster response and mitigation plans for the local monitoring agencies.
VolcFlow can model PDCs, avalanches, and lava flows assuming the material property values (e.g., density and cohesion) are available and accurate. These properties are difficult to calculate directly from remote sensing data. For this study, values from prior VolcFlow modeling studies of PDCs were used; however, these could be refined with laboratory analysis of samples from the June 3 flow. The estimated volume of the PDC used in the study came from Naismith et al. (2019) and is consistent with previous eruptions of Fuego [8]. However, a thorough field campaign and more accurate pre-eruption DEM would provide more accurate constraints on the volume of material erupted.
A second important model input for VolcFlow is the pre-flow DEM [35]. For this study, two versions of DEMs generated by the ASTER instrument were used. The stated vertical accuracy of the ASTER GDEM product is 20 m, better than a single-scene DEM accuracy of 30 m. The GDEM achieves this improved accuracy and reduction in pixel to pixel noise through averaging large numbers of single-scene DEMs acquired over time. This can create constraints for flow modeling. First, version 2 of the GDEM uses scenes from 2000–2011. Therefore, any topographic changes within this time period are lost. However, if no major topographic changes have occurred, as with Fuego, its use is appropriate. A version 3 GDEM was recently released which uses data from 2000–2013. It was released too late to be incorporated into this study, however the differences between it and version 2 at Fuego were assessed to be negligible. Version 3 contains only minor fixes, such as filling of holes. Second, to account for any significant topographic change, a model requires the most recent (and most accurate) DEM. The use of a single-scene DEM closest in time to an event is potentially more appropriate than using the GDEM. However, as seen by our analysis of the single-scene DEM, the amount of noise and topographic anomalies can adversely impact the modeling in certain locations (Figure 6b).
The ultimate goal of this study was not to create a model output that precisely matched the June 2018 deposit, nor assess whether VolcFlow is the appropriate flow model for this particular PDC emplacement. To achieve a more accurate fit with the VolcFlow model, its input parameters could be varied iteratively, and the subsequent output assessed. Rather, we wanted to examine the accuracy of the different ASTER-derived DEMs and their appropriateness in future modeling efforts. For this purpose, the VolcFlow model was chosen and run with a set of standard input parameters used in prior studies and the results compared using those two DEM products.
VolcFlow modeling using the GDEM was able to replicate the flow length, however there were notable differences. These are likely due to the constraints of the model to fully replicate all components of a PDC, the chosen starting location for the modeling, as well as the resolution of the DEM itself. For example, the model results show the deposit being emplaced into several barrancas, yet nearly all the material was concentrated into one barranca during the 2018 eruption. This higher volume emplaced into one barranca is likely the reason that the PDC overran the barranca walls in two locations downslope. Progressive infilling of the barranca by PDC material changed the depth in near real time, which was not resolved in the DEM. In addition, initiating the model at the summit (with a starting velocity of 0) is likely not accurate if the PDC initiated at a higher elevation from partial column collapse. The modeled results are therefore shorter (as we see in our results). Model results using the single-scene DEM presented other problems. Noise variations in the data resulted in minor random elevation anomalies from one pixel to the next that directly impacted the flow’s progression in the modeling. This produced results showing the PDC material dispersed laterally over a larger area higher on the slopes before becoming confined to multiple barrancas. The PDCs, therefore, did not travel as far as the population centers affected by the 3 June 2018, eruption. Although not a factor for this study, more extreme topography errors caused by the presence of cloud and cloud shadow in a scene would also affect the model output even more and should be considered where using individual ASTER scene DEMs for future studies. If, for example, there has been significant topographic changes at the volcano under study, the GDEM would not be an appropriate choice for a flow model. Although not employed here, some of the random noise present in these DEMs can be lessened with image smoothing and noise removal algorithms making the single scene DEM potentially more useful.
Volcano-wide hazard modeling of PDC-forming eruptions shows that population centers in close proximity to the barrancas to the southeast of Fuego (e.g., Los Lotes, San Jose, and El Rodeo) are at higher risk during larger paroxysmal eruptions. During the 3 June 2018, eruption, a PDC formed, flowed down Las Lajas barranca, and later exited it at two locations destroying both the La Réunion resort and the community of Los Lotes. These two locations are within the modeled flow hazard map for an eruption similar in size to the 3 June 2018, event. Because of the barranca-exiting risk of future large PDCs, any population center within 2 km of a barranca does have a higher risk during eruptions. However, it is outside the current ability of the VolcFlow model to recreate these more complex barranca-departure events. The most likely scenario is that these barrancas become infilled down-valley either by ongoing erosion during the rainy seasons or from the deposition of new material during the early stages of an eruption, thus changing the depth profile. Modeling future hazards at Fuego will benefit from more accurate and more frequently updated DEMs. For example, dedicated field campaigns following eruptions and flow emplacement using either drone-based LIDAR or structure from motion images could create updated DEMs over the areas of change, which could be used to augment the larger ASTER GDEM for more accurate modeling of future flow hazards.

5. Conclusions

Orbital ASTER TIR data refined using summary reports from INSIVUMEH provided detailed information on the recent PDC travel directions at Fuego volcano. Although the reports provided insights into the deposit type and specific barranca occupied, the resolution of the ASTER data over 15 years, resolved the activity and specific flow events. This study would have been less accurate without either the reports or the high spatial resolution TIR data acquired with improved temporal frequency enabled by the ASTER URP Program.
Despite the June 2018 PDC-forming eruption at Fuego occurring seven years after the data used to create the GDEM, it was found to be more appropriate and accurate for modeling the general trends of the flow produced by that eruption. Any topographic changes that did occur from 2011 to 2018 were small enough in comparison to the increased noise present in the single-scene DEM. However, this may not be the case at other volcanoes, especially those with significant topographic changes since 2011. A similar approach is easily adaptable to other volcanoes where the observer reporting may or may not be available and/or incorporating TIR data from Landsat. For any modeling effort integrated into those studies, the choice of flow model and the DEM are important factors. The ability of ASTER to provide several DEM products globally and over time make it the best option for most cases. However, the differences in the DEM products (e.g., the single-scene versus the GDEM) and the impact on the flow model’s uncertainty must be considered.
Despite the lack of a precise match between the model output and the June 2018 deposit, the historical tendency of flow directions as seen in the ASTER data analysis supports the VolcFlow model results, which identifies the risk to the surrounding population centers. The conditions leading to the two barranca-departure events were beyond the modeling and the DEM resolution. These events are what caused a majority of the fatalities and therefore require further analysis with more sophisticated modeling and progressively updated, higher-resolution DEMs. Despite this limitation, the generalized PDC hazard map with a PDC volume similar to that of the June 2018 volume identifies the population centers of La Réunion and Los Lotes as at-risk areas. With Fuego possibly now in a period of increased volcanic activity, the results of this study are important to potentially help mitigate future PDC disasters. As ASTER ages, similarly-conducted studies will benefit from a continuation of future TIR data with specifications equal to or improved from that of ASTER.

Author Contributions

The following contributions were provided by each author: Conceptualization, I.T.W.F.; Data curation, I.T.W.F. and M.S.R.; Formal analysis, I.T.W.F.; Funding acquisition, M.S.R.; Investigation, I.T.W.F.; Methodology, I.T.W.F. and M.S.R.; Project administration, M.S.R.; Resources, M.S.R.; Supervision, M.S.R.; Validation, M.S.R. and I.T.W.F.; Visualization, I.T.W.F. and M.S.R.; Writing—original draft, I.T.W.F.; Writing—review & editing, I.T.W.F. and M.S.R. All authors have read and agreed to the published version of the manuscript.

Funding

This work was supported by the NASA Science of Terra and Aqua Program (80NSSC18K1001).

Acknowledgments

The authors would like to thank INSIVUMEH for the monitoring reports and CONRAD for their response to and reporting of this volcanic crisis. We hope that the findings of this study are helpful to them and others in preparing for future volcanic events. We would also like to thank the IVIS lab group, specifically James Thompson and Daniel Williams, for their support and guidance with this research.

Conflicts of Interest

The authors declare no conflict of interest.

References

  1. Tilling, R.I.; Lipman, P.W. Lessons in Reducing Volcano Risk. Nature 1993, 364, 277–280. [Google Scholar] [CrossRef]
  2. Auker, M.R.; Sparks, R.S.J.; Siebert, L.; Crosweller, H.S.; Ewert, J. A Statistical Analysis of the Global Historical Volcanic Fatalities Record. J. Appl. Volcanol. 2013, 2, 1–24. [Google Scholar] [CrossRef] [Green Version]
  3. Bernard, J.; Kelfoun, K.; Le Pennec, J.L.; Vallejo Vargas, S. Pyroclastic Flow Erosion and Bulking Processes: Comparing Field-Based vs. Modeling Results at Tungurahua Volcano, Ecuador. Bull. Volcanol. 2014, 76, 1–16. [Google Scholar] [CrossRef]
  4. Bryant, E.A. Natural Hazards; Cambridge University Press: New York, NY, USA, 1991; p. 294. [Google Scholar]
  5. Lacroix, A. La Montagne Pelé et Ses Eruptions; Masson et Cie: Paris, France, 1904; pp. 1–662. [Google Scholar]
  6. Sparks, R.S.J.; Wilson, L. A Model for the Formation of Ignimbrite by Gravitational Column Collapse. J. Geol. Soc. Lond. 1976, 132, 441–451. [Google Scholar] [CrossRef]
  7. Naismith, A.K.; Matthew Watson, I.; Escobar-Wolf, R.; Chigna, G.; Thomas, H.; Coppola, D.; Chun, C. Eruption Frequency Patterns through Time for the Current (1999–2018) Activity Cycle at Volcán de Fuego Derived from Remote Sensing Data: Evidence for an Accelerating Cycle of Explosive Paroxysms and Potential Implications of Eruptive Activity. J. Volcanol. Geotherm. Res. 2019, 371, 206–219. [Google Scholar] [CrossRef] [Green Version]
  8. Escobar Wolf, R. Volcanic Processes and Human Exposure as Elements to Build a Risk Model for Volcan de Fuego, Guatemala; Michigan Technological University: Houghton, MI, USA, 2013. [Google Scholar]
  9. Bonis, S.; Salazar, O. The 1971 and 1973 Eruptions of Volcán Fuego, Guatemala, and Some Socio-Economic Considerations for the Volcanologist. Bull. Volcanol. 1973, 37, 394–400. [Google Scholar] [CrossRef]
  10. Ramsey, M.S.; Harris, A.J.L. Volcanology 2020: How Will Thermal Remote Sensing of Volcanic Surface Activity Evolve over the next Decade? J. Volcanol. Geotherm. Res. 2013, 249, 217–233. [Google Scholar] [CrossRef]
  11. Pieri, D.; Abrams, M. ASTER Watches the World’s Volcanoes: A New Paradigm for Volcanological Observations from Orbit. J. Volcanol. Geotherm. Res. 2004, 135, 13–28. [Google Scholar] [CrossRef]
  12. Reath, K.; Pritchard, M.E.; Moruzzi, S.; Alcott, A.; Coppola, D.; Pieri, D. The AVTOD (ASTER Volcanic Thermal Output Database) Latin America Archive. J. Volcanol. Geotherm. Res. 2019, 376, 62–74. [Google Scholar] [CrossRef] [Green Version]
  13. Blackett, M. An Overview of Infrared Remote Sensing of Volcanic Activity. J. Imaging 2017, 3, 13. [Google Scholar] [CrossRef]
  14. Pardini, F.; Queißer, M.; Naismith, A.; Watson, I.M.; Clarisse, L.; Burton, M.R. Initial Constraints on Triggering Mechanisms of the Eruption of Fuego Volcano (Guatemala) from 3 June 2018 Using IASI Satellite Data. J. Volcanol. Geotherm. Res. 2019, 376, 54–61. [Google Scholar] [CrossRef]
  15. Aldeghi, A.; Carn, S.; Escobar-Wolf, R.; Groppelli, G. Volcano Monitoring from Space Using High-Cadence Planet CubeSat Images Applied to Fuego Volcano, Guatemala. Remote Sens. 2019, 11, 2151. [Google Scholar] [CrossRef] [Green Version]
  16. Yamaguchi, Y.; Kahle, A.B.; Tsu, H.; Kawakami, T.; Pniel, M. Overview of Advanced Spaceborne Thermal Emission and Reflection Radiometer (ASTER). IEEE Trans. Geosci. Remote Sens. 1998, 36, 1062–1071. [Google Scholar] [CrossRef] [Green Version]
  17. Carter, A.; Ramsey, M. Long-Term Volcanic Activity at Shiveluch Volcano: Nine Years of ASTER Spaceborne Thermal Infrared Observations. Remote Sens. 2010, 2, 2571–2583. [Google Scholar] [CrossRef] [Green Version]
  18. Gillespie, A.; Rokugawa, S.; Matsunaga, T.; Cothern, J.S.; Hook, S.; Kahle, A.B. A Temperature and Emissivity Separation Algorithm for Advanced Spaceborne Thermal Emission and Reflection Radiometer (ASTER) Images. IEEE Trans. Geosci. Remote Sens. 1998, 36, 1113–1126. [Google Scholar] [CrossRef]
  19. Varner, L.-A.; Charbonnier, S.-J.; Escobar-Wolf, R.-P.; Rodriguez, L.-A.; Chigna, G.; Chun, C.; Gonzalez, D.; Juarez, F.; Merida, R.; Calder, E.; et al. Unravelling the Dynamics and Hazards of the June 3$^{rd}$, 2018 Pyroclastic Currents at Fuego Volcano (Guatemala): A Multi-Parameter Approach. In AGU Fall Meeting Abstracts; AGU: Washington, DC, USA, 2019; Volume 2019, p. V13E-0229. [Google Scholar]
  20. Lyons, J.J.; Waite, G.P.; Rose, W.I.; Chigna, G. Patterns in Open Vent, Strombolian Behavior at Fuego Volcano, Guatemala, 2005–2007. Bull. Volcanol. 2009, 72, 1. [Google Scholar] [CrossRef]
  21. Chesner, C.A.; Rose, W.I. Geochemistry and Evolution of the Fuego Volcanic Complex, Guatemala. J. Volcanol. Geotherm. Res. 1984, 21, 25–44. [Google Scholar] [CrossRef]
  22. Carr, M.J.; Patino, L.C.; Feigenson, M.D. Petrology and geochemistry of lavas. Cent. Am. Geol. Resour. Hazards 2002, 1, 565–590. [Google Scholar]
  23. Hutchison, A.A.; Cashman, K.V.; Williams, C.A.; Rust, A.C. The 1717 Eruption of Volcán de Fuego, Guatemala: Cascading Hazards and Societal Response. Quat. Int. 2016, 394, 69–78. [Google Scholar] [CrossRef]
  24. Volcano Global Risk Identification & Analysis Project (VOGRIPA), 2018. Available online: http://www.bgs.ac.uk/vogripa/index.cfm (accessed on 12 July 2018).
  25. Kelfoun, K.; Druitt, T.H. Numerical Modeling of the Emplacement of Socompa Rock Avalanche, Chile. J. Geophys. Res. Solid Earth 2005, 110, 1–13. [Google Scholar] [CrossRef]
  26. Kelfoun, K.; Samaniego, P.; Palacios, P.; Barba, D. Testing the Suitability of Frictional Behaviour for Pyroclastic Flow Simulation by Comparison with a Well-Constrained Eruption at Tungurahua Volcano (Ecuador). Bull. Volcanol. 2009, 71, 1057–1075. [Google Scholar] [CrossRef]
  27. ASTER Validation Team (AVT). ASTER Global DEM Validation Summary Report; report no. 28; The Ministry of Economy, Trade and Industry (METI) and the National Aeronautics and Space Administration (NASA): Washington, DC, USA, 2009. [Google Scholar]
  28. Cando-Jácome, M.; Martínez-Graña, A. Determination of Primary and Secondary Lahar Flow Paths of the Fuego Volcano (Guatemala) Using Morphometric Parameters. Remote Sens. 2019, 11, 727. [Google Scholar] [CrossRef] [Green Version]
  29. Abrams, M. The Advanced Spaceborne Thermal Emission and Reflection Radiometer (ASTER): Data Products for the High Spatial Resolution Imager on NASA’s Terra Platform. Int. J. Remote Sens. 2000, 21, 847–859. [Google Scholar] [CrossRef]
  30. Fujisada, H.; Bailey, G.B.; Kelly, G.G.; Hara, S.; Abrams, M.J. ASTER DEM performance. IEEE Trans. Geosci. Remote Sens. 2005, 43, 2707–2714. [Google Scholar] [CrossRef]
  31. Hirano, A.; Welch, R.; Lang, H. Mapping from ASTER Stereo Image Data: DEM Validation and Accuracy Assessment. ISPRS J. Photogramm. Remote Sens. 2003, 57, 356–370. [Google Scholar] [CrossRef]
  32. Crippen, R.E. Global Topographical Exploration and Analysis with the SRTM and ASTER Elevation Models. Geol. Soc. Spec. Publ. 2010, 345, 5–15. [Google Scholar] [CrossRef]
  33. Tachikawa, T.; Hato, M.; Kaku, M.; Iwasaki, A. Characteristics of ASTER GDEM Version 2. Int. Geosci. Remote Sens. Symp. 2011, 3657–3660. [Google Scholar] [CrossRef]
  34. Tachikawa, T.; Kaku, M.; Iwasaki, A.; Gesch, D.B.; Oimoen, M.J.; Zhang, Z.; Danielson, J.J.; Krieger, T.; Curtis, B.; Haase, J.; et al. ASTER Global Digital Elevation Model Version 2- Summary of Validation Results; NASA: Washington, DC, USA, 2011. [CrossRef]
  35. Constantinescu, R.; Thouret, J.C.; Irimuş, I.A. Computer Modeling as Tool for Volcanic Hazards Assessment: An Example of Pyroclastic Flow Modeling at El Misti Volcano, Southern Peru. Geogr. Tech. 2011, 2, 1–14. [Google Scholar]
  36. Kover, T.P. Application of a Digital Terrain Model for the Modeling of Volcanic Flows: A Tool for Volcanic Hazard Determination. Ph.D. Thesis, State University of New York at Buffalo, Buffalo, NY, USA, 1995. [Google Scholar]
  37. Pitman, E.B.; Nichita, C.C.; Patra, A.; Bauer, A.A.; Sheridan, M.; Bursik, M. Computing Debris Flows and Landslides. Phys. Fluids 2003, 15, 3638–3646. [Google Scholar] [CrossRef] [Green Version]
  38. Charbonnier, S.; Germa, A.; Connor, C.; Connor, L.; Dixon, T. The 2010 Pyroclastic Density Currents of Merapi Volcano, Central Java, Indonesia. EGUGA 2013, 15, 6629. [Google Scholar]
  39. Ogburn, S.E.; Calder, E.S. The Relative Effectiveness of Empirical and Physical Models for Simulating the Dense Undercurrent of Pyroclastic Flows under Different Emplacement Conditions. Front. Earth Sci. 2017, 5. [Google Scholar] [CrossRef] [Green Version]
  40. World Bank. Concatenated Volcanic Hazards Fuego Volcano Crisis, 3rd ed.; World Bank: Washington, DC, USA, 2018. [Google Scholar]
  41. Reath, K.A.; Ramsey, M.S.; Dehn, J.; Webley, P.W. Predicting Eruptions from Precursory Activity Using Remote Sensing Data Hybridization. J. Volcanol. Geotherm. Res. 2016, 321, 18–30. [Google Scholar] [CrossRef]
  42. Naranjo, M.F.; Ebmeier, S.K.; Vallejo, S.; Ramón, P.; Mothes, P.; Biggs, J.; Herrera, F. Mapping and Measuring Lava Volumes from 2002 to 2009 at El Reventador Volcano, Ecuador, from Field Measurements and Satellite Remote Sensing. J. Appl. Volcanol. 2016, 5, 1. [Google Scholar] [CrossRef] [Green Version]
  43. Worden, A.; Dehn, J.; Ripepe, M.; Donne, D.D. Frequency Based Detection and Monitoring of Small Scale Explosive Activity by Comparing Satellite and Ground Based Infrared Observations at Stromboli Volcano, Italy. J. Volcanol. Geotherm. Res. 2014, 283, 159–171. [Google Scholar] [CrossRef] [Green Version]
  44. Duba, K.A.; Ramsey, M.; Wessels, R.; Dehn, J. Optical Satellite Volcano Monitoring: A Multi-Sensor Rapid Response System. Geosci. Remote Sens. 2009, 473–496. [Google Scholar] [CrossRef] [Green Version]
  45. Ramsey, M.S. Synergistic Use of Satellite Thermal Detection and Science: A Decadal Perspective Using ASTER. Geol. Soc. Spec. Publ. 2016, 426, 115–136. [Google Scholar] [CrossRef] [Green Version]
  46. Coppola, D.; Laiolo, M.; Cigolini, C.; Donne, D.D.; Ripepe, M. Enhanced Volcanic Hot-Spot Detection Using MODIS IR Data: Results from the MIROVA System. Geol. Soc. Lond. Spec. Publ. 2016, 426, 181–205. [Google Scholar] [CrossRef]
Figure 1. Google Earth image of Fuego volcano annotated to show the seven primary barrancas (ravines) that are radially distributed to the west, south and east. Small lava flows, pyroclastic density currents (PDCs), and lahars are typically confined to these seven barrancas. The white stars indicate the two locations where the 3 June 2018, PDC exited the Las Lajas barranca. The two National Institute of Seismology, Volcanology, Meteorology, and Hydrology (INSIVUMEH) volcano observatories are shown by the red X marks (labeled FO1 and FO2).
Remotesensing 12 02790 g001
Figure 2. Satellite images of the La Réunion golf resort. Las Lajas barranca (outlined) lies directly to the west of the resort and golf course. (a) 7 March 2018 (prior to the eruption). (b) 14 November 2018 (~5 months after the eruption). Images from Google Earth.
Remotesensing 12 02790 g002
Figure 3. Satellite images of the village of Los Lotes, which is ~1.5 km south of the PDC exit point from Las Lajas barranca. The paved road (RN-14) serves as the primary trade route between Mexico and Guatemala [7]. The boarder of Mexico is ~150 km NW of Los Lotes. (a) 7 March 2018 (prior to the eruption). (b) 14 November 2018 (~5 months after the eruption). Images from Google Earth.
Remotesensing 12 02790 g003
Figure 4. Examples of the Advanced Spaceborne Thermal Emission and Reflection Radiometer (ASTER) thermal infrared (TIR) nighttime surface kinetic temperature product used to investigate the volcanic activity at Fuego. The thermally-elevated regions show: (a) a PDC traveling to the SW down Cenizas barranca; (b) a PDC traveling to the SE down El Jute barranca. Other thermal anomalies seen in the data include: (c) a lava flow traveling down Cenizas barranca (note the black “recovery” pixels at the summit indicating adjacent saturated pixels); (d) a grouping of thermally elevated pixels at the summit most likely caused by open-vent or dome activity. Scene subsets (ac) were validated using the INSIVUMEH reports to confirm the type of activity and direction traveled. See Figure 1 for the location of the named barrancas.
Remotesensing 12 02790 g004
Figure 5. Rose diagram showing the directionality of the PDC events over the ~15-year study period. PDC directionality was determined using both ASTER scenes and INSIVUMEH reports. Sixteen PDCs traveled southwest (Taniluya and Cenizas barrancas), 13 traveled southeast (El Jute and Las Lajas barrancas), 11 traveled south (Trinidad barranca), and 11 traveled northwest (Seca/Santa Teresa barrancas), while only 3 traveled to the northeast (Honda barranca).
Remotesensing 12 02790 g005
Figure 6. VolcFlow model result of PDC coverage for an eruptive volume of 30 × 106 m3 shown over: (a) the ASTER global digital elevation model (GDEM) version 2 product and (b) an individual ASTER scene DEM from 24 January 2018. Warmer colors indicate thicker PDC coverage estimated by the model. The dashed yellow outline in (a) is the approximate coverage area of the 3 June 2018, pyroclastic flow. Increased noise in (b) cause artificial topographic barriers that produced inaccurate model results and much shorter PDC flows.
Remotesensing 12 02790 g006
Figure 7. Difference image (ASTER GDEM minus an individual scene ASTER DEM from 24 January 2018). The extreme high and low values in this image are the result of clouds (erroneous topographic highs) and cloud shadows (erroneous topographic lows). Four regions of interest (ROI) (white boxes) were used to calculate the average difference between the two DEMs. ROI were chosen to avoid complications from the small areas of cloud cover, cloud shadow, and larger-scale topographic shadowing.
Remotesensing 12 02790 g007
Figure 8. Inundation PDC hazard map for Fuego created using VolcFlow and the ASTER GDEM. Each color represents a different PDC volume. The PDCs tend to follow the topographic lows (barrancas) with only minor deviations. Population centers that could possibly be impacted by future larger PDC events are identified. The inundation PDC hazard map indicates that both Los Lotes and La Réunion were at risk from a PDC with a volume similar to the estimate for the 3 June 2018.
Remotesensing 12 02790 g008
Table 1. Information from reports issued by OCHA, which were produced in collaboration with information provided by the National Coordinator for Disaster Reduction (CONRED), INSIVUMEH, the UN Emergency Technical Team (UNETE), the Red Cross, and other Non-Governmental Organizations. The first report was issued less than 24 h after the eruption.
Reporting PeriodAffectedEvacuatedInjuredKilledMissing
3–4 June 20181,702,13632714665-
5–7 June 20181,713,56612,4075899-
7–12 June 20181,714,37312,82357110197
12–19 June 20181,714,38712,82356111197
19–27 June 20181,714,38712,82328113197
Table 2. Primary variables used in the VolcFlow model. * denotes variables that vary during the calculations in time or in space during the model run.
VariableValueUnitReference
Gravity9.78m s −2
Basal Friction Angle0, 15, 18degreesKelfoun et al., 2009
Internal Friction Angle0 or 30degreesKelfoun et al., 2009
Flow Density1500kg m−3Kelfoun et al., 2009
Volume of pyroclastic flow materialvariesm3Naismith et al., 2019
Flow Velocity*m s−1
Ground Slope*degrees
Constant Stress5–50kPaOgburn and Calder, 2017
Table 3. Elevation values extracted for each of the ROIs shown in Figure 7.
ROIAverageMaximumMinimum
a4.4 m50 m−30 m
b2.2 m57 m−45 m
c1.4 m40 m−33 m
d0.2 m39 m−32 m

