Article

Global Forecast Impact of Low Data Latency Infrared and Microwave Sounders Observations from Polar Orbiting Satellites

1
Cooperative Institute for Meteorological Satellite Studies, University of Wisconsin–Madison, 1225 West Dayton St., Madison, WI 53706, USA
2
NOAA/JPSS Program Science Office, MD 20771, USA
*
Author to whom correspondence should be addressed.
Remote Sens. 2020, 12(14), 2193; https://doi.org/10.3390/rs12142193
Submission received: 27 May 2020 / Revised: 17 June 2020 / Accepted: 7 July 2020 / Published: 9 July 2020

Abstract

:
The Direct Broadcast Network (DBNet) provides near-real-time delivery of low-earth-orbiting (LEO) meteorological satellites to operational numerical weather prediction (NWP) systems that need short data cut-off times to allow for the assimilation of the most recent satellite measurements. The NWP model requires timely delivery of observations including atmospheric temperature, humidity, and surface wind vectors. The World Meteorological Organization (WMO) Space Program (WSP) recommends the data latency of no more than 20 min for the satellite measurements. Currently, not all DBNet stations are delivering satellite data within the 20-min time frame. In this study, the forecast impact of the observations of LEO satellite sounders with data latency of 20 min or less was evaluated using the National Centers for Environmental Prediction (NCEP) Global Forecast System (GFS). Reducing the data latency up to 5 min increases the number of LEO infrared (IR) and microwave (MW) sounder observations delivered to the NCEP GFS data assimilation system by more than 20%. Overall, this study demonstrates a positive impact on the global weather forecasts when the IR and MW sounder data are delivered by 20 min anywhere in the world. Additional forecast benefits are not obvious for shorter data latency. Results from this study support the WSP recommendation of 20–minute data latency.

Graphical Abstract

1. Introduction

With the improved satellite measurement techniques and the advent of advanced assimilation schemes, a large number of satellite observations are currently assimilated into the numerical weather prediction (NWP) models, and the forecast impacts now exceed that of conventional observations [1,2,3]. Among many types of observations from satellite sensors being assimilated, the infrared (IR) and the microwave (MW) sounder measurements have a significant positive impact on the forecast error reduction. Their spectral measurements contain valuable information on the detailed vertical structure of atmospheric temperature and moisture as well as other atmospheric compounds [4,5,6,7,8]. Hence, many operational NWP centers have put in significant effort to maximize the use of these IR and MW sounder measurements together with advanced data assimilation techniques in the NWP system to improve weather forecasting.
At operational NWP centers, timely delivery of model outputs to the forecasters is critical. Due to practical reasons, the NWP models are scheduled to be triggered at a data cut-off time after the defined analysis time. Observations made before the cut–off time but delivered after this data cut-off time will not be available to the assimilation system. The time gap between the observation time and the data delivery time to the data users such as the NWP centers is defined as data latency [9]. Major factors affecting data latency are the data transmission speed to the ground station, the frequency of data downlink, and the data pre-processing [9,10]. Data latency is one of the key factors in maximizing the usage of satellite measurements in the data assimilation. The data latency issue is related to all observation types. This is a more sensitive issue for the low-earth-orbiting (LEO) satellites that move quickly around the Earth from pole to pole in the low orbit. Moreover, a large number of the meteorological IR and MW sounders whose data are assimilated are flying on the LEO satellite platforms. Different from the LEO satellites, the geosynchronous-orbiting (GEO) satellites are fixed over one longitude at the equator and communicate with the assigned ground stations in real time. In contrast, the LEO satellites transmit the measured data saved in the onboard data storage to one of the assigned local ground stations distributed over many countries, while the satellite passes over the field of view of the local ground station for a short period. In other words, the LEO satellite data collected after the previous datalink time are saved in the onboard stage until it passes over the next local ground station. The visit-time gap between the ground stations over which the satellite passes sequentially can affect the data latency, compared to the GEO satellites that communicate with the ground station in real time.
In the past, the LEO satellite data delivery process was dependent on the model type. In the case of the regional NWP model, observations from the LEO satellites within the model domain were received by the assigned local ground station via the direct readout reception system, but not distributed to other NWP users in near real time. However, with improved computation power, regional NWP has increased the model domain significantly. Observations received at a single ground station no longer cover the whole model domain. For the global NWP model, LEO satellites dumped the data collected each time when they passed over the Command and Data Acquisition (CDA) station located on a Svalbard island. These data were then re-transmitted and assimilated into the global data assimilation at the NWP centers. The time interval between each revisit time to the CDA station contributed to delay in the delivery of the LEO satellite data to the NWP centers.
The Direct Broadcast Network (DBNet), coordinated by the World Meteorological Organization (WMO) Space Program (WSP) with the global cooperation of satellite-operating institutes [9,11], is set up to speed up delivery of the LEO sounder observations. The objective is to allow the NWP centers to use near-real-time data of the LEO satellite measurements to maximize the positive impact of the LEO satellites on the weather forecasting. The satellite data are acquired in real time through a worldwide network of local DBNet receiving stations, processed locally on agreed standards, and disseminated in near real time. The DBNet system carries out three sequential tasks. First, the LEO satellite sounder measurements are acquired by the local DBNet ground stations following the scheduling priorities determined by the DBNet coordination group. Second, the received satellite raw data are processed to calibrated radiances using agreed data processing packages such as the Advanced TIROS Operational Vertical Sounder (ATOVS) and Advanced Very High-Resolution Radiometer (AVHRR) Pre-processing Package (AAPP) and the Community Satellite Processing Package (CSPP). Third, the processed satellite data are re-transmitted to the global user community via the Global Telecommunication System (GTS) or the File Transfer Protocol (FTP) in near real time. With the global DBNet system, the length of data latency of the LEO satellite sounder measurements is significantly reduced.
However, the average data latency of the LEO satellites is still longer than 20 min recommended by the WSP in terms of the global model system. For example, for the National Centers for Environmental Prediction (NCEP) Global Forecast System (GFS), data are delivered with an averaged data latency of 80 min, leading to about 74% of observation usage [12]. There are two main reasons for longer data latency. Firstly, there is still an insufficient number of DBNet ground stations to deliver the LEO satellite data in a timely fashion. As of now, DBNet stations are located over land. In the Southern Hemisphere, where most of the surface is covered by ocean, the number of the stations is relatively small. Moreover, there are still few DBNet stations over the vast regions (i.e., the continent of Africa and Australia). Secondly, it is still technically difficult for the DBNet station to process all operating LEO satellites. The number of LEO satellites each DBNet station can handle is limited by the processing power of the station (e.g., availability of processors and its spatial coverage) and the usefulness of the satellite (e.g., forecast impact and data quality). Thus, the number of the assigned DBNet stations to each LEO satellite sounder is significantly different, leading to different data latency depending on the satellite types. Considering the aforementioned limitations, the current data latency of the LEO satellite sounders can be further reduced by expanding the number of DBNet stations over regions where coverage is limited and upgrading the data processing system of the DBNet station.
In two recent studies, it was demonstrated that the reduced data latency for the satellite observations has a positive forecast impact for the global and regional forecast models [13,14]. However, these studies mainly focused on assessing the forecast impact in the range of the data latency from 3 h to 0 with a one-hour interval, not considering that the current data latency is already less than 2 h in the operational model system. In order to shed light on how to enhance the global forecasts from the currently operating NWP system, it is more significant to diagnose the forecast benefit on the global forecast from reducing the current data latency through enhancing the operational DBNet system. Moreover, while the WSP recommends a 20-min data latency, it is still unknown if the forecast will benefit with an even shorter data latency. Thus, in this study, we assessed the data latency impact on the global forecasts under the assumption that the current data latency of all LEO satellite sounders is no longer than 20 min as recommended by the WSP, and if a short data latency of less than 20 min is beneficial using the NCEP GFS.
This paper is organized as follows. Section 2 provides the background information of GFS and the data setup depending on the defined data latency. The trial experiment design is described in Section 3. In Section 4, the global forecast impacts of the different data latency are analyzed in addition to a comparison of data usage. Section 5 provides conclusions and discussion.

2. Used NWP System and Data Setup with Data Latency

2.1. Global Forecast System (GFS)

GFS is a global numerical weather prediction system developed by NCEP. It comprises the forecast model and the data assimilation system to provide the initial condition. The forecast model is based on the primitive dynamical equations, which is a spectral model on a hybrid sigma/pressure coordinate. Recently, NCEP replaced the dynamic core embedded in the GFS forecast model with the Finite Volume cubed-sphere (FV3). Operationally, each GFS forecast goes out 16 days in advance. For the first 240 forecast hours (10 days), the model runs at a resolution of T1534 (~13km). The remaining 6 days are run at a reduced resolution of T574 (~27km). It has 64 vertical levels. The GFS runs a hybrid four-dimensional ensemble variational (4DEnVar) data assimilation system, the Gridpoint Statistical Interpolation (GSI), to generate its initial conditions. The flow-dependent error covariance is estimated from the 80 GFS ensemble members running at a reduced horizontal resolution from the previous cycle, using the ensemble Kalman filter (EnKF) scheme. The weights for the static and flow-dependent background error covariance are 0.125 and 0.875, respectively [15,16,17,18,19,20].
Observation types assimilated operationally in GFS consist of conventional observations (Table 1) and satellite measurements (Table 2) including satellite IR and MW radiances, satellite-based Atmospheric Motion Vectors (AMVs), and the Global Positioning System Radio Occultation (GPSRO) bending angles. Table 1 and Table 2 provide a detailed list of the observations assimilated. Observations are assimilated within a 6-h assimilation window centered at the analysis time (0000, 0600, 1200, and 18000 UTC). The DBNet system supplements the hyperspectral IR and MW sounder measurements that are being operationally used in the GFS data assimilation system in addition to routine data delivery through GTS.
The GFS runs two analysis cycles, an early run and a late run, four times a day at the six-hour interval (0000, 0600, 1200, and 1800 UTC) operationally. The late run, which is called the global data assimilation system (GDAS) run, is triggered 5 h 50 min after the analysis time. This run is least affected by data latency because of its long data cut-off time. This allows all observations to be assimilated. The GDAS run does not provide the long-range forecasts for forecasters. Instead, it provides the short-range forecasts up to 9 h that are used as the first guess for the GDAS and GFS run in the next analysis cycle. The early run (called the GFS run) is the main run that produces the long-range forecasts delivered to the forecasters. This early run has the data cut-off time of 2 h 45 min for the timely delivery of the model outputs, meaning that the GFS run is directly affected by data latency. In other words, considering that two analysis cycles have the same 6-h assimilation window from -3 h to +3 h centered at the analysis time, the initial condition from the GFS run is made in the absence of the observation data on the corresponding time slots within the 6-h assimilation window because the data are not delivered.

2.2. Data setup of LEO IR and MW sounders

The Binary Universal Form for the Representation of meteorological centers (BUFR) files containing the IR and MW sounder measurements with 20-min and 5-min latency were created from those used in the GDAS run. To determine if observations are delivered on time for the GFS run, the data latency of 20 min or 5 min was added to the actual observation time. If expected data delivery time is earlier than or equal to the data cut-off time, then this observation was written into the respective BUFR file. For example, if the data latency is 20 min and the actual observation time is 0240UTC 1 July, the data delivery time will be 0300UTC 2 July. On the other hand, if the data latency is 5 min, the data delivery time for this observation will be 0245UTC 1 July. For the 0000 UTC GFS analysis cycle, the data cut-off time is 0245 UTC. With the 20-min latency, the observation will not make it into the assimilation system. However, with the 5-min data latency, this observation is just in time for assimilation.
Figure 1 shows the spatial coverage of Cross-Track Infrared Sounder (CrIS) measurements in a BUFR used by a single analysis cycle (0000UTC 1 July 2018) depending on the defined data latency. As the GDAS run was triggered about six hours after the analysis time, almost all CrIS measurements observed within the 6-h assimilation window (2100UTC 30 June 2018 to 0300UTC 1 July 2018) were timely delivered for the GDAS run (Figure 1a). However, for the operational GFS run (Figure 1b), about 83% of the CrIS measurements used in the GDAS run were delivered before the data cut-off time of 2 h 45 min (0245UTC 1 July 2018). Compared with the CrIS data coverage at the GDAS run, the CrIS data covering the Western Pacific are missing for the operational GFS run. They were observed before the data cut-off time but not timely delivered due to the data latency. With the 20-min and 5-min data latency, the data usage of CrIS measurements reached about 90% and 94%, respectively (Figure 1c,d). In particular, the CrIS data over the Southwest Pacific are included for both cases. The 5-min latency run provided extra CrIS data over the central West Pacific.
The time series of total number observations from all sixteen IR and MW sounders for different data latency length for the period from 0000UTC 7 July 2018 to 000UTC 22 August 2018 was plotted in Figure 2, in addition to the percentage normalized by the total data number in the GDAS run. As expected, the GDAS run has the largest total number observation available for the data assimilation. For the operational GFS run, the percentage fluctuates between 65% to 75%. At data latency of 20 min and 5 min, the percentage increases to about 88% and 92%, respectively. This trend suggests that reducing the data latency up to 5 min will increase the data available for GFS run by more than 20%.

3. Trial Experiment Design

To assess the impact of reduced data latency for LEO satellite sounders on the global weather forecasting, three assimilation experiments were conducted: (a) a control run with the operational GFS cycle, (b) “latency_20m run”, where all LEO satellite sounder observations have the data latency of 20 min, and (c) “latency_5m run”, when the data latency is 5 min. The experiments were conducted from 1800UTC 30 June to 1800UTC 22 August 2018. This trial includes a seven-day spin-up period (1800UTC 30 Jun to 1800UTC 6 July 2018) to adjust for a spatial resolution change. The initial startup files were created from operational GFS output at T1534 (~13km). For this study, the NCEP GFS was run at T670 (about 25 km in mid-latitudes). In addition, different from the operational configuration, instead of running the early cycle (GFS run) for all four analysis cycles, it was run only on a 0000UTC cycle to produce the long-range forecast up to 168-h forecast hours due to the limited computation power. Apart from the modification made to the LEO IR and MW sounder measurements, all other observations, listed in Table 1 and Table 2, were assimilated.

4. Results

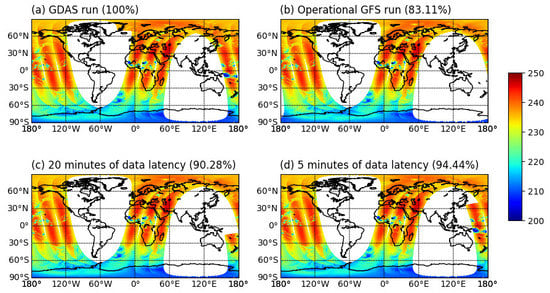
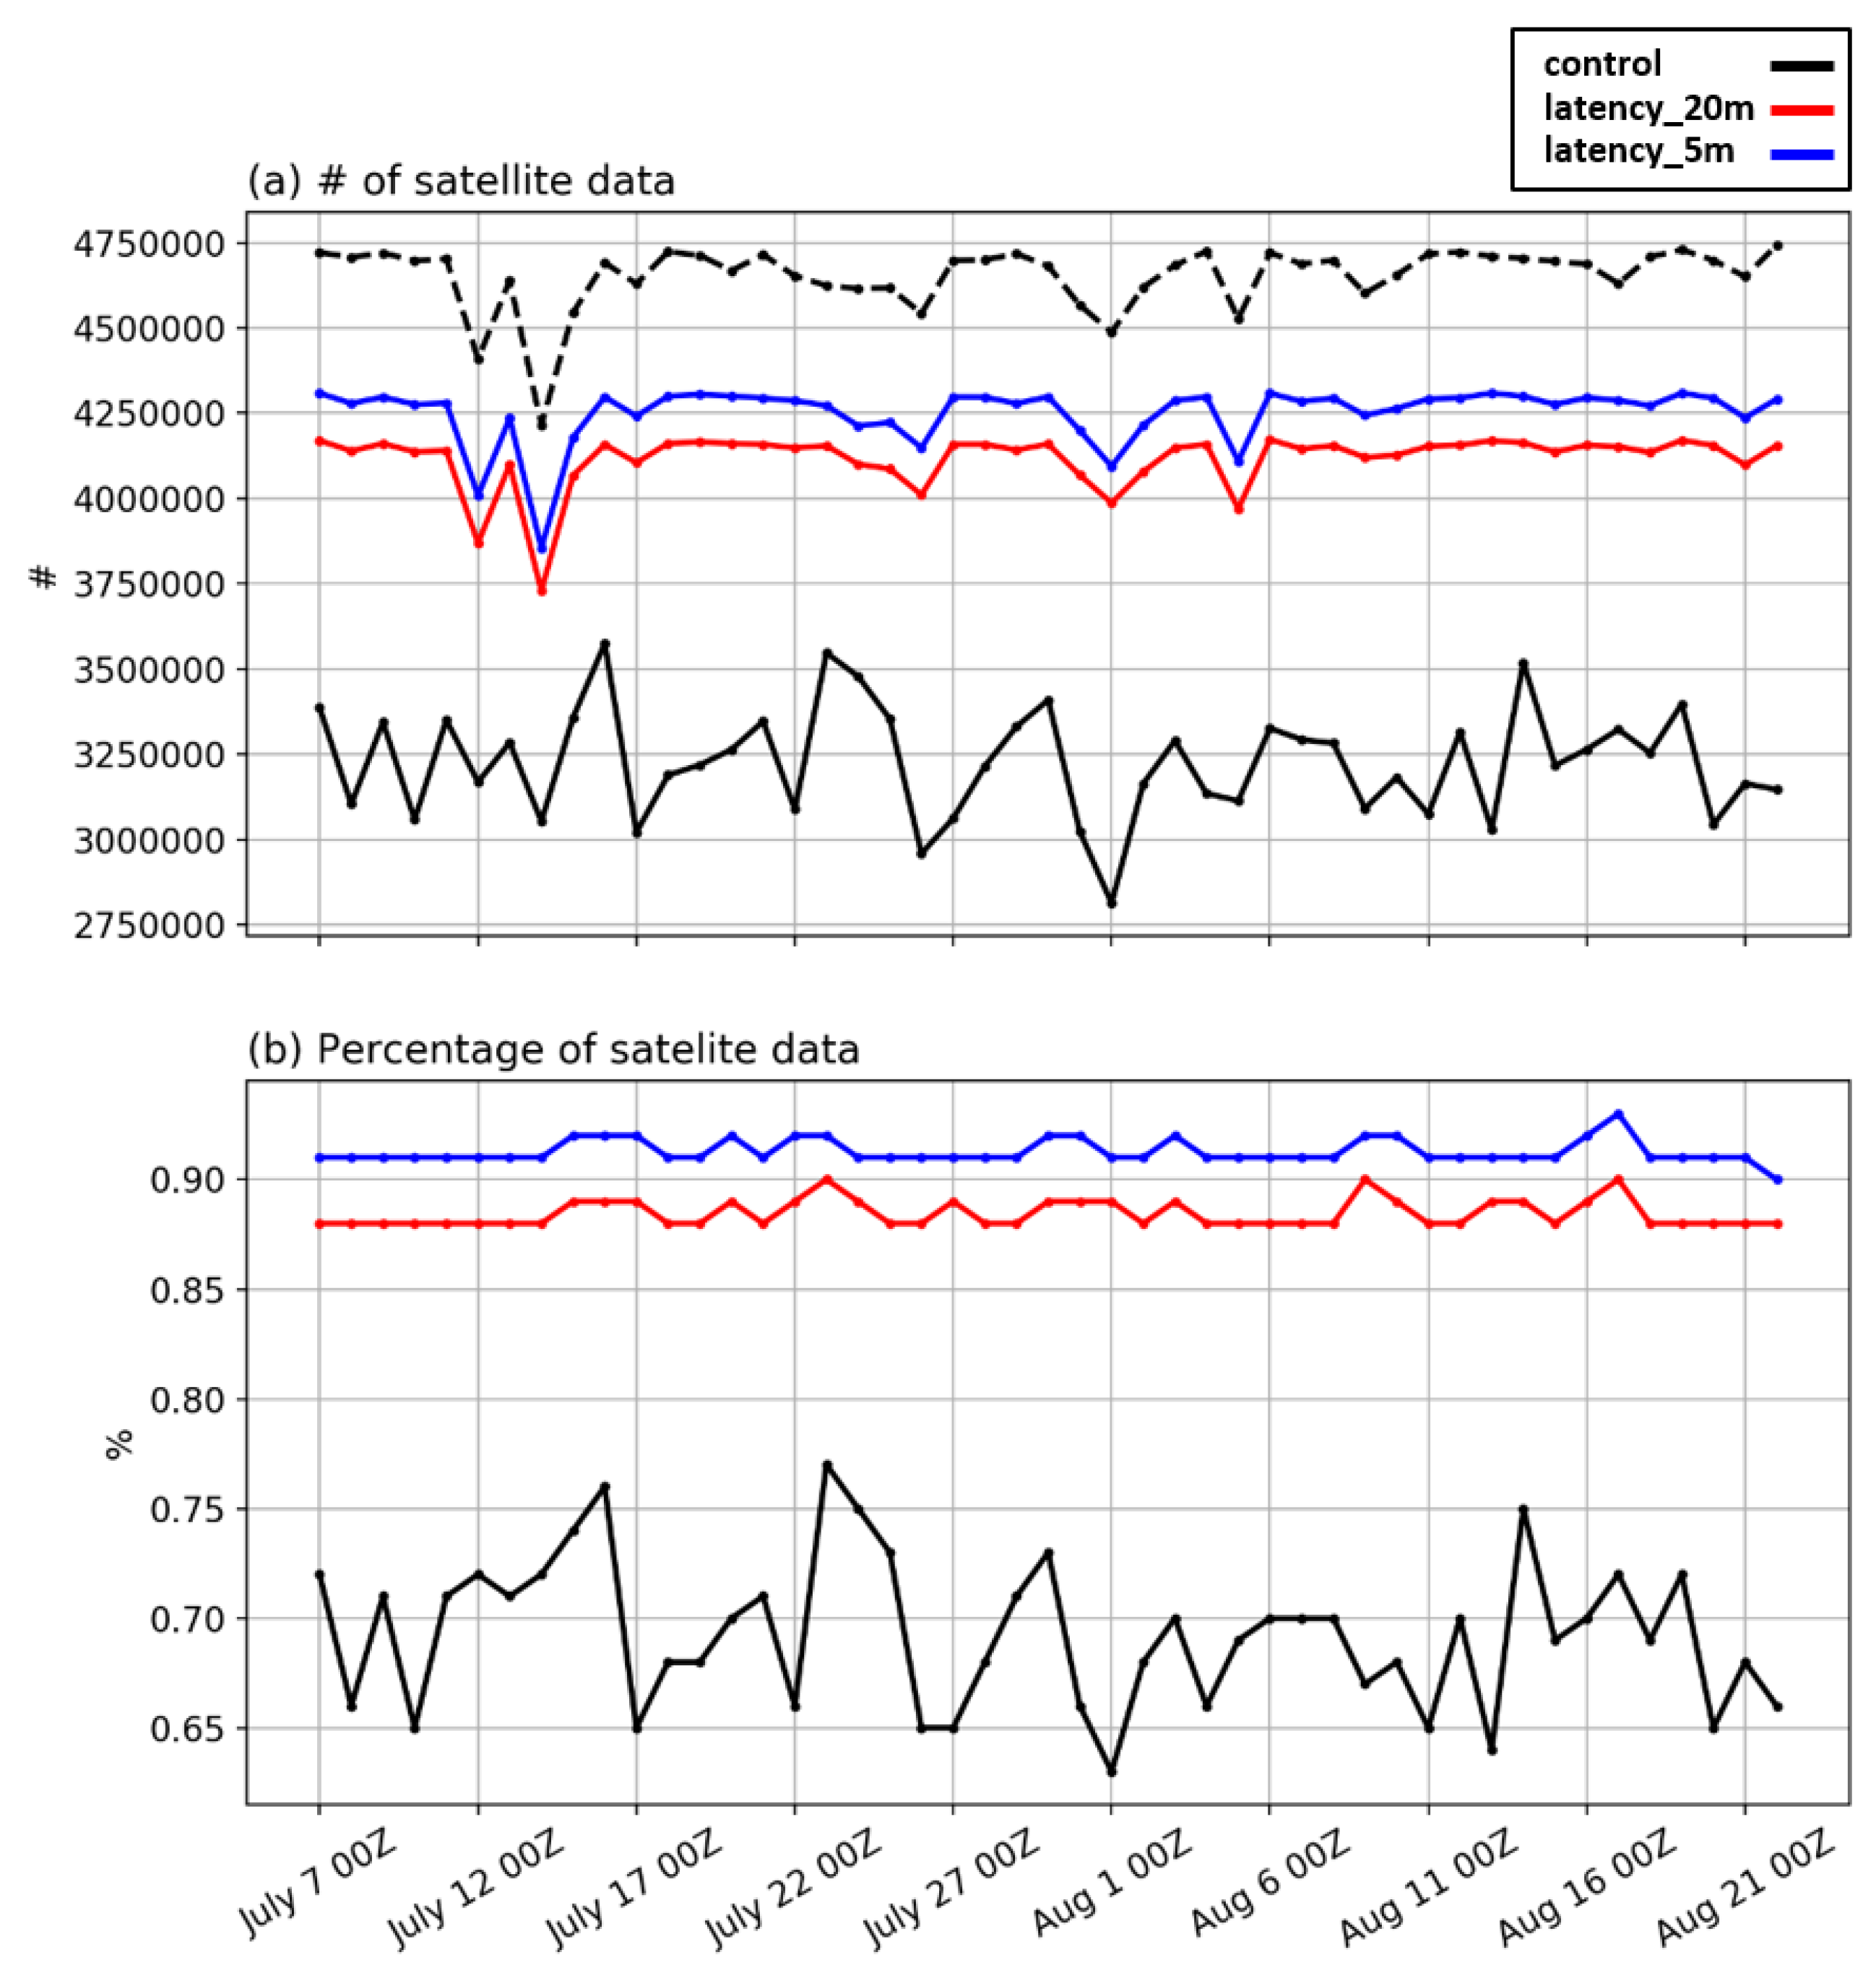
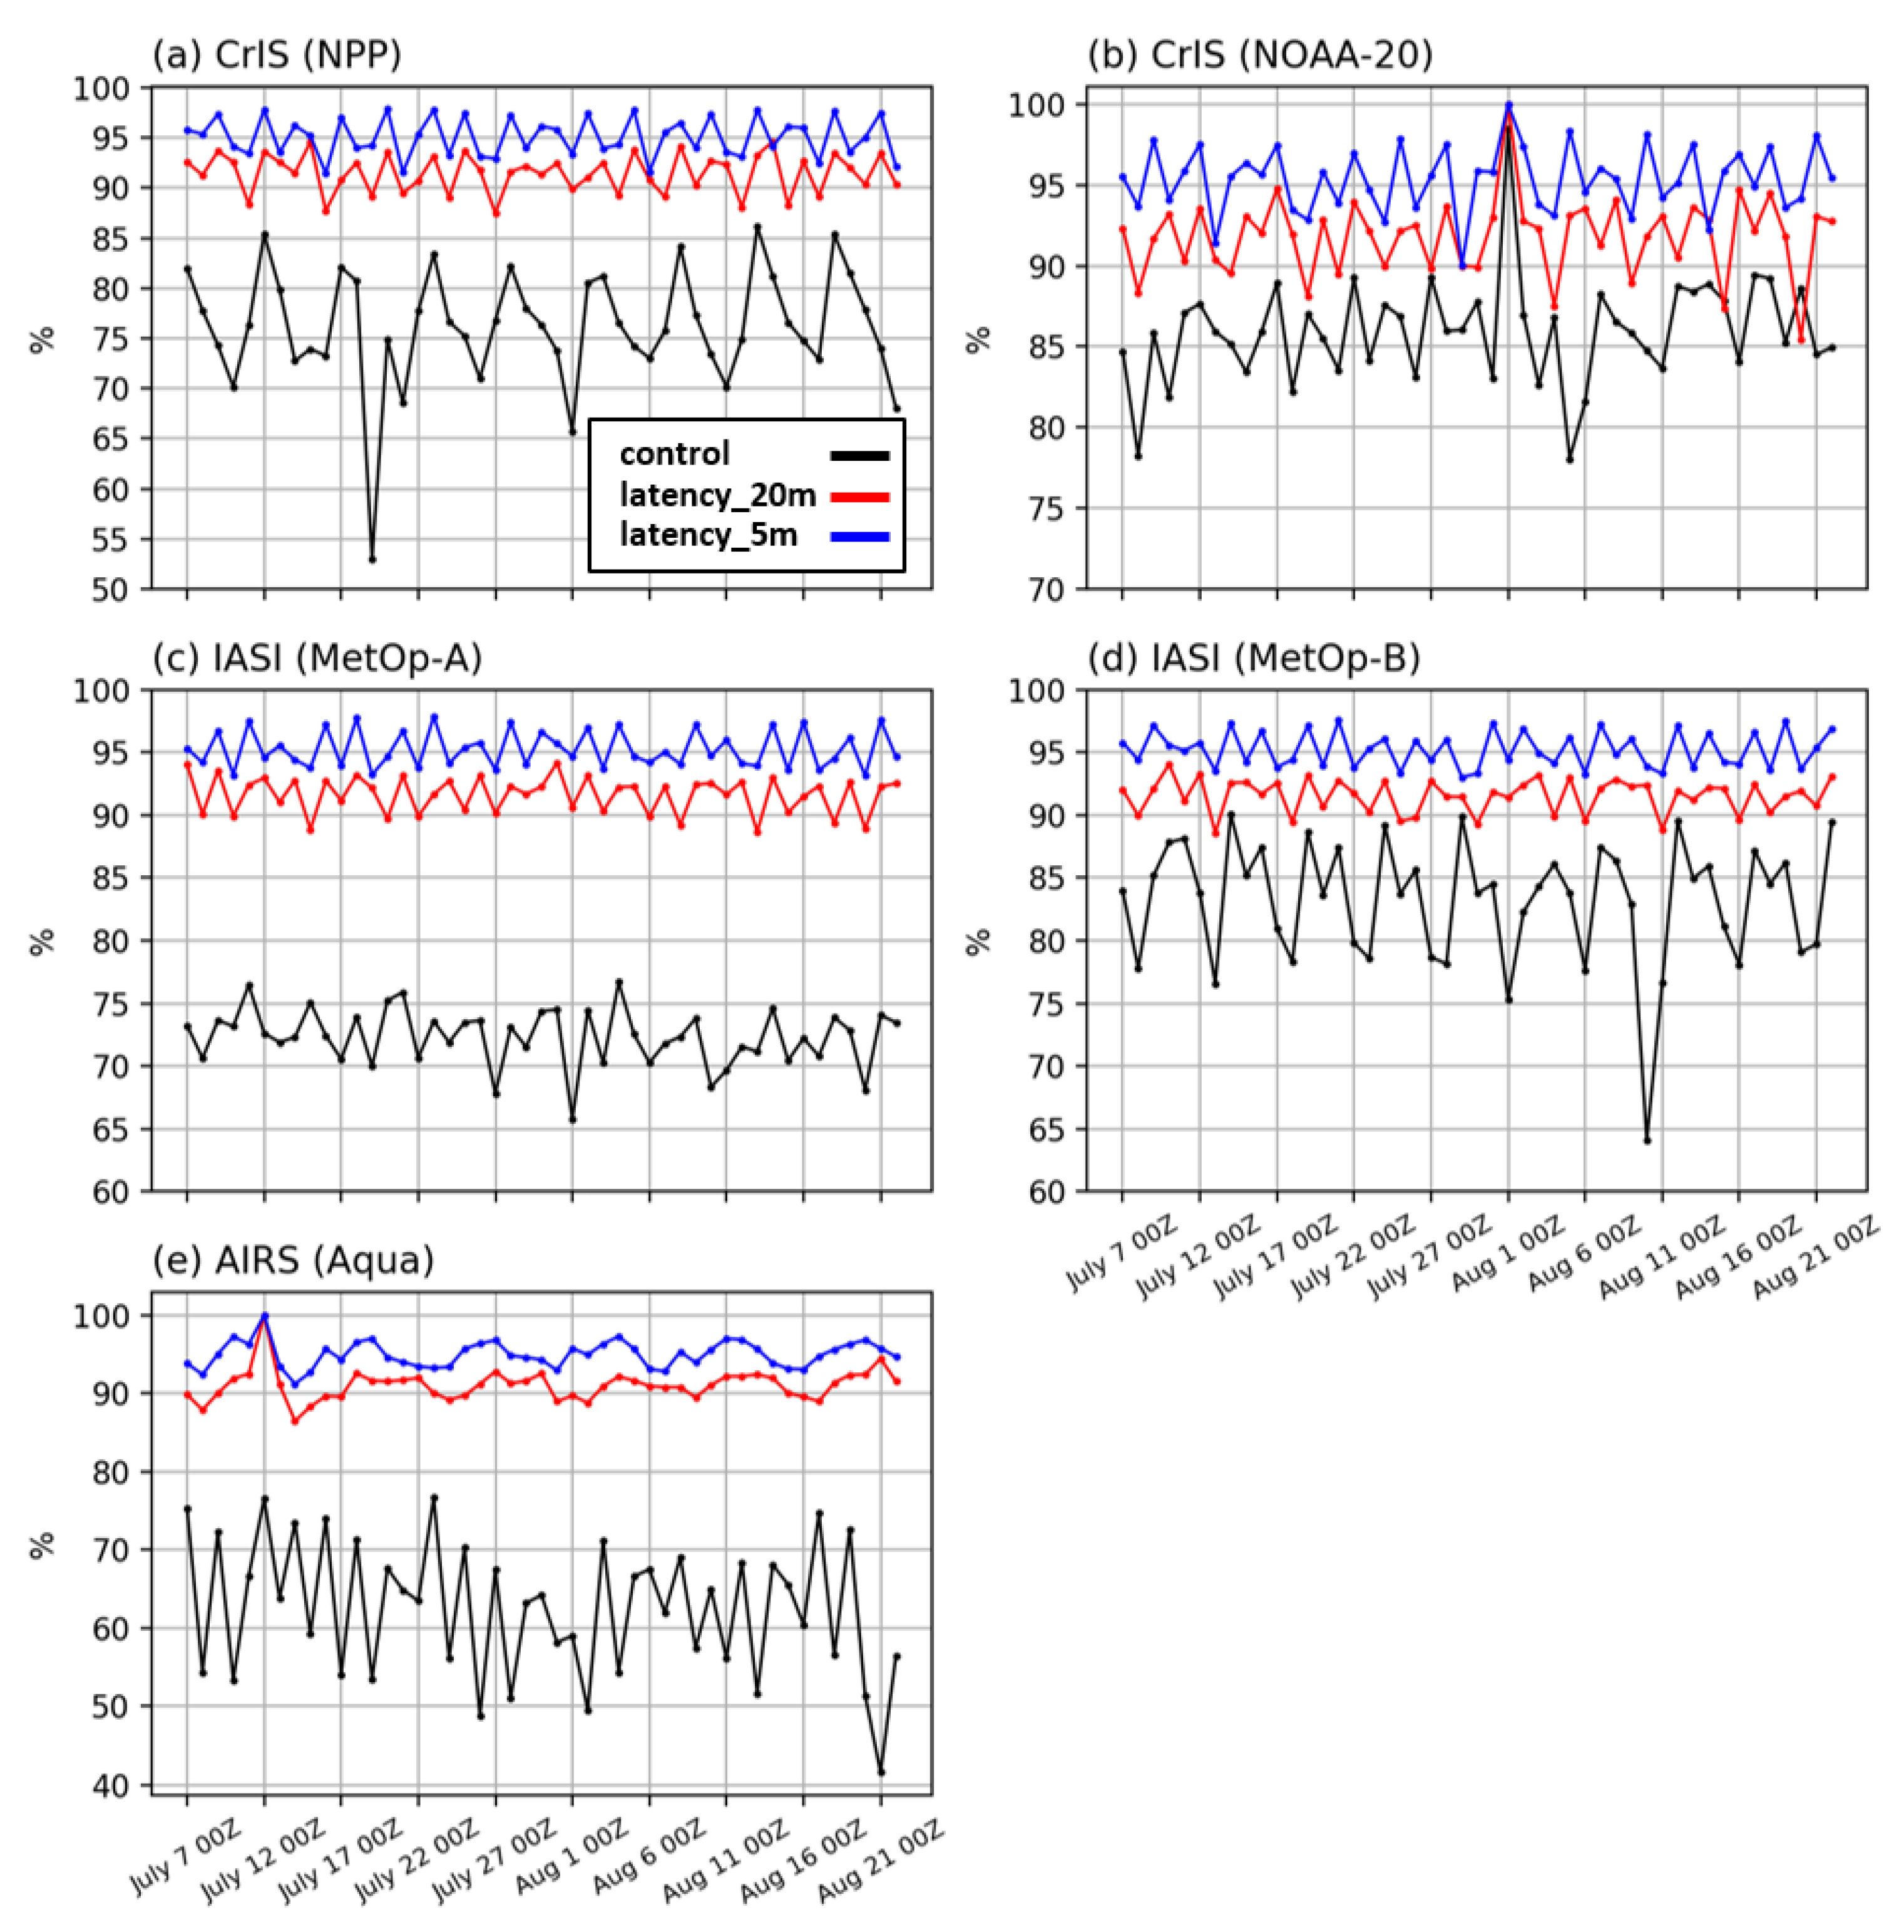
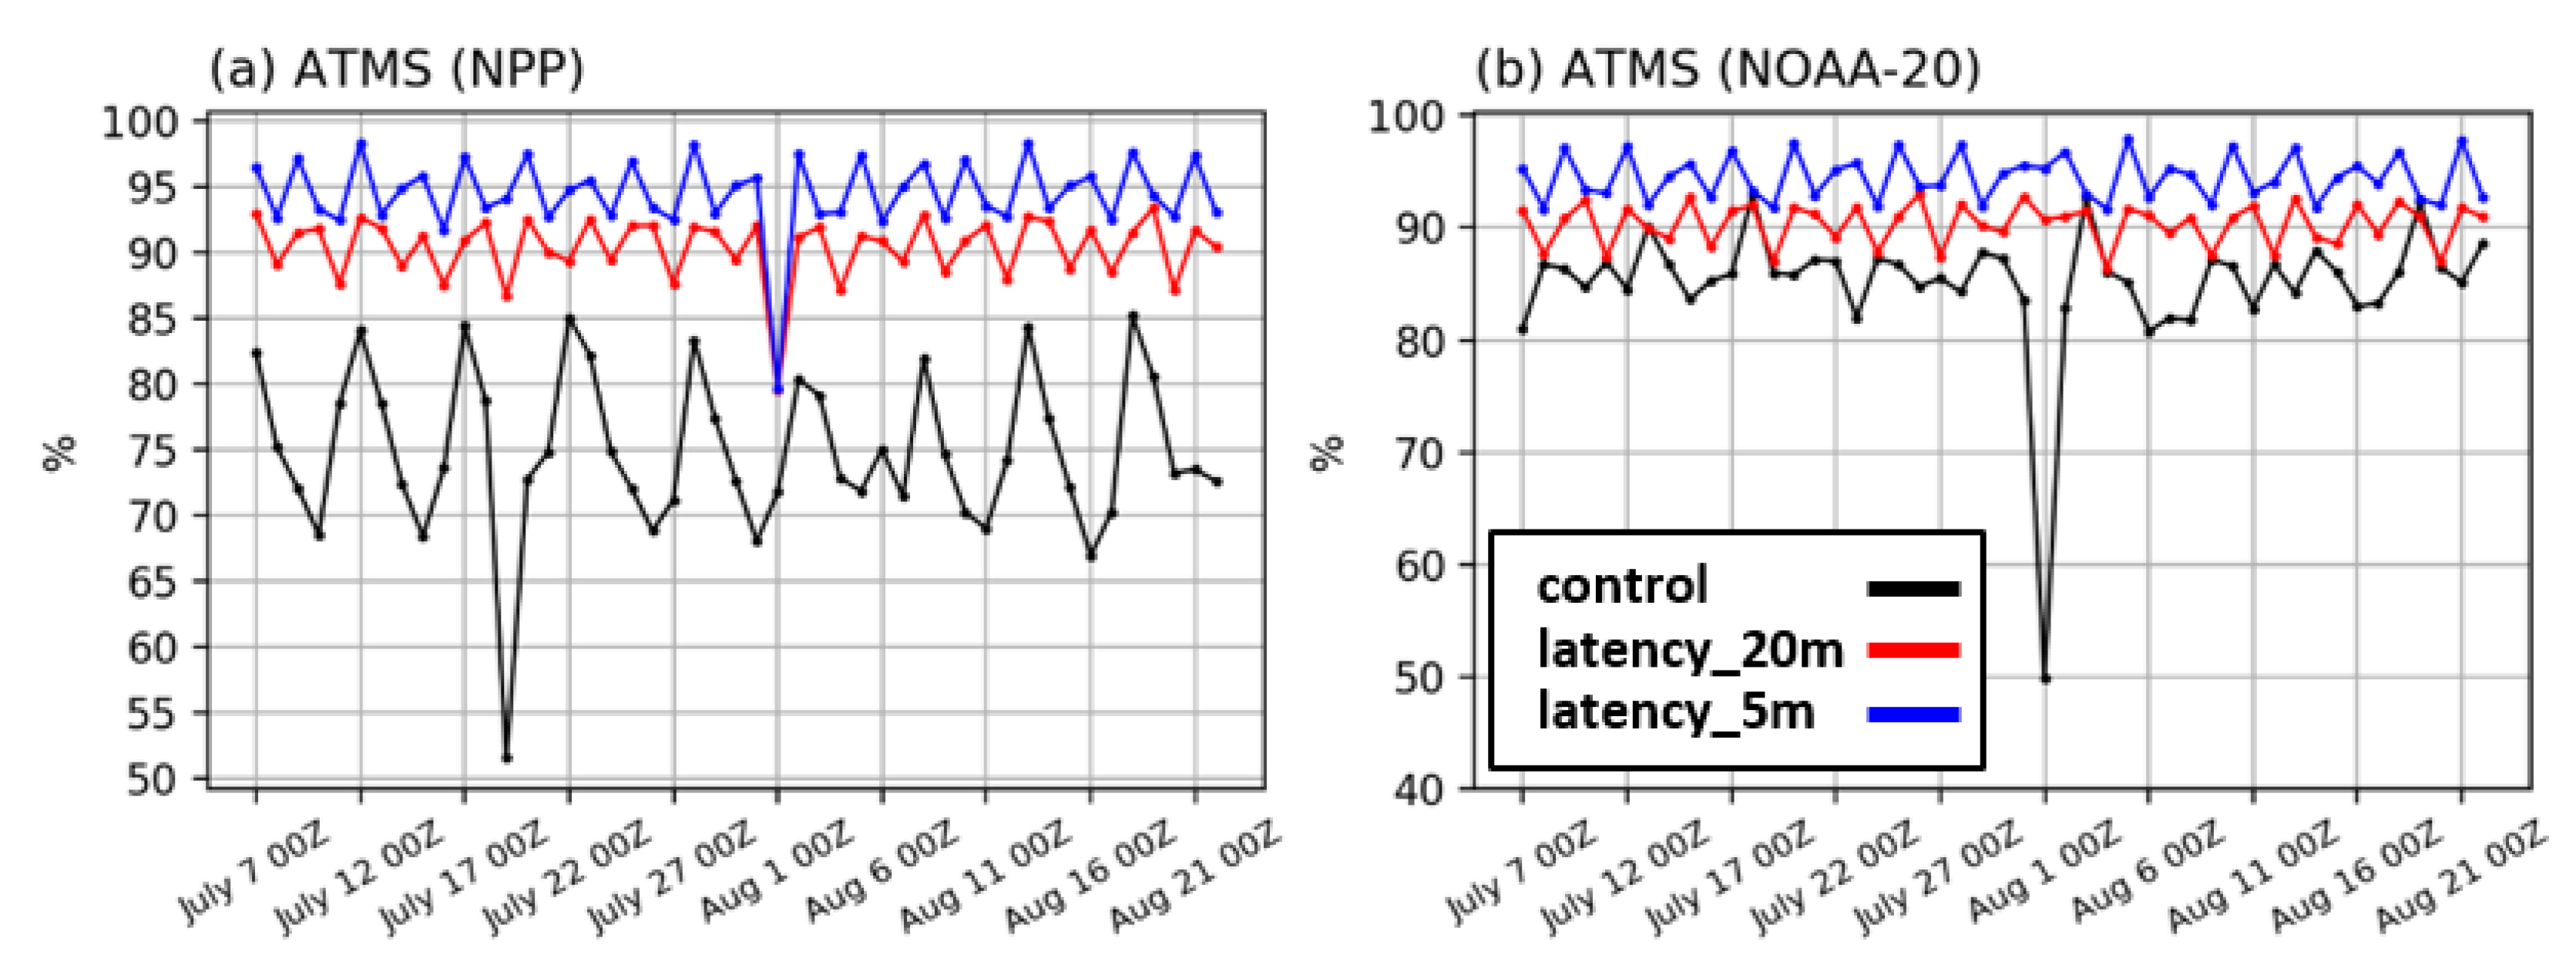
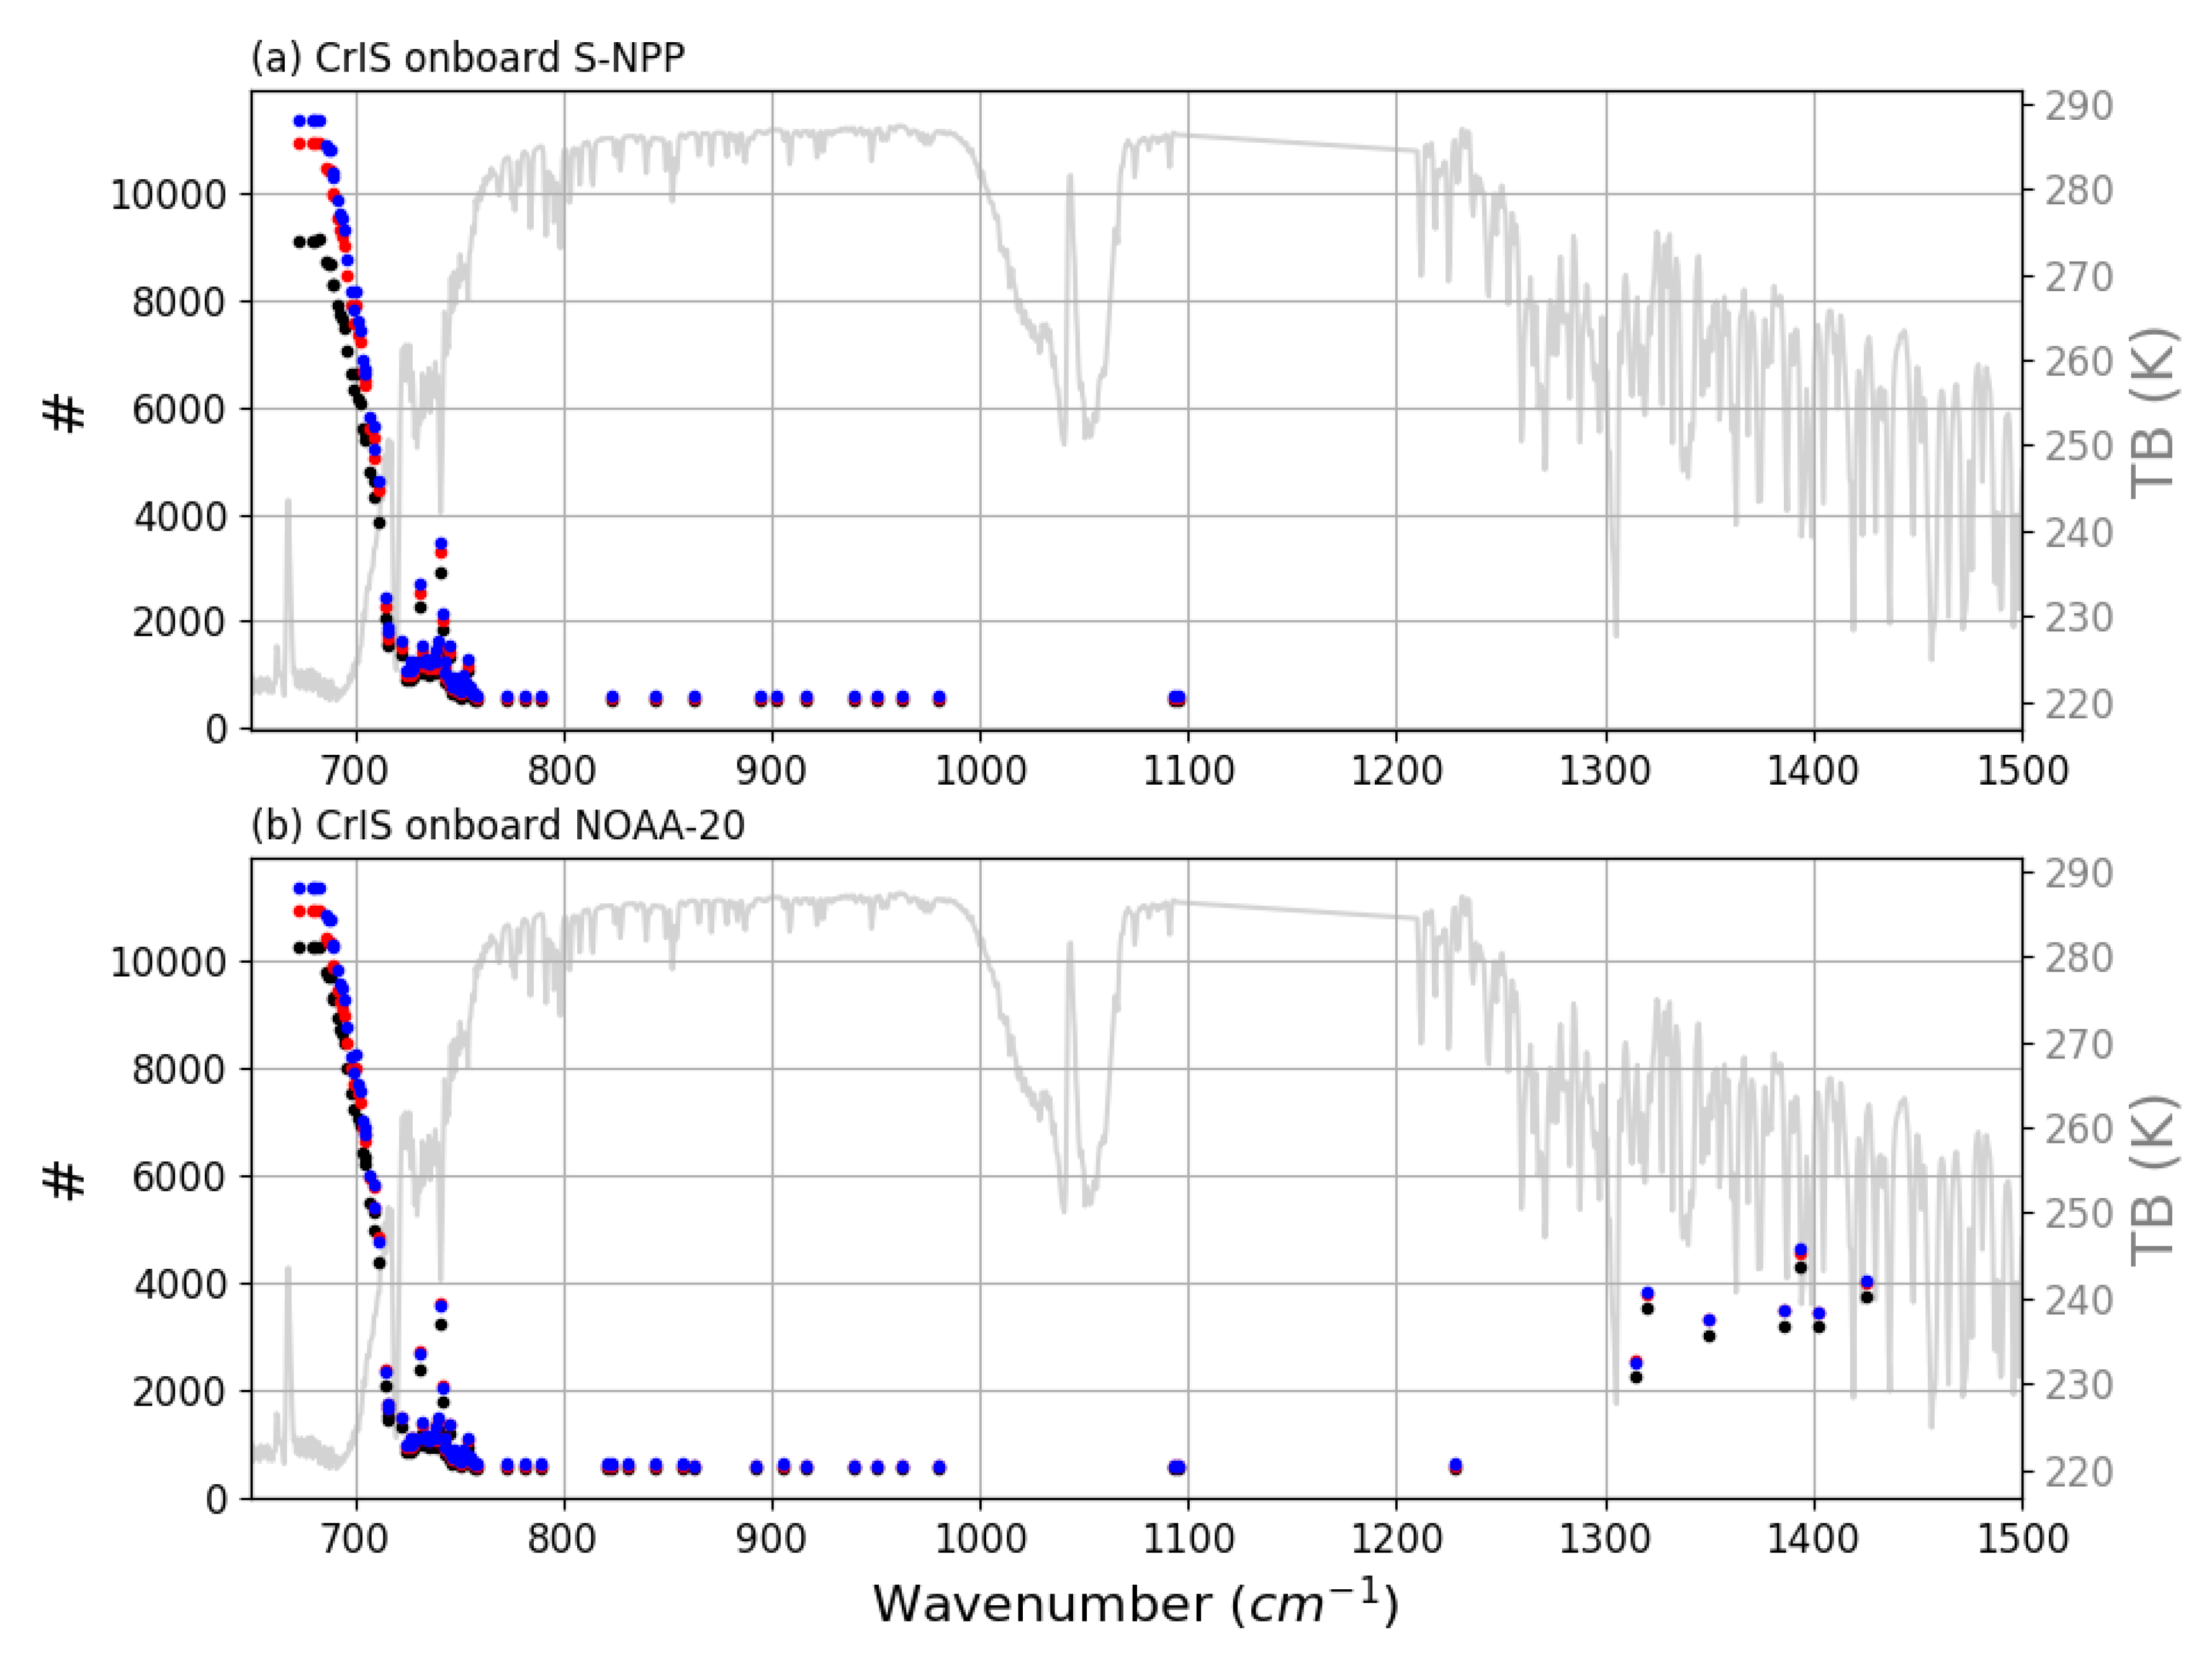
4.1. Comparison of LEO IR and MW Sounder Data Assimilated

In Figure 1 and Figure 2, the BUFR files indicated an increased number of observations delivered to the GFS assimilation system with reduced data latency. However, as this effort to reduce the data latency ultimately aims to enhance the model forecast by assimilating available satellite measurements as much as possible, it is more reasonable to assess how many additional LEO sounder data were assimilated practically by reducing the data latency. In this section, therefore, we compared the number of assimilated LEO sounder data for three trial runs. As the GDAS run has a very long data cut-off time, it is considered as the benchmark for the maximum number of observations assimilated. Figure 3 and Figure 4 show the percentage of the number of observations assimilated in the GFS run against the GDAS run for five IR sounders and two MR sounders, i.e., CrIS onboard Suomi National Polar-orbiting Partnership (S-NPP) and National Oceanic and Atmospheric Administration 20 (NOAA-20), Infrared Atmospheric Sounding Interferometer (IASI) onboard MetOp-A and MetOp-B, Atmospheric Infrared Sounder (AIRS) onboard Aqua, and the Advanced Technology Microwave Sounder (ATMS) onboard S-NPP and NOAA-20. A comparison of these percentages shows that more observations are assimilated with improved data latency. For the control run, the data usage ratios of the satellite sounder measurements are significantly different depending on the type of IR sounders, fluctuating between 50% and 85% during the whole trial period (Figure 3). In particular, the AIRS instrument onboard Aqua satellite shows the lowest data usage of about 65% in the operational NCEP GFS assimilation system (Figure 3e). The reason is that there is no delivery of the AIRS observations via the DBNet in near real time. Instead, AIRS data are transmitted to NCEP via GTS or FTP after being downlinked at the assigned ground stations.
It is also interesting to note that the data usage of the IASI instrument onboard MetOp-A satellite is lower than that of MetOp-B satellite despite being the same type of IR sounder (Figure 3c,d). According to the satellite data acquisition priority determined by the DBNet coordination group, the data direct broadcast of MetOp-A is not currently operating over some regions (e.g., polar region) due to the radiation sensitivity issue of the High Rate Picture Transmission (HRPT) hardware embedded in the MetOp-A satellite [9]. Thus, the length of data latency of MetOp-A is relatively longer than the MetOp-B satellite, leading to the reduction of assimilated data in GFS. Similar to IASI instruments, the data usage of CrIS instrument is also slightly different depending on the type of satellite platform (Figure 3a,b). The data percentage of CrIS data onboard NOAA-20 satellite is 5% higher than that of CrIS sensor onboard S-NPP satellite. The different data usage is because the data from the S-NPP satellite are only downlinked at the CDA but the data from NOAA-20 satellite are downlinked at the CDA and the Antarctic Data Acquisition (ADA) station at McMurdo Station, Antarctica [9].
Even though the length of data latency largely fluctuates depending on the sounding sensor type (shown in Figure 3), it is evident that more observations can be assimilated due to the reduction of data latency of LEO satellites with the use of the DBNet system. However, current average data latency for the IR/MW sounders is still longer than the WSP recommendation of 20 min. This is due to the limited DBNet coverage and sensor-dependent data acquisition issues. The data latency can be further reduced by expanding the number of DBNet stations to the areas that the current local DBNet ground stations do not cover and enhancing the data acquisition/processing capability of the DBNet stations. The results of the two trial runs (latency_20m and latency_5m runs), under the assumption that the data latency is 20 min and 5 min, respectively, for all DBNet stations, show how much the satellite measurements are assimilated in the GFS. For the latency_20m run, about 92% of the IR sounder measurements are assimilated into the global model. In the case of the latency_5m run, the data usage further increases by 6%, reaching up to about 98% for all IR sounders.
Similar to the results of the IR sounders, a 20-min latency (5-min latency) also enhances the data usage ratio of the ATMS MW sounders up to about 90% (95%) (Figure 4). For the operational GFS (control run), the data usage ratio of ATMS onboard S-NPP satellite is lower than that of ATMS onboard NOAA-20 satellite due to the same reason as the CrIS instrument. As the data usage of other MW temperature and moisture sounders, i.e., Advanced Microwave Sounding Unit-A (AMSU-A) and Microwave Humidity Sounder (MHS), shows quite similar patterns to the results of IR sounders and ATMS sensor (Figure 3 and Figure 4), the time series of AMSU-A and MHS sounders are not shown.
In addition to the total data usage, it is also of interest to examine the data usage depending on the IR and MW sounding channels. For the hyperspectral IR sounders, a subset of channels has been selected for each instrument to represent information contained in the full spectrum. NWP centers have only received the observations of a subset of IR sounder channels. CrIS subset is different depending on the operation model, i.e., the normal spectral resolution (NSR) and the full spectral resolution (FSR). In NSR mode, CrIS subset contains 399 channels that are from CrIS 1305 channels with different spectral resolution for all three bands (0.625, 1.25, 2.5 cm−1 for long-wave IR, mid-wave IR, and short-wave IR, respectively). In FSR mode, CrIS subset consists of 431 channels pre-selected from all CrIS 2211 channels with spectral resolution of 0.625 cm-1. IASI and AIRS instrument has 616 and 281 channels, respectively. This is done to reduce data transfer and computation cost. Each NWP center further pre-selects the channels from these subsets for assimilation. For example, 164 of 616 IASI channels, are assimilated in the GFS. For CrIS instrument onboard NOAA-20 satellite in FSR mode, 93 of 431 CrIS subset are assimilated. For CrIS instrument onboard S-NPP satellite in NSR mode, 82 of 399 CrIS subset are used.
Figure 5 and Figure 6 show the mean data number of the assimilated CrIS and ATMS channels for three trial runs, respectively. Similar to what is shown in Figure 3a,b, a maximum data number is presented for the latency_5m run and the number of CrIS data onboard NOAA-20 satellite is larger than that of S-NPP satellite for the control run (Figure 5). However, the number of observations assimilated per channel significantly differs due to the spectral characteristics of CrIS channels being distributed on different absorption bands. For the GFS, there are two major quality-control processes that determine if the observations are to be assimilated into the GFS. First, if the cloud is detected in the CrIS field of view (FOV), the cloud-affected CrIS channels are discarded if their peaks of the weighting function of channels are below the top height of the cloud detected from the satellite measurements. Second, under the clear-sky condition, the surface-sensitive channels are rejected if the departures between the observed radiances and model-simulated radiances exceed certain thresholds due to the uncertainty of used surface information (i.e., surface temperature and surface emissivity). This is the reason why the number of assimilated data has a peak in the high-peaking CO2 channels (650–680 cm-1) whose peaks of weighting function are located in the upper troposphere. The number of assimilated data tends to decrease with an increasing channel wavenumber after 650 cm-1. For CrIS channels near the window region (800–1100 cm-1) that are sensitive to both the surface and cloud, only less than 10% of data are assimilated compared with the high-peaking channels in the CO2 band (650–680 cm-1). This trend is reflected for all three experiments.
Similar to CrIS, the largest number of the ATMS data assimilated for both satellites (S-NPP and NOAA-20) is when data latency is reduced to 5 min (Figure 6). The limited number of observations assimilated for the surface-sensitive ATMS channels (channel 1–6; 23.8–53.6 GHz) and humidity channels (channel 16–22; 88.2–183.3 GHz) is due to the uncertain surface information (surface emissivity and surface temperature).

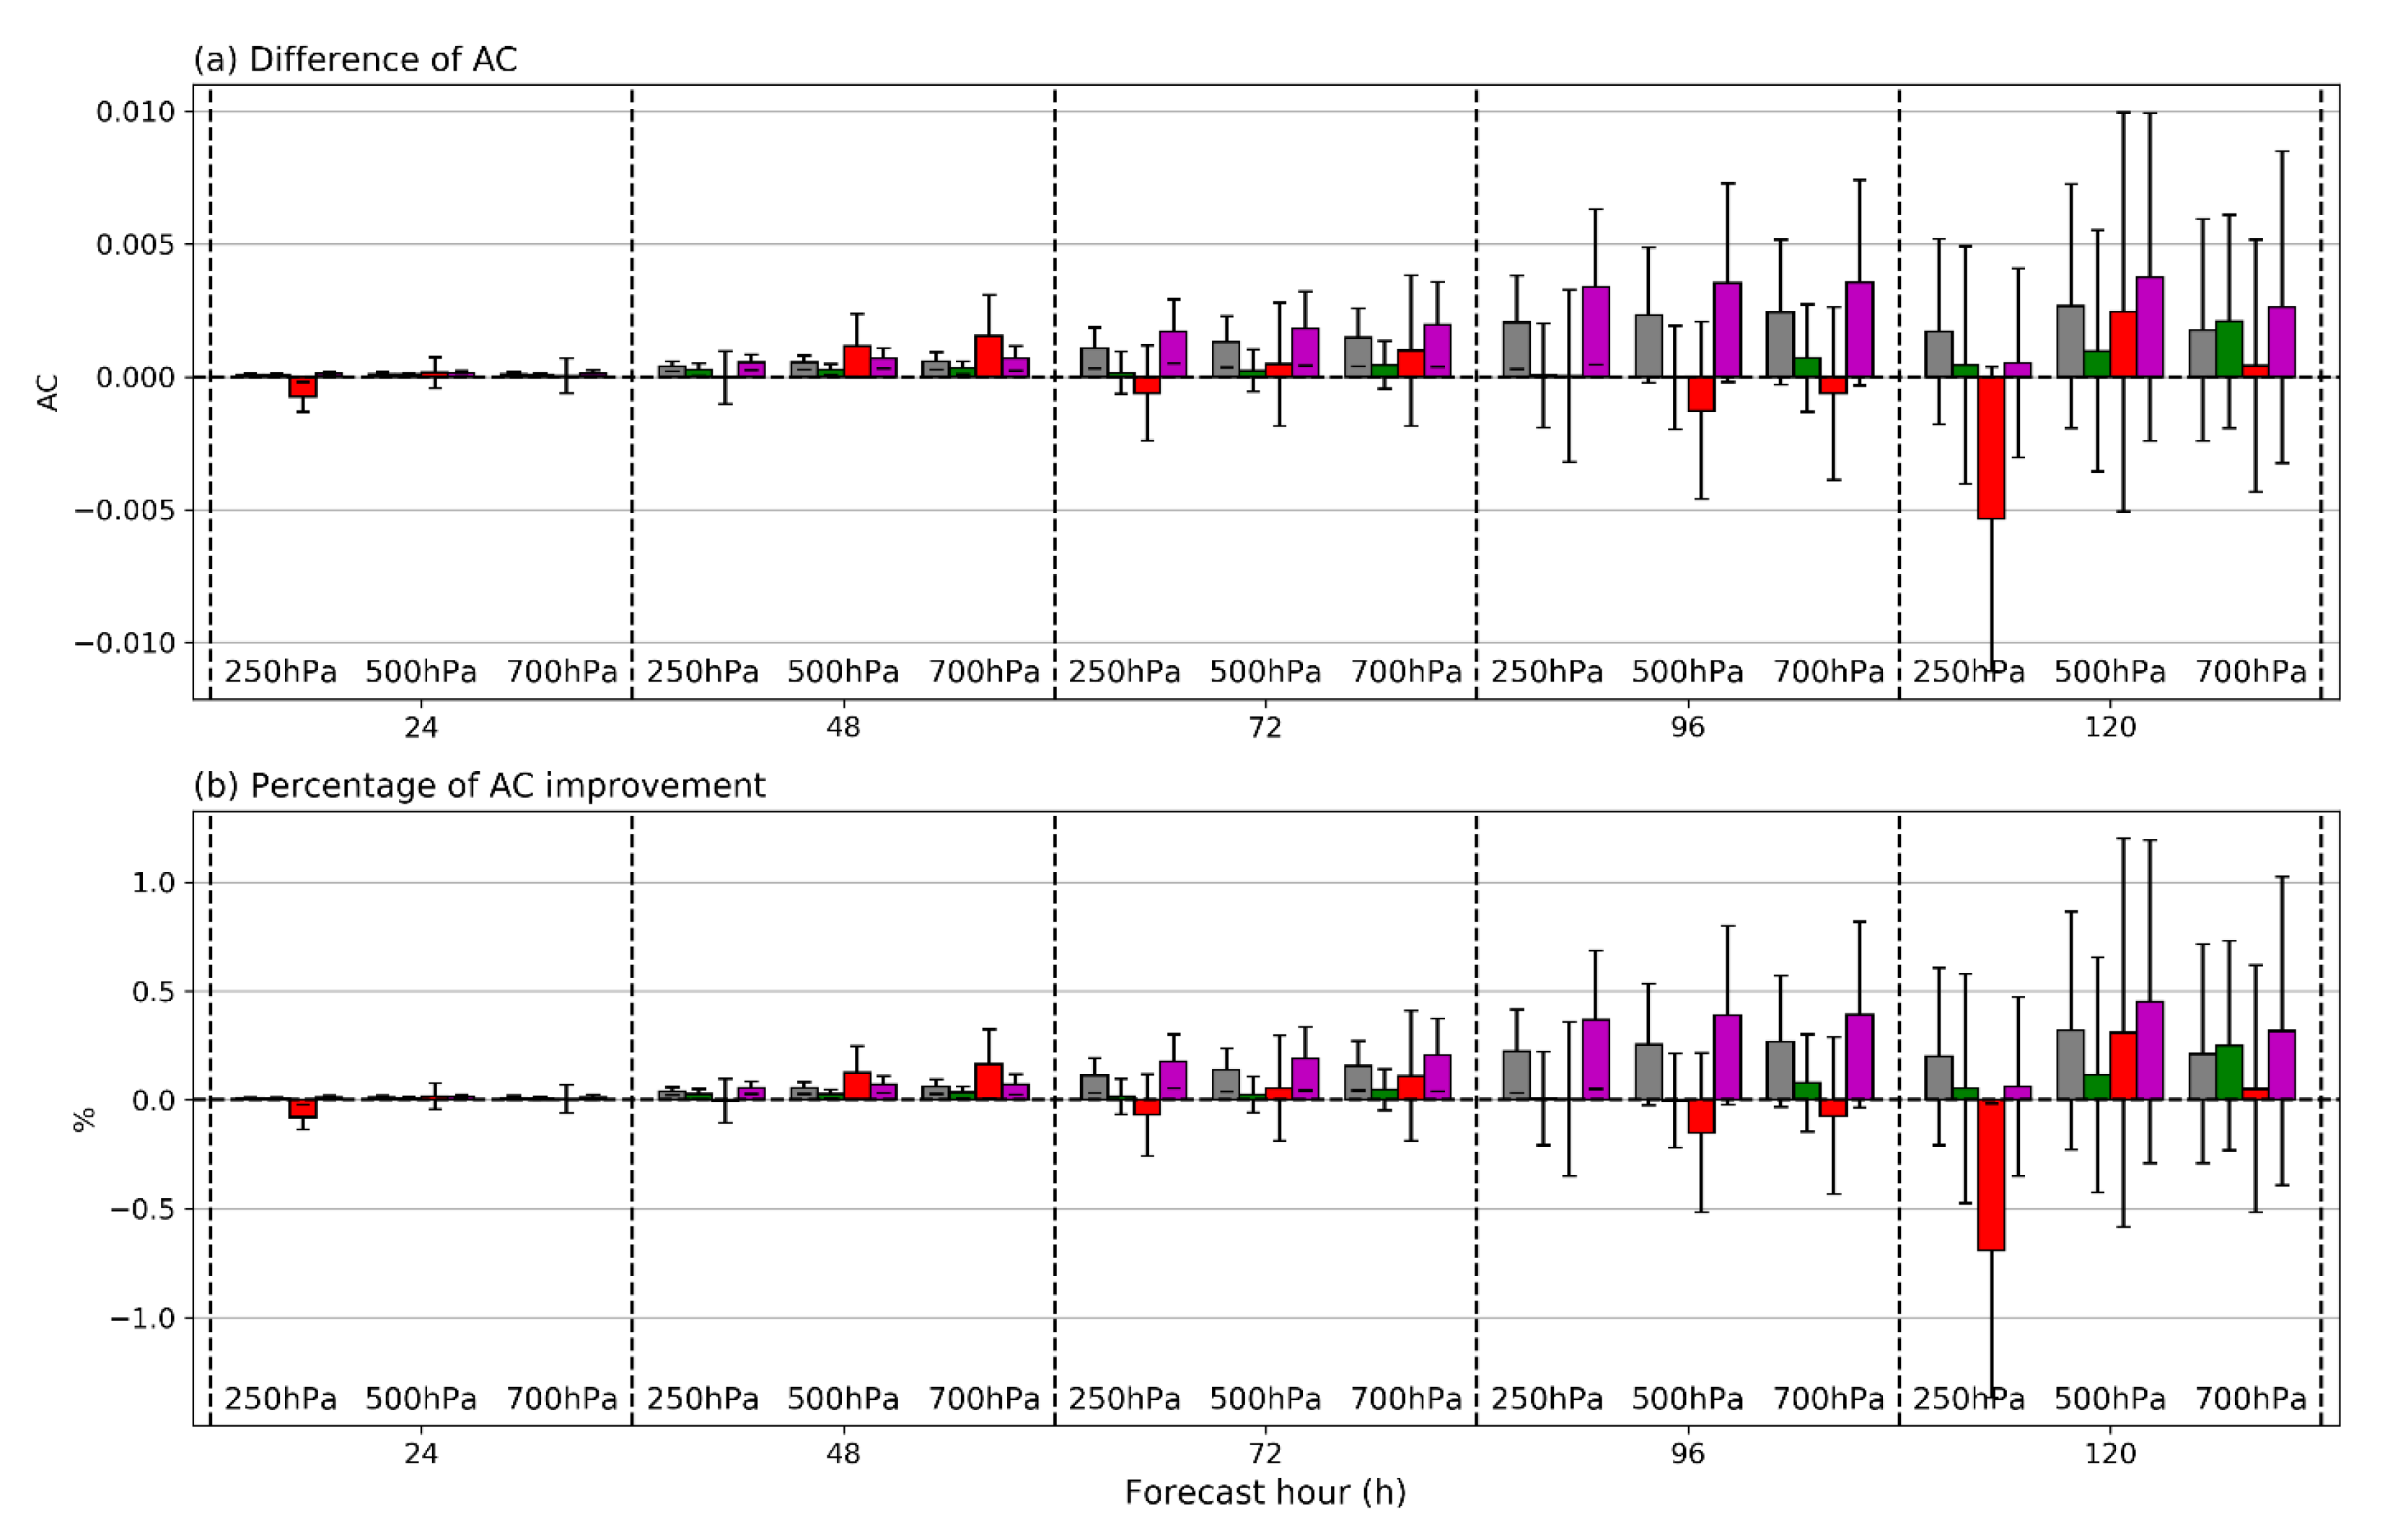
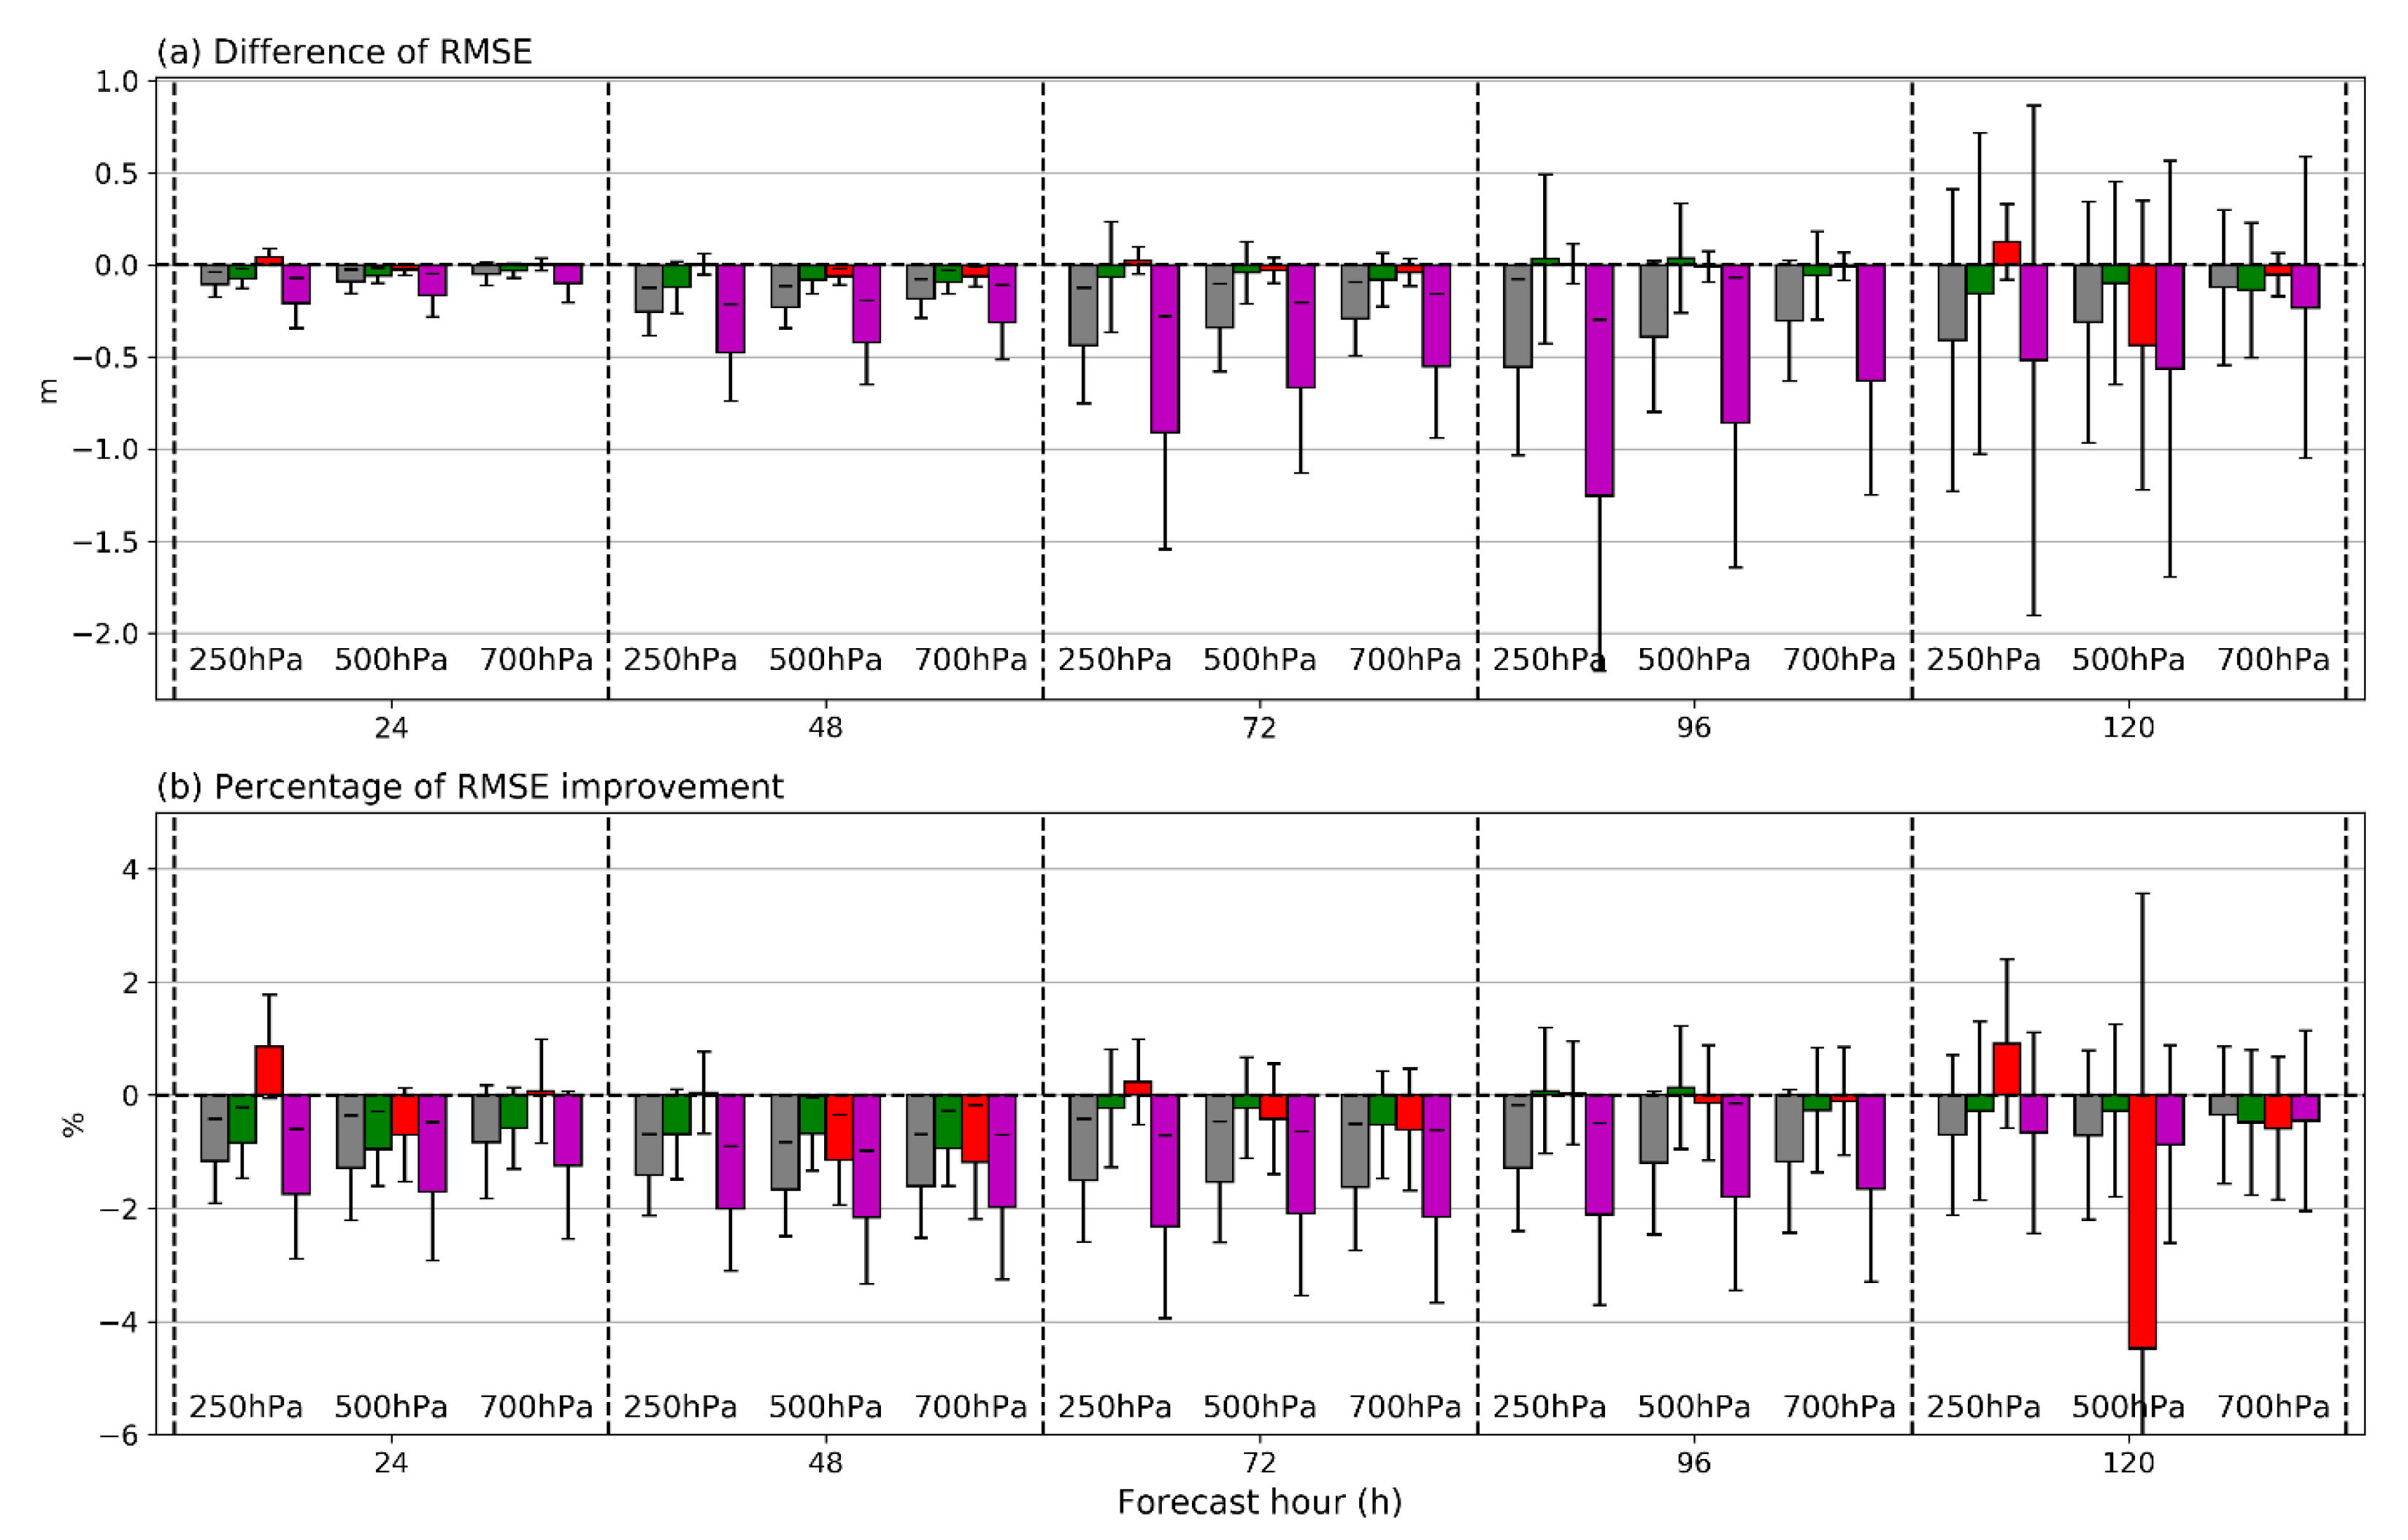
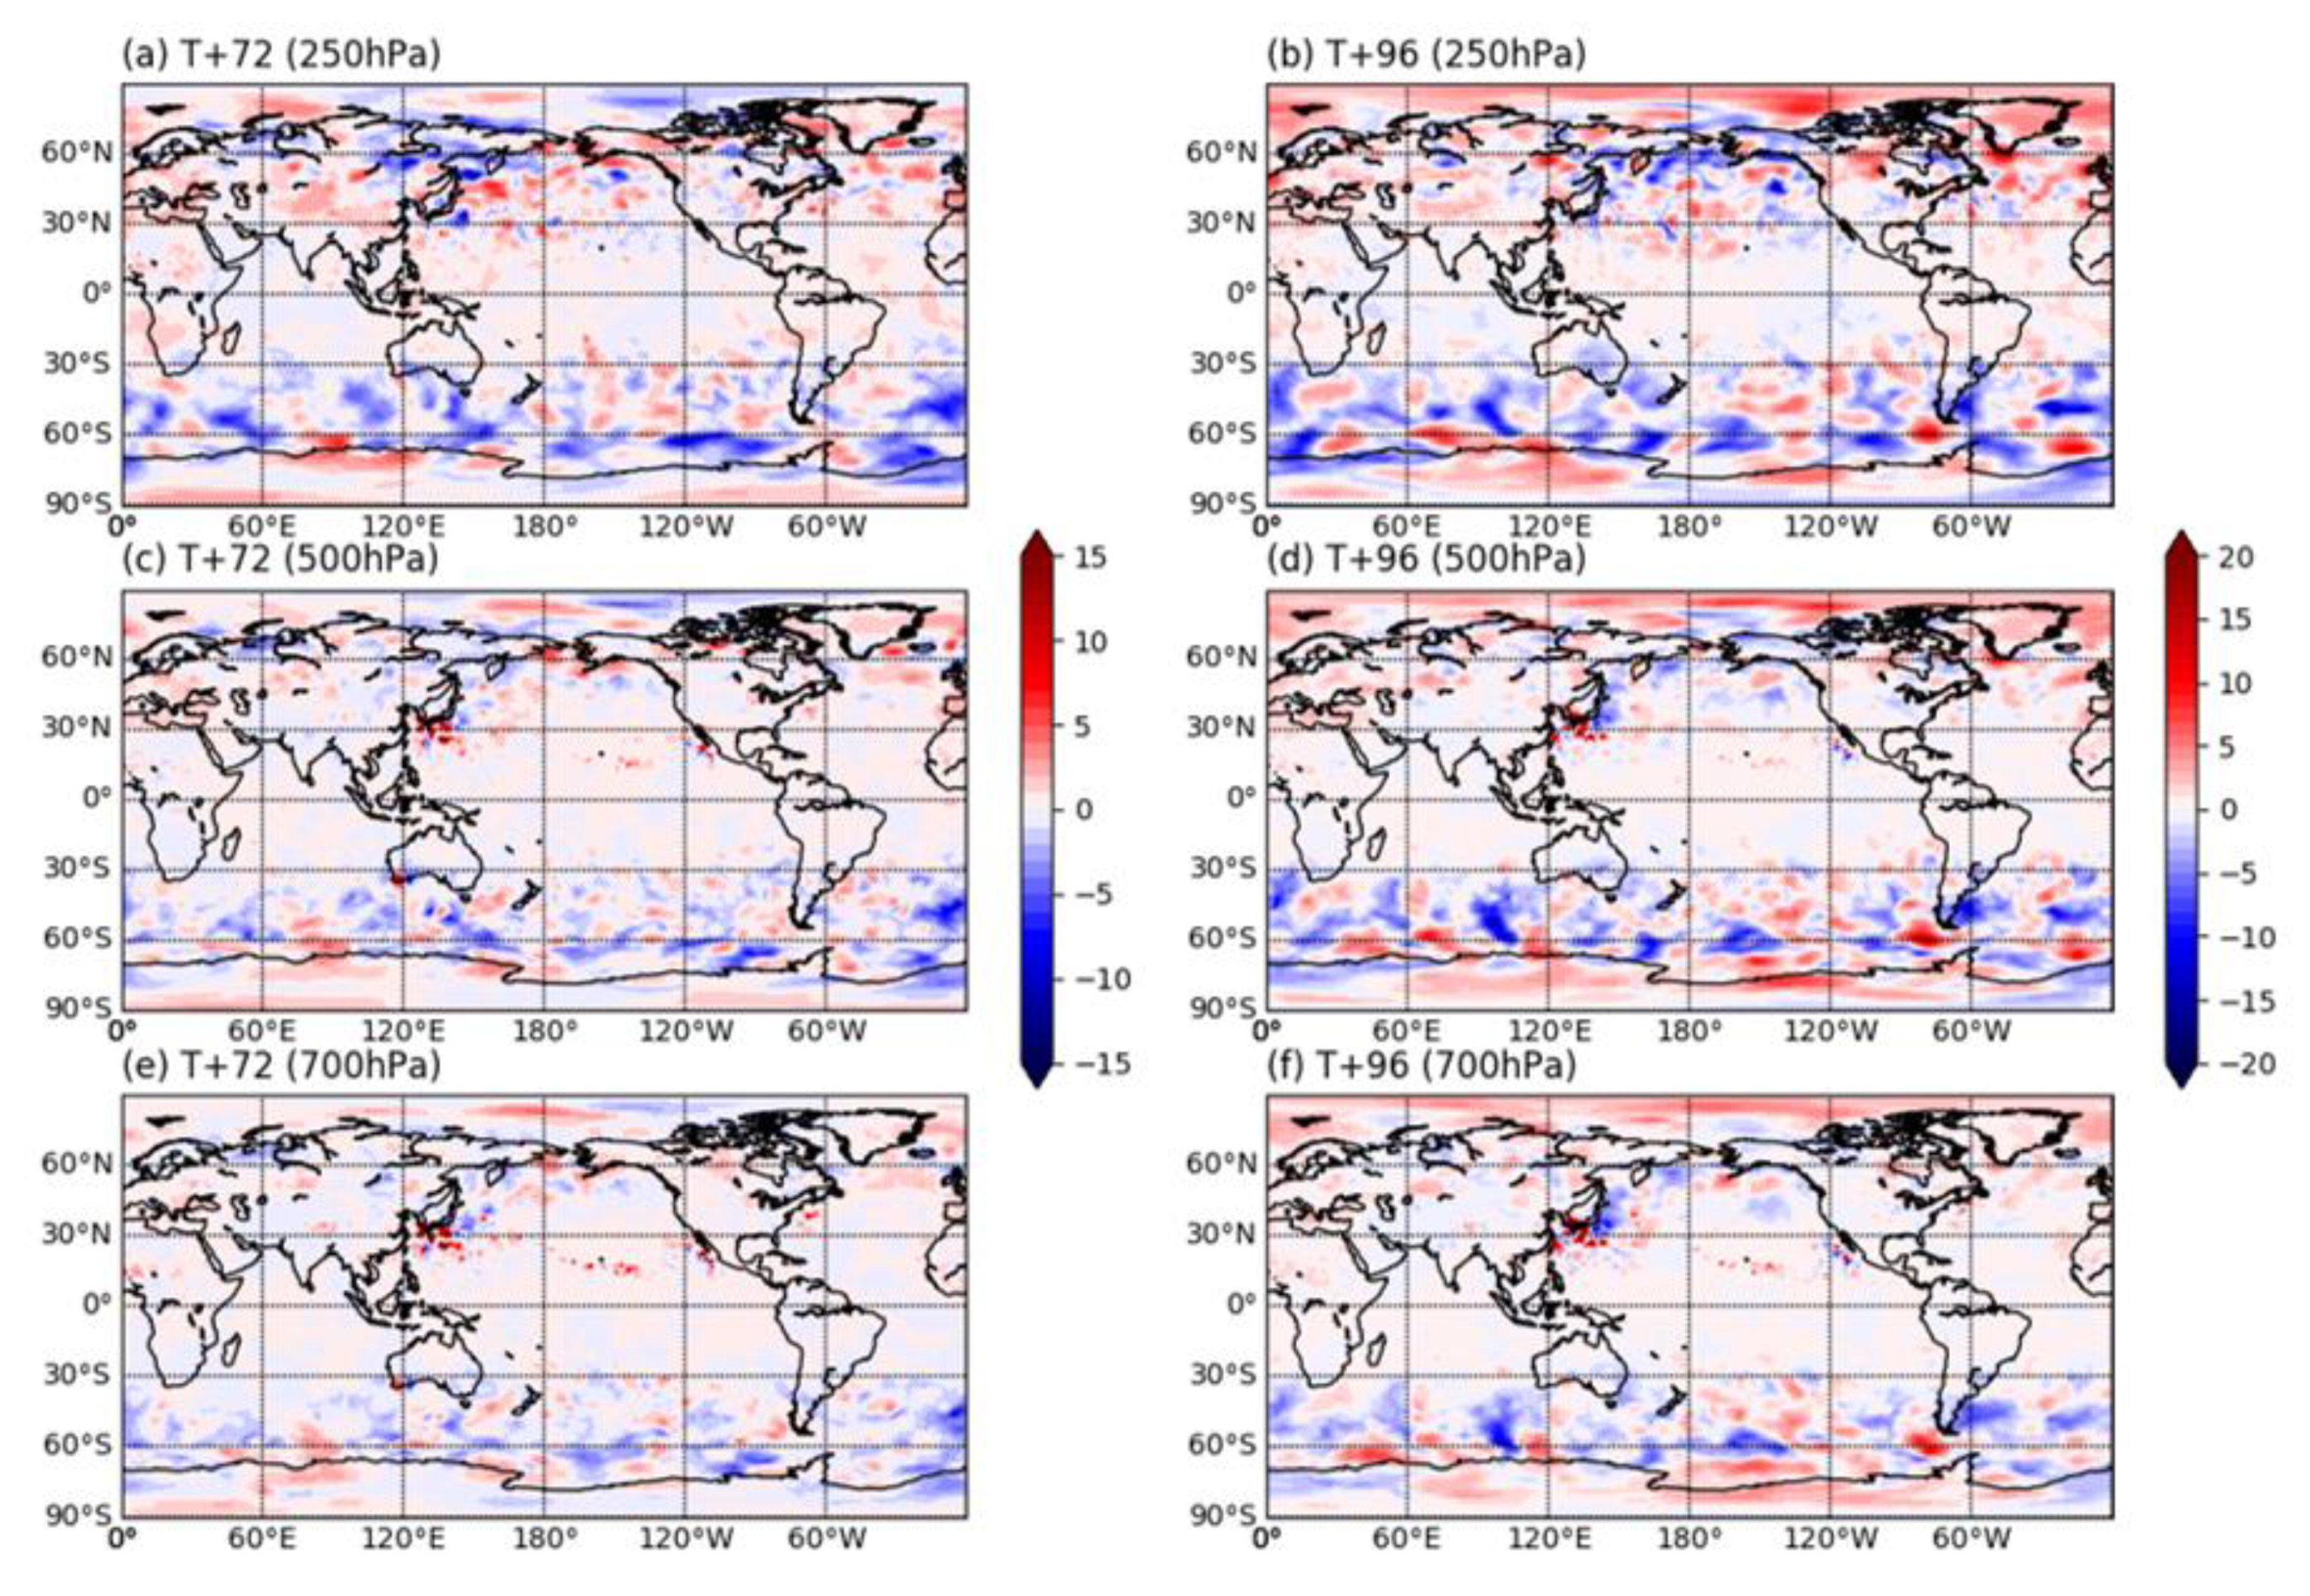
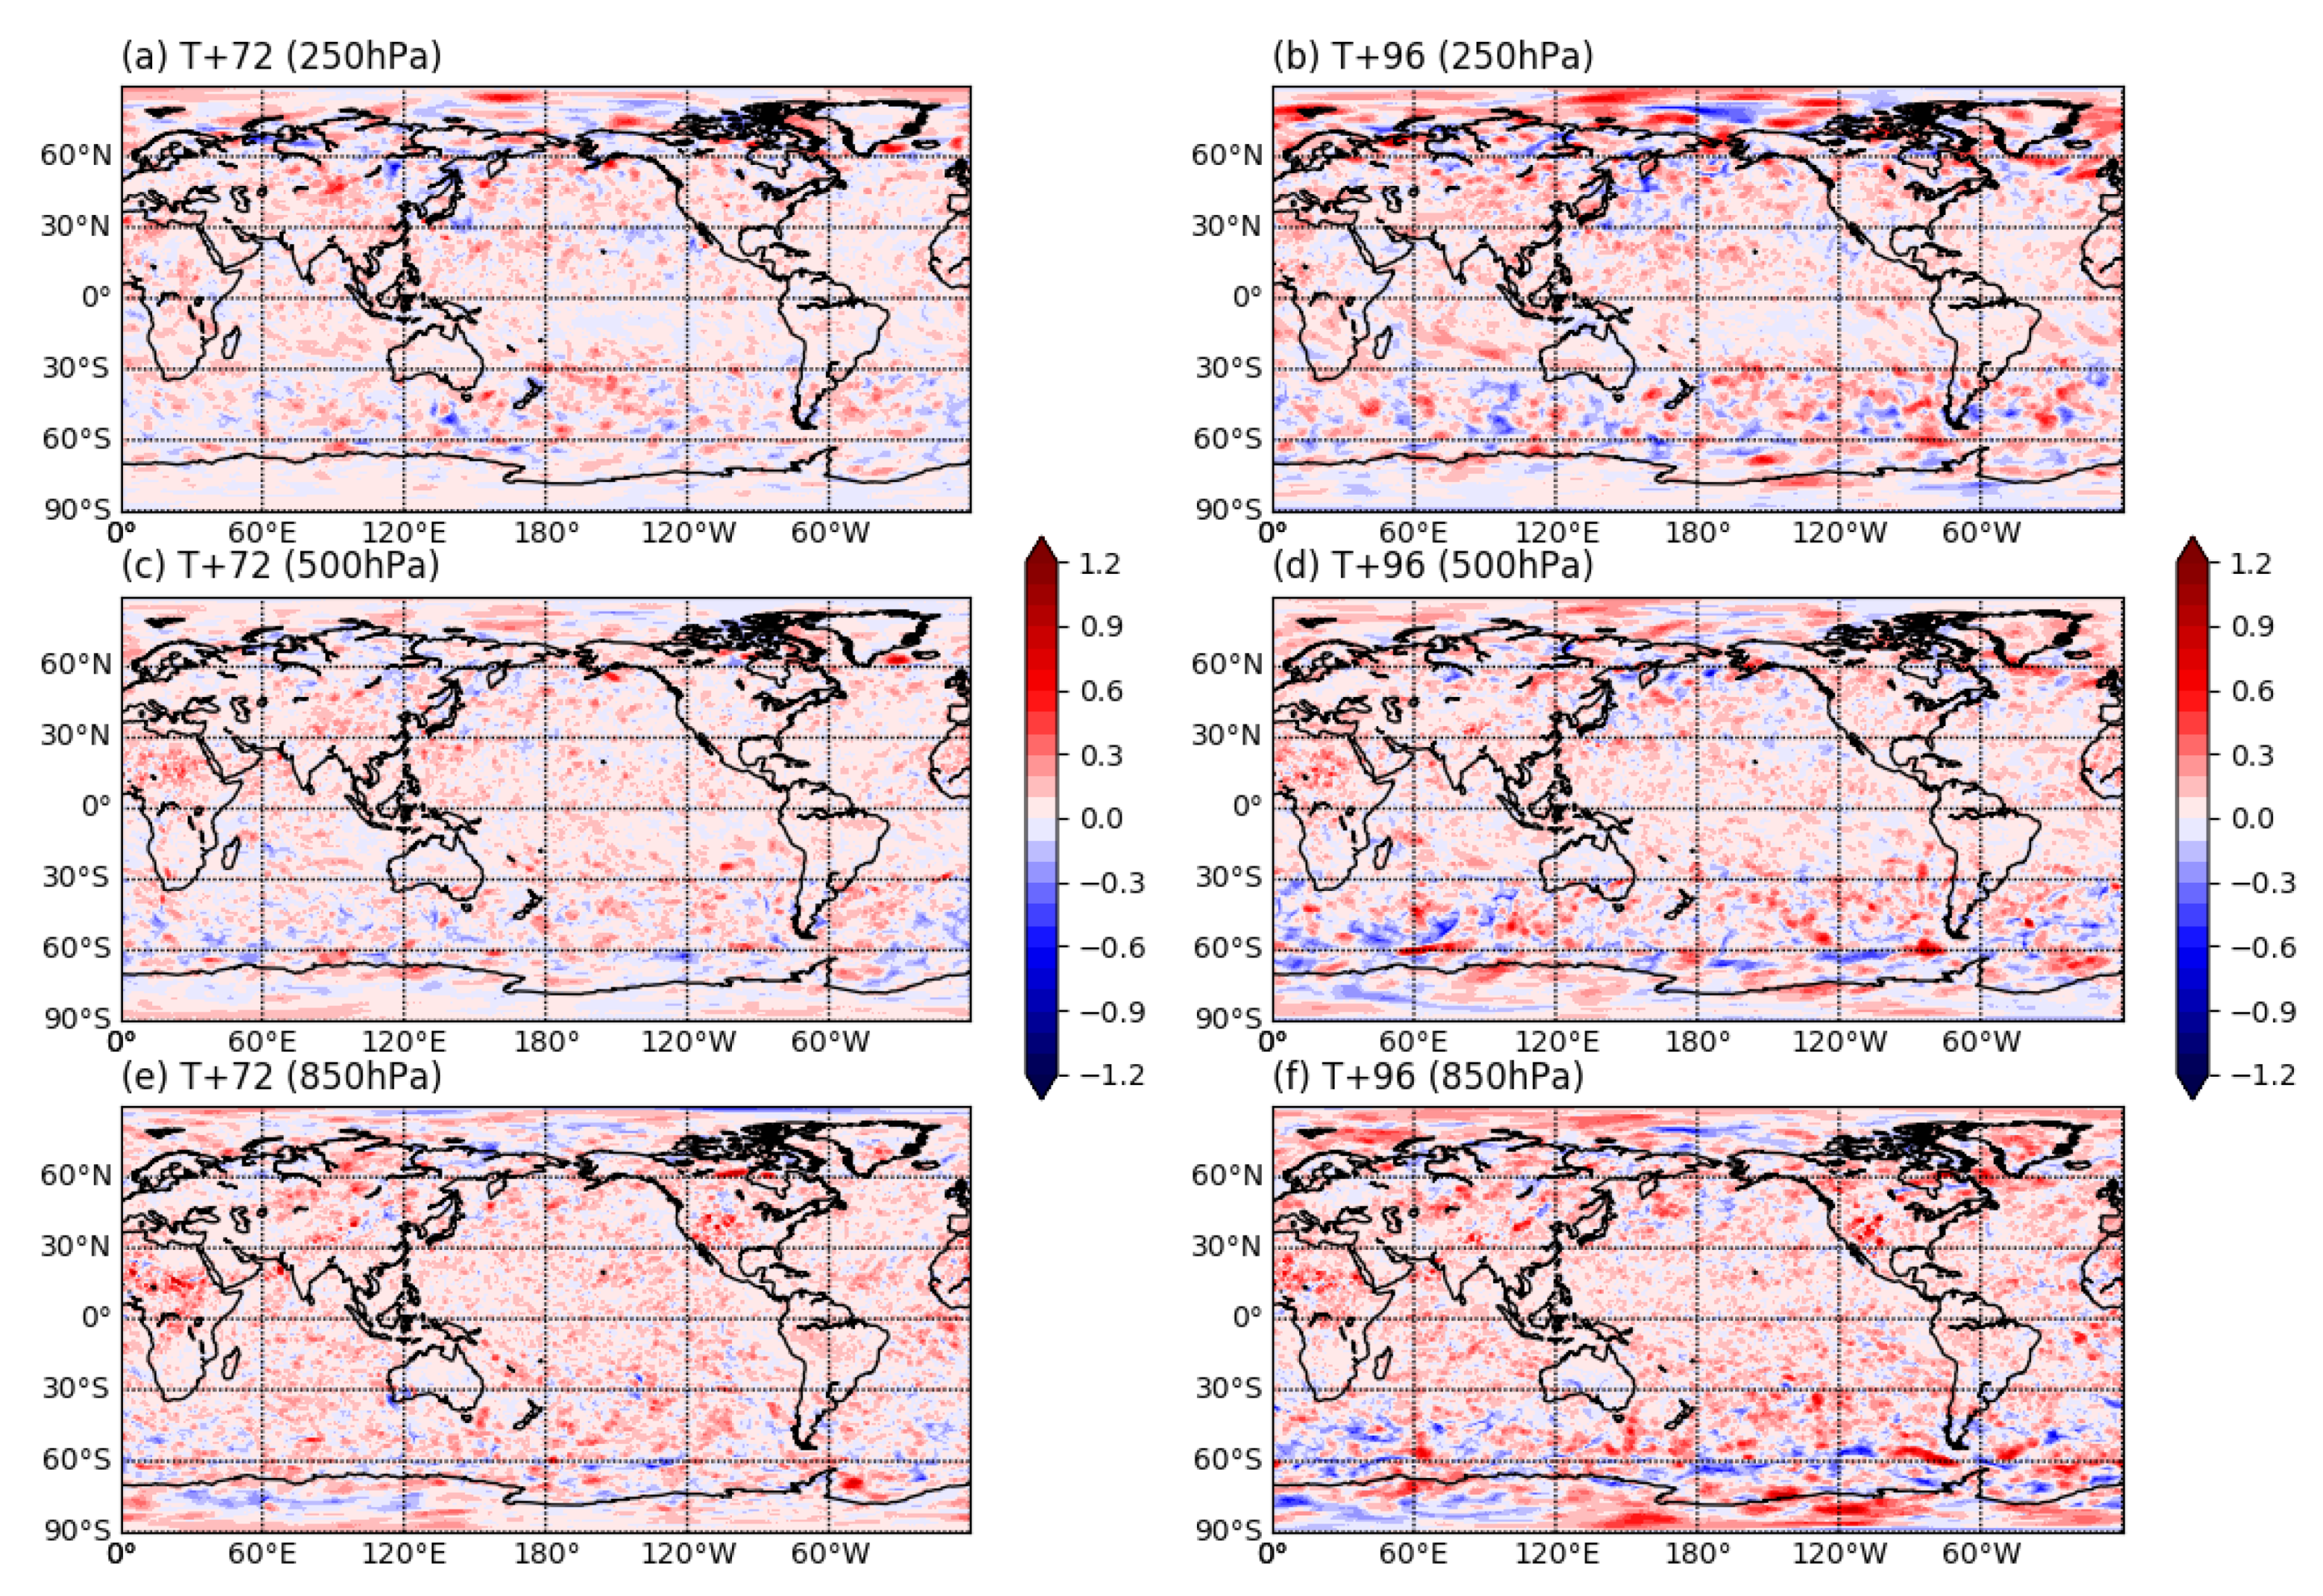
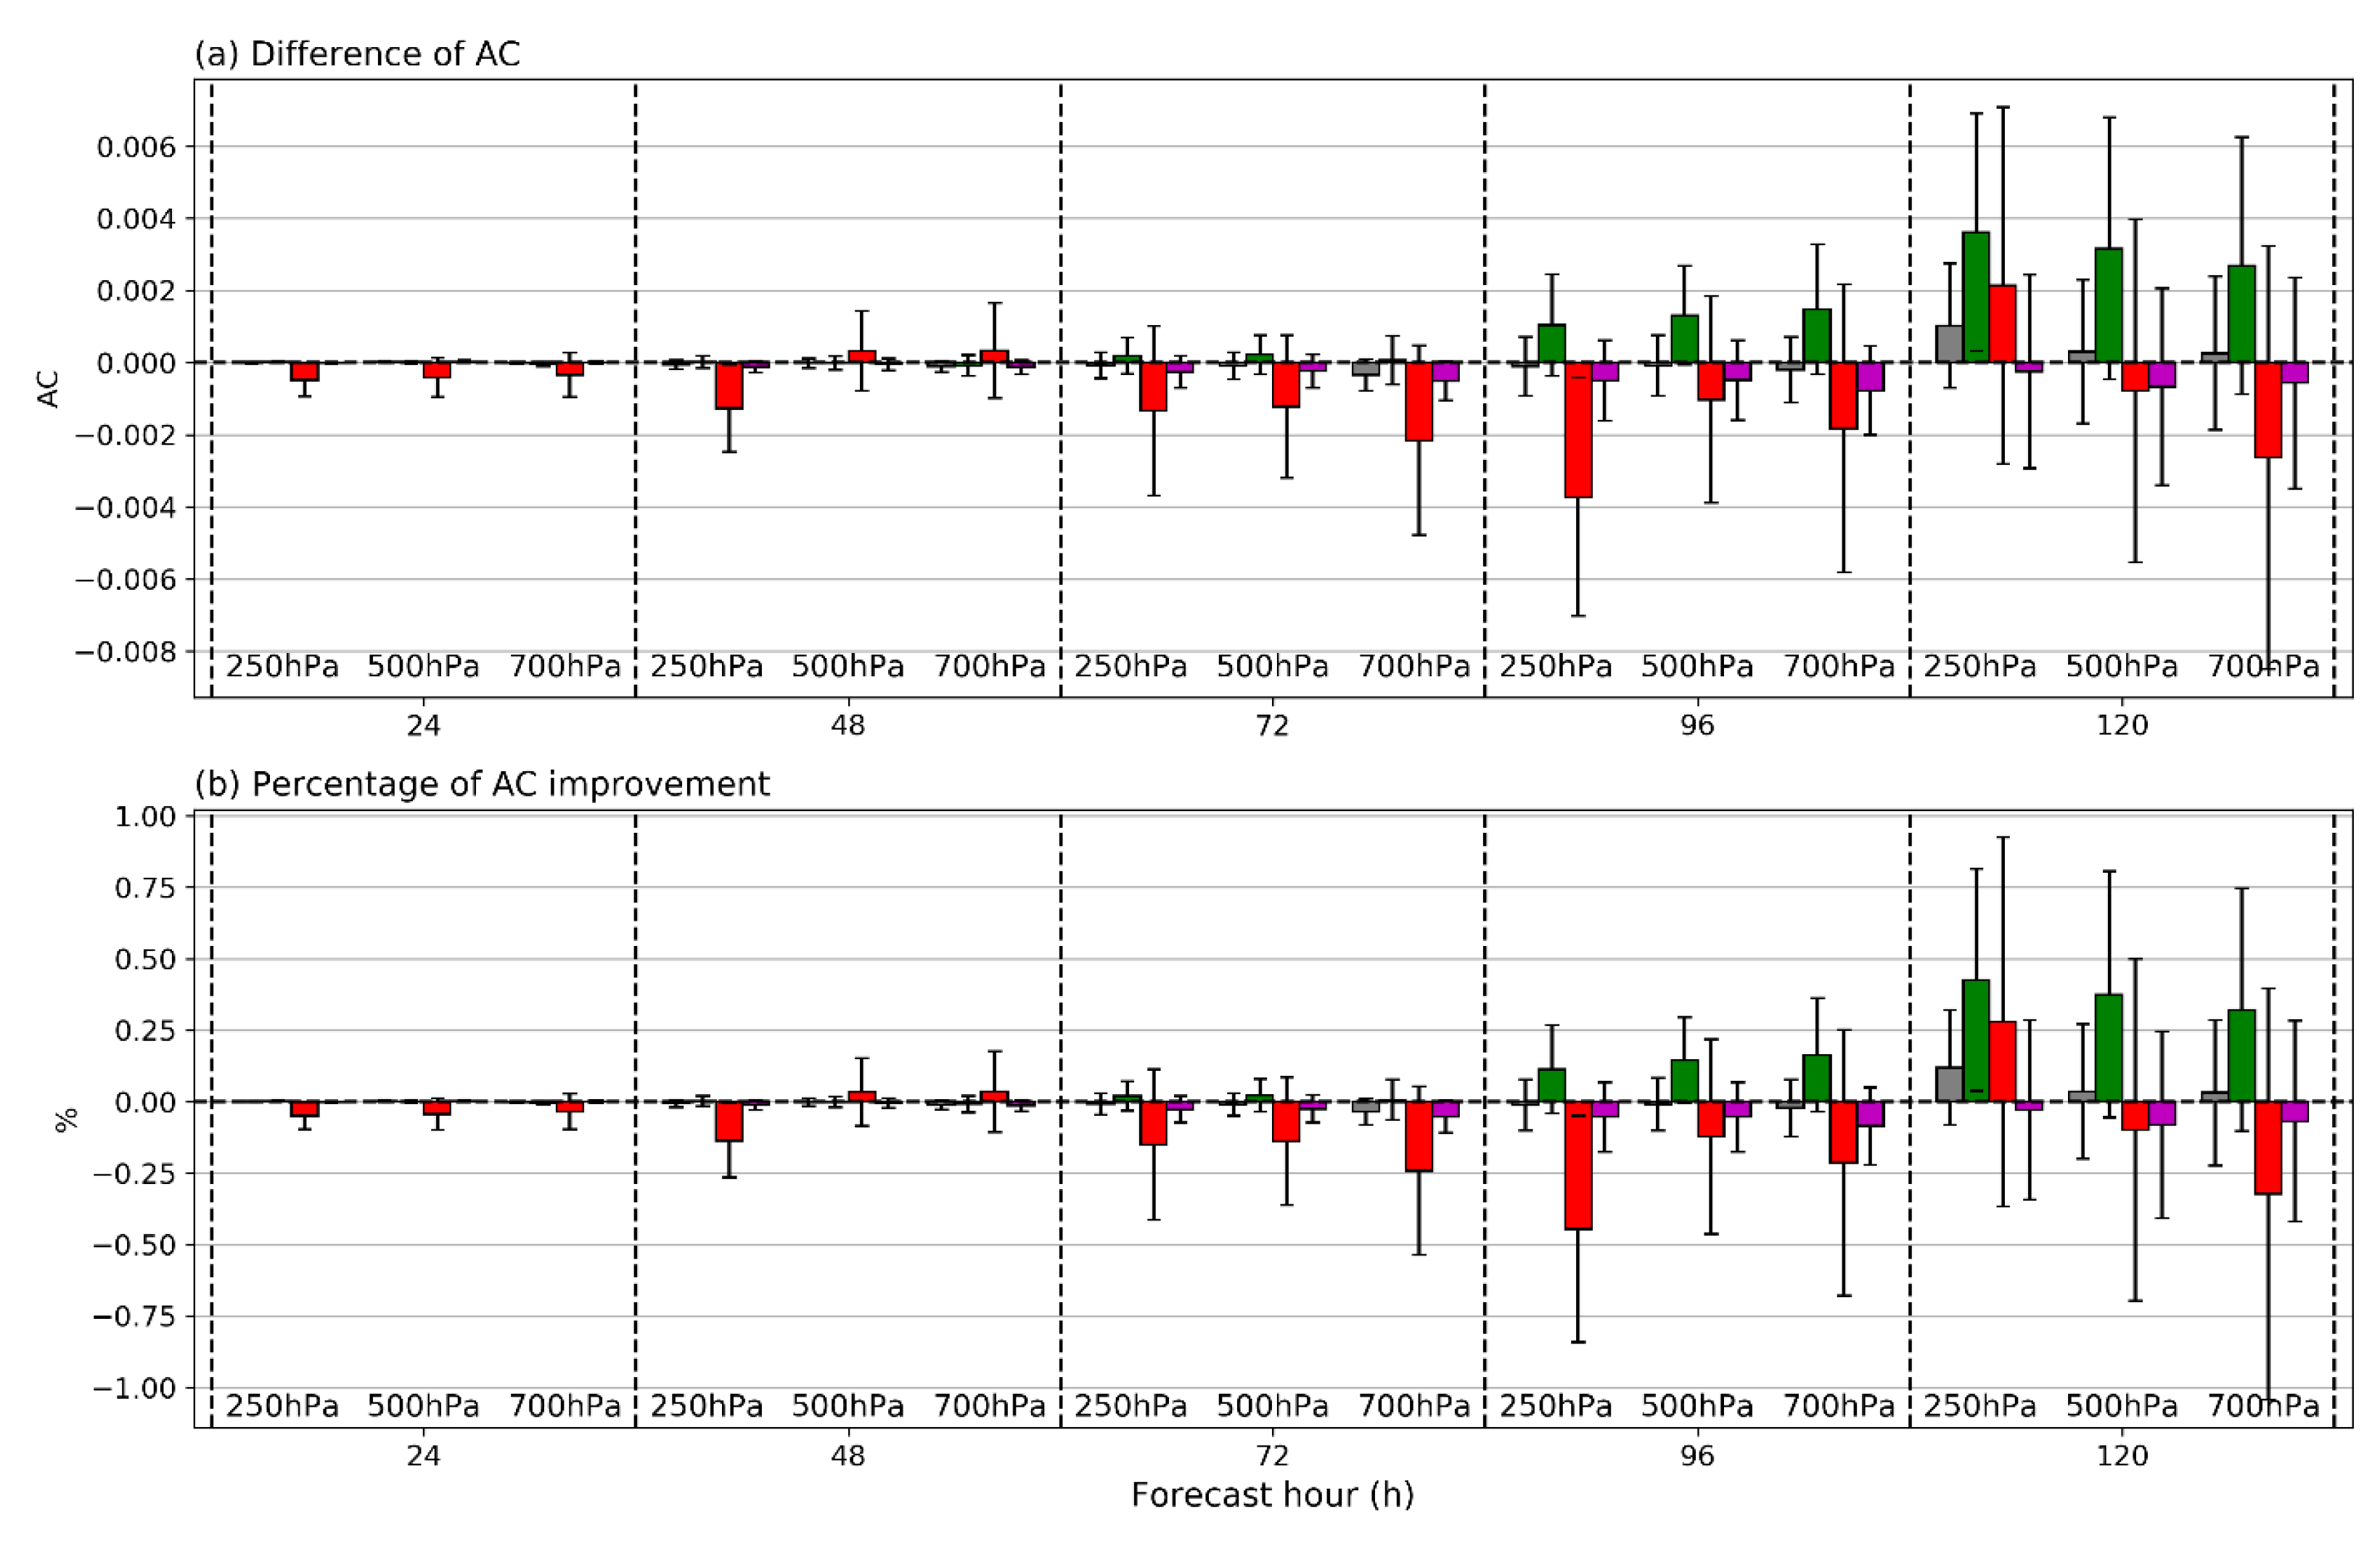
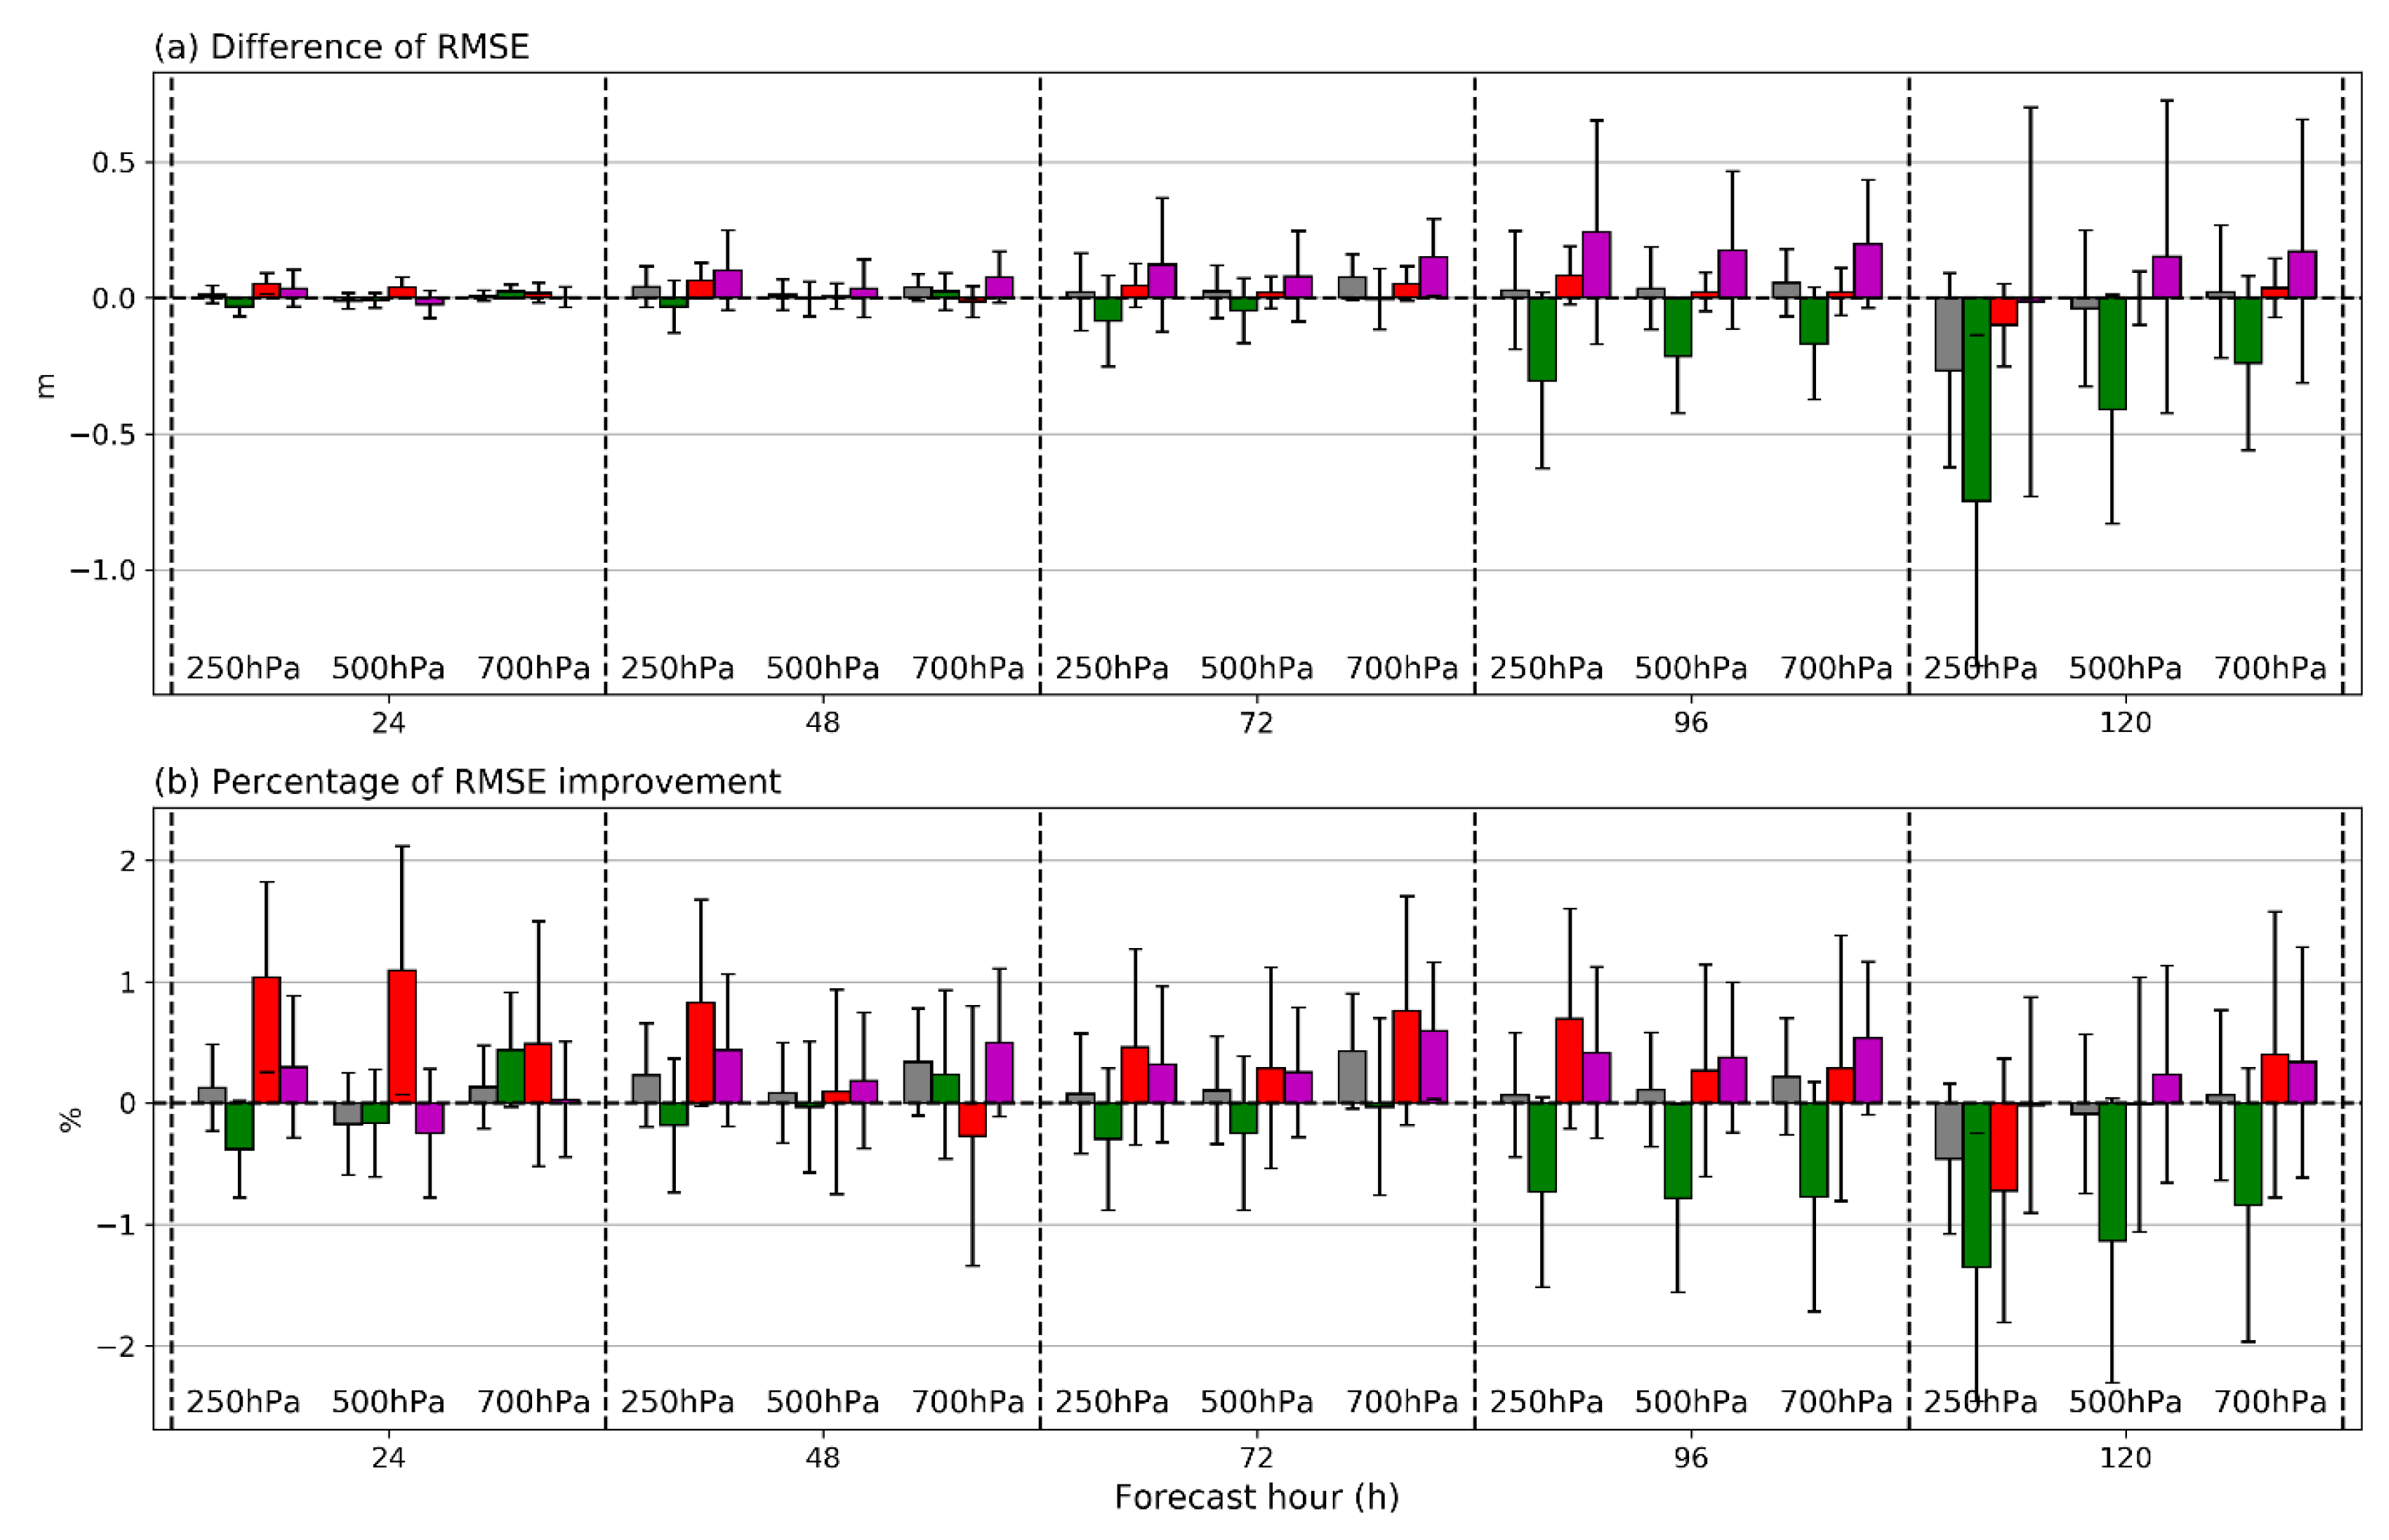
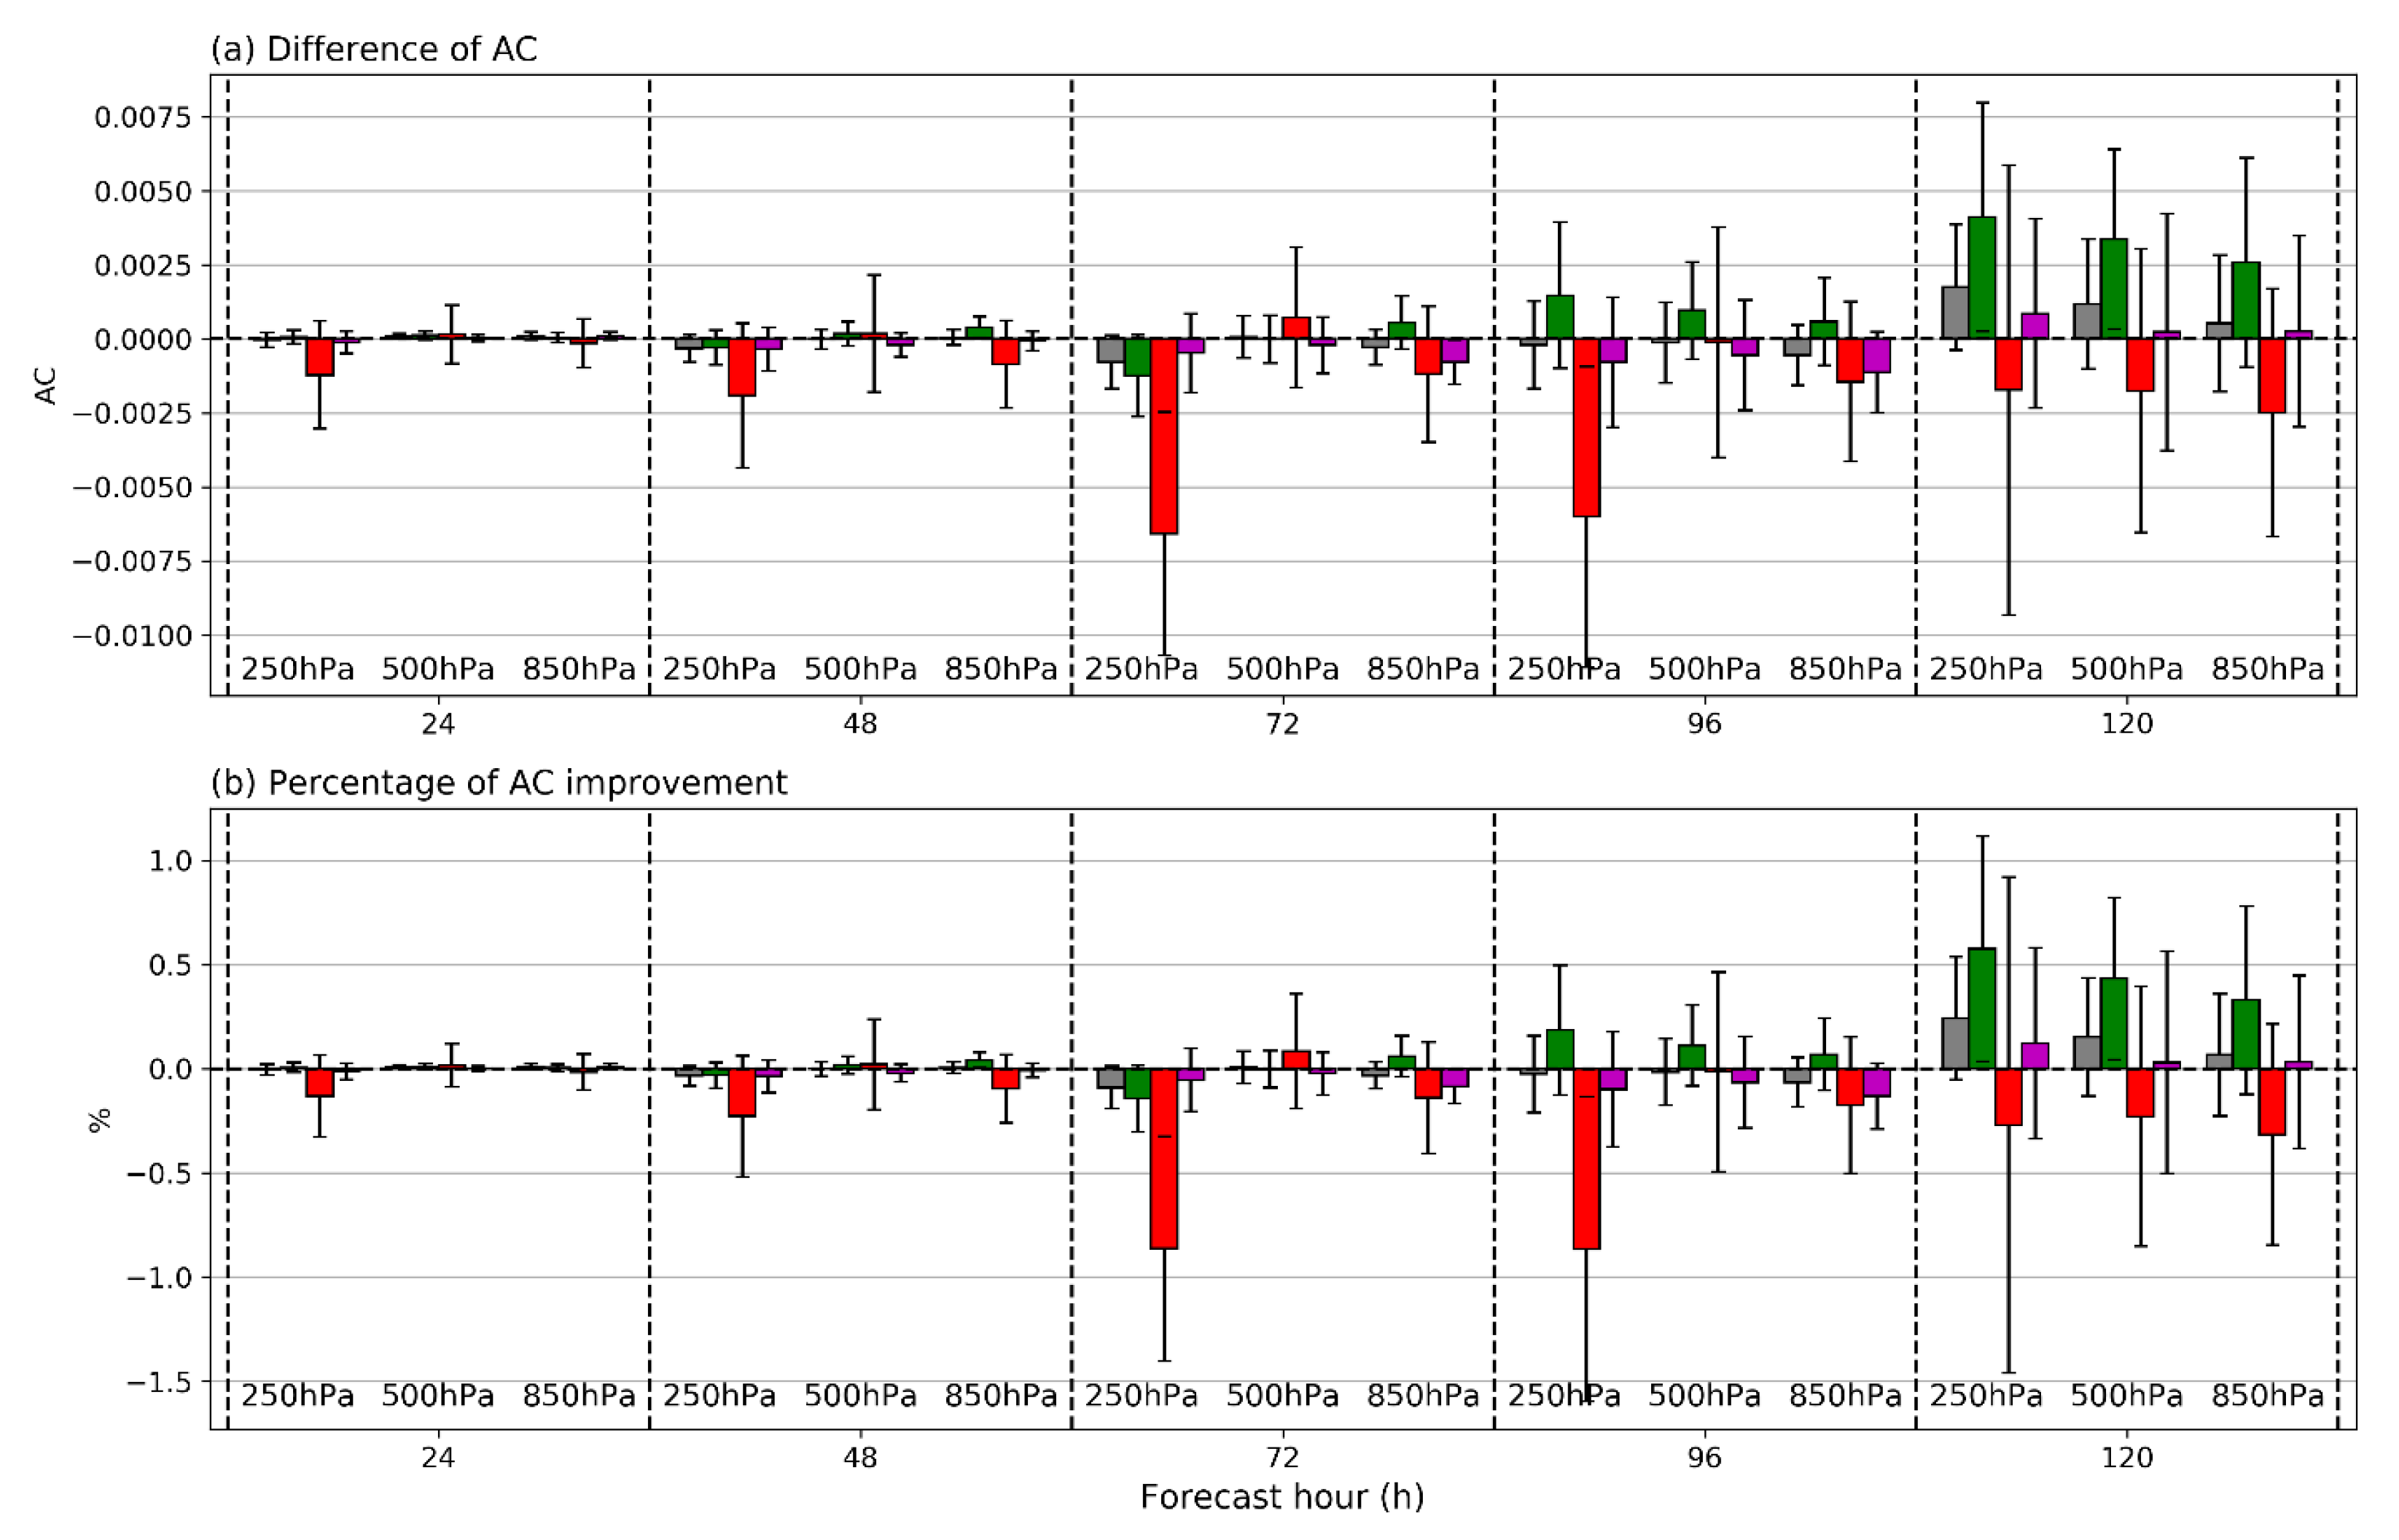
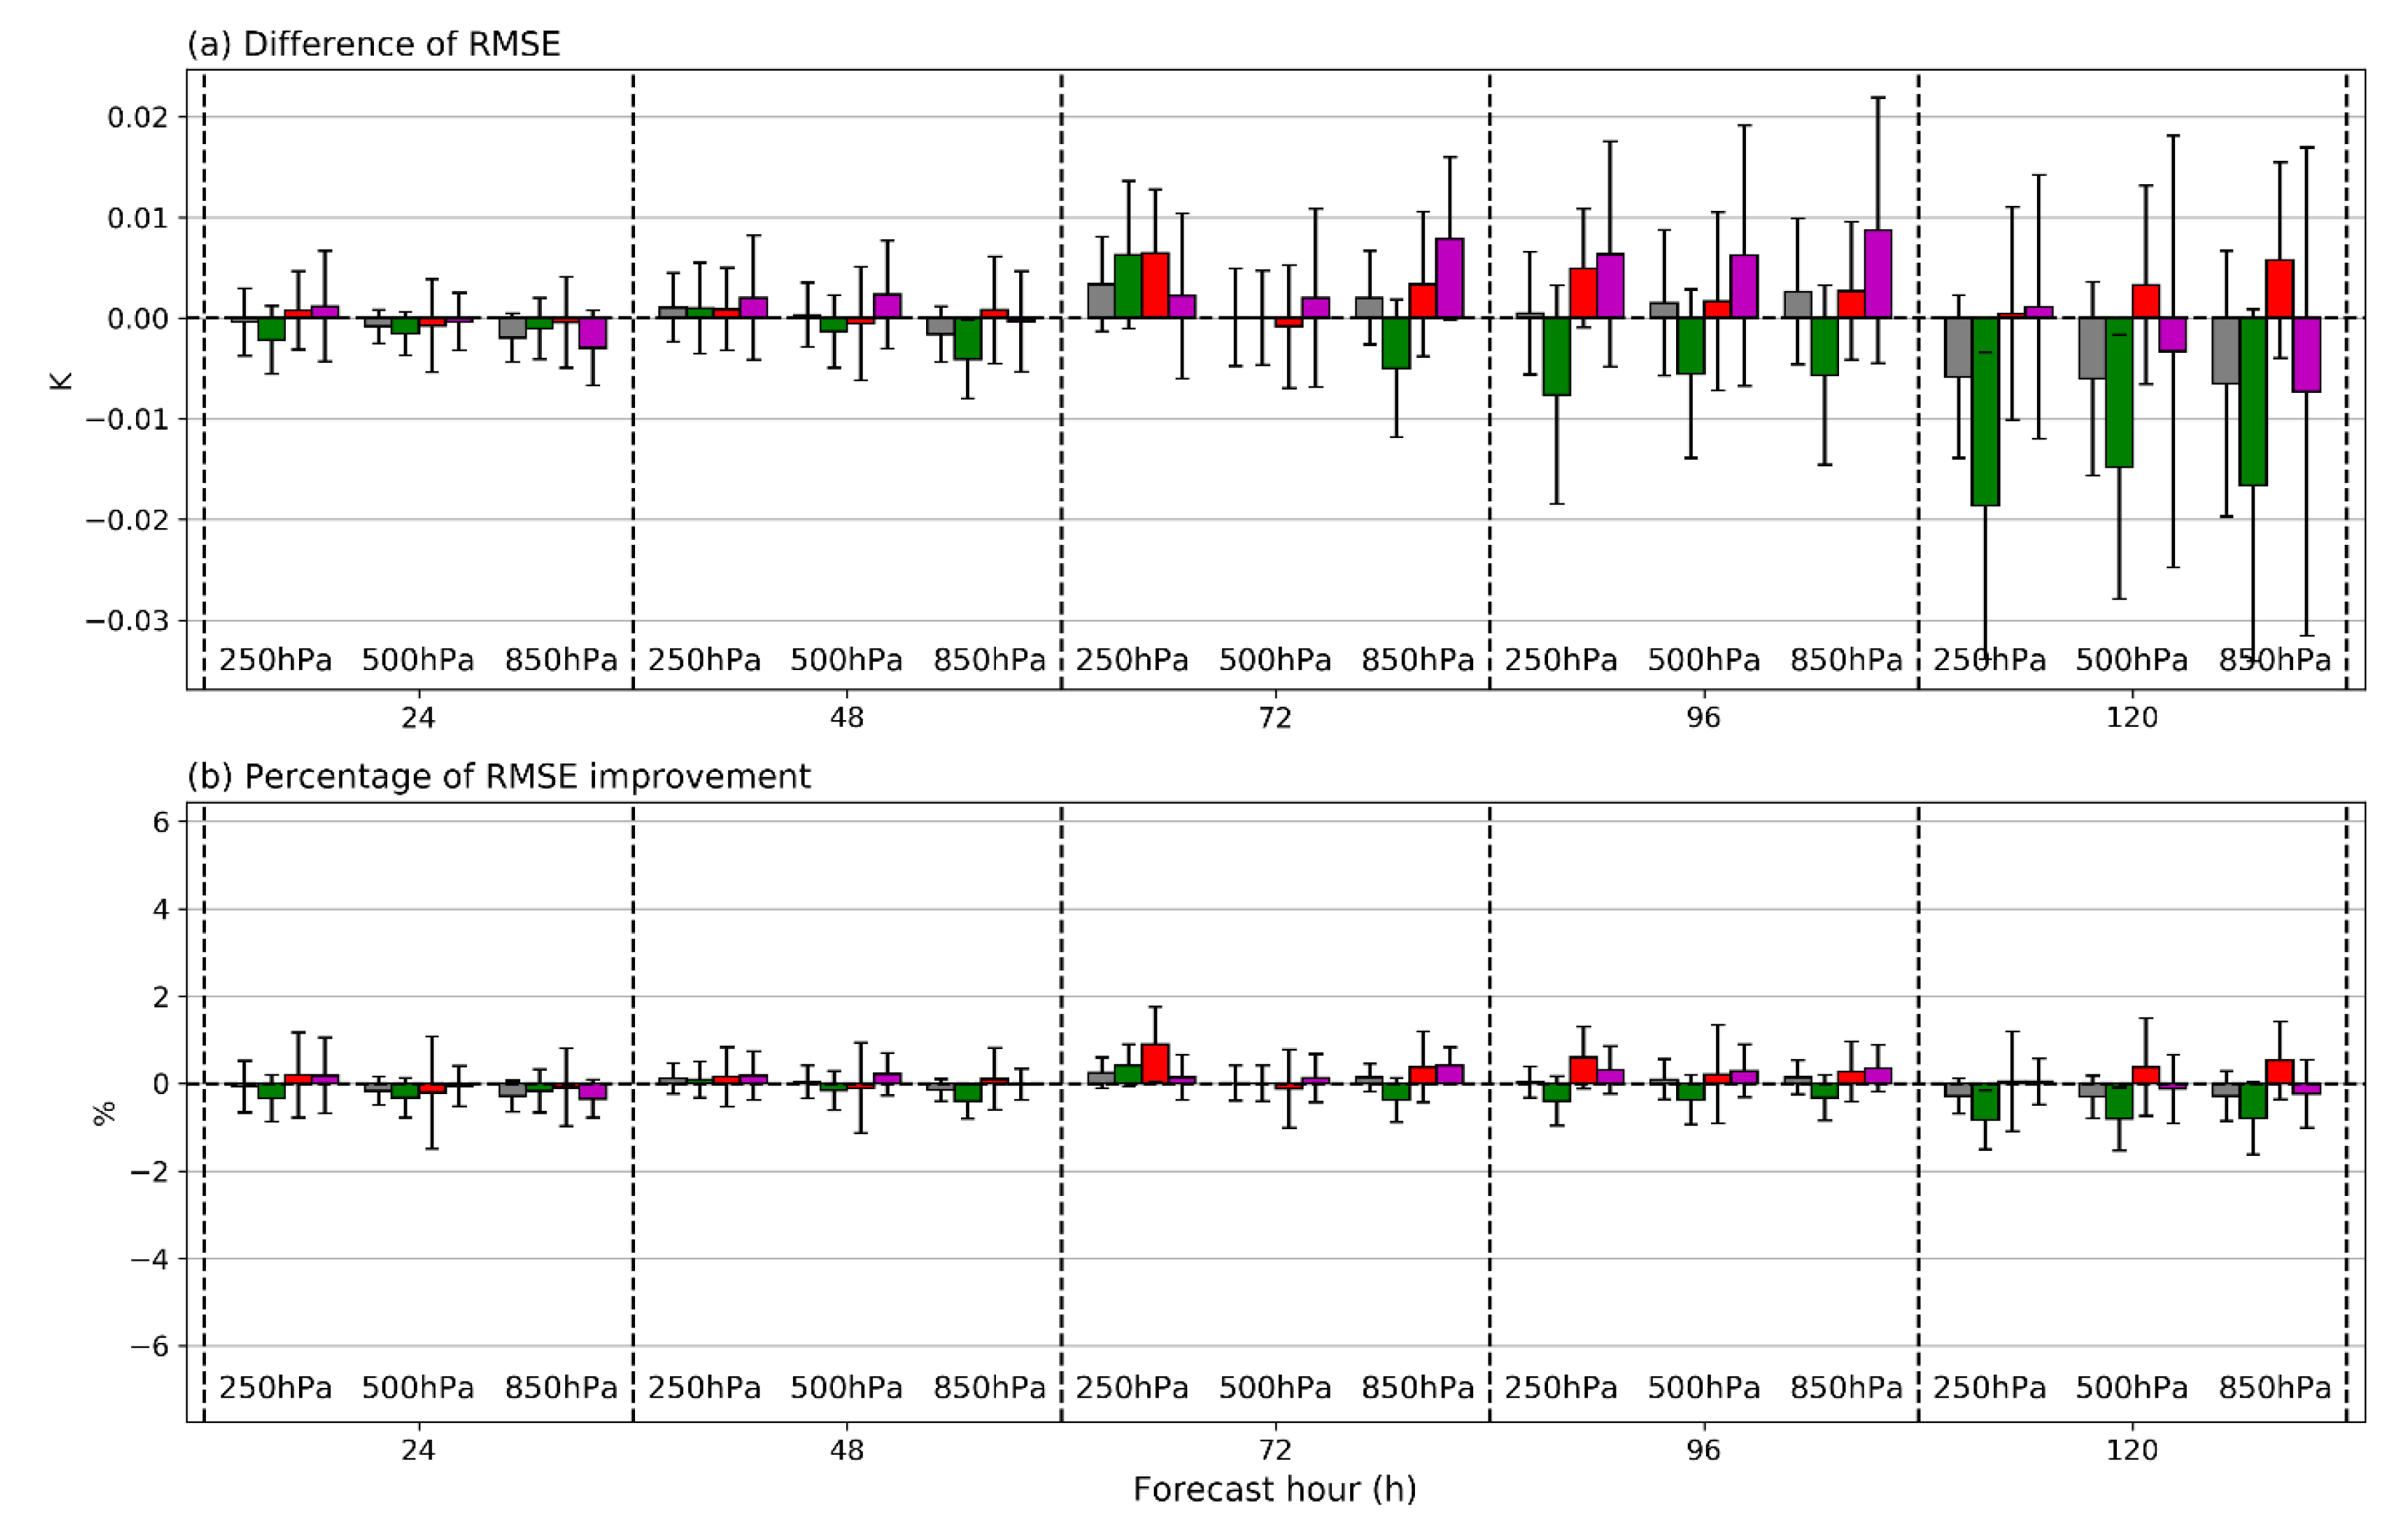
4.2. Assessment of Global Forecast Impact

The impact of different data latency length of LEO IR and MW sounders on the GFS forecast was evaluated by comparing forecast against self-analyses using the NCEP Verification Statistics DataBase (VSDB) package. For the forecast verification, the anomaly correlation (AC) metric, which is one of the most widely used indexes to diagnose the impact of advanced data assimilation skill on weather forecasting, was used. The AC values indicate the spatial correlation between the forecast anomaly and the analysis anomaly for the designated atmospheric parameter. In particular, the forecast errors of 500 hPa geopotential height are widely used to be the key indicators to measure the overall forecast performance because large-scale weather patterns in the middle-level atmosphere near 500 hPa pressure level are well linked with lower-level atmospheric patterns. In addition to the AC, the root-mean-square errors (RMSEs) of the forecast field were also used to diagnose the forecast performance for the trial runs.
Figure 7 and Figure 8 show mean difference in the ACs and RMSEs of geopotential height at three pressure levels (i.e., 250, 500, and 700 hPa) between the latency_20m run and the control run. In addition to the mean difference, the normalized difference of ACs with respect to the control run was also plotted. A positive difference in the AC indicates that the forecast errors for the experiment run are smaller than the control run, meaning that the reduced data latency has a positive forecast impact. On the contrary, a negative difference in the RMSEs indicates a positive forecast impact.
For all three geopotential heights, the ACs tend to decrease with increasing forecast hour (not shown), indicating that the forecast accuracy decreases with the length of forecast hour. As shown in Figure 7a, a positive difference is exhibited in the forecast range from T+48 to T+120, becoming larger with the forecast hour. In particular, the global mean ACs of 500 hPa geopotential height increase up to about 0.3% at 120-h forecast. Moreover, a strong positive impact is found in the Southern Hemisphere for all three geopotential heights (i.e., 250, 500, and 700 hPa), especially at T+96 forecast hour. In the Northern Hemisphere, the difference in the ACs is close to zero and its percentage change is small. However, in the Tropic, a negative impact is shown at 250 hPa at T+120 forecast hour. Similar to the results of ACs, the negative difference of RMSEs of three geopotential heights increases in the forecast range of T+24 to T+96, indicating that the forecast errors are reduced for the latency_20m run as compared to the control run (Figure 8). The forecast errors are significantly reduced in the Southern Hemisphere, with a maximum reduction of about -1.3m at 250 hPa for the T+96 forecast hour. In terms of the percentage analysis, a steady error reduction of about 2.0% is exhibited for the whole forecast range except for the T+120 forecast hour. As shown in Figure 9, strong error reduction is mainly shown in the latitudinal range from 30° S to 70° S at T+72 and T+96 forecast hours, in particular at 250 hPa and 500 hPa pressure levels. In the Tropic and the Northern Hemisphere, the forecast impact is overall neutral. Even though the largest negative value (-4.2%) is present at 500 hPa for the T+120 forecast hour in the Tropics (Figure 8b), this value is statistically insignificant considering the error confidence level. In the Northern Hemisphere (30° N–90° N), the positive/negative impacts are spatially blended, leading to overall neutral impact. However, in the Tropic (30°N–30° S), the departures of RMSEs between two trial runs are almost zero at all three pressure levels at T+72 and T+96 forecast hours (Figure 9).
For temperature forecast verification, the ACs tend to increase slightly in the forecast range of T+48 to T+96 for the latency_20m run at three different pressure levels (Figure 10). Similar to the results of geopotential heights, the maximum forecast impact is exhibited in the Southern Hemisphere, with a maximum improvement of 0.5% at 500 hPa for the T+96 forecast hour. However, in the Tropic, there is strong negative impact at 250 hPa for the forecast range from T+96 to T+120. For the RMSE analysis, it is found that reducing the data latency to 20 min has contributed to improving the temperature forecast at three pressure levels, especially in the Southern Hemisphere, where the error reduction of about 1.0% is present in the range of T+24 to T+96 forecast hour (Figure 11). The positive impact is mainly exhibited in the latitudinal range from 30° S to 70° S at all three pressure levels at T+72 and T+96 forecast hours (Figure 12). In the Northern Hemisphere (30° N–90° N), the positive impacts conflict with other negative impacts in the spatial distribution, making the impact overall neutral. In contrast, in most of the regions in the Tropics (30° N–30° S), the difference of RMSEs between the latency_20m run and the control run is close to zero. The neutral impact shown in the Tropics can be related to many potential factors but seems to because many IR and MW sounding data were filtered out over the cloud that frequently occurs in the Tropics, leading to a small number of satellite data to be assimilated.
Considering that the difference between two trial runs is only an amount of LEO IR and MW sounding data assimilated in the GFS due to different data latency, the positive forecast impact of reduced data latency is attributed to newly added sounding measurements for the latency_20m, which provide unique information on the vertical structure of primary atmospheric variables (i.e., temperature and moisture). Based on the forecast verification results, it can be concluded that WSP-recommended data latency of 20 min on the LEO IR and MW sounders is beneficial for improving the global weather forecasting.
To examine additional forecast benefit induced by reducing the data latency from 20 min to 5 min, we also compared the forecast errors between the latency_5m run and the latency_20m run. Figure 13 and Figure 14 show the difference of forecast errors (i.e., AC and RMSE) of geopotential heights at three different pressure levels between the latency_5m run and the latency_20m run. For both of the ACs and RMSEs, the global mean differences are almost zero for the whole forecast hours at all three pressure levels, meaning that there are no extra forecast benefits gained by reducing the data latency from 20 min to 5 min. The forecast errors tend to increase in the Tropic and the Southern Hemisphere but decrease in the Northern Hemisphere for the latency_5m run as compared to the latency_20m run, but the error changes are not statistically significant. In addition to the geopotential height, the departures of ACs and RMSEs of temperature between the latency_5m run and the latency_20m run show a neutral forecast impact (Figure 15 and Figure 16). The difference in the number of assimilated satellite measurements between the latency_20m run and the latency_5m run is about 5% for all IR and MW sensors (Figure 3 and Figure 4). This slight data difference is unlikely to change the forecast impact when verified over a length of time.

5. Conclusions and Discussion

Currently, with the near-real-time DBNet system coordinated by the WSP, the delivery speed of the LEO satellite sounder (IR and MW) measurement to the operational GFS model is significantly enhanced, increasing the number of the satellite data assimilated in the GFS. However, the current data latency of LEO satellites is still longer than the data latency of 20 min recommended by the WSP due to the limited spatial coverage of DBNet stations and the data processing time. Thus, in this study, the impact of reduced data latency of LEO IR and MW sounders on the global weather forecasting was examined using the NCEP GFS under the assumption that the WSP-recommended 20-min latency is met. This study also evaluated the forecast benefit of further reducing the latency to 5 min. To assess the forecast impact of reduced data latency, the satellite data input files to GFS were created depending on the different data latency requirement (i.e., 20 min and 5 min) for the IR and MW sounder data being assimilated in GFS. Three trial experiments (i.e., control, latency_20m, and latency_5m runs) were conducted from 30 June to 22 August 2018. This trial included a seven-day spin-up period for model resolution change. For the control run, the original LEO satellite data used in the operational GFS were assimilated. Apart from the LEO IR and MW sounder data, the same baseline observations were assimilated for all three trial runs.
The assimilated data ratios of the IR and MW sounders reach an average of about 92% and 95% for the latency_20m and latency_5m runs, respectively, compared to less than 90% for the control run. In particular, for the IASI onboard MetOp–A and AIRS onboard Aqua satellite, the difference in data usage between the control run and two experiment runs is larger than 20%. The increase in the number of assimilated satellite data from reduced data latency is mainly presented on the spectral channels sensitive to the middle and upper troposphere, away from surface and cloud contaminations. Forecast verification results show that reducing the data latency to 20 min has a large positive impact, particularly in the Southern Hemisphere. The improvement is likely due to the increased number of assimilated IR and MW sounder measurements by the reduced data latency of 20 min as forecast improvements in this part of the globe are driven by satellite observations. However, the forecast impact analysis shows that a further reduction of data latency to 5 min has an overall neutral impact, implying that the 20–minute data latency recommended by WSP is optimal for maximizing the forecast impact from the IR and MW sounder measurements.
In this study, it was demonstrated that reducing the data latency for the LEO IR and MW sounder has a positive impact on the global forecasts, but it could be achieved if currently operating LEO IR and MW sounder data are uniformly delivered to the GFS assimilation system within 20 min of data latency. Unfortunately, as of now, it would be difficult to reduce the data latency to 20 min because the DBNet ground stations cannot be built over the ocean that occupies most of the Earth's surface, in particular, in the Southern Hemisphere. However, by building extra DBNet ground stations on the areas that current DBNet stations do not cover and improving the advanced data processing system, current data latency can be further reduced. In addition, it is likely premature to mention, but the data relay system between the LEO satellites and the GEO satellites can be one of the solutions to further reduce the data latency of LEO satellites. With this data relay system, the satellites flying over the ocean can transmit the observed data to the user communities in real time. However, to make such plans (i.e., expanding the DBNet station coverage and building the data relay system) feasible, huge investments are required in terms of cost and technology. Therefore, continuous cooperation of global satellite-operating institutes is necessary, aiming to meet the WSP recommendation.

Author Contributions

Conceptualization, Y.-C.N. and A.H.N.L.; methodology, Y.-C.N. and A.H.N.L.; formal analysis, Y.-C.N., A.H.N.L., and H.-L.H.; writing—original draft preparation, Y.-C.N.; writing—review and editing, A.H.N.L., H.-L.H., and M.D.G.; project administration, H.-L. H. and M.D.G. All authors have read and agreed to the published version of the manuscript.

Funding

This project was funded by the Joint Polar Satellite System Proving Ground and Risk Reduction Program Grant NA115NES4320001.

Acknowledgments

The trial experiments were run on the NOAA/NESDIS Supercomputer for Satellite Simulations and data assimilation Studies (S4) located at the University of Wisconsin–Madison.

Conflicts of Interest

The authors declare no conflict of interest.

Abbreviations

Glossary of Terminology and Abbreviations inTable 1 and Table 2
ABIAdvanced Baseline Imager
AIREPAircraft Report
AIRSAtmospheric Infrared Sounder
AMDARAircraft Meteorological Data Relay
AMIAdvanced Meteorological Imager
AMSU-AAdvanced Microwave Sounding Unit-A
AMVAtmospheric Motion Vector
ATMSAdvanced Technology Microwave Sounder
ATOVSAdvanced TIROS Operational Vertical Sounder
AquaSatellite in EOS series
AVHRRAdvanced Very High-Resolution Radiometer
BOGUSBogus observations generated by national meteorological centers
COSMICConstellation Observing System for Meteorology Ionosphere and Climate
CrISCross-track Infrared Sounder
DMSPDefense Meteorological Satellite Program
EOSEarth Observing System
EUMETSAT European Organization for the Exploitation of Meteorological Satellites
GEO Geosynchronous-orbiting (satellite)
GOES Geostationary Operational Environmental Satellite
GPSRO Global Positioning System Radio Occultation
GRAS GNSS Receiver for Atmospheric Sounding
EUMETSAT European Organization for the Exploitation of Meteorological Satellites
GEO Geosynchronous-orbiting (satellite)
GOES Geostationary Operational Environmental Satellite
GPSRO Global Positioning System Radio Occultation
GRAS GNSS Receiver for Atmospheric Sounding
Himawari Geostationary satellite operated by JMA
HIRS High Resolution Infrared Radiation Sounder
IASI Infrared Atmospheric Sounding Interferometer
JMA Japan Meteorological Agency
LEO Low-Earth orbiting (satellite)
METAR Meteorological Aerodrome Report
MetOp Meteorological Operational satellite series operated by EUMETSAT
MHS Microwave Humidity Sounder
MODIS Moderate Resolution Imaging Spectroradiometer
NEXRAD Next Generation Weather Radar
NOAA National Oceanic and Atmospheric Administration
PIBALPilot balloon (Upper-level wind observation)
S-NPP Suomi National Polar-orbiting Partnership
SARSynthetic Aperture Radar
SSMIS Special Sensor Microwave Imager/Sounder
TanDEM-X German SAR Earth observation satellite
Terra Satellite in EOS series
TerraSAR-X German SAR Earth observation satellite

References

  1. Zapotocny, T.H.; Jung, J.A.; Le Marshall, J.F.; Treadon, R.E. A two-season impact study of satellite and in situ data in the NCEP Global Data Assimilation System. Weather Forecast. 2007, 22, 887–909. [Google Scholar] [CrossRef] [Green Version]
  2. Joo, S.; Eyre, J.; Marriott, R. The impact of MetOp and other satellite data within the Met Office global NWP system using an adjoint-based sensitivity method. Mon. Weather Rev. 2013, 141, 3331–3342. [Google Scholar] [CrossRef]
  3. Bauer, P.; Thorpe, A.; Brunet, G. The quiet revolution of numerical weather prediction. Nature 2015, 525, 47–55. [Google Scholar] [CrossRef] [PubMed]
  4. Hilton, F.; Atkinson, N.C.; English, S.J.; Eyre, J.R. Assimilation of IASI at the Met Office and assessment of its impact through observing system experiments. Q. J. R. Meteorol. Soc. 2009, 135, 495–505. [Google Scholar] [CrossRef]
  5. Wang, P.; Li, J.; Li, Z.; Lim, A.H.N.; Li, J.; Schmit, T.J.; Goldberg, M.D. The impact of Cross-track Infrared Sounder (CrIS) cloud-cleared radiances on Hurricane Joaquin (2015) and Matthew (2016) forecasts. J. Geophys. Res. Atmos. 2017, 122, 13201–13218. [Google Scholar] [CrossRef] [Green Version]
  6. Menzel, W.P.; Schmit, T.J.; Zhang, P.; Li, J. Satellite based atmospheric infrared sounder development and applications. Bull. Am. Meteorol. Soc. 2018, 99, 583–603. [Google Scholar] [CrossRef]
  7. Kim, S.-M.; Kim, H.M. Forecast sensitivity observation impact in the 4DVAR and hybrid-4DVAR data assimilation systems. J. Atmos. Ocean. Technol. 2019, 36, 1563–1575. [Google Scholar] [CrossRef]
  8. Migliorini, S.; Candy, B. All-sky satellite data assimilation of microwave temperature sounding channels at the Met Office. Q. J. R. Meteorol. Soc. 2019, 145, 867–883. [Google Scholar] [CrossRef]
  9. WMO Guide to the Direct Broadcast Network for Near-real-time Relay of Low Earth Orbit Satellite Data: Attachment to the Guide to the WMO Information System (WMO-No. 1061). Available online: https://library.wmo.int/doc_num.php?explnum_id=4135 (accessed on 26 May 2020).
  10. Lin, H.; Weygandt, S.; Benjamin, S.; Hu, M. Satellite radiance data assimilation with the hourly updated rapid refresh. Weather Forecast. 2017, 32, 1273–1287. [Google Scholar] [CrossRef]
  11. Gumley, L.; Goldberg, M.; Flynn, B.; Santek, D. NOAA Direct Broadcast Real-Time Network (DBRTN): Advanced infrared and microwave sounder data from polar orbiting satellites for numerical weather prediction (NWP) and other time-sensitive applications. In Proceedings of the 2018 AGU Fall Meeting, Washington, DC, USA, 10–14 December 2018. [Google Scholar]
  12. Goldberg, M. NOAA Direct Broadcast Data Initiative to Meet NWP Latency Requirements. CGMS-41 NOAA-WP-13. Available online: https://www.cgms-info.org/documents/documents-cgms/2067741.pdf (accessed on 26 May 2020).
  13. Wang, P.; Li, J.; Schmit, T.J. The impact of low latency satellite sounder observations on local severe storm forecasts in regional NWP. Sensors 2020, 20, 650. [Google Scholar] [CrossRef] [PubMed] [Green Version]
  14. Diaz, S.W.; Casey, S.P.F.; Cucurull, L. Impact of satellite data latency on global weather forecasts. In Proceedings of the 2020 AMS Annual Meeting, Boston, MA, USA, 12–15 January 2020. [Google Scholar]
  15. Yang, F.; Pan, H.-L.; Krueger, S.K.; Moorthi, S.; Lord, S.J. Evaluation of the NCEP global forecast system at the ARM SGP site. Mon. Weather Rev. 2006, 134, 3668–3690. [Google Scholar] [CrossRef]
  16. Wang, X.; Parrish, D.; Kleist, D.; Whitaker, J. GSI 3DVarbased ensemble-variational hybrid data assimilation for NCEP global forecast system: Single-resolution experiments. Mon. Weather Rev. 2013, 141, 4098–4117. [Google Scholar] [CrossRef]
  17. Kleist, D.T.; Ide, K. An OSSE-based evaluation of hybrid variational-ensemble data assimilation for the NCEP GFS. Part II: 4DEnVar and hybrid variants. Mon. Weather Rev. 2015, 143, 452–470. [Google Scholar] [CrossRef] [Green Version]
  18. Ma, Z.; Maddy, E.S.; Zhang, B.; Zhu, T.; Boukabara, S.A. Impact assessment of Himawari-8 AHI data assimilation in NCEP GDAS/GFS with GSI. J. Atmos. Ocean. Technol. 2017, 34, 797–815. [Google Scholar] [CrossRef]
  19. Zhou, X.; Zhu, Y.; Hou, D.; Luo, Y.; Peng, J.; Wobus, R. Performance of the new NCEP Global Ensemble Forecast System in a parallel experiment. Weather Forecast. 2017, 32, 1989–2004. [Google Scholar] [CrossRef]
  20. Tallapragada, V. Recent updates to NCEP Global Modeling Systems: Implementation of FV3 based Global Forecast System (GFS v15.1) and plans for implementation of Global Ensemble Forecast System (GEFSv12). In Proceedings of the 2019 AGU Fall Meeting, San Francisco, MD, USA, 9–13 December 2019. [Google Scholar]
Figure 1. Spatial coverage of Cross-Track Infrared Sounder (CrIS) channel 99 (corresponding to the channel wavenumber of 711.15 cm-1) brightness temperatures for (a) the global data assimilation system (GDAS) run, (b) the operational Global Forecast System (GFS) run, (c) the GFS run with the 20-min data latency, and (d) the GFS run with the 5-min data latency on 0000UTC 1 July 2018. Data ratio against the CrIS data for the GDAS run is described in parenthesis.
Remotesensing 12 02193 g001
Figure 2. Time series of (a) total number of the hyperspectral infrared (IR) and microwave (MW) sounder measurements available at the GFS run for the control (black solid), latency_20m (red solid), and latency_5m (blue solid) runs, and (b) observation percentage (%) normalized against the number of the sounder measurements used for the GDAS run. The black dashed line indicates the number of the sounder measurements available for the GDAS run.
Remotesensing 12 02193 g002
Figure 3. Time series of assimilated data ratio of (a,b) CrIS, (c,d) IASI, and (e) AIRS IR sounders for the period from 7 July to 22 August 2018. Black, red, and blue lines indicate the control, latency_20m, and latency_5m runs, respectively.
Remotesensing 12 02193 g003
Figure 4. Time series of assimilated data ratio of Advanced Technology Microwave Sounder (ATMS) MW sounders onboard (a) Suomi National Polar-orbiting Partnership (S-NPP) and (b) National Oceanic and Atmospheric Administration (NOAA–20) satellites for the period from 7 July to 22 August 2018. Black, red, and blue lines indicate the control, latency_20m, and latency_5m runs, respectively.
Remotesensing 12 02193 g004
Figure 5. The spectral distribution of mean assimilated data number of assimilated CrIS channels onboard (a) S-NPP and (b) NOAA-20 satellites for three trial runs for the period from 7 July to 22 August 2018. Black, red, and blue circles indicate the control, latency_20m, and latency_5m runs, respectively. Greyline means the reference brightness temperatures of CrIS 2211 channels in FSR mode.
Remotesensing 12 02193 g005
Figure 6. The spectral distribution of mean assimilated data number of ATMS channels onboard (a) S-NPP and (b) NOAA–20 satellites for three trial runs for the period from 7 July to 22 August 2018. Black, red, and blue circles indicate the control, latency_20m, and latency_5m runs, respectively.
Remotesensing 12 02193 g006
Figure 7. The (a) mean and (b) normalized difference of AC of 250 hPa, 500 hPa, and 700 hPa geopotential height forecast up to 120–h forecast hours between the latency_20m and control runs. Grey, green, red, and magenta boxes indicate the results over the Global, Northern Hemisphere, Tropic, and Southern Hemispheres, respectively. Vertical bars representing 95% confidence level of the uncertainty are overlaid.
Remotesensing 12 02193 g007
Figure 8. The (a) mean and (b) normalized difference of RMSE of 250 hPa, 500 hPa, and 700 hPa geopotential height forecast up to 120–h forecast hours between the latency_20m and control runs. Grey, green, red, and magenta boxes indicate the results over the Global, Northern Hemisphere, Tropic, and Southern Hemispheres, respectively. Vertical bars representing 95% confidence level of the uncertainty are overlaid.
Remotesensing 12 02193 g008
Figure 9. Global map of the mean difference of RMSE of (a,b) 250 hPa, (c,d) 500 hPa, and (e,f) 700 hPa geopotential height at (a,c,e) T+72 and (b,d,f) T+96 forecast hours between the latency_20m run and the control run.
Remotesensing 12 02193 g009
Figure 10. The (a) mean and (b) normalized difference of AC of 250 hPa, 500 hPa, and 850 hPa temperature forecast up to 120-h forecast hours between the latency_20m and control runs. Grey, green, red, and magenta boxes indicate the results over the Global, Northern Hemisphere, Tropic, and Southern Hemispheres, respectively. Vertical bars representing 95% confidence level of the uncertainty are overlaid.
Remotesensing 12 02193 g010
Figure 11. The (a) mean and (b) normalized difference of RMSE of 250 hPa, 500 hPa, and 850 hPa temperature forecast up to 120–h forecast hours between the latency_20m and control runs. Grey, green, red, and magenta boxes indicate the results over the Global, Northern Hemisphere, Tropic, and Southern Hemispheres, respectively. Vertical bars representing 95% confidence level of the uncertainty are overlaid.
Remotesensing 12 02193 g011
Figure 12. Global map of the mean difference of RMSE of (a,b) 250 hPa, (c,d) 500 hPa, and (e,f) 850 hPa temperature at (a,c,e) T+72 and (b,d,f) T+96 forecast hours between the latency_20m run and the control run.
Remotesensing 12 02193 g012
Figure 13. The (a) mean and (b) normalized difference of AC of 250 hPa, 500 hPa, and 700 hPa geopotential height forecast up to 120-h forecast hours between the latency_5m and latency_20m runs. Grey, green, red, and magenta boxes indicate the results over the Global, Northern Hemisphere, Tropic, and Southern Hemispheres, respectively. Vertical bars representing 95% confidence level of the uncertainty are overlaid.
Remotesensing 12 02193 g013
Figure 14. The (a) mean and (b) normalized difference of RMSE of 250 hPa, 500 hPa, and 700 hPa geopotential height forecast up to 120–h forecast hours between the latency_5m and latency_20m runs. Grey, green, red, and magenta boxes indicate the results over the Global, Northern Hemisphere, Tropic, and Southern Hemispheres, respectively. Vertical bars representing 95% confidence level of the uncertainty are overlaid.
Remotesensing 12 02193 g014
Figure 15. The (a) mean and (b) normalized difference of AC of 250 hPa, 500 hPa, and 850 hPa temperature forecast up to 120–h forecast hours between the latency_5m and latency_20m runs. Grey, green, red, and magenta boxes indicate the results over the Global, Northern Hemisphere, Tropic, and Southern Hemispheres, respectively. Vertical bars representing 95% confidence level of the uncertainty are overlaid.
Remotesensing 12 02193 g015
Figure 16. The (a) mean and (b) normalized difference of RMSE of 250 hPa, 500 hPa, and 850 hPa temperature forecast up to 120-h forecast hours between the latency_5m and latency_20m runs. Grey, green, red, and magenta boxes indicate the results over the Global, Northern Hemisphere, Tropic, and Southern Hemispheres, respectively. Vertical bars representing 95% confidence level of the uncertainty are overlaid.
Remotesensing 12 02193 g016
Table 1. Conventional observation types used in the GFS data assimilation system. See the Abbreviations for an explanation of acronyms.
Observation TypeAtmospheric Parameter
Rawinsonde and DropsondeTemperature, humidity, and wind profiles
PIBAL and Wind profilerWind profile
Ground radar (NEXRAD)Wind and precipitation
Wind profilerWind profile
Land surface (METAR)Surface pressure
Ship and BuoyTemperature, humidity, and surface pressure
Aircraft (AIREP and AMDAR)Wind
BOGUSWind of tropical cyclone
Table 2. Satellite-based observation types used in the GFS data assimilation system. See the Abbreviations for an explanation of acronyms.
Observation TypeInstrumentPlatform
Infrared sounder
(LEO)
CrISS-NPP and NOAA-20
IASIMetOp-A and MetOp-B
AIRSAqua
Microwave sounder
(LEO)
ATMSS-NPP and NOAA-20
AMSU-ANOAA-15, NOAA-18, NOAA-19, MetOp-A, and Aqua
MHSNOAA-18, NOAA-19, MetOp-A, and MetOp-B
GPSRO bending angle
(LEO)
GPS sensorCOSMIC, TerraSAR-X, and TanDEM-X
GRASMetOp-A and MetOp-B
AMV
(GEO)
ImagerGOES-15
AHIHimawari-8
AMV
(LEO)
MODISAqua and Terra
VIIRSS-NPP
AVHRRMetOp-A, MetOp-B, NOAA-15, NOAA-18, and NOAA-19
Sea surface wind (LEO)ASCATMetOp-A and MetOp-B
Microwave imager (LEO)SSMISDMSP-17
Infrared sounder (GEO)SounderGOES-15
Radiometer (LEO)AVHRRNOAA-18 and MetOp-A

