Article

Estimation of Noise in the In Situ Hyperspectral Data Acquired by Chang’E-4 and Its Effects on Spectral Analysis of Regolith

1
Key Laboratory of Earth and Planetary Physics, Institute of Geology and Geophysics, Chinese Academy of Sciences, Beijing 100029, China
2
Key Laboratory of Space Active Opto-Electronics Technology, Shanghai Institute of Technical Physics, Chinese Academy of Sciences, Shanghai 200083, China
3
State Key Laboratory of Space Weather, National Space Science Center, Chinese Academy of Sciences, Beijing 100190, China
*
Author to whom correspondence should be addressed.
Remote Sens. 2020, 12(10), 1603; https://doi.org/10.3390/rs12101603
Submission received: 14 April 2020 / Revised: 14 May 2020 / Accepted: 15 May 2020 / Published: 18 May 2020
(This article belongs to the Special Issue Lunar Remote Sensing and Applications)

Abstract

:
The Chang’E-4 (CE-4) spacecraft landed successfully on the far side of the Moon on 3 January 2019, and the rover Yutu-2 has explored the lunar surface since then. The visible and near-infrared imaging spectrometer (VNIS) onboard the rover has acquired numerous spectra, providing unprecedented insight into the composition of the lunar surface. However, the noise in these spectral data and its effects on spectral interpretation are not yet assessed. Here we analyzed repeated measurements over the same area at the lunar surface to estimate the signal–noise ratio (SNR) of the VNIS spectra. Using the results, we assessed the effects of noise on the estimation of band centers, band depths, FeO content, optical maturity (OMAT), mineral abundances, and submicroscopic metallic iron (SMFe). The data observed at solar altitudes <20° exhibit low SNR (25 dB), whereas the data acquired at 20°–35° exhibit higher SNR (35–37 dB). We found differences in band centers due to noise to be ~6.2 and up to 28.6 nm for 1 and 2 μm absorption, respectively. We also found that mineral abundances derived using the Hapke model are affected by noise, with maximum standard deviations of 6.3%, 2.4%, and 7.0% for plagioclase, pyroxene, and olivine, respectively. Our results suggest that noise has significant impacts on the CE-4 spectra, which should be considered in the spectral analysis and geologic interpretation of lunar exploration data.

Graphical Abstract

1. Introduction

Visible and near-infrared (VNIR) reflectance spectra are the primary data sources used in analysis of the composition of the materials and processes on the lunar surface. Hyperspectral remote sensing sensors, including the Moon Mineralogy Mapper (M3), the Spectral Profilers, and the Interference Imaging Spectrometer, have allowed the accumulation of extensive spectral datasets describing the entire surface of the Moon [1,2,3]. The VNIR spectral signature of the lunar surface is a complex function of parameters including surface composition, particle size, scattering property, space weathering, and viewing geometry [4,5,6,7]. Previously, the spectral features of lunar regolith were studied in a laboratory setting using the Apollo samples to help decode remote sensing data [6,8]. However, laboratory measurements are typically obtained under controlled conditions (i.e., with fixed incidence and viewing angles), and differences between the acquired spectra are generally associated with differences in the chemical and physical properties of the target. Moreover, it is difficult to reproduce the undisturbed lunar surface and environment in a laboratory; any such reproduction may have a significant effect on the optical features obtained. These experimental issues can be addressed by conducting in situ measurements of the lunar surface.
On 3 January 2019, the Chang’E-4 (CE-4) spacecraft landed successfully in the South Pole–Aitken (SPA) basin on the far side of the Moon. The visible and near-infrared imaging spectrometer (VNIS) onboard the Yutu-2 rover obtained numerous VNIR hyperspectral images, providing unprecedented insight into the spectrophotometric properties and compositions of lunar regolith and rocks [9,10,11,12,13]. However, the ability of these hyperspectral data to represent the real lunar environment is degraded by noise, which is related to factors such as the instrument system used and the measurement environment [14]. In particular, instrumental noise can introduce uncertainties in spectral bands to varying degrees; moreover, the received radiance can be degraded by imaging conditions such as illumination [14]. Thus, the effect of noise on observed data must be estimated in the spectral analysis of lunar surface characteristics.
Lunar regolith and rocks are composed of varying quantities of dominant minerals, including plagioclase, pyroxene, olivine, and ilmenite. The accurate identification of minerals on the lunar surface is critical to our understanding of the surface processes and the geological history of the Moon [15,16,17,18]. Absorption related to electronic transitions, vibrational modes, and charge transfer processes of specific minerals can be used to characterize mineral types [4]. For example, pyroxenes have diagnostic band centers at ~1 and ~2 μm, with wavelength varying as a function of the Ca/Fe/Mg ratio [19,20]. Similarly, absorption occurs at ~1.05 μm for olivine [21]. Additionally, band depth (absorption strength) is related to mineral abundance and space weathering. Noise is known to affect the estimation of spectral features such as band center and band depth. In this context, the estimation of spectral features may be affected by the signal–noise ratio (SNR) of hyperspectral data. Accurate estimation of the abundances of each of these minerals in lunar regolith and rocks would help further constrain the Moon’s evolution [22]. Typically, mineral abundances can be derived from spectra of lunar regolith and rocks using the radiative transfer models. For example, the Hapke model is used widely to estimate mineralogical information from VNIR reflectance spectra of lunar materials [9,11,22,23,24]. However, the deconvolution of such spectra is known to be sensitive to noise. Therefore, quantitative assessment of how noise affects spectral data, and the mineralogical information derived from such data, is important for robust geologic interpretation.
Space weathering is the primary surface process on the Moon which can produce the submicroscopic metallic iron (SMFe) [25,26,27]. The estimation of the SMFe abundance in the lunar regolith is undoubtedly important in evaluating space weathering and hence the regolith evolution [27,28]. The existence of SMFe reduces the albedo and band depth of the spectra of the lunar regolith, and physical modeling was developed to derive the SMFe abundance from the acquired spectra [25,29]. However, how noise of CE-4 spectral data affects the estimations of SMFe abundance needs to be quantitatively assessed.
Noise in in situ hyperspectral data and its effects on the spectral features of lunar regolith can be determined by observing the same areas repeatedly. On the tenth and thirteenth lunar days of the CE-4 mission, the VNIS onboard the Yutu-2 rover conducted experiments to measure the same target repeatedly at various sites (Figure 1). In this study, we first estimated the noise level of the VNIS measurements (i.e., the SNR of the hyperspectral images obtained) and analyzed their variations with solar altitude and incident energy. We also analyzed the effect of noise on the estimation of band center and depth. Finally, we assessed variations in mineral abundance and SMFe caused by the noise. These results are critical in the interpretation of the in situ spectral data acquired by CE-4.

2. Data and Methods

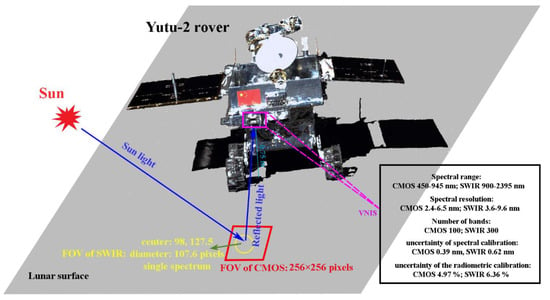
2.1. Chang’E-4 Spectral Data and Preprocessing

The VNIS onboard the Yutu-2 rover measures the lunar surface at a height of ~0.75 m (Figure 1). The VNIS uses an acousto-optic tunable filter (AOTF), which is a spectroscopic device based on the principle of acousto-optic diffraction, used to discriminate the light wavelength [30,31]. The VNIS detectors acquire the spectral information by rapidly driving frequency scanning on the AOTF, to change the first-order diffraction light dispersed with the wavelength sequentially [30]. The VNIS consists of a complementary metal–oxide–semiconductor (CMOS) imager (450–945 nm, spectral resolution of 2.4–6.5 nm) and a short-wavelength near-infrared (SWIR) detector (900–2395 nm, spectral resolution of 3.6–9.6 nm) [30,31]. The SWIR detector (the material is InGaAs) does not image but acquires a spectrum of the target. The field of view of the SWIR detector is a circle with a diameter of 107.6 CMOS pixels and is centered at sample 98, line 127.5, within the field of view of the CMOS imager (Figure 1). The uncertainties for spectral calibration of the CMOS imager and SWIR detector are 0.39 and 0.62 nm, respectively, while those for radiometric calibration are 4.97% and 6.36%, respectively [10,30]. Radiance data were converted to reflectance using a solar calibration method [10,32] despite having a white panel carried by the rover. Only a few measurements of the white panel were conducted on the lunar surface because of the rigorous engineering requirements. A good measurement of the white panel relies on the appropriate relations of azimuth geometries between the rover and the Sun, otherwise the white panel would be shadowed. In addition, the rover’s protective layer scatters the light on the white panel in some observation geometries, which could cause uncertainties in the calibration. Fortunately, the released radiance data were calibrated in flight using the valid measurements of white panel. The CMOS and SWIR channels have an overlap region from 900 to 945 nm; differences within this overlapping region can be attributed to response differences between the CMOS imager and SWIR detector [30,31,33,34]. Accordingly, we synchronized the CMOS and SWIR channels using the reflectance at 900 nm [9,10]. In addition, the spectra acquired by the SWIR detector have a gap between 1375 and 1380 nm due to an unexpected spectral response. We filled this gap by extending the spectra before 1375 nm to 1380 nm.
On the tenth and thirteenth lunar days of mission operations, the Yutu-2 rover conducted two different experiments using the VNIS (Figure 1): (1) measuring the spectra of the same regolith area at different solar altitudes and (2) measuring the spectra of the same rock-bearing area continuously at the same viewing geometry. The measurement angles for each site are listed in Table 1 and the corresponding CMOS images are shown in Figure 2. Regolith characteristics were measured at different solar altitudes for the same area to investigate errors caused by varying illumination conditions (Figure 2a). Similarly, rock outcrops were measured repeatedly at the same viewing geometry (i.e., with little variation in solar altitude) which could help assess the measurement uncertainty. Measurements were obtained for three rock-bearing areas (Figure 2b).

2.2. Estimation of Signal–Noise Ratio

The SNR of hyperspectral remote sensing systems can be estimated in two ways: using a complex system of sensors or from data acquired by an imaging spectrometer [35]. Variation in dark current signals can represent system noise in the laboratory [36]. Besides the dark current of the detector, the thermal and readout effects also contribute to the data noise [31]. Furthermore, conditions in the lunar environment are complex which could induce additional noise. Thus, it is important to have an effective way to estimate the noise level in the spectral analysis of the CE-4 data.
Noise in remote sensing images can be divided into two types based on the relationship between noise and signal, multiplicative and additive noises, which exhibit strong and weak correlation with signal strength, respectively [37,38]. In this study, we first assessed noise type for the CMOS images by considering a moving window with 5 × 5 pixels as the local area. The local mean radiance value and local standard deviation were assumed to represent the signal and noise, respectively [38]. The correlation coefficients of the images were found to be <0.3 for all bands, suggesting that the noise in the CMOS images is additive (Figure 3).
Thus, we used the residual-scaled local standard deviations (RLSD) method, which assumes that the noise in hyperspectral images is additive, to estimate the SNR [35]. The RLSD method has been applied successfully to hyperspectral images, including those from the interference imaging spectrometer of the Chang’E-1 spacecraft [39]. This method is based on the concept of strong band correlation of hyperspectral images and the local standard deviation (LSD) of small imaging patches. In particular, the RLSD method uses multiple linear regression to obtain noise-like residuals and calculate the distribution of a number of LSDs to estimate the noise of an image. The CMOS images 0104 and 0105 are affected by shadow (Figure 2), and thus the SNR was not calculated for these images.

2.3. Estimation of Band Center and Depth

We estimated the band centers and depths based on continuum-removed spectra, which were obtained using a straight-line segment method [4]. Before continuum removal, the reflectance spectra were smoothed using the Savitzky–Golay algorithm [40] with 31 points and a second-order polynomial function. Then, we used a sixth-order polynomial function to fit the continuum-removed spectra at ~1000 and ~2000 nm to characterize the band centers; these represent the band positions with minimum reflectance/continuum values [15]. The band depth is defined as 1 minus the reflectance at the band center of the continuum-removed spectra. To estimate the error in band center and depth, we used four different band ranges to fit the absorption: 900–1050, 850–1150, 800–1250, and 750–1350 nm for 1000 nm; and 1750–2250, 1700–2300, 1650–2350, and 1600–2395 nm for 2000 nm [41].

2.4. Estimation of Mineral Abundance

The lunar regolith is intimately mixed and the endmembers have nonlinear characteristics in the reflectance space. However, the single-scattering albedo (SSA) of the mixture can be a linear combination of endmembers. The relation between reflectance and SSA, scattering properties, and particle size, etc., can be well described by the Hapke model.

2.4.1. The Hapke Equations

The relation between the reflectance and single-scattering albedo (SSA) is described as [5]:
r = ω 4 ( μ 0 + μ e ) { p ( g ) [ 1 + B ( g ) ] + H ( μ 0 ) H ( μ e ) 1 }
where r is the reflectance of lunar materials; μ0 and μe are the cosines of the angles of incidence and emission, respectively; and g is phase angle. B (g) is the backscattering function; P (g) is the phase function, which can be expressed with Legendre polynomials; H(x) is a multiple-scattering function; and ω is the average SSA, which is the approximately linear combination of endmembers’ SSAs. The equations and parameters of B (g), P (g), H(μ0), and H(μe) are the same as those in [22]:
P ( g ) = 1 0.4 cos ( g ) + 0.25 ( 1.5 cos 2 ( g ) 0.5 )
B ( g ) = 1 / [ 1 + tan ( g / 2 ) / h ]
h = 3 8 ln ( 1 ϕ )
H ( μ 0 ) = 1 / { 1 ( 1 1 ω ) μ 0 [ r 0 + ( 1 0.5 r 0 r 0 μ 0 ) ln ( 1 + μ 0 ) / μ 0 ] }
r 0 = ( 1 1 ω ) / ( 1 + 1 ω )
where h is the angular width parameter of opposition effect. The equation for H(μe) is same as for H(μ0), but μ0 is replaced with μe.

2.4.2. Single-Scattering Albedo of Mineral Endmember

The endmembers used in this study are pyroxene (PYX), olivine (OL), plagioclase (PLG), and ilmenite (ILM), which are the dominant minerals of the Moon. Considering the spectral variations, at least two spectra of each endmember were used in this study (Figure 4). These endmember spectra were collected from the Lunar Rock and Mineral Characterization (LRMCC) database [42]. The endmember SSA can be calculated using the Hapke model with given optical constants and grain size:
ω = S e + ( 1 S e ) ( 1 S i ) θ 1 S i θ
S e = ( n 1 ) 2 + k 2 ( n + 1 ) 2 + k 2 + 0.05
S i = 1 4 n ( n + 1 ) 2
θ = e α D
where n and k are optical constants of the minerals. Si and Se are the Fresnel reflectivity for internally and externally incident light, respectively. θ is the internal transmission coefficient of the particle without internal scatter. The variable <D> is the average distance traveled by transmitted rays during one traverse of a particle, which is related to particle size D:
D = 2 3 [ n 2 1 n ( n 2 1 ) 3 / 2 ] D
where α = 4πk/λ is the absorption coefficient of the mineral. For considering the effects of space weathering on the lunar surface, the spectral contribution of submicroscopic metallic iron (SMFe) is taken into account by modeling the absorption coefficient:
α = 4 π k λ + 36 π z M F e ρ λ ρ F e
z = n 3 n F e k F e ( n F e 2 k F e 2 + 2 n 2 ) 2 + 4 n F e 2 k F e 2
where ρ is density of host mineral; nFe, kFe, and ρFe are optical constants and the density of SMFe. MFe is the mass fraction of SMFe.
The endmember’s optical constant k was calculated using Equations (1–11) with known reflectance and particle size. The endmembers’ SSAs were calculated by setting the particle size as (low boundary, step, upper boundary) = (10, 5, 60) and SMFe abundance as (0, 0.001, 0.005). Thus, a SSA spectral library was constructed. Theoretically, there are only a small number of materials in a mixture, which is sparse compared with the hundreds of spectra in our spectral library. Therefore, a sparse unmixing algorithm [43] that was applied to Martian hyperspectral data [44,45,46] was used to obtain the optimal solution. The sparse regression problem is written as [43]:
min x x 0   Subject   to   Y A x 2 δ , x 0
where δ 0 is the modeling error tolerance, x is the mineral abundance, Y is the SSA of mixture, and A is the spectral library. Variable x 0 , the L0 norm, denotes the number of nonzero components of x. Due to the non-deterministic polynomial (NP)-hard problem of the L0 norm, it is typically replaced with the L1 norm [43]. Therefore, the objective function of the optimal problem can be formulated as:
min x 1 2 A x Y 2 2 + γ X 1   Subject   to   x 0
where γ is regularization parameter. A sparse unmixing via variable splitting augmented Lagrangian (SunSAL) algorithm proposed by Iordanche et al. [43] was applied to retrieve the mineral abundances.

2.5. Estimation of SMFe Abundance

The SMFe abundance of the lunar regolith can be modeled using the Hapke model [22] by accounting for the space weathering. As shown in Equations (12) and (13), the absorption coefficient of the lunar regolith can be modeled by adding a different mass fraction of SMFe incorporated on the host material, which did not experience space weathering [25]. A rock with fresh exposure (Figure 5) was measured by the Yutu-2 rover at the third lunar day of the mission, which was suggested to be a norite [9]. The lunar regolith was believed to have the same origin with this rock, based on the similar spectral features [9]. Even though part of the rock surface was masked by the lunar regolith, the fresh rock surface can be clearly identified from the CMOS image [9]. Therefore, the mean spectrum of the pixels collected from the fresh rock surface was considered as the host material in Equation (12). The optical constant n was set as 1.78 [28] and the mean grain size of the rock was assumed to be 80 μm [9]. In this case, the optical constant k of the host material can be calculated using Equations (1–11). The mass fraction of SMFe and particle size of the lunar regolith were then estimated by fitting the regolith spectra using Equations (1–13) with least squares algorithm [25]. The initial values of the SMFe abundance and particle size of lunar regolith in the algorithm were set as 0.1 wt. % and 17 μm, respectively [24].

3. Results and Discussion

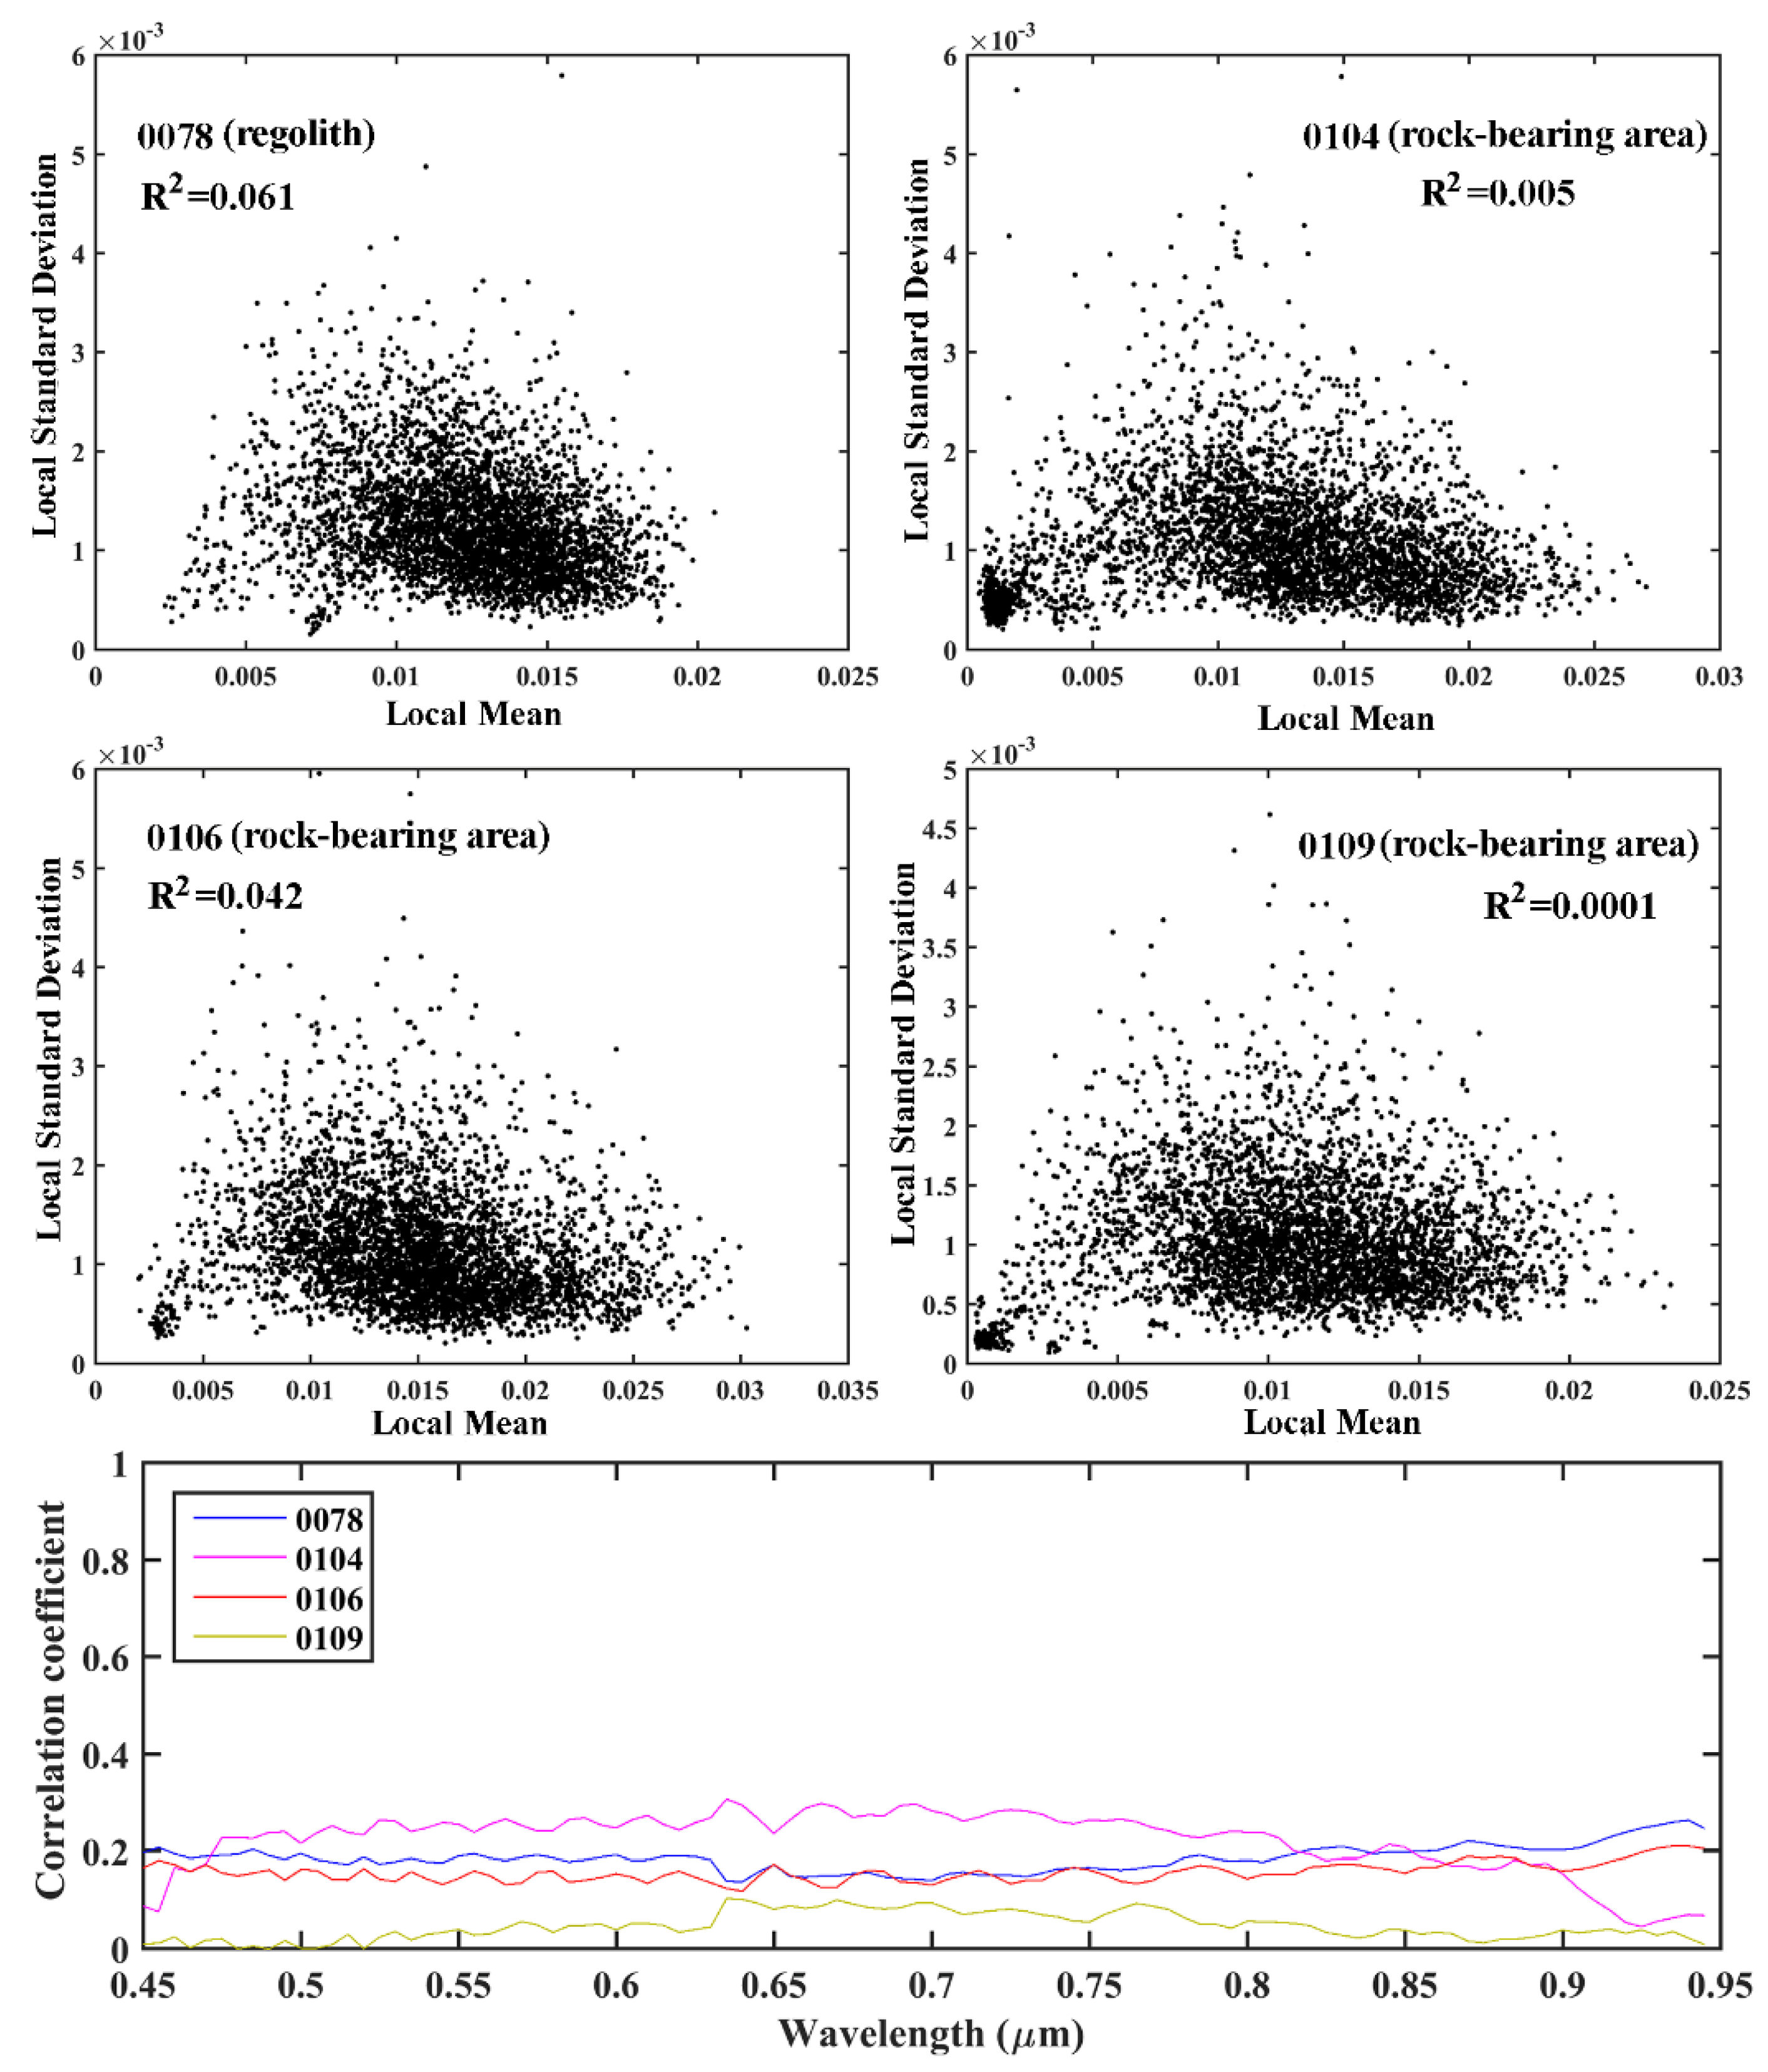
3.1. SNR of CMOS Image and Spectral Difference

We found the SNR to increase with increasing solar altitude (Figure 6), which indicates that the quality of the hyperspectral remote sensing data acquired by CE-4 was affected significantly by the illumination conditions at the lunar surface. The irradiance of solar energy also increases with solar altitude, in conjunction with increasing SNR in our dataset (Figure 6c). In general, the SNR increases with wavelength (Figure 6a). The SNR is lower than 25 dB for solar altitudes <20° (Figure 6b); this could affect spectral interpretation, particularly for short wavelengths (10–15 dB). The low SNR of the image acquired at low solar altitude was primarily caused by the low solar incident energy and the shadows produced by the uneven lighting. Therefore, we suggest that future measurements should be obtained at solar altitudes >20° to improve the quality of obtained lunar spectra. Compared with the regolith, the rock-bearing areas measured at a similar solar altitude were found to exhibit higher SNR (Figure 6b), suggesting that fresher materials exhibit a higher SNR due to their stronger reflectance.
We found differences in the paired measurements between 0106 and 0107, as well as between 0109 and 0110, despite that these observations were collected for the same areas and with similar viewing geometries. Note that the differences in incidence angles were smaller than 0.12°. We attribute these differences to measurement error or noise. We found considerable variability in the spectra at wavelengths longer than 1.8 μm (Figure 7), suggesting that variability could affect the 2 μm spectral features. This variability is particularly pronounced for the two observations collected at the lowest solar altitudes (Figure 7b,d).

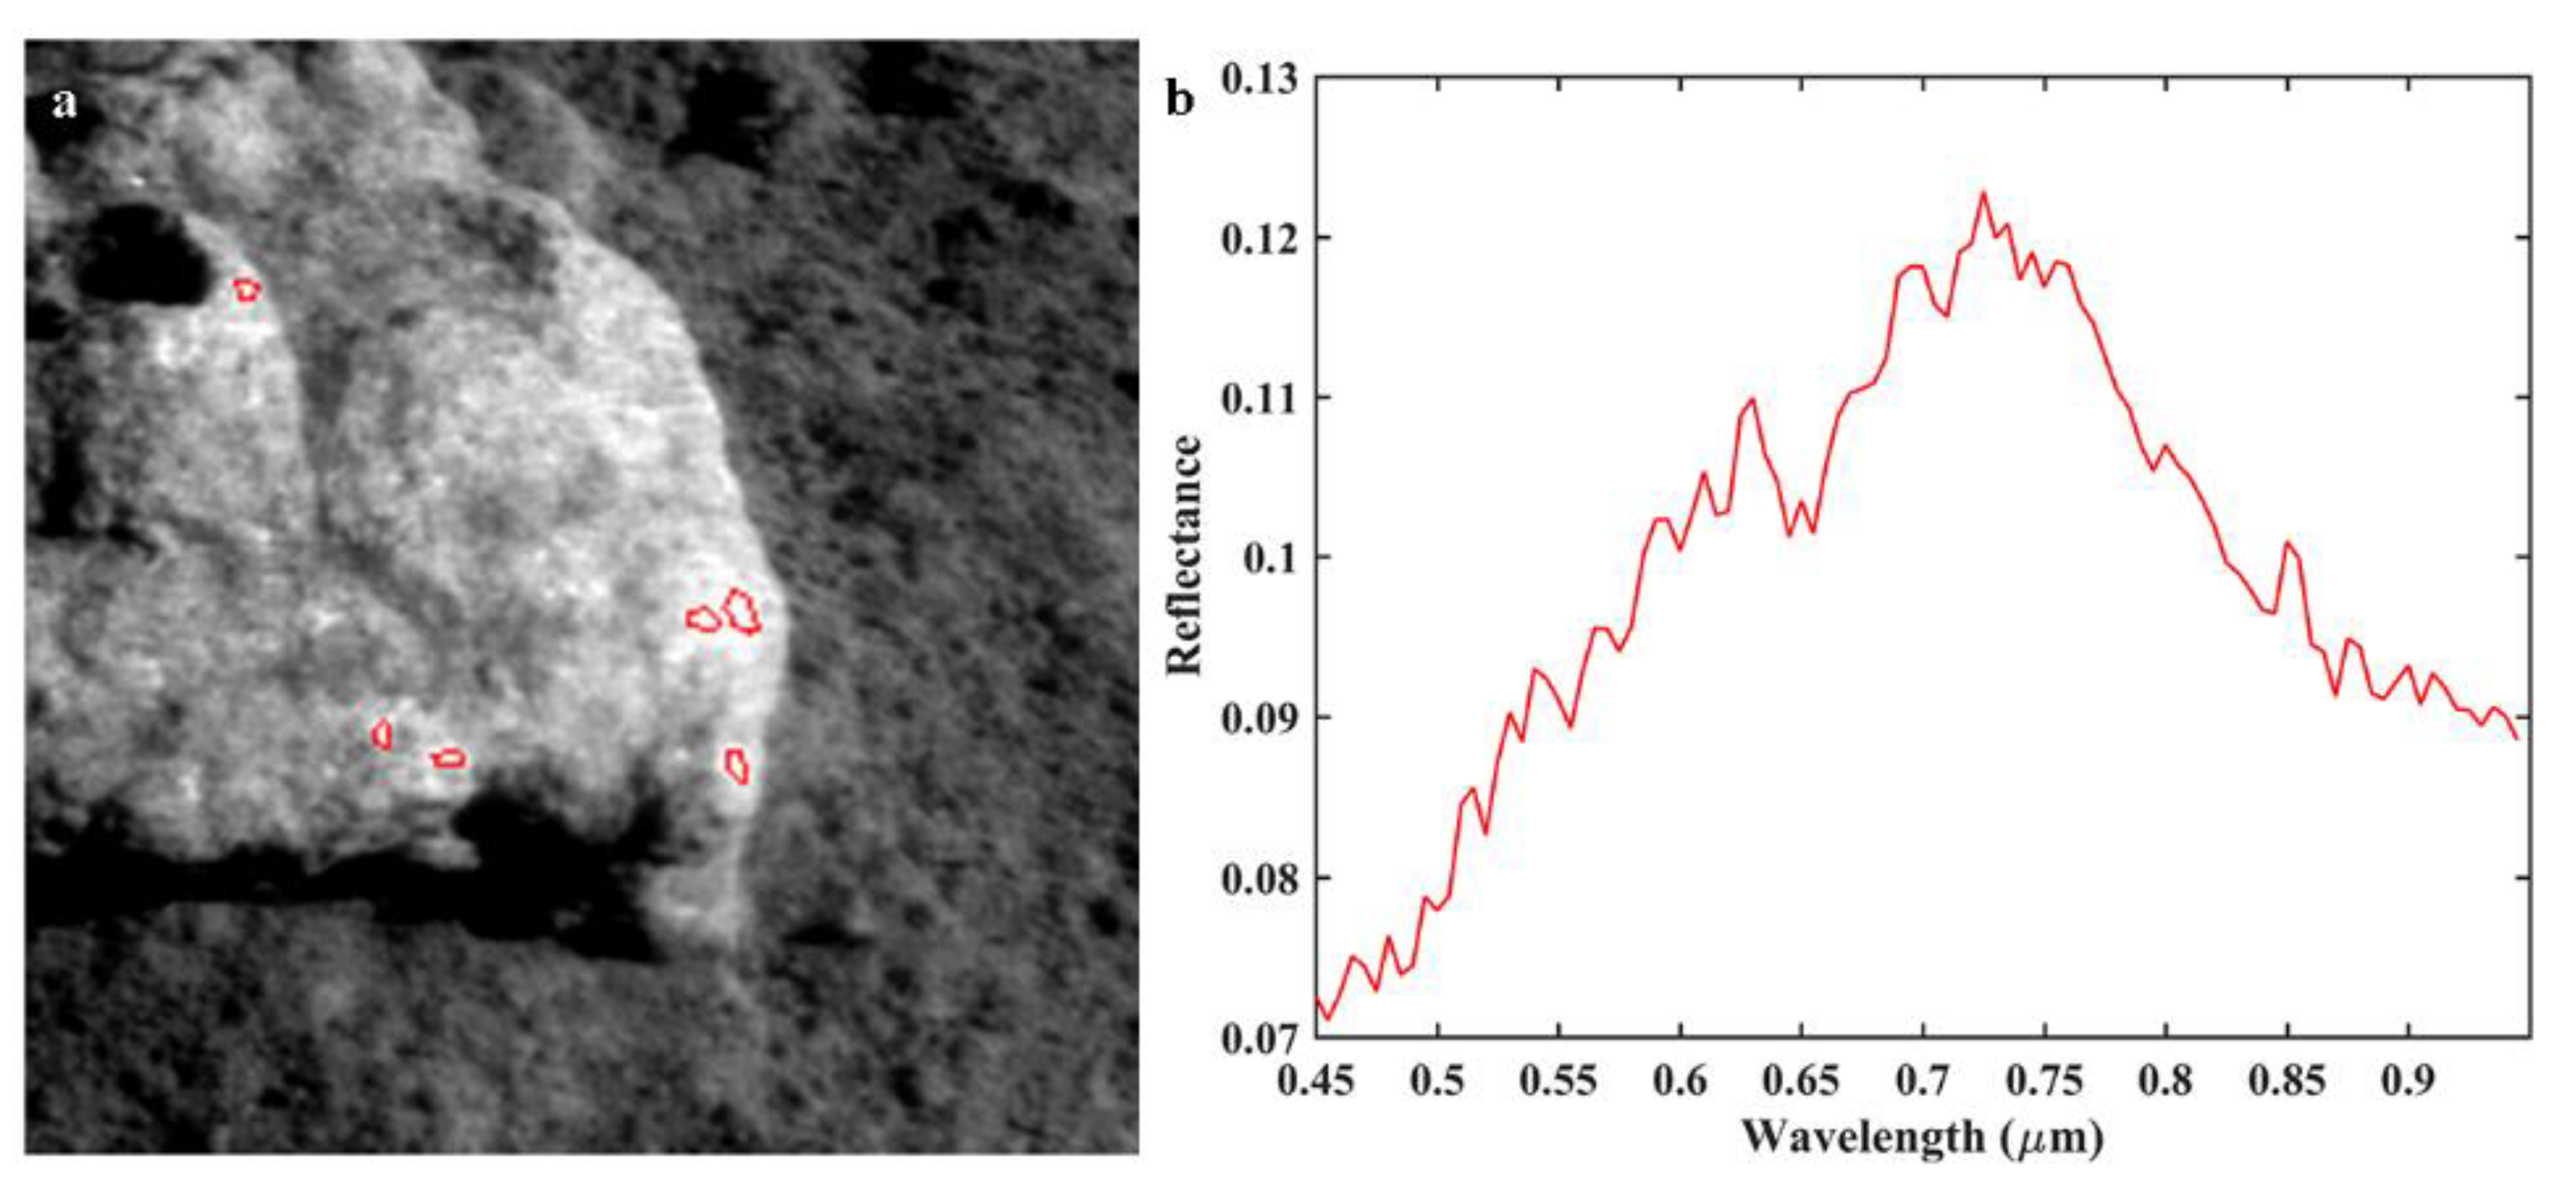
3.2. Effects of Noise on Band Center and Depth

The effects of noise on band center and band depth were also investigated. Spectral variations in the continuum-removed reflectance spectra between measurements acquired under the same conditions are evident (Figure 8), particularly for the 2 μm absorption. This is consistent with the large differences observed at ~2 μm in the reflectance spectra. We observed the following differences in band centers. For 0106 and 0107, differences were 2.6 and 10.2 nm for the 1 and 2 μm bands, respectively. For 0109 and 0110, differences were 2.7 and 1.7 nm for the 1 and 2 μm bands, respectively. Finally, for 0104 and 0105, differences were 1.9 and 16.7 nm for the 1 and 2 μm bands, respectively. These findings suggest that the effects of noise on band center estimation are random, with variation of 1.9–2.7 and 1.7–16.7 nm for the 1 and 2 μm absorptions, respectively. Moreover, the noise caused by solar altitude was found to have significant effects on the band centers, with uncertainties of 9.6 and 46.0 nm for the 1 and 2 μm bands, respectively. Removal of measurements acquired at solar altitudes <20° reduced these uncertainties to 6.2 and 28.6 nm for the 1 and 2 μm absorptions, respectively. Band depth, which is related to mineral abundance, was also affected by noise (Figure 8d). Similarly, we found noise to induce variations in estimation of band depth, and these variations are 0.001–0.004 and 0.002–0.006 for the 1 and 2 μm absorptions, respectively. The tie points of the spectral continuum were changed by the noise and thus introduced significant variations when estimating the band center and depth.
The CE-4 landing site is located in Von Kármán crater of the SPA basin. Von Kármán crater was filled with mare basalts [47]. However, the ejecta blanket from Finsen crater, which is to the northeast of the CE-4 landing site, can be seen from the orbital images [9,11,12,13,47]. In this case, the regolith at the landing site could represent the original materials of the SPA basin floor excavated by an asteroid impact [9]. It is critical to determine the source of the materials around the landing site because their formation conditions would be varied. We estimated the band centers of numerous regolith spectra acquired by the Yutu-2 rover and compared our results with the Apollo samples from the Lunar Soil Characterization Consortium (LSCC) database [8,48]. As shown in Figure 9, the maximum shifts of the band centers of each regolith spectrum affect the determination of mineral types, thus such shifts caused by the noise need to be considered in the geologic interpretation.

3.3. Effects of Noise on Estimations of Compositions

The noise changed the spectral shapes (band centers, band depths, and spectral slopes) and thus could affect the estimation of compositions, as the composition derived from the spectra relies on the fitting of the spectral shape and absorption features. Therefore, we analyzed the influence of noise on the interpretation of FeO content, optical maturity (OMAT), and mineral abundances, as well as the SMFe abundance. The spectra obtained were photometrically corrected with photometric functions derived using the CE-4 spectra, which were acquired on the fourth lunar day of the mission [10]. Then, FeO content and OMAT were calculated using spectral parameters [10,49,50]. The variation in OMAT (i.e., absolute difference/OMAT value) between the two measurements acquired under the same conditions was found to be 0.9%–2.7%, whereas the uncertainty induced by noise related to illumination was found to be 6.8%. The variation in FeO content (i.e., absolute difference/FeO content) between two measurements acquired under the same conditions was found to be 3.9%–8.1%. In contrast, variation in FeO content caused by illumination-related noise was found to be 11.2%.
The mineral abundances derived from the VNIR spectra using the Hapke model are shown in Figure 10, showing that the abundance values vary between two sets of measurements acquired under the same conditions. In particular, we found the abundances could vary as much as 0%–6%, 1%–5%, and 0%–4% for pyroxene, plagioclase, and olivine, respectively. Furthermore, we found the mineral abundances derived from CE-4 spectra using the Hapke model are also affected by noise caused by illumination conditions (N0068–N0078), and the corresponding standard deviations for plagioclase, pyroxene, and olivine are 6.3%, 2.4%, and 7.0%, respectively. Figure 10 shows that errors of mineral abundances caused by noise may affect the determination of lithology (Figure 10).
The mean SMFe abundance of the regolith is 0.096 wt. %, with standard variation of 0.025 wt. % (Figure 11a). Removal of measurements acquired at solar altitudes <20° reduced this standard variation to 0.011 wt. %. Because we have photometrically corrected the spectra to the standard viewing geometry, this standard variation is attributed primarily to the noise. Similarly, our modeling results show that the mean particle size of the regolith is 45.73 μm, with a standard deviation of 4.75 μm (Figure 11b).

4. Conclusions

The Yutu-2 rover of the CE-4 mission has explored the far side of the Moon since 3 January 2019, providing a unique perspective on the composition of the lunar surface. The rover conducted a series of in situ spectral measurements in two specific areas. We estimated the noise inherent in the obtained hyperspectral data, analyzed its effects on the band centers and band depths, and discussed the effects of the noise on the derived FeO content, OMAT, and mineral abundances of lunar regolith and rocks. The main findings can be summarized as follows:
(1) Data observed at solar altitudes <20° exhibit low signal–noise ratio (SNR) (25 dB). In contrast, those acquired at 20°–35° exhibit higher SNR (35–37 dB).
(2) The band centers of the spectra measured by the Yutu-2 rover were affected significantly by noise, with variations of ~6.2 nm and up to 28.6 nm for 1 and 2 μm absorption, respectively.
(3) Variations in FeO content and OMAT for two sets of measurements acquired under the same conditions were found to be 3.9%–8.1% and 0.9%–2.7%, respectively. Variations in FeO content and OMAT attributed to noise due to weak illumination were found to be 11.2% and 6.8%, respectively.
(4) The standard deviations of mineral abundances derived using the Hapke model are 6.3%, 2.4%, and 7.0% for plagioclase, pyroxene, and olivine, respectively. We attribute these variations primarily to noise.
(5) The standard deviations of the estimated SMFe abundance and particle size from the different spectral measurements of the same lunar regolith are 0.025 wt. % and 4.75 μm, respectively.
In summary, our analysis provides a quantitative assessment of the effects of noise on spectral data, and we have demonstrated that the effect of noise on estimating band centers, band depths, FeO content, OMAT, and mineral abundances is significant and could mislead the geologic interpretation of the evolution history of the CE-4 landing site.

Author Contributions

Conceptualization, Y.L. (Yangting Lin) and H.L.; methodology, H.L.; formal analysis, H.L. and Y.L. (Yangting Lin).; writing—original draft preparation, H.L.; writing—review and editing, Y.L. (Yangting Lin), Y.W., S.H., Y.Y., and Y.L. (Yang Liu), W.Y.; supervision, Y.L. (Yangting Lin); data acquisition, Z.H. and R.X.; funding acquisition, H.L., Y.L. (Yangting Lin), Y.W., and Y.L. (Yang Liu). All authors have read and agreed to the published version of the manuscript.

Funding

This work was funded by the National Natural Science Foundation of China, grant number 41902318, 41490631, 11941001, and 41525016; the Key Research Program of Frontier Sciences, CAS, grant number QYZDJ-SSW-DQC001 and the Beijing Municipal Science and Technology Commission, grant number Z181100002918003. Honglei Lin was also supported by the Key Research Program of the Institute of Geology and Geophysics, CAS, grant number IGGCAS-201905.

Acknowledgments

The Chang’E-4 mission was carried out by the Chinese Lunar Exploration Program, and the data were provided by the Science and Application Center for Moon and Deep Space Exploration, Chinese Academy of Sciences. The authors are grateful to the editors and three anonymous reviewers for their constructive reviews. The data reported in this work will be archived at http://moon.bao.ac.cn/searchOrder_dataSearchData.search.

Conflicts of Interest

The authors declare no conflict of interest.

References

  1. Pieters, C.M.; Boardman, J.; Buratti, B.; Chatterjee, A.; Clark, R.; Glavich, T.; Green, R.; Head, J., III; Isaacson, P.; Malaret, E. The Moon Mineralogy Mapper (M³) on Chandrayaan-1. Curr. Sci. 2009, 96, 500–505. [Google Scholar]
  2. Wu, Y.Z.; Zheng, Y.C.; Zou, Y.L.; Chen, J.; Xu, X.S.; Tang, Z.S.; Xu, A.A.; Yan, B.K.; Gan, F.P.; Zhang, X. A preliminary experience in the use of Chang’E-1 IIM data. Planet. Space Sci. 2010, 58, 1922–1931. [Google Scholar] [CrossRef]
  3. Yamamoto, S.; Matsunaga, T.; Ogawa, Y.; Nakamura, R.; Yokota, Y.; Ohtake, M.; Haruyama, J.; Morota, T.; Honda, C.; Hiroi, T.; et al. Calibration of NIR 2 of Spectral Profiler Onboard Kaguya/SELENE. IEEE Trans. Geosci. Remote Sens. 2014, 52, 6882–6898. [Google Scholar] [CrossRef]
  4. Clark, R.N.; Roush, T.L. Reflectance Spectroscopy―Quantitative-Analysis Techniques for Remote-Sensing Applications. J. Geophys. Res. 1984, 89, 6329–6340. [Google Scholar] [CrossRef]
  5. Hapke, B. Bidirectional reflectance spectroscopy: 1. Theory. J. Geophys. Res. Solid Earth 1981, 86, 3039–3054. [Google Scholar] [CrossRef]
  6. Pieters, C.M.; Taylor, L.A.; Noble, S.K.; Keller, L.P.; Hapke, B.; Morris, R.V.; Allen, C.C.; McKay, D.S.; Wentworth, S. Space weathering on airless bodies: Resolving a mystery with lunar samples. Meteorit. Planet. Sci. 2000, 35, 1101–1107. [Google Scholar] [CrossRef]
  7. Johnson, J.R.; Shepard, M.K.; Grundy, W.M.; Paige, D.A.; Foote, E.J. Spectrogoniometry and modeling of martian and lunar analog samples and Apollo soils. Icarus 2013, 223, 383–406. [Google Scholar] [CrossRef]
  8. Taylor, L.A.; Pieters, C.M.; Keller, L.P.; Morris, R.V.; McKay, D.S. Lunar Mare Soils: Space weathering and the major effects of surface-correlated nanophase Fe. J. Geophys. Res. Planets 2001, 106, 27985–27999. [Google Scholar] [CrossRef]
  9. Lin, H.; He, Z.; Yang, W.; Lin, Y.; Xu, R.; Zhang, C.; Zhu, M.-H.; Chang, R.; Zhang, J.; Li, C. Olivine-norite rock detected by the lunar rover Yutu-2 likely crystallized from the SPA impact melt pool. Natl. Sci. Rev. 2019. [Google Scholar] [CrossRef] [Green Version]
  10. Lin, H.; Xu, R.; Yang, W.; Lin, Y.; Wei, Y.; Hu, S.; He, Z.; Qiao, L.; Wan, W. In situ photometric experiment of lunar regolith with visible and near-infrared imaging spectrometer onboard the Yutu-2 lunar rover. J. Geophys. Res. Planets 2020, 125, e2019JE006076. [Google Scholar] [CrossRef]
  11. Hu, X.; Ma, P.; Yang, Y.; Zhu, M.H.; Jiang, T.; Lucey, P.G.; Sun, L.; Zhang, H.; Li, C.; Xu, R. Mineral Abundances Inferred From In Situ Reflectance Measurements of Chang’E-4 Landing Site in South Pole-Aitken Basin. Geophys. Res. Lett. 2019, 46, 9439–9447. [Google Scholar] [CrossRef]
  12. Li, C.L.; Liu, D.W.; Liu, B.; Ren, X.; Liu, J.J.; He, Z.P.; Zuo, W.; Zeng, X.G.; Xu, R.; Tan, X.; et al. Chang’E-4 initial spectroscopic identification of lunar far-side mantle-derived materials. Nature 2019, 569, 378–382. [Google Scholar] [CrossRef] [PubMed]
  13. Gou, S.; Di, K.; Yue, Z.; Liu, Z.; He, Z.; Xu, R.; Lin, H.; Liu, B.; Peng, M.; Wan, W. Lunar deep materials observed by Chang’e-4 rover. Earth Planet. Sci. Lett. 2019, 528, 115829. [Google Scholar] [CrossRef]
  14. Rasti, B.; Scheunders, P.; Ghamisi, P.; Licciardi, G.; Chanussot, J. Noise Reduction in Hyperspectral Imagery: Overview and Application. Remote Sens. 2018, 10, 482. [Google Scholar] [CrossRef] [Green Version]
  15. Horgan, B.H.N.; Cloutis, E.A.; Mann, P.; Bell, J.F. Near-infrared spectra of ferrous mineral mixtures and methods for their identification in planetary surface spectra. Icarus 2014, 234, 132–154. [Google Scholar] [CrossRef] [Green Version]
  16. Wu, Y.; Hapke, B. Spectroscopic observations of the Moon at the lunar surface. Earth Planet. Sci. Lett. 2018, 484, 145–153. [Google Scholar] [CrossRef]
  17. Moriarty, D.; Pieters, C.; Isaacson, P. Compositional heterogeneity of central peaks within the South Pole-Aitken Basin. J. Geophys. Res. Planets 2013, 118, 2310–2322. [Google Scholar] [CrossRef] [Green Version]
  18. Moriarty, D.P.; Pieters, C.M. The Character of South Pole-Aitken Basin: Patterns of Surface and Subsurface Composition. J. Geophys. Res. Planets 2018, 123, 729–747. [Google Scholar] [CrossRef]
  19. Adams, J.B. Visible and near-infrared diffuse reflectance spectra of pyroxenes as applied to remote sensing of solid objects in the solar system. J. Geophys. Res. 1974, 79, 4829–4836. [Google Scholar] [CrossRef]
  20. Klima, R.L.; Dyar, M.D.; Pieters, C.M. Near-infrared spectra of clinopyroxenes: Effects of calcium content and crystal structure. Meteorit. Planet. Sci. 2011, 46, 379–395. [Google Scholar] [CrossRef]
  21. Sunshine, J.M.; Pieters, C.M. Determining the composition of olivine from reflectance spectroscopy. J. Geophys. Res. Planets 1998, 103, 13675–13688. [Google Scholar] [CrossRef]
  22. Li, S.A.; Li, L. Radiative transfer modeling for quantifying lunar surface minerals, particle size, and submicroscopic metallic Fe. J. Geophys. Res. Planets 2011, 116. [Google Scholar] [CrossRef]
  23. Denevi, B.W.; Lucey, P.G.; Sherman, S.B. Radiative transfer modeling of near-infrared spectra of lunar mare soils: Theory and measurement. J. Geophys. Res. Planets 2008, 113. [Google Scholar] [CrossRef]
  24. Zhang, H.; Yang, Y.Z.; Yuan, Y.; Jin, W.D.; Lucey, P.G.; Zhu, M.H.; Kaydash, V.G.; Shkuratov, Y.G.; Di, K.C.; Wan, W.H.; et al. In situ optical measurements of Chang’E-3 landing site in Mare Imbrium: 1. Mineral abundances inferred from spectral reflectance. Geophys. Res. Lett. 2015, 42, 6945–6950. [Google Scholar] [CrossRef]
  25. Hapke, B. Space weathering from Mercury to the asteroid belt. J. Geophys. Res. Planets 2001, 106, 10039–10073. [Google Scholar] [CrossRef]
  26. Pieters, C.M.; Noble, S.K. Space weathering on airless bodies. J. Geophys. Res. Planets 2016, 121, 1865–1884. [Google Scholar] [CrossRef]
  27. Wang, Z.; Wu, Y.; Blewett, D.T.; Cloutis, E.A.; Zheng, Y.; Chen, J. Submicroscopic metallic iron in lunar soils estimated from the in situ spectra of the Chang’E-3 mission. Geophys. Res. Lett. 2017, 44, 3485–3492. [Google Scholar] [CrossRef]
  28. Gou, S.; Yue, Z.Y.; Di, K.C.; Wan, W.H.; Liu, Z.Q.; Liu, B.; Peng, M.; Wang, Y.X.; He, Z.P.; Xu, R. In situ spectral measurements of space weathering by Chang’e-4 rover. Earth Planet. Sci. Lett. 2020, 536. [Google Scholar] [CrossRef]
  29. Lucey, P.G.; Noble, S.K. Experimental test of a radiative transfer model of the optical effects of space weathering. Icarus 2008, 197, 348–353. [Google Scholar] [CrossRef]
  30. Li, C.; Xu, R.; Lv, G.; Yuan, L.; He, Z.; Wang, J. Detection and calibration characteristics of the visible and near-infrared imaging spectrometer in the Chang’e-4. Rev. Sci. Instrum. 2019, 90, 103106. [Google Scholar] [CrossRef] [Green Version]
  31. He, Z.; Li, C.; Xu, R.; Lv, G.; Yuan, L.; Wang, J. Spectrometers based on acousto-optic tunable filters for in-situ lunar surface measurement. J. Appl. Remote Sens. 2019, 13, 027502. [Google Scholar]
  32. Gueymard, C.A. The sun’s total and spectral irradiance for solar energy applications and solar radiation models. Sol. Energy 2004, 76, 423–453. [Google Scholar] [CrossRef]
  33. He, Z.P.; Wang, B.Y.; Lu, G.; Li, C.L.; Yuan, L.Y.; Xu, R.; Liu, B.; Chen, K.; Wang, J.Y. Operating principles and detection characteristics of the Visible and Near-Infrared Imaging Spectrometer in the Chang’e-3. Res. Astron. Astrophys. 2014, 14, 1567–1577. [Google Scholar] [CrossRef]
  34. Li, C.L.; Wang, Z.D.; Xu, R.; Lv, G.; Yuan, L.Y.; He, Z.P.; Wang, J.Y. The Scientific Information Model of Chang’e-4 Visible and Near-IR Imaging Spectrometer (VNIS) and In-Flight Verification. Sensors 2019, 19, 482. [Google Scholar] [CrossRef] [Green Version]
  35. Gao, L.; Wen, J.; Ran, Q. Residual-Scaled Local Standard Deviations Method for Estimating Noise in Hyperspectral Images. In Proceedings of the MIPPR 2007: Multispectral Image Processing, Wuhan, China, 15–17 November 2007; p. 678713. [Google Scholar]
  36. Van der Meer, F.D.; De Jong, S.M. Imaging Spectrometry: Basic Principles and Prospective Applications; Springer: Berlin/Heidelberg, Germany, 2011. [Google Scholar]
  37. Corner, B.R.; Narayanan, R.M.; Reichenbach, S.E. Noise estimation in remote sensing imagery using data masking. Int. J. Remote Sens. 2003, 24, 689–702. [Google Scholar] [CrossRef]
  38. Gao, B.C. An Operational Method for Estimating Signal to Noise Ratios from Data Acquired with Imaging Spectrometers. Remote Sens. Environ. 1993, 43, 23–33. [Google Scholar] [CrossRef]
  39. Xia, Z.; Tong, S.; Dong, Z. Assessment of the information quality of hyperspectral data from interference imaging spectrometer. J. Infrared Millim. Waves 2012, 31, 143–147. [Google Scholar]
  40. Savitzky, A.; Golay, M.J.E. Smoothing + Differentiation of Data by Simplified Least Squares Procedures. Anal. Chem. 1964, 36, 1627–1639. [Google Scholar] [CrossRef]
  41. Yang, Y.; Lin, H.; Liu, Y.; Lin, Y.; Wei, Y.; Hu, S.; Yang, W.; Xu, R.; He, Z.; Zou, Y. The effects of viewing geometry on the spectral analysis of lunar regolith as inferred by in situ spectrophotometric measurements of Chang’E-4. Geophys. Res. Lett. 2020, 47, e2020GL087080. [Google Scholar] [CrossRef]
  42. Isaacson, P.J.; Sarbadhikari, A.B.; Pieters, C.M.; Klima, R.L.; Hiroi, T.; Liu, Y.; Taylor, L.A. The lunar rock and mineral characterization consortium: Deconstruction and integrated mineralogical, petrologic, and spectroscopic analyses of mare basalts. Meteorit. Planet. Sci. 2011, 46, 228–251. [Google Scholar] [CrossRef]
  43. Iordache, M.D.; Bioucas-Dias, J.M.; Plaza, A. Sparse Unmixing of Hyperspectral Data. IEEE Trans. Geosci. Remote Sens. 2011, 49, 2014–2039. [Google Scholar] [CrossRef] [Green Version]
  44. Lin, H.L.; Mustard, J.F.; Zhang, X. A methodology for quantitative analysis of hydrated minerals on Mars with large endmember library using CRISM near-infrared data. Planet. Space Sci. 2019, 165, 124–136. [Google Scholar] [CrossRef]
  45. Lin, H.L.; Zhang, X. Retrieving the hydrous minerals on Mars by sparse unmixing and the Hapke model using MRO/CRISM data. Icarus 2017, 288, 160–171. [Google Scholar] [CrossRef]
  46. Lin, H.L.; Zhang, X.; Shuai, T.; Zhang, L.F.; Sun, Y.L. Abundance retrieval of hydrous minerals around the Mars Science Laboratory landing site in Gale crater, Mars. Planet. Space Sci. 2016, 121, 76–82. [Google Scholar] [CrossRef]
  47. Huang, J.; Xiao, Z.Y.; Flahaut, J.; Martinot, M.; Head, J.; Xiao, X.; Xie, M.G.; Xiao, L. Geological Characteristics of Von Karman Crater, Northwestern South pole-Aitken Basin: Chang’E-4 Landing Site Region. J. Geophys. Res. Planets 2018, 123, 1684–1700. [Google Scholar] [CrossRef] [Green Version]
  48. Pieters, C.; Shkuratov, Y.; Kaydash, V.; Stankevich, D.; Taylor, L. Lunar soil characterization consortium analyses: Pyroxene and maturity estimates derived from Clementine image data. Icarus 2006, 184, 83–101. [Google Scholar] [CrossRef]
  49. Lucey, P.G.; Blewett, D.T.; Jolliff, B.L. Lunar iron and titanium abundance algorithms based on final processing of Clementine ultraviolet-visible images. J. Geophys. Res. Planets 2000, 105, 20297–20305. [Google Scholar] [CrossRef]
  50. Lucey, P.G.; Blewett, D.T.; Taylor, G.J.; Hawke, B.R. Imaging of lunar surface maturity. J. Geophys. Res. Planets 2000, 105, 20377–20386. [Google Scholar] [CrossRef]
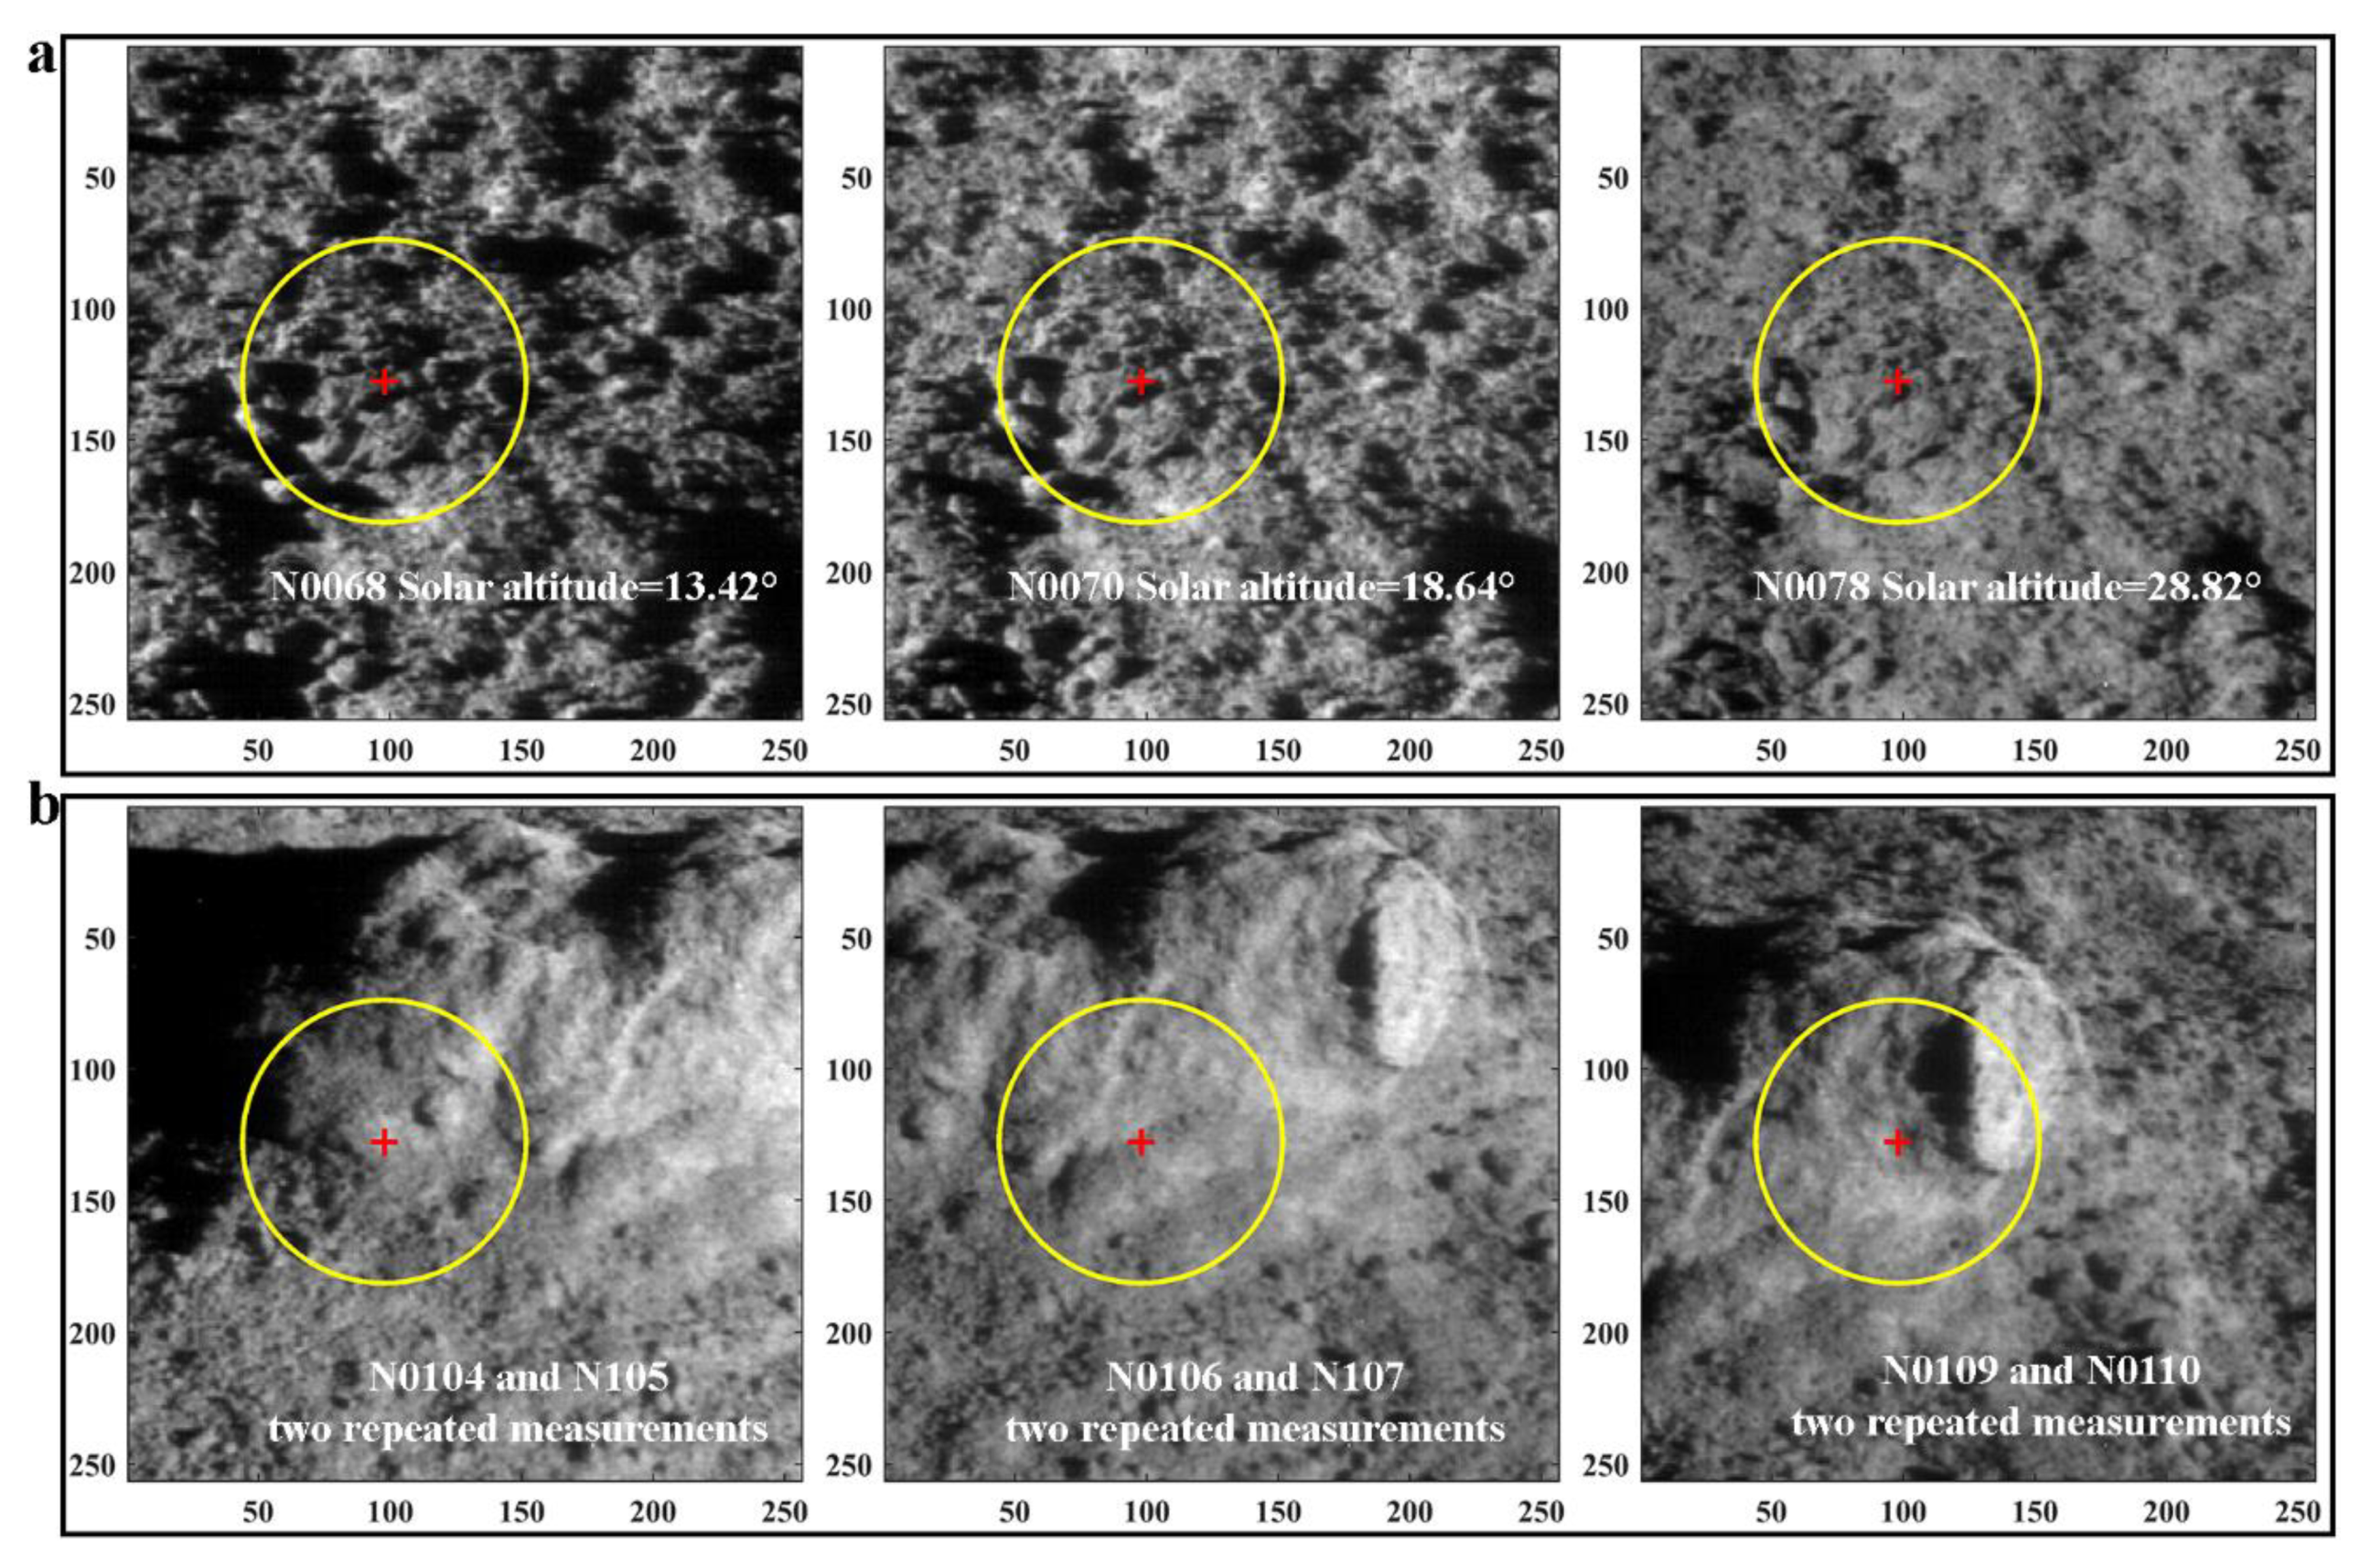
Figure 1. Schematic of working mode of the Yutu-2 rover at lunar surface and the major specifications of visible and near-infrared (VNIR) imaging spectrometer [30]. The field of view (FOV) of the complementary metal–oxide–semiconductor (CMOS) imager is ~15 cm × 21 cm because of the different resolution in the horizontal and vertical directions. The FOV of the short-wavelength near-infrared (SWIR) detector is a circle with a diameter of 107.6 CMOS pixels and is centered at sample 98, line 127.5 within the FOV of the CMOS imager. Only a spectrum can be obtained by SWIR detector.
Remotesensing 12 01603 g001
Figure 2. The CMOS images of lunar surface observed by Yutu-2 rover. (a) The images of the same regolith area measured at different solar altitudes. (b) The repeated measurements of rock-bearing areas. The size of CMOS image is ~15 × 21cm. The yellow circle is the field of view of the SWIR detector.
Remotesensing 12 01603 g002
Figure 3. The scatterplot of the local mean radiance values and the local standard deviations at 0.945 μm and their correlation coefficients at all bands.
Remotesensing 12 01603 g003
Figure 4. Endmember spectra used in this study. (a) Pyroxene. (b) Plagioclase. (c) Olivine. (d) Ilmenite. The minerals were separated from the Apollo samples, which were collected in Lunar Rock and Mineral Characterization Consortium (LMRCC) database [42].
Remotesensing 12 01603 g004
Figure 5. The rock measured by Yutu-2 rover. (a) The CMOS image of the rock. The red regions are the fresh rock surface. (b) The average reflectance spectrum of the fresh rock surface.
Remotesensing 12 01603 g005
Figure 6. Signal–noise ratio (SNR) of the CMOS image. (a) The SNR versus wavelength at different solar altitude. (b) The SNR versus solar altitude. (c) The SNR versus irradiance of solar energy at 0.75 μm.
Remotesensing 12 01603 g006
Figure 7. The spectra and their differences acquired from the same rock-bearing area. (a) The spectra of 0106 and 0107. (b) The spectra of 0109 and 0110. (c) The difference of the spectra between 0106 and 0107. (d) The difference of the spectra between 0109 and 0110.
Remotesensing 12 01603 g007
Figure 8. The continuum-removed spectra and band centers and depths of rock-bearing areas. (a) The continuum-removed spectra of the paired measurements with small difference of solar altitudes. (b) The continuum-removed spectra of the paired measurements with large difference of solar altitudes. (c) The positions of the band centers. (d) The band depths. The lines in (c) and (d) are error bars.
Remotesensing 12 01603 g008
Figure 9. The band centers of the regolith spectra measured by Yutu-2 rover and their shifts caused by the data noise. The b1 and b2 indicate the 1 μm band center and 2 μm band center, respectively. The black dots and gray triangles represent spectral features of the Apollo samples included in the LSCC database. For obtaining the accurate band centers of Apollo samples, only the spectra with strong absorptions were plotted (48 of 76 samples).
Remotesensing 12 01603 g009
Figure 10. The variation of mineral abundances caused by the noise in the hyperspectral data acquired by CE-4.
Remotesensing 12 01603 g010
Figure 11. The variations of (a) SMFe abundance and (b) particle size of lunar regolith caused by the noise in the hyperspectral data acquired by CE-4.
Remotesensing 12 01603 g011
Table 1. Observation angles of the repeated measurements.
Data IDIncidence Angle (°)Solar Altitude (°)Emission Angle (°)Phase Angle (°)Incidence Angle VariationPhase Angle Variation
Figure 2a (regolith)N006876.5813.4248.2779.38
N006975.9814.0248.2778.490.600.89
N007071.3618.6448.2771.494.627.0
N007170.1419.8648.2769.601.221.89
N007269.6120.3948.2768.780.530.82
N007368.9021.1048.2767.660.711.12
N007468.3321.6748.2766.760.570.9
N007563.7426.2648.2759.244.597.52
N007662.8627.1448.2757.730.881.51
N007762.0527.9548.2756.320.811.41
N007861.1828.8248.2754.790.871.53
Figure 2b (rock-bearing area)N010458.83 31.1743.23 49.70
N010559.53 30.4743.23 50.94 0.701.24
Figure 2c (rock-bearing area)N010660.24 29.7643.08 54.06
N010760.35 29.6543.08 54.26 0.110.20
Figure 2d (rock-bearing area)N010967.40 22.6042.93 66.76
N011067.52 22.4842.93 66.95 0.120.19

