Letter

Assessment of AMSR2 Ice Extent and Ice Edge in the Arctic Using IMS

1
Center for Satellite Applications and Research, NOAA/NESDIS, 1225 West Dayton St., Madison, WI 53706, USA
2
Center for Satellite Applications and Research, NOAA/NESDIS, 5830 University Research Ct, College Park, MD 20740, USA
3
National Snow and Ice Data Center, CIRES, 449 UCB, University of Colorado Boulder, Boulder, CO 80309, USA
4
Cooperative Institute for Meteorological Satellite Studies, University of Wisconsin-Madison, 1225 West Dayton St., Madison, WI 53706, USA
*
Author to whom correspondence should be addressed.
Remote Sens. 2020, 12(10), 1582; https://doi.org/10.3390/rs12101582
Submission received: 21 April 2020 / Revised: 7 May 2020 / Accepted: 12 May 2020 / Published: 16 May 2020
(This article belongs to the Special Issue Remote Sensing in Sea Ice)

Abstract

:
This work assesses the AMSR2 (the Advanced Microwave Scanning Radiometer 2) ice extent and ice edge in the Arctic using the ice extent products of NOAA’s Interactive Multisensor Snow and Ice Mapping System (IMS) from the period of July 2015 to July 2019. Daily values and monthly means of four statistical scores (hit rate, false alarm ratio, false alarm rate, and Hanssen-Kuiper Skill Score) over the Arctic Ocean show distinct annual cycles. IMS ice edges often extend further south compared to those from AMSR2, with up to 100 km differences over the Beaufort, Chukchi, and East Siberian Seas in August and September.

Graphical Abstract

1. Introduction

Sea ice regulates the energy and mass exchange between the atmosphere and the ocean. Satellite retrievals of cloud properties, radiation flux and many other physical variables depend on surface types, e.g., snow/ice from open water [1,2]. There have been dramatic changes in the Arctic sea ice properties in the last few decades [3,4,5,6,7], and the trends are expected to continue in the coming decades [8,9]. Changes in sea ice lead to changes in atmosphere–ocean interactions and sea ice spatial patterns, e.g., the marginal ice zone (MIZ) [10]. High-quality sea ice observations are essential for these applications. Satellite sensors have long been used to monitor sea ice for their much higher spatial and temporal coverage in the polar regions than in situ observations. Microwaves can penetrate clouds, and all-weather passive microwave sea ice concentration products have been available since the late 1970s [11,12,13]. At least a dozen algorithms are available to estimate the passive microwave ice concentration [11,14], of which the NASA Team (NT) algorithm [15], the enhanced NT (NT2) algorithm [16], the Bootstrap (BS) algorithm [17] and the ARTIST Sea Ice (ASI) algorithm [18] are widely used. Sea ice concentrations from satellite sensors in the visible and infrared spectrum, e.g., from the MODIS (Moderate Resolution Imaging Spectroradiometer) and VIIRS (Visible Infrared Imaging Radiometer Suite) instruments, are only available under clear-sky conditions, but have higher spatial resolution, and thus, can provide additional information [19].
The qualities of passive microwave sea ice products have been assessed in numerous previous studies. Intercomparisons of passive microwave sea ice concentrations from different algorithms [11,14,20,21] revealed substantial differences, mainly due to the use of different channels and tie-point approaches. Generally good validation data are lacking for the evaluation of these products. Direct comparisons to sea ice concentration observations with higher spatial resolutions, e.g., observations from ship, synthetic aperture radar (SAR), and Landsat, show higher uncertainties in the MIZ, regions of melting and freeze-up, over thin ice and melt ponds, and generally, in summer [11,20,22,23]. Comparisons of sea ice extent and area that are derived from different sea ice concentrations also show noticeable differences, though they generally agree on the trends in both area and extent [14,24]. Meier et al. [25] compared sea ice concentrations and derived Arctic sea ice extent from the NASA AMSR-E (Advanced Microwave Scanning Radiometer - Earth Observing System) and from the Sea Ice Index (SII) [26] to daily Multisensor Analyzed Sea Ice Extent (MASIE) fields. The comparison showed that MASIE has higher Arctic sea ice extent than SII and AMSR-E throughout the year, except in the periods before the peak of the melt season (May-June) and at the end of the melt season and beginning of freeze-up (late September-October).
The AMSR2 (the Advanced Microwave Scanning Radiometer 2) onboard Japan’s Global Change Observation Mission 1st - Water “SHIZUKU” (GCOM-W1) satellite was launched in 2012. The NT2 algorithm was originally developed for AMSR-E [16], and has been adapted for NOAA’s operational products for the AMSR2 [4]. The AMSR2 Brightness Temperatures are adjusted to equivalent-AMSR-E Brightness Temperature for application of NT2 for AMSR2 data [27]. Passive microwave ice concentration estimates are critical for numerical weather prediction (NWP), climate monitoring and forecasting, and navigational forecasting. With the end of the AMSR-E and Special Sensor Microwave Imager/Sounder (SSMIS) missions, the ASMR2 ice products became increasingly important in such applications. The accuracy and biases need to be assessed to correctly apply and adjust for AMSR 2 uncertainty. Even though the heritage from AMSR-E indicates an equally high quality of this AMSR2 ice products as those from AMSR-E, the quality of the AMSR2 ice products needs to be constantly monitored and extensively assessed when new validation datasets become available. Ice cover product has been available since 1997 from the Interactive Multisensor Snow and Ice Mapping System (IMS) of the US National Ice Center (USNIC). The IMS is a manually generated daily analysis of Northern Hemispheric snow and ice extent that relies on input from over 30 potential satellite and in situ data sources, and is applied in many NWP models worldwide. The IMS only generates ice extents, not ice concentrations, like AMSR 2. The addition of human expertise makes the IMS a good validation data set for satellite retrieval products [28,29]. Spatial resolution of the IMS changed from 24 km to 4 km in 2008, and has increased to 1 km since 2014 [28]. This high-quality and high-spatial-resolution IMS data has provided, since 2014, a good opportunity to assess the quality of this AMSR2 ice product.
In this work, we present an overview of the effort to assess the newly available AMSR2 ice product using 1 km IMS of the USNIC from 2015 to 2019, regarding the pixel-to-pixel comparison of ice extents and derived ice edge. Section 2 describes the data and methods. Section 3 presents the evaluation results. Section 4 summarizes and concludes.

2. Data and Methods

2.1. Data

The NT2 algorithm is run on swath data. The outputs include daily ice concentrations, with each grid cell containing the most recent observations in a day. Details of the modifications made for better operational application of AMSR2 can be found in Meier et al. [4]. The daily AMSR2 ice concentration with a 10 km Equal-Area Scalable Earth Grid version 2 (EASE2-Grid) has dimensions of 1050 by 1050 grid cells, covering the Arctic and extending from the pole to ~40° North. The range of ice concentration is from 0 to 100%. The ice concentration is 100% near the North Pole point, where AMSR2 does not cover. We use the daily data from July 2015 to July 2019. The daily data are remapped to 1 km EASE-2 Grid (Figure 1).
Snow cover and sea ice for the Northern Hemisphere from February 1997 to the present based on the IMS of USNIC are available at the National Snow and Ice Data Center (NSIDC) [28]. The data provides binary snow cover and sea ice cover information at three different resolutions, i.e., 1 km, 4 km, and 24 km, in polar stereographic ellipsoidal projection, with 1 km resolution data available starting in December 2014 [28,29]. The IMS is based on human analysis of many near-real-time datasets, including derived ice charts, modeled ice conditions, and surface observations, as well as visible, passive microwave, and active microwave satellite resources, e.g., SAR, with a 40% concentration threshold for the presence of sea ice. Not all datasets are used equally. With the availability of Copernicus Sentinel-1 SAR data to NOAA since 2014, the IMS has applied it as the primary source of data in ice identification, with moderate resolution MODIS and VIIRS imagery/products providing secondary references. When the primary and secondary products are unable to provide data for ice estimation, analysts will default to passive microwave 89 GHz brightness temperatures, scatterometer backscatter, ice charts, ice models, and sea ice concentrations from passive microwaves to determine the presence of ice. Based on the USNIC IMS, daily MASIE [30] provides daily ice extent, as used in [25]. MASIE/IMS at 4km resolution was also demonstrated to provide improve ice edge forecasts over the use of AMSR 2 alone [31]. That study didn’t examine whether this improvement was the result of AMSR 2 underestimation biases in the marginal ice zone. In this study, we used the IMS 1 km sea ice cover data from July 2015 to July 2019 and remapped them to 1 km EASE-2 Grid (Figure 1).

2.2. Method

A pixel is identified as ice covered when the AMSR2 ice concentration is higher than or equal to the set threshold, i.e., 15% (as convention for passive microwave ice concentration), or otherwise, as open water. The 15% threshold is used for passive microwave products, e.g., AMSR-E and AMSR2, because it tends to match up best with the true ice edge given the coarse spatial resolution of the passive microwave sensors [25]. We assess the quality of AMSR2 ice extent using the IMS ice extent in two different ways.
First, we compare AMSR2 and IMS using a contingency table approach (Table 1). This does a grid cell by grid cell match for the existence or nonexistence of ice in each of the products. A 2 × 2 contingency table provides the samples numbers a (ice in both AMSR2 and IMS), b (AMSR2 ice and IMS water), c (AMSR2 water and IMS ice), and d (water in both AMSR2 and IMS). In this formulation, a and d would be considered “correct” AMSR2 observations relative to IMS. From the contingency table, four statistical skill scores are derived, i.e., Hit Rate (HIT, or probability of detection), False Alarm Ratio (FARatio, or probability of false alarm), False Alarm Rate (FARate, or probability of false detection), and Hanssen-Kuiper Skill Score (KSS) (Equations (1)–(4)), and there four skill scores are calculated for the purpose of evaluation.
H I T =   a a   +   c
F a l s e   A l a r m   R a t i o = b a   +   b
F a l s e   A l a r m   R a t e = b b   +   d
K S S = H I T F a l s e   A l a r m   R a t e = a d b c ( a   +   c ) ( b   +   d )
The HIT represents the fraction of correct AMSR2 ice identification of the total ice cases from IMS, ranging from 0 to 1, with 1 as a perfect score. The FARatio represents the fraction of false AMSR2 ice identification of total AMSR2 ice identification, ranging from 0 to 1, with 0 as a perfect score. The FARate represents the fraction of false AMSR2 ice identification of total water cases from IMS, ranging from 0 to 1, with 0 as a perfect score. The KSS (also known as True Skill Statistics) represents the separation of the correct identification (HIT) and false identification (FARate), ranging from -1 to 1, with 1 as a perfect score. It has been argued that KSS provides an unbiased and acceptable measure of forecast accuracy for scientific purposes.
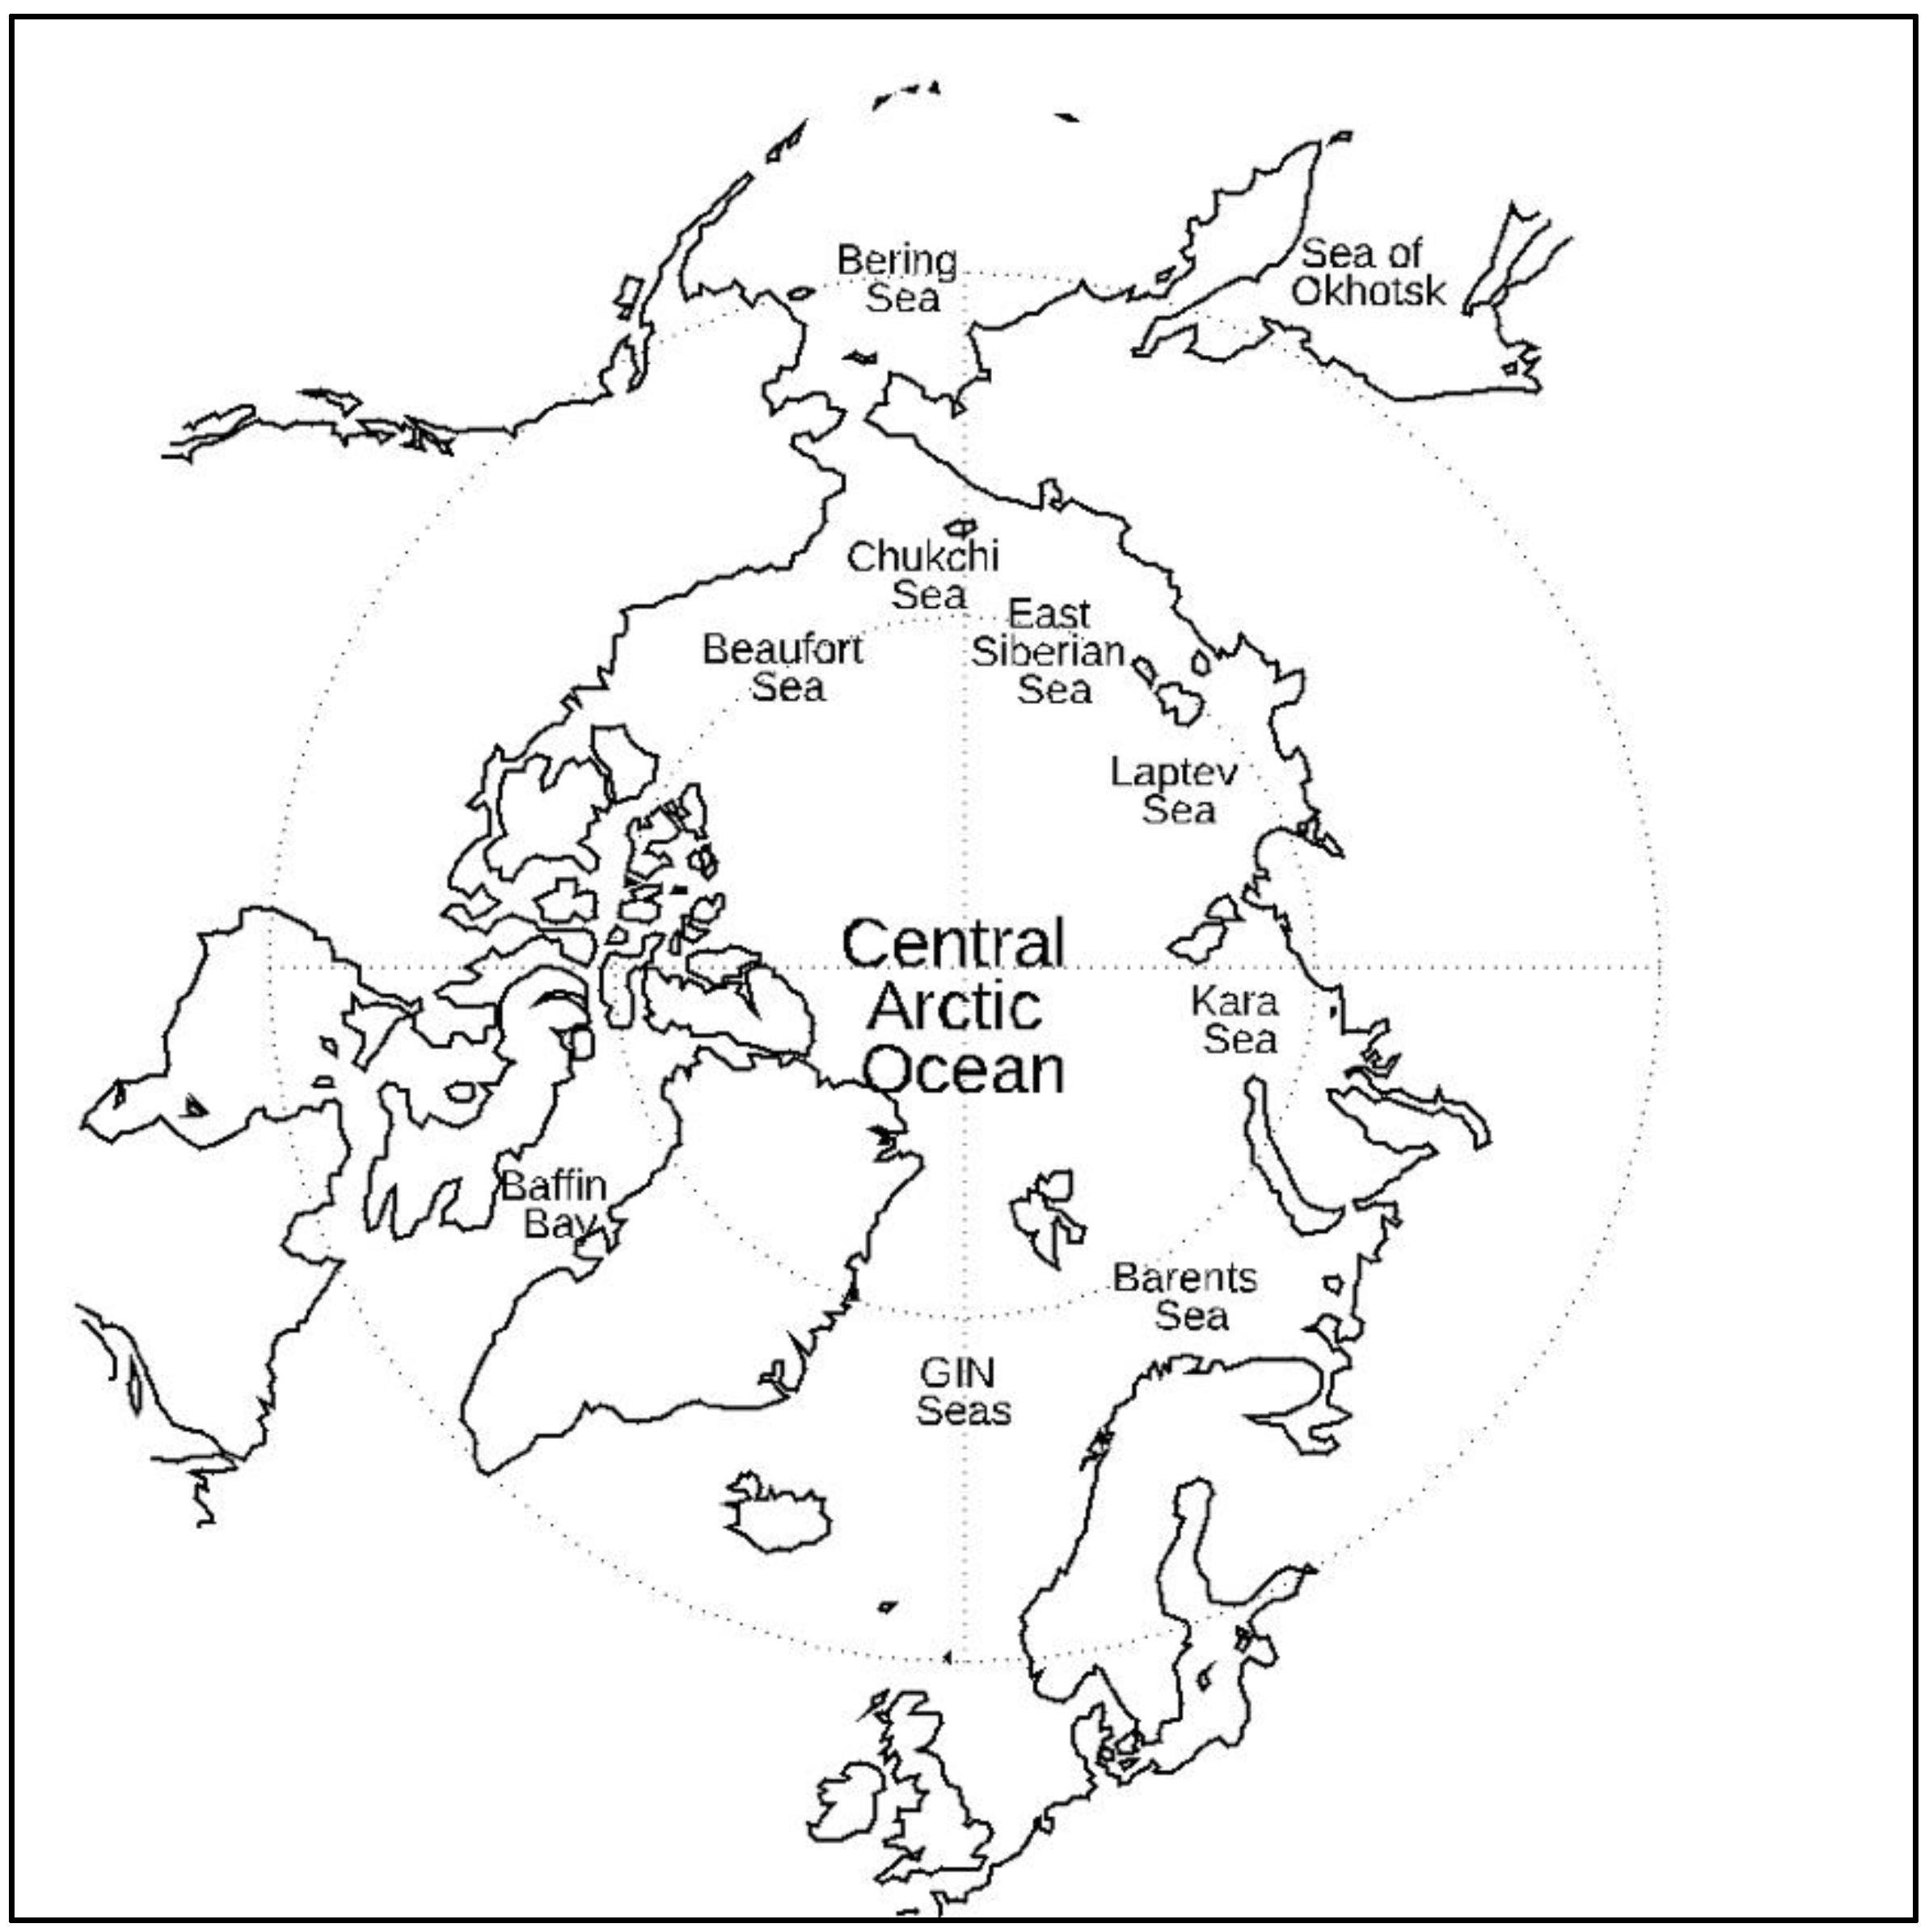
Daily HIT, FARatio, FARate, and KSS are calculated over individual sea of the Arctic Ocean, the Central Arctic Ocean, the Peripheral Seas of the Arctic Ocean (including Beaufort, Chukchi, East Siberian, Laptev, Kara, and Barents Seas), and over the Arctic Ocean north of 60° North from July 2015 to July 2019, as shown in Figure 2. Monthly mean statistics are derived based on daily values and the mean of monthly means from 2015 to 2019 are also calculated for each month.
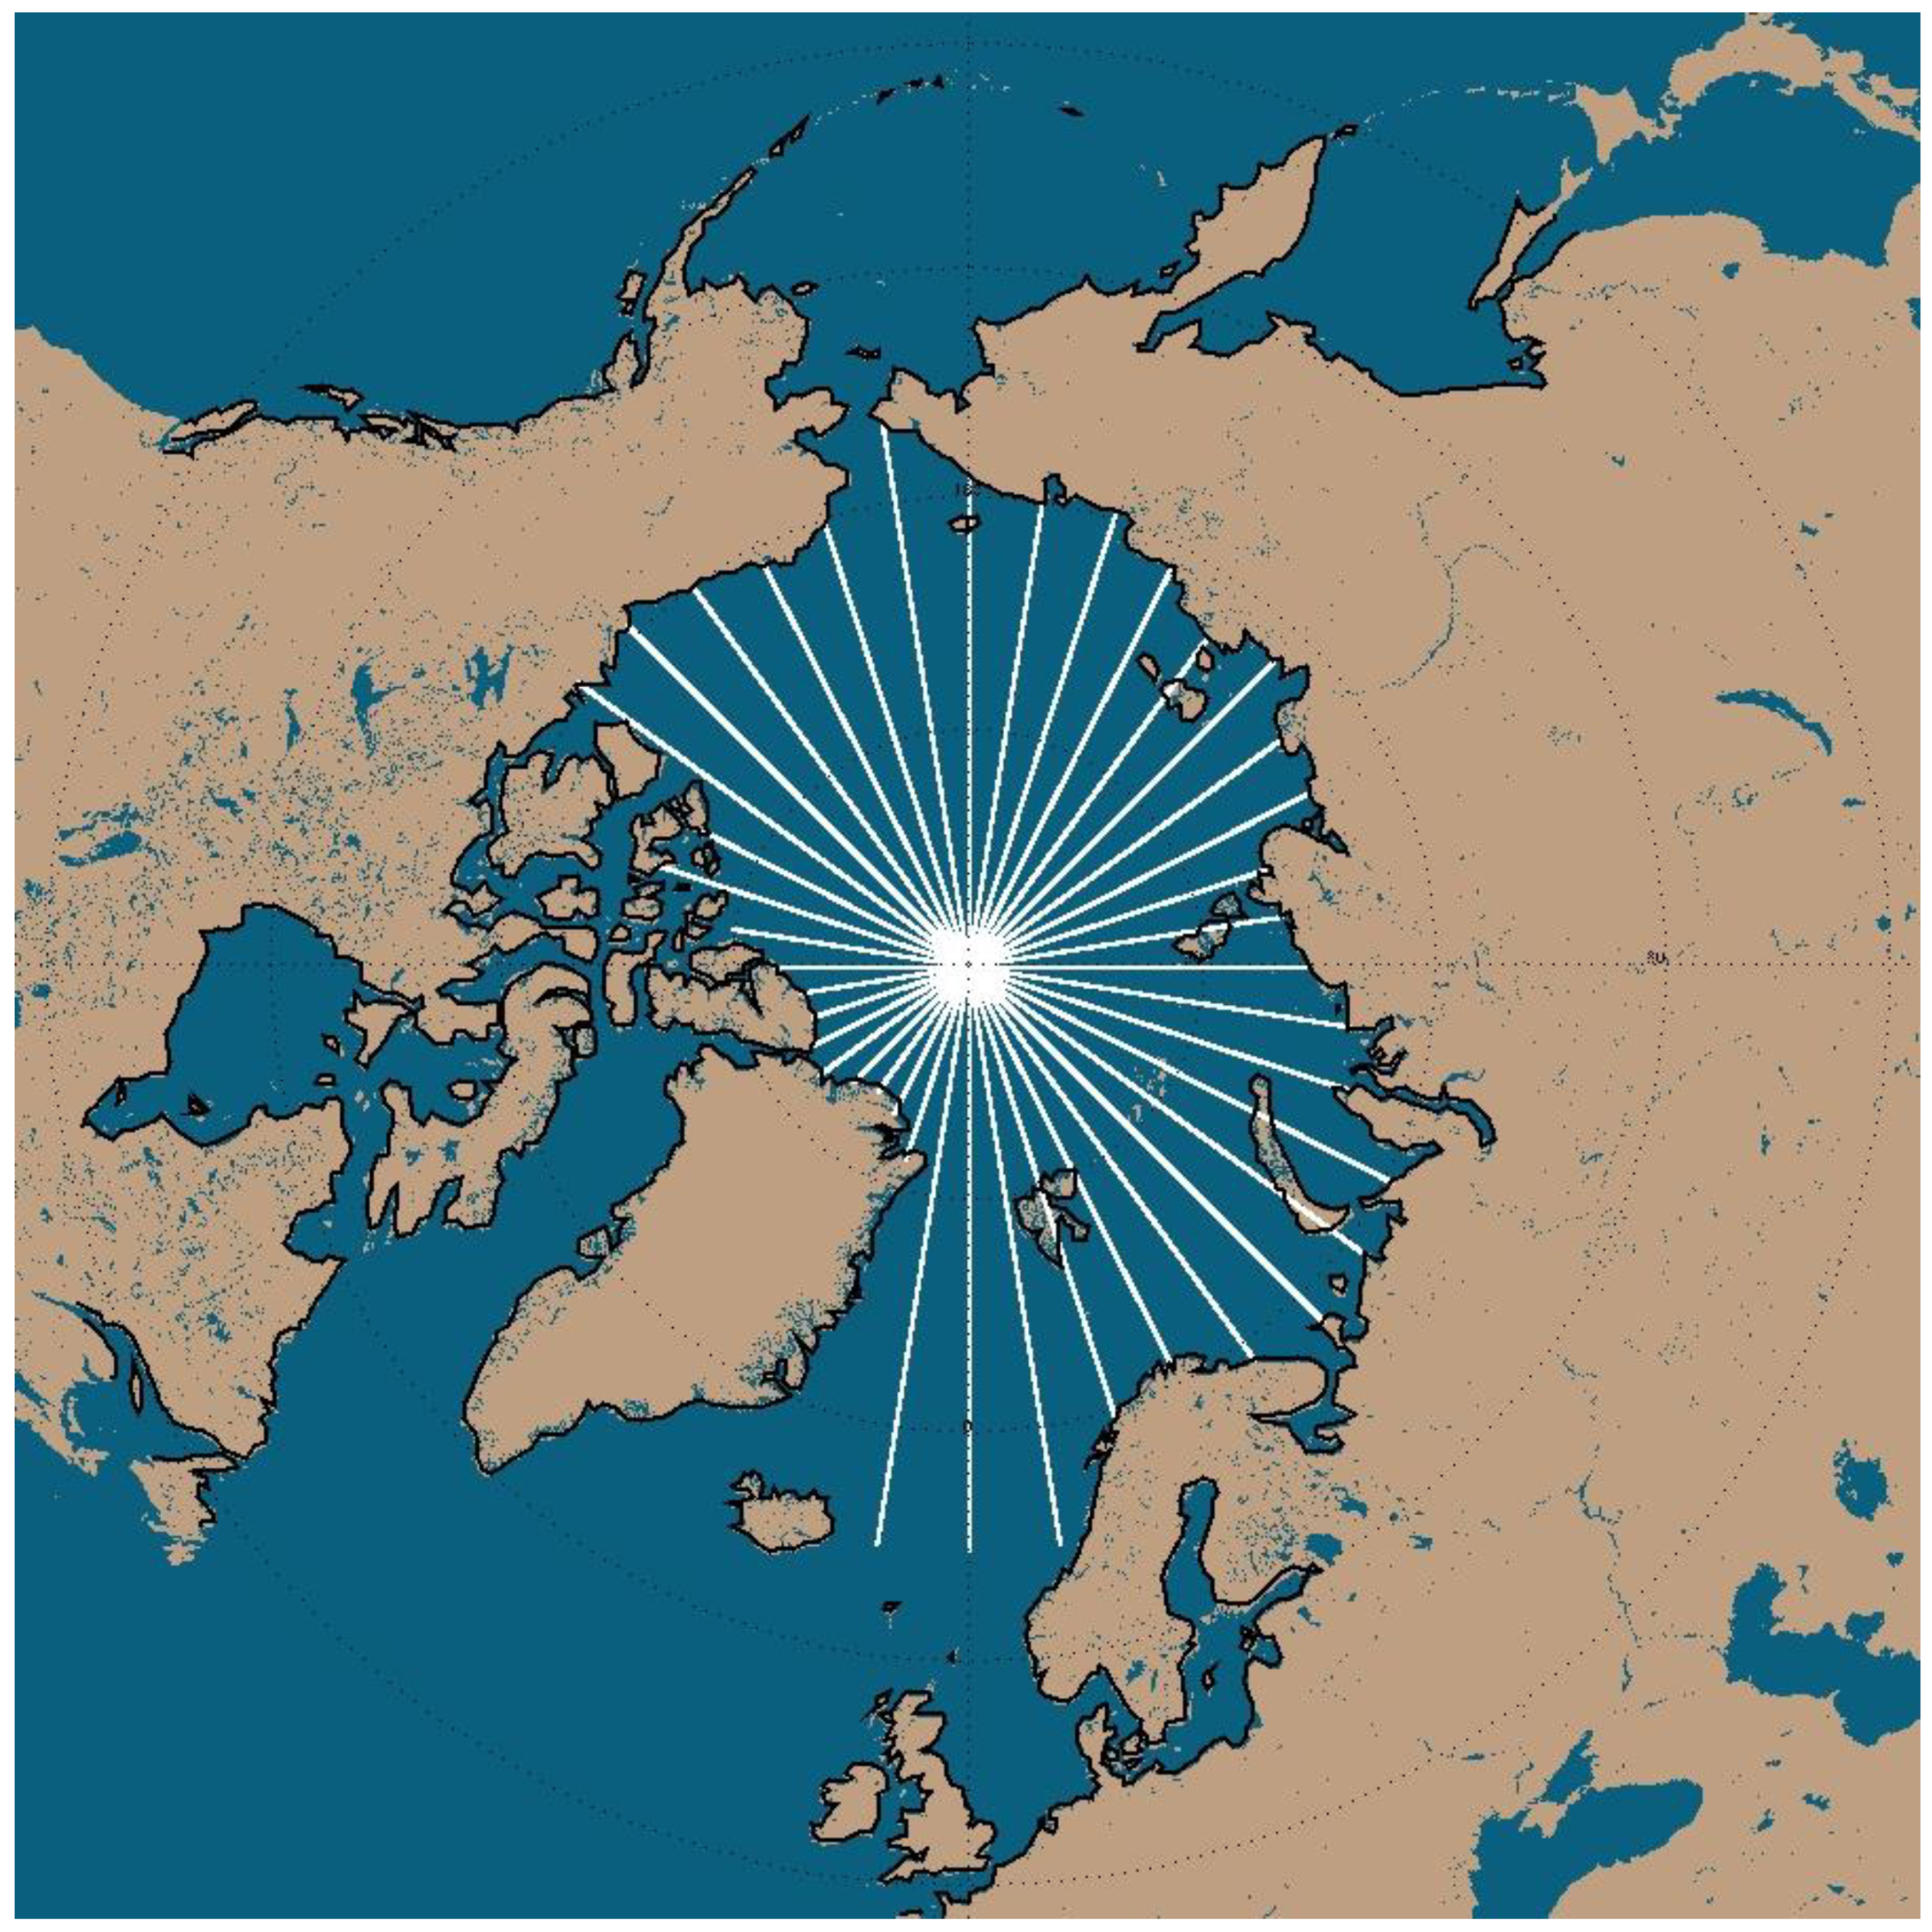
The second assessment approach is to compare the ice edge latitudinal locations derived from the AMSR2 and IMS ice extent. The ice edge is determined based on the ice extent using a similar approach by Mahoney et al. [32] and Stroeve et al. [7]. Radial transects from 90° N to 60° N with 0.01 degree longitude interval are used to locate the ice edge (Figure 3). The transects start from the North Pole point (90° N), then meet the ice pack, encounter the marginal ice zone, and finally, reach the ice edge. The northern edge of an open water area is determined as the ice edge if it is longer than 150 km along the transect. Daily ice edge is derived from July 2015 to July 2019, and monthly mean statistics are then derived.

3. Results

3.1. Ice Cover

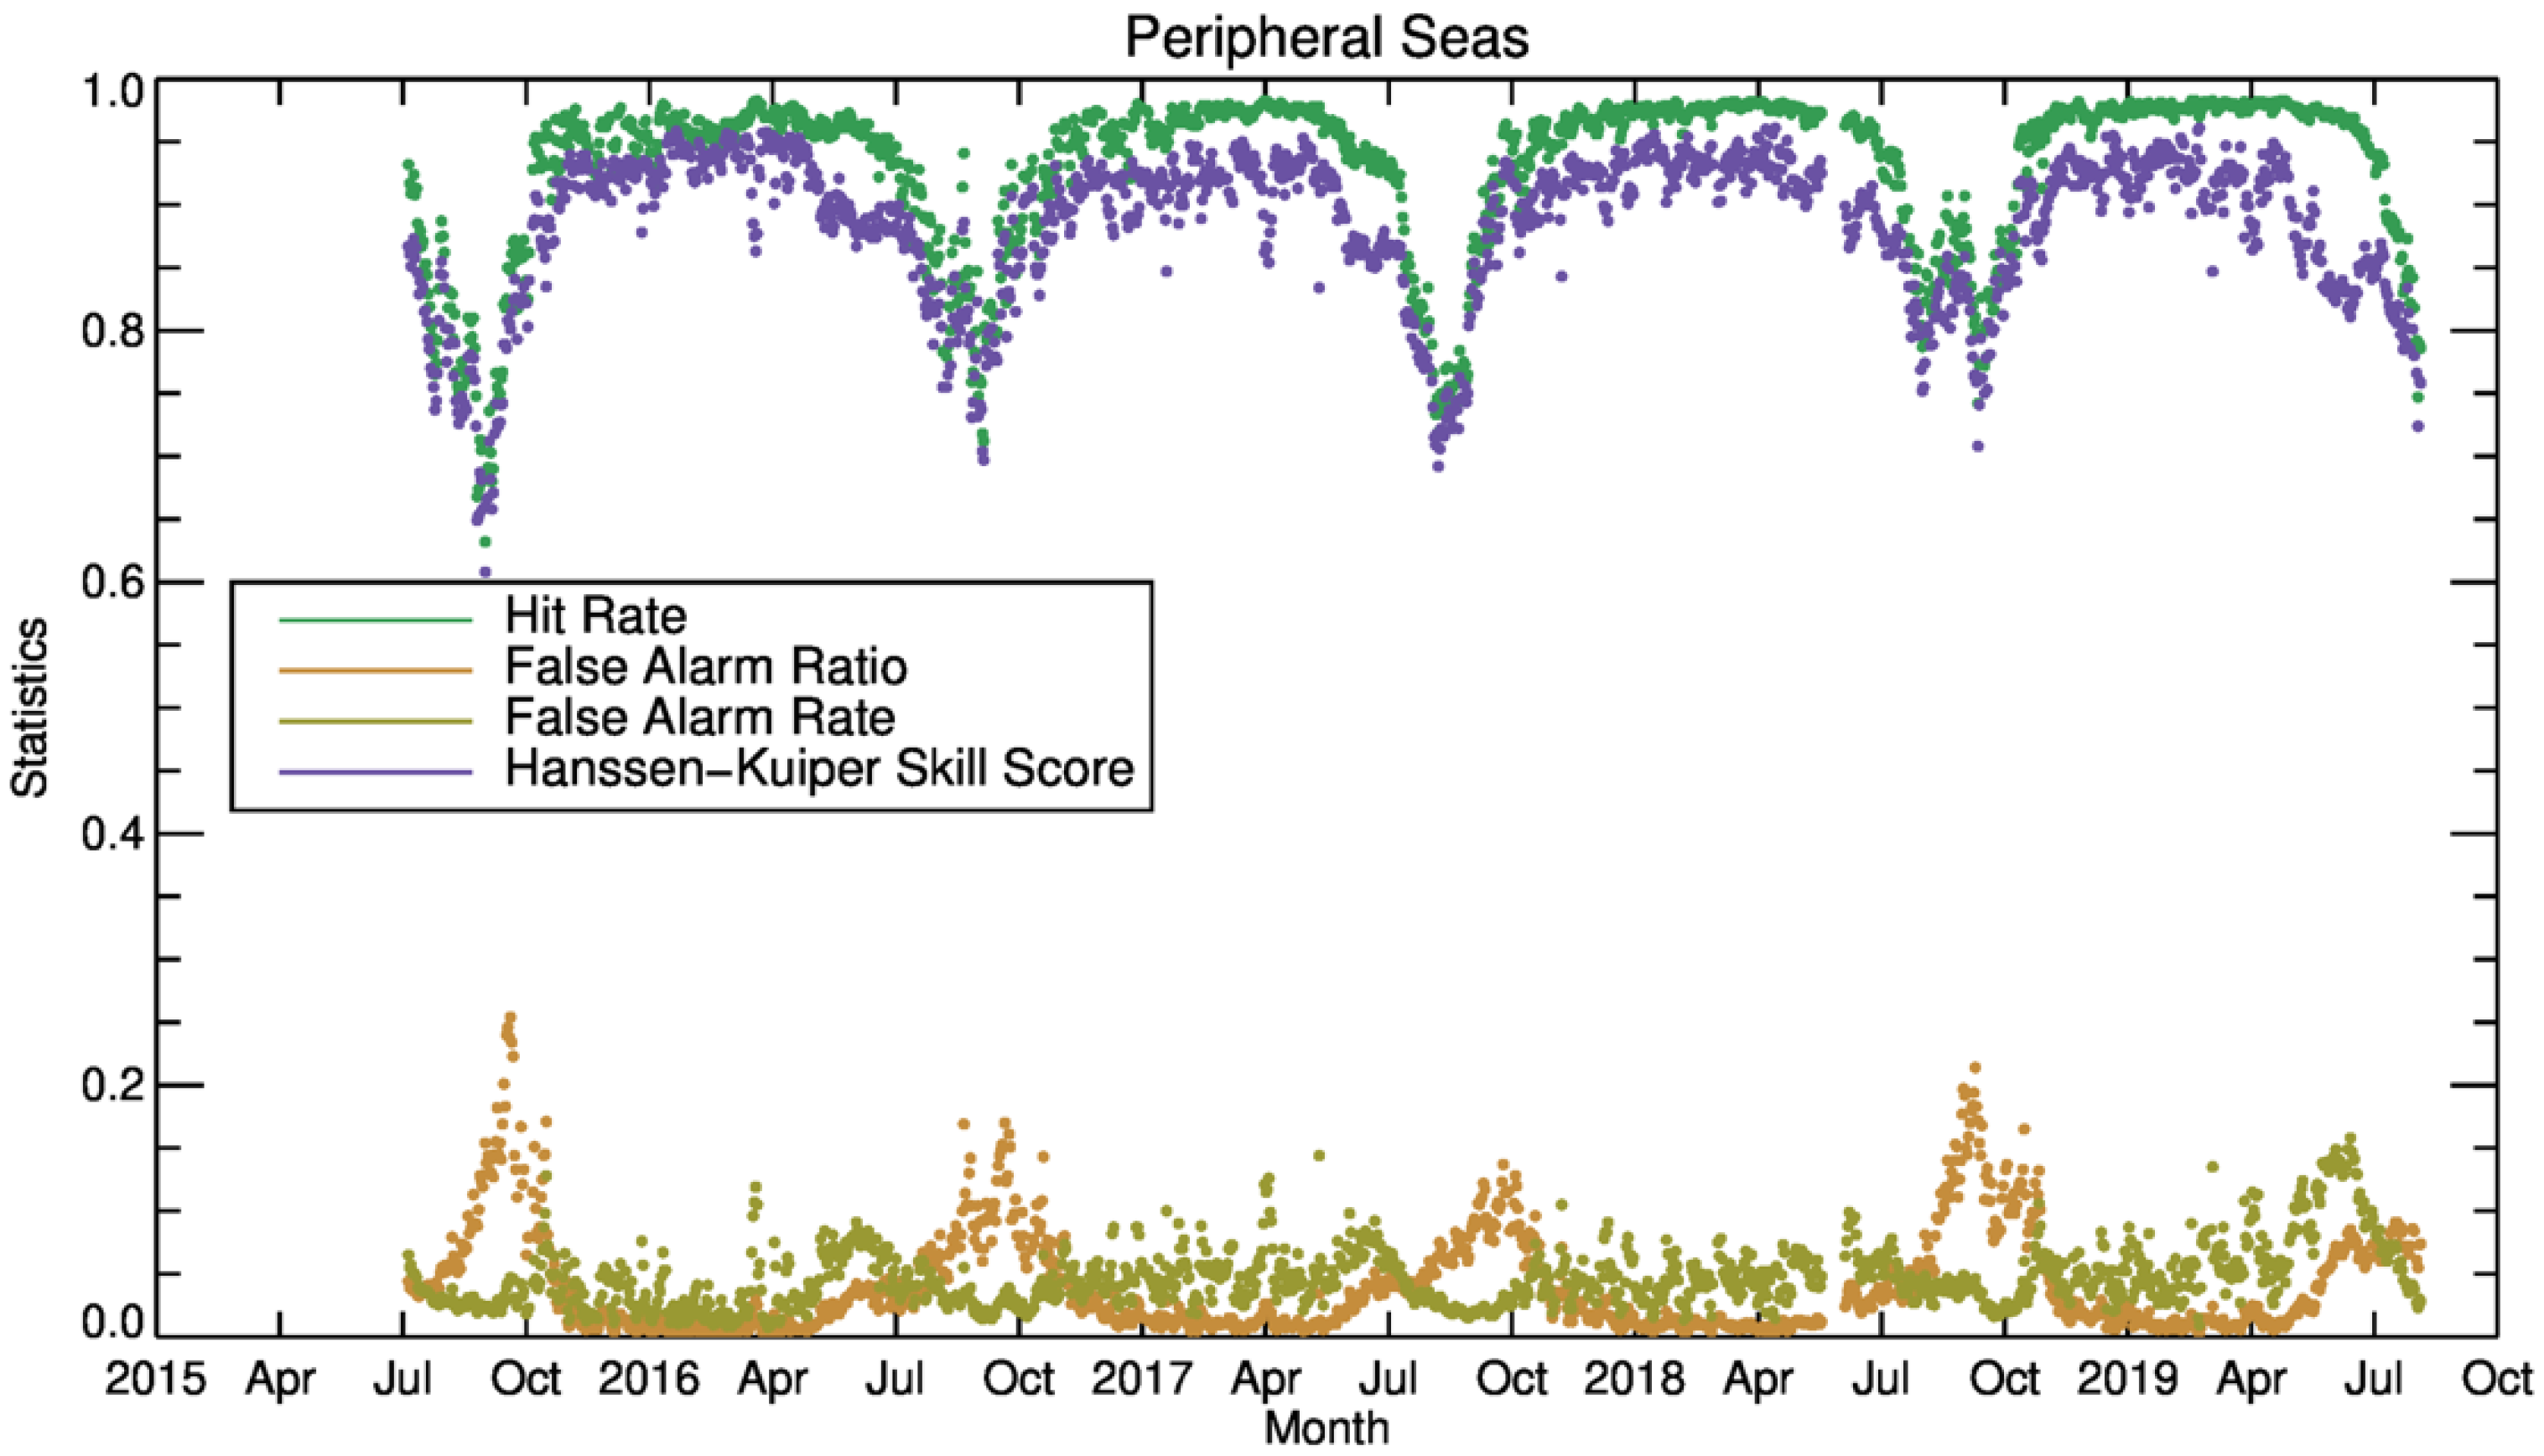
Over the Arctic Ocean north of 60° latitude, daily HIT reaches the maximum, i.e., 0.95, in October, remains high till June, i.e., over 0.9, and has its minimum from late July to early August, i.e., 0.85. The daily FARatio is under 0.03 most of the year, but increases from 0.03 in July to its maximum in September of up to around 0.12, before decreasing again in November. The daily FARate remains relatively constant during the year with values under 0.05; as a result, daily KSS follows the trends of daily HIT, with lower values than the daily HIT (Figure 4). In the peripheral seas, the daily HIT, FARatio, and KSS resemble the annual trends of those over the Arctic Ocean north of 60 degree, but with higher maxima and lower minima or larger magnitudes (Figure 5). The daily FARate remains relatively constant, with elevated values in June of as high as 0.10. The features of annual cycles of HIT, FARatio, FARate, and KSS over the Central Arctic Ocean show high values of HIT and KSS, i.e., near 1.0, throughout the year, and low values of FARatio, i.e., near 0.0, throughout the year.
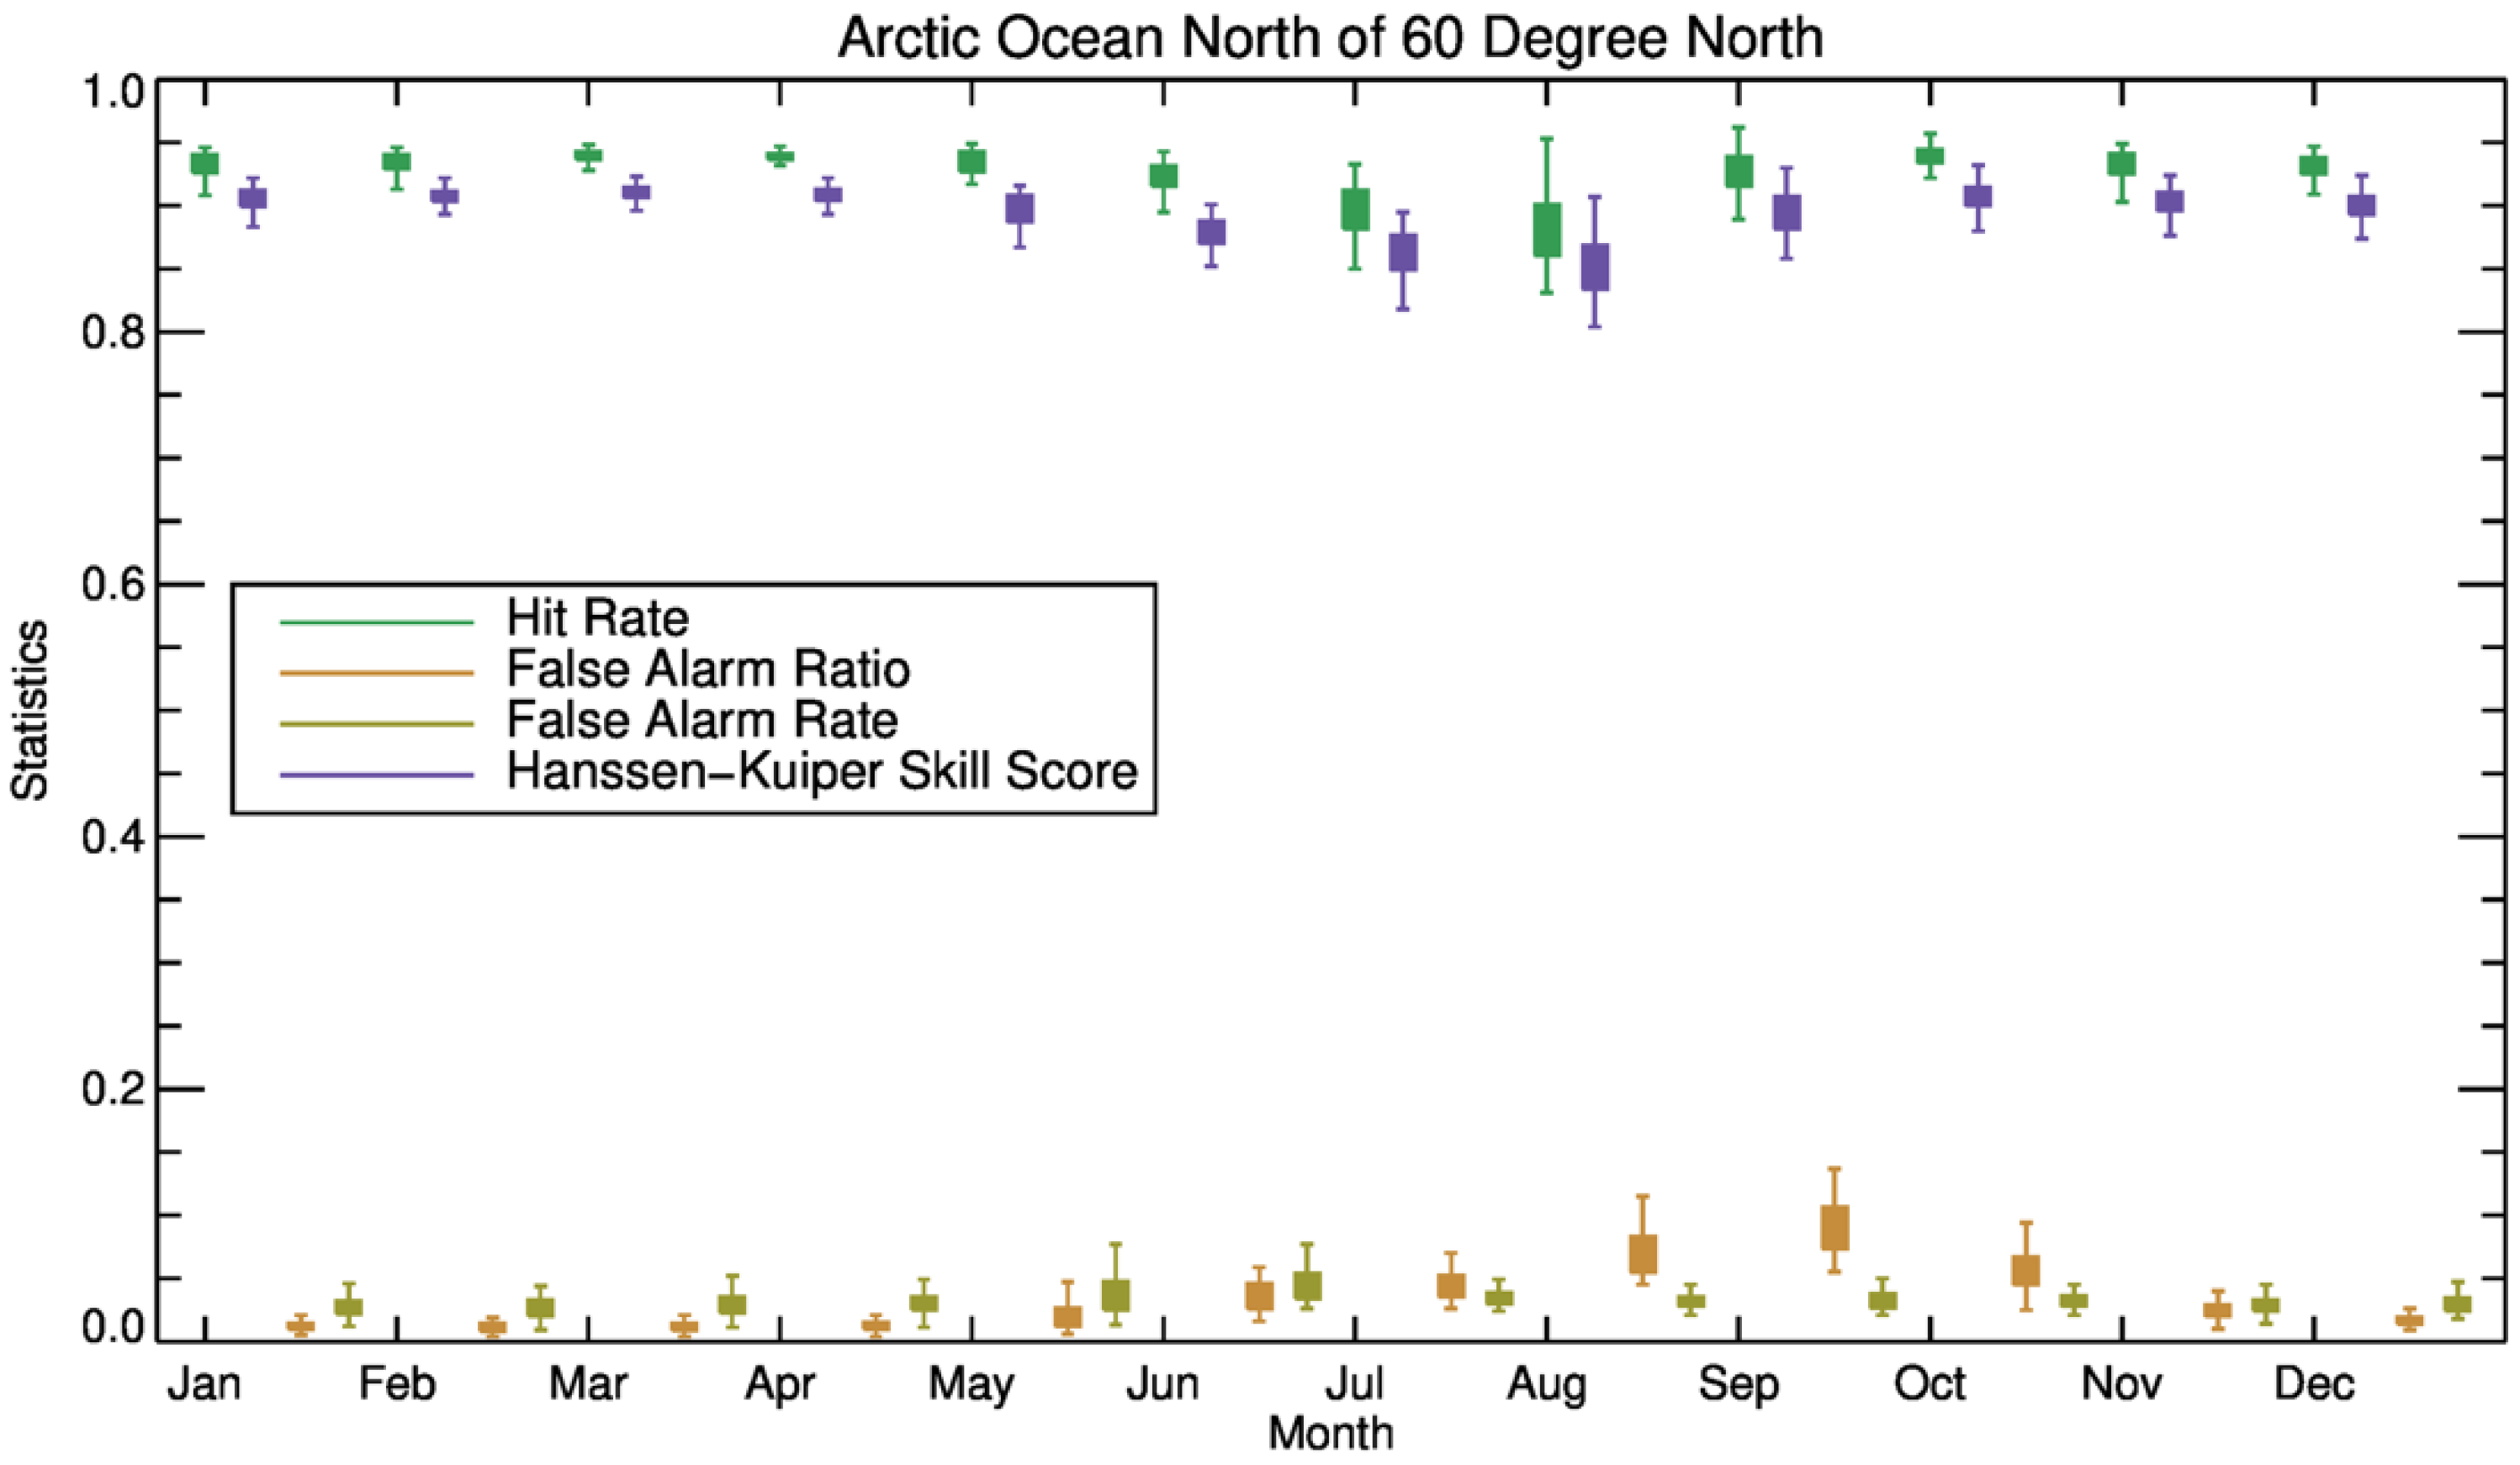
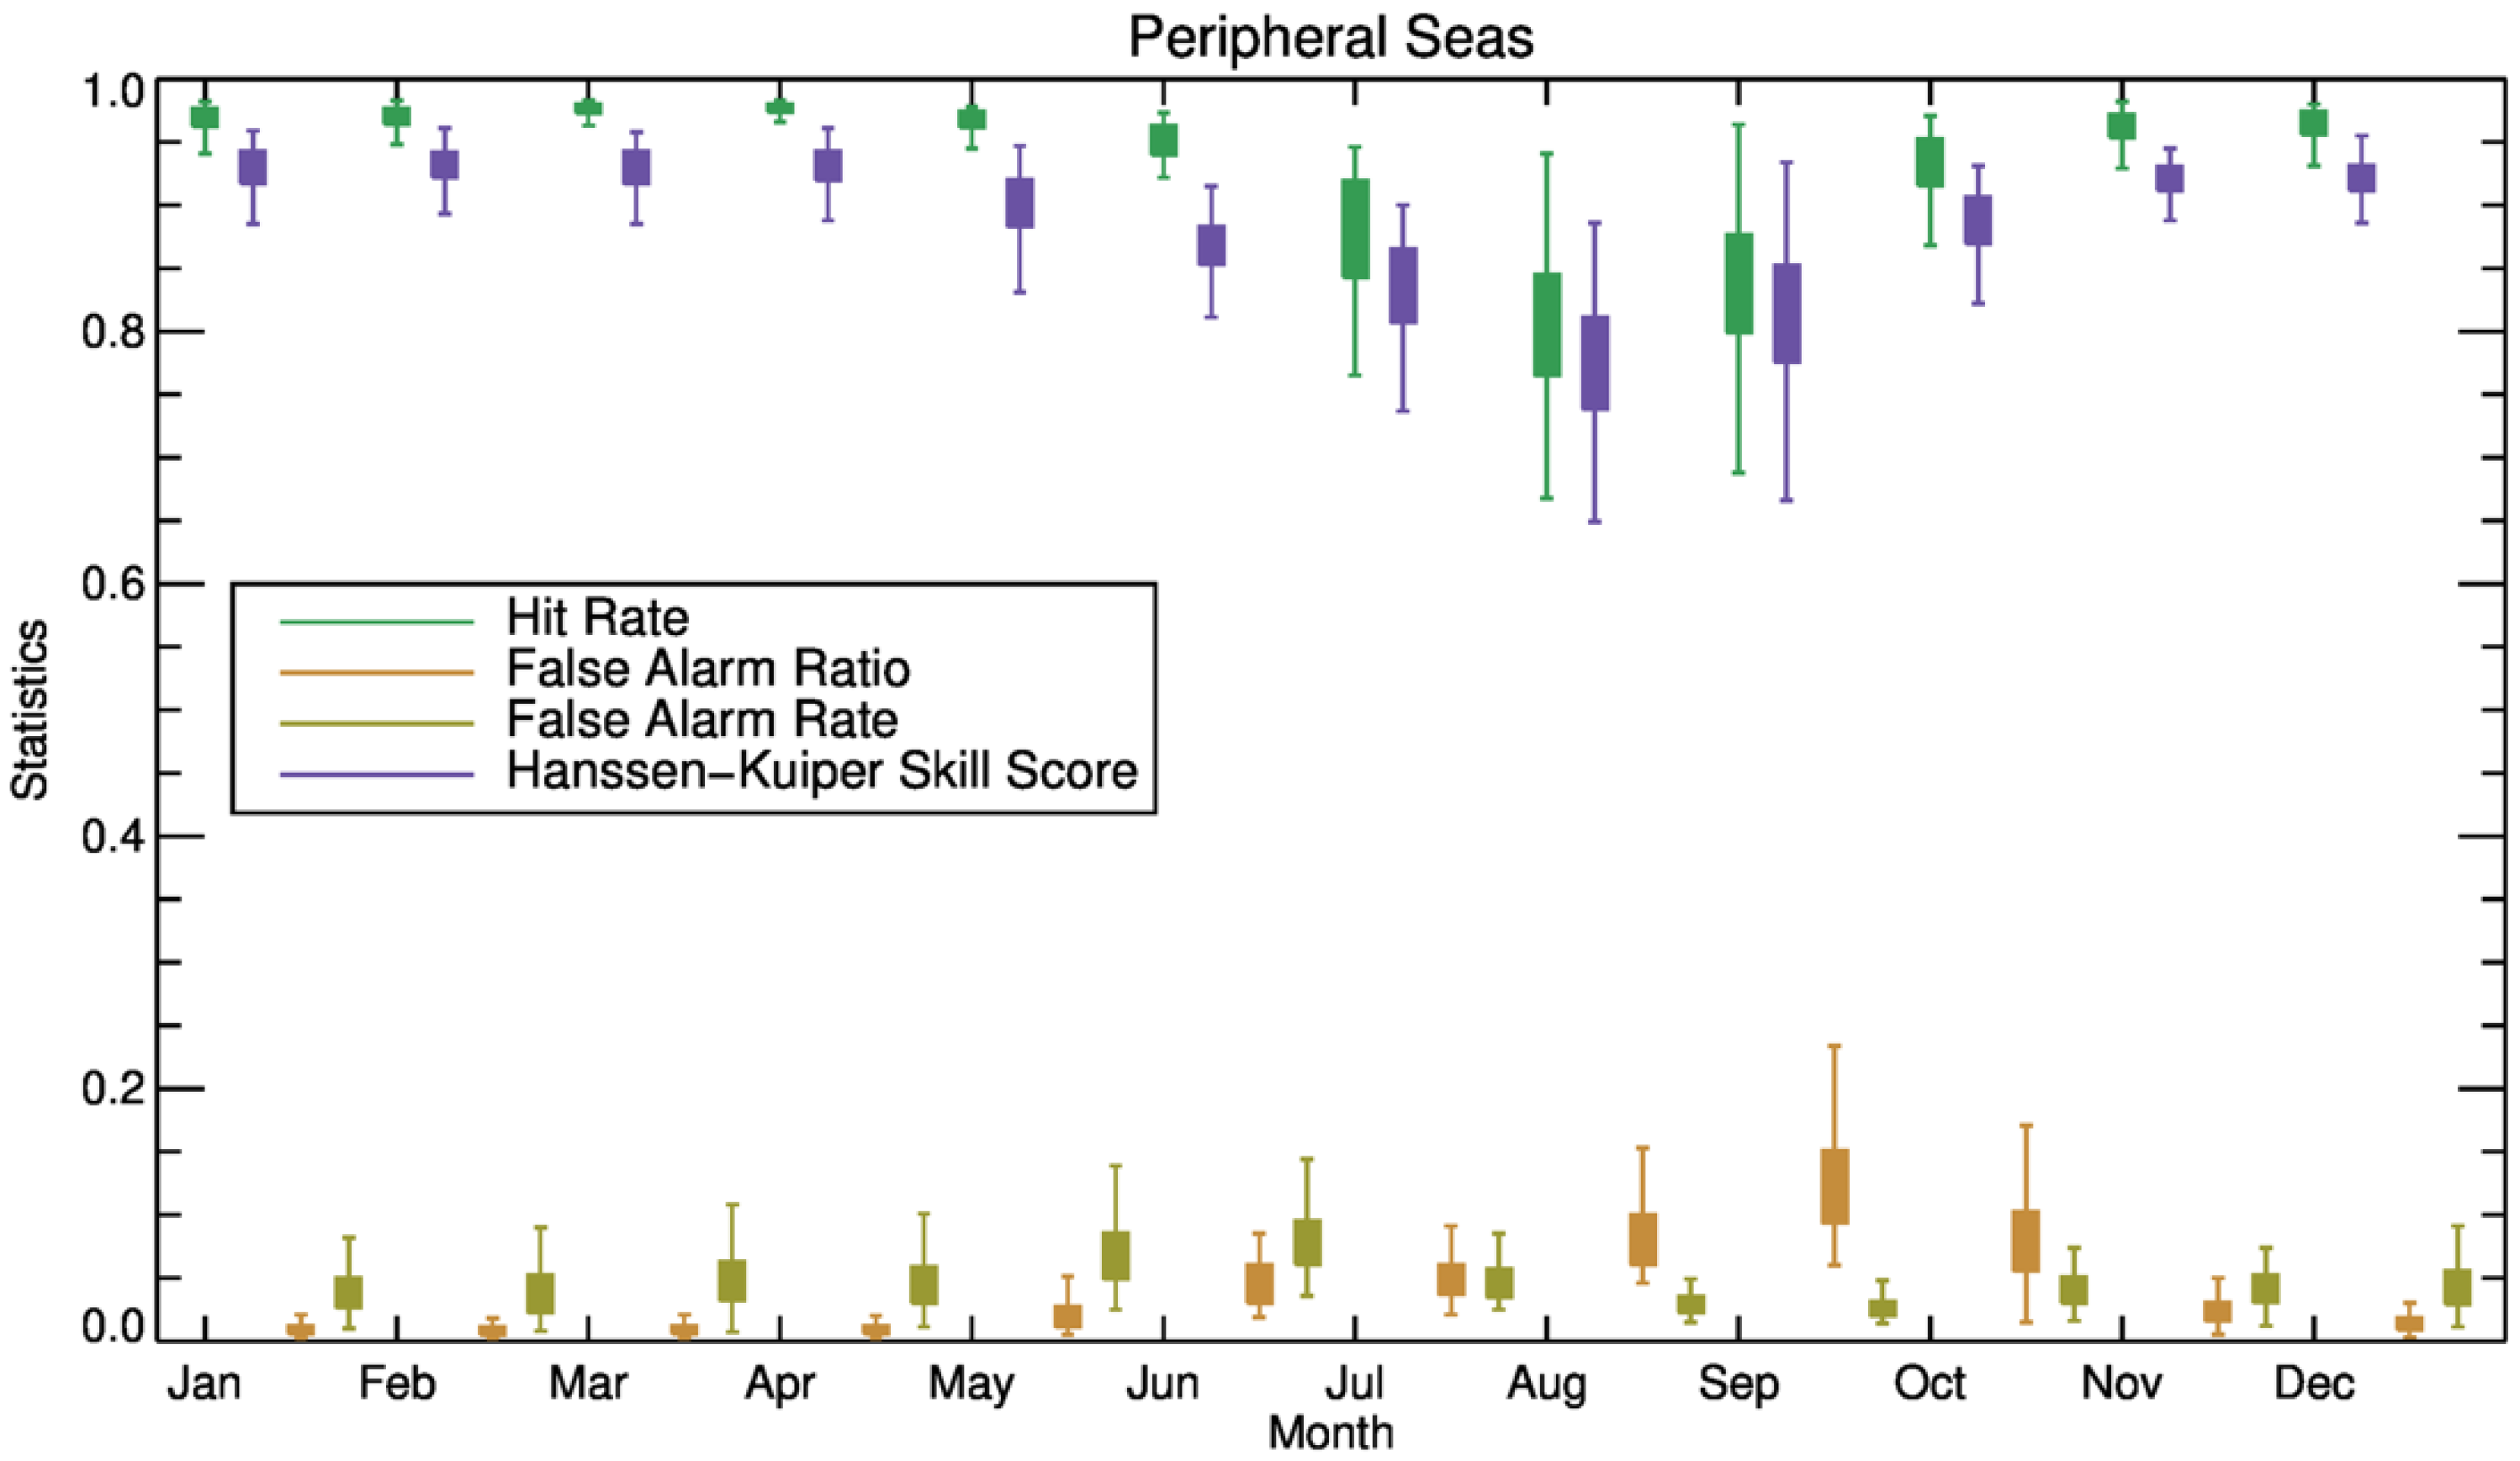
Annual cycles of monthly means shown in Figure 6 and Figure 7 and Table 2 are consistent with those of the daily values. Over the Arctic Ocean, poleward of 60° North, the monthly median HITs are above 0.93 in all months except for the minimum in July and August, when they are around 0.88. The monthly median FARatio are under 0.05, except from August to October, with the maximum in September of 0.09. The monthly median FARates are less than 0.05 in all months. The monthly median KSSs follow the trends of HITs with smaller values, i.e., above 0.90 in most months, with the minimum of around 0.85 in August (Figure 6). Over the peripheral seas, the monthly HITs, FARatio, FARate, and KSSs show similar annual cycles to those over the Arctic Ocean north of 60 degrees North, with larger annual cycle magnitude and larger monthly variations, e.g., larger interquartile ranges (Figure 7). The monthly median HITs are above 0.95 in all months except in July, August, and September, with a minimum of around 0.80 in August. The monthly median KSSs are above 0.90 in most months except in June, July, August, and September, with a minimum of around 0.78 in August.
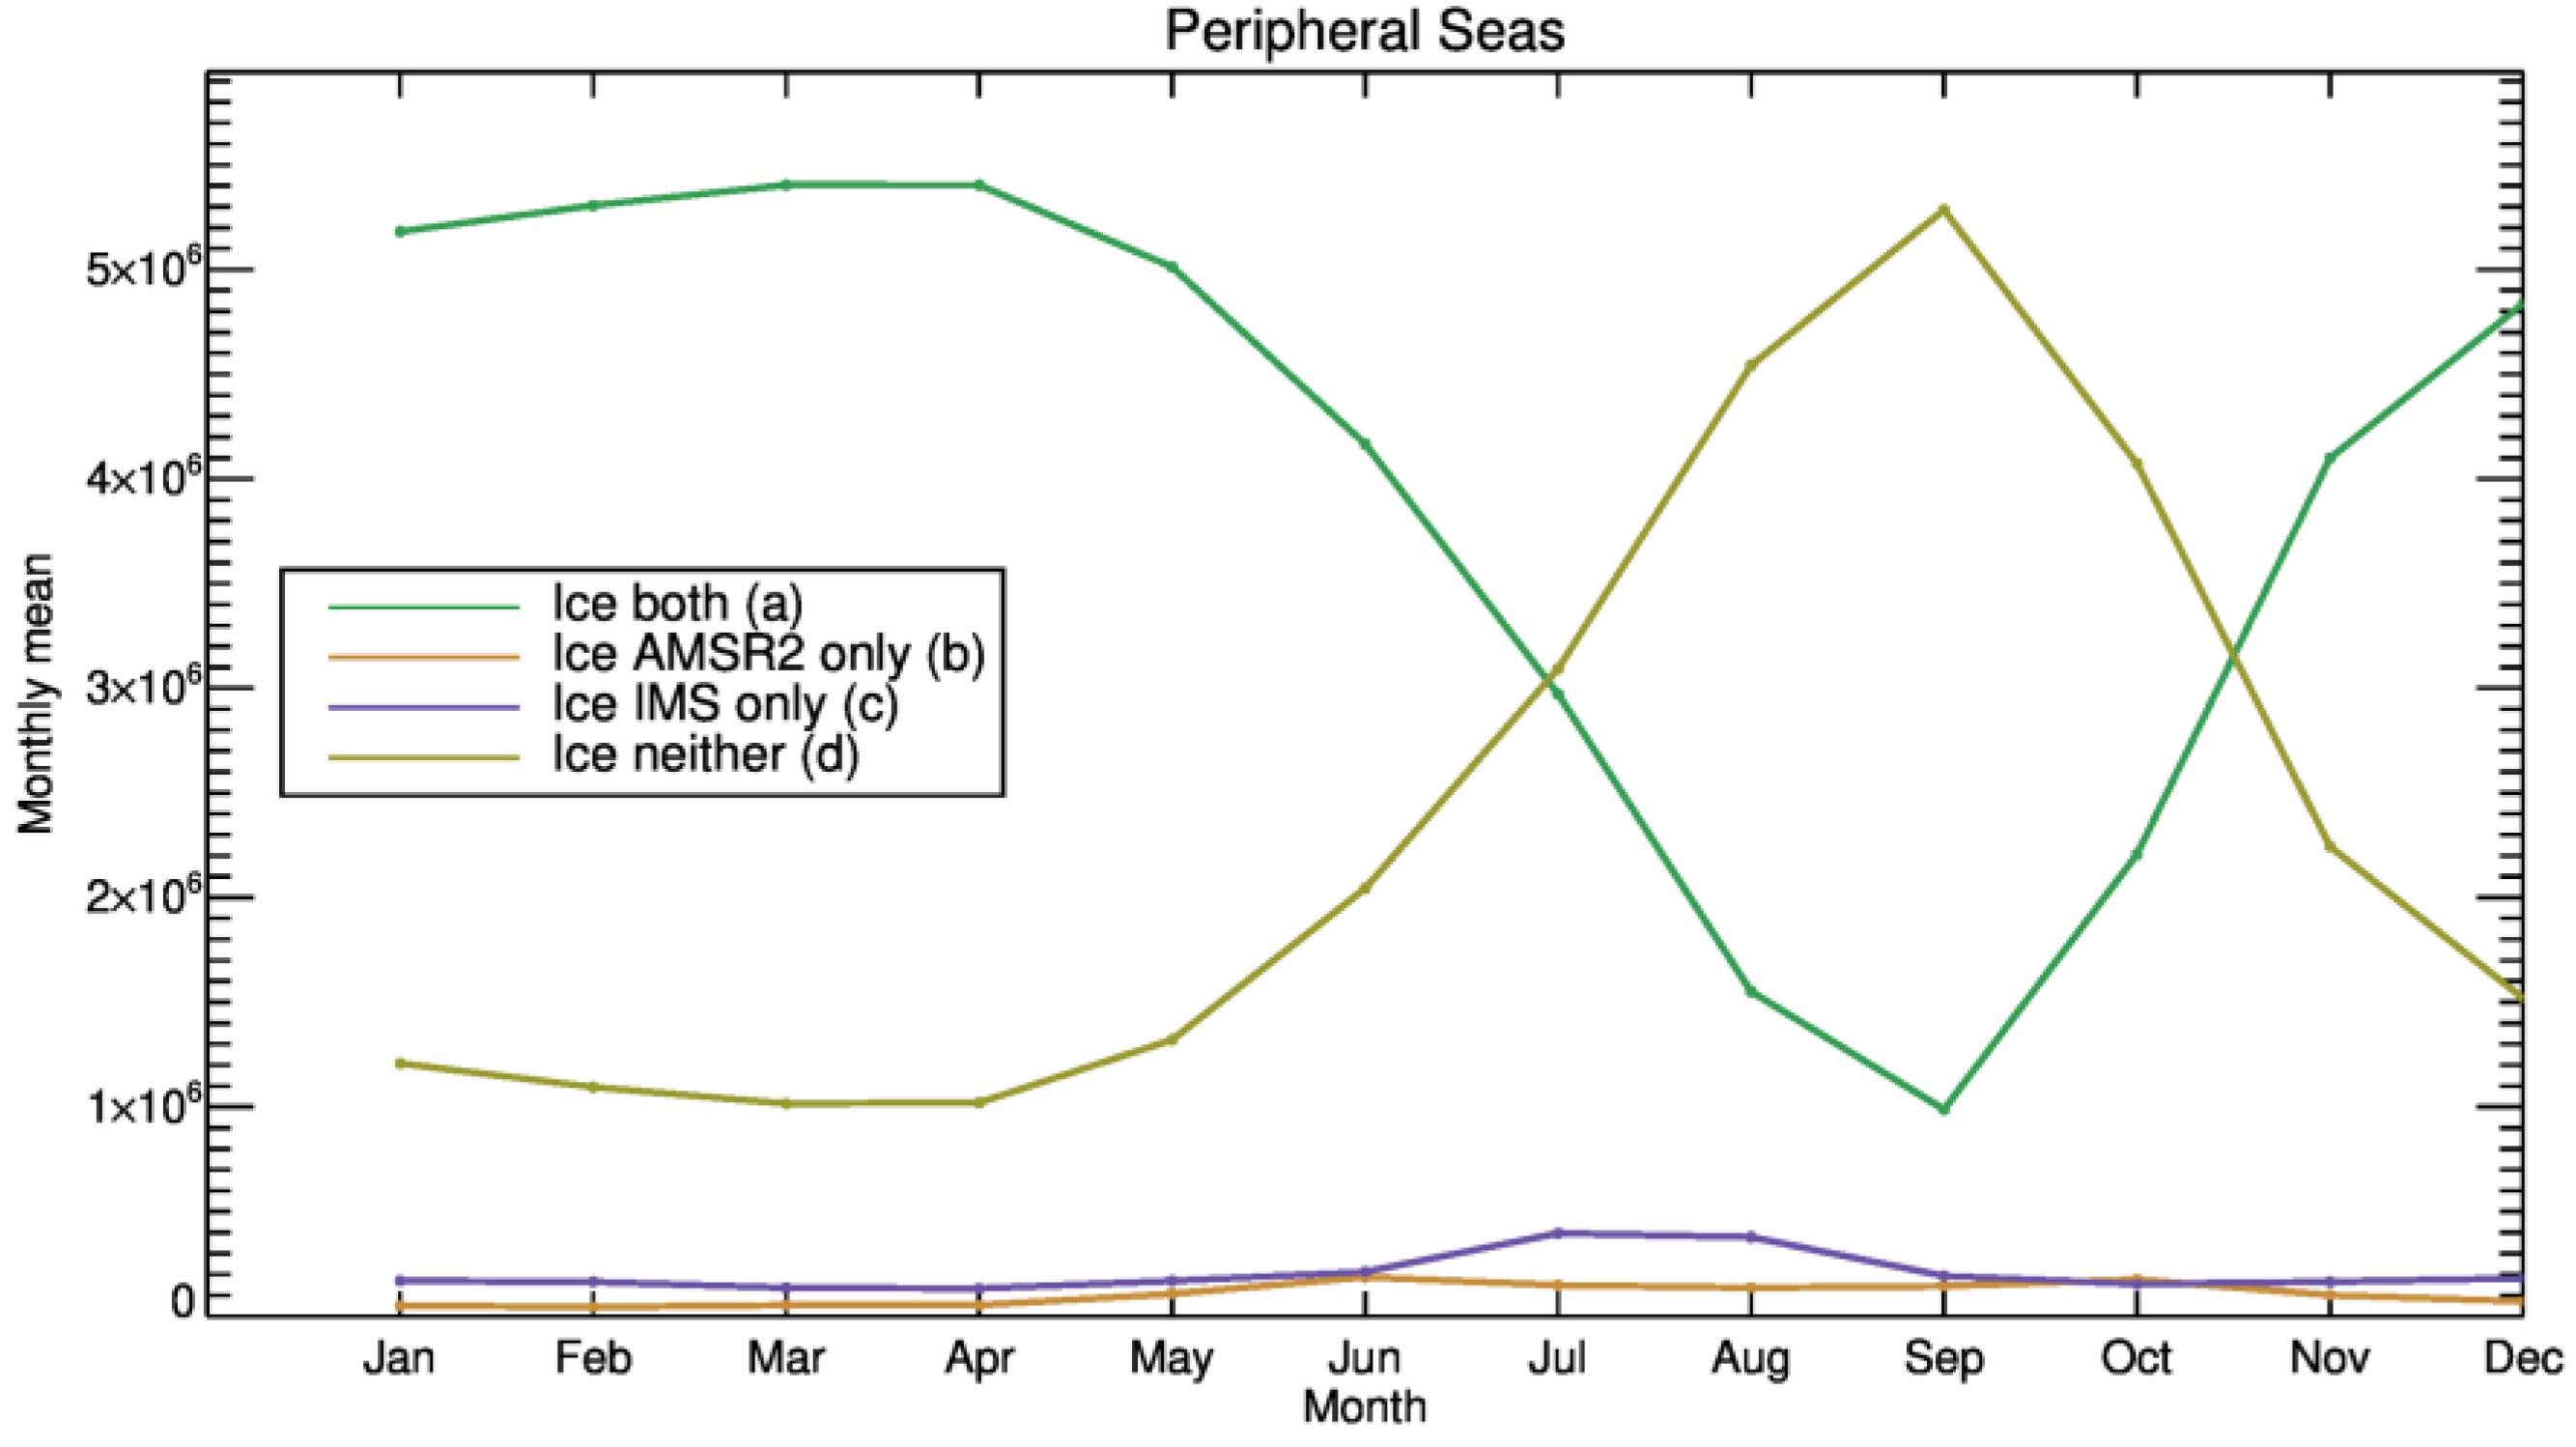
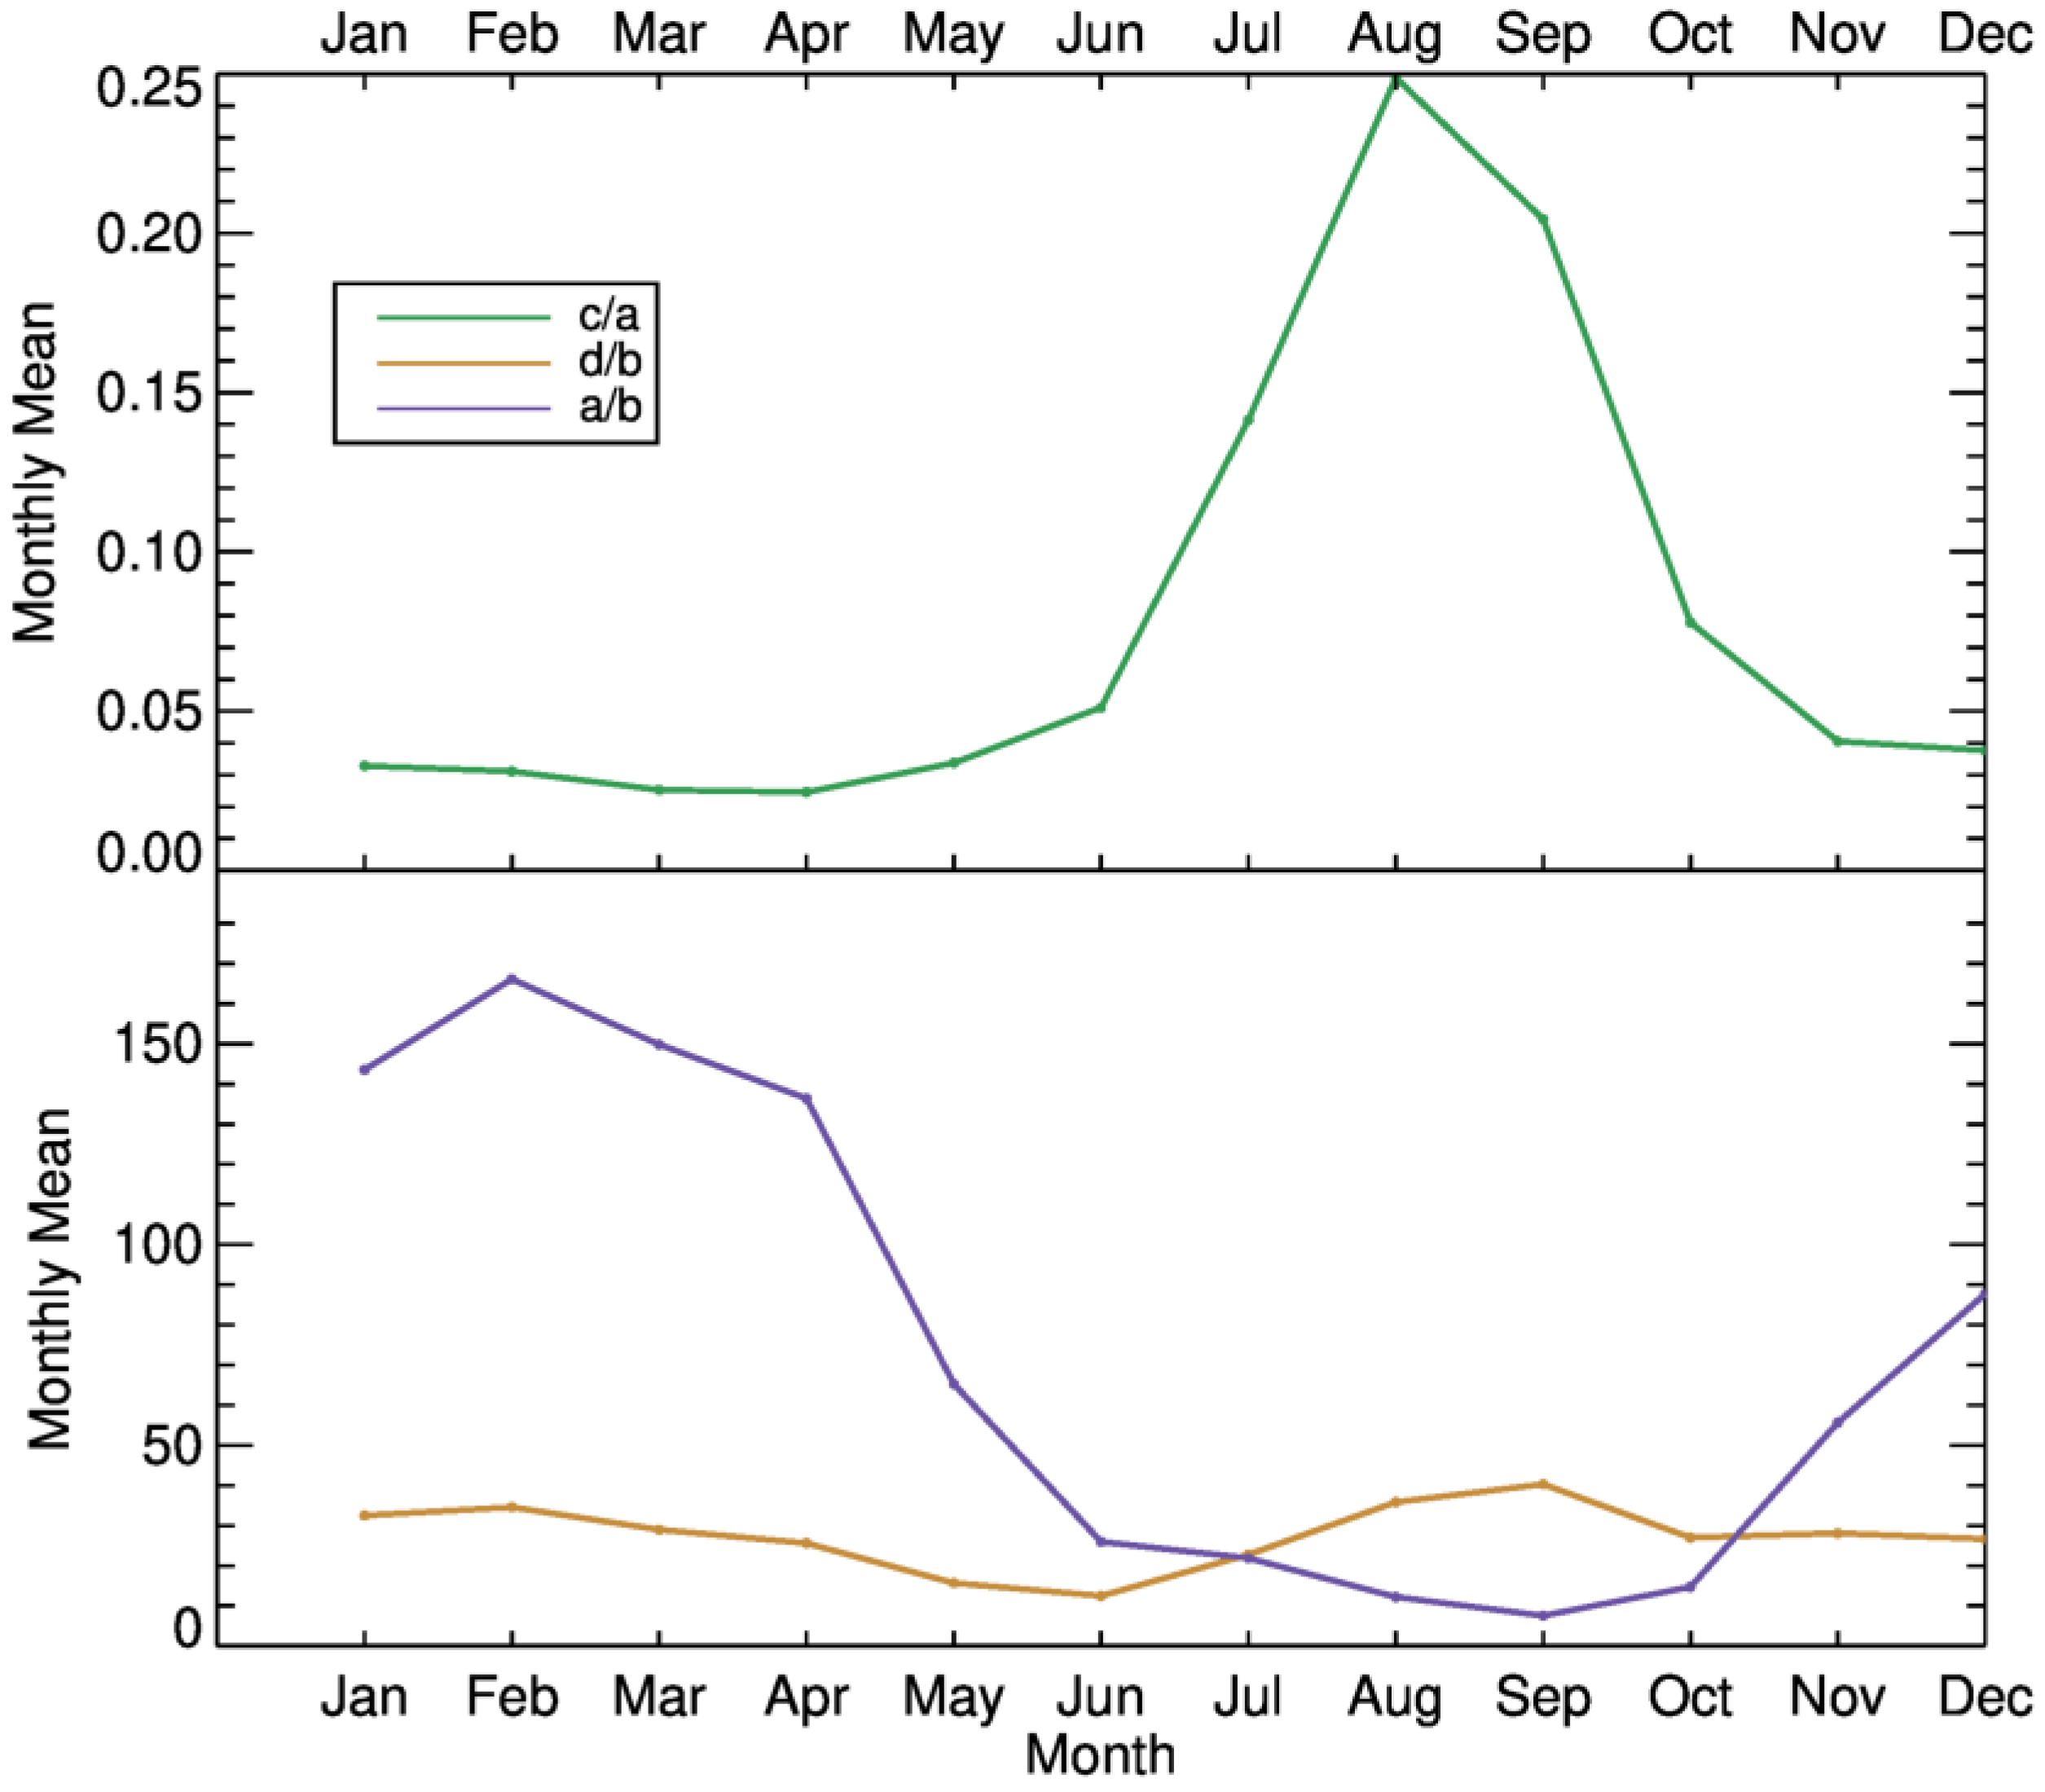
To understand the monthly evolution of the four skill parameters, we studied the monthly evolution of the four variables in the contingency table used to calculate the four skill parameters, as shown in Figure 8. The monthly mean shown here is the mean of monthly means from 2015 to 2019. The number of cases in which both AMSR2 and IMS are identified as ice over the peripheral seas (‘a’ in the contingency table) remain relatively constant from January to April, start to decrease from May, reach the minimum in September, and then increase. This trend follows the trend of overall sea ice extent changes throughout the year. When there is less sea ice, both AMSR2 and IMS identifies less sea ice, though their ice identifications are not exactly the same. Cases in which AMSR2 identifies ice while IMS identifies water (‘b’ in the contingency table) are very few from December to April, and constant but slightly higher from May to November. The cases in which AMSR2 identifies water and IMS identifies ice (‘c’ in the contingency table) remain relatively constant throughout the year, but are greater in number in July and August. The cases in which both AMSR2 and IMS identify water (‘d’ in the contingency table) remain relatively constant from January to April, start to increase from May, reach the maximum in September, and then decrease, which is the opposite trend of ‘a’ (Figure 8). The consequent values of ‘c/a’ are much higher in July, August, and September due to the smaller ‘a’. ‘a/b’ has its minima from June to October and maxima from January to April. ‘d/b’ is relatively constant throughout the year (Figure 9). These trends correspond to the lower HITs from July to September, elevated FARatio from June to October, and relatively constant FARate throughout the year (Figure 6 and Figure 7). Values of ‘c’ are higher than ‘b’ throughout the year except in October. Their differences are equal to the differences of overall ice extent estimated from IMS and AMSR2. Thus, IMS overall ice extents are higher in every month except October, and the differences are maximal in July and August.
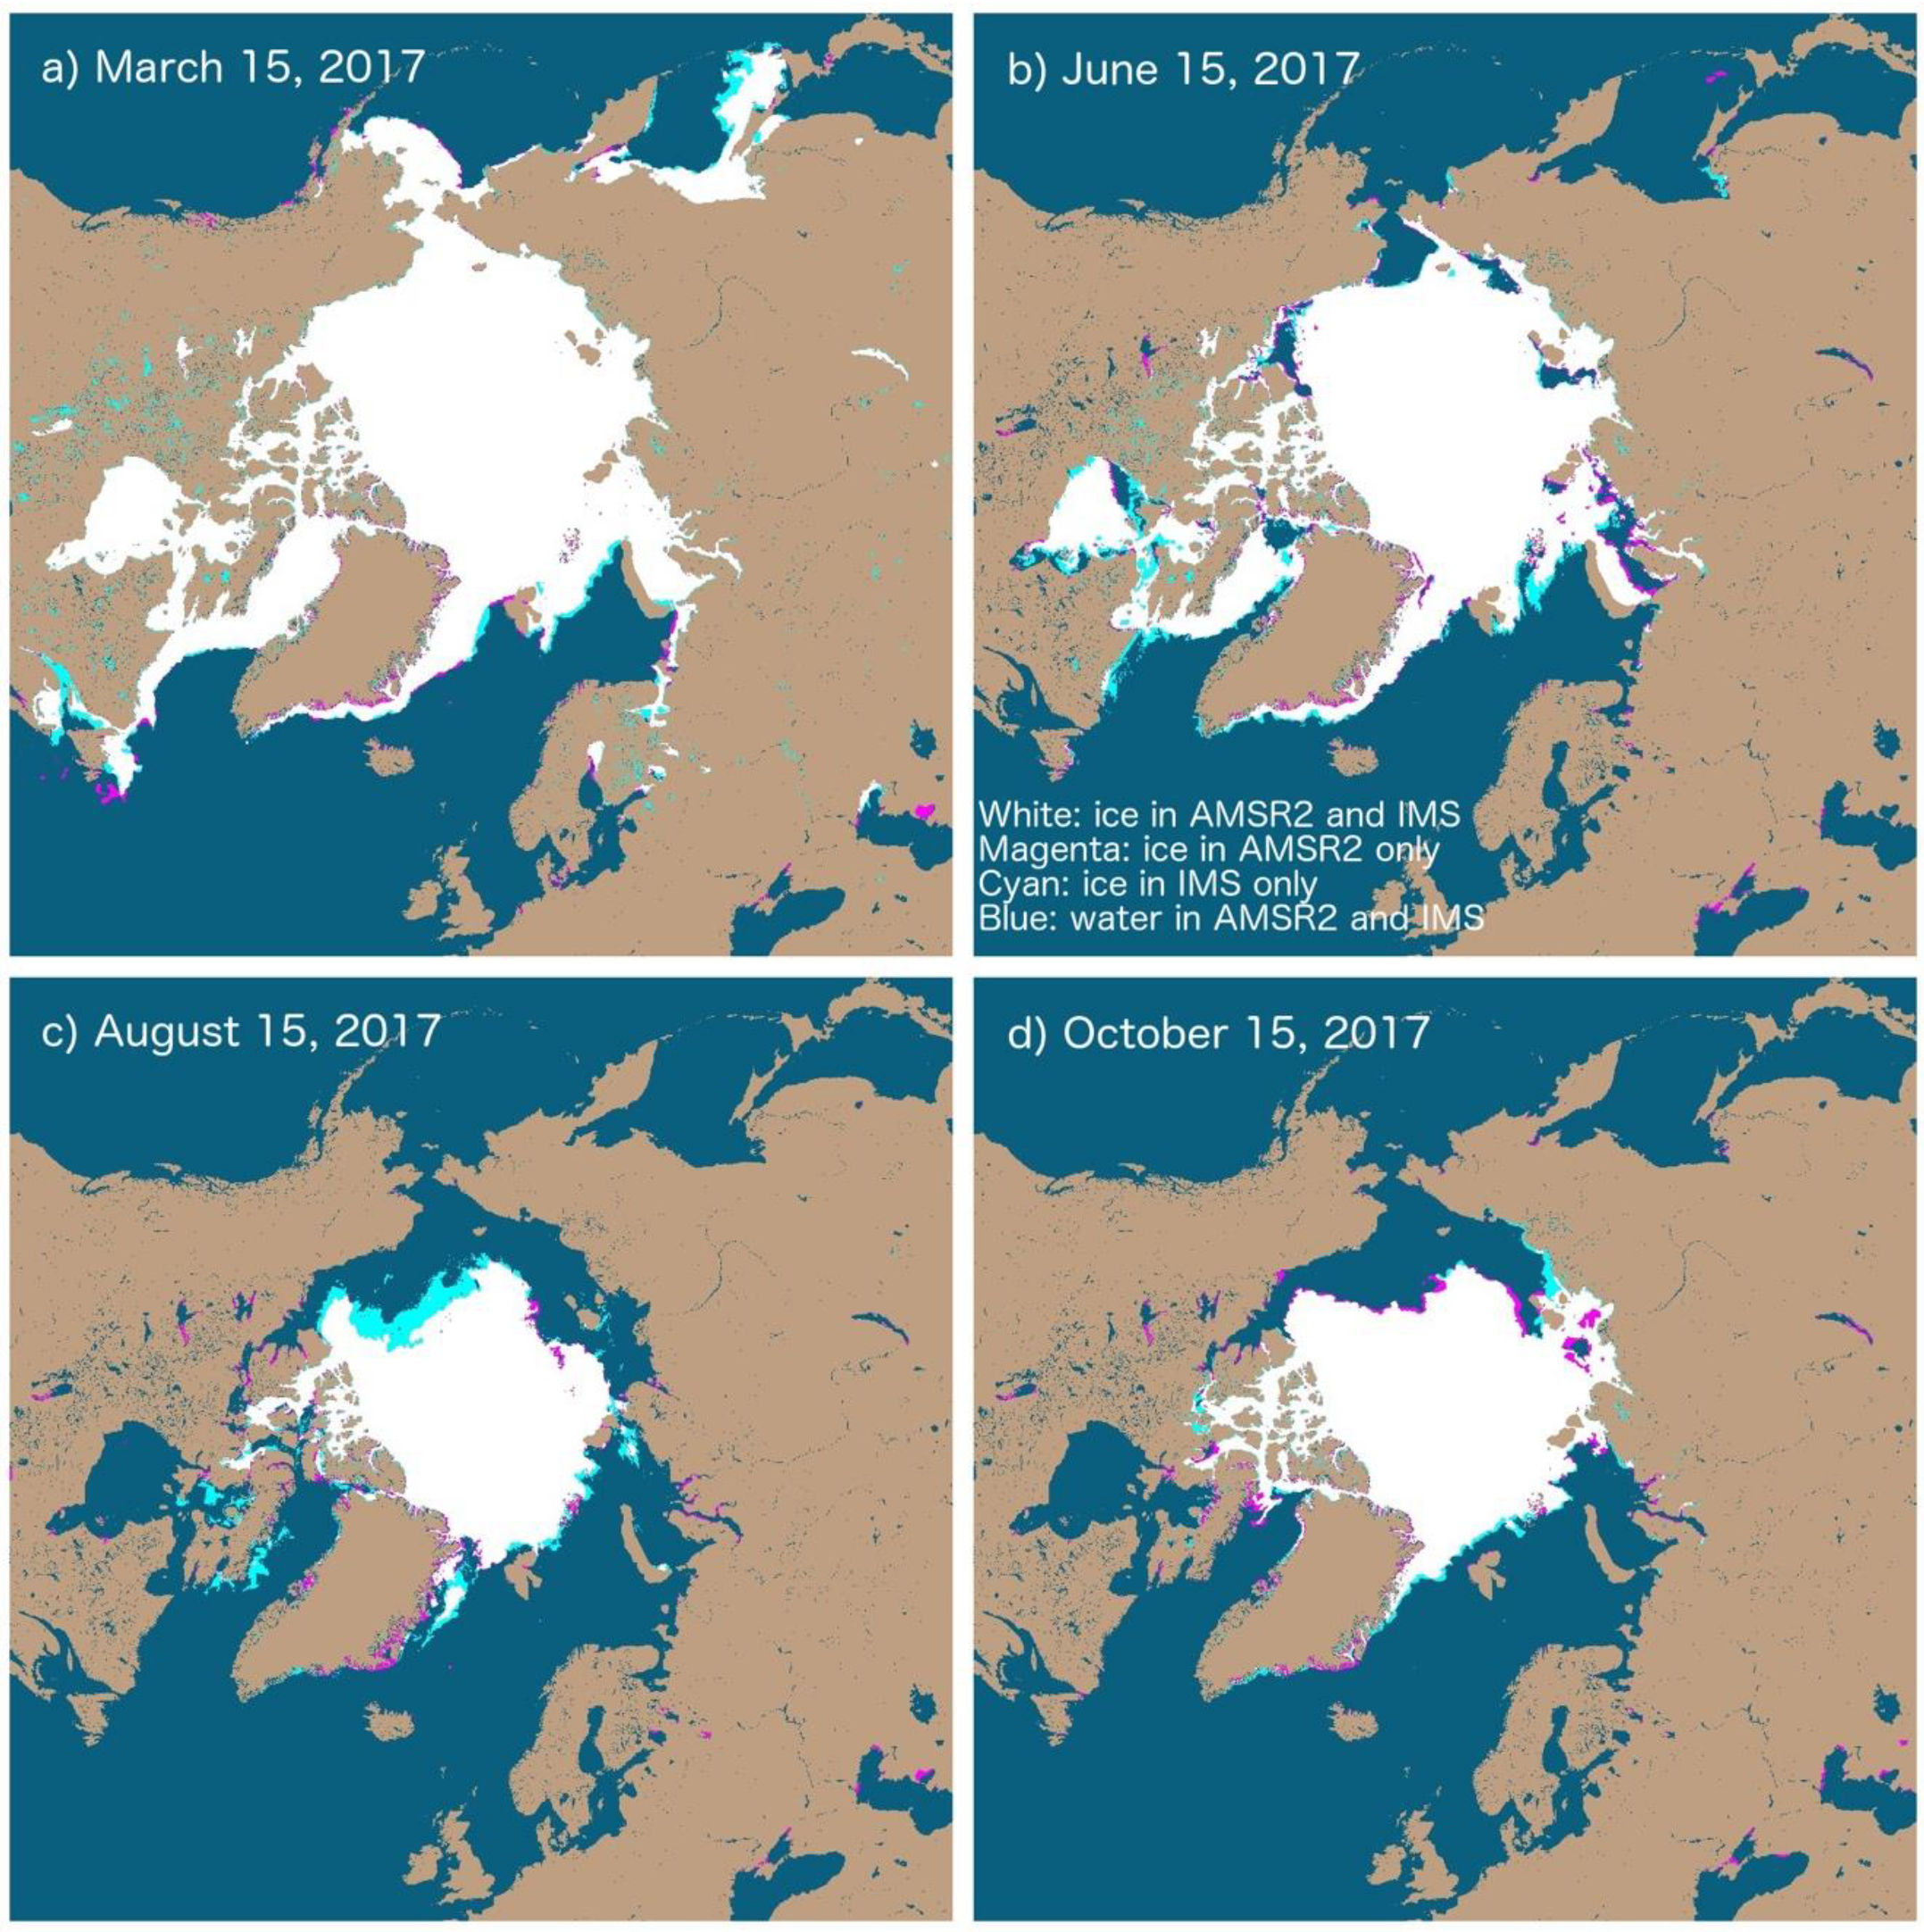
To further help understand the monthly evolution of the four variables in the contingency table and relate them to the spatial distribution of the ice extent of AMSR2 and IMS, the differences of ice cover from AMSR2 and IMS on four days of 2017, which are representative of the typical annual cycle, are shown in Figure 10. On March 15, most of the Arctic Ocean is ice covered, and a small area in the Atlantic side of the Arctic comprises open water in both AMSR2 and IMS, which is reflected in the maximum ‘a’ values, minimum ‘d’ values, and very small values of ‘b’ and ‘c’ from December to April over the Arctic Ocean and over its peripheral seas (Figure 8). On June 15, some ice in the peripheral seas melts and becomes open water in both AMSR2 and IMS, which is reflected on the decreasing ‘a’ value and increasing ‘d’ value in Figure 8. On August 15, the ice cover reaches close to its minimum extent, with maximum open water over the Arctic Ocean in both AMSR2 and IMS, which is consistent with the minimum ‘a’ value and the maximum ‘d’ value, with ‘d’ value higher than ‘a’ value. The area that AMSR2 identifies as water but IMS identifies as ice, i.e., near the ice edge in the Chukchi and Beaufort Seas, also reaches its maximum. Thus, ‘c’ values are at their maxima in July and August. On 15 October, the Arctic sea ice starts to freeze after the minimum coverage in September in both AMSR2 and IMS, which can be seen in increasing ‘a’ values and decreasing ‘d’ values. While some pixels near the ice edge identified by IMS as ice are still identified as water by AMSR2 as in other months, an increasing numbers of pixels near the ice edge identified by AMSR2 as ice are identified as water by IMS, e.g., in the Chukchi and East Siberia Seas.

3.2. Ice Edge

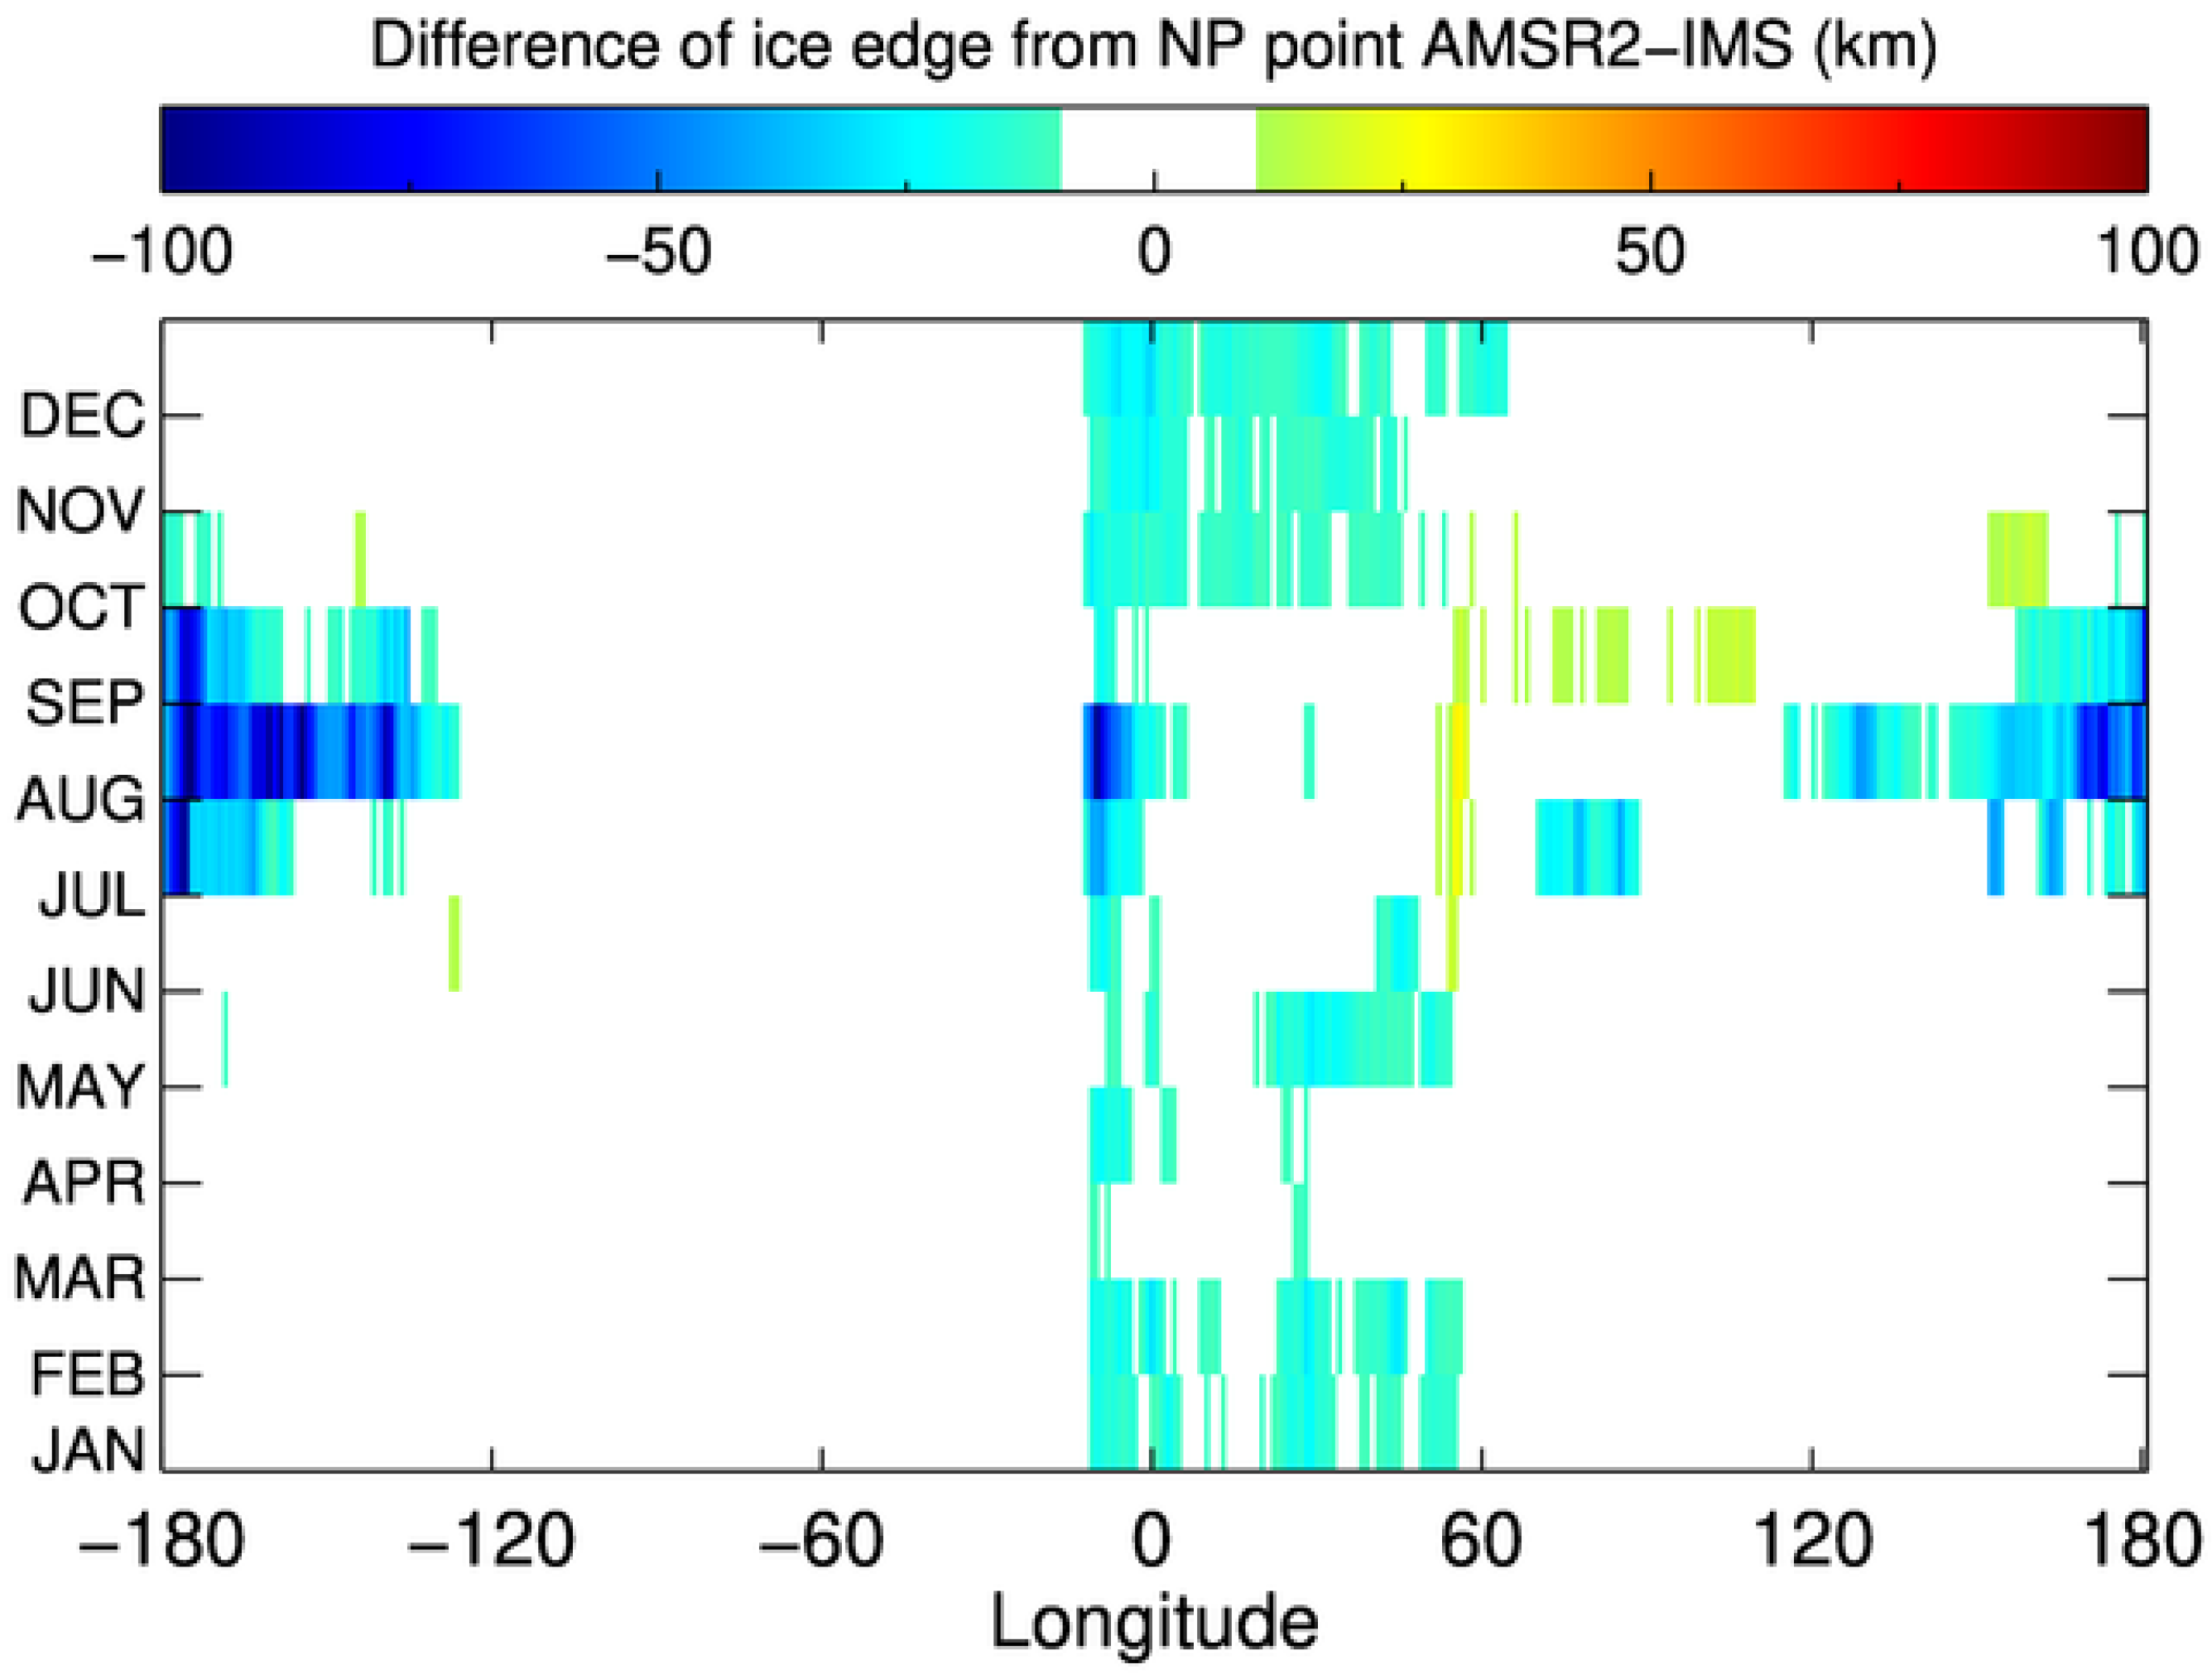
Comparisons of ice extents from IMS and AMSR2 show that the former extends further south than the latter. The ice edge determined using the approach illustrated in Figure 3 quantifies the differences of ice edges from IMS and AMSR2 in all months. Differences of monthly median ice edges from the AMSR2 and IMS ice extents are often less than 10 km, as shown in Figure 11, which is the spatial resolution of the AMSR2 ice concentration product. Apparent negative differences appear at two longitudinal intervals throughout the year, as shown in Figure 11. The first interval, 0 to 60 degree longitude (GIN Seas and Barents Sea), occurs throughout the year, but is typically relatively small, with most differences <50 km. This sector has an ‘open’ ice edge, meaning that the ice does not reach the coastline throughout the year. The second interval encompasses the Beaufort and Chukchi Seas (150° to 180° and −180° to −120° E longitude) from July to September, with absolute differences of around 100 km at times (Figure 11).
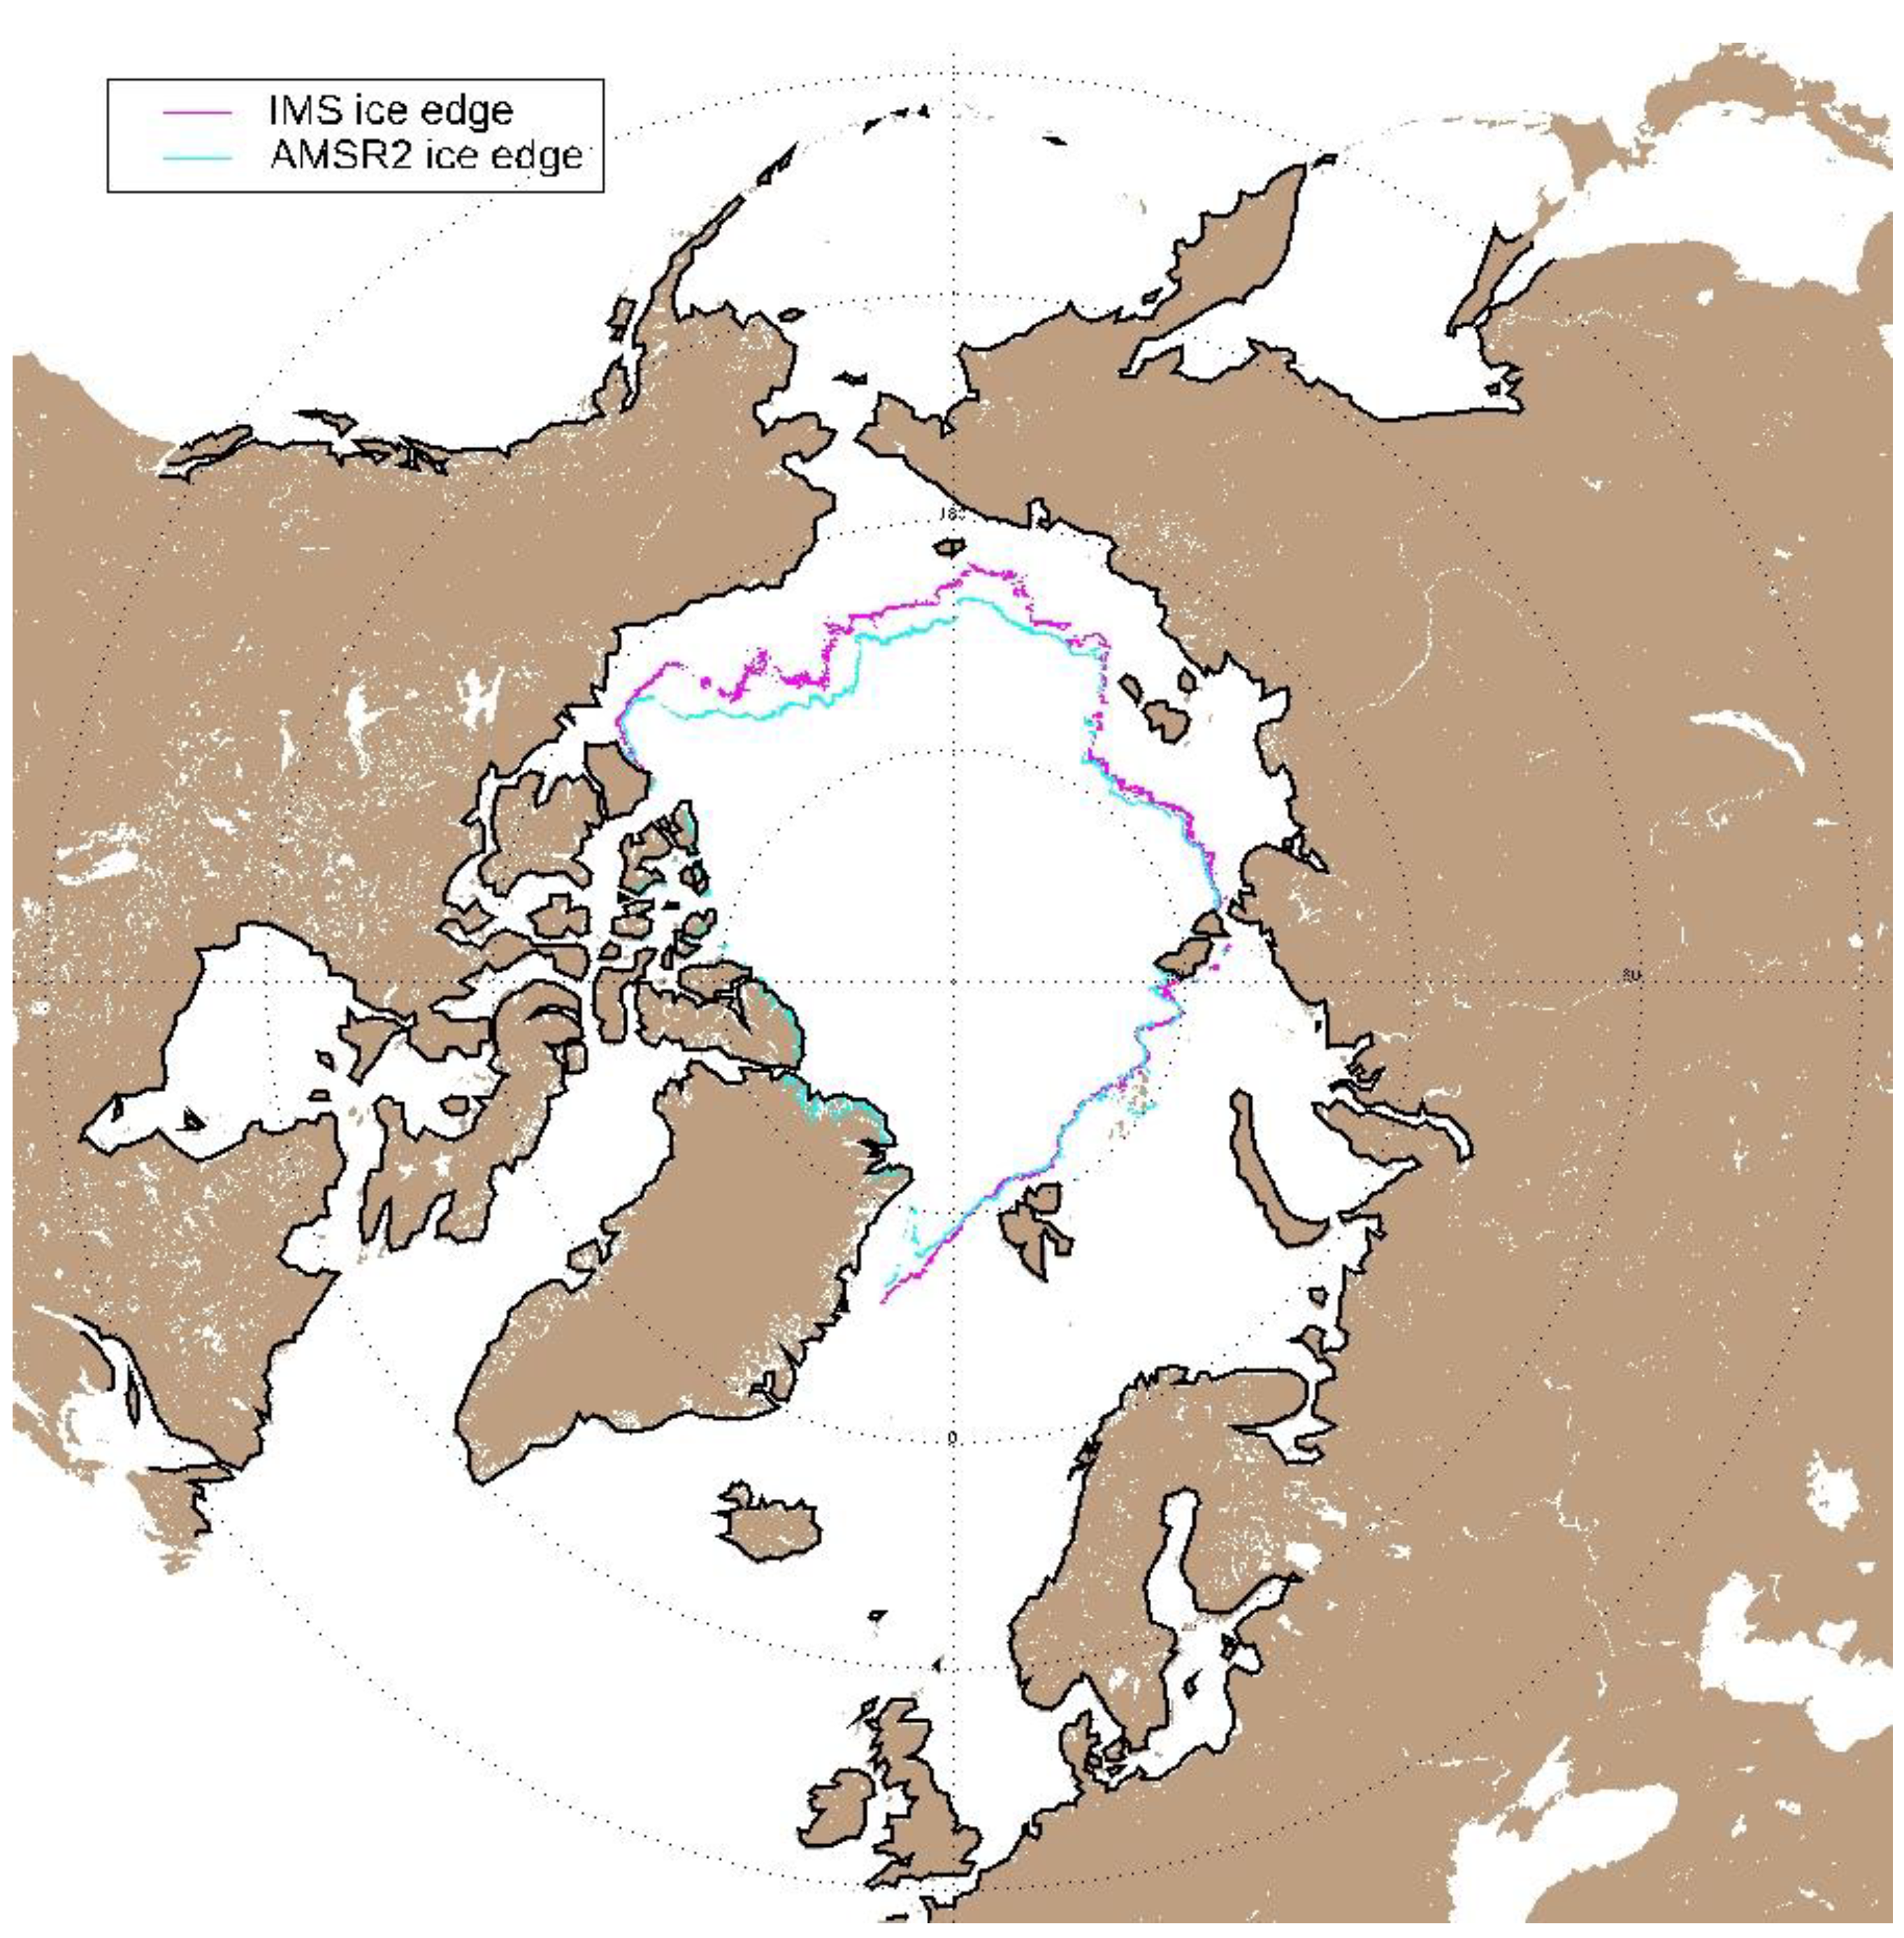
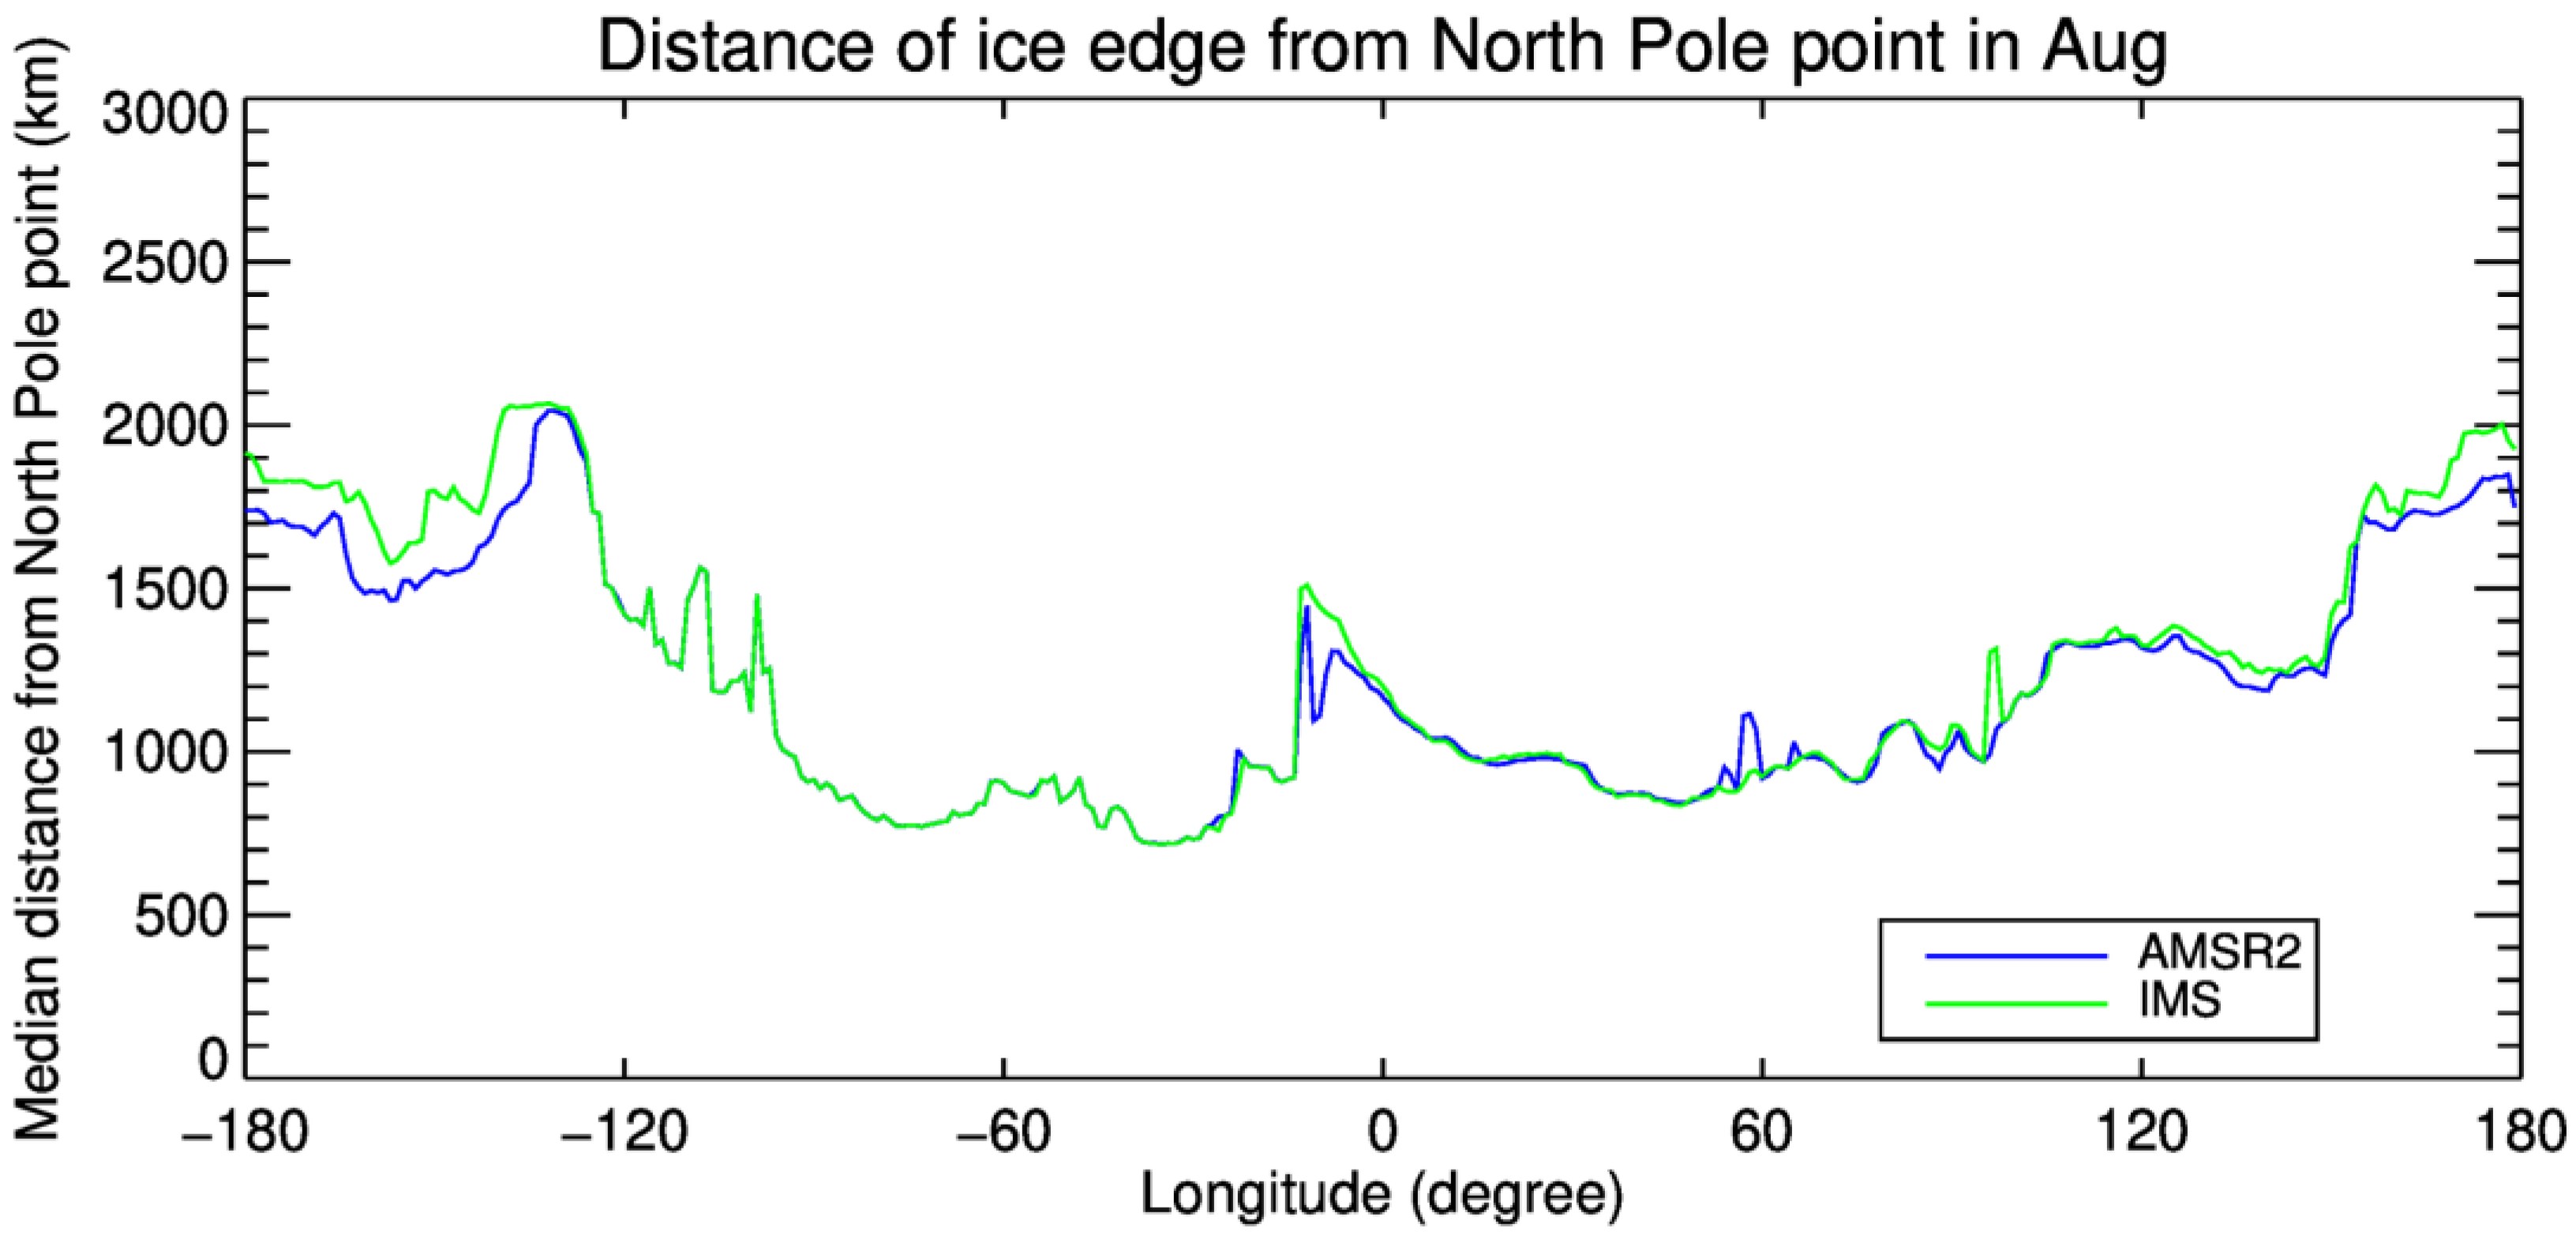
The largest magnitude differences appear in August over the Beaufort, Chukchi, and East Siberia Seas; the longitudinal distributions of the differences can be seen in Figure 12 and Figure 13. This is around the peak of the melt season, when the ice cover in this region may be heavily decayed with surface water, which is often misclassified as open water by passive microwave algorithms. Figure 11 also shows many areas with little or no difference between the AMSR2 and IMS ice edges; in many cases, e.g., the Beaufort Sea during winter and early spring, this is due to the ice reaching the coast, so there is an invariant edge location for both sources.

4. Discussion and Conclusions

In this study, the daily AMSR2 ice extent (based on a 15% concentration threshold) was assessed with IMS ice extent from July 2015 to July 2019. Four statistical scores on a daily basis, their monthly means, and annual cycles were calculated and shown. Subsequently, ice edges from the AMSR2 ice extent were compared to those from the IMS ice extent. Many algorithms are available to estimate the passive microwave ice concentrations, each with its respective strengths and weaknesses. In this study, the enhanced NASA Team (or NASA Team 2) algorithm was used. The IMS ice extent is based on human analysis of many near-real-time datasets, and thus, may provide more comprehensive ice extent data compared to the considered individual datasets, including the passive microwave ice concentration and derived ice extent.
As a result of the annual cycles of the variables in the contingency table, four statistical scores of AMSR2 over the Arctic Ocean and its peripheral seas in the Arctic Ocean have distinct annual and spatial cycles. The hit rates were above 0.93 (0.95) from October to June, with minima from late July to early August of around 0.88 (0.80) over the Arctic Ocean (the Peripheral Seas of the Arctic Ocean). The false alarm ratios remained very low throughout the year, but elevated values were observed from August to October, with the maximum in September. The false alarm rates were consistently low in all months of the year. The Hanssen and Kuiper’s Skill Score were above 0.90 (0.90) from October to May, with the minimum from late July to early August being around 0.85 (0.78) over the Arctic Ocean (the Peripheral Seas of the Arctic Ocean). The four statistical scores over the peripheral seas of the Arctic Ocean had larger magnitudes than those over the Arctic Ocean. The IMS ice edge often extends further south compared to AMSR2. In August, the IMS ice edge extends around 100 km further south over the Beaufort, Chukchi, and East Siberia Seas.
These findings indicate good overall performance of AMSR2 ice extent estimates. The AMSR2 ice extent can be a reliable source to determine the surface type satellite retrieval of cloud properties, radiation flux and other parameters, and to study the long-term trends of sea ice when combined with other passive microwave sea ice products. In the melt season, uncertainties of the ASMR2 ice extent and derived ice edge can be higher, especially near the ice edge, which may have a nonnegligible impact on the study of ocean-sea–ice-atmosphere interactions and the marginal ice zone. Quantitative assessments of these impacts need further investigation.
The areas that AMSR2 identifies as water but IMS identifies as ice are mainly near the ice edge, and this can be attributed to the limited ability of passive microwaves to detect thin ice near the ice edge [25]. This is more prominent in the July and August, when the sea ice undergoes strong surface melt (Figure 10), and this is particularly notable near the ice edge in the Chukchi and Beaufort Seas [25]. A notable example of this was provided in [25], where AMSR2 extent dropped quickly after the passage of a strong storm in early August, but IMS showed a much slower decline. These areas coincide with the areas with the largest observed changes in ice cover within the last two decades [5]; These regions have transitioned from being mostly multiyear ice to mostly first-year ice [33], which is now thinner and more likely to be heavily decayed, with many small, broken floes. Surface water may also be present on many floes due either to melt or flooding by wave action. The extent of this type of ice is often underestimated by passive microwave imagery because the small floes and surface water may be interpreted by the algorithms as <15% ice concentration. In contrast, IMS analysts can often detect such ice in visible imagery or high-resolution SAR data. The general negative differences in ice edges from AMSR2 and IMS can be attributed to this identification difference.
The areas that AMSR2 identifies as ice but IMS identifies as water are mostly in shoreline areas and in narrow water bodies (Figure 10), which is likely due to land contamination in the AMSR2 field of view of mixed land-water areas. Thus, the open water can be interpreted by the algorithm as sea ice. This sometimes happens over new openings, possibly due to melting; Meier et al. [25] attributed this to the fact that the lower spatial resolution of the passive microwave data cannot capture smaller-scale openings. Even with the improved spatial resolution of AMSR2 at 10 km compared to that of AMSR-E at 12.5 km, the relatively low spatial resolution (compared to IMS sources) still results in the misidentification of some open water openings as ice. Another possible cause of this difference is the lack of visible information regarding the ice edge due to continuous cloud cover; this may cause the IMS analysis to be conservative regarding the expansion of the ice. We would also argue that even with visible information, this type of new ice without snow cover is difficult to detect due to its similarity to open water; thus, it may be misinterpreted by IMS. Finally, there may be a difference due to the imagery used in the observation time interval. The AMSR2 or scatterometer ice products available for IMS might be 18–36 h old compared to the daily values from AMSR2. The IMS has to generate the product by 23:12Z with only the data available. When ice is undergoing rapid growth, the IMS may not have the benefit of the overpasses that the AMSR2 would include.
This study only assesses the ice extent and ice edge from AMSR2 using the NASA Team 2 algorithm. There are many algorithms available for ice concentration retrievals, and each has its weaknesses and strengths [11]. Similar assessments could be performed using other products. Satellite retrievals of cloud properties, radiation flux and many other physical parameters, navigation, studies of ocean-sea ice-atmosphere interactions and their changes, and research on the marginal ice zone all depend on accurate surface types. These assessments may assist in determining the appropriate product(s) to be used in different scientific applications.

Author Contributions

Conceptualization, Y.L.; methodology, Y.L., R.D.; formal analysis, Y.L.; writing—original draft preparation, Y.L.; writing—review and editing, Y.L., S.H., W.N.M. and R.D. All authors have read and agreed to the published version of the manuscript.

Funding

This research was funded by NOAA, grant number NA15NES4320001. W.N.M.’s contribution supported by the Cooperative Institute for Research in Environmental Sciences (CIRES) via a grant from NOAA NESDIS, NOAA Award number NA17OAR4320101.

Acknowledgments

This work was supported by the JPSS Program Office and the GOES-R Program Office. The views, opinions, and findings contained in this report are those of the author(s) and should not be construed as an official National Oceanic and Atmospheric Administration or U.S. Government position, policy, or decision. The authors would like to thank the reviewers and editors for their valuable comments.

Conflicts of Interest

The authors declare no conflict of interest.

References

  1. Ackerman, S.; Strabala, K.; Menzel, W.; Frey, R.; Moeller, C.; Gumley, L. Discriminating clear sky from clouds with modis. J. Geophys. Res. Atmos. 1998, 103, 32141–32157. [Google Scholar] [CrossRef]
  2. Minnis, P.; Sun-Mack, S.; Young, D.F.; Heck, P.W.; Garber, D.P.; Chen, Y.; Spangenberg, D.A.; Arduini, R.F.; Trepte, Q.Z.; Smith, W.L. CERES Edition-2 cloud property retrievals using TRMM VIRS and Terra and Aqua MODIS data—Part I: Algorithms. IEEE Trans. Geosci. Remote Sens. 2011, 49, 4374–4400. [Google Scholar] [CrossRef]
  3. Box, J.E.; Colgan, W.T.; Christensen, T.R.; Schmidt, N.M.; Lund, M.; Parmentier, F.-J.W.; Brown, R.; Bhatt, U.S.; Euskirchen, E.S.; Romanovsky, V.E. Key indicators of arctic climate change: 1971–2017. Environ. Res. Lett. 2019, 14, 045010. [Google Scholar] [CrossRef]
  4. Meier, W.N.; Kern, S.; Holland, M.; Tamura, T. Changes in Arctic sea ice extent, concentration and thickness. In Snow, Water, Ice, and Permafrost in the Arctic (SWIPA) 2017; Arctic Monitoring and Assessment Programme (AMAP): Oslo, Norway, 2017; pp. 105–111. [Google Scholar]
  5. Maslanik, J.; Stroeve, J.; Fowler, C.; Emery, W. Distribution and trends in arctic sea ice age through spring 2011. Geophys. Res. Lett. 2011, 38. [Google Scholar] [CrossRef]
  6. Serreze, M.C.; Meier, W.N. The arctic’s sea ice cover: Trends, variability, predictability, and comparisons to the Antarctic. Ann. N. Y. Acad. Sci. 2019, 1436, 36–53. [Google Scholar] [CrossRef] [PubMed]
  7. Stroeve, J.C.; Jenouvrier, S.; Campbell, G.G.; Barbraud, C.; Delord, K. Mapping and assessing variability in the Antarctic marginal ice zone, pack ice and coastal polynyas in two sea ice algorithms with implications on breeding success of snow petrels. Cryosphere 2016, 10, 1823–1843. [Google Scholar] [CrossRef] [Green Version]
  8. Stroeve, J.C.; Kattsov, V.; Barrett, A.; Serreze, M.; Pavlova, T.; Holland, M.; Meier, W.N. Trends in arctic sea ice extent from CMIP5, CMIP3 and observations. Geophys. Res. Lett. 2012, 39. [Google Scholar] [CrossRef] [Green Version]
  9. Overland, J.E.; Wang, M. When will the summer arctic be nearly sea ice free? Geophys. Res. Lett. 2013, 40, 2097–2101. [Google Scholar] [CrossRef]
  10. Strong, C.; Foster, D.; Cherkaev, E.; Eisenman, I.; Golden, K.M. On the definition of marginal ice zone width. J. Atmos. Ocean. Technol. 2017, 34, 1565–1584. [Google Scholar] [CrossRef]
  11. Ivanova, N.; Pedersen, L.T.; Tonboe, R.T.; Kern, S.; Heygster, G.; Lavergne, T.; Sørensen, A.; Saldo, R.; Dybkjær, G.; Brucker, L. Inter-comparison and evaluation of sea ice algorithms: Towards further identification of challenges and optimal approach using passive microwave observations. Cryosphere 2015, 9, 1797–1817. [Google Scholar] [CrossRef] [Green Version]
  12. Peng, G.; Meier, W.N.; Scott, D.J.; Savoie, M.H. A long-term and reproducible passive microwave sea ice concentration data record for climate studies and monitoring. Earth Syst. Sci. Data 2013, 5, 311–318. [Google Scholar] [CrossRef] [Green Version]
  13. Meier, W.N.; Fetterer, F.; Savoie, M.; Mallory, S.; Duerr, R.; Stroeve, J. NOAA/NSIDC Climate Data Record of Passive Microwave Sea Ice Concentration, Version 3; NSIDC: National Snow and Ice Data Center: Boulder, CO, USA, 2017. [Google Scholar]
  14. Ivanova, N.; Johannessen, O.M.; Pedersen, L.T.; Tonboe, R.T. Retrieval of arctic sea ice parameters by satellite passive microwave sensors: A comparison of eleven sea ice concentration algorithms. Geosci. Remote Sens. IEEE Trans. 2014, 52, 7233–7246. [Google Scholar] [CrossRef]
  15. Cavalieri, D.J.; Parkinson, C.L.; Gloersen, P.; Comiso, J.C.; Zwally, H.J. Deriving long-term time series of sea ice cover from satellite passive-microwave multisensor data sets. J. Geophys. Res. Ocean. 1999, 104, 15803–15814. [Google Scholar] [CrossRef]
  16. Markus, T.; Cavalieri, D.J. An enhancement of the NASA team sea ice algorithm. IEEE Trans. Geosci. Remote Sens. 2000, 38, 1387–1398. [Google Scholar] [CrossRef] [Green Version]
  17. Comiso, J.C.; Cavalieri, D.J.; Parkinson, C.L.; Gloersen, P. Passive microwave algorithms for sea ice concentration: A comparison of two techniques. Remote Sens. Environ. 1997, 60, 357–384. [Google Scholar] [CrossRef]
  18. Kaleschke, L.; Lüpkes, C.; Vihma, T.; Haarpaintner, J.; Bochert, A.; Hartmann, J.; Heygster, G. SSM/I sea ice remote sensing for mesoscale ocean-atmosphere interaction analysis. Can. J. Remote Sens. 2001, 27, 526–537. [Google Scholar] [CrossRef]
  19. Liu, Y.; Key, J.; Mahoney, R. Sea and freshwater ice concentration from VIIRS on Suomi NPP and the future JPSS satellites. Remote Sens. 2016, 8, 523. [Google Scholar] [CrossRef] [Green Version]
  20. Andersen, S.; Tonboe, R.; Kaleschke, L.; Heygster, G.; Pedersen, L.T. Intercomparison of passive microwave sea ice concentration retrievals over the high-concentration arctic sea ice. J. Geophys. Res. Ocean. 2007, 112. [Google Scholar] [CrossRef]
  21. Kern, S.; Lavergne, T.; Notz, D.; Toudal Pedersen, L.; Tage Tonboe, R.; Saldo, R.; Macdonald Sørensen, A. Satellite passive microwave sea-ice concentration data set intercomparison: Closed ice and ship-based observations. Cryosphere Copernic. Publ. 2019, 13, 3261–3307. [Google Scholar] [CrossRef] [Green Version]
  22. Agnew, T.; Howell, S. The use of operational ice charts for evaluating passive microwave ice concentration data. Atmos. -Ocean 2003, 41, 317–331. [Google Scholar] [CrossRef]
  23. Cavalieri, D.J.; Markus, T.; Hall, D.K.; Gasiewski, A.J.; Klein, M.; Ivanoff, A. Assessment of EOS Aqua AMSR-E Arctic sea ice concentrations using Landsat-7 and airborne microwave imagery. IEEE Trans. Geosci. Remote Sens. 2006, 44, 3057–3069. [Google Scholar] [CrossRef]
  24. Comiso, J.C.; Meier, W.N.; Gersten, R. Variability and trends in the Actic sea ice cover: Results from different techniques. J. Geophys. Res. Ocean. 2017, 122, 6883–6900. [Google Scholar] [CrossRef]
  25. Meier, W.N.; Fetterer, F.; Stewart, J.S.; Helfrich, S. How do sea-ice concentrations from operational data compare with passive microwave estimates? Implications for improved model evaluations and forecasting. Ann. Glaciol. 2015, 56, 332–340. [Google Scholar] [CrossRef] [Green Version]
  26. Fetterer, F.; Knowles, K.; Meier, W.M.; Savoie, M.; Windnagel, A.K. Updated daily. In Sea Ice Index, Version 3; National Snow and Ice Data Center: Boulder, CO, USA, 2017. [Google Scholar] [CrossRef]
  27. Meier, W.N.; Ivanoff, A. Intercalibration of AMSR2 NASA team 2 algorithm sea ice concentrations with AMSR-E slow rotation data. IEEE J. Sel. Top. Appl. Earth Obs. Remote Sens. 2017, 10, 3923–3933. [Google Scholar] [CrossRef]
  28. U.S. National Ice Center. 2008, updated daily. In IMS Daily Northern Hemisphere Snow and Ice Analysis at 1 km, 4 km, and 24 km Resolutions, Version 1; [July 2015–July 2019]; National Snow and Ice Data Center: Boulder, CO, USA, 2015. [Google Scholar] [CrossRef]
  29. Helfrich, S.R.; McNamara, D.; Ramsay, B.H.; Baldwin, T.; Kasheta, T. Enhancements to, and forthcoming developments in the Interactive Multisensor Snow and Ice Mapping System (IMS). Hydrol. Process. Int. J. 2007, 21, 1576–1586. [Google Scholar] [CrossRef]
  30. U.S. National Ice Center; National Snow and Ice Data Center; Fetterer, F.; Savoie, M.; Helfrich, S.; Clemente-Colón, P. Multisensor Analyzed Sea Ice Extent - Northern Hemisphere (MASIE-NH), Version 1; National Snow and Ice Data Center: Boulder, CO, USA, 2010. [CrossRef]
  31. Posey, P.G.; Metzger, E.J.; Wallcraft, A.J.; Hebert, D.A.; Allard, R.A.; Smedstad, O.M.; Phelps, M.W.; Fetterer, F.; Stewart, J.S.; Meier, W.N.; et al. Improving Arctic sea ice edge forecasts by assimilating high horizontal resolution sea ice concentration data into the US Navy’s ice forecast systems. Cryosphere 2015, 9, 1735–1745. [Google Scholar] [CrossRef] [Green Version]
  32. Mahoney, A.R.; Barry, R.G.; Smolyanitsky, V.; Fetterer, F. Observed sea ice extent in the Russian Arctic, 1933–2006. J. Geophys. Res. Ocean. 2008, 113. [Google Scholar] [CrossRef] [Green Version]
  33. Tschudi, M.A.; Meier, W.N.; Stewart, J.S. An enhancement to sea ice motion and age products at the National Snow and Ice Data Center (NSIDC). Cryosphere 2020, 14, 1519–1536. [Google Scholar] [CrossRef]
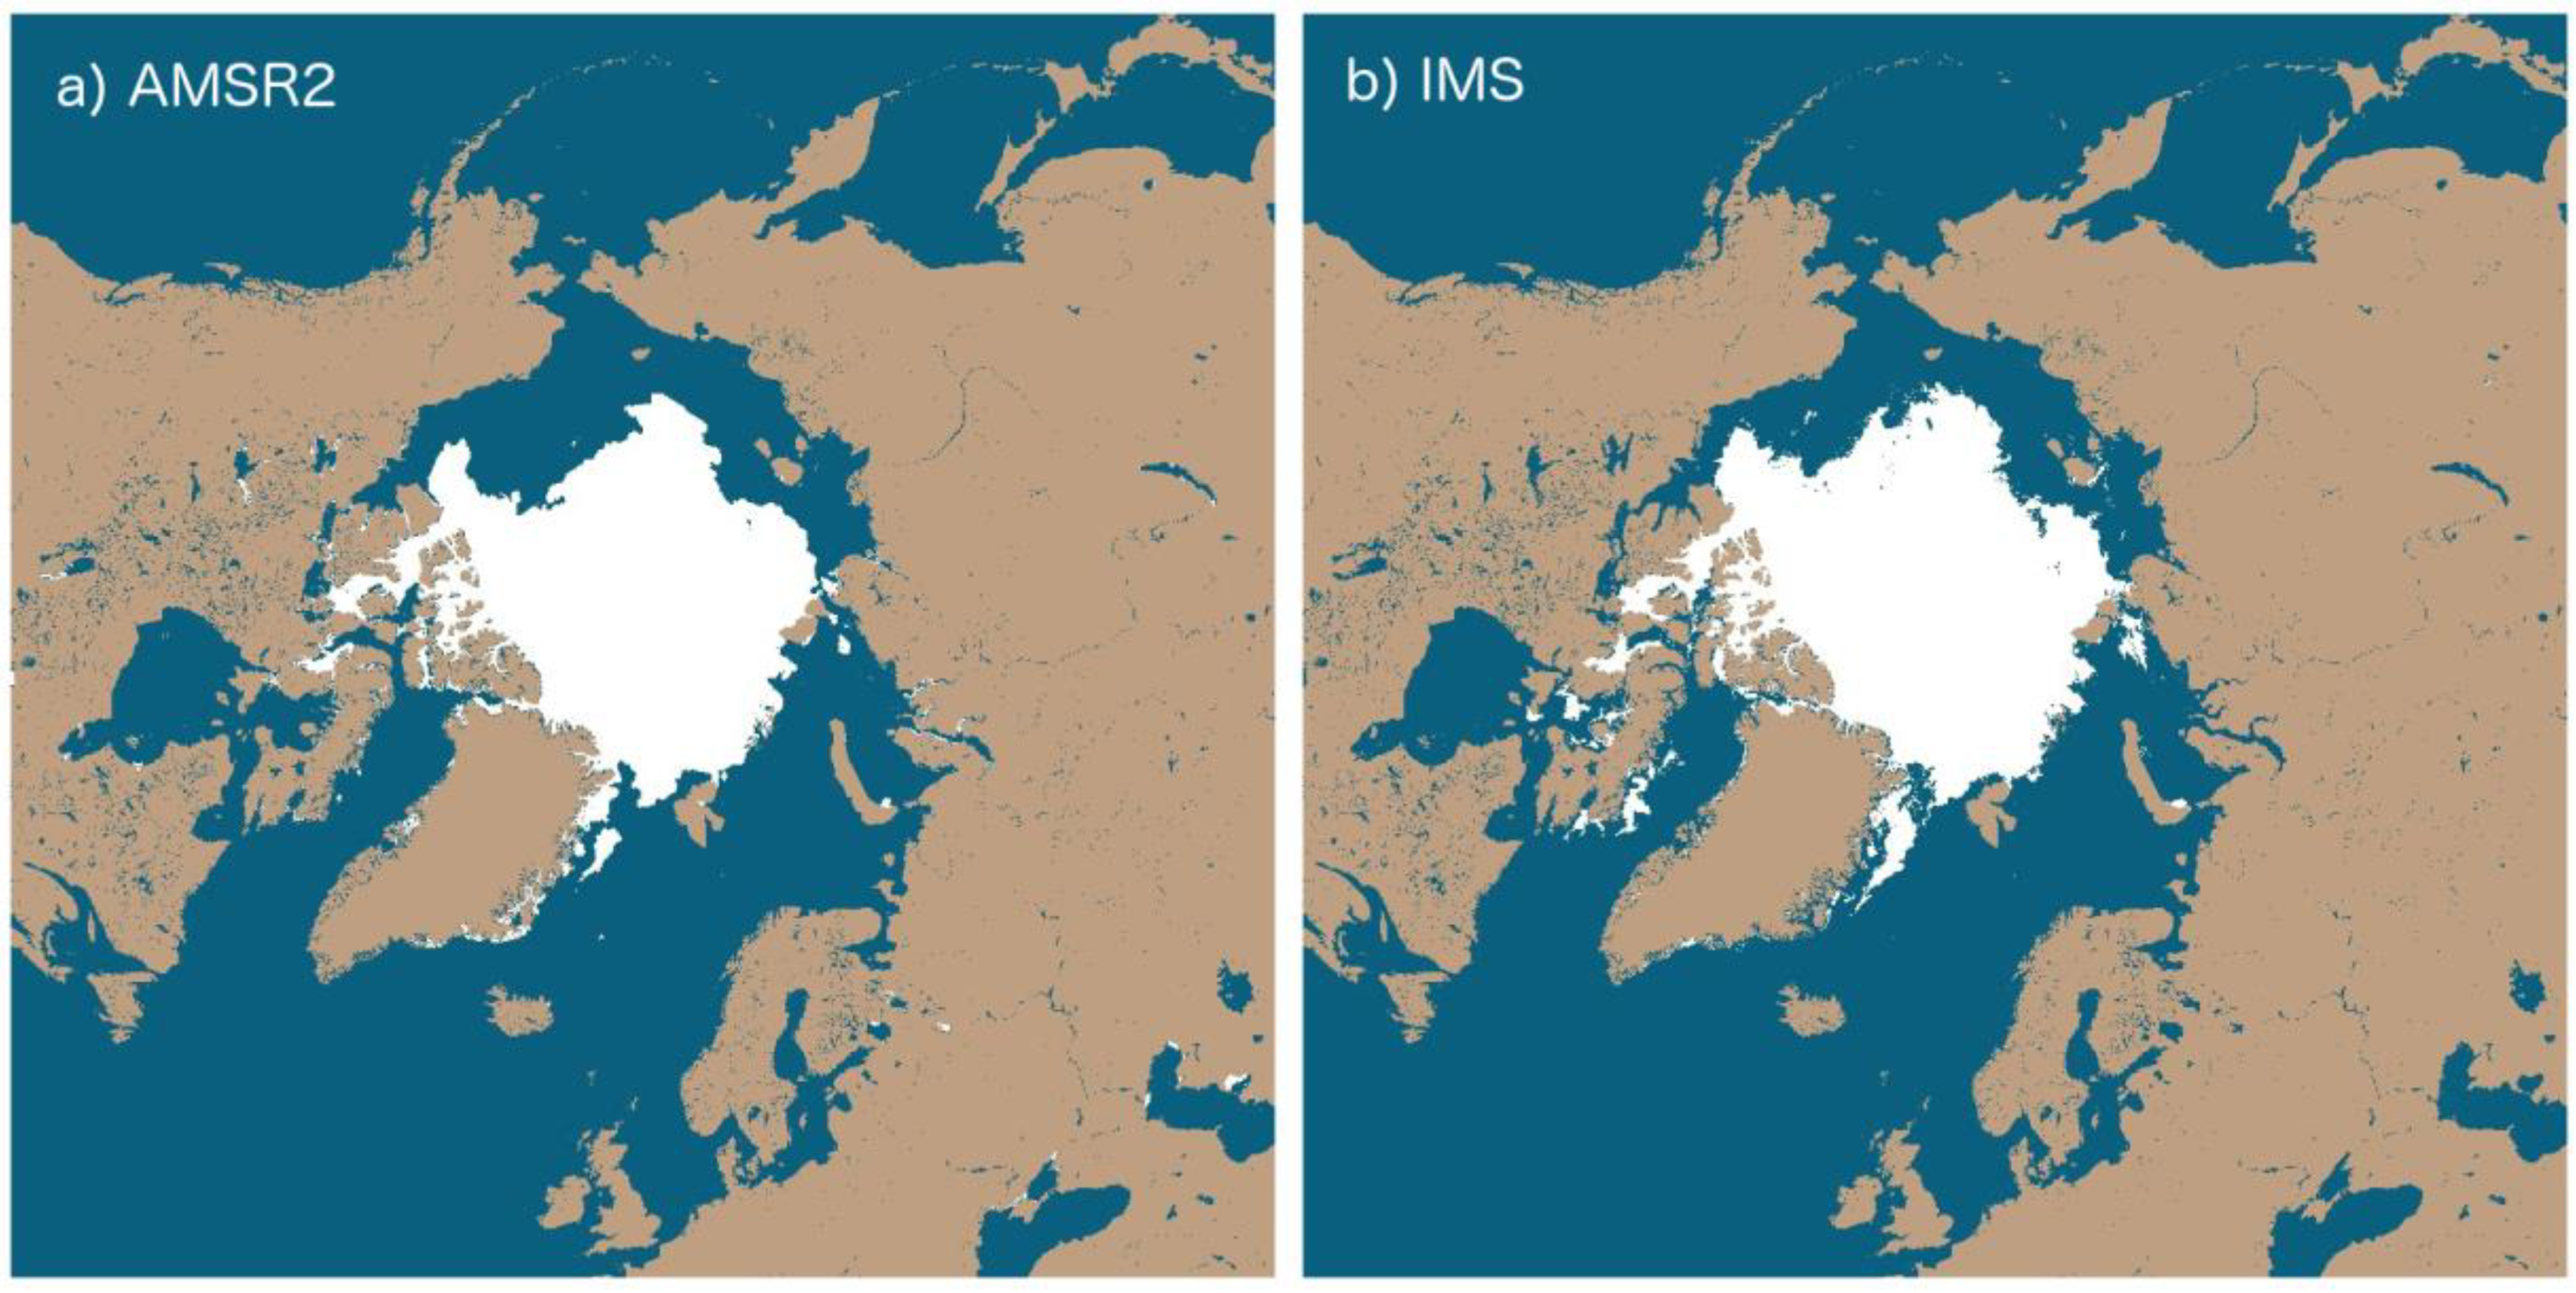
Figure 1. Ice cover from AMSR2 (a) and IMS (b) on 15 August 2017.
Remotesensing 12 01582 g001
Figure 2. Regional division of the Arctic north of 60°N, referring to the definition of regional seas in the Arctic from the National Snow and Ice Data Center at https://nsidc.org/arcticseaicenews/map-of-the-arctic-ocean/.
Remotesensing 12 01582 g002
Figure 3. Lines of longitude for ice edge determination.
Remotesensing 12 01582 g003
Figure 4. Daily Hit Rate, False Alarm Ratio, False Alarm Rate, and Hanssen-Kuiper Skill Score over the Arctic Ocean poleward of 60° North, when AMSR2 ice mask compared to IMS ice mask.
Remotesensing 12 01582 g004
Figure 5. Same as Figure 4, except over the Peripheral Seas of the Arctic Ocean, including the Beaufort, Chukchi, East Siberian, Laptev, and Kara and Barents Seas.
Remotesensing 12 01582 g005
Figure 6. Monthly mean Hit Rate, False Alarm Ratio, False Alarm Rate, and Hanssen-Kuiper Skill Score over the Arctic Ocean poleward of 60° North, where AMSR2 ice mask compares to IMS ice mask. The solid box shows the interquartile range (25% to 75%), and the whiskers extend out the maximum and minimum value of the monthly means.
Remotesensing 12 01582 g006
Figure 7. Same as Figure 6, except over the Peripheral Seas of the Arctic Ocean, including the Beaufort, Chukchi, East Siberian, Laptev, and Kara and Barents Seas.
Remotesensing 12 01582 g007
Figure 8. Monthly mean values of a, b, c, and d in the contingency table when AMSR2 ice and water identification are compared to IMS ice and water identification over the Peripheral Seas of the Arctic Ocean.
Remotesensing 12 01582 g008
Figure 9. Monthly mean values of ratio c/a, d/b, and a/b when AMSR2 ice and water identification are compared to IMS ice and water identification over the Peripheral Seas of the Arctic Ocean.
Remotesensing 12 01582 g009
Figure 10. Ice extent from AMSR2 and IMS on (a) 15 March 2017, (b) 15 June 2017, (c) 15 August 2017, and (d) 15 October 2017. White: ice in both AMSR2 and IMS; Magenta: ice in AMSR2 and water in IMS; Cyan: water in AMSR2 and ice in IMS.
Remotesensing 12 01582 g010
Figure 11. Differences of monthly median ice edges from AMSR2 and IMS from 2015 to 2019 according to longitude. Absolute differences of less than 10 km are in white.
Remotesensing 12 01582 g011
Figure 12. Median ice edge in August 2015–2019 from AMSR2 (Cyan) and from IMS (Magenta).
Remotesensing 12 01582 g012
Figure 13. Longitudinal distribution of median ice edge from North Pole point in August from AMSR2 (Blue) and IMS (Green) 2015–2019.
Remotesensing 12 01582 g013
Table 1. A 2 × 2 contingency table.
2 × 2 Contingency TableIMS IceIMS Water
AMSR2 icea (hits)b (false alarms)
AMSR2 water.c (misses)d (correct negatives)
Table 2. Monthly median Hit Rate, False Alarm Ratio, False Alarm Rate, and Hanssen-Kuiper Skill Score over the Arctic Ocean poleward of 60° North and over the Peripheral Seas of the Arctic Ocean.
Monthly MedianMonthHit RateFalse Alarm RatioFalse Alarm RateHanssen-Kuiper Skill Score
Arctic Ocean North of 60° NorthJan0.930.010.030.91
Feb0.940.010.030.91
Mar0.940.010.030.91
April0.940.010.030.91
May0.930.020.030.90
June0.920.030.040.88
July0.900.040.030.86
Aug0.880.060.030.85
Spet0.930.090.030.90
Oct0.940.060.030.91
Nov0.930.030.030.90
Dec0.930.020.030.90
Peripheral SeasJan0.970.010.040.93
Feb0.970.010.040.93
Mar0.980.010.050.93
April0.980.010.040.93
May0.970.020.060.90
June0.950.040.080.87
July0.890.040.040.83
Aug0.810.080.030.78
Spet0.850.120.020.81
Oct0.940.080.040.89
Nov0.960.020.040.92
Dec0.970.010.040.92