Article

Designing and Evaluating a User-Oriented Calibration Field for the Target-Based Self-Calibration of Panoramic Terrestrial Laser Scanners

Institute of Geodesy and Geoinformation, University of Bonn, Nussallee 17, 53115 Bonn, Germany
*
Author to whom correspondence should be addressed.
Remote Sens. 2020, 12(1), 15; https://doi.org/10.3390/rs12010015
Submission received: 17 November 2019 / Revised: 10 December 2019 / Accepted: 16 December 2019 / Published: 18 December 2019
(This article belongs to the Section Engineering Remote Sensing)

Abstract

:
Calibration of terrestrial laser scanners (TLSs) is one of the fundamental tasks for assuring the high measurement accuracy required by an increasing number of end-users. Nevertheless, the development of user-oriented calibration approaches is still an active topic of research. The calibration fields for the target-based self-calibration of TLSs described in the literature are based on the quasi-random distribution of a high number of targets, and they rely on heavy redundancy. This redundancy assures highly accurate calibration results, however, with the price of reduced efficiency. In contrast, this work follows the design, implementation, and validation of a user-oriented, cost-efficient calibration field intended for TLS calibration prior to measurement campaigns. Multiple goals and constraints are placed upon the design of the calibration field, such as comprehensive calibration for high-end panoramic TLSs considering all relevant mechanical misalignments, delivering stable and reusable calibration parameters, increasing calibration efficiency by minimizing calibration-field assembly, measurement acquisition and processing time through reducing the number of targets and scanner stations, as well as estimating calibration parameters with predefined quality criteria. The calibration field design was derived through a series of simulation experiments and it was compared with the current state of the art. The simulations indicate comparable calibration results, with eight times smaller number of targets (14 instead of 120). The implemented calibration field was tested on a range of instruments, successfully improving the measurement quality, both in situ and in the subsequent applications.

Graphical Abstract

1. Introduction

Despite the enormous efforts of TLS manufacturers, fabrication procedures are not flawless. The remaining small misalignments of instruments’ mechanical components can cause systematic measurement errors, reducing the point cloud quality. Hence, these systematic errors need to be mathematically modeled. Additionally, the relations of the mechanical components can vary over time. Therefore, regular calibration is necessary to ensure the sufficient measurement quality needed for stringent engineering tasks, such as deformation monitoring [1] and reverse engineering [2].
To that end, multiple self-calibration approaches have been developed, assuring up-to-date calibration parameters (CPs) and successfully reducing the measurement uncertainty without requiring instruments of higher accuracy [3]. These approaches rely on different objects as calibration references, such as planes [4,5], cylinders [6], paraboloids [7], signalized target points [8,9,10,11,12,13,14], or automatically detected salient points [15,16], which are found or deliberately placed in the surroundings.
To achieve accurate and unbiased measurements, the calibration should be comprehensive, modeling all relevant mechanical misalignments [3,8,11,17]. Therefore, the measurement geometry needs to be sufficiently sensitive to allow separation and unbiased estimation of all CPs. This is challenging, mainly due to the high correlations between some of the CPs [18,19]. Such sensitive measurement geometry can only be achieved by an adequate distribution of reference objects in the instrument’s field-of-view and an adequate distribution and number of measurements. Several works addressed this problem, outlining the measurement geometry characteristics necessary for successful comprehensive target-based calibration [8,18,20]. However, for the remaining calibration approaches, similar guidelines are still missing. Some studies avoid this complexity by estimating only the most relevant subset of calibration parameters [9,18]. However, such a calibration approach is overly simplified, as it is known that the number of existing mechanical misalignments is substantially larger [3,8,21].
Therefore, we build upon the target-based TLS self-calibration as the best-studied calibration approach, which has successfully been used for comprehensive calibration in multiple experiments. Current implementations of the calibration fields for target-based calibration use high quantities of well-distributed targets, and they rely on this heavy redundancy to assure accurate and unbiased estimation of CPs. As a result, they lack efficiency due to complex calibration field assembly and long measurement acquisition and processing time, which was recognized as the main disadvantage of this approach in many instances [3,5,6,10,22,23,24,25,26]. This drawback hinders this approach to be well accepted as a standard user-oriented TLS calibration method.
The main goals of this study are:
  • To design a user-oriented calibration field (in sense of cost-efficiency) that fulfills certain design criteria;
  • To evaluate this calibration field based on several calibration attempts using a wide range of TLSs with a special focus on high-end instruments;
  • To demonstrate the usability of the calibration parameters in situ and a posteriori.
Regarding the first goal, we want to increase efficiency by reducing the calibration field complexity. This is achieved by utilizing a small number of carefully selected target and scanner station positions, with the constraints of achieving the desired CP quality (desired precision, correlations, and reliability). The selected criteria are discussed in detail as the main guidance for the target reduction and the calibration field design. For comparison, a current typical calibration field consists of 120 well-distributed targets [3]. It should be noted that a few studies have already addressed the problem of calibration efficiency by reducing the number of targets [10,27]. However, they focused on estimating only a smaller subset of the CPs.
Regarding the second goal, the phrase “high-end denotes TLSs with high-quality components and measurement characteristics, such as two-face measurements, dynamic compensators for automatic leveling, low-measurement noise, and angular encoders with multiple reading heads, which reduces the amount of overall possible systematic errors. Examples of such devices are Leica ScanStation P-series and Zoller and Fröhlich Imager series instruments. We focus primarily on these devices, as they are most often used for highly demanding engineering tasks, and therefore, their successful calibration is of highest relevance. However, the calibration field designed herein can also be used to calibrate the instruments that do not fall into this category.
Regarding the third goal, we investigate the improvement in the point cloud uncertainty when the estimated calibration parameters are used. So far, this has only been investigated for in situ scans. Using the estimated parameters for scans of unrelated objects with different time offsets has never been documented in the literature before. The presented results give an impression of how much we can rely on such CPs for scans that are collected some time after the calibration.
This work is structured as follows. The review of the current state of the art and the aims of this study are presented in the current section. Section 2 gives an overview of the theoretical background (materials and methods) necessary to understand the conducted experiments. Section 3 presents the experimental results, the main experimental findings, and the corresponding discussion. Finally, Section 4 gives the main conclusions of our study.

2. Materials and Methods

This section firstly provides a brief summary of the theoretical basis for the TLS calibration (Section 2.1), and secondly it explains the main ideas behind the calibration field design (Section 2.2).

2.1. Basics of TLS Calibration

2.1.1. Calibration Parameters (CPs)

For the TLS calibration, it is necessary to transform the Cartesian coordinates back to spherical ones, mimicking the original observations (Equations (1)–(3)):
r j i = x j i 2 + y j i 2 + z j i 2
φ j i = a r c t a n ( x j i y j i )
θ j i = arccos (   z j i r j i   )
where r j i , φ j i , θ j i denote the range, horizontal, and vertical angle measurements; and x j i , y j i ,   z j i are Cartesian coordinates of the ith point measured from the jth scanner station. To account for quadrants, the horizontal angles are corrected by adding 180° or 360° where necessary, and vertical angles are corrected by deducting the calculated value from 360° where necessary. This angle parameterization is adopted from [28], and it is just one of several parametrizations found in the literature [21,29]. This parameterization should be adapted with respect to the scanning mechanism of the used instrument [30].
From the variety of different CP functional models in the literature [8,21,31,32], we based our design on the functional model developed by the National Institute of Standards and Technology (NIST), which is the first one to describe the genuine geometrical relations between the mechanical misalignments and the TLS observations [14,21]. The latter parameterization was proven valid for the majority of panoramic TLSs in a large run-off experiment, where several major manufacturing companies declared it as functional [33]. This model is abbreviated herein because in the case of the high-end TLSs, the errors related to angular encoders can be safely neglected [28,34], which reduces the overall list of relevant CPs from 18 to 10:
r j i = x 2 sin ( θ j i )   +   x 10 + v r j   i
φ j i = x 1 z r j   i tan ( θ j i ) + x 3 r j i   sin ( θ j i ) + x 5 z x 7 tan ( θ j i ) + 2 x 6 s i n ( θ j i ) + x 1 n r j   i + v φ j   i
θ j i = ( x 1 n + x 2 )   cos ( θ j   i ) r j   i + x 4 + x 5 n cos ( θ j   i ) x 1 z   s i n ( θ j   i ) r j   i   x 5 z   s i n ( θ j   i ) + v θ j   i
where r j i , φ j i , θ j i are measurement errors, which are further decomposed on v r j   i , v φ j   i ,   v θ j   i , the calibration adjustment residuals describing the random errors, and x 1 n , x 2 , , the calibration parameters describing the systematic errors (Table 1). Hence, this abbreviation simplifies the task of designing the calibration field. Similarly to total stations [35], high-end panoramic TLSs can utilize two-face measurements to estimate the majority of the CPs (Table 1) using two consecutive scans (front/back and back/front scan) from a single scanner station without a reference [21,28]. Other panoramic TLSs are restricted by the software limitations. This characteristic has a strong influence on the results of TLS calibration, and consequently, on the required measurement configuration (Section 3.1).

2.1.2. Functional Model

The algorithm of the target-based self-calibration is generally realized as the least-squares adjustment, and it is based on the functional model of rigid body movement or photogrammetric bundle adjustment:
f j i   =   R ( k , ϕ , ω )   i x y z j i +   T ( X , Y , Z ) i     X Y Z j r e f .   = 0 ,
where i = 1,2…,s; j = 1,2…,p; s and p are total numbers of scanner stations and targets used in the experiment. The estimated parameters are separated in the rotation matrix R ( k , ϕ , ω )   i , the translation vector T ( X , Y , Z ) i (jointly called exterior orientation parameters, EOPs), the vector of target coordinates in the reference coordinate system X Y Z j r e f . (also called object points, OPs), and the calibration parameters (CPs).
The measurement vector from the scanner station i to the target j in the local coordinate system is equal to
x y z j i = [ x j i y j i z j i ] = [ ( r j i + r j i ) sin ( θ j i + θ j i ) sin ( φ j i + φ j i ) ( r j i + r j i ) sin ( θ j i + θ j i ) cos ( φ j i + φ j i ) ( r j i + r j i ) cos ( θ j i + θ j i ) ]
in the case of the right-handed, y-headed, clockwise-rotating coordinate system. Further, the dynamic compensator observations are added as additional conditions (if available):
ω i = ω o b s i + σ ω
ϕ i = ϕ o b s i + σ ϕ
where ω i and ϕ i are true tilts with respect to the local horizon, ω o b s i and ϕ o b s i are observed values, while σ ω and σ ϕ are associated uncertainties from manufacturer specifications.
Herein, we transform the least-squares adjustment algorithm based on the strict Gauss–Helmert model (GHM) into the robust parameter estimator based on the Danish method. An adequate strategy for the detection and elimination of eventual outliers is necessary, as it is known that the target center estimation process can suffer from gross errors [9,17]. If no outliers are detected, the Danish method equals to the least-squares solution. This target-based self-calibration algorithm implementation is directly adopted from Reshetyuk (2009) [9], and readers are referred to the latter literature for more information.

2.1.3. Stochastic Model

Typically, as a starting point, the stochastic models are based on values provided in the manufacturers’ specifications given for a single point accuracy. Most often these are single scalar values separately provided for the horizontal angle, vertical angle, and range measurements. Such stochastic models are furtherly iteratively refined using the variance component estimation (VCE) based on the estimated measurement residuals of three observation groups ( σ r [ m m ] , σ φ [     ] , and σ θ [     ] ) until the global test is accepted [36].
Designing a calibration field based on simulated measurements requires more accurate a priori knowledge about the measurement uncertainty. Hence, for our simulations, we used the empirically derived stochastic model (ESM) describing the uncertainty of the repeated target center estimation. Although it does not reflect the measurement uncertainty comprehensively, it comes closer to reality than relying on the values from manufacturers’ specifications [37]. As solving the optimization problem requires having one definite stochastic model, we focus on the combination of the particular instrument type (Leica ScanStation P-series) and the particular settings, target design, and target center estimation algorithm (more in Section 3.2.1). The empirical values for the latter stochastic model are directly adopted from [20]. A previous study [37] revealed that the corresponding standard deviations σ r [ m m ] ,   σ φ [     ] , and σ θ [     ] depend on the scanner-to-target distance within the investigated ranges from 1 to 100 meters. Hence, for the simulation purposes (Section 3.1), the covariance matrix of observations (Σ) is generated as a diagonal matrix, where the uncertainty of each observation is derived by sampling the empirical values from [20], respecting the scanner-to-target distances.
However, the final implementation of the calibration field in this study uses distances ranging from approximately 3 to 20 m, where the target center uncertainty is nearly constant in each measurement direction if the metric values are observed [37]. The standard deviations expressed for Euclidian distances in the direction of ranges ( σ r [ m m ] ), as well as horizontal and vertical angle measurements ( σ φ [   m m   ] ,   σ θ [   m m ] ), are nearly constant ( 0.1 mm). As the observations φ j i and θ j i in the calibration adjustment are angular values, the corresponding standard deviations of approximately 0.1 mm need to be transformed back to angular values, which are different for each scanner-to-target distance. Hence, the covariance matrix in the case of the empirical experiments (Section 3.2) is defined as:
Σ   =   [ σ r   [ m m ] 2 I ( tan 1 σ φ   [ m m ] r i ) 2 I ( tan 1 σ θ   [ m m ] r i ) 2 I ]
where the angular uncertainty is recalculated for each target individually based on the metric uncertainty of the observation groups σ φ [   m m   ] and σ θ [   m m ] , as well as the measurement range r i . This way, we achieve a more general stochastic model that is applicable for various instruments, while still preserving the trend of constant metric uncertainty in each of the three measurement directions. In the empirical experiments, the VCE is used to adjust the Σ to correctly represent the measurement uncertainty of each individual instrument. The initial values for σ r   [ m m ] , σ φ   [   m m   ] , and σ θ   [   m m ] are safely defined in the first iteration as 3 σ r   [ m m ] based on the value for range accuracy in the manufacturers’ specifications (to avoid an incorrect detection of valid measurements as outliers), and further refined by VCE until the global test is accepted.

2.2. TLS Calibration in the Context of Geodetic Networks

2.2.1. Optimization of Geodetic Networks

The task of designing a TLS calibration field can be described as the design of geodetic networks. It is an optimization problem that searches for a cost-efficient solution that fulfills imposed quality criteria, and is solved analytically (only partially) [38,39] or heuristically [40,41]. The network design is divided into four interrelated sub-problems, known as orders of the design [39]: the zero-order design (ZOD), or the problem of optimal datum; first-order design (FOD), or the problem of optimal network configuration (measurement geometry); second-order design (SOD), or the problem of optimal observation weights; and the third-order design (TOD), or the problem of densification of existing networks. Niemeier (2008) [42] states that there is no analytical solution for the complete design of geodetic networks.
For the target-based calibration, the datum choice has a negligible effect on the CPs [43]. Hence, the ZOD can be neglected and the datum can be arbitrarily chosen (we implemented the minimal constraint by fixing six EOPs [44]). Regarding the SOD, the observation weights are typically chosen to reflect the uncertainty of the measurement procedures and the equipment. In the case of the TLS self-calibration, the SOD is given for a particular scanner, scanner settings, and the target design (Section 2.1.3). As we aim to establish a new calibration field, the problem of TOD is not relevant. Hence, our aim is designing the TLS calibration field with a focus on the FOD problem.
Several publications have focused on the TLS-related FOD aiming at viewpoint planning (i.e., the optimal instrument positioning to achieve a certain point cloud quality). Different heuristic algorithms were utilized to find near-optimal solutions, such as simulated annealing, greedy search, genetic algorithm, particle swarm optimization, and ant colony optimization methods [45,46,47,48]. All studies reduced the problem to 2D due to the high numerical complexity. However, this is not possible in the case of the TLS calibration, as the vertical position of the targets is of high relevance [8,18]. Hence, we obtain the design solution based on simulations, using the least computationally expensive heuristic method, the man-made trial and error analysis. The number of possible solutions is reduced based on the results from [20].
Generally, the quality of the geodetic network is characterized by its precision, reliability, and cost [49]. Based on the previous work on the topic of TLS calibration, we adopt an additional criterion—the correlation of CPs. The exact adopted optimization goals or design criteria of the calibration field design are defined and discussed in the following sections.

2.2.2. Design Criteria

Efficiency

The efficiency is the most straightforward optimization goal we want to accomplish with the calibration field design. In short, as our calibration field is user-oriented, the overall workload and time necessary for the establishment and maintenance of the calibration field, as well as the measurement acquisition and processing, needs to be minimal. This is achieved by relying on the self-calibration technique (therefore avoiding costly and time-consuming establishment of reference values) and with use of the minimal number of targets p and scans or scanner stations s :
s , p m i n
The latter is the only true optimization goal that we directly tried to minimize, while the further goals are rather considered as constraints, giving threshold values that should not be breached.

Precision of CPs

The general goal of the calibration is that after the calibration, the influence of remaining systematic errors (i.e., bias) should be small enough so as to be insignificant (can be considered as a part of the random noise). The required precision of the CPs strongly depends on the demands and circumstances of each individual user. Namely, the overall accumulated impact of all systematic errors depends on the size, shape, and position of the object of interest in the scanner’s field of view. The final magnitude of the random noise depends on multiple factors, such as measurement geometry, surface properties, measurement settings, as well as denoising and preprocessing strategies, and it is not homogenous. Finally, the necessary quality of the final point cloud depends on the individual task.
Thus, estimating the exact threshold value for the optimization function could be a subject of multiple separate studies in the future. Herein, we simplified this problem by bounding the CPs precision threshold to the measurement uncertainty. The adopted threshold is that the standard deviation of each CP needs to be equal to or smaller than the mean target center uncertainty of all observations in the calibration field:
σ x   σ ¯ r   [ m m ] ,   σ ¯ φ   [     / m m   ] ,   σ ¯ θ   [   / m m   ]
To design the calibration field, we use the empirically derived values for Leica ScanStation P-series [20]. In this concrete case, the mean expected angular uncertainty ( σ ¯ φ   [     ] , σ ¯ θ   [     ] ) equals approximately 0.5″. Hence, we aim to estimate all tilt/angular CPs (Table 1) with the standard deviation lower than 0.5″. As the analogous metric uncertainties σ ¯ r [ m m ] , σ ¯ φ [ m m   ] , and σ ¯ θ [   m m   ] equal approximately 0.1 mm, we aim at estimating all offset (metric) CPs with accuracy lower than 0.1 mm.
We consider this criterion as feasible for several reasons. First, as a rule of a thumb, the target center uncertainty is an order of magnitude smaller than single point measurement noise. Hence, at least the standard deviation of each individual CP should be below the random noise. Second, expecting to achieve much higher CP precision is unrealistic, especially if we aim for cost-efficient calibration field design. As our simulations suggest (Section 3.1.2), even with 120 targets, the CP precision is not remarkably higher than the defined threshold. Finally, we decided to bind the threshold to the target center uncertainty, because even when the stochastic model is refined through the VCE (Section 2.1.3), this way the CP precision threshold is proportionally changed and will be fulfilled.

Correlations

Low correlations assure that if one of the CPs is incorrectly or imprecisely estimated, it will not influence the remaining parameters. Therefore, low correlations reduce the possibility of biased parameter estimates, they reduce the parameter coupling, they assure avoiding singularity in the calibration adjustment (caused by perfect coupling), and they can help identify insignificant parameters. Hence, as common practice for the camera self-calibration [36], multiple previous publications have aimed to achieve low correlations between individual TLS calibration parameters [9,11,18]. To date, there is no generally accepted threshold for sufficiently low correlation of the CPs. Therefore, in this work, we adopted a threshold where the correlations between all CPs should be smaller or equal to 0.8:
ρ x 0.8
The reason for such a high value is two-fold. First, in all our simulations we could not achieve notably lower correlations for such a high number of functionally similar CPs. Even in the keypoint- based calibration approach [15], with the high number of well-distributed observations, and in the case of using 120 targets (Section 3.1.2), the correlations were similarly high or higher. Hence, it is unreasonable to expect that the cost-efficient calibration would lead to even lower CP correlations. Second, higher correlation values do not necessarily negatively influence the calibration results. If each CP is estimated with high precision, higher correlation values will not adversely influence the CPs’ quality. Herein, we guarantee a high CP precision by fulfilling the precision threshold (Equation (12)).

Reliability

Multiple publications have pointed out that the TLS calibration must be robust to outliers, which are commonly present in the observations [3,9,17,50]. Therefore, the least-squares adjustment is often substituted with robust parameter estimators that can detect and process the outliers [9]. The possibility to correctly detect outliers strongly depends on the measurement configuration. Hence, it needs to be accounted for when designing the calibration field.
In this work, we incorporated the external reliability criterion for the calibration field design. The external reliability describes the network controllability within the parameter domain. It is defined by impact factors, which quantify the maximal impact of undetected outliers on the estimated parameters [51]:
x = ( A T Σ 1 A   ) 1 A T Σ 1 ( B [ 0 , ,   i , , 0 ] T )
where A and B are the Jacobian matrices with respect to the estimated parameters and observations, while i is the minimum detectable outlier [52].
The reliability analysis has already been introduced as part of the calibration field design for mobile laser scanning systems [53]. Herein, we define that the maximal impact of undetected outliers (impact factor) should be equal to or smaller than the mean target center uncertainty of all observations in the calibration field:
x σ ¯ r [ m m ] , σ ¯ φ [     / m m   ] , σ ¯ θ [   / m m   ]
In other words, the impact of outliers on the CPs should not be higher than the measurement noise. In the previous publications, the reliability was not discussed as a relevant quality criterion for the CPs, because the high redundancy of targets and scans assured the high reliability by default (as will be presented in Section 3.1.2). However, for a cost-efficient solution with a small number of observations, the network reliability must be considered.

3. Results and Discussion

This section is separated into the simulation experiment, which is the basis of the calibration field design (Section 3.1), and the empirical experiment, which is the basis of the implemented calibration field evaluation (Section 3.2).

3.1. Simulation Experiments—Designing the Calibration Field

We derived the final calibration field design using the simulation-based trial and error analysis, where we aimed to fulfil all the optimization goals presented in Equations (12)–(14) and Equation (16). Additionally, we had the constraint that the calibration field needed to be implemented in the large machine hall we dedicated for future calibration experiments (Figure 1). We selected a large hall instead of commonly used office rooms with smaller dimensions for two reasons. First, it was shown by Lichti [18] that the correlations between CPs are lower with the higher maximum range. Second, in our previous work, it was shown that the angular target center precision is higher with higher ranges [37], which increases the sensitivity of the measurement configuration to estimate the CPs [20].
We applied the simulated CPs on all simulated observations according to Equations (4)–(6). The parameter values were chosen with realistic magnitudes based on the previously conducted empirical experiment (Table 2). Additionally, all observations were subject to synthetic random noise with magnitudes corresponding to the values adopted from [19]. The calibration parameters were estimated using the functional and stochastic model described in Section 2.1.2 and Section 2.1.3. Section 3.1.1 and Section 3.1.2 give the simulations results for the high-end panoramic TLSs, while Section 3.1.3 discusses adaptations necessary to fulfill the goal functions with the instruments not falling into this category. Separate solutions for these two TLS groups are necessary, as a lack of some measurement characteristics, such as two-face measurements, makes fulfilling the adopted design criteria more difficult (Section 2.1.1).

3.1.1. Simulated Design for High-End TLS

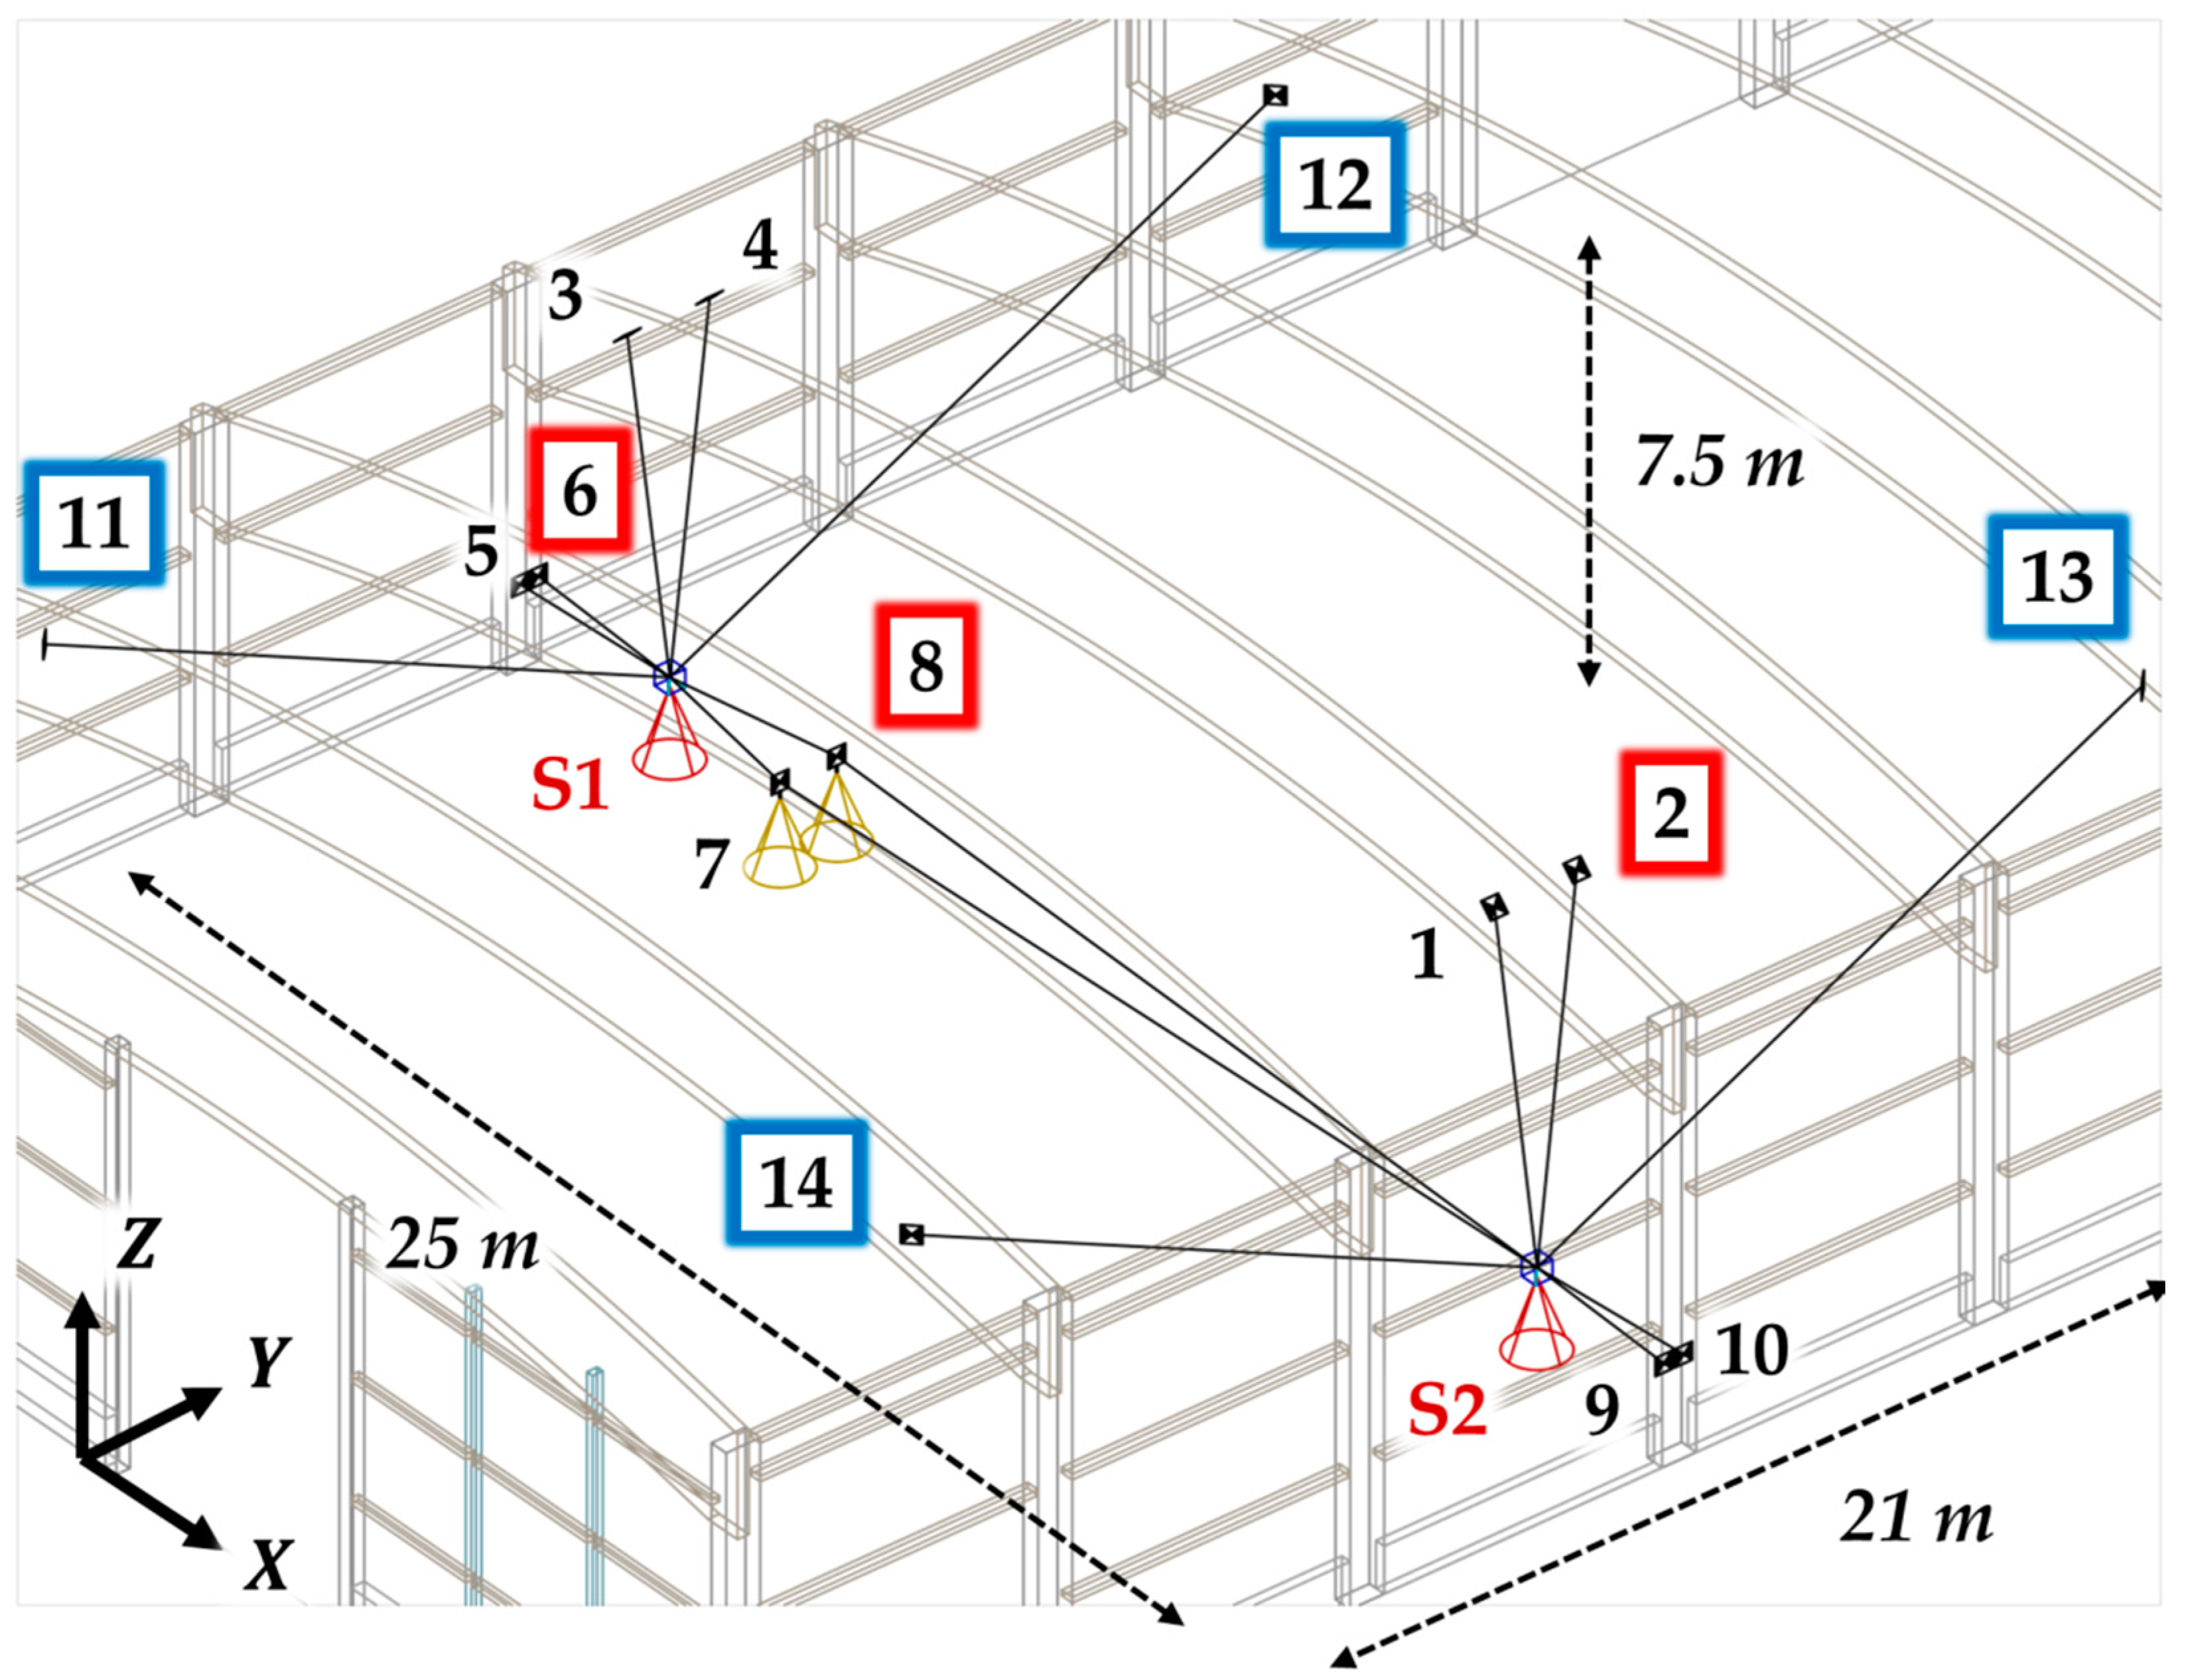
The final solution of our trial and error analysis is presented in Figure 2. Our educated guesses focused on combining the measurement configurations that are known to be sensitive towards estimating each individual CP [20]. We started the simulation trials with three targets and two-face scans from two scanner stations, which is a necessary minimum for the unambiguous estimation of the relevant CPs (Equations (4)–(6)) [20]. The number of targets was iteratively increased by 1 when aiming to improve the estimates of two-face sensitive CPs, or by 2 when aiming to improve the estimates of the remaining CPs. In the simulation process, we considered 85 different target locations and 4 different scanner stations in several hundred different set-ups, reaching the maximum network complexity when incorporating 24 targets. Finally, as the best solution, we derived the network of 14 targets measured from two scanner stations (S1 and S2) using two-face measurements (four scans), which successfully fulfilled all given optimization criteria. The coordinates of all targets and scanner stations are given in Appendix A.
The network is symmetric and it is realized by four repetitions of the minimal measurement geometry necessary for the comprehensive TLS calibration derived in [20]. In short, it is necessary to have a minimum of three targets measured from two stations using two-face measurements to estimate all relevant CPs (Figure 2, targets indicated with red frames). This measurement configuration is guaranteed to be highly sensitive, and therefore it is the backbone of the implemented calibration field. Four repetitions of this geometry were necessary to increase CP precision and reliability.
The instrument’s orientation around the standing axis needs to be differed by approximately 90° between the scanner stations, while the compensator observations need to be included in the calibration adjustment. Such a maneuver reduces the correlations and improves the standard deviation of some parameters [18]. Additionally, the targets between the scanner stations should allow observations from both sides. Further, we included 4 more targets perpendicular to the line connecting scanner stations S1 and S2 (Figure 2, targets indicated with blue frames). These targets have increased elevation angles at higher distances and they bring several advantages to our calibration field.
First, they form a highly sensitive measurement configuration for estimating the parameter x5z, which is hard to estimate precisely due to the lack of two-face sensitivity [20]. Second, it improves the overall network geometry by increasing EOPs precision. Namely, a better volumetric distribution of targets increases the positioning accuracy similar to the Global Navigation Satellite System (GNSS), where geometric dilution of precision (GDOP) value improves with the larger volume of the pyramid closed, with four satellites and a receiver [54]. Improving the TLS positioning precision indirectly increases the CP quality (precision, correlations, and reliability). Third, it provides an additional set of targets at higher elevation angles, which boosts the accuracy of estimating the elevation-dependent CPs (majority), which is compromised due to the limited roof height in the hall [20]. Additionally, due to the longer ranges in comparison to the targets directly above stations S1 and S2 help to decouple the elevation-dependent tilt and offset parameters (e.g., x1z and x5z -x7).
The results of the calibration simulations with the latter network geometry are given in Table 2. As can be seen, all of the CPs are estimated unbiasedly with the desired precision and reliability of 0.5″ for tilt (angular) CPs and 0.1 mm for offset (metric) CPs, while the correlations did not breach the threshold of 0.8. The CPs with the highest σ x and x are the tilt parameters that rely on the targets with the higher elevation angles. These CPs are best estimated if the targets are placed directly above the instrument at distances of 10 m or more. However, the maximal distance in the given facility to such targets is approximately 6 m, making it suboptimal. This is an unavoidable phenomenon for the indoor calibration facilities due to the limited rooftop heights.

3.1.2. Comparison to Previous Calibration Fields

We further compared the derived calibration solution with the typical calibration field design to analyze the similarities and shortcomings of the cost-efficient calibration field concerning the usual implementations. Hence, we simulated a calibration experiment based on the typical calibration field derived by Chow et al. (2013) [3]. This calibration field consists of 120 targets measured with six scans taken from two scanner stations, where the instrument is rotated around the standing axis for approximately 120° after each scan. The calibration field is realized in a larger office room with dimensions of 14.5 × 11 ×3 m. We removed all observations with the incidence angles higher than 60° to avoid highly uncertain target center estimation, as it is a common practice in the literature [8]. The simulation was analogous to the previously explained one, and the results are presented in Table 3.
Comparing Table 2 and Table 3 reveals that having an eight times higher number of targets does not notably improve the calibration results. The highest correlations occur between the functionally similar CPs (e.g., x3 vs. x6 and x5z vs. x7, in the same range of approximately 70%). The precision of x 7 is practically identical, while the highest impact factors are only 0.1–0.2″ smaller in the case of 120 targets. To conclude, if sufficient attention is given to the measurement configuration, the number of targets can be remarkably reduced without notable losses in calibration parameter quality.

3.1.3. Simulation Results for Non-High-End TLS

Simulations for cases of instruments not falling into the category of high-end TLSs are realized by omitting compensator and two-face measurements and by increasing the measurement noise by a factor of 5. To still fulfill the desired optimization goals (now the goals are σ x   and   x 2.5   or   0.5   mm ) , we need to increase the number of scans from four to eight, while the measurement configuration is unchanged. The orientation of the instrument around the standing axis needs to be changed between each scan by approximately 90° on both scanner stations, and the reason for this is two-fold. First, this maneuver is known to reduce the parameter correlations [18]. Second, it mimics the two-face measurements of high-end TLSs when the instrument is coarsely rotated by 180° around its standing axis, which improves the CP quality (precision, correlations, and reliability). The simulation results for the latter conditions are presented in Table 4.
The realized CP quality is comparable to the high-end TLSs, with σ x and x proportionally increased with the measurement noise, while ρ x remained similar. This solution is only one of a few possibilities that would lead to fulfilling the given optimization goals. We selected this one as the most feasible because it requires no extensive modifications in the measurement configuration. Although it may seem that the measurement time needs to be notably increased, with modern instruments this is only an increase of measurement time from approximately one to two hours.

3.2. Empirical Experiments—Evaluating the Calibration Field

3.2.1. Experiment setup

We calibrated a Leica ScanStation P20, Leica ScanStation P50, and Zoller and Fröhlich Imager 5016 (all high-end), as well as the Faro Focus3D X 130, Leica BLK360, and Leica HDS6100. All instruments were calibrated according to the measurement configurations presented in the latter section.
The simulated measurement configuration was implemented with centimeter-level accuracy for both targets and scanner station locations (deemed sufficient based on the simulations). The positioning was based on the known 3D model of the facility and the measurements with an electronic distance measurement device and a measuring tape. The implemented targets were planar black and white, 8-fold BOTA8 targets with dimensions of 30 × 30 cm, which guaranteed high precision target center estimation [55]. The targets had a semisphere mounting at the back side of the plate that was compatible with the laser tracker magnetic nests. Overall, 12 targets were installed on 12 magnetic nests in the facility.
The remaining two targets were placed on the wooden surveying tripods between the scanner stations. The latter targets were used to estimate the rangefinder offset (x10), and therefore they needed to be observed from both sides. Hence, they had an additional printed target pattern on the back side and were mounted on typical surveying tribrachs. Additionally, they needed to allow an accurate transfer of the target center between the sides in the direction of range measurements (0.1 mm or better). Therefore, we used two-sided targets with a known thickness, which was measured with submillimeter-accurate calipers. To avoid an eventual bias of the CPs due to the unknown lateral shifts between the target patterns from both sides, we deweighted the angular measurements towards these targets in the calibration adjustment.
The instruments were placed on a heavy duty wooden tripod for TLSs and secured using the surveying tripod stabilization when possible. Focus3D and BLK360 were not compatible, and hence they were placed on their original tripods without additional stabilization. During each measurement campaign, the atmospheric conditions were monitored. They all remained stable within this short measurement time. The measurement ranges spread from approximately 3 to 20 meters, and the vertical angles spread from 5° to 90° and from 270° to 355°. As all range measurements were relatively short, no atmospheric correction was applied. From each scanner station, two-face measurements were made and the compensator was turned on (when possible). Further details of each calibration are summarized in Table 5.
The target centers were estimated using the algorithm based on template matching described by Janßen et al. (2019) [55]. These observations were processed in the calibration adjustment as described in Section 2.1.2 and Section 2.1.3, with one modification. Namely, in all calibration cases, we observed an increased variance for the angular measurements of all highly elevated targets directly above scanner stations S1 and S2 (Figure 2). To account for this, we created respective separate observation groups, whose variances are refined separately through VCE, as described in Section 2.1.3. Therefore, the new covariance matrix adopted in the empirical experiment resembles the one given in Equation (11). However, it consists of five instead of three block matrices (one for σ r ,   σ φ ,   σ φ e l e v a t e d , σ θ , and σ θ e l e v a t e d respectively). The number of outliers in the experiments was on average less than 1–2%, never breaching the value of 5% of observations.

3.2.2. Experiment Results for All TLSs

The estimated CPs together with the corresponding significances are presented in Table 6. Since the CPs are correlated, they cannot be considered as independent values, and hence they need to be decorrelated before the statistical testing. Therefore, we applied the significance testing as described in [56], where the Cholesky decomposition is used to obtain uncorrelated parameter values. As can be appreciated in Table 6, all parameters are found to be significant in at least one of six cases. As expected, the tilt parameters are significant on a larger scale than the offset parameters. However, the x1z is found to be significant in 3 out of 6 cases. Although not applying this CP would not notably reduce the point cloud quality, it would bias the estimate of functionally similar tilt parameters (x7 and x5z). This indicates that all parameters given in Equations (4)–(6) should be considered when designing a calibration field for a comprehensive calibration of TLSs.
The magnitudes of the estimated offset CPs are in the order of several tenths of a millimeter, while the spread is much higher in the case of the tilt CPs (from several arc seconds up to more than a hundred). It is observable that the values for high-end TLSs are generally a few times lower (up to an order of magnitude). These differences make evident the division on the high-end instruments and the ones not falling into that category.
Table 7 presents the standard deviation of the observation residuals in the registration adjustment with and without applying the estimated CPs, as well as the improvement achieved through the calibration. It is impossible to directly compare the success of our calibration field with the calibration fields used in previous calibration experiments due to different instruments, different distribution of observations, as well as different functional and stochastic models. However, the improvement in observation residuals is the most common evaluation of the calibration success in the literature [8,10,17,57]. Therefore, with a lack of better criterion, we rely on these values. Garcia and Lerma (2013) [17] analyzed and summarized the success of all TLS calibration experiments, presenting significant improvements of 36–48% for ranges, 30–80% for horizontal angles, and 31–74% for vertical angles. The values presented in Table 7 fit well in the latter intervals. The mean values are 28%, 60%, and 50% for ranges, horizontal, and vertical angles, respectively, where only range measurements fall marginally short in comparison to the previous experiments.
Furthermore, a number of observations in the previous target-based TLS calibration experiments fall within the range of 390–4680, with a mean of 2390. In this study, the number of observations is 168 or 336, depending on the scanner type (Table 5). This is a significant decrease of up to an order of magnitude. To conclude, the presented data demonstrate that we achieved comparable measurement improvements with a notably reduced number of observations. Hence, it can be concluded that the design of the cost-efficient calibration field based on the adopted optimization goals was successful, both for high-end and non-high-end TLSs.

3.2.3. Reproducibility of Results for the Leica ScanStation P50

We estimated the mean CP values and the empirical standard deviation based on the calibration of the Leica ScanStation P50, which was repeated four times (Table 8). If we compare these empirical values with the ones derived from the calibration adjustment, we can observe the high level of congruence for most of the parameters (a few hundredths of a millimeter and a few tenths of an arc second). Additionally, we mostly achieved the goals set in the simulation experiments by estimating all offset parameters with a standard deviation of 0.1 mm and tilt parameters with a standard deviation of 0.5′.
The only parameters deviating from this are x7 and x5z, and the probable reason for that is two-fold. First, the estimation of these CPs relies on highly elevated targets directly above the instrument, for which we observed increased variance for angular measurements. Hence, to combat this increased variance and to achieve the initially planned CP accuracy in the future, we could increase the number of targets with high elevation angles. Second, if the calibration series for these two parameters are examined more carefully, we can notice an approximately linear trend of the CP values over time. Namely, both parameters decrease steadily with each calibration. This trend seems systematic and it cannot be adequately modeled with the variance propagation in the calibration adjustment. Therefore, in the future, we plan to repeat similar calibration series and further examine this phenomenon. Nevertheless, even with this discrepancy, the estimated CP standard deviations do not fall far away from the empirical values. Hence, they estimate the uncertainty of the estimated CPs well.
If we further analyze the impact factors, we can see that the estimated quantities are close to the values of standard deviations. Hence, we can conclude that our goal of keeping the maximal impact of undetected outliers in the same range as the measurement noise is achieved. Finally, the maximal correlations between the CPs remained under the threshold defined in Section 2.2.2. This conclusively confirms the successful implementation of the simulated calibration field design. A similar analysis for all instruments is omitted due to the limited instrument availability and time.

3.2.4. Point Cloud Quality Improvement

We additionally analyzed the degree to which applying the CPs improves the overall point cloud quality, both in situ and in later use. The CPs were applied twice. First, they were applied to the point clouds taken during the calibration to further investigate the effect of the up-to-date CPs. Second, the CPs were applied on the point clouds of unrelated measurement objects that were measured with different time offsets in comparison to the calibration.
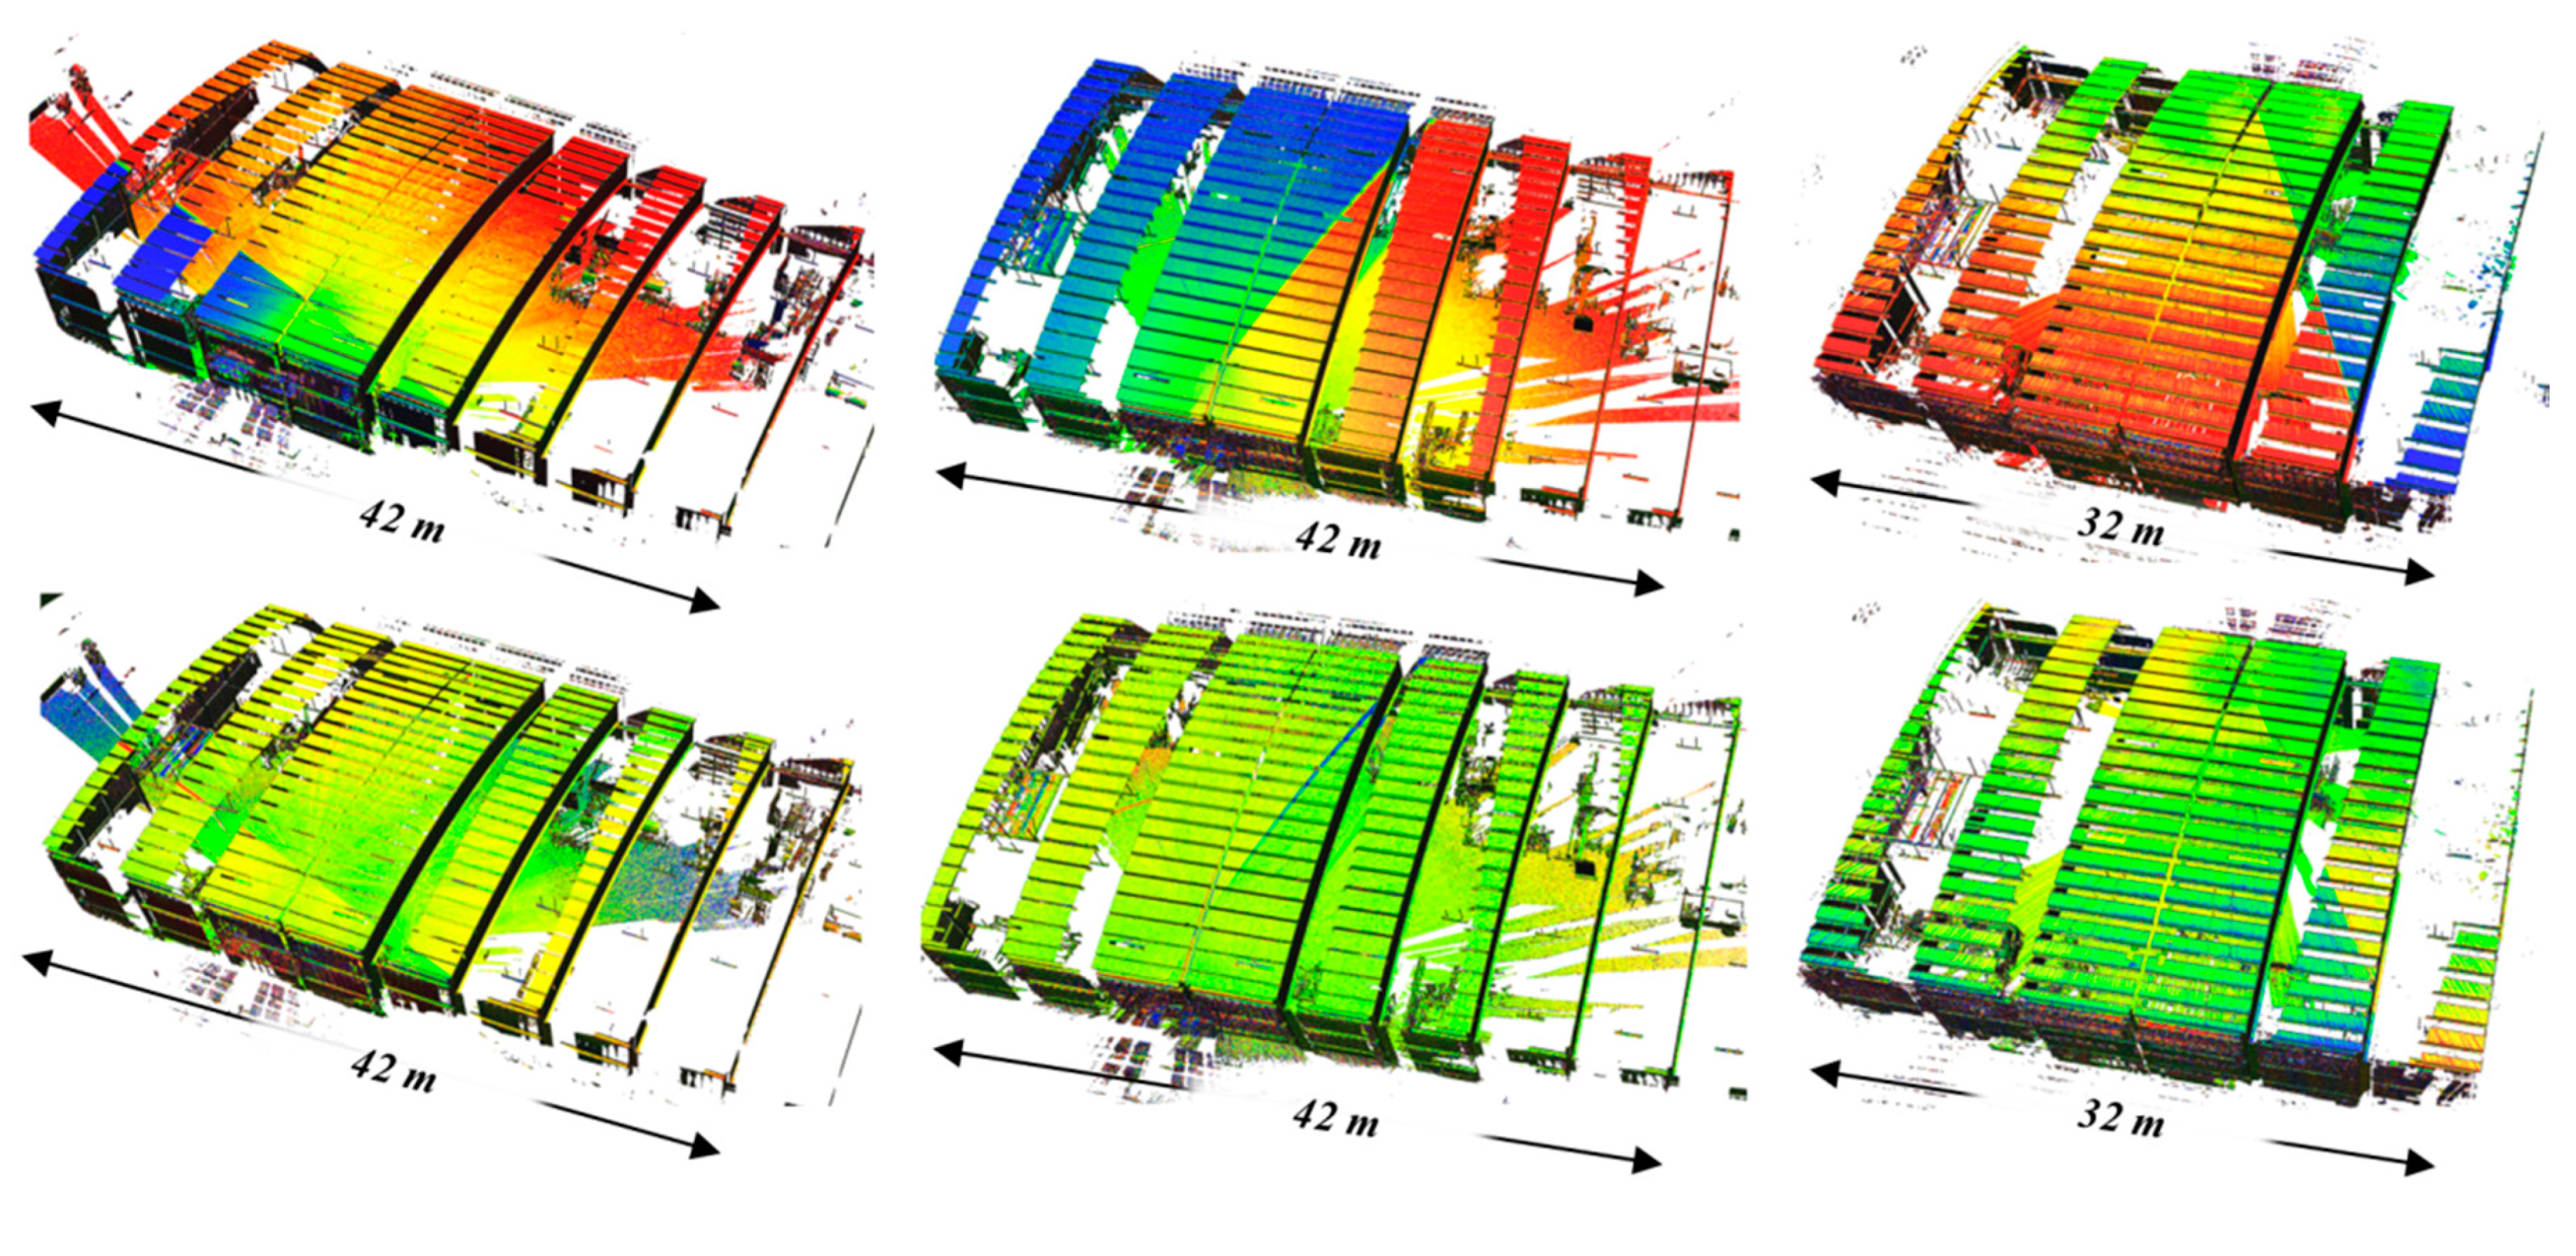
To quantify the point cloud quality improvement, we analyzed the differences between the 1st and 2nd scans of the two-face measurements, before and after applying the CPs. The differences are computed using the M3C2 point cloud comparison algorithm [58]. These differences were computed in the direction of the local surface normals and were denoised based on the local point cloud statistics. As all external systematic errors act identically on both scans of two-face measurements, the only difference originates from the instrument’s mechanical misalignments and measurement noise. For example, the atmosphere-related systematic errors can be treated as constant for both consecutive scans, as there is no notable change in temperature or pressure in this short period of time. This leads to the cancelation of this systematic effect in the process of computing differences. Hence, for a perfectly calibrated instrument, the computed point cloud differences should have a central tendency of zero with low dispersion (lower than the measurement noise) [59]. Using this evaluation strategy limits us to the high-end TLSs allowing two-face measurements. Hence, we further analyze only these instruments, which are the main focus of this study anyway. It should be noted that this calibration evaluation strategy is not completely comprehensive (validates 9 out of 10 CPs). Namely, the influence of the estimated rangefinder offset (x10) cannot be analyzed this way. Hence, for the validation of x10, we rely on the improvement in observation residuals (Table 7).
Figure 3 presents the differences between the scans of two-face measurements of the machine hall (Figure 1) for the Leica ScanStation P50, Leica ScanStation P20, and Z+F Imager 5016 instruments before and after applying the CPs. The color scale is adjusted to highlight the differences before and after the calibration for each instrument individually. This is necessary due to uneven magnitudes of two-face differences. Hence, the results between the instruments are not directly comparable. In general, the green color represents the zero difference and it changes gradually until the defined threshold is breached (1 mm for P50 and Imager 5016, 2 mm for P20). The color depends on the direction of the differences (red for positive and blue for negative direction).
In the upper half of Figure 3, we can observe notable systematic trends in the computed differences with abrupt changes in signs between the parts measured in the front and in the back of the instrument. These differences originate from the two-face sensitive mechanical misalignments and indicate the degraded point cloud quality. In the lower half of the figure, we can observe that applying the estimated CPs notably reduced the differences and almost completely removed the systematic trends.
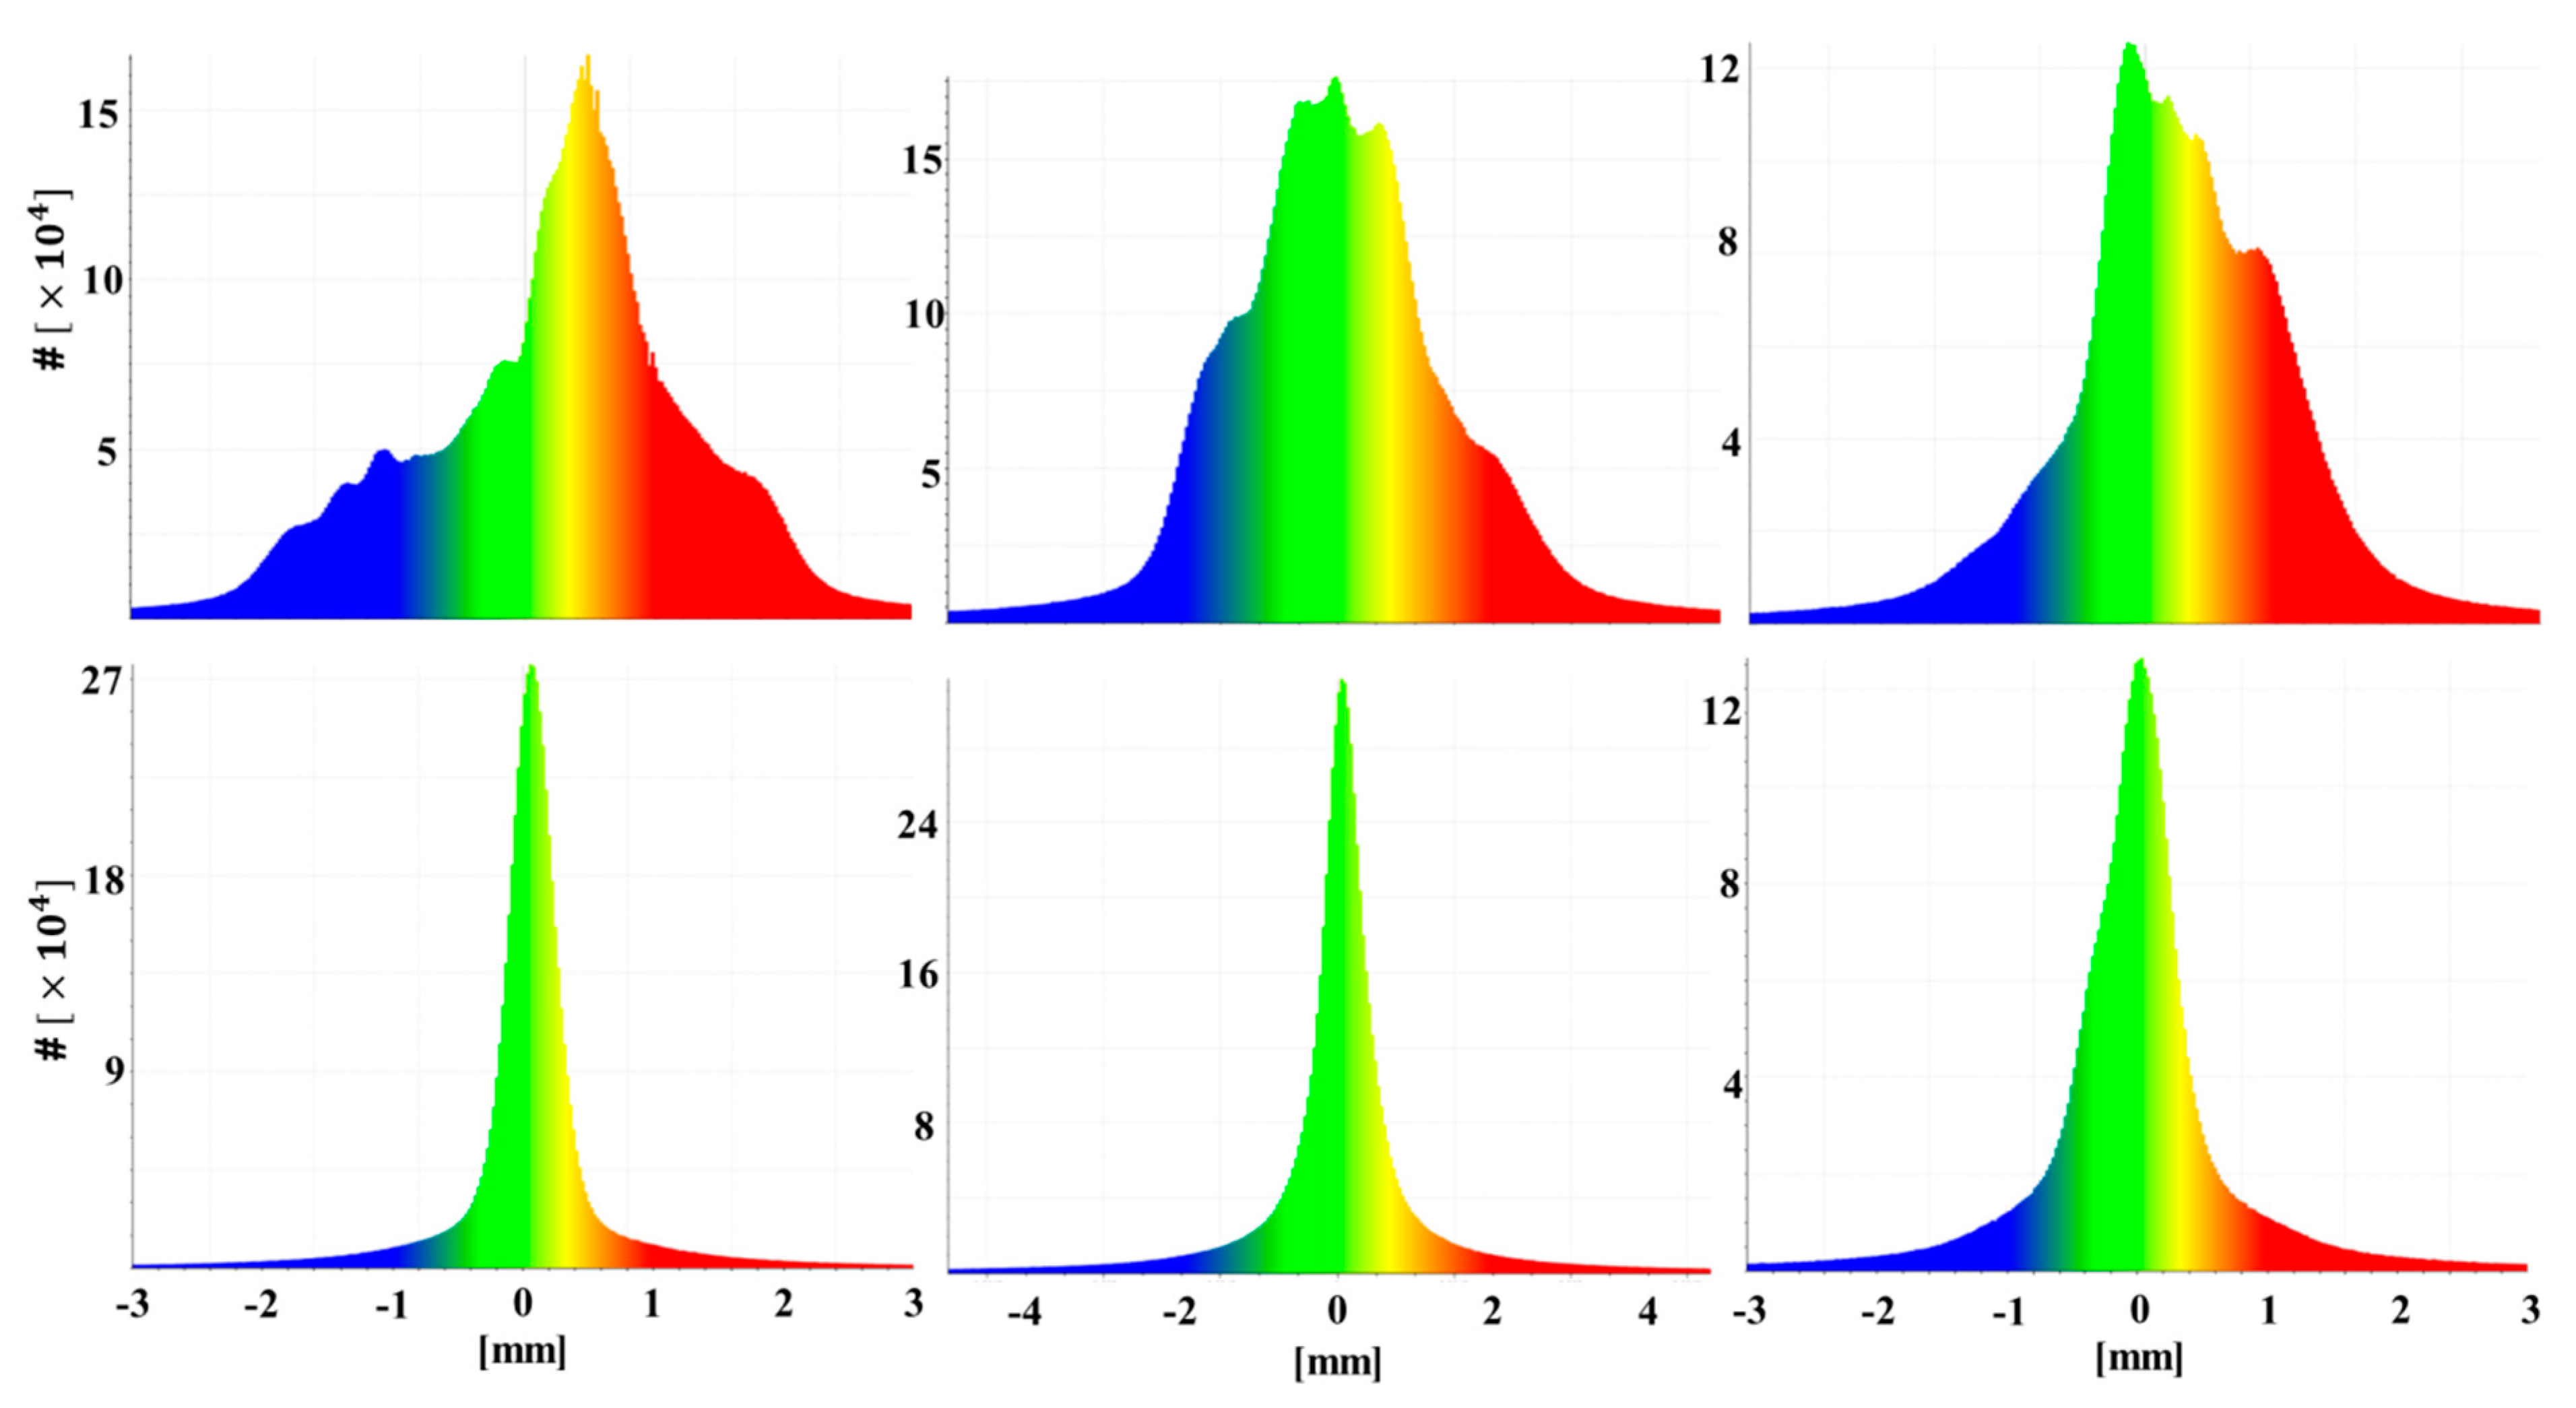
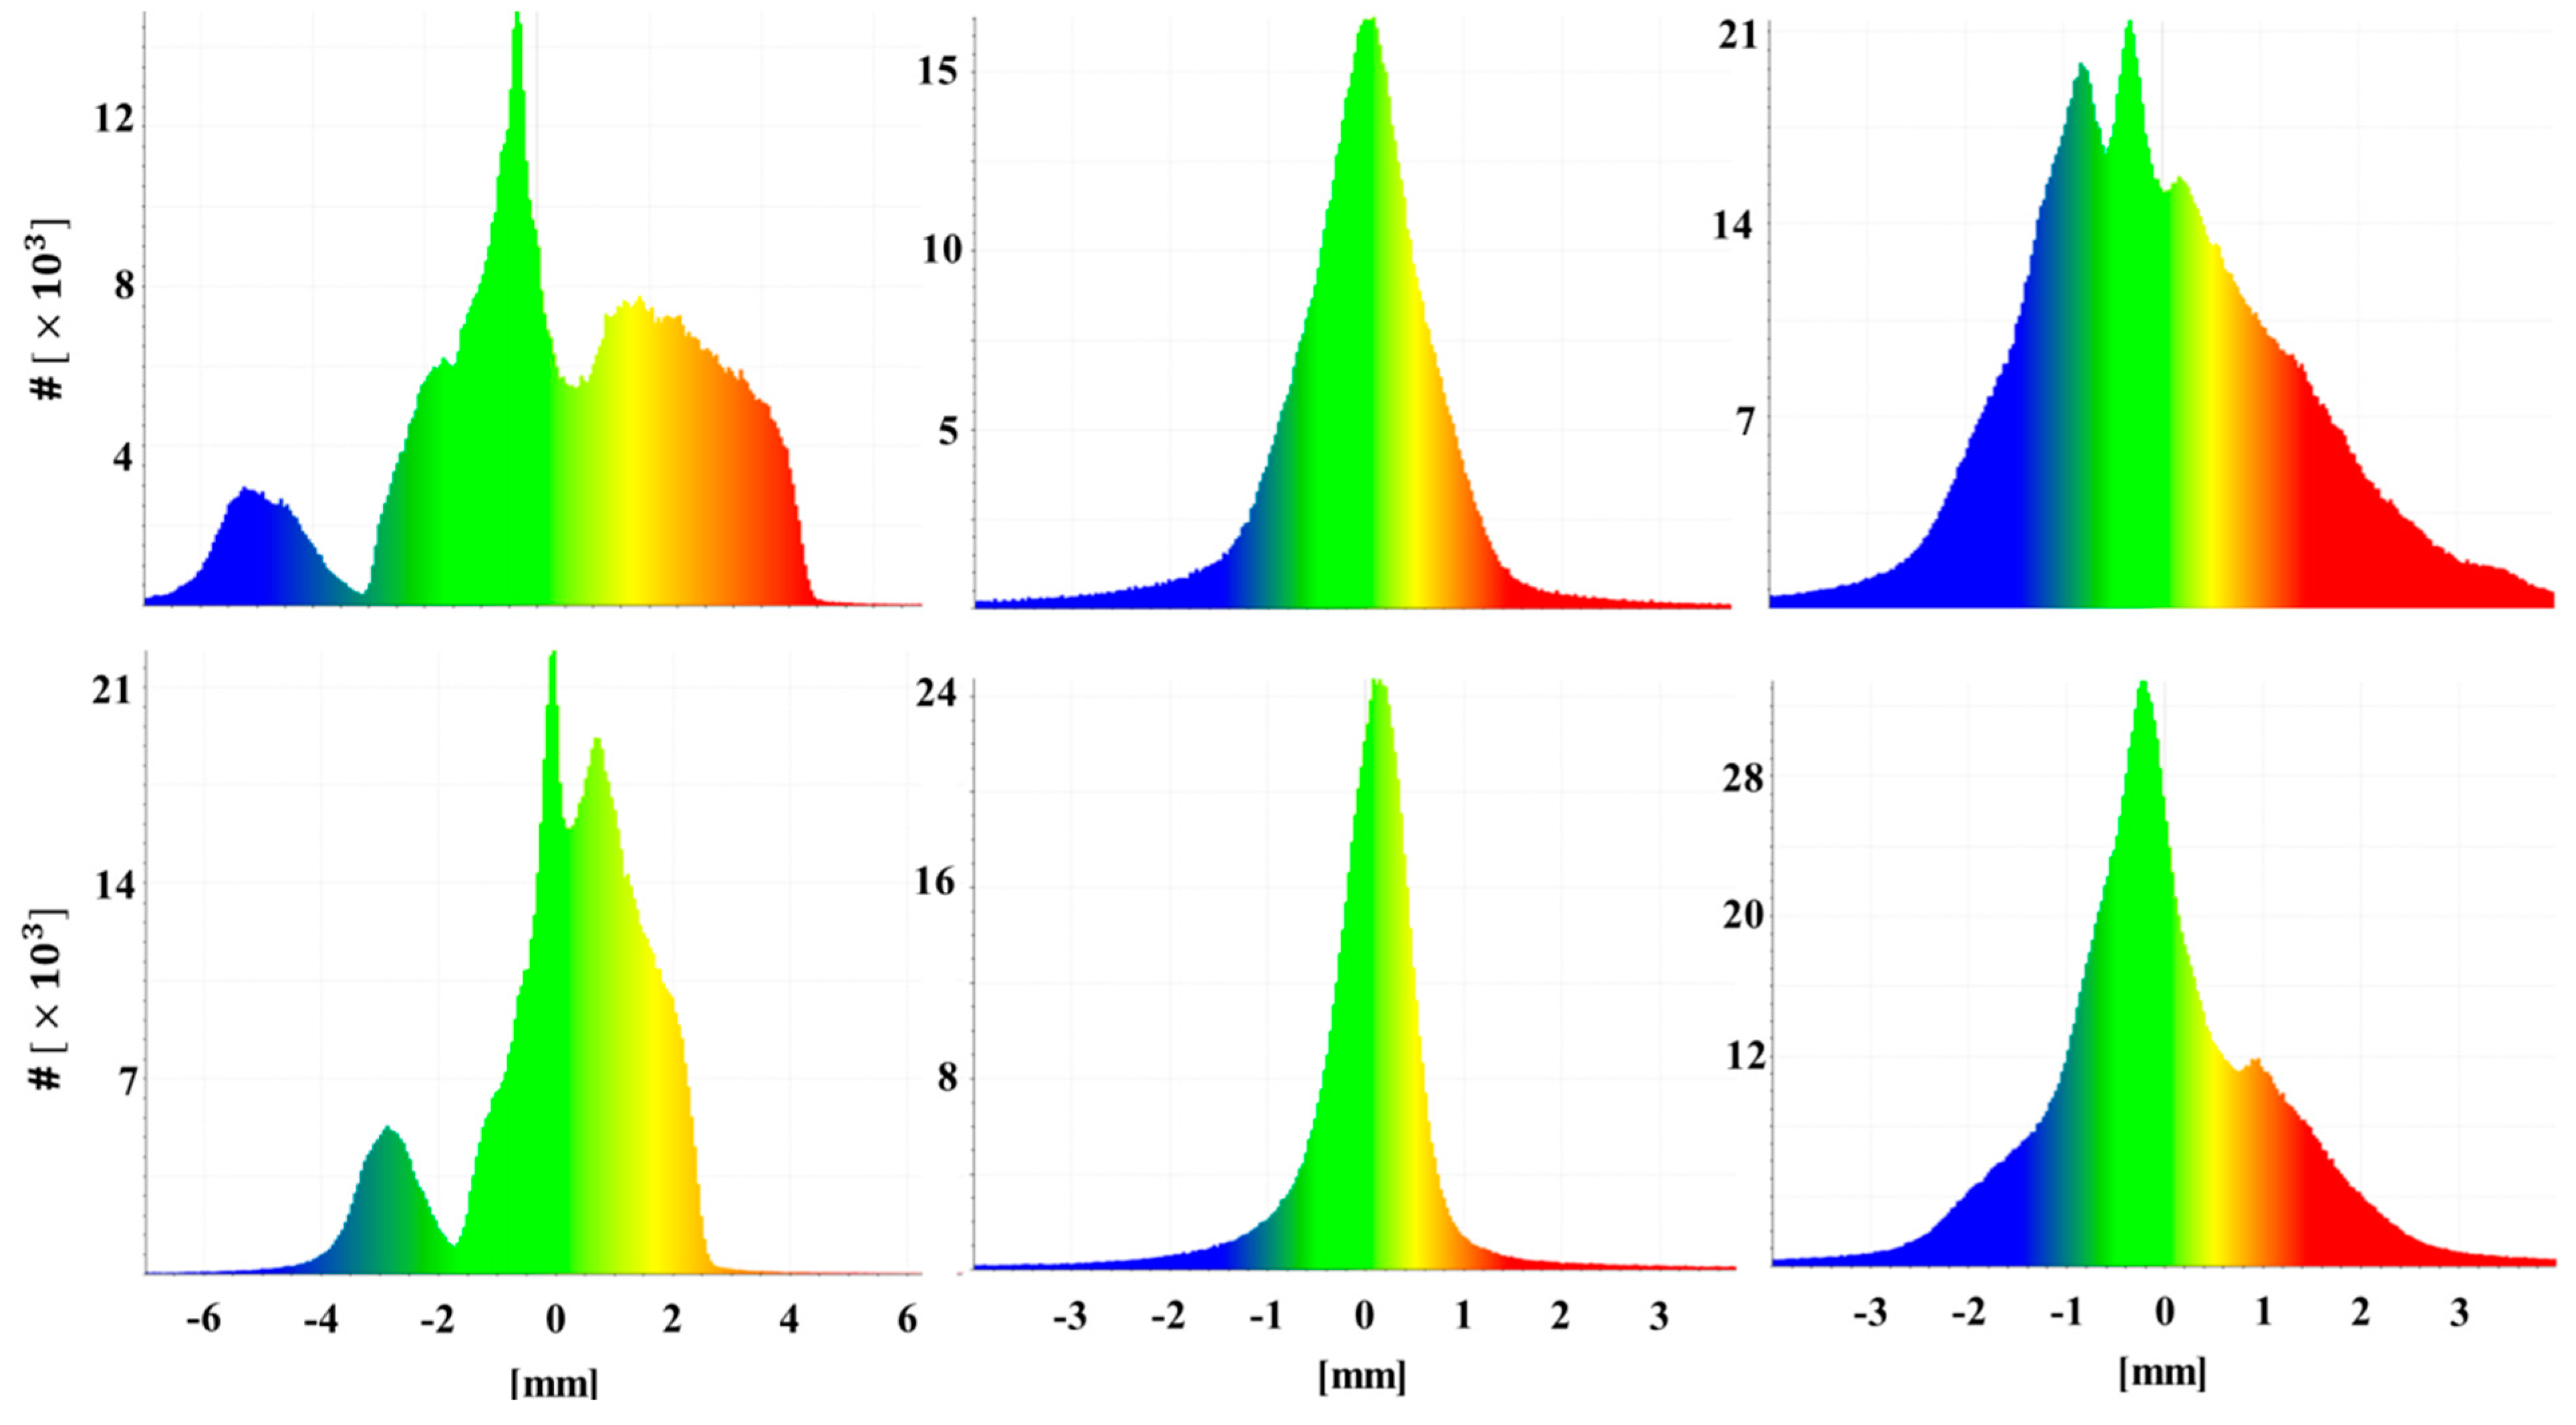
The corresponding histograms of the computed differences are given in Figure 4. It can be seen that applying the CPs notably improved the distributions of differences for all scanners (central tendency closer to zero and lower dispersion). Hence, our calibration successfully reduced the evident influence of systematic errors. The calculated point cloud differences are not necessarily normally distributed due to possible outliers, remaining systematic influences, and unknown influence of the M3C2 algorithm on the observations. Hence, following a few recent studies [60,61], besides the commonly used values of central tendency and dispersion (mean and standard deviation), we also calculated the robust measures of distribution—median and median absolute deviation (MAD). The standard deviation of the differences was reduced by the calibration process from 15% to 40%, while the MAD was reduced even more, from 43% to 74%. Additionally, the mean and median values were notably closer to zero for P50 (mean ranged from 0.22 to 0.06mm, median from 0.34 to 0.06mm) and Imager 5016 (mean ranged from 0.23 to –0.02, median from 0.22 to –0.01), further indicating the elimination of the systematic trends in measurements (for P20 values changed only marginally).

3.2.5. A Posteriori Use of Calibration Parameters

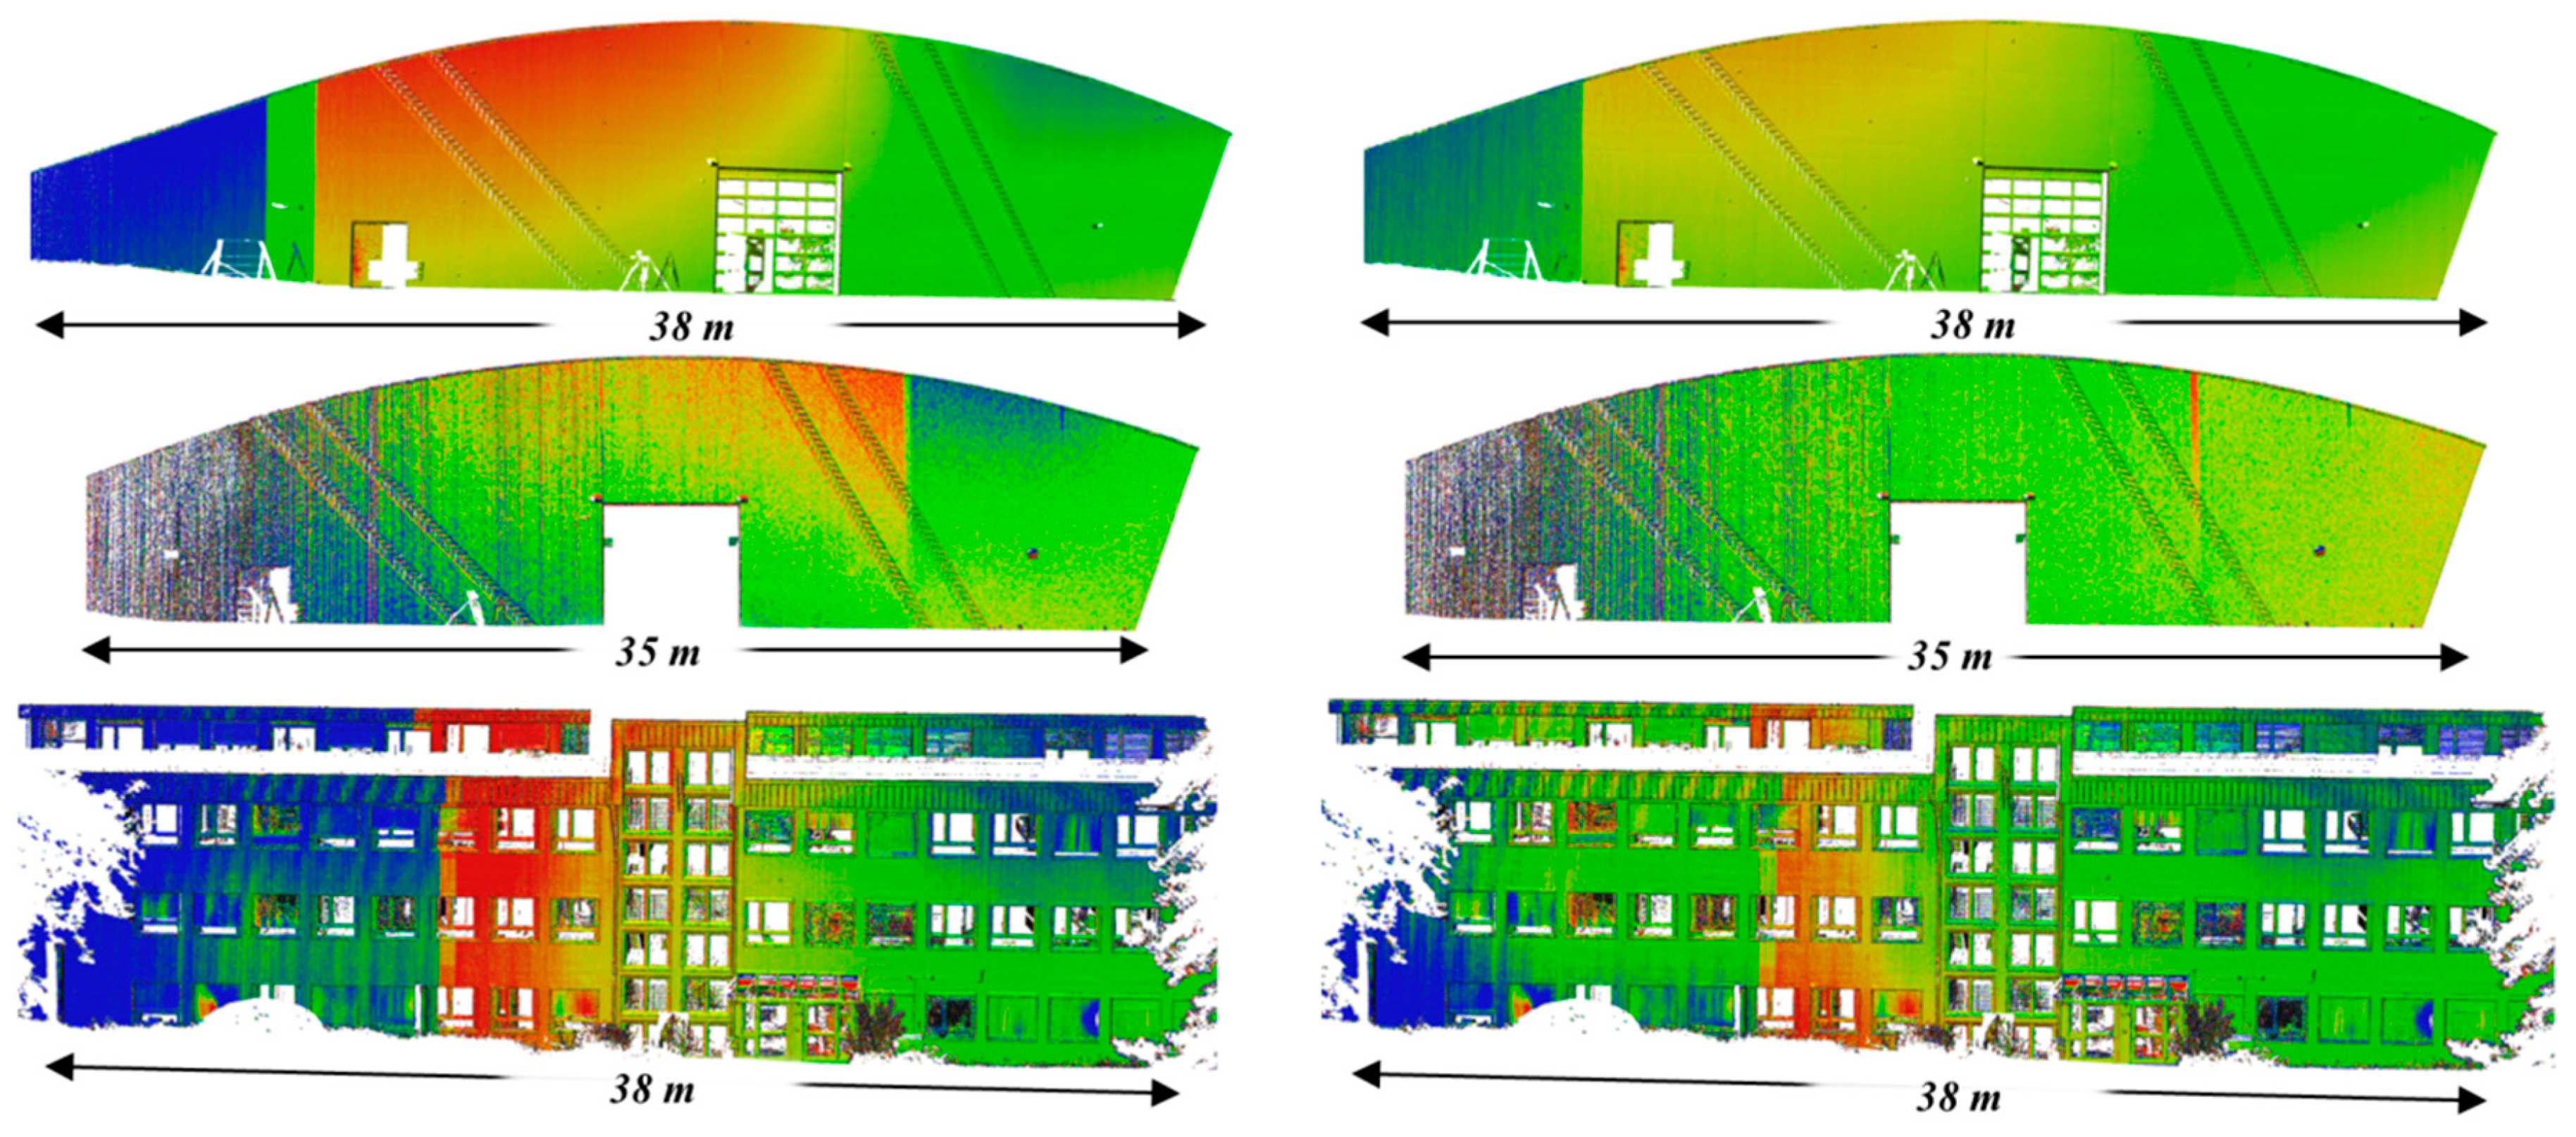
To test the a posteriori point cloud quality improvement, we measured a planar wall from the outer side of the machine hall with the P20 and P50 instruments, while we measured a building façade in the proximity of our institute with the Imager 5016 instrument. All measurements were several days apart from the calibration experiment, and in contrast to the point clouds presented in Figure 3, they were acquired outdoors. The measurements with the P20 instrument took place two days after the calibration, with the P50 instrument two weeks before the calibration, and with the Imager 5016 instrument approximately two months after the calibration. The point cloud differences and corresponding histograms are presented in Figure 5 and Figure 6, respectively. Again, the color scales were adjusted for each instrument individually (with the solid color thresholds at 5 mm for P50 and 1.5 mm for P20 and Imager 5016).
A few important observations should be pointed out. The first one is that applying the estimated CPs again succeeded in improving the point cloud quality (lower dispersion of the differences and central tendency closer to zero), even in the case of recently factory-calibrated instruments (the Leica ScanStation P50 and ZF Imager 5016 were calibrated a few months prior to the experiments). This indicates that the estimated CPs can be used a posteriori on unrelated objects to increase the measurement accuracy. To the authors’ knowledge, this is the first time in the literature that such results are presented for user calibration of TLSs.
The second observation is that the point cloud improvement is notably lower in comparison to the in situ case. For example, MAD is now reduced from a minimum of 28% to a maximum of 53%, which is evidently lower. The strong remaining systematic trend can still be observed in the case of Leica ScanStation P50 measurements, causing a bimodal distribution of the point cloud differences, even after the calibration. This systematic trend is likely caused by the insufficiently compensated influence of the two-face sensitive CPs, primarily the mirror tilt CP ( x 6 ). The reason for this presumption is an abrupt change in the sign of the visible systematic trend in the point cloud differences (Figure 5, top), which appears on the location where the parts of the wall measured in the front and in the back of the instrument meet. This deterioration in the point cloud quality improvement is not completely surprising, as the measurements took place with different time offsets with respect to the calibration, and the temporal stability of the CPs was already questioned in the literature [8,17,57].
Finally, we can deduce that the estimated CPs can notably improve the point cloud quality, both in indoor and outdoor applications, where the improvement was higher in the case of the indoor scenes. However, this is likely caused by the temporal instability of the CPs rather than the different scenes. Namely, the derived CPs are based on the mechanical working principle of TLSs, and as such they are universally applicable (Section 2.1.1).
Therefore, it can be concluded that the implemented calibration field can deliver the CPs that improve the measurement quality, even in the a posteriori application. However, it is necessary to further investigate the stability of the CPs to use them in high-accuracy-demanding tasks, such as deformation monitoring. First, it is necessary to correctly quantify the uncertainty based on their temporal stability. Second, the physical causes for their instability should be investigated to mitigate these effects through the application of the eventual correction models or appropriate measurement strategies.

4. Conclusions

Within this study, we designed a cost-efficient TLS calibration field for the comprehensive target-based self-calibration of panoramic TLSs. The design was based on the discussed optimization goals and simulation experiments, and it was implemented in reality to empirically validate its feasibility. We successfully calibrated a wide range of TLSs, reaching in situ improvement in observation residuals comparable to previous studies (on average 28%, 60%, and 50% for ranges, horizontal, and vertical angles), with a notably reduced number of observations using only 14 targets. These results demonstrate that implementation of our workflow and the optimization goals can be used to derive further cost-efficient calibration fields.
In the calibration experiments, all of the adopted calibration parameters were found to be significant (at least once), stressing the importance of a comprehensive TLS calibration. Additionally, we demonstrated that the a posteriori estimated standard deviations represent the precision of the calibration parameters well in reality. We notably improved the point cloud quality of manufacturer-calibrated high-end TLSs, even with brand new instruments (Leica P50, Imager 5016). Thus, we can confirm that the implemented calibration field can indeed be used to obtain the reference solutions for further development of in situ calibration approaches.
Finally, we demonstrated a point cloud quality improvement based on a posteriori application of estimated calibration parameters on the measurements of an unrelated object. Our results suggest that in the future, it is necessary to further investigate the temporal stability of the estimated calibration parameters. Eventually, time-dependent correction models could account for this parameter variability. Alternatively, the combination of well-designed calibration fields, as introduced in this study, and in situ calibration strategies accounting for the temporal variability of some calibration parameters might lead to the most accurate laser scanning product.

Author Contributions

T.M. conceived, designed, and performed the experiments. T.M. and C.H. analyzed the data and drafted the manuscript. H.K. provided the resources and gave specific input for the analysis. All authors have read and agreed to the published version of the manuscript.

Funding

This research received no external funding.

Conflicts of Interest

The authors declare no conflict of interest.

Appendix A

Table A1. Targets and scanner station coordinates of the simulated calibration field.
Target #X [m]Y [m]Z [m]Target #X [m]Y [m]Z [m]
122.0516.257.611025.0317.051.41
222.0217.697.62113.3427.607.43
33.3116.197.32123.326.397.46
43.3217.637.311322.0427.617.48
50.3416.741.401422.026.397.44
60.3317.051.41StationX [m]Y [m]Z [m]
76.3216.441.43S122.0416.971.40
86.3117.431.39S23.3116.931.41
925.0416.761.43

References

  1. Mukupa, W.; Roberts, G.W.; Hancock, C.M.; Al-Manasir, K. A review of the use of terrestrial laser scanning application for change detection and deformation monitoring of structures. Surv. Rev. 2017, 49, 99–116. [Google Scholar] [CrossRef]
  2. Bianculli, D.; Humphries, D.; Berkeley, L. Application of terrestrial laser scanner in particle accelerator and reverse engineering solutions. In Proceedings of the 14th International Workshop Accelerator Alignment, Grenoble, France, 3–7 October 2016. [Google Scholar]
  3. Chow, J.C.K.; Lichti, D.D.; Glennie, C.; Hartzell, P. Improvements to and comparison of static terrestrial LiDAR self-calibration methods. Sensors 2013, 13, 7224–7249. [Google Scholar] [CrossRef] [Green Version]
  4. Gielsdorf, F.; Rietdorf, A.; Gruendig, L. A Concept for the Calibration of Terrestrial Laser Scanners. In Proceedings of the FIG Working Week, Athens, Greece, 22–27 May 2004; pp. 1–10. [Google Scholar]
  5. Bae, K.; Lichti, D.D. On-site self-calibration using planar features for terrestrial laser scanners. Int. Arch. Photogramm. Remote Sens. Spat. Inf. Sci 2007, 36, 14–19. [Google Scholar]
  6. Chan, T.O.; Lichti, D.D. Cylinder-Based Self-Calibration of a Panoramic Terrestrial Laser Scanner. Int. Arch. Photogramm. Remote Sens. Spat. Inf. Sci. 2012, XXXIX, 169–174. [Google Scholar] [CrossRef] [Green Version]
  7. Holst, C.; Medić, T.; Kuhlmann, H. Dealing with systematic laser scanner errors due to misalignment at area-based deformation analyses. J. Appl. Geod. 2018, 12, 169–185. [Google Scholar] [CrossRef]
  8. Lichti, D.D. Error modelling, calibration and analysis of an AM-CW terrestrial laser scanner system. ISPRS J. Photogramm. Remote Sens. 2007, 61, 307–324. [Google Scholar] [CrossRef]
  9. Reshetyuk, Y. Self-Calibration and Direct Georeferencing in Terrestrial Laser Scanning; KTH Stockholm: Stockholm, Sweden, 2009. [Google Scholar]
  10. Abbas, M.A.; Lichti, D.D.; Chong, A.K.; Setan, H.; Majid, Z. An on-site approach for the self-calibration of terrestrial laser scanner. Measurement 2014, 52, 111–123. [Google Scholar] [CrossRef]
  11. Lerma, J.L.; García-San-Miguel, D. Self-calibration of terrestrial laser scanners: Selection of the best geometric additional parameters. ISPRS Ann. Photogramm. Remote Sens. Spat. Inf. Sci. 2014, II-5, 219–226. [Google Scholar] [CrossRef] [Green Version]
  12. Neitzel, F. Investigation of Axes Errors of Terrestrial Laser Scanners. In Proceedings of the 5th International Symposium Turkish-German Joint Geodetic Days, Berlin, Germany, 28–31 March 2006. [Google Scholar]
  13. Wang, L.; Muralikrishnan, B.; Rachakonda, P.; Sawyer, D. Determining geometric error model parameters of a terrestrial laser scanner through two-face, length-consistency, and network methods. Meas. Sci. Technol. 2017, 28, 065016. [Google Scholar] [CrossRef]
  14. Muralikrishnan, B.; Wang, L.; Rachakonda, P.; Sawyer, D. Terrestrial laser scanner geometric error model parameter correlations in the Two-face, Length-consistency, and Network methods of self-calibration. Precis. Eng. 2018, 52, 15–29. [Google Scholar] [CrossRef]
  15. Medić, T.; Kuhlmann, H.; Holst, C. Automatic in-situ self-calibration of a panoramic TLS from a single station using 2D keypoints. In ISPRS Annals of the Photogrammetry, Remote Sensing and Spatial Information Sciences; ISPRS: Enschede, The Netherlands, 2019. [Google Scholar]
  16. Li, X.; Li, Y.; Xie, X.; Xu, L. Terrestrial Laser Scanner Autonomous Self-Calibration with No Prior Knowledge of Point-Clouds. IEEE Sens. J. 2018, 18, 9277–9285. [Google Scholar] [CrossRef]
  17. Garcia-San-Miguel, D.; Lerma, J.L. Geometric calibration of a terrestrial laser scanner with local additional parameters: An automatic strategy. ISPRS J. Photogramm. Remote Sens. 2013, 79, 122–136. [Google Scholar] [CrossRef]
  18. Lichti, D.D. Terrestrial laser scanner self-calibration: Correlation sources and their mitigation. ISPRS J. Photogramm. Remote Sens. 2010, 65, 93–102. [Google Scholar] [CrossRef]
  19. Lichti, D.D.; Chow, J.; Lahamy, H. Parameter de-correlation and model-identification in hybrid-style terrestrial laser scanner self-calibration. ISPRS J. Photogramm. Remote Sens. 2011, 66, 317–326. [Google Scholar] [CrossRef]
  20. Medić, T.; Kuhlmann, H.; Holst, C. Sensitivity Analysis and Minimal Measurement Geometry for the Target-Based Calibration of High-End Panoramic Terrestrial Laser Scanners. Remote Sens. 2019, 11, 1519. [Google Scholar] [CrossRef] [Green Version]
  21. Muralikrishnan, B.; Ferrucci, M.; Sawyer, D.; Gerner, G.; Lee, V.; Blackburn, C.; Phillips, S.; Petrov, P.; Yakovlev, Y.; Astrelin, A.; et al. Volumetric performance evaluation of a laser scanner based on geometric error model. Precis. Eng. 2015, 40, 139–150. [Google Scholar] [CrossRef]
  22. Chan, T.O.; Lichti, D.D.; Belton, D. A rigorous cylinder-based self-calibration approach for terrestrial laser scanners. ISPRS J. Photogramm. Remote Sens. 2015, 99, 84–99. [Google Scholar] [CrossRef]
  23. Chow, J.C.K.; Teskey, W.F.; Lovse, J.W. In-situ Self-calibration of Terrestrial Laser Scanners and Deformation Analysis Using Both Signalized Targets and Intersection of Planes for Indoor Applications. In Proceedings of the 14th FIG Symposium on Deformation Measurements and Analysis, Hong Kong, China, 2–4 November 2011. [Google Scholar]
  24. Chow, J.C.K.; Lichti, D.D.; Glennie, C. Point-based versus plane-based self-calibration of static terrestrial laser scanners. Int. Arch. Photogramm. Remote Sens. Spat. Inf. Sci. 2011, 38, 121–126. [Google Scholar] [CrossRef] [Green Version]
  25. Abbas, M.A.; Lichti, D.D.; Chong, A.K.; Setan, H.; Majid, Z.; Lau, C.L.; Idris, K.M.; Ariff, M.F.M. Improvements to the accuracy of prototype ship models measurement method using terrestrial laser scanner. Meas. J. Int. Meas. Confed. 2017, 100, 301–310. [Google Scholar] [CrossRef]
  26. Lichti, D.D.; Chow, J.C.K. Inner Constraints for Planar Features. Photogramm. Rec. 2013, 28, 74–85. [Google Scholar] [CrossRef]
  27. Ge, X. Terrestrial Laser Scanning Technology from Calibration to Registration with Respect to Deformation Monitoring; Technical University of Munich: Munich, Germany, 2016. [Google Scholar]
  28. Medić, T.; Holst, C.; Kuhlmann, H. Towards System Calibration of Panoramic Laser Scanners from a Single Station. Sensors 2017, 17, 1145. [Google Scholar] [CrossRef] [Green Version]
  29. Lichti, D.D. The impact of angle parameterisation on terrestrial laser scanner self-calibration. Int. Arch. Photogramm. Remote Sens. Spat. Inf. Sci 2009, 38, 171–176. [Google Scholar]
  30. Medić, T.; Holst, C.; Kuhlmann, H. Improving the results of terrestrial laser scanner calibration by an optimized calibration process. In Photogrammetrie Laserscanning Optische 3DMesstechnik—Beiträge der Oldenburger 3D-Tage; Wichmann Verlag: Oldenburg/Berlin, Germany, 2019; pp. 36–50. [Google Scholar]
  31. Parian, J.A. Sensor Modeling, Calibration and Point Positioning with Terrestrial Panoramic Cameras; Inst. für Geodäsie und Photogrammetrie: Zürich, Switzerland, 2007; p. 121. [Google Scholar]
  32. Holst, C.; Kuhlmann, H. Aiming at self-calibration of terrestrial laser scanners using only one single object and one single scan. J. Appl. Geod. 2014, 8, 295–310. [Google Scholar] [CrossRef]
  33. Muralikrishnan, B.; Rachakonda, P.; Shilling, M.; Lee, V.; Blackburn, C.; Sawyer, D.; Cheok, G.; Cournoyer, L. Report on the May 2016 ASTM E57.02 Instrument Runoff at NIST, Part 1—Background Information and Key Findings; US Department of Commerce, National Institute of Standards and Technology: Washington, DC, USA, 2016. [Google Scholar] [CrossRef]
  34. Walsh, G. Leica ScanStation P-Series—Details that matter. Leica ScanStation—White Paper. Available online: http://blog.hexagongeosystems.com/wp-content/uploads/2015/12/Leica_ScanStation_P-Series_details_that_matter_white_paper_en-4.pdf (accessed on 21 May 2019).
  35. Schofield, W.; Breach, M. Engineering Surveying, 6th ed.; Elsevier: Oxford, UK, 2007; ISBN 9780750669498. [Google Scholar]
  36. Förstner, W.; Wrobel, B.P. Photogrammetric Computer Vision; Springer International Publishing: Cham, Switzerland, 2016; ISBN 9783319115498. [Google Scholar]
  37. Medić, T.; Holst, C.; Janßen, J.; Kuhlmann, H. Empirical stochastic model of detected target centroids: Influence on registration and calibration of terrestrial laser scanners. J. Appl. Geod. 2019. [Google Scholar] [CrossRef]
  38. Kuang, S. Geodetic Network Analysis and Optimal Design: Concepts and Applications; Ann Arbor Press: Chelsea, UK, 1996. [Google Scholar]
  39. Grafarend, E.W.; Sanso, F. Optimization and Design of Geodetic Networks, 1st ed.; Springer: Berlin/Heidelberg, Germany, 1985; ISBN 9783642706615. [Google Scholar]
  40. Saleh, H.A.; Chelouah, R. The design of the global navigation satellite system surveying networks using genetic algorithms. Eng. Appl. Artif. Intell. 2004, 17, 111–122. [Google Scholar] [CrossRef]
  41. Baselga, S. Second order design of geodetic networks by the simulated annealing method. J. Surv. Eng. 2011, 137, 167–173. [Google Scholar] [CrossRef] [Green Version]
  42. Niemeier, W. Ausgleichungsrechnung: Statistische Auswertemethoden; Walter de Gruyter: Berlin, Germany, 2008; ISBN 3110206781. [Google Scholar]
  43. Abbas, M.A.; Setan, H.; Majid, Z.; Idris, K.M.; Chong, A.K.; Lichti, D.D. The Effect of Datum Constraints for Terrestrial Laser Scanner Self-Calibration The Effect of Datum Constraints for Terrestrial Laser Scanners Self-Calibration. In Proceedings of the FIG Congress 2014, Kuala Lumpur, Malaysia, 16–21 June 2014. [Google Scholar]
  44. Abbas, M.A.; Setan, H.; Majid, Z.; Chong, A.K.; Lichti, D.D. Improvement in measurement accuracy for hybrid scanner. IOP Conf. Ser. Earth Environ. Sci. 2014, 18, 012066. [Google Scholar] [CrossRef] [Green Version]
  45. Jia, F.; Lichti, D.D. An Efficient, Hierarchical Viewpoint Planning Strategy for Terrestrial Laser Scanner Networks. ISPRS Ann. Photogramm. Remote Sens. Spat. Inf. Sci. 2018, 4. [Google Scholar] [CrossRef] [Green Version]
  46. Soudarissanane, S.; Lindenbergh, R. Optimizing Terrestrial Laser Scanning Measurement Set-Up. ISPRS Int. Arch. Photogramm. Remote Sens. Spat. Inf. Sci. 2012, XXXVIII-5, 127–132. [Google Scholar] [CrossRef] [Green Version]
  47. Díaz-Vilariño, L.; Frías, E.; Balado, J.; González-Jorge, H. SCAN Planning and Route Optimization for Control of Execution of As-Designed Bim. Int. Arch. Photogramm. Remote Sens. Spat. Inf. Sci. 2018, XLII-4, 143–148. [Google Scholar]
  48. Jia, F.; Lichti, D. A comparison of simulated annealing, genetic algorithm and particle swarm optimization in optimal first-order design of indoor TLS networks. ISPRS Ann. Photogramm. Remote Sens. Spat. Inf. Sci. 2017, 4, 75–82. [Google Scholar] [CrossRef] [Green Version]
  49. Amiri-Simkooei, A.R.; Asgari, J.; Zangeneh-Nejad, F.; Zaminpardaz, S. Basic Concepts of Optimization and Design of Geodetic Networks. J. Surv. Eng. 2012, 138, 172–183. [Google Scholar] [CrossRef] [Green Version]
  50. González-Aguilera, D.; Rodríguez-Gonzálvez, P.; Armesto, J.; Arias, P. Trimble GX200 and Riegl LMS-Z390i sensor self-calibration. Opt. Express 2011, 19, 2676–2693. [Google Scholar] [CrossRef]
  51. Baarda, W. A Testing Procedure for Use in Geodetic Networks. Netherlands Geod. Comm. 1968, 2, 64–71. [Google Scholar]
  52. Baarda, W. Statistical Concepts in Geodesy’, Netherlands Geod; Commission New Series; Publications on Geodesy: Waltman, The Netherlands, 1967; Volume 2. [Google Scholar]
  53. Heinz, E.; Eling, C.; Wieland, M.; Klingbeil, L.; Kuhlmann, H. Analysis of different reference plane setups for the calibration of a mobile laser scanning system. In Proceedings of the Internationalen Ingenieurvermessungskurs, Graz, Austria, 17–20 April 2017; pp. 25–29. [Google Scholar]
  54. Langley, R.B. Dilution of precision. GPS World 1999, 10, 52–59. [Google Scholar]
  55. Janßen, J.; Medić, T.; Kuhlmann, H.; Holst, C. Decreasing the uncertainty of the target centre estimation at terrestrial laser scanning by choosing the best algorithm and by improving the target design. Remote Sens. 2019, 11, 845. [Google Scholar] [CrossRef] [Green Version]
  56. Schwintzer, P. Zur Bestimmung der Signifikanten Parameter in Approximationsfunktionen. Inst. für Geodäsie der UniBW München München, Ger. 1984, 10, 71–91. [Google Scholar]
  57. Chow, J.C.K.; Lichti, D.D.; Teskey, W.F.; Key, C. Accuracy assessment of the FARO Focus 3D and Leica HDS6100 panoramic-type terrestrial laser scanners through point-based and plane-based user self-calibration. In Proceedings of the FIG Working Week: Knowing to Manage the Territory, Protect the Environment, Evaluate the Cultural Heritage, Rome, Italy, 6–10 May 2012. [Google Scholar]
  58. Lague, D.; Brodu, N.; Leroux, J. Accurate 3D comparison of complex topography with terrestrial laser scanner: Application to the Rangitikei canyon (NZ). ISPRS J. Photogramm. Remote Sens. 2013, 82, 10–26. [Google Scholar] [CrossRef] [Green Version]
  59. Mikhail, E.W. Observations and Least Squares; IEP Don-Donnelley: New York, NY, USA, 1976. [Google Scholar]
  60. Nocerino, E.; Menna, F.; Remondino, F.; Toschi, I.; Rodríguez-Gonzálvez, P. Investigation of indoor and outdoor performance of two portable mobile mapping systems. In Videometrics, Range Imaging, and Applications XIV; SPIE: Munich, Germany, 2017; Volume 10332, p. 103320I. [Google Scholar]
  61. Toschi, I.; Rodríguez-Gonzálvez, P.; Remondino, F.; Minto, S.; Orlandini, S.; Fuller, A. Accuracy evaluation of a mobile mapping system with advanced statistical methods. Int. Arch. Photogramm. Remote Sens. Spat. Inf. Sci. 2015, 40, 245. [Google Scholar] [CrossRef] [Green Version]
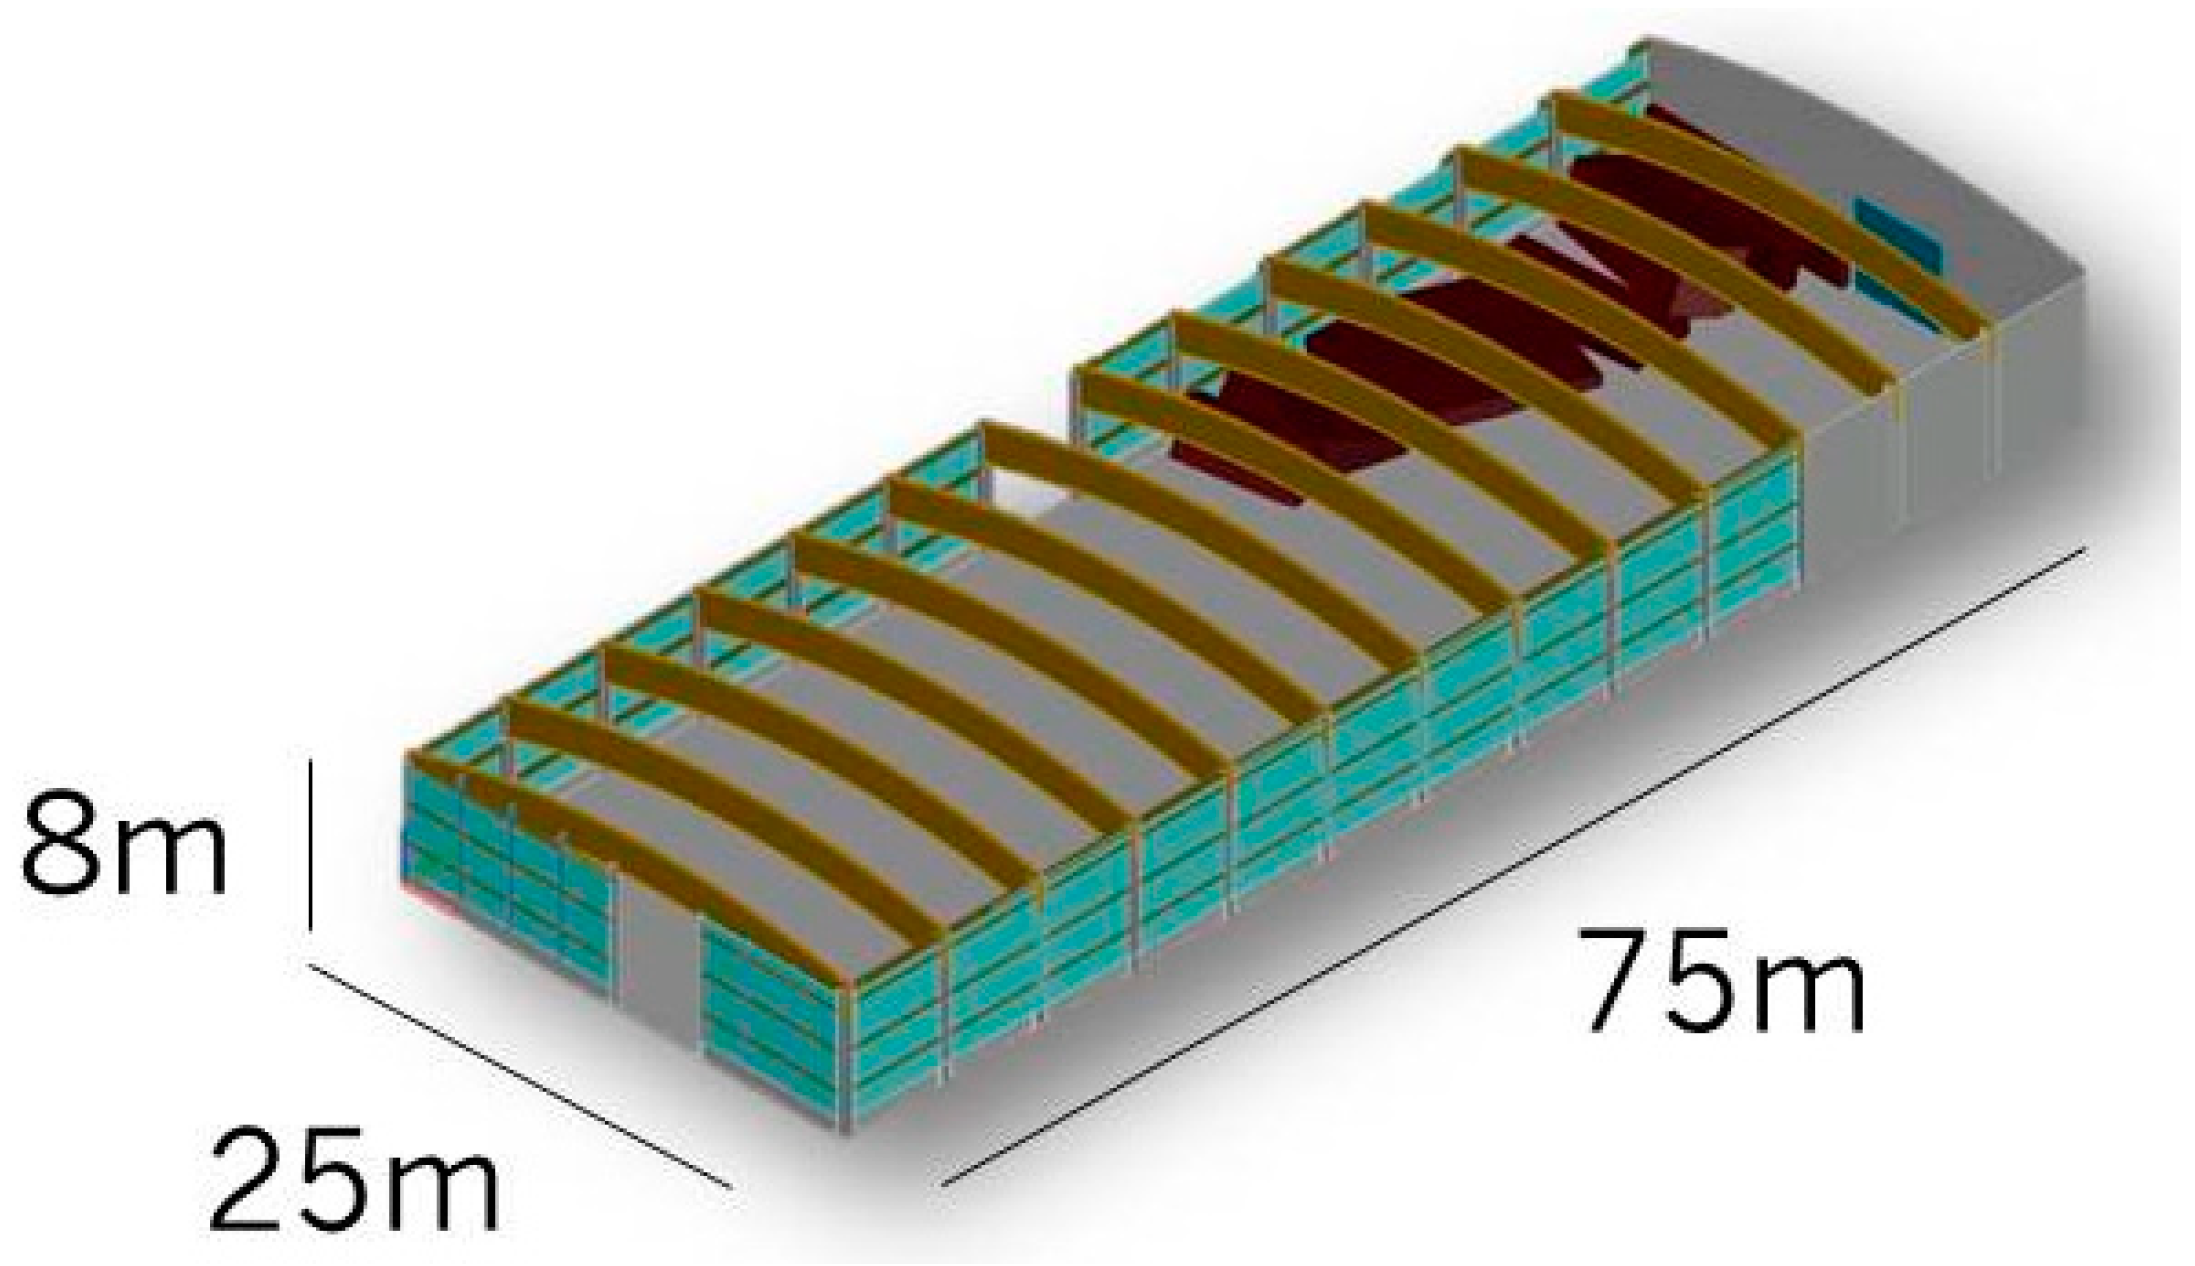
Figure 1. The 3D model of the machine hall used for the calibration field implementation.
Remotesensing 12 00015 g001
Figure 2. The calibration field design with a total of 14 targets (Appendix A, scanner stations S1 and S2; red frames—targets necessary for minimum measurement geometry; blue frames—additional targets at higher elevation).
Remotesensing 12 00015 g002
Figure 3. In situ calibration point cloud improvement. Point cloud differences (M3C2) between 1st and 2nd scans of two-face measurements, before (top) and after (bottom) applying the calibration parameters (from left to right for Leica ScanStation P50, P20, and Z+F Imager 5016 instruments). Color values are analogous to the values presented in Figure 4 (green, no difference; blue, negative; red, positive).
Remotesensing 12 00015 g003
Figure 4. In situ calibration point cloud improvement. Histograms of the point cloud differences (M3C2) between 1st and 2nd scans of two-face measurements, before (top) and after (bottom) applying the calibration parameters (from left to right for Leica ScanStation P50, P20, and Z+F Imager 5016 instruments). The values correspond to the data presented in Figure 3.
Remotesensing 12 00015 g004
Figure 5. A posteriori calibration point cloud improvement. Point cloud differences (M3C2) between 1st and 2nd scans of two-face measurements, before (left) and after (right) applying the calibration parameters (from top to bottom for the Leica ScanStation P50, P20, and Z+F Imager 5016). Color values are analogous to the values presented in Figure 6 (green, no difference; blue, negative; red, positive).
Remotesensing 12 00015 g005
Figure 6. A posteriori calibration point cloud improvement. Histograms of the point cloud differences (M3C2) between 1st and 2nd scans of two-face measurements, before (top) and after (bottom) applying the calibration parameters (from left to right for the Leica ScanStation P50, P20, and Z+F Imager 5016). The values correspond to the data presented in Figure 5.
Remotesensing 12 00015 g006
Table 1. Relevant calibration parameters for high-end terrestrial laser scanners (TLSs).
CPDescription
x1nHorizontal beam offset **
x1zVertical beam offset **
x2Horizontal axis offset
x3Mirror offset
x4Vertical index offset
x5nHorizontal beam tilt
x5zVertical beam tilt **
x6Mirror tilt
x7Horizontal axis error (tilt)
x10Rangefinder offset *
* CPs not sensitive to two-face measurements. ** CPs partially sensitive to two-face measurements.
Table 2. Simulation results of calibration of high-end TLSs with 14 targets (4 scans).
CP x t r u e x ^ σ x ρ x ( m a x ) with x
x 10 [mm]–2.00–1.990.020.39 x 7 0.02
x 2 [mm]–0.20–0.210.01–0.49 x 5 n 0.01
x 3 [mm]–0.20–0.200.00–0.67 x 6 0.01
x 6 [ “ ]–8.00–7.990.050.72 x 5 z 0.06
x 1 z [mm]–0.20–0.200.010.72 x 6 0.02
x 7 [ “ ]8.007.360.470.75 x 5 z 0.46
x 5 z [ “ ]–8.00–8.580.390.75 x 7 0.46
x 1 n [mm]–0.20–0.200.01–0.50 x 5 n 0.01
x 5 n [ “ ]–8.00–7.390.29–0.68 x 4 0.35
x 4 [ “ ]–8.00–8.060.07–0.68 x 5 n 0.10
Table 3. Simulation results for calibration of high-end TLSs with 120 targets (6 scans).
CP x t r u e x ^ σ x ρ x ( m a x ) with x
x 10 [mm]–2.00–2.020.010.05 x 1 n 0.00
x 2 [mm]–0.20–0.200.00–0.28 x 1 n 0.00
x 3 [mm]–0.20–0.200.00–0.70 x 6 0.00
x 6 [ “ ]–8.00–7.970.03–0.70 x 3 0.03
x 1 z [mm]–0.20–0.200.000.53 x 7 0.01
x 7 [ “ ]8.008.070.460.72 x 5 z 0.29
x 5 z [ “ ]–8.00–8.020.350.72 x 7 0.09
x 1 n [mm]–0.20–0.200.00–0.62 x 5 n 0.00
x 5 n [ “ ]–8.00–8.130.29–0.62 x 1 n 0.27
x 4 [ “ ]–8.00–7.920.06–0.06 x 5 z 0.08
Table 4. Simulation results of calibration of non-high-end TLSs with 14 targets (8 scans).
CP x t r u e x ^ σ x ρ x ( m a x ) with x
x 10 [mm]–2.00–1.960.060.41 x 7 0.06
x 2 [mm]–0.20–0.220.03–0.45 x 5 n 0.02
x 3 [mm]–0.20–0.170.02–0.61 x 6 0.04
x 6 [ “ ]–8.00–8.250.190.71 x 1 z 0.31
x 1 z [mm]–0.20–0.190.030.71 x 6 0.10
x 7 [ “ ]8.006.391.960.78 x 5 z 2.03
x 5 z [ “ ]–8.00–10.701.690.78 x 7 1.77
x 1 n [mm]–0.20–0.160.03–0.48 x 5 n 0.03
x 5 n [ “ ]–8.00–9.041.18–0.51 x 4 1.06
x 4 [ “ ]–8.00–7.410.33–0.51 x 5 n 0.64
Table 5. Details of each calibration experiment for six TLSs.
InstrumentP50P20Imager 5016HDS6100Focus3DBLK360
Date16 April 20198 August 201827 May 20197 August 20187 August 20187 August 2018
Duration1 h1 h1 h2 h2 h40 min
Scans #4444**88
Observations #168168168168336336
Two-face m.yesyesyesyesnono
Compensatoryesyesyesnonono
Resolution [mm @ 10 m]1.61.61.61.61.65.0
σ r [mm]1.21.01.02.02.04.0
σ φ   /   θ [ ″ ]8.08.014.426.019.041.0
σ c o m p . [ ″ ]1.51.514.4 - - -
Temperature*17.928.0 16.831.233.133.1
Pressure*996.2991.5990.1989.0988.3988.3
Humidity*42.554.075.031.527.527.5
Note: * Stable within: temp. +/− 0.5 °C, pressure +/− 1.5 hPa, humidity +/− 2.5%; ** 4 instead of 8 scans due to time limitations and availability of two-face measurements.
Table 6. Estimated CPs for all 6 TLSs with the corresponding significance (sgf.).
CPP50P20Imager HDS6100Focus3DBLK360
x ^ sgf. x ^ sgf. x ^ sgf. x ^ sgf. x ^ sgf. x ^ sgf.
x 10 [mm]–0.03N0.58Y0.37Y0.11N0.23Y4.29Y
x 2 [mm]–0.14Y–0.09N0.03N0.03N0.05N0.04N
x 1 z [mm]0.14N–0.23Y0.59Y–0.01N0.87N1.37Y
x 3 [mm]–0.03N0.16Y–0.15N–0.64N–0.28N–0.41N
x 7 [ “ ]–33.50Y3.78N26.49Y–85.77Y122.14Y–16.97N
x 6 [ “ ]3.41Y0.55N0.40N8.00Y10.28Y–19.98Y
x 1 n [mm]0.01N0.08N–0.45Y–0.54N–0.17N0.05N
x 4 [ “ ]4.51Y–6.70Y–6.44Y–8.13Y–57.31Y52.03Y
x 5 n [ “ ]5.38Y–18.05Y12.74N57.07Y–2.51N–20.72Y
x 5 n [ “ ]–16.78Y–2.53N2.66N–64.81Y36.08Y–3.49N
Table 7. Observation residuals in the registration adjustment without applying CPs (no CPs), after applying CPs (CPs), and improvement in observation residuals (%).
P50P20Imager 5016
σ r   [ mm ] σ φ [ ″ ] σ θ   [ ″ ] σ r   [ mm ] σ φ [ ″ ] σ θ [ ″ ] σ r   [ mm ] σ φ   [ ″ ] σ θ   [ ″ ]
no CPs0.1593.7318.360.2826.148.790.1232.074.82
CPs0.0624.721.860.2513.394.470.0617.733.40
%56.7673.6289.8710.8748.7949.2248.9844.7029.50
HDS6100FOCUS 3DBLK360
σ r   [mm] σ φ   [ ″ ] σ θ   [ ″ ] σ r [mm] σ φ   [ ″ ] σ θ   [ ″ ] σ r   [mm] σ φ   [ ″ ] σ θ   [ ″ ]
no CPs0.2784.0217.230.11218.0221.502.1658.0525.40
CPs0.2026.318.880.1070.6011.261.7224.0716.08
%24.2468.6948.455.8767.6247.6020.3458.5336.68
Table 8. Leica ScanStation P50 calibration results for 4 repeated calibrations: estimated CPs for each realization (left), mean CP value and empirical standard deviation of all realizations (middle), mean CP standard deviations, and correlations and impact factors based on the covariance matrix after the adjustment (right).
CP x ^ 1 x ^ 2 x ^ 3 x ^ 4 x ^ m e a n σ E ( x ) σ ^ x ρ x ( m a x ) x
x 10 [mm]–0.160.030.01–0.03–0.040.090.060.370.10
x 2 [mm]–0.12–0.11–0.12–0.14–0.120.010.02–0.230.02
x 1 z [mm]0.080.310.210.140.190.100.070.640.10
x 3 [mm]–0.020–0.06–0.03–0.030.030.05–0.770.08
x 7 [ “ ]–22.35–25.38–26.31–33.5–26.894.722.020.612.66
x 6 [ “ ]4.193.594.113.413.830.380.31–0.770.46
x 1 n [mm]0.070.080.050.010.050.030.05–0.640.07
x 4 [ “ ]4.25.15.174.514.750.470.32–0.700.64
x 5 n [ “ ]4.54.675.625.385.040.541.48–0.701.29
x 5 n [ “ ]–12–14.71–14.33–16.78–14.461.961.070.180.86