Article

A Correlated Multi-Pixel Inversion Approach for Aerosol Remote Sensing

1
Jet Propulsion Laboratory, California Institute of Technology, Pasadena, CA 91109, USA
2
Laboratoire d’Optique Atmosphérique, CNRS/Université Lille-1, 59655 Villeneuve d’Ascq, France
3
Viterbi Faculty of Electrical Engineering, Technion - Israel Institute of Technology, Haifa 32000, Israel
*
Author to whom correspondence should be addressed.
Remote Sens. 2019, 11(7), 746; https://doi.org/10.3390/rs11070746
Submission received: 8 January 2019 / Revised: 2 March 2019 / Accepted: 19 March 2019 / Published: 27 March 2019
(This article belongs to the Special Issue Advances of Remote Sensing Inversion)

Abstract

:
Aerosol retrieval algorithms used in conjunction with remote sensing are subject to ill-posedness. To mitigate non-uniqueness, extra constraints (in addition to observations) are valuable for stabilizing the inversion process. This paper focuses on the imposition of an empirical correlation constraint on the retrieved aerosol parameters. This constraint reflects the empirical dependency between different aerosol parameters, thereby reducing the number of degrees of freedom and enabling accelerated computation of the radiation fields associated with neighboring pixels. A cross-pixel constraint that capitalizes on the smooth spatial variations of aerosol properties was built into the original multi-pixel inversion approach. Here, the spatial smoothness condition is imposed on principal components (PCs) of the aerosol model, and on the corresponding PC weights, where the PCs are used to characterize departures from the mean. Mutual orthogonality and unit length of the PC vectors, as well as zero sum of the PC weights also impose stabilizing constraints on the retrieval. Capitalizing on the dependencies among aerosol parameters and the mutual orthogonality of PCs, a perturbation-based radiative transfer computation scheme is developed. It uses a few dominant PCs to capture the difference in the radiation fields across an imaged area. The approach is tested using 27 observations acquired by the Airborne Multiangle SpectroPolarimetric Imager (AirMSPI) during multiple NASA field campaigns and validated using collocated AERONET observations. In particular, aerosol optical depth, single scattering albedo, aerosol size, and refractive index are compared with AERONET aerosol reference data. Retrieval uncertainty is formulated by accounting for both instrumental errors and the effects of multiple types of constraints.

Graphical Abstract

1. Introduction

Aerosol retrievals performed on remotely-sensed radiometric and polarimetric imagery are subject to non-uniqueness of the solutions and a large computational burden. The former is caused by insufficient information in the observations and the latter is associated with the high dimensionality of the parameter space. To stabilize the inversion process, optimization-based inversions are often informed by extra constraints that supplement the observations. Exploration and application of these constraints are primary tasks in designing a reliable inversion algorithm. A particularly effective physical constraint for remote sensing applications is the so-called smoothness condition (see [1,2,3,4,5]), which takes advantage of the general observation that some quantities (such as ozone vertical distribution and atmospheric temperature profile) vary smoothly in certain dimensions. For aerosols, their loading and properties (e.g., size distribution or spectral real and imaginary refractive index) tend to vary smoothly in the spatial (horizontal and vertical) dimensions, while the underlying surface reflectance tends to vary smoothly in the temporal dimension. Imposition of this type of constraint leads to the “multi-pixel” inversion approach [6]. In this case, many pixels are stably inverted at one time and the dimensionality of the retrieval space is proportional to the number of inverted pixels.
Additional constraints can further reduce the large dimensionality of the parameter space, with the expected benefits of higher stability and accelerated retrievals. In this study, we introduce a “correlation constraint” on the aerosol inversions. This constraint takes advantage of empirical dependencies between different sets of aerosol parameters. The cross-correlation coefficient between a pair of aerosol fields quantifies the degree of correlation—as long as this coefficient is not zero, the aerosol variables are not independent of each other, i.e., they are correlated to some extent. However, development of a sophisticated physical model to parameterize these correlations is intractable due to the complexity of the real physical world. On the other hand, empirical methods, such as principal component analysis (PCA) or empirical orthogonal function (EOF) analysis, can be used to capture phenomenological correlations between aerosol fields. By implementing PCA over a training dataset, the original fields can be transformed to superpositions of a set of mutually orthogonal vectors, or principal components (PCs). Then, the original aerosol fields can be approximately reconstructed using a linear combination of a certain number of PCs, with accuracy dependent on the number of PCs employed.
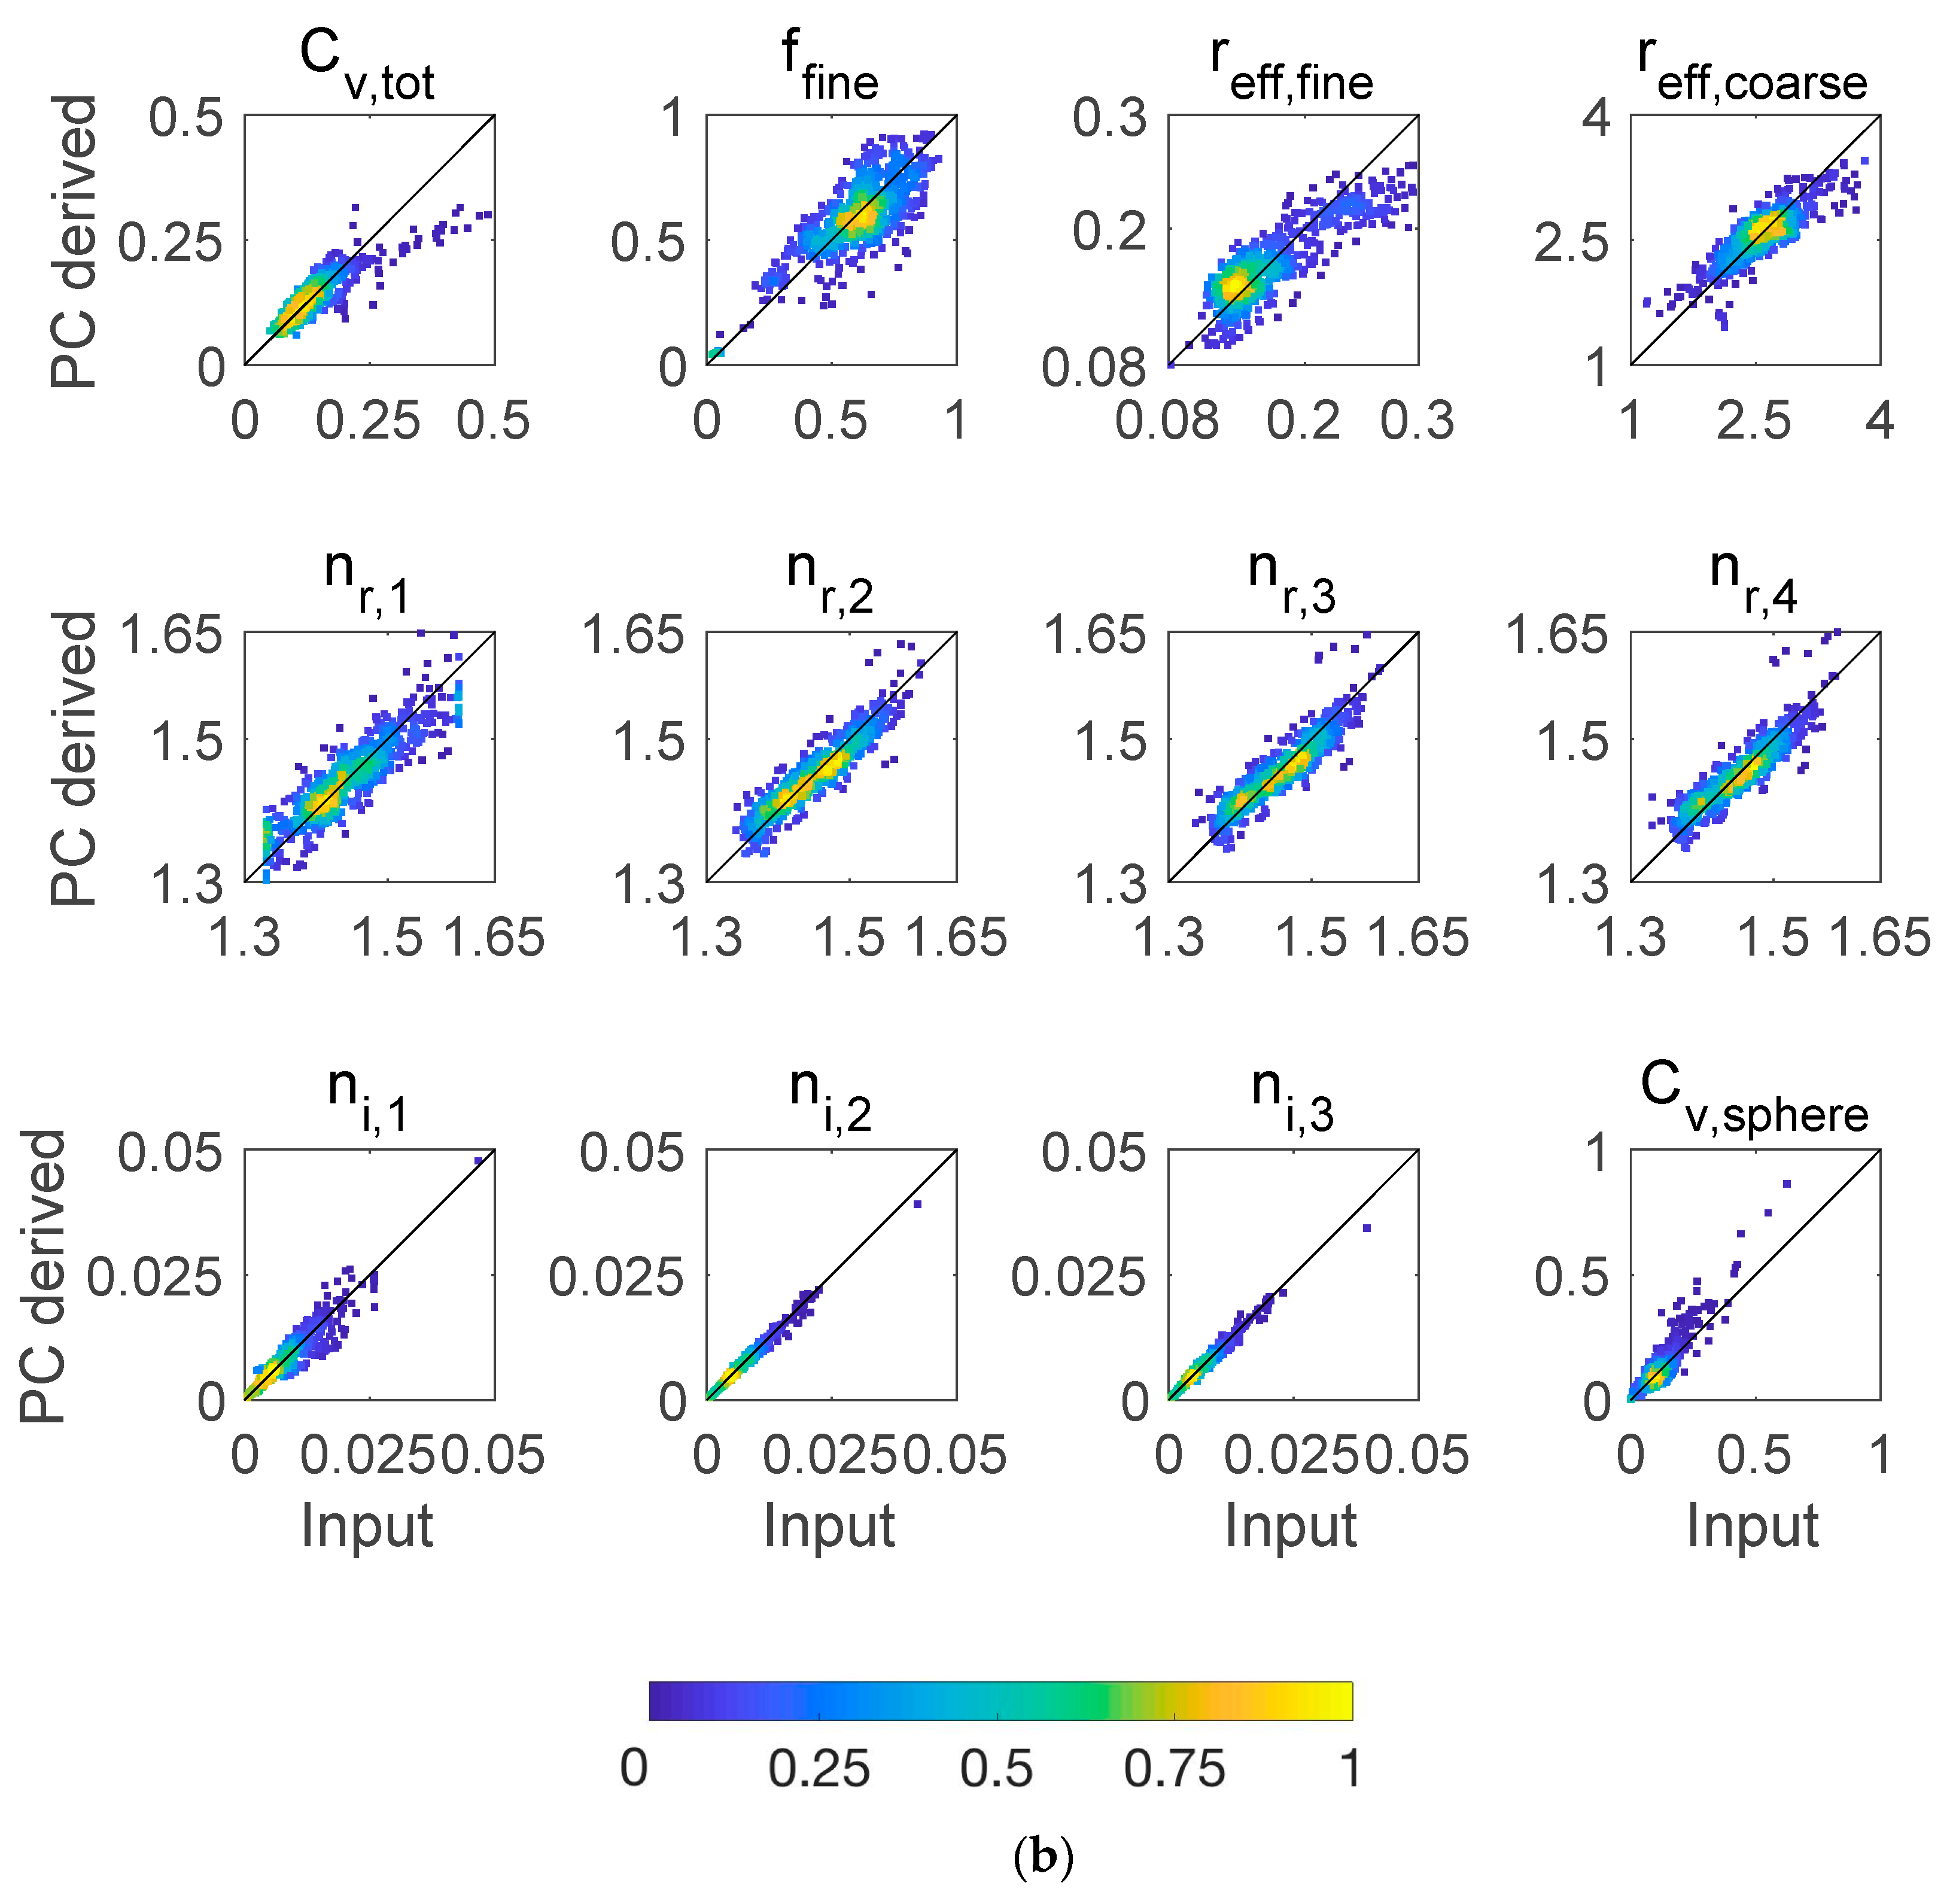
Figure 1 and Figure 2 show a PC analysis of AERONET Level 2 aerosol inversions within a circular domain of diameter 2000 km around the Fresno, California, and Namibe, Angola, sites, respectively. The aerosol fields include total volume concentration, fraction of fine mode particles, effective radii of fine and coarse mode particles, spectral real and imaginary parts of refractive index, and volume concentration of the spherical particles. To generate Figure 1, a total of 691 retrievals from 60 AERONET stations within a circular domain of 2000 km around the AERONET site in Fresno, California, at longitude −119.787° and latitude 36.738° for the years 1994–2018 were used in the PC analysis. For Figure 2, a total of 780 retrievals from 18 AERONET stations within a circular domain of 2000 km around the AERONET site in Namibe, Angola, at longitude 12.178° and latitude −15.159° for the years 2000–2017 were used for the PC analysis. Although there are 13 parameters and the aerosol fields vary both temporally and spatially, a few PCs dominate the variations about the mean. For these two cases, 85–90% of the variance in the aerosol fields is captured by the first four PCs. Corresponding to the AERONET analysis in Figure 1 (Fresno domain), Table 1 lists the mutual correlation coefficients among all 13 parameters. Many different types of parameters show correlation coefficients exceeding ~0.3, and among related parameters, such as real and imaginary part of the refractive index, even stronger correlation is observed. While non-absorbing and weakly absorbing particles are dominant in the Fresno domain (Figure 1), absorbing (smoke) aerosols prevail in the Namibe domain (Figure 2). Nevertheless, mutual correlation among aerosol parameters is found in the latter domain as well, as indicated in Table 2. Moreover, comparison of Table 1 and Table 2 shows dependence of correlation on specific sets of parameters and regions. For example, the correlation between total aerosol concentrations and spherical particle concentration in the 2000 km Fresno region is weaker than that in the Namibe region. The correlation between fine mode aerosol fraction and real part of refractive index, however, is stronger in Fresno region.
This empirical correlation among aerosol parameters motivates reduction of the dimensionality of the retrieval parameter space and acceleration of the radiative transfer (RT) computations. Benefiting from the empirical aerosol correlations and orthogonality of PCs, increased computational efficiency is achieved by developing a PC-based fast multi-pixel RT computation scheme, as described in Section 4. A straightforward way to reduce dimensionality of the retrieval space is to first derive PCs from a training dataset, such that the retrieval problem reduces to determination of the pixel-dependent PC weights. To account for possible errors in the precomputed PCs, the correlation-based inversion should allow adjustment of the elements of the PC vectors. This is not straightforward, as the vector elements vary significantly in magnitude. A methodology for handling this issue is discussed in Section 3.
PCA has been used to significantly accelerate hyperspectral RT computations [7,8,9]. Following a determination of representative components from a training dataset of trace-gas and solar-induced chlorophyll fluorescence, the hyperspectral inversions of these quantities are sped up by retrieving PC weights [10,11,12]. In another retrieval application, Multi-angle Imaging SpectroRadiometer (MISR) operational aerosol retrieval over land uses spatial contrasts to derive PCs of the surface related contribution to the top-of-the-atmosphere (TOA) radiances [13,14]. The similarity in the angular shapes of surface bidirectional reflectance factors among MISR’s four spectral bands in the visible and near-infrared [15] is an example of a prior empirical constraint used to stabilize the aerosol retrievals. In contrast to MISR’s application of PCA to the surface boundary, this paper applies PCA to the aerosol parameters. An optimization approach is developed, which allows both PC vectors and PC weights to be retrieved.
Our retrieval approach is referred to as the “correlated multi-pixel inversion”, where “multi-pixel” reflects that our approach simultaneously uses multiple pixels within image-based measurements (as in the original multi-pixel inversion [6]), while “correlated” captures the extra correlation constraint. In contrast to most optimization approaches that retrieve the individual aerosol fields (see reviews in [16,17]) from multi-spectral radiometric or polarimetric remote sensing observations, we retrieve PC weights and PC vectors of those fields that have spectral, spatial, or temporal correlation with each other, with the purpose of reducing parameter space and improving algorithm efficiency. The individual fields are then constructed from the PC weights and PC vectors. The smoothness constraints on those fields, as implemented in the original “multi-pixel algorithm” used with airborne data at JPL [18,19], are adapted to the current correlated multi-pixel inversion approach. Both “multi-pixel” and “correlated multi-pixel” retrieval approaches utilize a one-dimensional (1D) code based on the independent pixel approximation [20] to ensure forward modeling efficiency.
This paper is organized as follows. Following an algorithm overview in Section 2, the correlated multi-pixel retrieval algorithm and error analysis are formulated in Section 3. A faster forward vector (polarized) RT model for a coupled atmosphere-surface system is presented in Section 4. In Section 5, retrieval tests are performed using 27 datasets acquired by the Airborne Multiangle SpectroPolarimetric Imager (AirMSPI) during multiple NASA field campaigns. A summary is presented in Section 6.

2. General Structure of the Algorithm

The expected advantages of correlated multi-pixel inversion in PC space are two-fold. First, it reduces the number of parameters to be retrieved and utilizes observed correlations as empirical constraints to improve the retrieval efficiency and accuracy. Specifically, the correlated parameter space reduces from N corr × N pixel to ( N PC + 1 ) × N corr + N PC × N pixel , where N pixel , N corr , and N PC are the number of image pixels in the scene, the number of correlated aerosol parameters per pixel, and the number of PC vectors, respectively. Reduction of parameter in conjunction with the imposition of proper constraints is expected to mitigate ill-posedness. Morever, establishment of the PC vectors using ground-based measurements, climatology, or other data sources enables characterization of aerosol properties for which the remote-sensing observations may have insufficient sensitivity (such as aerosol chemical composition or vertical profile).
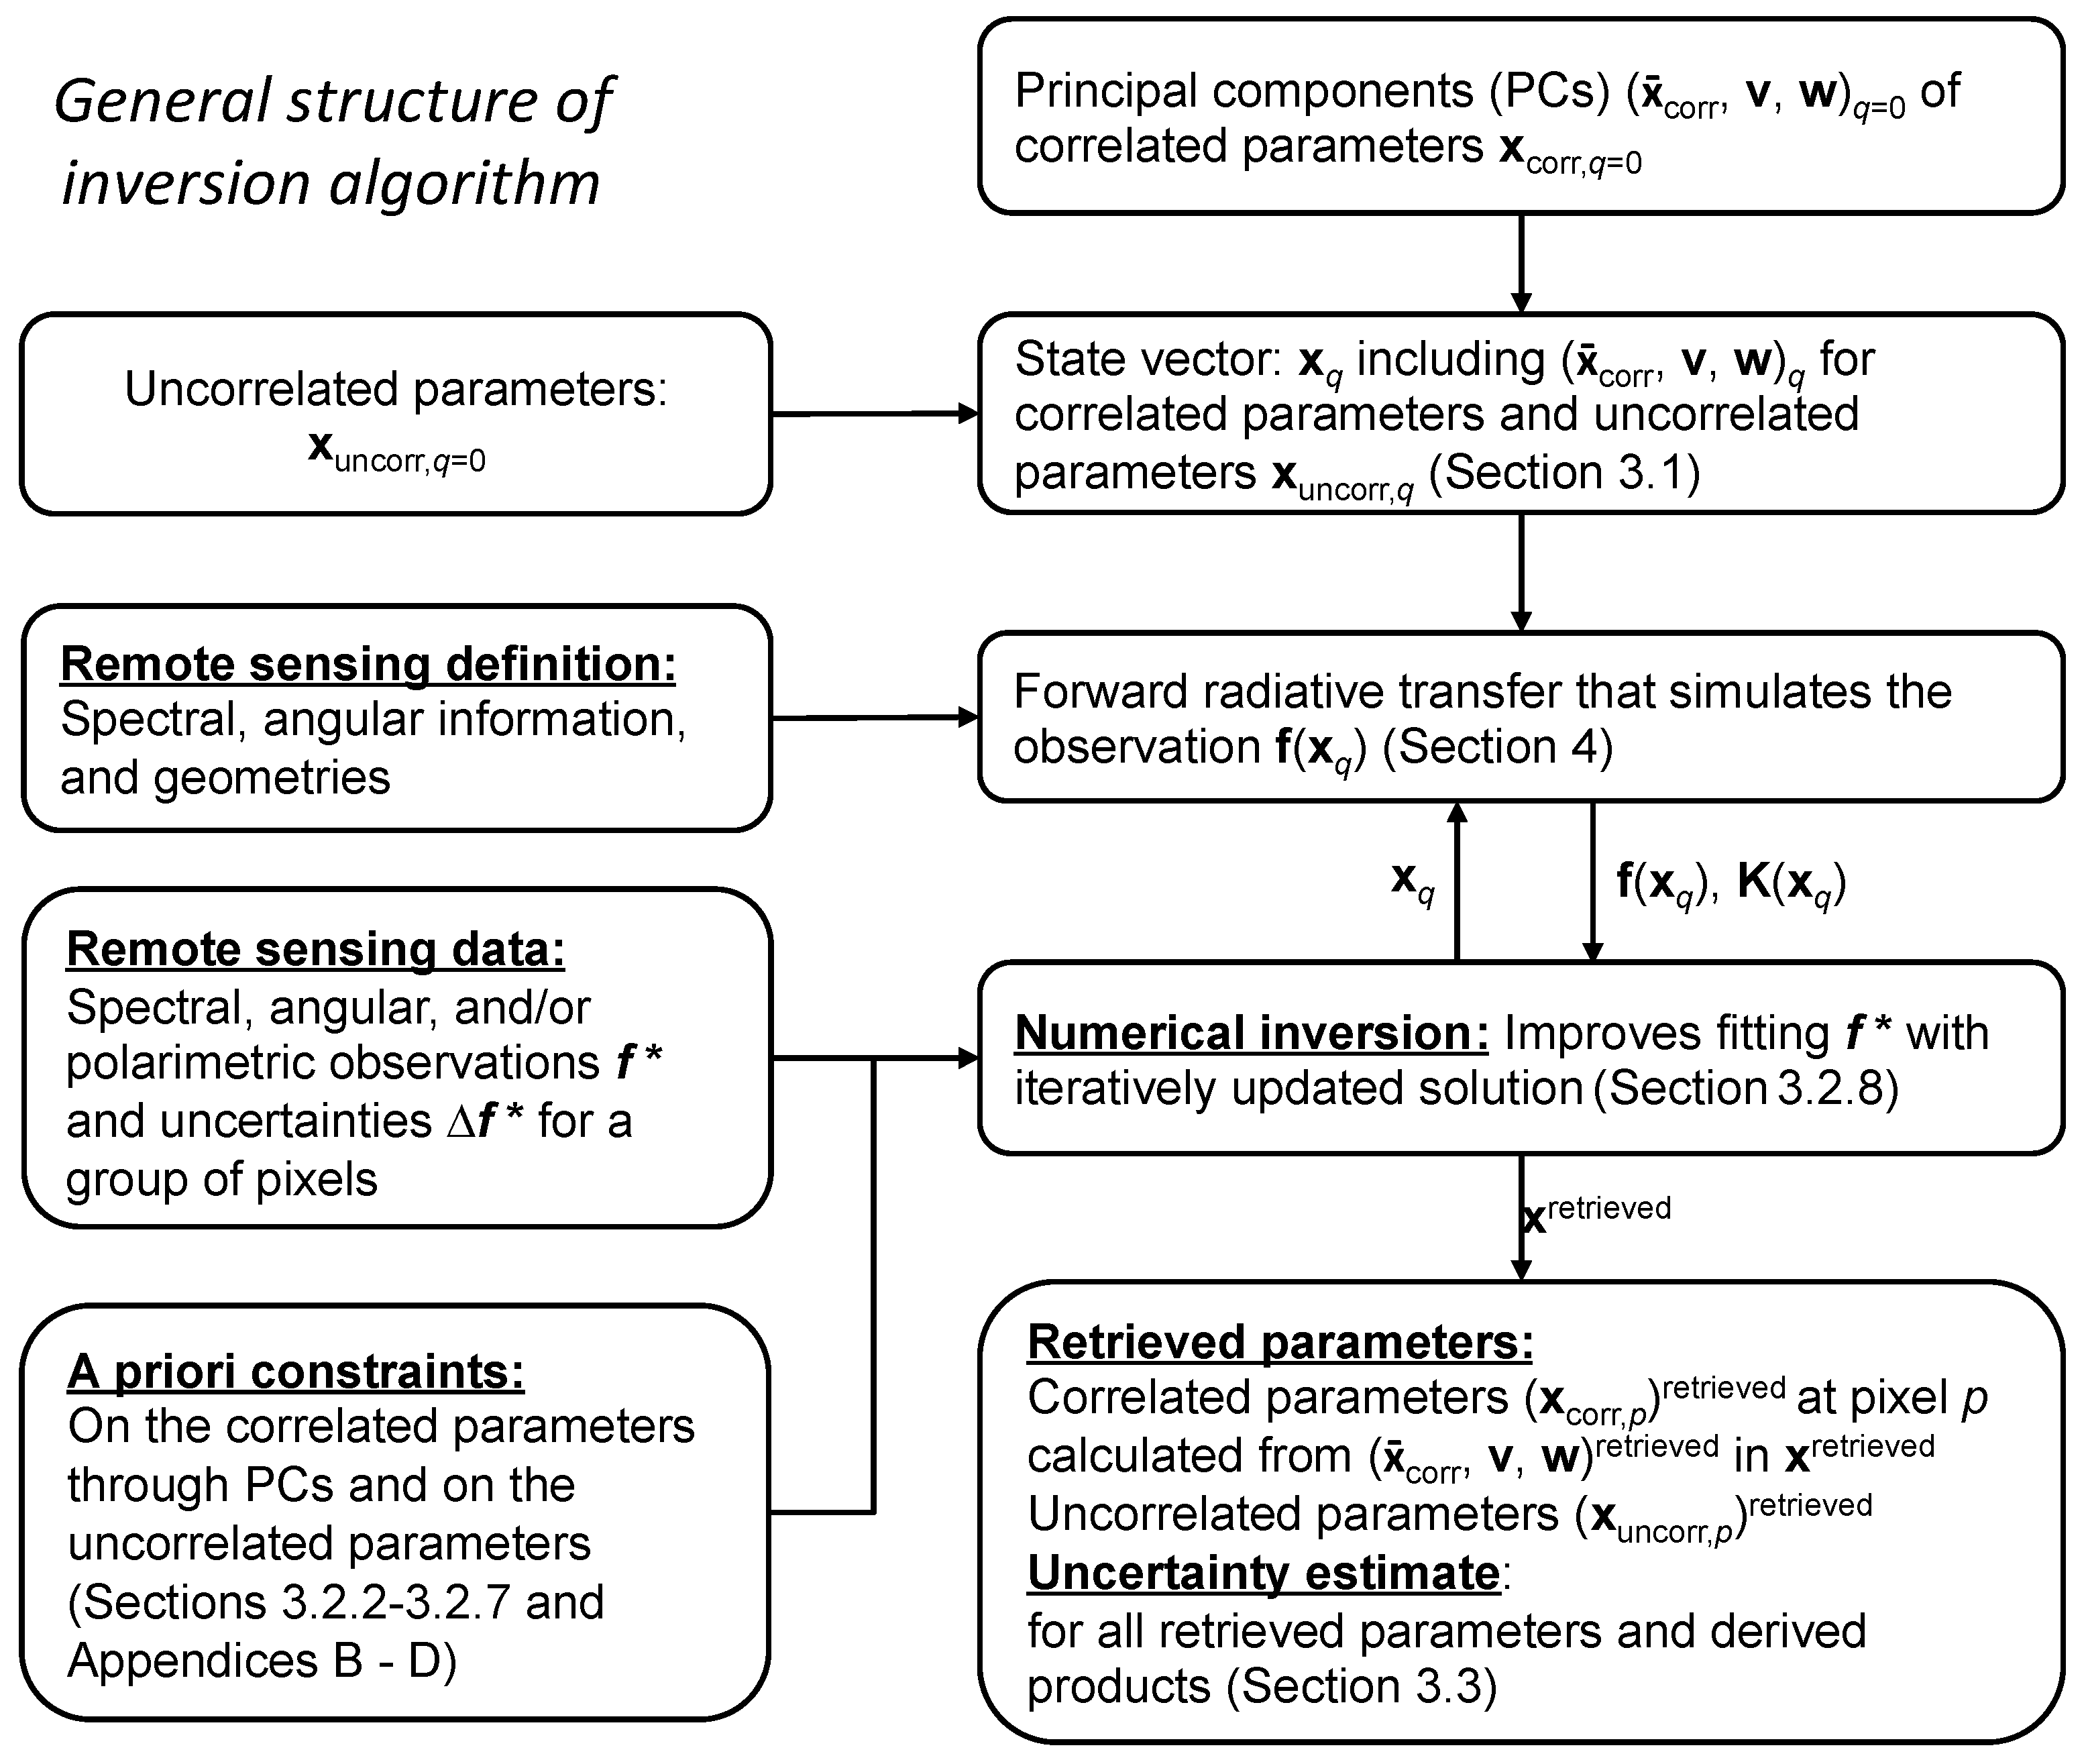
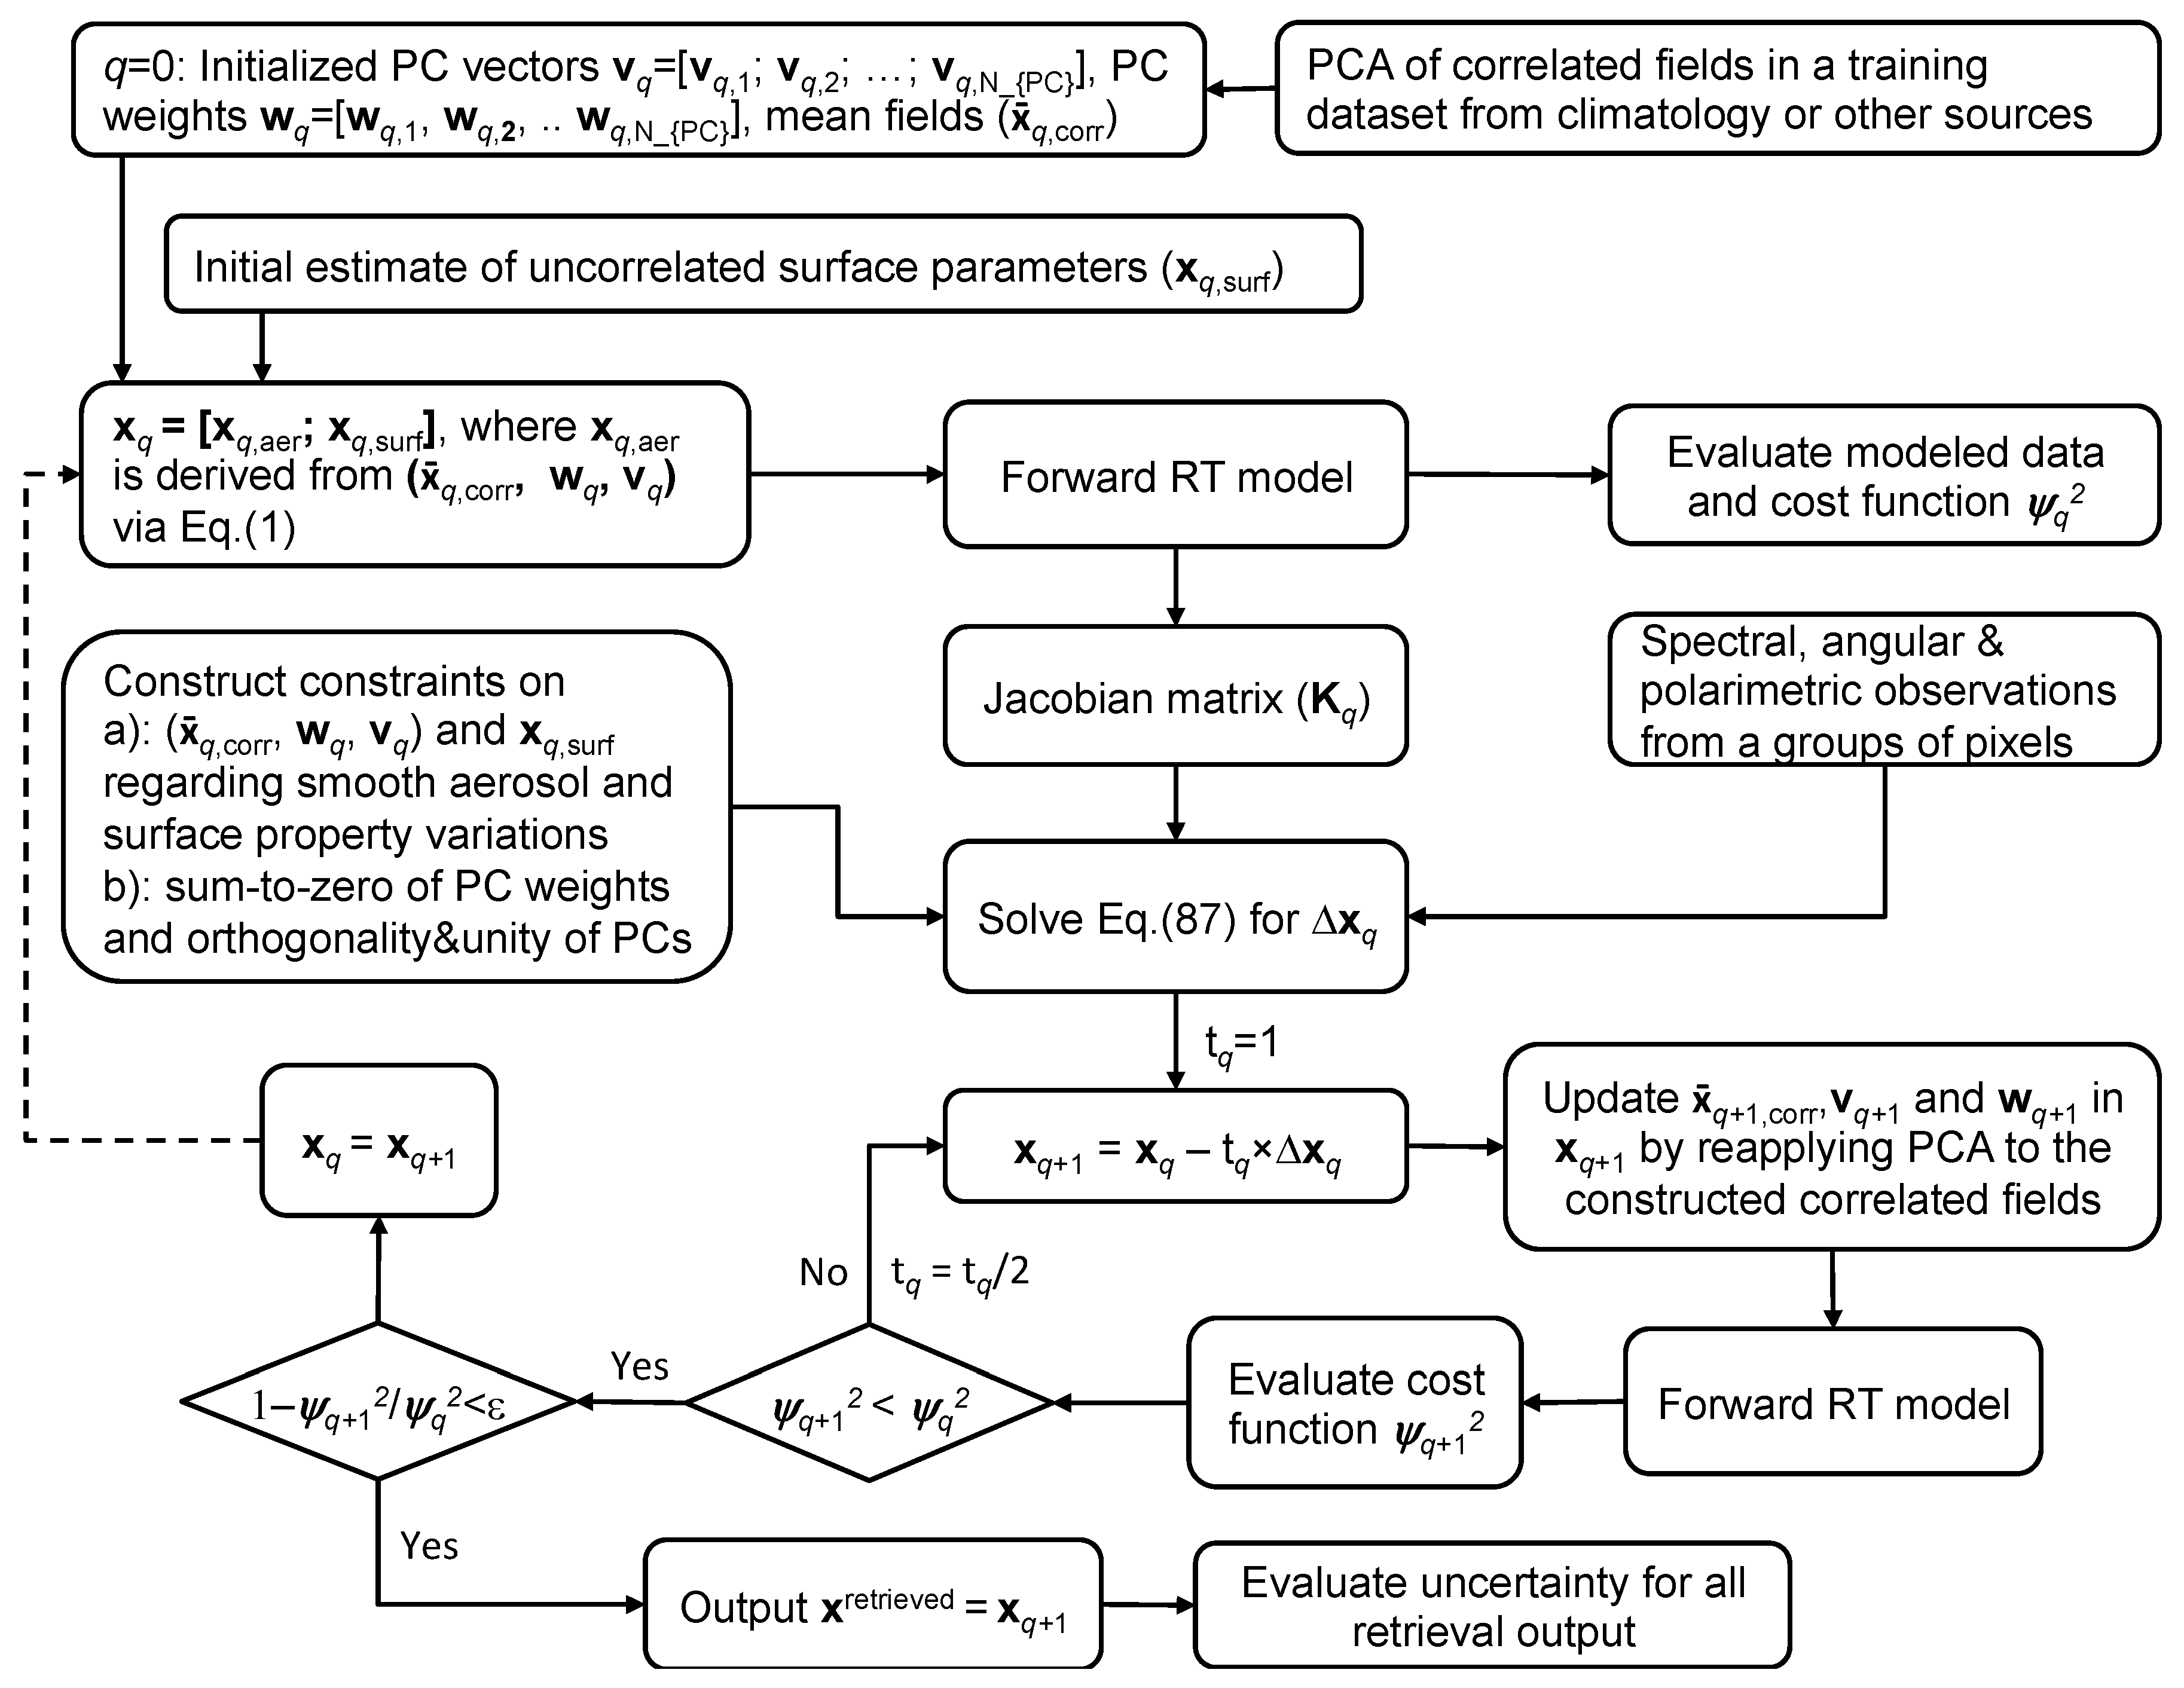
An overview of the correlated multi-pixel approach and its mapping to different sections of this paper is shown in Figure 3. Symbols and abbreviations used in this work are found in Appendix A (Table A1). A training dataset of correlated parameters is used to derive the spatial and temporal mean of correlated parameters over a targeted area, along with PCs of the correlated departures from the mean. Together with the uncorrelated retrieval parameters, a state vector is initialized with elements specified in Section 3.1. In addition to observational constraints provided by the remote-sensing observations used in the retrievals (Section 3.2.1), convergence and robustness retrieval are optimized by imposing additional constraints. For correlated fields, the additional constraints include: (a) the spectral variation of certain correlated fields (e.g., aerosol optical properties); (b) the spatial variation of certain correlated fields across neighboring image pixels; (c) mutual orthogonality and unit length of the PC vectors; and (d) zero sum of the PC weights. Formalisms for imposing these constraints in PC space are provided in Section 3.2.2, Section 3.2.3, Section 3.2.4, Section 3.2.5, Section 3.2.6 and Section 3.2.7 and Appendix C. For any uncorrelated field (such as surface reflectance), constraints on the spectral, spatial, or temporal variations of the associated parameters are handled in the same way as is formulated in the original multi-pixel inversion approach [6] and repeated in Section 3.2.3 and Appendix B. Combining observational and a priori constraints, a system of equations is established at each iteration and then solved to increment the solution (Section 3.2.8) in an inversion process. Error analysis for all retrieved properties is discussed in Section 3.3.
To preserve generality of the approach, we use the symbol x corr in the notations below to denote a column vector containing an arbitrary set of parameters that have correlation with each other. In the specific implementation of the correlated multi-pixel inversion for AirMSPI aerosol remote sensing (Section 5), we specify the correlation to be among aerosol parameters only, while the surface parameters are uncorrelated with each other or with aerosol properties (though in principle these assumptions could be relaxed [21,22,23]). Utilization of the aerosol correlations enables development of a fast PC-RT model for TOA radiance and polarization calculation over a group of pixels (Section 4).
As the retrieval output, the correlated aerosol fields for pixel p ( x corr , p ) are constructed from pixel-resolved PC weights in vector form ( w p ), spatially and temporally effective PC matrix (v), and spatial and temporal mean vector x ¯ corr , namely
x corr , p = x ¯ corr + v × w p
where x ¯ corr is a single column vector and the matrix v is made up of N PC column vectors consisting of correlated aerosol fields, with N PC denoting the number of retrieved principal components. By integrating all PCs into a matrix, we have
v = [ v 1 v 2 v N PC ]
where each PC is composed of N corr elements, i.e.,
v k = [ v k ( 1 ) ; v k ( 2 ) ; ; v k ( N corr ) ]
where “;” indicates that the elements v k ( 1 ) , v k ( 2 ) , … and v k ( N corr ) are vertically arranged into a column vector. We can further define a PC weight matrix w that consists of Npixel columns, namely,
w = [ w 1 w 2 w N pixel ]
where the vector containing PC weights for p-th pixel is
w p = [ w p ( 1 ) ; w p ( 2 ) ; ; w p ( N PC ) ]
The quantities ( x ¯ corr , v, w) are contained in the solution vector x from the last iteration of an inversion process.

3. Inversion

3.1. State Vector

Equations (1)–(5) demonstrate the basic operations for constructing correlated fields from PC weight and PC vectors. We define a state vector x state that includes both correlated and uncorrelated fields. The retrieval parameters are arranged in the following order,
x state = [ x ¯ corr ; v k = 1 ; v k = 2 ;   v k = N PC ;   w p = 1 ; x p = 1 , uncorr ;   w p = 2 ; x p = 2 , uncorr ;   w p = N pixel ; x p = N pixel , uncorr ]
where the mean of aerosol fields takes the form of a column vector
x ¯ corr = [ x ¯ corr , 1 ; x ¯ corr , 2 ;   ; x ¯ corr , N TP , corr ]
and N TP , corr is the total number of types of parameters correlated with others, and each type may have a subset of values. For example, real and imaginary refractive indices are two types of parameters correlated with each other and each of them have a subset of values as a function of wavelength. For the j-th type of correlated parameter with L(j) elements,
x ¯ corr , j = [ x ¯ corr , j ( 1 ) ; x ¯ corr , j ( 2 ) ; x ¯ corr , j ( L ( j ) ) ]
Similarly, an arbitrary ( k th ) PC vector composed of N TP , corr types of correlated parameters can be arranged into the following column vector,
v k = [ v k , 1 ; v k , 2 ; ;   v k , N TP , corr ]
where for the type of correlated parameter with L corr ( j ) elements,
v k , j = [ v k , j ( 1 ) ; v k , j ( 2 ) ; ;   v k , j ( L corr ( j ) ) ]
The PC weight vector for pixel p is
w p = [ w p ( 1 ) ; w p ( 2 ) ; w p ( N PC ) ]
For the state vector with N TP , uncorr types of uncorrelated parameters, we have for an arbitrary pixel p,
x p , uncorr = [ x p , uncorr , 1 ; x p , uncorr , 2 ; ; x p , uncorr , N TP , uncorr ]
where the [ n TP , uncorr ]-th type of uncorrelated parameter has L uncorr ( n TP , uncorr ) elements, namely,
x uncorr , p , n TP , uncorr = [ x uncorr , p , n TP , uncorr ( 1 ) ; x uncorr , p , n TP , uncorr ( 2 ) ; ; x uncorr , p   n TP , uncorr ( L uncorr ( n TP , uncorr ) ) ]

3.2. Constraints

Reduction of parameter space is critical for ensuring inversion efficiency and mitigating ill-posedness of large-scale optimization. Moreover, imposition of various types of constraints is important for stabilizing the retrievals and improving accuracy. The correlated multi-pixel inversion algorithm described here uses a total of ten types of constraints:
  • The first type of constraint, formulated in Section 3.2.1, consists of the observations provided directly by the remote sensing instrument(s).
  • The second type of constraint consists of a priori values for the retrieval parameters, and is described in Section 3.2.2.
  • For the uncorrelated fields (such as surface reflection properties), the pixel-resolved properties x uncorr can be subjected to both across-pixel and within-pixel constraints. Imposition of these types of constraints has been incorporated into the original multi-pixel inversion [6] and is repeated in Section 3.2.3 as well as in Appendix B as the third type of constraint.
  • When a set of parameters (e.g., aerosol properties) are correlated with each other, their mean can be subjected to smoothness constraints. This is referred to as the fourth type of constraint in Section 3.2.3.
  • Transformation of smooth variations of aerosol properties from regular aerosol parameters into the PC space forms the fifth type of constraint, discussed in Section 3.2.4.
  • In PC space, the smoothness constraints can be applied to the PC weights w and vectors v separately. Application to across-pixel weights w, discussed in Section 3.2.3, forms the sixth type of constraint.
  • Similarly, application of the smoothness constraints to certain type of parameters within a PC vector v k , also discussed in Section 3.2.3, forms the seventh type of constraint. Although it appears that the sixth and seventh types of constraints applied to “w” and “v” separately are redundant with the fifth type of constraint that ensures a smooth variation of overall correlated field constructed from PCs; they are helpful when poor initial guesses of “w” and “v” are provided by a training dataset.
  • The eighth type of constraint, formulated in Section 3.2.5, imposes a zero sum of the PC weights.
  • The ninth type of constraint, formulated in Section 3.2.6, imposes mutual orthogonality of the PC vectors.
  • The tenth type of constraint, formulated in Section 3.2.7, imposes unit norm on all PC vectors.
Even with this set of constraints, numerical errors are unavoidable during the iterations. Hence, a post-correction is implemented after each iteration by reapplying PC analysis to the updated PCs. This way the intrinsic properties of PCs are strictly preserved.
With the ten types of constraints (M = 10) introduced above, we now describe the statistical inversion of multi-source (or multi-constraint) data. It involves solving the following system of equations (see [24] for Equations (14)–(20) below):
f i = f i ( x ) + Δ f i , 1 i M
where f i denotes the i th type of constraint, Δ f i is the error with this type of constraint, and x = x state , as defined in Equation (6). Formally, the statistical independence of different sources of constraints means that the covariance matrix of joint constraint f = [ f 1 ; f 2 ; ; f M ] has the following structure
C f = [ C 1 0 0 0 0 C 2 0 0 0 0   C M ]
where C i indicates the covariance matrix of i-th constraint ( f i ). Following the expressions of f i and C f i , the probability distribution function (PDF) of joint data (1 ≤ iM) can be derived by multiplying PDFs of data from all M sources, namely,
P ( f ( x ) | f ) = i = 1 M P ( f i ( x ) | f i ) ~ exp { 1 2 i = 1 M [ f i ( x ) f i ] T ( C i ) 1 [ f i ( x ) f i ] }
Further introducing the weight matrix (W) for multiple (M) types of constraints, the objective cost function to be minimized has a quadratic form, namely,
Ψ total ( x ) = i = 1 M γ i Ψ i ( x )
where
Ψ i ( x ) = 1 2 [ f i ( x ) f i ] T W i 1 [ f i ( x ) f i ]
W i = 1 ε i 2 C i
γ i = ε 1 2 ε i 2
In the above equations, ε i 2 is the first diagonal element of C i (i.e., ε i 2 = { C i } 11 ) and the Lagrange factor γ i weights the contribution of each type of constraint with respect to the first one ( γ 1 = 1).
Minimization of Ψ total ( x ) in Equation (17) means its gradient with respect to the solution x approaches zero, such that
Ψ total ( x ) = i = 1 M γ i Ψ i ( x ) = 0
which can be ensured by enforcing the gradient of all components approach zero, namely
Ψ i ( x ) = K i T W i 1 ( f i ( x ) f i ) = 0
where K i is the Jacobian matrix containing the derivatives of i-th type of constraint with respect to the retrieval parameters. To solve the above equation iteratively, we replace x by x − Δx in Equation (22) and substitute
f i ( x Δ x ) = f i ( x ) K i Δ x
into it. This results in
Ψ i ( x Δ x ) = K i T W i 1 ( f i ( x ) K i Δ x f i ) = 0
or equivalently,
( K i T W i 1 K i ) Δ x = K i T W i 1 ( f i ( x ) f i ) = Ψ i ( x )
The Jacobian matrix K i in Equations (22)–(25) consists of the derivative of the l-th observational or a priori data with respect to the n-th unknown,
K i , ( l , n ) = f i , l x n | x
More explicit evaluation of f i ( x ) , f i , and K and W matrices for all ten types of constraints is discussed in the following subsections.

3.2.1. Observational Constraints (i = 1)

Assuming a total number of N pixel pixels, where each pixel has Z observations, then after arranging all pixel data into a column vector we have
f i = 1 ( x ) = [ f 1 , p 1 ; f 1 , p 2 ; ; f 1 , N pixel ] N × 1 = [ y 1 ; y 2 ; ; y N f ]
where N f = N pixel × Z.
The parameters of the atmosphere-surface model are adjusted so that the model prediction of radiance and polarization f 1 ( x ) fit the observational constraints f 1 ( x ) . The calculation of f 1 ( x ) is introduced in Section 4. The Jacobian matrix K 1 consists of first order partial derivatives with respect to correlated and uncorrelated parameters in the vicinity of x, namely,
K 1 = [ K 1 , x ¯ corr K 1 , v K 1 , w ( p 1 ) K 1 , uncorr ( p 1 ) 0 0 0 0 K 1 , x ¯ corr K 1 , v 0 0 K 1 , w ( p 2 ) K 1 , uncorr ( p 2 ) 0 0 K 1 , x ¯ corr K 1 , v 0 0 0 0 K 1 , w ( N pixel ) K 1 , uncorr ( N pixel ) ]
where K 1 , x ¯ corr is the Jacobian matrix containing derivatives of observations with respect to spatial and temporal mean correlated parameters (total number is N corr ). Variation of x ¯ corr impacts observations in all pixels. Then K 1 , x ¯ corr is evaluated by
K 1 , x ¯ corr = [ y 1 x ¯ corr ( 1 ) y 1 x ¯ corr ( 2 ) y 1 x ¯ corr ( N corr ) y 2 x ¯ corr ( 1 ) y 2 x ¯ corr ( 2 ) y 2 x ¯ corr ( N corr ) y N f x ¯ corr ( 1 ) y N f x ¯ corr ( 2 ) y N f x ¯ corr ( N corr ) ]
The matrix K 1 , v in Equation (28) is the Jacobian matrix containing derivatives of observations with respect to all PC elements. It is evaluated as follows:
K 1 , v = [ K 1 , v ( k = 1 ) K 1 , v ( k = 2 ) K 1 , v ( k = N PC ) ]
with
K 1 , v ( k ) = [ y 1 v k ( 1 ) y 1 v k ( 2 ) y 1 v k ( N corr ) y 2 v k ( 1 ) y 2 v k ( 2 ) y 2 v k ( N corr ) y N f v k ( 1 ) y N f v k ( 2 ) y N f v k ( N corr ) ]
The matrix K 1 , w in Equation (28) is the Jacobian matrix containing derivatives of observations with respect to pixel-resolved PC weights and is evaluated as follows:
K 1 , w ( p ) = [ y p , 1 w p ( 1 ) y p , 1 w p ( 2 ) y p , 1 w p ( N PC ) y p , 2 w p ( 1 ) y p , 2 w p ( 2 ) y p , 2 w p ( N PC ) y p , Z w p ( 1 ) y p , Z w p ( 2 ) y p , Z w p ( N PC ) ]
Moreover, the derivatives with respect to pixel-resolved uncorrelated parameters are evaluated by,
K 1 , uncorr ( p ) = [ y p , 1 x p ( 1 ) y p , 1 x p ( 2 ) y p , 1 x p ( L ( 1 ) + L ( 2 ) + + L ( N uncorr ) ) y p , 2 x p ( 1 ) y p , 2 x p ( 2 ) y p , 2 x p ( L ( 1 ) + L ( 2 ) + + L ( N uncorr ) ) y p , Z x p ( 1 ) y p , Z x p ( 2 ) y p , Z x p ( L ( 1 ) + L ( 2 ) + + L ( N uncorr ) ) ]
The covariance matrix for the first constraint (i.e., the observations) assembles the sub-weighting matrix from all pixels, namely,
W 1 = [ W 1 ( 1 ) 0 0 0 W 1 ( 2 ) 0 0 0 W 1 ( N pixel ) ]

3.2.2. A Priori Constraints (i = 2)

The a priori constraint is constructed in the same way as in a previous study [24]. Namely, Equation (14) becomes
f i = 2 = x a   p r i o r i = x + Δ x a   p r i o r i
Then in Equations (21)–(25), K i = 2 = I (identity matrix) and W i = 2 = 1 ε a 2 C a . More explicitly, W i = 2 can be constructed from estimated range of each parameter relative to the first one,
W i = 2 = [ 1 0 0 0 ( x 2 , max x 2 , min ) 2 ( x 1 , max x 1 , min ) 2 0 0 0 ( x N , max x N , min ) 2 ( x 1 , max x 1 , min ) 2 ]

3.2.3. Smoothness Constraints in Regular Parameter Space (i = 3, 4, 6, and 7)

The formulation of these types of constraints is similar, so we discuss them together. The third type of constraint reflects the smooth variation of an uncorrelated type of parameter (such as the variation of parameter of the surface bidirectional reflectance distribution function with wavelength). The fourth type of constraint reflects the smooth variation of certain type of parameter in the mean field (e.g., aerosol refractive index as a function of wavelength). The sixth type of constraint reflects the smooth variation of PC weights from pixel to pixel. The seventh equation reflects the smooth variation of certain type of parameters residing in a PC vector (such as the deviation of refractive index from the mean). The strengths of the sixth and seventh types of constraints depends on the rank of PC. Putting all four of these types of constraints together, we have
{ f 3 = 0 = S 3 , m x uncorr + Δ g ( x uncorr ) f 4 = 0 = S 4 , m x ¯ + Δ g ( x ¯ corr ) f 6 = 0 = S 6 , m w state + Δ g ( w ) f 7 = 0 = S 7 , m v state + Δ g ( v )
where w state and v state are column vectors containing only PC weights and vectors, respectively, and are extracted from the overall state vector expressed in Equation (6), and S i , m is the differentiation matrix of m-th order for i-th type of constraint.
When a retrieval parameter varies smoothly as a function of some variable z, it is assumed to be locally approximated by a smooth function g(z), such as a constant, a line, a parabola, etc. With a polynomial form, the m-th derivative approaches zero [6], such that
S i , m ( z ) z = d m g ( z ) d z m = 0 { g m = 1 ( z ) = const g m = 2 ( z ) = A z + B g m = 3 ( z ) = A z 2 + B z + C
For a discretized grid of the variable z, the explicit form of S i , m z , is,
S i , m ( z j ) z j = { d g d z Δ 1 g Δ 1 ( z ) = g ( z j + 1 ) g ( z j ) Δ 1 ( z j ) , for   m = 1 d m g d z m Δ m g Δ m ( z ) = Δ m 1 g ( z j + 1 ) / Δ m 1 ( z j + 1 ) Δ m 1 g ( z j ) / Δ m 1 ( z j ) [ Δ m 1 ( z j ) + Δ m 1 ( z j + 1 ) ] / 2 , for   m 2
Taking the orders of difference m = 1 and 2 as examples, we have
{ Δ m = 1 ( z j ) = z j + 1 z j Δ m = 2 ( z j ) = [ Δ 1 ( z j ) + Δ 1 ( z j + 1 ) ] / 2
Application of the above equation to L discretized grids rj (namely, 1 ≤ jL) leads to
f i ( x ) = S i , m x
so that by invoking Equation (26),
K i = S i , m
where the matrix S i , m is evaluated by,
S i , m = 1 = [ 1 Δ 1 ( 1 ) 1 Δ 1 ( 1 ) 0 0 0 1 Δ 1 ( 2 ) 1 Δ 1 ( 2 ) 0 0 0 0 0 0 1 Δ 1 ( L 1 ) 1 Δ 1 ( L 1 ) ]
and
S i , m = 2 = [ 2 Δ 1 ( 1 ) [ Δ 1 ( 1 ) + Δ 1 ( 2 ) ] 2 Δ 1 ( 1 ) Δ 1 ( 2 ) 2 Δ 1 ( 2 ) [ Δ 1 ( 1 ) + Δ 1 ( 2 ) ] 0 0 0 0 2 Δ 1 ( 2 ) [ Δ 1 ( 2 ) + Δ 1 ( 3 ) ] 2 Δ 1 ( 2 ) Δ 1 ( 3 ) 2 Δ 1 ( 3 ) [ Δ 1 ( 2 ) + Δ 1 ( 3 ) ] 0 0 0 2 Δ 1 ( L 1 ) [ Δ 1 ( L 1 ) + Δ 1 ( L ) ] 2 Δ 1 ( L 1 ) Δ 1 ( L ) 2 Δ 1 ( L ) [ Δ 1 ( L 1 ) + Δ 1 ( L ) ] ]
The same principle applied to higher orders of difference (m > 2) ensures a smooth curve with d m g ( z ) d z m = 0 . Substitution of Equations (41), (42), and f i = 0 into Equation (18) gives,
Ψ i ( x ) = 1 2 x T S i , m T W i , m 1 S i , m x
where the weighting matrix W has the following diagonal terms,
{ W i , m } j j = 1 Δ m ( z j )
and Δ m ( z j ) is specified in Equation (40) for m = 1 and 2, and can be generalized to an arbitrary higher order.
Substitution of Equations (41), (42), and f i = 0 into Equation (26) gives
( S i , m T W i , m 1 S m ) Δ x = S i , m T W i , m 1 ( S i , m x )
Further defining
Ω i = S i , m T W i , m 1 S i , m
we have
Ω i Δ x = Ω i x
Note that for equidistant pixels on an imaged grid, the weighting matrix W is a unity matrix (namely W = I). To distinguish the smoothness constraints imposed on different types of parameters, we note here,
Ω i = { Ω uncorr , i = 3 Ω corr x ¯ , i = 4 Ω corr w , i = 6 Ω corr v , i = 7

3.2.4. Smoothness Constraints in PC Space (i = 5)

The fifth type of constraint reflects the smooth variation of correlated parameters in different dimensions. However, unlike the smoothness constraint directly imposed on relevant uncorrelated parameters, it has to be transformed to the PC vectors and weights. For simplicity, we put all PC weights into a single-column vector w state = [ w k = 1 ; w k = 2 ; ; w k = N PC ] and all PC elements for j-th correlated parameter into another single-column vector v state = [ v k = 1 ; v k = 2 ; ; v k = N PC ] . The smooth variation of the j-th correlated aerosol parameter is ensured by,
f i = 5 = 0 = S i , m x wv + Δ g ( [ v ; w ] )
where x wv = [ v state w state ] . To evaluate the differentiation matrix S i , m , we recall that a pixel-resolved correlated parameter is constructed from PCs via Equation (1). An arbitrary correlated parameter x corr , p ( j ) associated with p-th pixel is derived as,
x corr , p ( j ) = x ¯ corr , j + k = 1 N PC w p ( k ) v k ( j ) = x ¯ corr , j + [ w p ( 1 ) v 1 ( j ) + w p ( 2 ) v 2 ( j ) + + w p ( N PC ) v N PC ( j ) ]
(a) across-pixel smoothness
The across-pixel variation of a correlated parameter is contributed by pixel-resolved PC weights, namely,
Δ x corr , p = v × ( Δ w p )
Taking the first order of difference (m = 1) in the across-pixel variation of the field as an example, Equation (39) becomes,
S m = 1 ( z j ) z j = d g d z Δ 1 g Δ 1 z k = 1 N PC { v k ( j ) × [ w j + 1 ( k ) w j ( k ) ] } Δ 1 ( z j )
where z measures the inter-pixel relative distance. As an example, we take the simplest case of a single PC (k = 1), three pixels ( p 1 , p 2 , p 3 ) associated with PC weights [ w p 1 , w p 2 , w p 3 ], and two correlated parameters associated with PC elements v k = 1 (1) and v k = 1 (2). The matrix S i , m is constructed in the following way to ensure smooth variation of the correlated parameter across equidistant (e.g., unity spacing) pixels via f i = 5 ( x wv ) = S i , m x wv :
f i = 5 ( x wv ) = S i , m x wv = { 1 2 [ w p 1 ( k = 1 ) w p 2 ( k = 1 ) 0 v k = 1 ( 1 ) v k = 1 ( 1 ) 0 0 w p 1 ( k = 1 ) w p 2 ( k = 1 ) v k = 1 ( 2 ) v k = 1 ( 2 ) 0 w p 2 ( k = 1 ) w p 3 ( k = 1 ) 0 0 v k = 1 ( 1 ) v k = 1 ( 1 ) 0 w p 2 ( k = 1 ) w p 3 ( k = 1 ) 0 v k = 1 ( 2 ) v k = 1 ( 2 ) ] } × [ v k = 1 ( 1 ) v k = 1 ( 2 ) w p 1 ( k = 1 ) w p 2 ( k = 1 ) w p 3 ( k = 1 ) ]
(b) within-pixel smoothness
Within-pixel variation of a parameter (such as refractive index) describes its dependence on a non-spatial variable, e.g., wavelength. For an arbitrary pixel p, the within-pixel variation of a correlated parameter is contributed by PC vectors, namely,
Δ x corr , p = ( Δ v ) × w p
Taking the first order of difference (m = 1) as an example, the differentiation matrix S i , m is constructed in the following way to ensure smooth variation of the correlated parameter to x(j) as a function of z across which x(j) is smooth (for example, z is wavelength when x(j) is aerosol refractive index),
S i , m = 1 ( z j ) z j = d g d z Δ m g Δ m z k = 1 N PC { w p ( k ) × [ v k ( j + 1 ) v k ( j ) ] } Δ 1 z j
Taking the simplest case of a single PC (k = 1), three parameters associated with PC elements v k = 1 (1), v k = 1 (2) and v k = 1 (3) as an example,
f i = 5 ( x wv ) = S i , m = 1 x wv = { 1 2 [ w p ( k = 1 ) Δ 1 ( z 1 ) w p ( k = 1 ) Δ 1 ( z 1 ) 0 v k = 1 ( 2 ) v k = 1 ( 1 ) Δ 1 ( z 1 ) 0 w p ( k = 1 ) Δ 1 ( z 2 ) w p ( k = 1 ) Δ 1 ( z 2 ) v k = 1 ( 3 ) v k = 1 ( 2 ) Δ 1 ( z 2 ) ] } × [ v k = 1 ( 1 ) v k = 1 ( 2 ) v k = 1 ( 3 ) w p ( k = 1 ) ]
Invoking f i = 0 , the cost function in the form of Equation (45) is derived for both across-pixel and within-pixel smoothness constraints. Further, substitution of f i = 5 ( x wv ) = S i , m = 1 x wv into Equation (26) gives the expression for Jacobian matrix elements,
K i , ( l , n ) = ( S i , m x wv ) l x wv , n | x wv
in which the matrix S i , m is a function of x (see Equation (57)), therefore K i S i , m . Intuitively, one can think of f i = 5 ( x wv ) = S i , m = 1 x wv as a model prediction to fit the “observation” f i , which is a zero vector. Therefore, the above Jacobian matrix is evaluated in the same way as is done for observational constraints by use of finite difference methodology. The finite difference method is used for evaluating Equation (59).
Invoking f i ( x wv ) = S i , m x wv and f i = 0 , Equation (25) becomes
( K i T W i 1 K i ) Δ x wv = K i T W i 1 S i , m x wv
Further defining
{ Ω corr , 1 wv = K i T W i 1 K i Ω corr , 2 wv = K i T W i 1 S i , m
we have
Ω corr , 1 Δ x wv = Ω corr , 2 x wv
Note that if S i , m is independent of x (cases for 3, 4, 6, and 7), then K can be analytically evaluated from Equation (59), namely,
K i = S i , m
so that
Ω corr , 1 wv = Ω corr , 2 wv = S i , m T W i 1 S i , m
In this manner, the static smoothness matrices for cases for 3, 4, 6, and 7 (Section 3.2.3) are recovered.
Based on above demonstration, the evaluation of S i , m , K i , and Ω i matrices is generalized from the case of regular (non-correlated) retrieval parameters to the case of correlated parameters represented by PCs in Appendix C. The Ω matrix derived above is accounted for later to solve for an increment of the PC terms during optimization.

3.2.5. Zero-sum Constraint on PC Weights (i = 8)

As an intrinsic property of pixel-resolved PC weights, they are required to sum to zero for an arbitrary set of PC vectors. This constraint is ensured by multiplying the PC weights w in the state vector by an O matrix, such that,
f i = 8 = 0 = f i = 8 ( w state ) + Δ O
where w state is a column vector defined in Section 3.2.4 and contains the weights of all PCs, and f i = 8 ( w state ) is expressed as
f 8 ( w state ) = O w state
where
O = [ 1 0 0 0 1 0 0 0 0 1 ] N PC × ( N PC × N pixel ) , 1 = [ 1 ,   1 ,   ,   1 ] 1 × N pixel
Further substituting f 8   = 0 and f 8 ( w state ) = O w state into Equation (18), the cost function has the following quadratic form,
Ψ i ( w state ) = 1 2 ( w state T O T O w state )
Substitution of Equation (66) into Equation (26) gives the evaluation of Jacobian matrix elements,
K i , ( l , n ) = ( O w state ) l w state , n | w state = O l , n
Further defining a zero-sum matrix to be,
Ω O = Ω i = O T O
and invoking f 8 ( w state ) = O w state and f 8   = 0 , Equation (25) becomes,
Ω O Δ w state = Ω O w state

3.2.6. Mutual Orthogonality Constraint among PC Vectors (i = 9)

An intrinsic property of PC vectors is that they are mutually orthogonal. This forms the orthogonality constraint imposed on all pairs of PC vectors via f i (i = 9), namely
f i = 9   = 0 = f i = 9 ( v state ) + Δ Γ
where v state is a column vector defined in Section 3.2.4 and contains all PC vectors, and f i = 9 ( v state ) is expressed as
f 9 ( v state ) = Γ v state
where,
Γ = [ v k = 2 T v k = 1 T 0 0 0 0 v k = 3 T 0 v k = 1 T 0 0 0 v k = N PC T 0 0 0 0 v k = 1 T 0 v k = 3 T v k = 2 T 0 0 0 0 v k = 4 T 0 v k = 2 T 0 0 0 v k = N PC T 0 0 0 v k = 2 T 0 0 0 0 v k = N PC 1 T v k = N PC T ]
Further substituting f 9   = 0 = { [ 0 0 0 ] T } { 1 2 [ N PC × ( N PC 1 ) ] } × 1 and f 9 ( v state ) = Γ v state into Equation (18), the cost function is derived as,
Ψ i ( v ) = 1 2 v state T Γ T Γ v state
Substitution of Equation (73) into Equation (26) gives the evaluation of Jacobian matrix elements,
k i , ( l , n ) = ( Γ v ) l v state , n | v state = Γ l , n
Further defining a zero-sum matrix to be,
Ω Γ = Ω i = Γ T Γ
and invoking f 9 ( v state ) = Γ v state and f 9   = 0 , Equation (25) becomes,
Ω Γ Δ v state = Ω Γ v state

3.2.7. Unity-norm Constraint PC Vectors (i = 10)

Another intrinsic property of each PC vector is that its norm equals unity (i.e., v k 2 = v k T v k = 1 ). This forms the unity constraint imposed on all PC vectors via f i (i = 10), such that
f i = 10   = 1 = f i = 10 ( v state ) + Δ U
where
f 10 ( v state ) = U v state
and U is expressed as,
U = [ v k = 1 T 0 0 0 v k = 2 T 0 0 0 0 v k = N PC T ] N PC × ( N PC × N corr )
Then substituting Equation (80) and f 10   = 1 = { [ 1 1 1 ] T } N PC × 1 into Equation (18), the cost function is derived as,
Ψ i ( v state ) = 1 2 ( v state T U T U v state N PC )
Moreover, substitution of Equation (80) into Equation (26) gives the evaluation of Jacobian matrix elements:
K i , ( l , n ) = ( U v state ) l v state , n | v state
Further defining a unity constraining matrix to be,
{ Ω U , 1 = K i T K i Ω U , 2 = K i T U
and invoking f 10 ( v state ) = U v state and f 10   = 1 , Equation (25) becomes equivalent to
Ω U , 1 Δ v state = Ω U , 2 v state K i T f i

3.2.8. Construction of Overall Equation System

Accounting for the above ten types of above-specified constraints, the solution to minimizing Equation (17) is approached iteratively. The solution from iteration q is incremented as follows,
x q + 1 = x q Δ x q
where Δ x q is obtained by accounting for both observational and a priori constraints derived in Section 3.2.1, Section 3.2.2, Section 3.2.3, Section 3.2.4, Section 3.2.5, Section 3.2.6 and Section 3.2.7,
A q × Δ x q = Ψ total ( x q )
As the explicit form, we have
A q = K 1 , q T W 1 1 K 1 , q + γ Ω total , 1 + γ a W a 1
Ψ total ( x q ) = K 1 , q T W 1 1 [ f 1 ( x q ) f 1 ] + γ Ω total , 2 x q + γ a W a 1 ( x q x a   p r i o r i ) + [ 0 γ U K 10 , q T f 10 0 ]
where “ γ Ω total ” incorporates i = 3–10 types of constraints, namely,
{ γ Ω total , 1 = γ uncorr Ω uncorr Ra + γ corr x ¯ Ω corr x ¯ , Ra + γ corr wv Ω corr , 1 wv , Ra + γ corr w Ω corr w , Ra + γ corr v Ω corr v , Ra + γ O Ω O Ra + γ Γ Ω Γ Ra + γ U Ω U , 1 Ra γ Ω total , 2 = γ uncorr Ω uncorr Ra + γ corr x ¯ Ω corr x ¯ , Ra + γ corr wv Ω corr , 2 wv , Ra + γ corr w Ω corr w , Ra + γ corr v Ω corr v , Ra + γ O Ω O Ra + γ Γ Ω Γ Ra + γ U Ω U , 2 Ra
where the eight terms on the right-hand-side of the above equation are equal to Ω i with i = 3–10, respectively, and the multipliers γ control the strength of these constraints. The smoothness matrices γ uncorr Ω uncorr Ra , γ corr x ¯ Ω corr x ¯ , Ra , γ O Ω O Ra , γ Γ Ω Γ Ra , γ U Ω U Ra , γ corr wv Ω corr wv , Ra , and γ corr w / v Ω corr w / v , Ra act on uncorrelated fields, multi-pixel mean of correlated fields, PC weights, PC vectors, PC vectors, combined PC weights and vectors, and separate PC weights and vectors, respectively. They are essentially equal to γ uncorr Ω uncorr , γ corr x ¯ Ω corr x ¯ , γ O Ω O , γ Γ Ω Γ , γ U Ω U , γ corr wv Ω corr wv , and γ corr w / v Ω corr w / v , respectively, as evaluated in Section 3.2.3, Section 3.2.4, Section 3.2.5, Section 3.2.6 and Section 3.2.7. However, the elements of these matrices are rearranged into the same dimension to add to each other in assembling γ Ω total in Equation (90). In performing the rearrangement, specific locations of relevant parameters in the state vector (see Equation (6)) have to be accounted for, and zero values have to be filled in to accommodate the parameters not subjected to a specific constraint. For the uncorrelated parameters and fields, the explicit forms of γ uncorr Ω uncorr as well as γ corr x ¯ Ω corr x ¯ are given in Appendix B. For the correlated parameters and fields, the smoothness constraints imposed on PC vector and weight retrieval incorporates two types: the coupled type ( γ corr wv Ω corr wv ), which acts on combined PC weights and vectors, and the decoupled type γ corr w / v Ω corr w / v , which act on PC weights and vectors separately. Based on previous demonstration of principles for deriving Ω i for i = 5, a comprehensive evaluation of γ corr wv Ω corr wv is provided in Appendix C. Comprehensive evaluations of γ corr w Ω corr w and γ corr v Ω corr v are provided in Appendix D. The imposition of γ corr w Ω corr w and γ corr v Ω corr v are effective when pixel-resolved PC weights themselves or PC elements associated with a type of parameter present certain smooth behavior (usually appearing in low order PCs). Our retrieval tests indicate that a combined use of γ corr wv Ω corr wv and γ corr w / v Ω corr w / v stabilize the inversion of PCs.
Ideally, a retrieval is deemed successful when the minimization of the cost function is achieved, such that
Ψ total ( N f + N c + N a N a ) ε f 2
where Nf, Nc, Na, and Na* are the total number of observations, total number of constraints imposed on retrieval (including smoothness constraints in different dimensions, zero-sum constraint over PC weights and orthogonality and unity constraints over PC vectors), total number of retrieval parameters, and total number of a priori estimates of parameters, respectively; and ε f 2 is the expected variance due to measurement errors. In practice, forward RT modeling error and other unmodeled effects can impede realization of the required cost function minimization. Therefore, the retrieval is also terminated when the relative difference of fitting residues with solutions from two successive iterations drops below a user-specified threshold value, ε c 2 , namely,
| Ψ total ( x q + 1 ) Ψ total ( x q ) | Ψ total ( x q ) ε c 2 .

3.2.9. Determination of Lagrange Multipliers

The Lagrange multipliers reflect the strength of smoothness constraints for a given parameter to be retrieved. Each multiplier is defined as,
γ i = ε i = 1 2 / ε i 2
where ε i 2 are the first diagonal elements of the covariance matrices corresponding to i-th type of constraints. To estimate ε i 2 for a given parameter to be retrieved (f = x), which is a function of z, the most unsmooth known solution f us ( z ) over the target domain is used, as suggested by Dubovik and King [25], namely,
ε 2 = z min z max ( d m [ f us ( z ) ] d m z ) 2 d z
where z min and z max specify the lower and upper bound of z. For i = 3, 4, 5, γ i is evaluated using least smooth known solution of correlated parameter x over the target domain. For i = 6 and 7, γ i is evaluated using the least smooth known solution of PC weights and PC vectors, respectively, which are derived from a training dataset over the target domain.
In practical implementation of our algorithm, the Lagrange multipliers are modified in the following way:
γ i Final = N f N i ε ˜ f 2 ε f 2 γ i
There are two differences between γ i Final and γ i :
1. The multipliers “ N f / N i ” are introduced to account for possible redundancy of the measured and a priori data. Considering that ε i 2 is a variance of the error in a single measured or estimated a priori value, if we have N values of a similar kind, the total variance increases in proportion to N. Introducing this coefficient ensures that when there are several kinds of data, the data with fewer values are given comparable weight, as the data type for which there is a greater number of available values.
2. The multiplier ε ˜ f 2 / ε f 2 is introduced with ε ˜ f 2 estimated as the dynamic fitting residual during iterations:
ε ˜ f 2 ( x q ) Ψ total ( x q ) ( N f + N c + N a N a ) ε f 2
With the multiplier ε ˜ f 2 / ε f 2 , the fitting residual is used as an estimate of measurement error variance. As a result, during the first few iterations, the contribution of the a priori term is strongest, and its influence decreases as the retrieval progresses. This is done to ensure mostly monotonic convergence, as in the Levenberg-Marquardt procedure [26,27]. However, the Levenberg-Marquardt approach does not specify a particular scheme for introducing these terms, rather it relies on the implementer’s intuition. Our algorithm requires the fitting errors in the initial iterations to be dominated by model linearization errors as opposed to random measurement errors, because at each iterative step the full forward model is replaced by its linear approximation, the “errors of linearization” decrease as convergence toward the final solution progresses, and they practically disappear, so that ε ˜ f 2 becomes equal to ε f 2 . As a result of this adjustment of the Lagrange multiplier, the non-linear iteration becomes significantly more monotonic. The Lagrange multiplier that controls the strength of a priori (i = 2), zero sum (i = 8), orthogonality (i = 9), and unity (i = 10) constraints are dynamically updated using Equations (95) and (96). When the solution approaches the truth, the constraining effect of smoothness constraints via the Lagrange factor decreases during the optimization process.

3.3. Retrieval Error Estiamte

Instrumental errors, forward modeling errors, and physical constraints imposed on the retrievals need to be taken into account when evaluating retrieval errors. Instrumental errors include random and systematic effects, such as absolute bias, band-to-band error, and camera-to-camera error. If all of these error sources are well-characterized, their error propagation to the retrievals can be derived in a comprehensive way [19]. If not, then a practical method is to use the square root of the diagonal terms of the following covariance matrix,
Δ x j = ( C Δ x ) j j
with
C Δ x = ( Δ x syst ) × ( Δ x syst ) T + C Δ x , rand
where the covariance matrix C Δ x , rand accounts for the contributions by random errors in the measurement ( ε rand ),
C Δ x rand = [ A ( x true ) ] 1 ε rand 2
and systematic error Δ x syst is estimated by
Δ x syst = [ A ( x true ) ] 1 Ψ total ( x true )
where A and Ψ total are calculated by substituting x true into Equations (88) and (89), respectively.
As the retrieved solution is the closest estimate of the “true” solution x true , we adopt x true = x retrieved for uncertainty estimation. Uncertainties with uncorrelated parameters are available from Equation (97). Uncertainties with pixel-resolved correlated parameters rely on the propagation of retrieval uncertainties of PCs and PC weights, so that,
( Δ x p , corr retrieved ) 2 = ( Δ x ¯ corr retrieved ) 2 + k = 1 N PC { [ w p retrieved ( k ) ] 2 ( Δ v k retrieved ) 2 + [ Δ w p retrieved ( k ) ] 2 ( v k retrieved ) 2 }
To estimate errors for functions of the retrieved parameters (namely f ( x p retrieved ) , e.g., aerosol single-scattering albedo, (SSA)), the following chain rule is applied,
Δ f ( x p retrieved ) = K 2 T ( x p retrieved ) C Δ x p retrieved K 2 ( x p retrieved )
where K 2 denotes the Jacobian array containing derivatives of f ( x p retrieved ) with respect to x p retrieved .
When x a   p r i o r i is not available, we assume x a   p r i o r i = x q so that the a priori term on the right-hand-side of Equation (89) for Ψ total is neglected. Indeed, instrument errors are already contained in the observation vector. Therefore, by implementing Equations (97) and (98), it is possible that errors are double-counted in the case that they bias the solution in the same direction as the modeling errors, resulting in a conservative error estimate.
Most error estimates involving Jacobians assume that the calculation is representative of the whole solution space and that the retrieval error is linear with measurement error. These two assumptions can be problematic in situations where model or observation errors are large. In these cases, closure tests using synthetic data with combined random and systematic errors to obtain improved error estimates are recommended.

3.4. Retrieval Options

A priori or first guess of PCs can be obtained from running PCA on a climatology database, field measurements, or model output. In the case of PCs for which confidence in their contents is low, simultaneous retrieval of PC weights and PC vectors has to be performed. For high confidence PCs, a two-step retrieval can be used to speed up the retrieval. That is, we run PC weight retrieval using the predetermined PCs first and then relax PCs during the retrieval to refine the solution. This relaxation is one way to capture unexpected variance that exceeds that represented by the predetermined PCs. In the extreme situation, where PCs are not representative of the actual aerosol properties, the scene model can be reproduced by using N PCs, where N equals to the number of aerosol parameters. In the absence of confidence in an a priori set of PCs, retrieval efficiency is still desired. In this case, one can run the correlated multi-pixel inversion with 2–3 PC vectors to capture the major variation of the correlated fields and then (a) relax more PCs into the retrieval to capture unexpected variance, or (b) return to the original multi-pixel retrieval to refine the solution. These different options have been built into our algorithm. In addition, to stabilize the retrieval of correlated fields varying significantly in magnitude (even in logarithmic space), we built into the algorithm an option of retrieving scaled PC vectors and weights. In this case, the representation of correlated fields by PCs for p-th pixel (namely Equation (1)) is modified as,
x corr , p = x ¯ corr + c ( v × w p )
where in the above equation denotes an operation of element-wise multiplication, and the constant column vector c has N corr elements and is introduced here to balance or weight the contribution of all types of retrieval parameters in the PC analysis. It is calculated from (a) the standard deviation of a correlated field x varying in spatial or temporal scales ( σ spatio - temporal ,   x ), and (b) its uncertainty estimate ( σ e ,   x ), namely,
C x = σ spatio - temporal ,   x 2 + σ e ,   x 2
Such a scaled PC analysis is used to analyze the AERONET retrievals in Figure 1 and Figure 2. To accommodate the constant column vector, the smoothness matrices for the correlated fields and Lagrange multipliers need a slight modification, which is straightforward and is not discussed here.

4. Radiative Transfer in a Coupled Atmosphere-Surface System

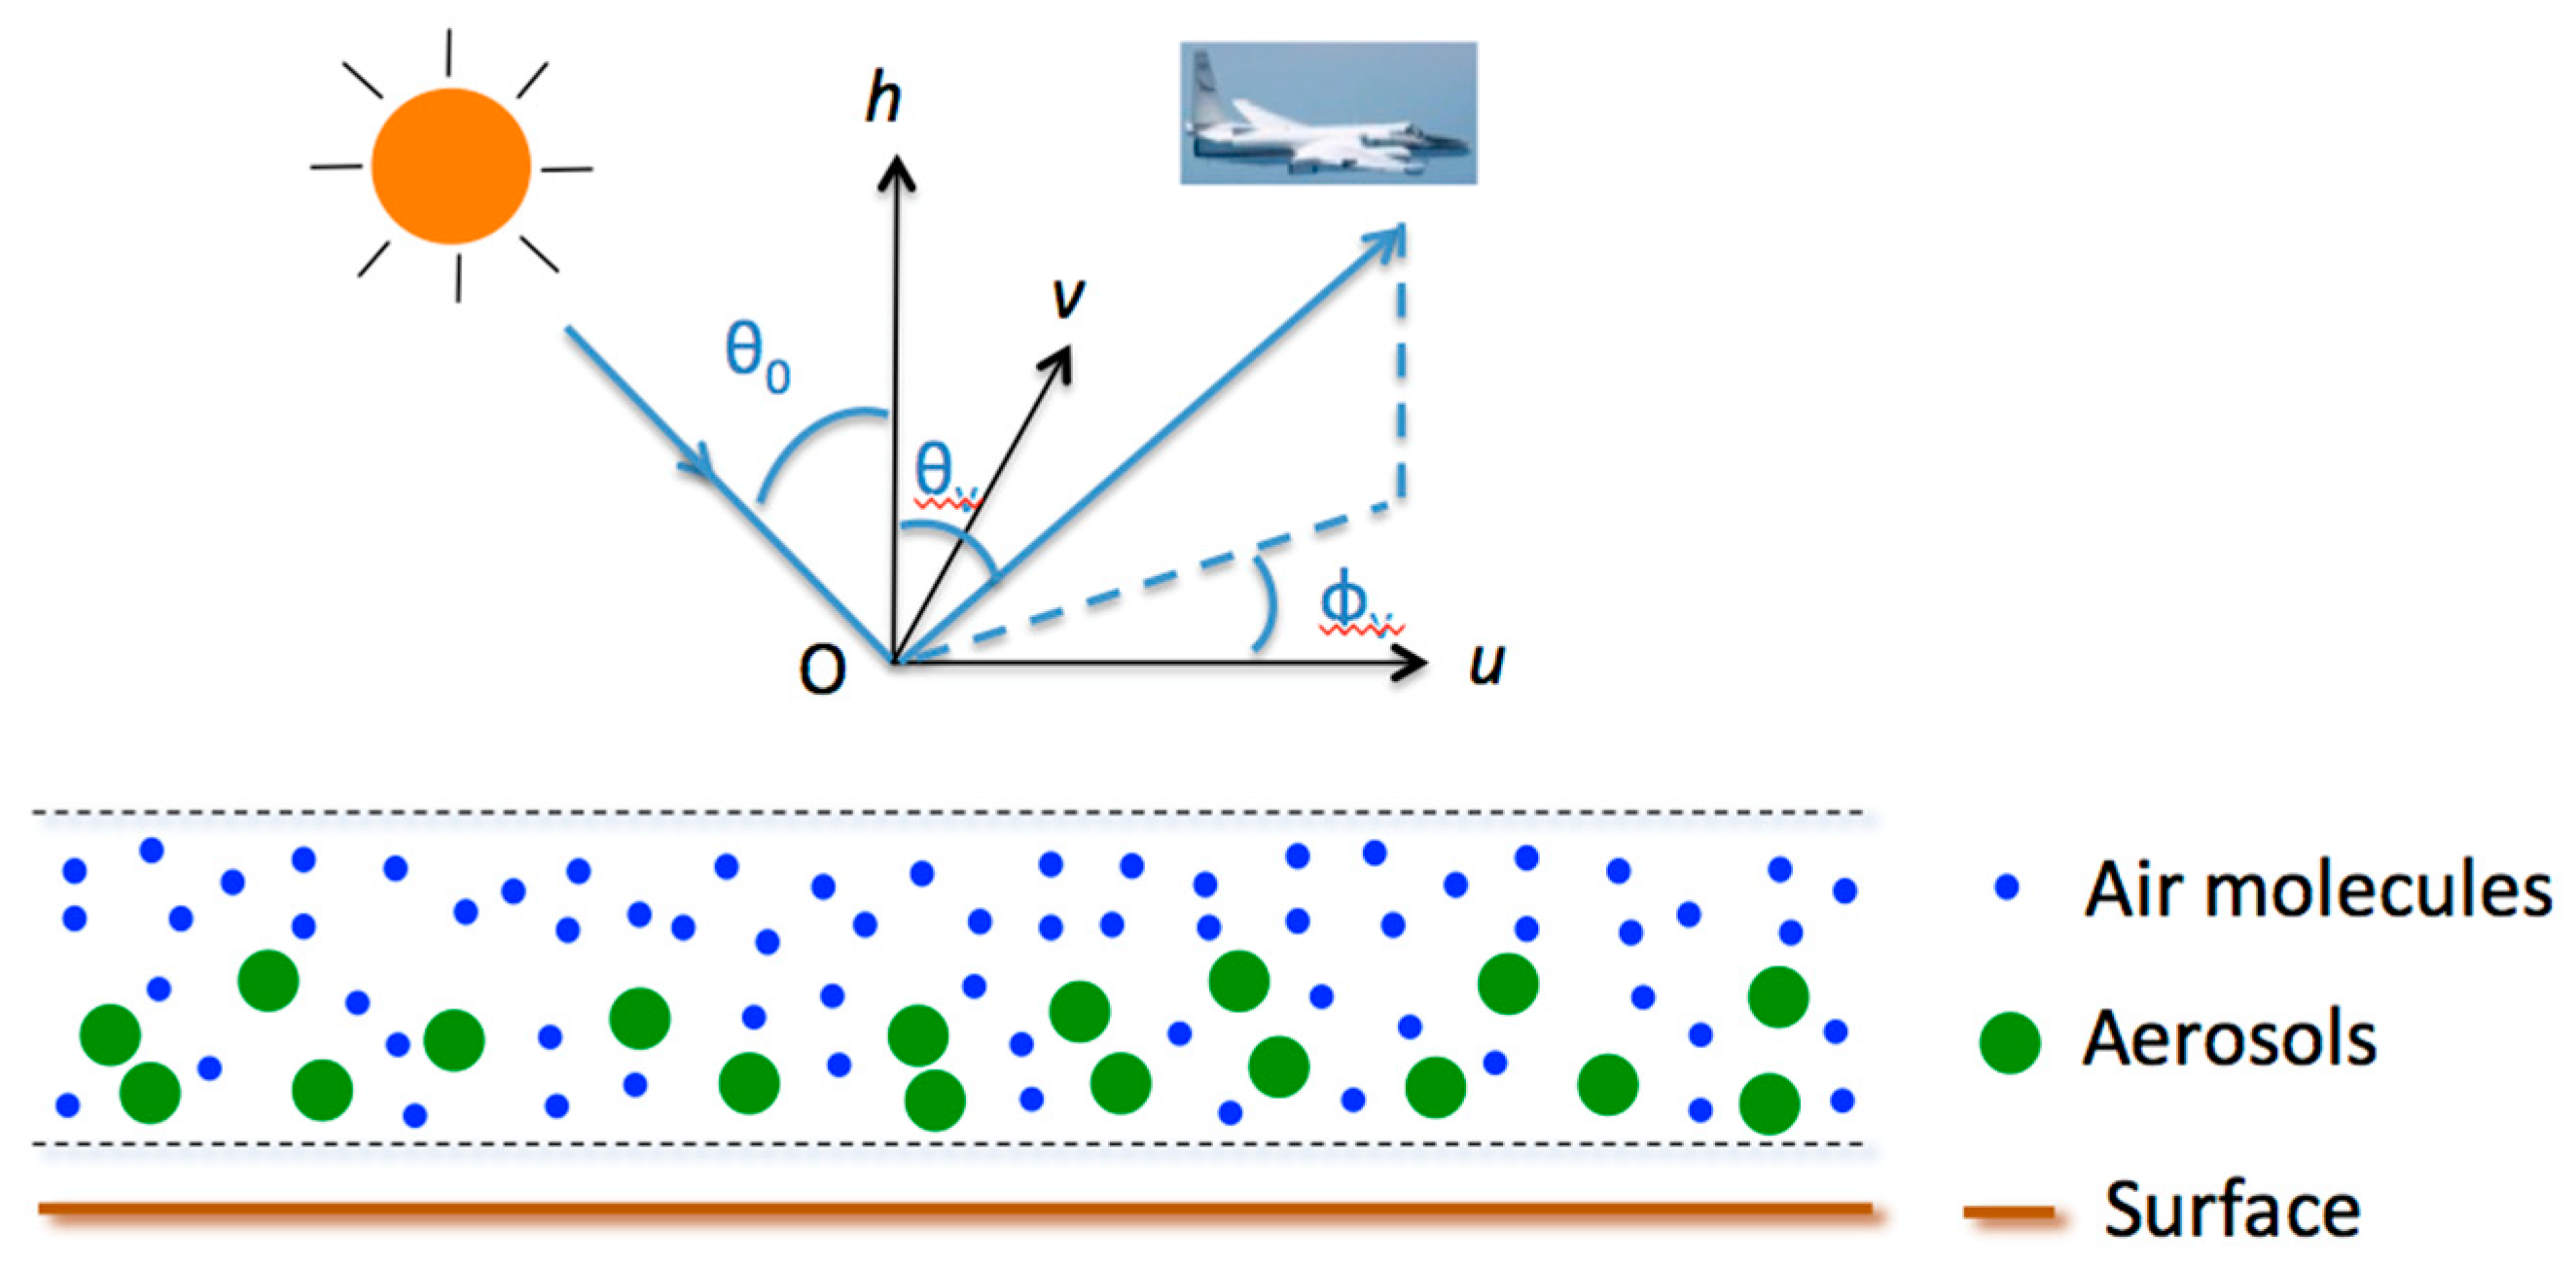
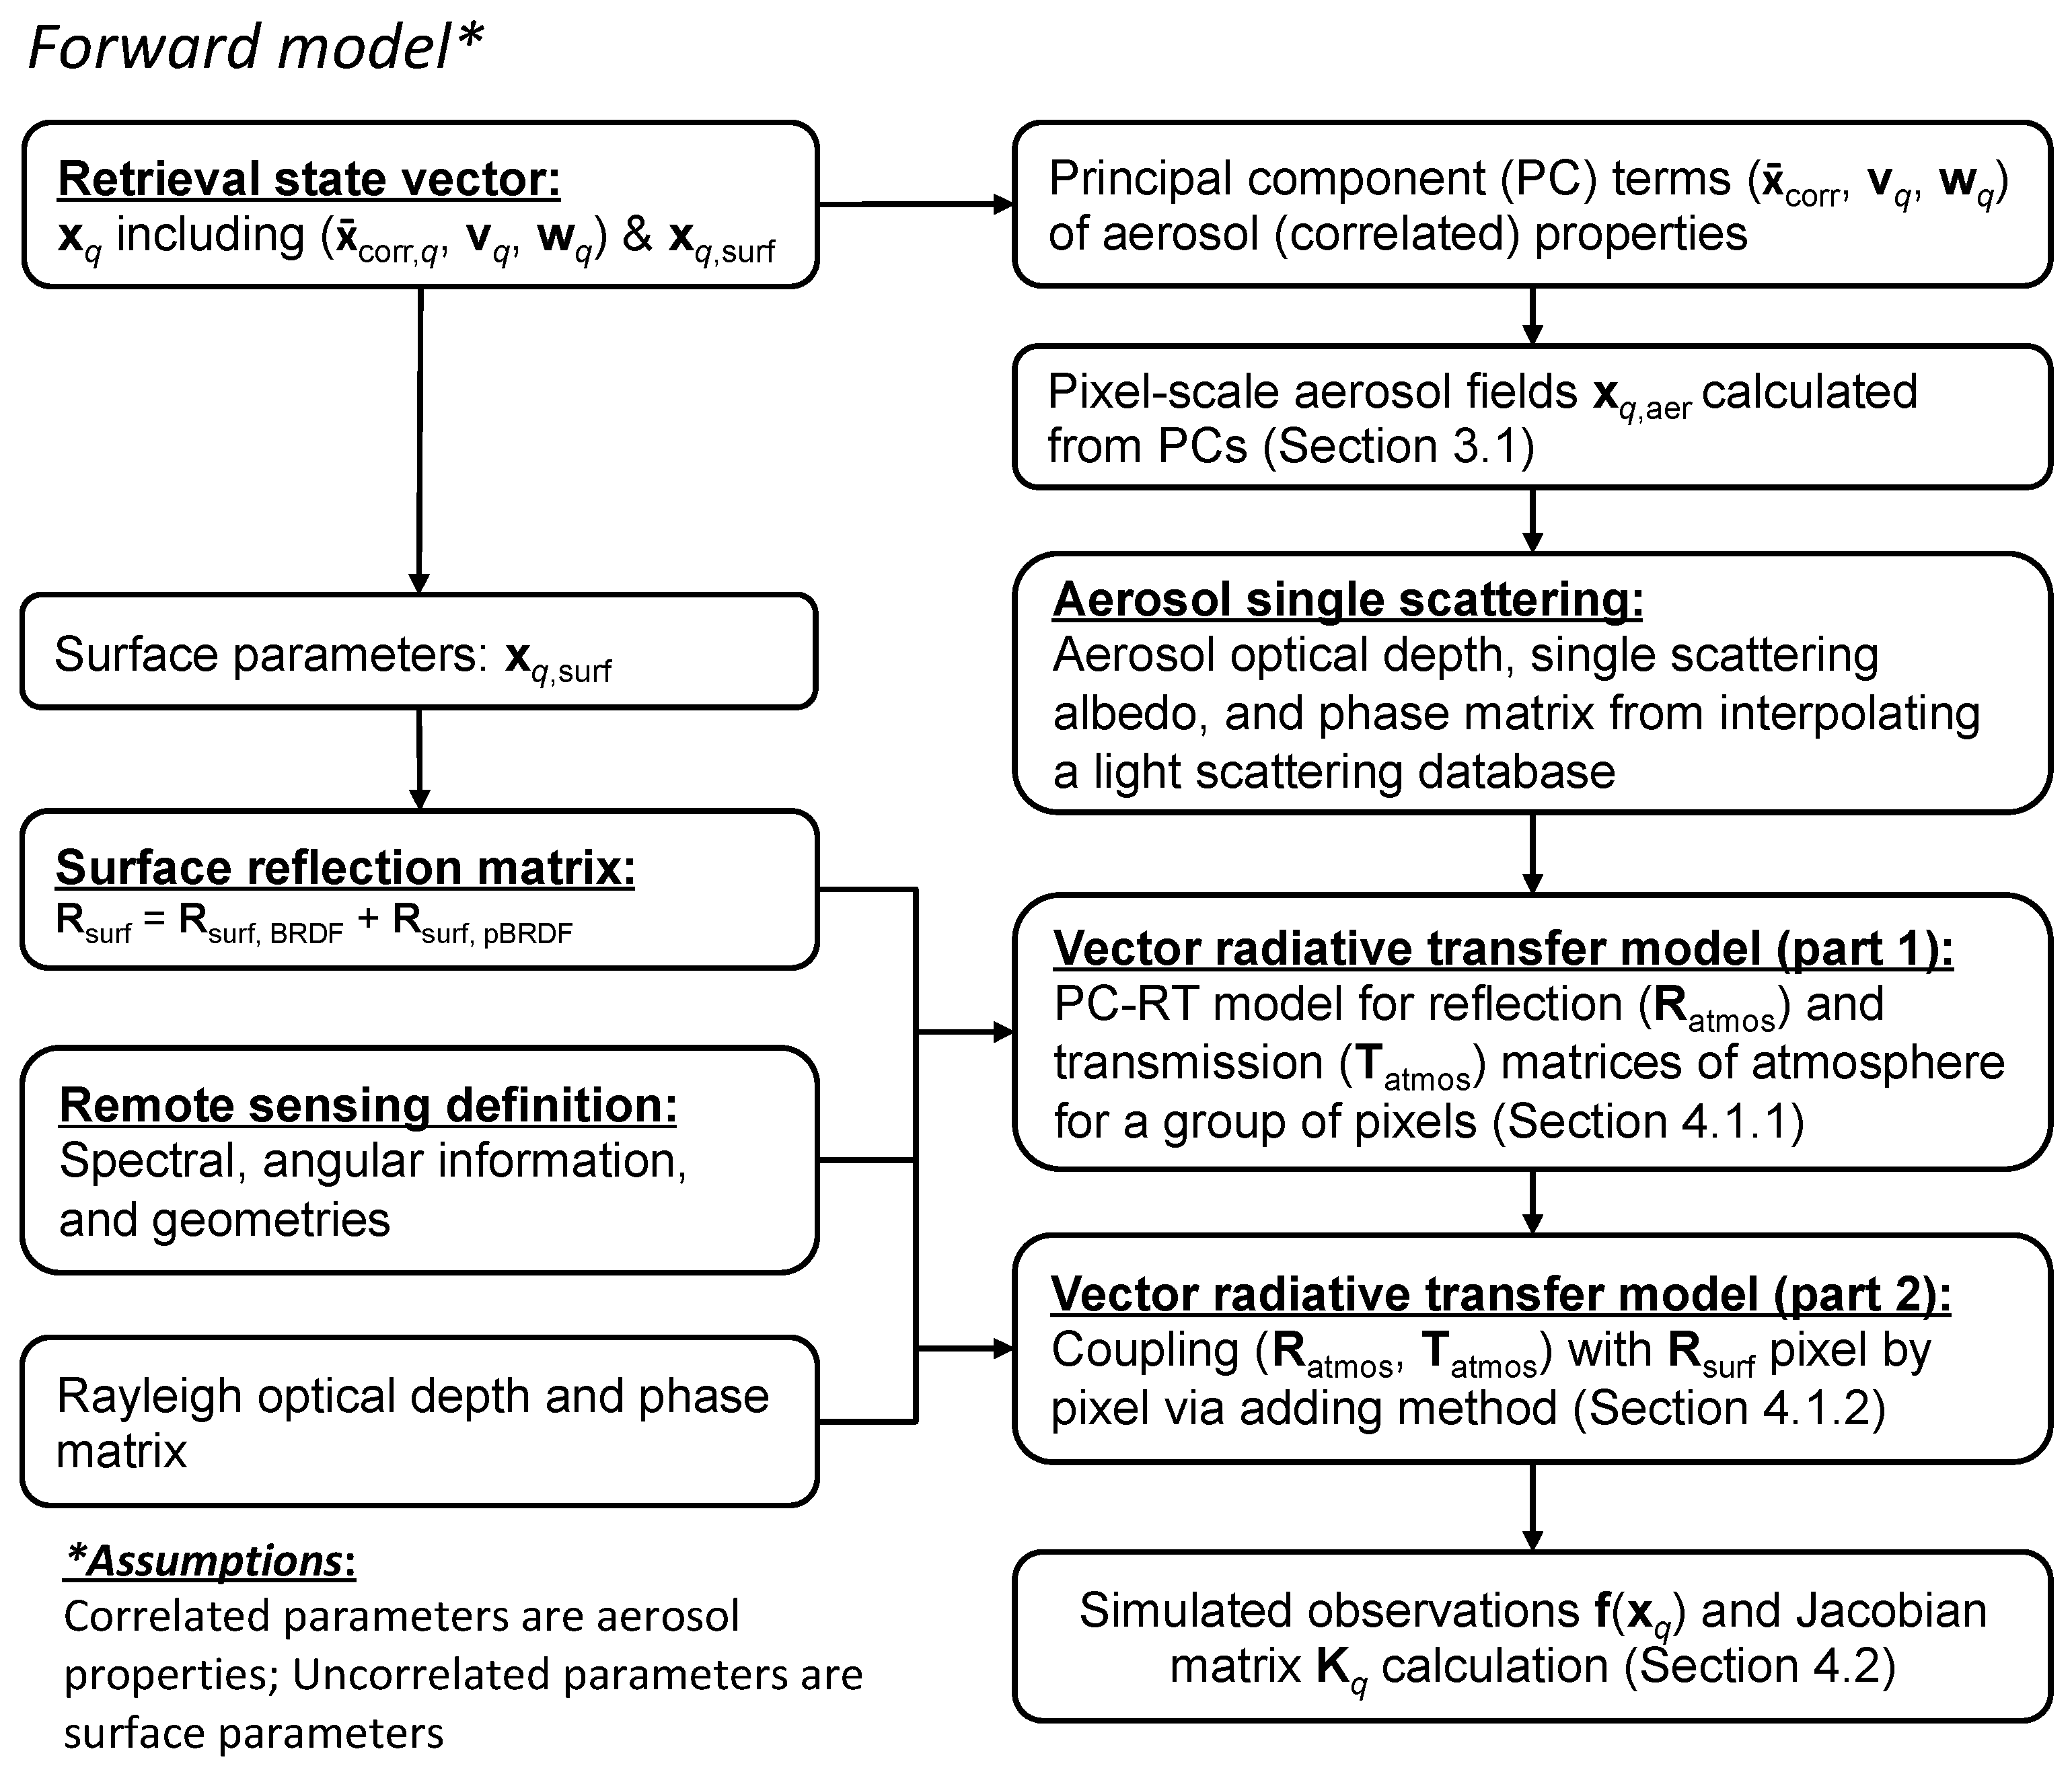
A fast radiative transfer model for a coupled atmosphere-surface (CAS) system plays a critical role in ensuring inversion efficiency. Where correlation among aerosol parameters exists, this section formulates the development of such a model for simulating TOA radiance for a group of pixels simultaneously. Figure 4 shows a CAS system consisting of a land surface and an aerosol/air-molecule mixed layer. The Markov chain model [28] is adopted for modeling RT in the atmospheric part of the CAS system. Coupling of atmospheric radiation and surface reflection is performed by use of the adding method [29]. As outlined in Figure 5, the principal-component based radiative transfer (PC-RT) model includes two steps: (1) calculating aerosol light scattering properties (aerosol optical depth, single scattering albedo, and phase matrix), and the reflection and transmission matrices of the atmosphere for a group of pixels by utilizing correlations in aerosol properties (Section 4.1.1); (2) coupling reflection/transmission matrices of the atmosphere with surface reflection pixel-by-pixel to model the TOA observations (Section 4.1.2). For retrieval use, evaluation of the Jacobian matrix that contains the derivatives of TOA observations with respect to all aerosol and surface parameters is described in Section 4.2.
To further ensure modeling efficiency, the correlated aerosol microphysical properties derived from their PCs are input to a light scattering database [30] for determination of aerosol scattering properties using interpolation. The modeled scattering properties include aerosol optical depth (AOD), single scattering albedo (SSA), and phase matrix. To model surface reflection, the Rahman-Pinty-Verstraete (RPV) model [31] is used to calculate the unpolarized surface bidirectional reflectance distribution function (BRDF). The parameters of the unpolarized part of the surface model include spectral weights and a few angular shape parameters. A modified microfacet model [32] is used to calculate the polarized surface BRDF (pBRDF). The pBRDF model parameters include spectral weight, shadowing width, and slope variance of the microfacets. Combination of the two components gives the full surface reflection model used in AirMSPI aerosol retrievals over land [19]. With the AOD and single scattering properties, a fast RT model that utilizes the correlation in aerosol fields and orthogonality of PC vectors is used to model the radiometric and polarimetric observations.

4.1. Fast Multi-Pixel Polarized RT Modeling in the Atmosphere

At a given iteration step, aerosol optical depth (AOD) and light scattering properties, including SSA and phase matrices, are established for all layers. Then, along with the parameters of the surface reflection, RT modeling is performed to evaluate the TOA radiation field. The basic multi-pixel algorithm, which does not take advantage of correlations between aerosol parameters, runs the RT pixel by pixel. Making use of correlation in aerosol fields and orthogonality of PC vectors, the next section describes a fast way to compute radiation in the atmosphere, which is then coupled with surface reflection to derive the TOA radiation field.

4.1.1. Fast Multiple-Pixel Radiative Transfer Modeling Utilizing Correlation

The spatial and spectral variation of aerosol fields, such as volume concentration as a function of aerosol size, aerosol refractive index, vertical distribution profile, and volume concentration of spherical particles, are captured by a few ( N PC ) dominant PC vectors. Taking advantage of orthogonality of the PCs, the quantities (Y), including total AOD ( τ aer , tot ), absorption AOD ( τ aer , abs ), and reflection and transmission matrices (R and T) for the above-surface atmosphere, can be expanded into Taylor series for multi-variable vector-valued functions v k . Adopting the second order of approximation (justified later in this section) and finite difference method to calculate derivatives, we have,
Y ( x p ) Y ( x ¯ ) + k = 1 N PC [ Y ( x ¯ + δ s × v k ) Y ( x ¯ δ s × v k ) 2 δ s w p ( k ) + Y ( x ¯ + δ s × v k ) 2 Y ( x ¯ ) + Y ( x ¯ δ s × v k ) 2 δ s 2 w p 2 ( k ) ]
where x ¯ is state vector containing multi-pixel mean aerosol properties and δ s is the scale factor that perturbs a PC vector. The scale factor is empirically determined by accounting for: (a) the accuracy of the two Jacobian related terms on the right-hand-side of the above equation; and (b) the sufficiency of expanding the radiation fields to the second order and using finite number of PCs to capture the variation of radiation across the imaging area. For an AirMSPI imaging area 10 km by 10 km, an empirical value of 0.1 is adopted to use the above equation.
The efficiency gain of implementing the above PC based RT modeling is obvious: only (2 × N PC +1) RT runs are necessary for evaluating the radiance fields for all pixels, which is much smaller than required for pixel-by-pixel RT runs. If the variation of aerosol fields across an imaging area is extremely high, we use an alternative method built into the algorithm, which applies PCA to the difference in the RT fields evaluated by RT runs with low and high numbers of streams (“streams” represent the quadrature points for integrating the contribution of light from different directions to an event of scattering in a new direction), namely,
Y ( x p ) Y LS ( x p ) [ Y HS ( x ¯ ) Y LS ( x ¯ ) ] +   k = 1 N PC [ Δ Y ( x ¯ + δ s × v k ) Δ Y ( x ¯ δ s × v k ) 2 δ s w p ( k ) + Δ Y ( x ¯ + δ s × v k ) 2 Δ Y ( x ¯ ) + Δ Y ( x ¯ δ s × v k ) 2 δ s 2 w p 2 ( k ) ]
where “HS” and “LS” denote high and low stream-based RT runs, respectively, and Δ Y = Y HS Y LS . In this case, RT runs with low order streams are performed for all pixels and then corrected by Equation (106). This methodology was proposed for a hyperspectral RT simulation [8] and adopted here for the multi-pixel RT simulation. Compared to directly applying PCA to RT via Equation (105), implementation of Equation (106) increases computational cost but captures more variance in the image-scale radiation fields and achieves higher modeling accuracy.
Note that the above evaluation assumes the same view and azimuthal angles for all pixels across the whole image, which is not strictly correct, as view angle varies pixel-by-pixel. To account for such an effect, the R and T matrices are calculated for a few view and azimuthal angular grids for each viewed image. Interpolation is then used to obtain the reflection and transmission matrices for an arbitrary pixel before coupling them with the surface reflection (as we assume no correlation between aerosol and surface reflection properties in this paper). Coupling of atmospheric radiation and surface reflection to get the TOA radiance for fitting observation is formulated in the next section.
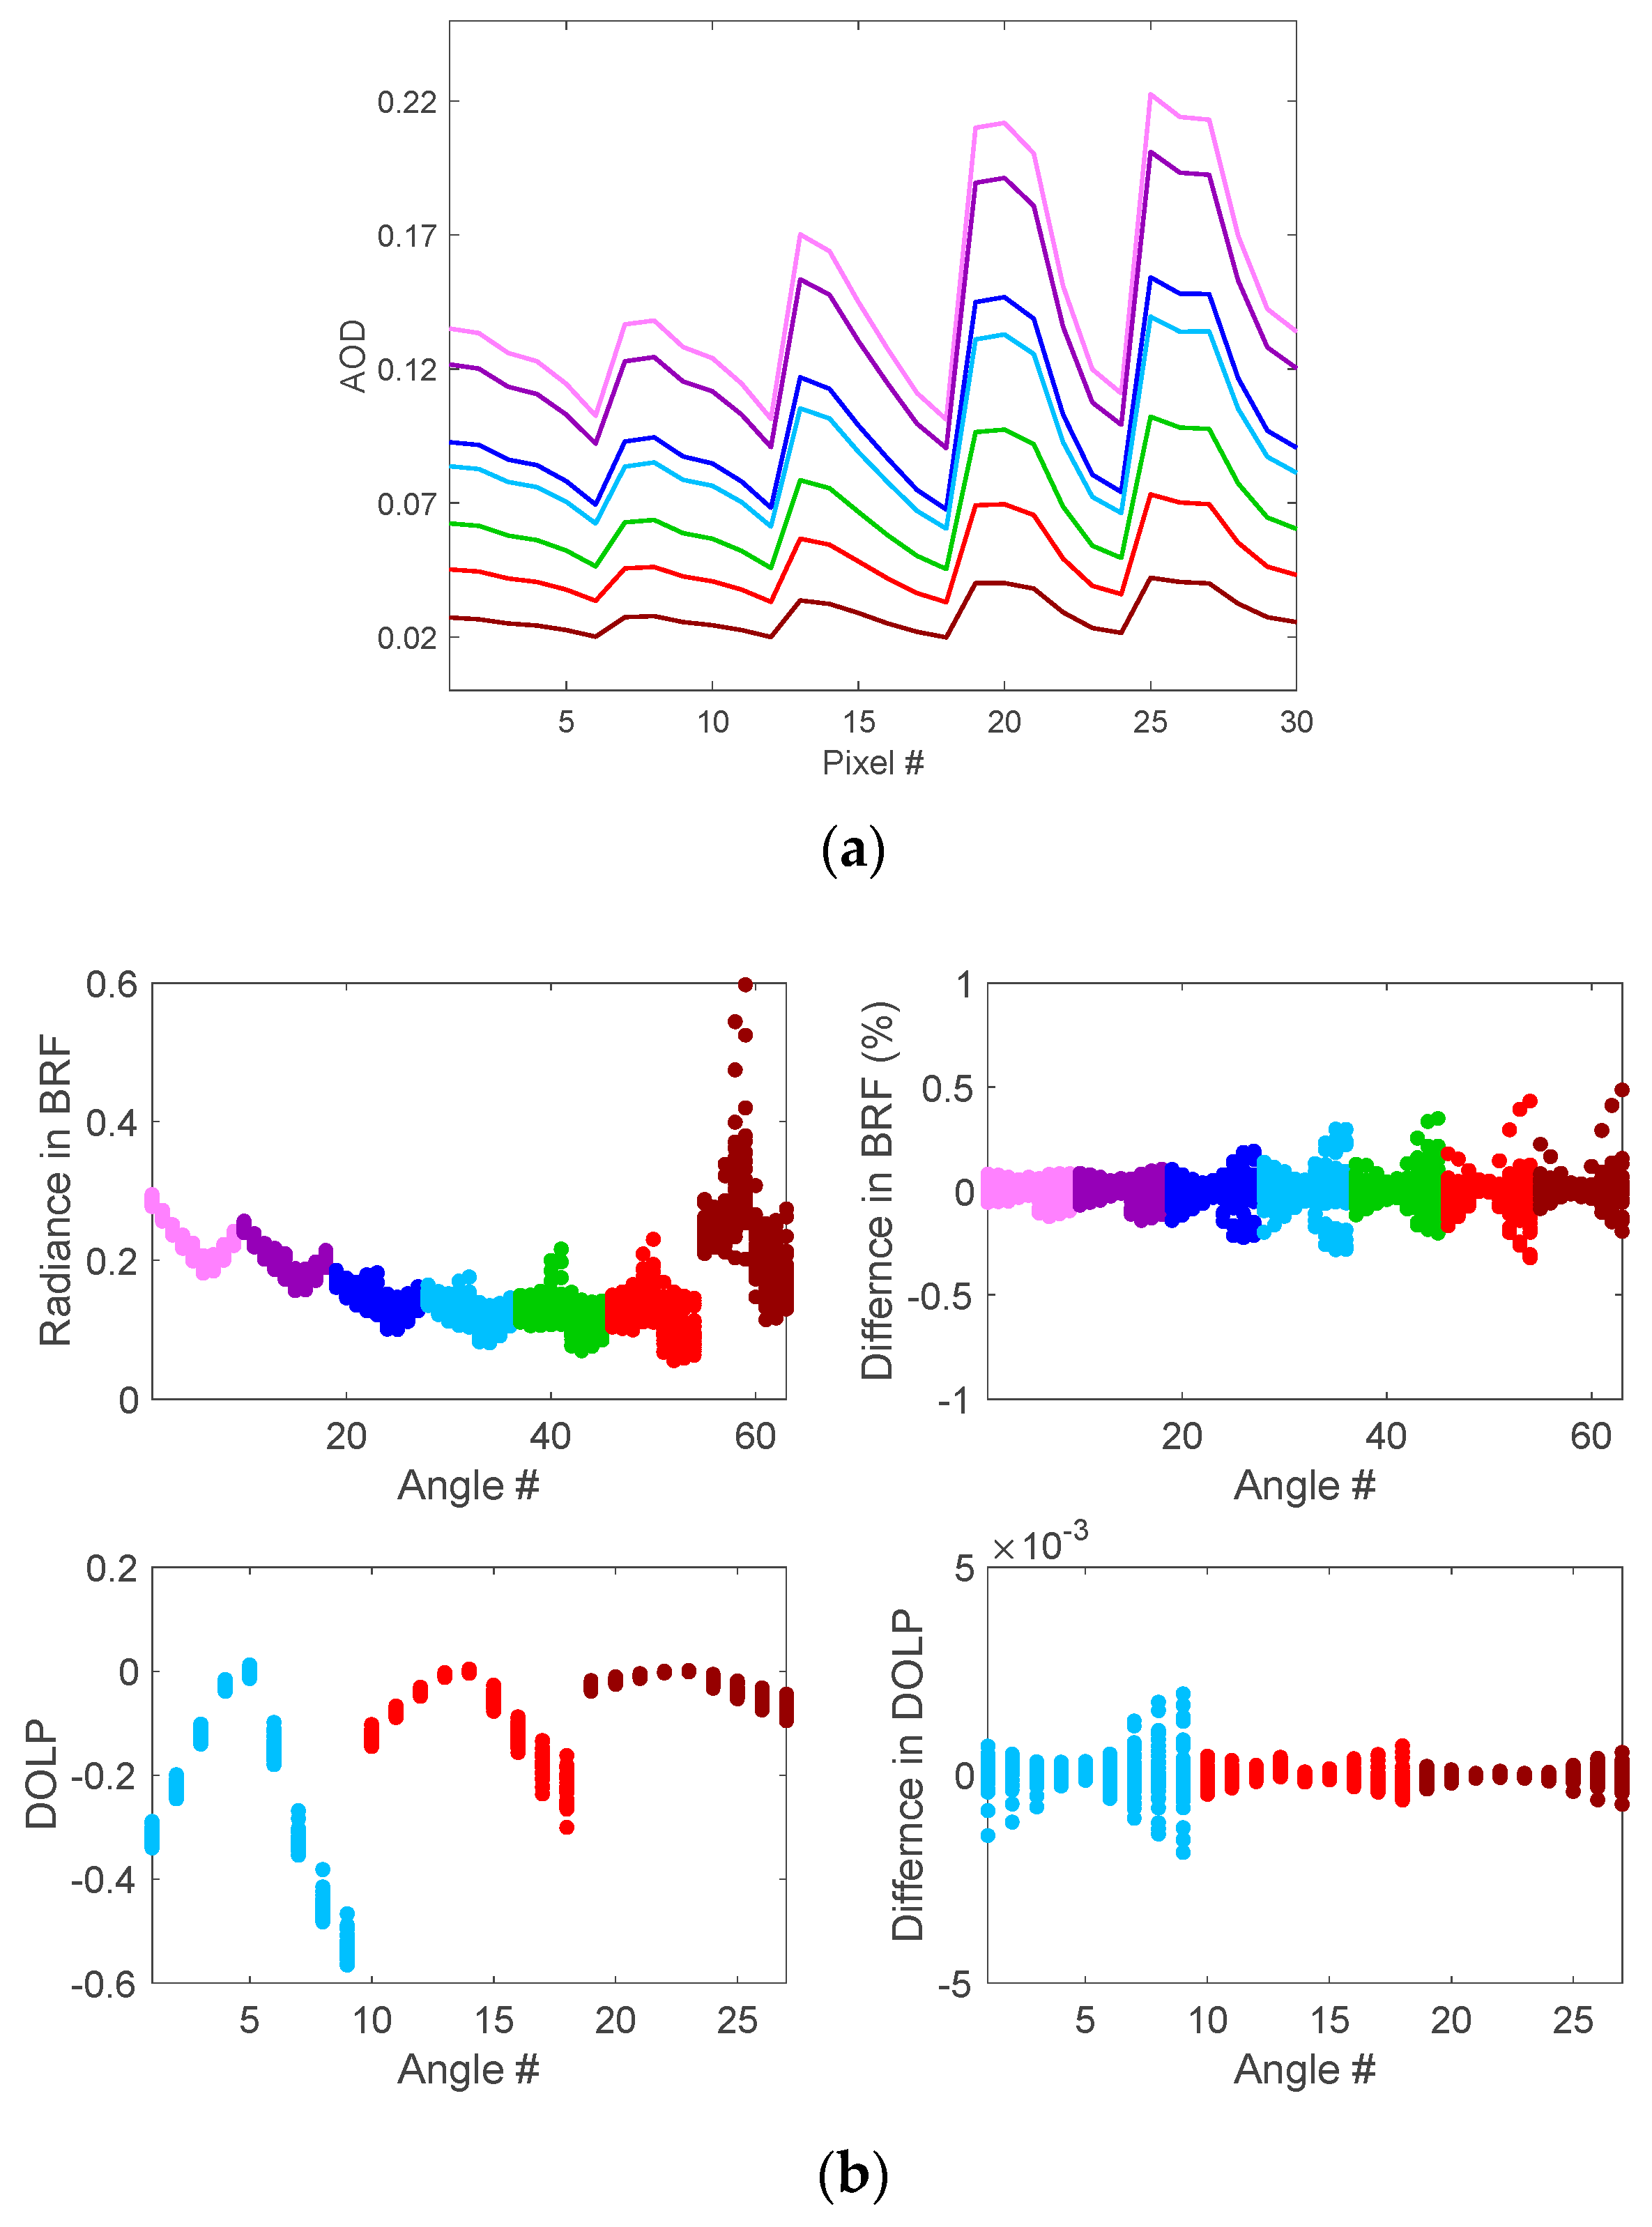
Using three PCs ( N PC = 3), Figure 6 shows a comparison of PC based RT computation of radiance (expressed as bidirectional reflectance factor, BRF) and degree of linear polarization (DOLP) for 30 super-pixels of an AirMSPI image against the RT computation obtained without using PCs. Here, BRF is defined as π I meas d ES 2 / μ 0 E 0 , where I meas is the measured radiance, d ES is the Earth-Sun distance, μ 0 is the cosine of solar zenith angle, and s is the exo-atmospheric solar irradiance. A super-pixel has the resolution of 1 km and is generated by aggregating 100 by 100 original AirMSPI pixels with 10-m resolution. Running RT model over super-pixels can mitigate the errors from the independent pixel approximation [20]. For a variation of aerosol loading up to 100%, the error in computed TOA, BRF, and DOLP from PC-based RT computation is found to be less than ~0.5% and ~0.0025, respectively. These values are smaller than typical instrument errors (e.g., ~4% for radiance and 0.005 for DOLP, which are the instrument requirements for AirMSPI [33]).
Note that the PC-RT model formulated here assumes that aerosol properties are correlated. It is possible, however, that some aerosol fields are not highly correlated. In this case, one can use more PCs to capture the variance. In the worst case scenario of no correlation, the RT calculation defaults to the pixel-by-pixel approach.

4.1.2. Coupling Atmospheric Radiation with Surface Reflection

Using the deterministic Markov chain RT model for a plane-parallel atmosphere ([28], or other RT models), we calculate two sets of reflection and transmission matrices for the atmosphere, ( R atmos , T atmos ) and ( R atmos , T atmos ), which result from illumination at the top and bottom of the atmosphere, respectively. We denote the surface reflection matrix by R surf , which consists of a BRDF component ( R surf ,   BRDF ) and a pBRDF component ( R surf ,   pBRDF ). In accordance with the adding method [29], two matrices Q and S are defined to account for the interaction between the surface and atmosphere, respectively,
S = n = 1 N max Q n
Q n = Q 1 Q n 1
Q 1 = R atmos R surf
Then the matrices for downwelling and upwelling diffuse light at the atmosphere-land interface are given by
D = T atmos + S exp ( τ atmos μ 0 ) + S T atmos
where τ atmos is the optical thickness of the whole atmosphere, as contributed by all atmospheric constituents, and the diffuse upwelling light from the surface is calculated as
U = R Surf exp ( τ atmos μ 0 ) + R Surf D
The reflection matrix of the full CAS is,
R CAS = R atmos exp ( τ atmos μ ) U + T atmos U
For simplicity in describing the conceptual scheme, the superscript “m” that denotes Fourier series order is not shown in the above expressions. In actuality, the TOA radiation fields for the CAS system are reconstructed from all orders of Fourier terms, namely,
BRF TOA = π m = 0 ( 2 δ 0 m ) R CAS , 11 ( m ) cos m ( ϕ v ϕ 0 )
qBRF TOA = π m = 0 ( 2 δ 0 m ) R CAS , 21 ( m ) cos m ( ϕ v ϕ 0 )
uBRF TOA = π m = 0 ( 2 δ 0 m ) R CAS , 31 ( m ) cos m ( ϕ v ϕ 0 )
vBRF TOA = π m = 0 ( 2 δ 0 m ) R CAS , 41 ( m ) cos m ( ϕ v ϕ 0 )
where ( ϕ v ϕ 0 ) is the relative azimuth angle between the view and illumination directions. Equations (113)–(116) describe TOA BRFs for total, linearly polarized, and circularly polarized radiation. When DOLP is used to fit the observations, it is calculated as DOLP qBRF TOA 2 + uBRF TOA 2 / BRF TOA , where we neglect the minor contribution of circular polarization related term ( vBRF TOA ) when it is excluded from polarimetric measurements.

4.2. Jacobian Evaluation

In an iterative way, the optimization algorithm adjusts the state vector that parameterizes aerosol and surface properties to approach the solution. At each iterative step, RT calculations are performed to obtain both the modeled radiation fields and their Jacobians, which describe how the radiation fields vary in response to the small perturbation of state vector components and determine the direction and step size to move for the iterative solution to converge. For an observation vector composed of a series of Nf measurements ( f 1 = [ y 1 ; y 2 ; ; y N f ] ) and a state vector of N a components ( x = [ x 1 ; x 2 ; ; x N a ] ), the Jacobian matrix has the following structure,
K = [ y 1 x 1 y 1 x 2 y 1 x N a y 2 x 1 y 2 x 2 y 2 x N a y N f x 1 y N f x 2 y N f x N a ] N f × N a
Each matrix element is evaluated by use of the finite difference method. Namely, the derivative of modeled i-th data with respect to n-th state vector component is evaluated by,
y i x n = y i ( x n + Δ x n ) y i ( x n Δ x n ) 2 Δ x n
The above equation applies to the calculation of the derivatives of τ aer , tot , τ aer , abs , R, and T with respect to the mean aerosol properties and pixel-resolved PC weights. Then, without applying the finite difference method again, the derivative of quantity Y = { τ aer , tot , τ aer , abs , R, T} at pixel p with respect to an element in k-th PC vector can be derived in a fast manner, namely, from the derivatives with respect to the mean and to the PC weights associated with p-th pixel,
Y p v k ( i ) w p ( k ) Y p x ¯ ( i )
Such a strategy further improves the Jacobian evaluation efficiency when multiple PCs are retrieved.

5. Inversion of Aerosol and Surface Properties

Section 3 provided a general algorithm formulation to retrieve correlated and uncorrelated parameters. This section describes practical specifics in using AirMSPI data to retrieve aerosol and surface properties. In doing so, we assume correlations in aerosol properties, no correlation in surface properties, and no correlation between aerosol and surface properties.
The first guesses of PCs, PC weights, and mean aerosol fields are derived from a training dataset, which contains all historical AirMSPI retrievals for selected scenes with the criteria of well-calibrated measurements, clear-sky conditions, and collocated ground observations. The aerosol fields include spectrally dependent real and imaginary parts of the aerosol refractive index, volume concentrations of multiple aerosol size components, nonspherical particle fraction, and Gaussian profile-based parameterization of aerosol layer height and standard deviation [19]. Constrained by the information content in polarimetric observations, we retrieve aerosol properties by assuming a single layer, and an “effective” set of aerosol properties for the single layer that fits the polarimetric observations is derived.
With these assumptions, the correlated aerosol parameters include volume concentration as a function of five size components ( C v 1 N S C with N SC = 5 as adopted in [19]), real and imaginary parts of refractive index ( n r and n i ), Gaussian distribution-based vertical profile parameterized by central height h a and standard deviation s a , and the volume fraction of spherical particles ( f v ,   sphere ). Then, the parameter spaces described at the beginning of Section 3 are specified as follows,
x ¯ corr = log [ C ¯ v 1     C ¯ v N SC x ¯ corr , 1 T , n ¯ r ,   λ 1   n ¯ r ,   λ 7 x ¯ corr , 2 T , n ¯ i ,   λ 1   n ¯ i ,   λ 7 x ¯ corr , 3 T , h ¯ a x ¯ corr , 4 , s ¯ a x ¯ corr , 5 ,   f ¯ v ,   sphere x ¯ corr , 6 ] T
v = [ v 1   v 2   v N PC ]
with
v k = [ v k , C v 1     v k , C v 5 v k , 1 T , v k , n r ,   λ 1   v k , n r ,   λ 7 v k , 2 T , v k , n i ,   λ 1   v k , n i ,   λ 7 v k , 3 T , v k , h a v k , 4 ,   v k , s a v k , 5 ,   v k , f v ,   sphere v k , 6 ] T
w = [ w 1   w 2   w N pixel ] ,   with   w p = [ w p ( 1 ) ; w p ( 2 ) ; ; w p ( N PC ) ]
x p , uncorr = [ x p , uncorr , 1 ; x p , uncorr , 2 ;   ; x p , uncorr , N TP , uncorr ]
with N TP , uncorr = 6 types of uncorrelated parameters, including the BRDF spectral weight a λ (j = 1), anisotropy parameter k λ (j = 2), anisotropy parameter g λ (j = 3), pBRDF weight ϵ λ (j = 4), shadowing width k γ (j = 5), and slope variance σ s (j = 6), namely,
x p , uncorr ,   j = 1 = [ a p ( λ 1 ) ; a p ( λ 2 ) ;   ;   a p ( λ 7 ) ]
x p , uncorr ,   j = 2 = [ k p ( λ 1 ) ; k p ( λ 2 ) ;   ;   k p ( λ 7 ) ]
x p , uncorr ,   j = 3 = [ g p ( λ 1 ) ; g p ( λ 2 ) ; ;   g p ( λ 7 ) ]
x p , uncorr ,   j = 4 = [ ε p ( λ 1 ) ; ε p ( λ 2 ) ;   ;   ε p ( λ 7 ) ]
x p , uncorr ,   j = 5 = [ k γ , p ]
x p , uncorr ,   j = 6 = [ σ s , p 2 ]
In Equation (120), the natural logarithm is used to ensure non-negativity of the solution after dynamic updates during the iterative optimization process. Though not noted here, the angular shape parameter “g” with the RPV model needs to be offset by a constant before being transformed into logarithmic space.
An overview of correlated multi-pixel inversion of aerosol properties and surface reflection algorithm flow is shown in Figure 7. As part of the state vector, the PCs of the correlated aerosol microphysical properties are derived from a training dataset from climatology or other sources. As another part of the state vector, uncorrelated parameters (such as surface reflection properties) are initialized to be static [19]. The inversion is stabilized by applying a priori constraints on smooth variations of certain aerosol and surface properties in spatial and spectral dimensions. Iterations repeat until convergence is achieved. For the retrieval tests in this study, it takes five to seven iterations for the solution to converge.
As demonstrated in earlier POLDER and AirMSPI retrievals [6,19], imposition of temporal constraints on the variation of surface reflectance can improve aerosol and surface retrievals. In this case, multiple scenes acquired from revisits of a target have to be used. This functionality is not turned on in the following retrieval tests to simplify the demonstration.

5.1. AirMSPI Datasets

The retrieval algorithm is designed to retrieve column aerosol and surface reflection properties from observations by AirMSPI, which flies on NASA’s ER-2 aircraft at an altitude of 20 km and operates in eight spectral channels: 355, 380, 445, 470*, 555, 660*, 865*, and 935 nm, with the asterisk denoting polarimetric bands, in which the Stokes parameters Q and U are measured in addition to radiance I. Images of each targeted area were obtained at 9 viewing angles: 0° (nadir), ±29°, ±48°, ±59°, and ±66° in AirMSPI’s step-and-stare mode. At nadir, the imaged area covers a 10 km × 11 km region and the data are mapped to a 10-m spatial grid. Without using the water-vapor influenced band (935 nm), a total of 117 signals per pixel are used, which include 63 radiances (transformed to logarithmic space in retrieval) at nine angles and seven spectral bands, and 27 signals of q = Q/I and another 27 signals of u = U/I in the three polarimetric bands. Retrievals for all pixels of a surface area viewed from all 9 angles are performed simultaneously. The measurement errors are adopted as 4% for radiance (to account for angle-to-angle and pixel-to-pixel uncertainties) and 0.005 for DOLP.
A wide range of atmospheric conditions and terrestrial environments have been covered by AirMSPI during over a hundred flights in several airborne campaigns. In this paper, we use AirMSPI data from the Polarimeter Definition Experiment (PODEX) (January to February 2013), Studies of Emissions, Atmospheric Composition, Clouds, and Climate Coupling by Regional Surveys (SEAC4RS) (August to September 2013), CalWater-2 (January to March 2015), and Imaging Polarimetric Assessment and Characterization of Tropospheric Particulate Matter (ImPACT-PM) (July 2016) campaigns. From these, 27 AirMSPI step-and-stare data collection sequences were identified to be cloud-free and collocated with AERONET sun photometers for retrieval validation. Locations of these AERONET sites and AirMSPI/AERONET measurement times can be found in a previous study [19]. To control the strength of multiple types of constraints, the initial values of Lagrange multipliers for the two PCs used in our retrieval are provided in Table 3, Table 4 and Table 5. Note that the difference between Table 3 and Table 4 and Table 5 is that Table 3 and Table 4 are for constructing the smoothness constraints over the correlated fields constructed from the combined set of PCs and PC weights. Table 5 is for constructing the smoothness constraints over PC weights and PC vectors separately. Table 3, Table 4 and Table 5 also list the first guesses of the relevant state vector components and the order of difference for imposing the smoothness constraints on these components.

5.2. Retrieval Validation against AERONET Products

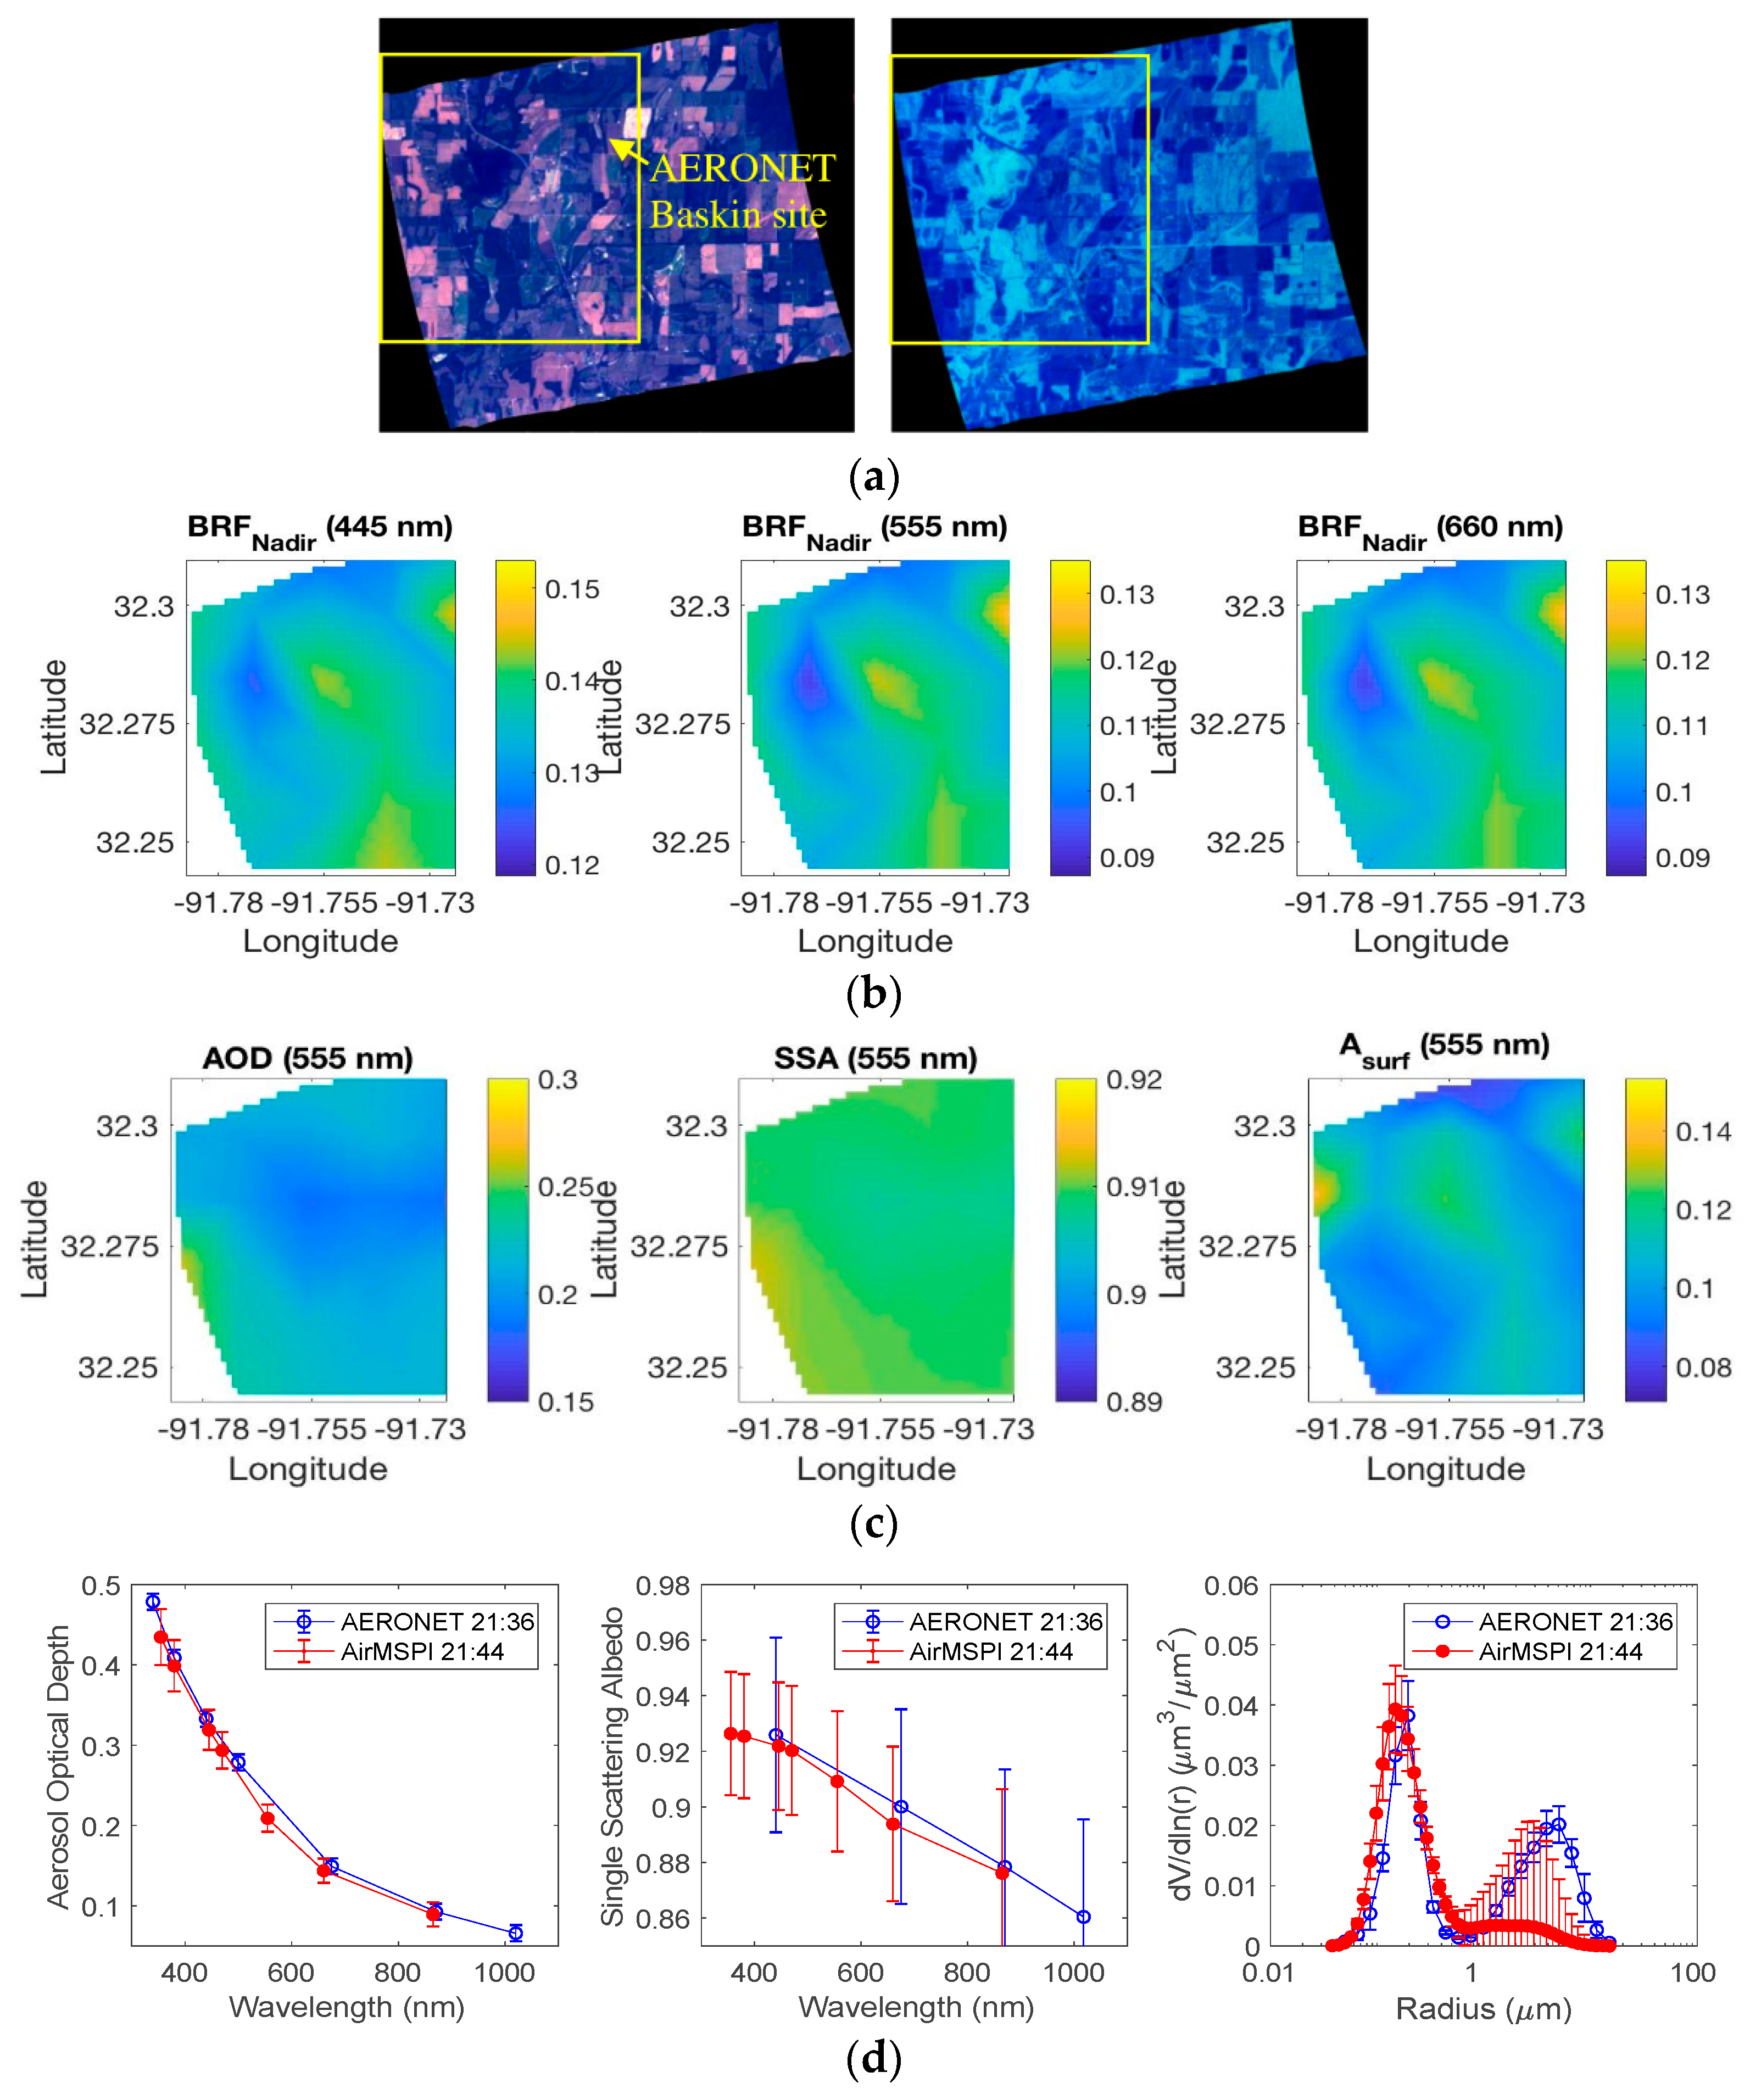
The retrieved AirMSPI AOD, SSA, size distribution, and refractive index are validated against AERONET Level 1.5 aerosol products. We choose Level 1.5 AERONET product (cloud-screened and quality controlled), as it reports more fields to validate our retrievals. Though the Level 2.0 AERONET product (quality-assured) has higher confidence, the SSA, refractive index, and aerosol size distribution fields were not all generated in 27 test cases. However, for the fields reported by both versions, negligible differences were observed. As a first check, a retrieval is performed using AirMSPI observations acquired on September 9, 2013, over the AERONET Baskin, Louisiana, site which is located at longitude = −91.738° and latitude = 32.282°. The left image in Figure 8a shows nadir radiance using the spectral band combination of 445, 555, and 660 nm, while the right image displays DOLP at 470, 660, and 865 nm. The retrievals are performed over the area viewed in common at all 9 AirMSPI view angles, outlined by the yellow box. Figure 8b shows TOA BRF at 445, 555, and 660 nm in the left, middle, and right panels, respectively, for the retrieval area with spatial resolution ~1.0 km. Figure 8c shows maps of retrieved AOD, SSA, and surface albedo (Asurf) at 555 nm in the left, middle, and right panels, respectively. The retrieved AOD, SSA, and volume weighted aerosol size distribution for the atmosphere above the super-pixel closest to the Baskin site is compared to the AERONET reference data in the left, middle, and right panels of Figure 8d. Good agreement (quantified below) is obtained for all of these quantities, except for the coarse particle size distribution, likely due to the lack of bands longward of 1000 nm in AirMSPI. Generally, the difference between AirMSPI retrievals of AOD, SSA, and size distribution and AERONET reference data is within their retrieval uncertainties. The AirMSPI uncertainties plotted in Figure 8d are estimated as the root mean square of the retrieval uncertainties of these aerosol quantities and the standard deviation of their variations over the whole image. The AERONET uncertainties consist of two parts: temporal variation within the ±~1-h window centered on the AirMSPI nadir overpass time, and aerosol measurement and retrieval error [34]. A temporally closest AERONET reference data was identified compare to AirMSPI retrieval at the spatially closest pixel. To account for airmass change during the measurements, the ±~1-h window centered on AirMSPI nadir overpass time is used to calculate the AERONET uncertainty from temporal variation.
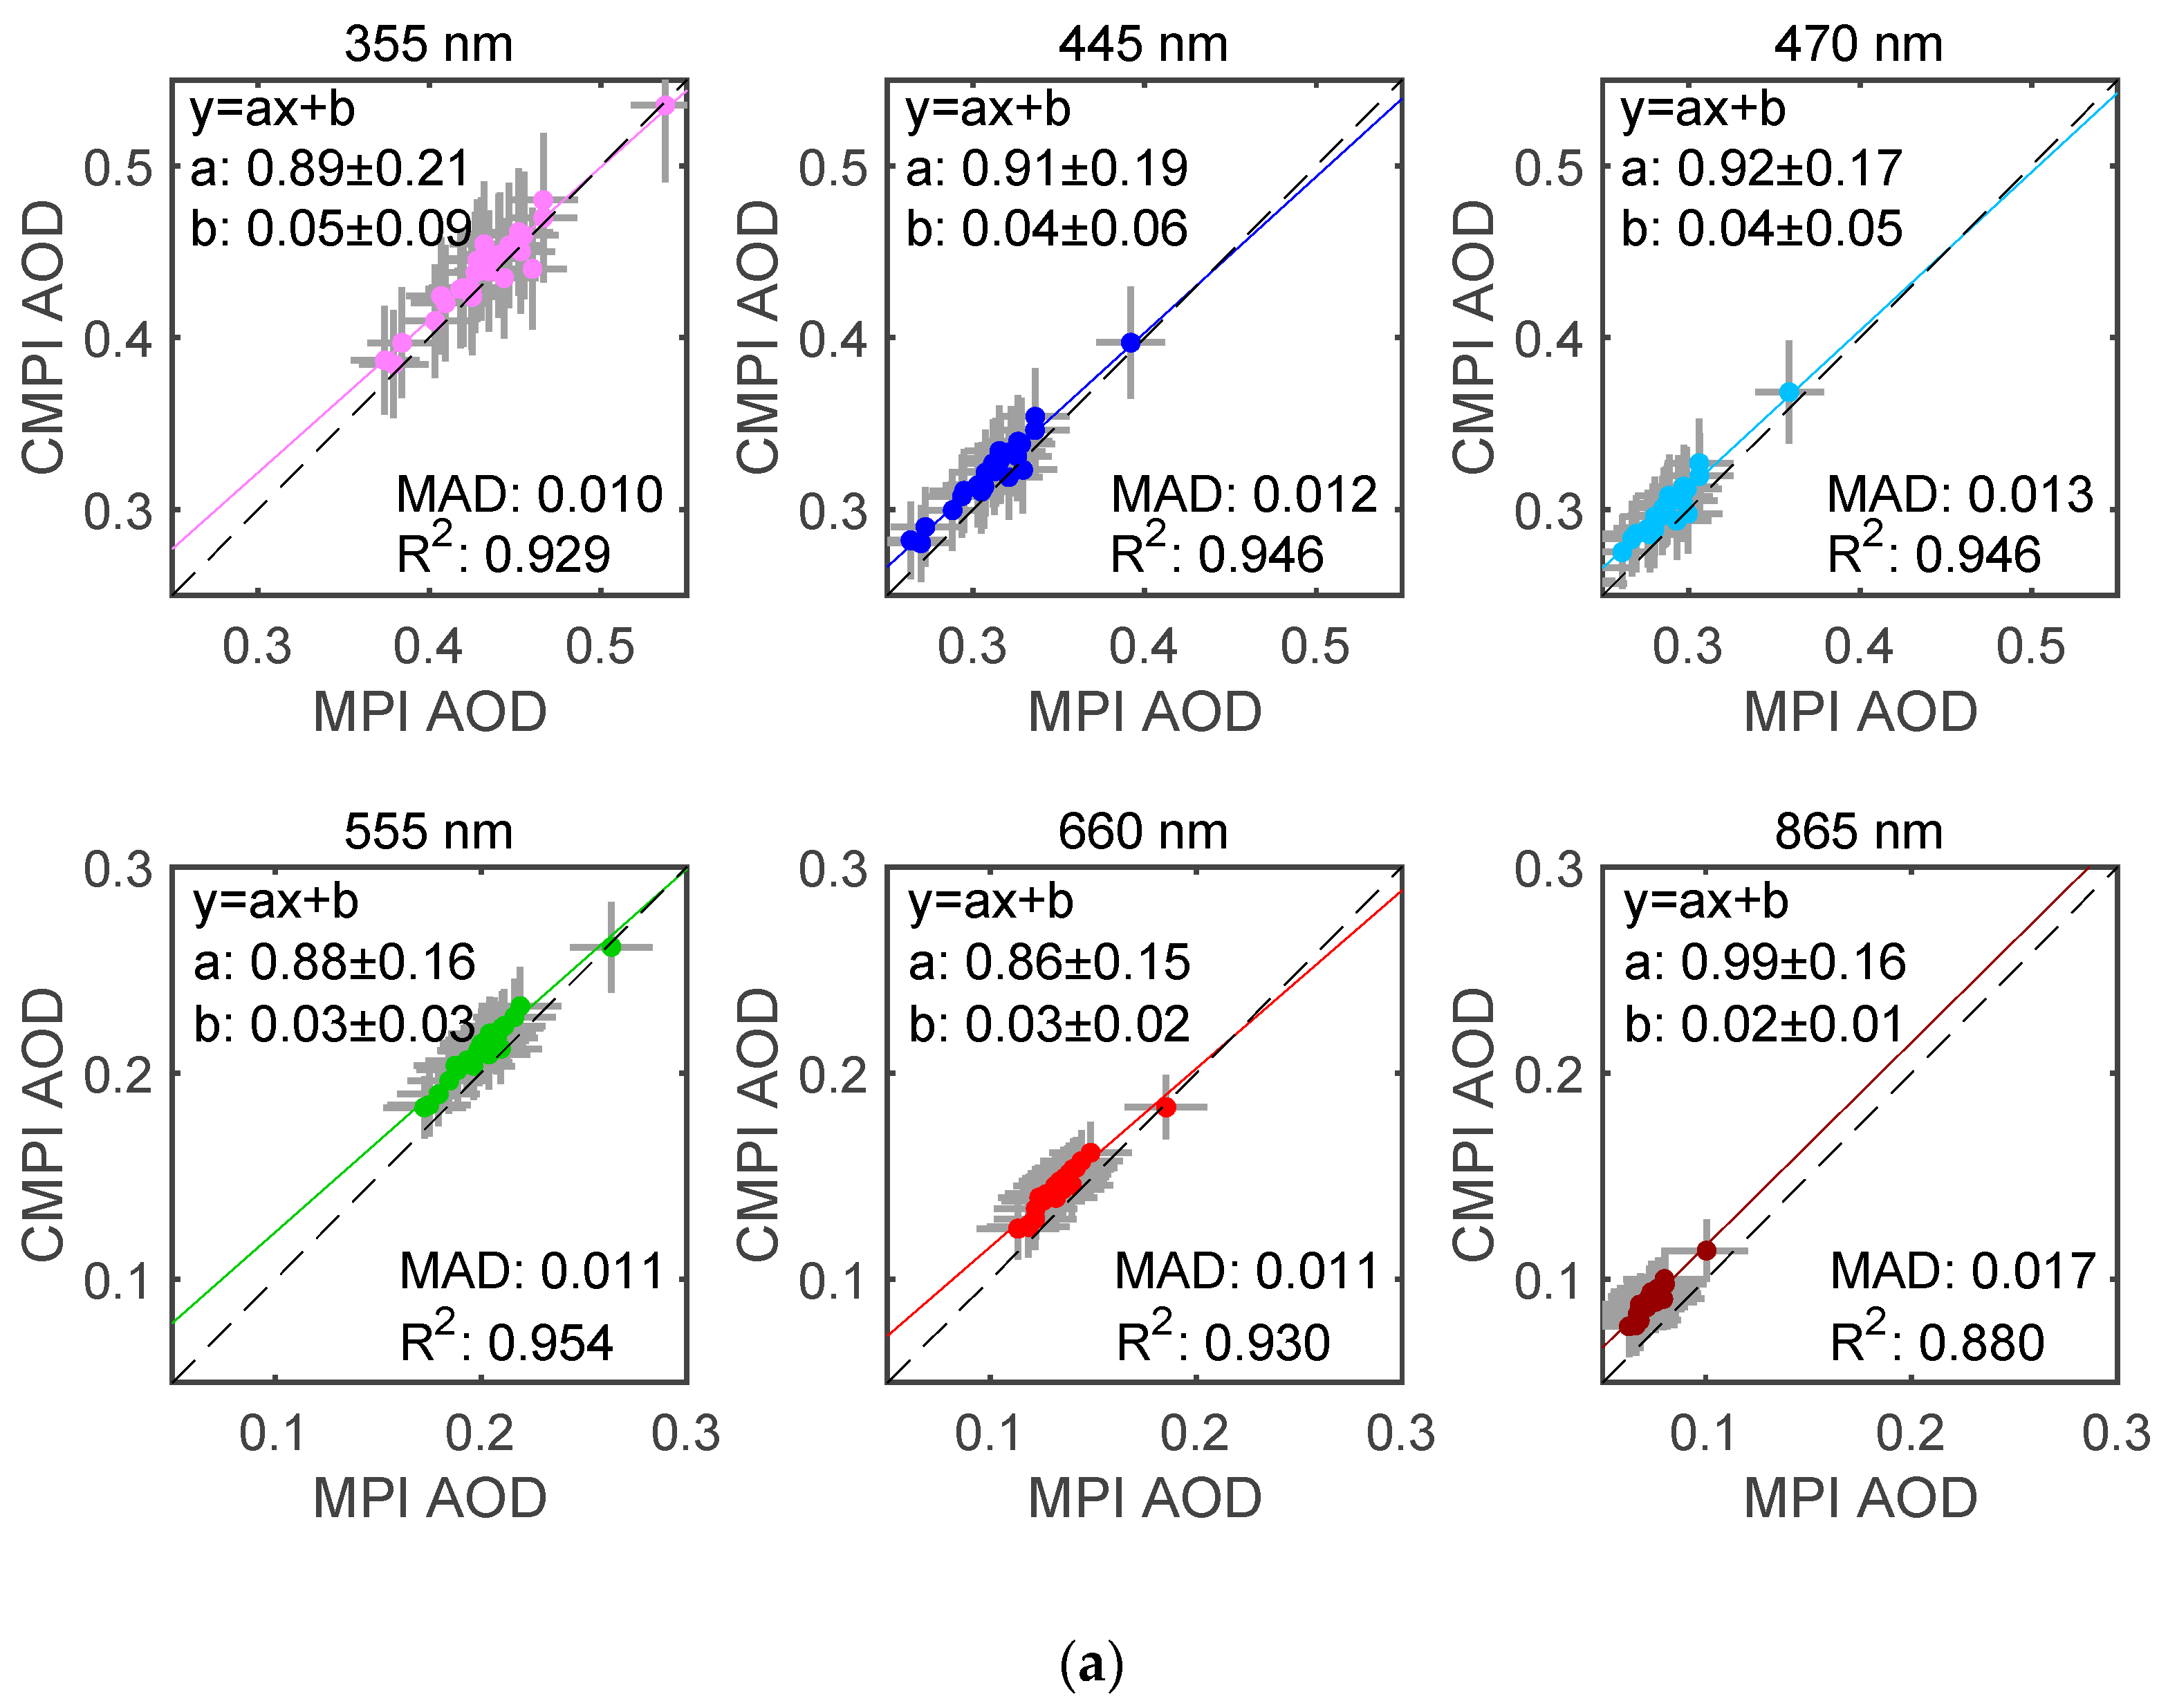
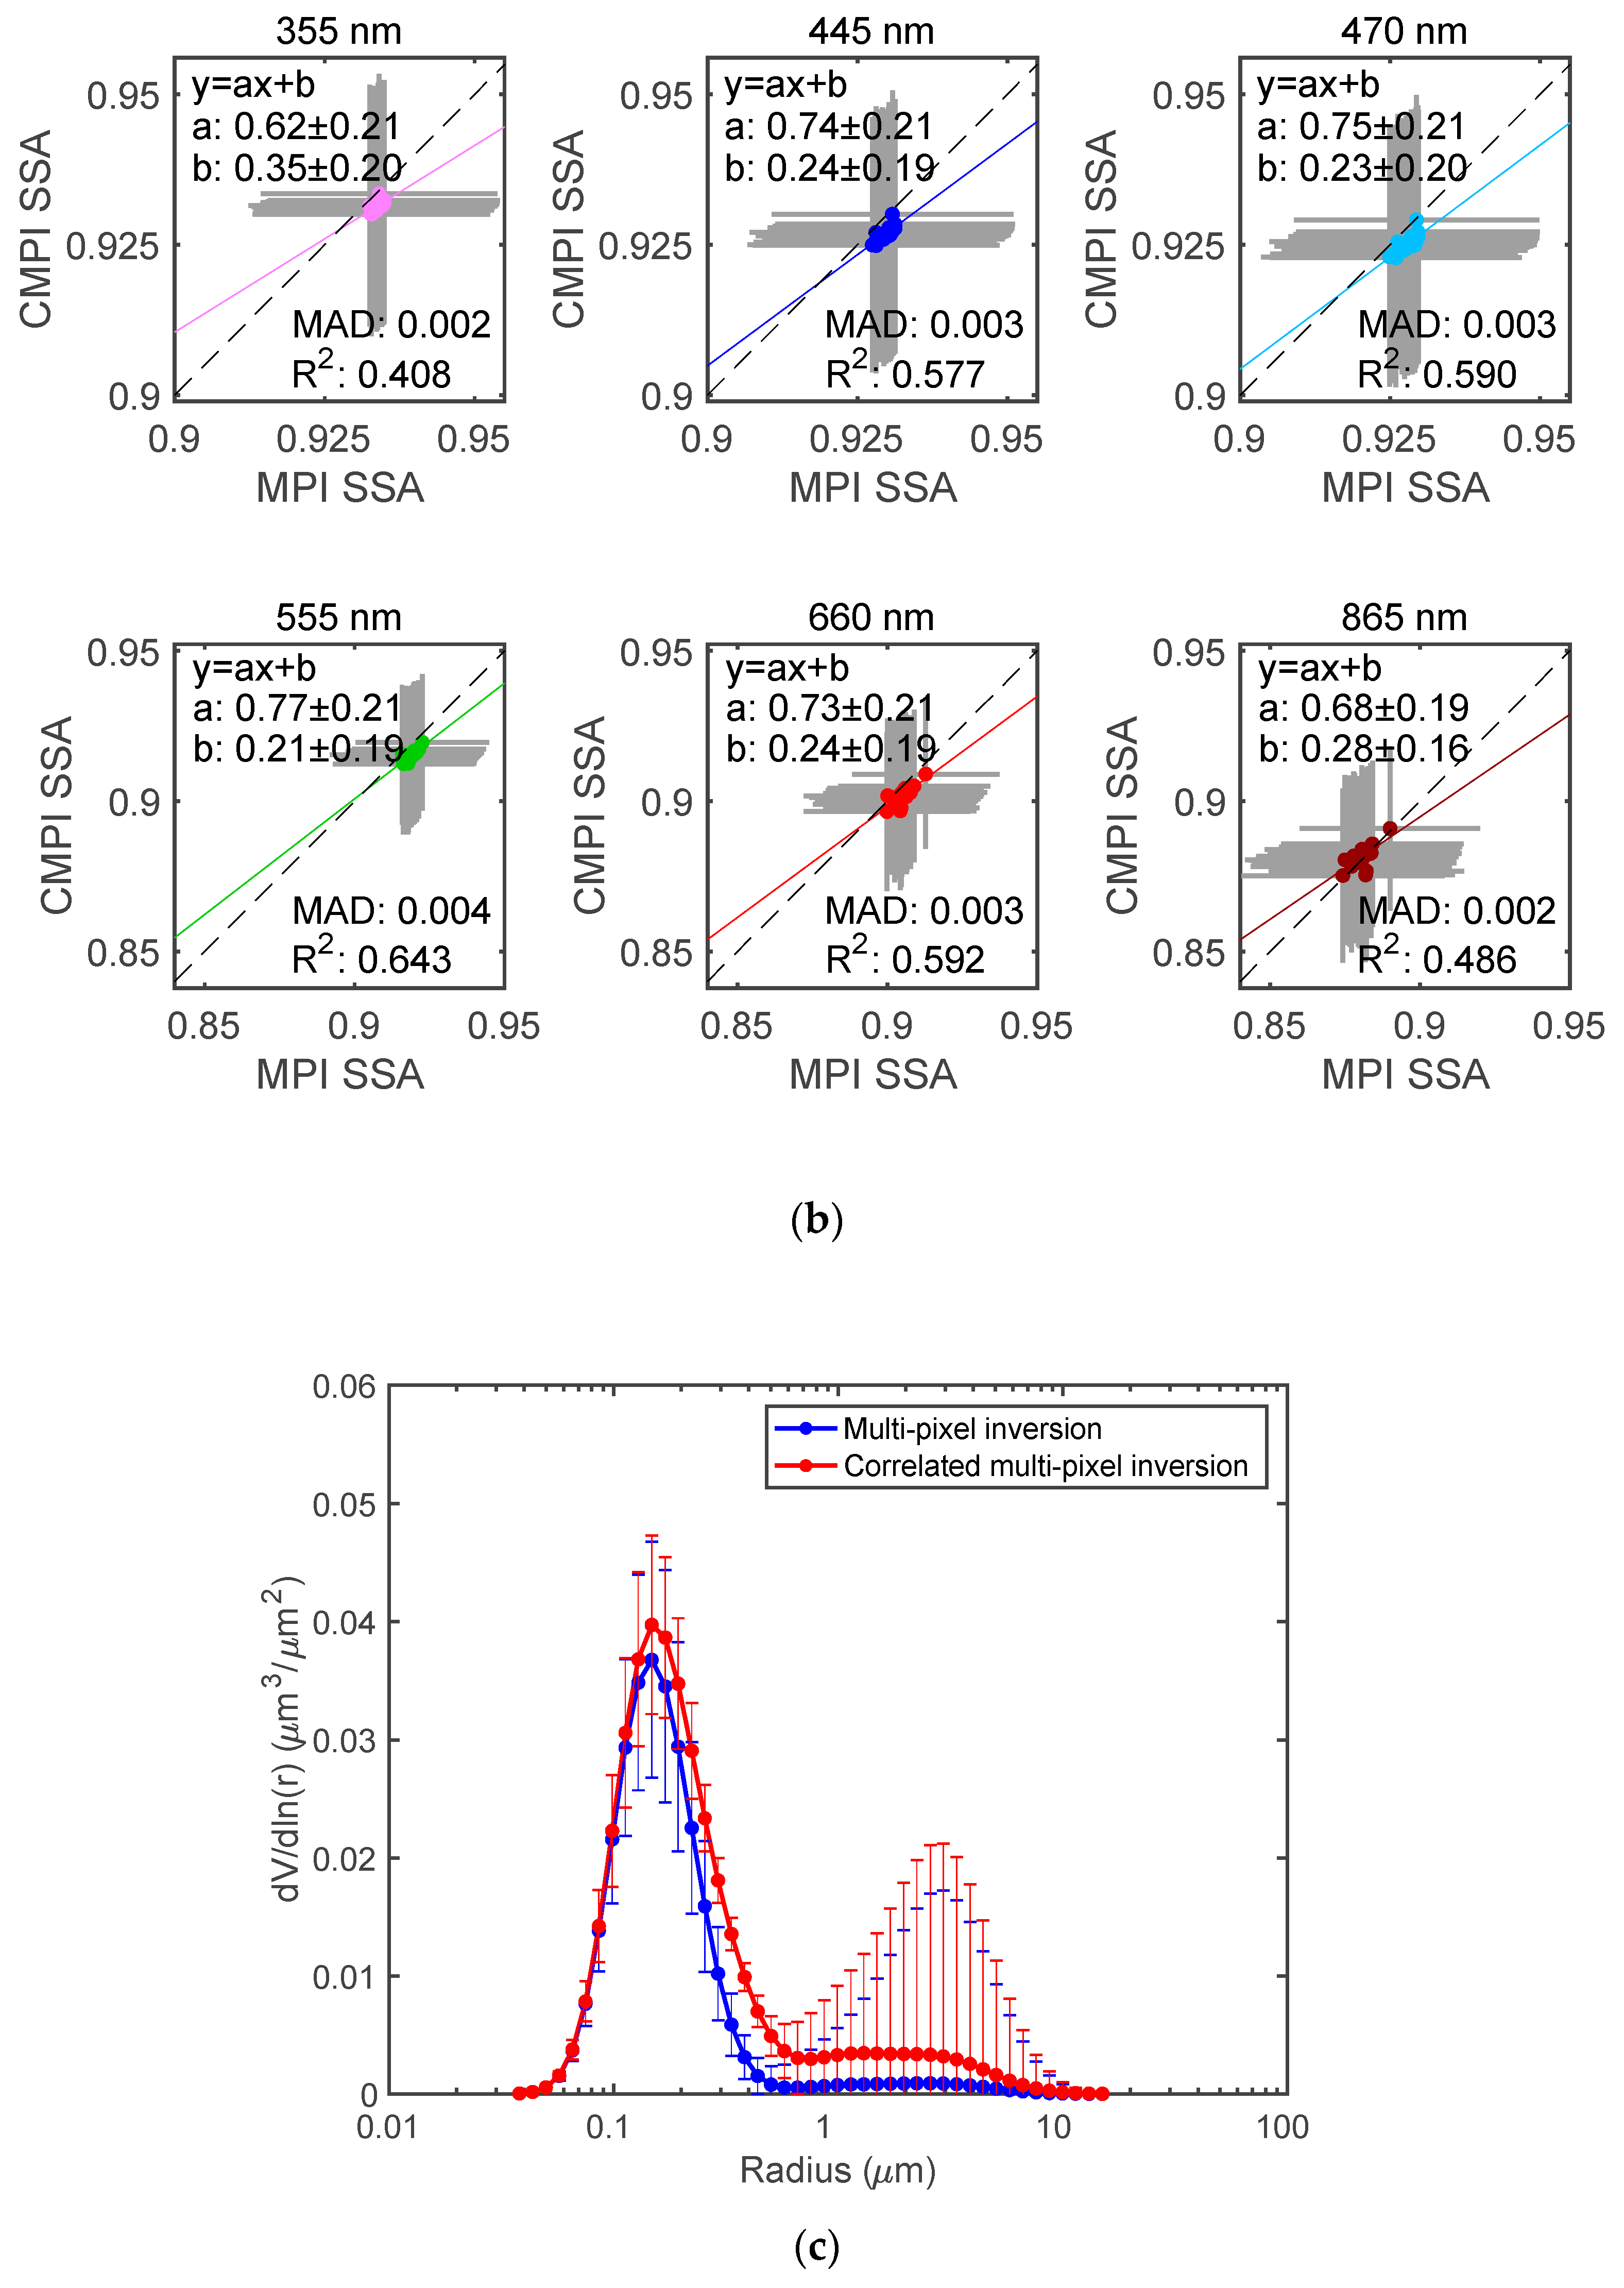
Figure 9 shows a comparison of retrieved pixel-resolved AODs, SSAs, and aerosol size distributions (dV/dln(r), in μm3/μm2) from the correlated multi-pixel inversion with those retrieved using original multi-pixel algorithm adapted for AirMSPI [19]. The AOD results for seven AirMSPI spectral bands are plotted in different colors: pink (355 nm), purple (380 nm), dark blue (445 nm), light blue (470 nm), green (555 nm), red (660 nm), and brown (865 nm). Linear regression is performed to obtain slope a, intercept b, as well as the coefficient of determination R2. The mean absolute difference (MAD) in AERONET and AirMSPI results is also calculated to measure the overall deviation. Strong correlation and low bias (R2 ≥ 0.88, a ~ 0.90, b ≤ 0.05, and MAD < 0.02) are observed. It can also be observed that a variation of aerosol loading by ~30% around the mean (namely in the range 0.28 ≤ AOD 445 n m ≤ 0.40 with mean value 0.32) across the retrieval area is captured by the correlated multi-pixel inversion. Implementation of our approach using several datasets with even higher (~90%) variation of aerosol loading over several smoke scenes acquired by AirMSPI during the recent Aerosol Characterization from Polarimeter and Lidar (ACEPOL) campaign showed the algorithm to be capable of capturing this variation. The regression in Figure 9b shows correlations and low bias of SSAs ( R 2 > 0.40, a > 0.60, b < 0.030, and MAD ≤ 0.004) from the two inversions as well. Figure 9c shows basic consistency in the retrieved aerosol size distributions: both algorithms find the peaks of fine and coarse mode aerosol size to be around ~0.15 μm and ~2 μm, respectively. Due to the lower sensitivity of AirMSPI’s longest wavelength 865 nm to coarse mode aerosols, some differences in coarse mode aerosol size can be observed. This indicates the impact of insufficient observational information about certain aerosol properties. Comparisons of pixel-scale AOD, SSA, and size distribution at other retrieval cases show a similar quality of agreement.
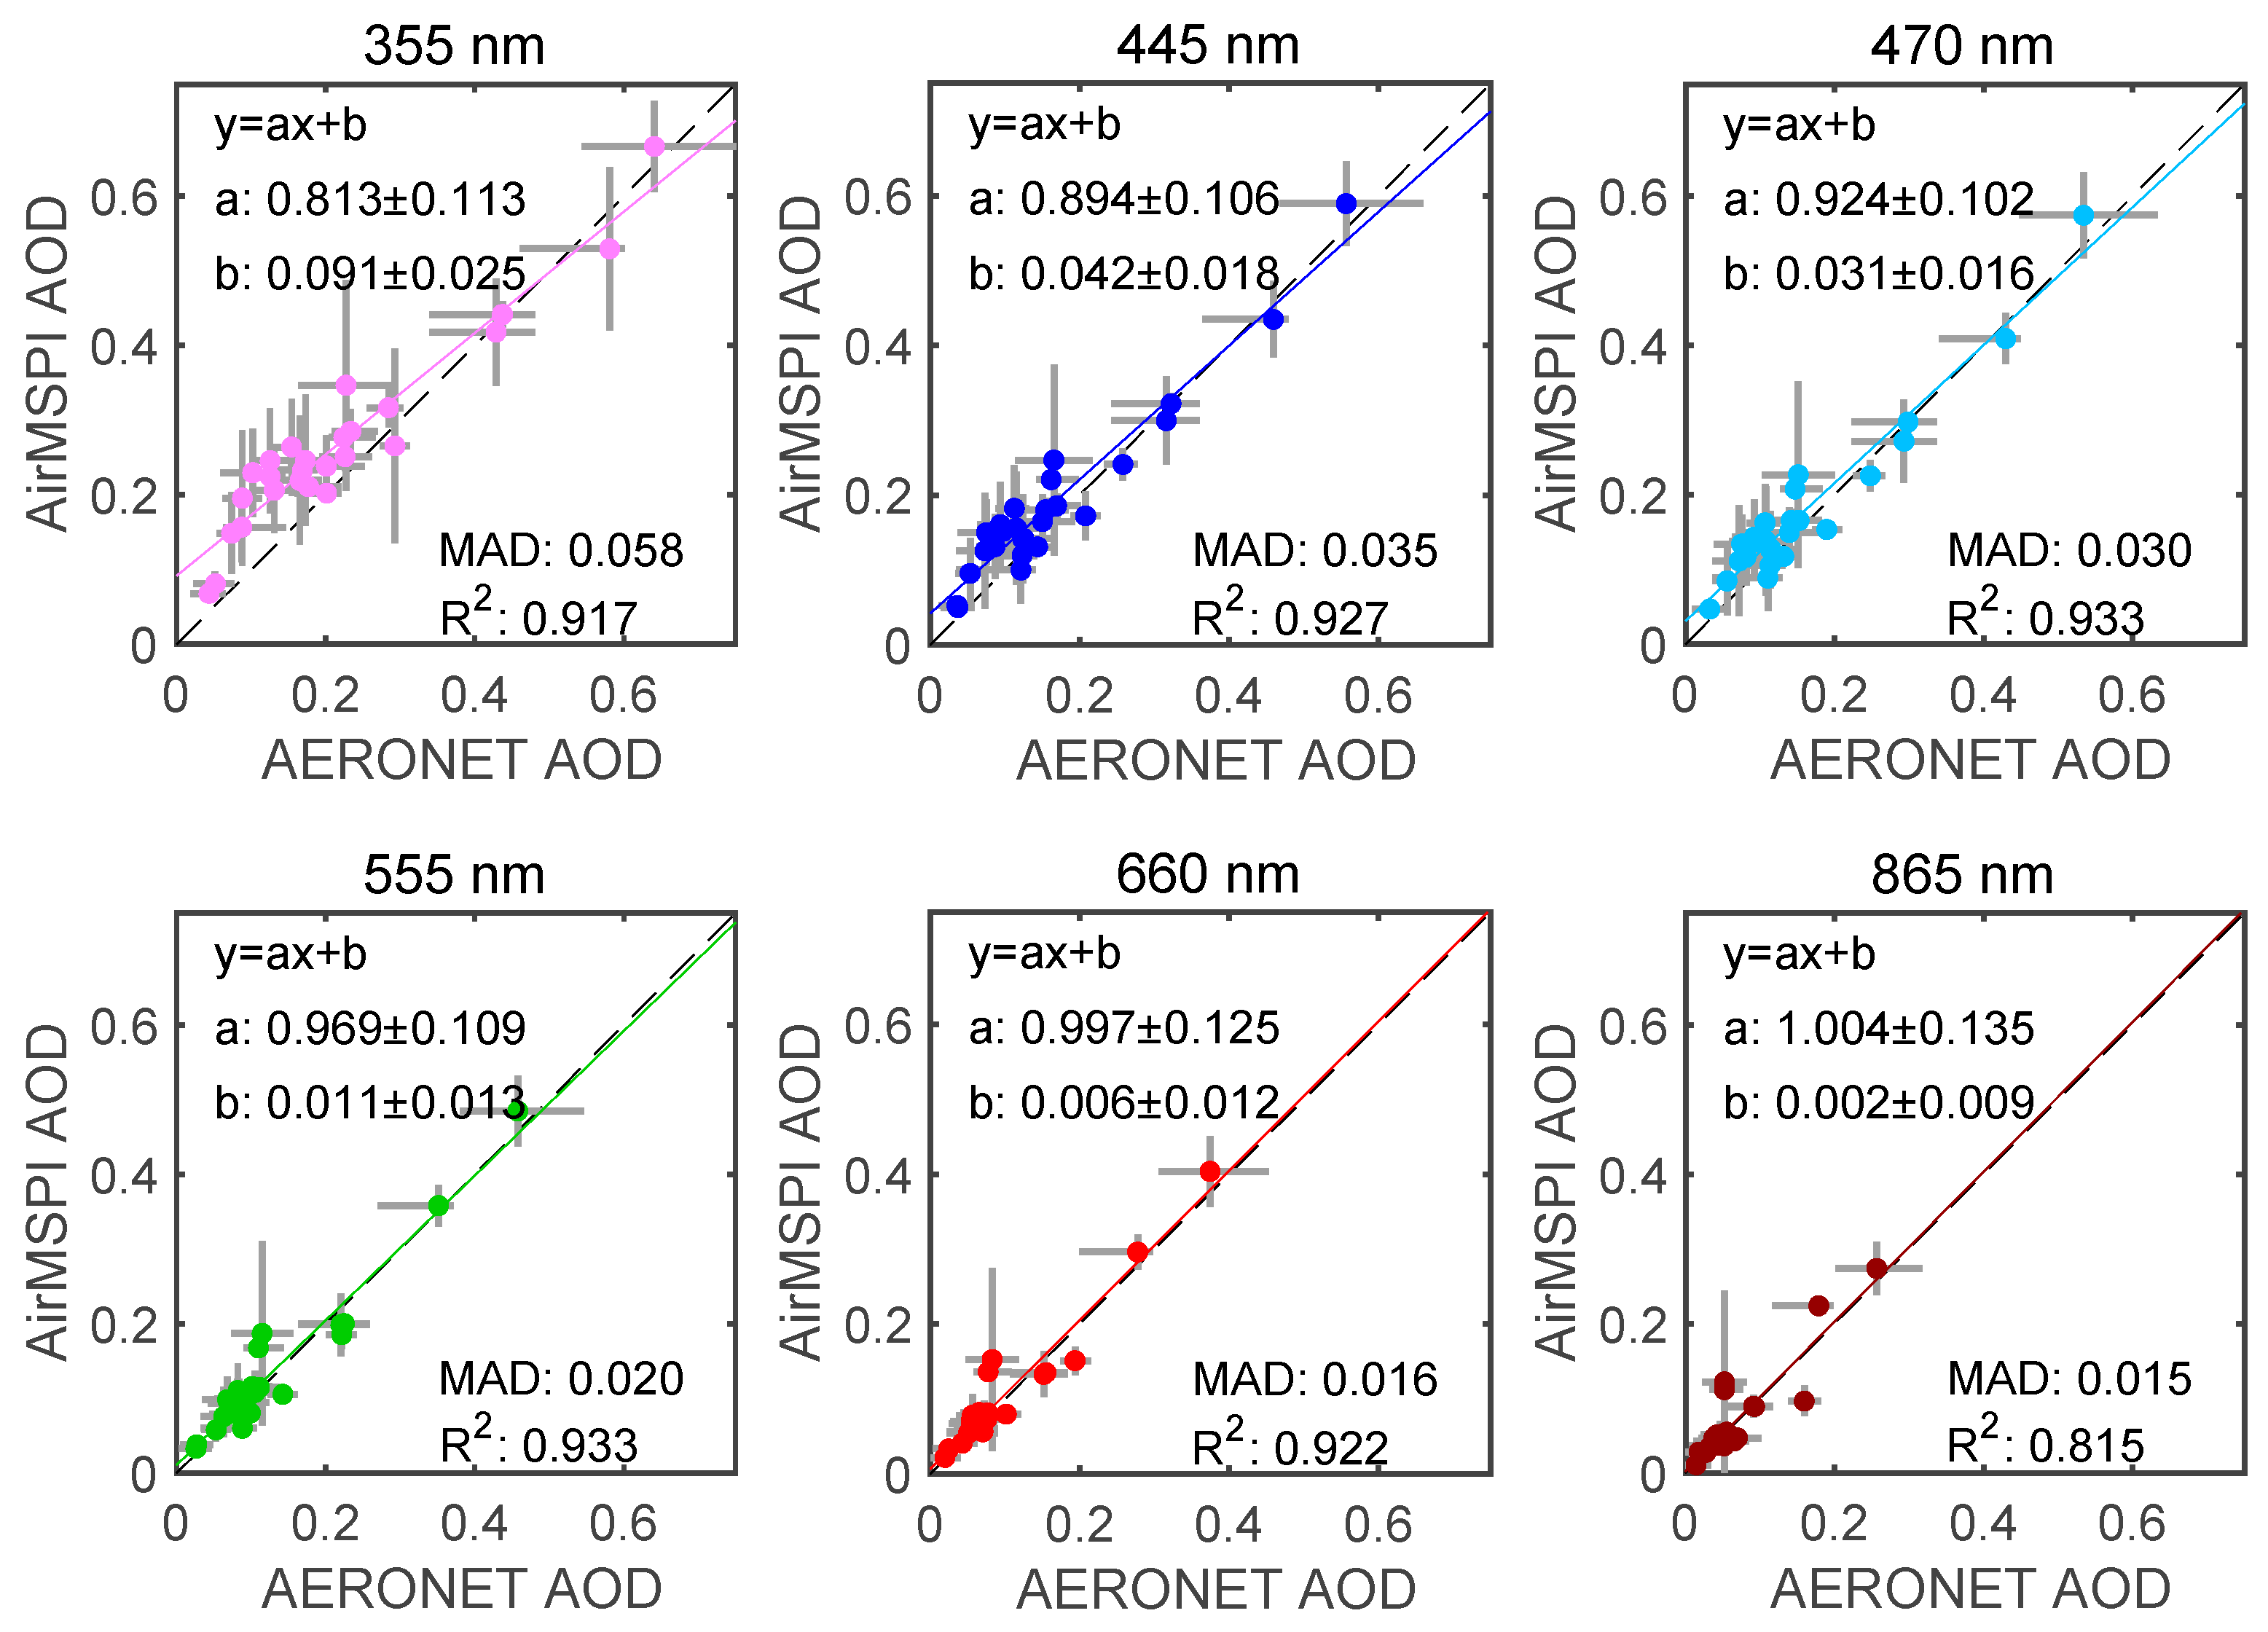
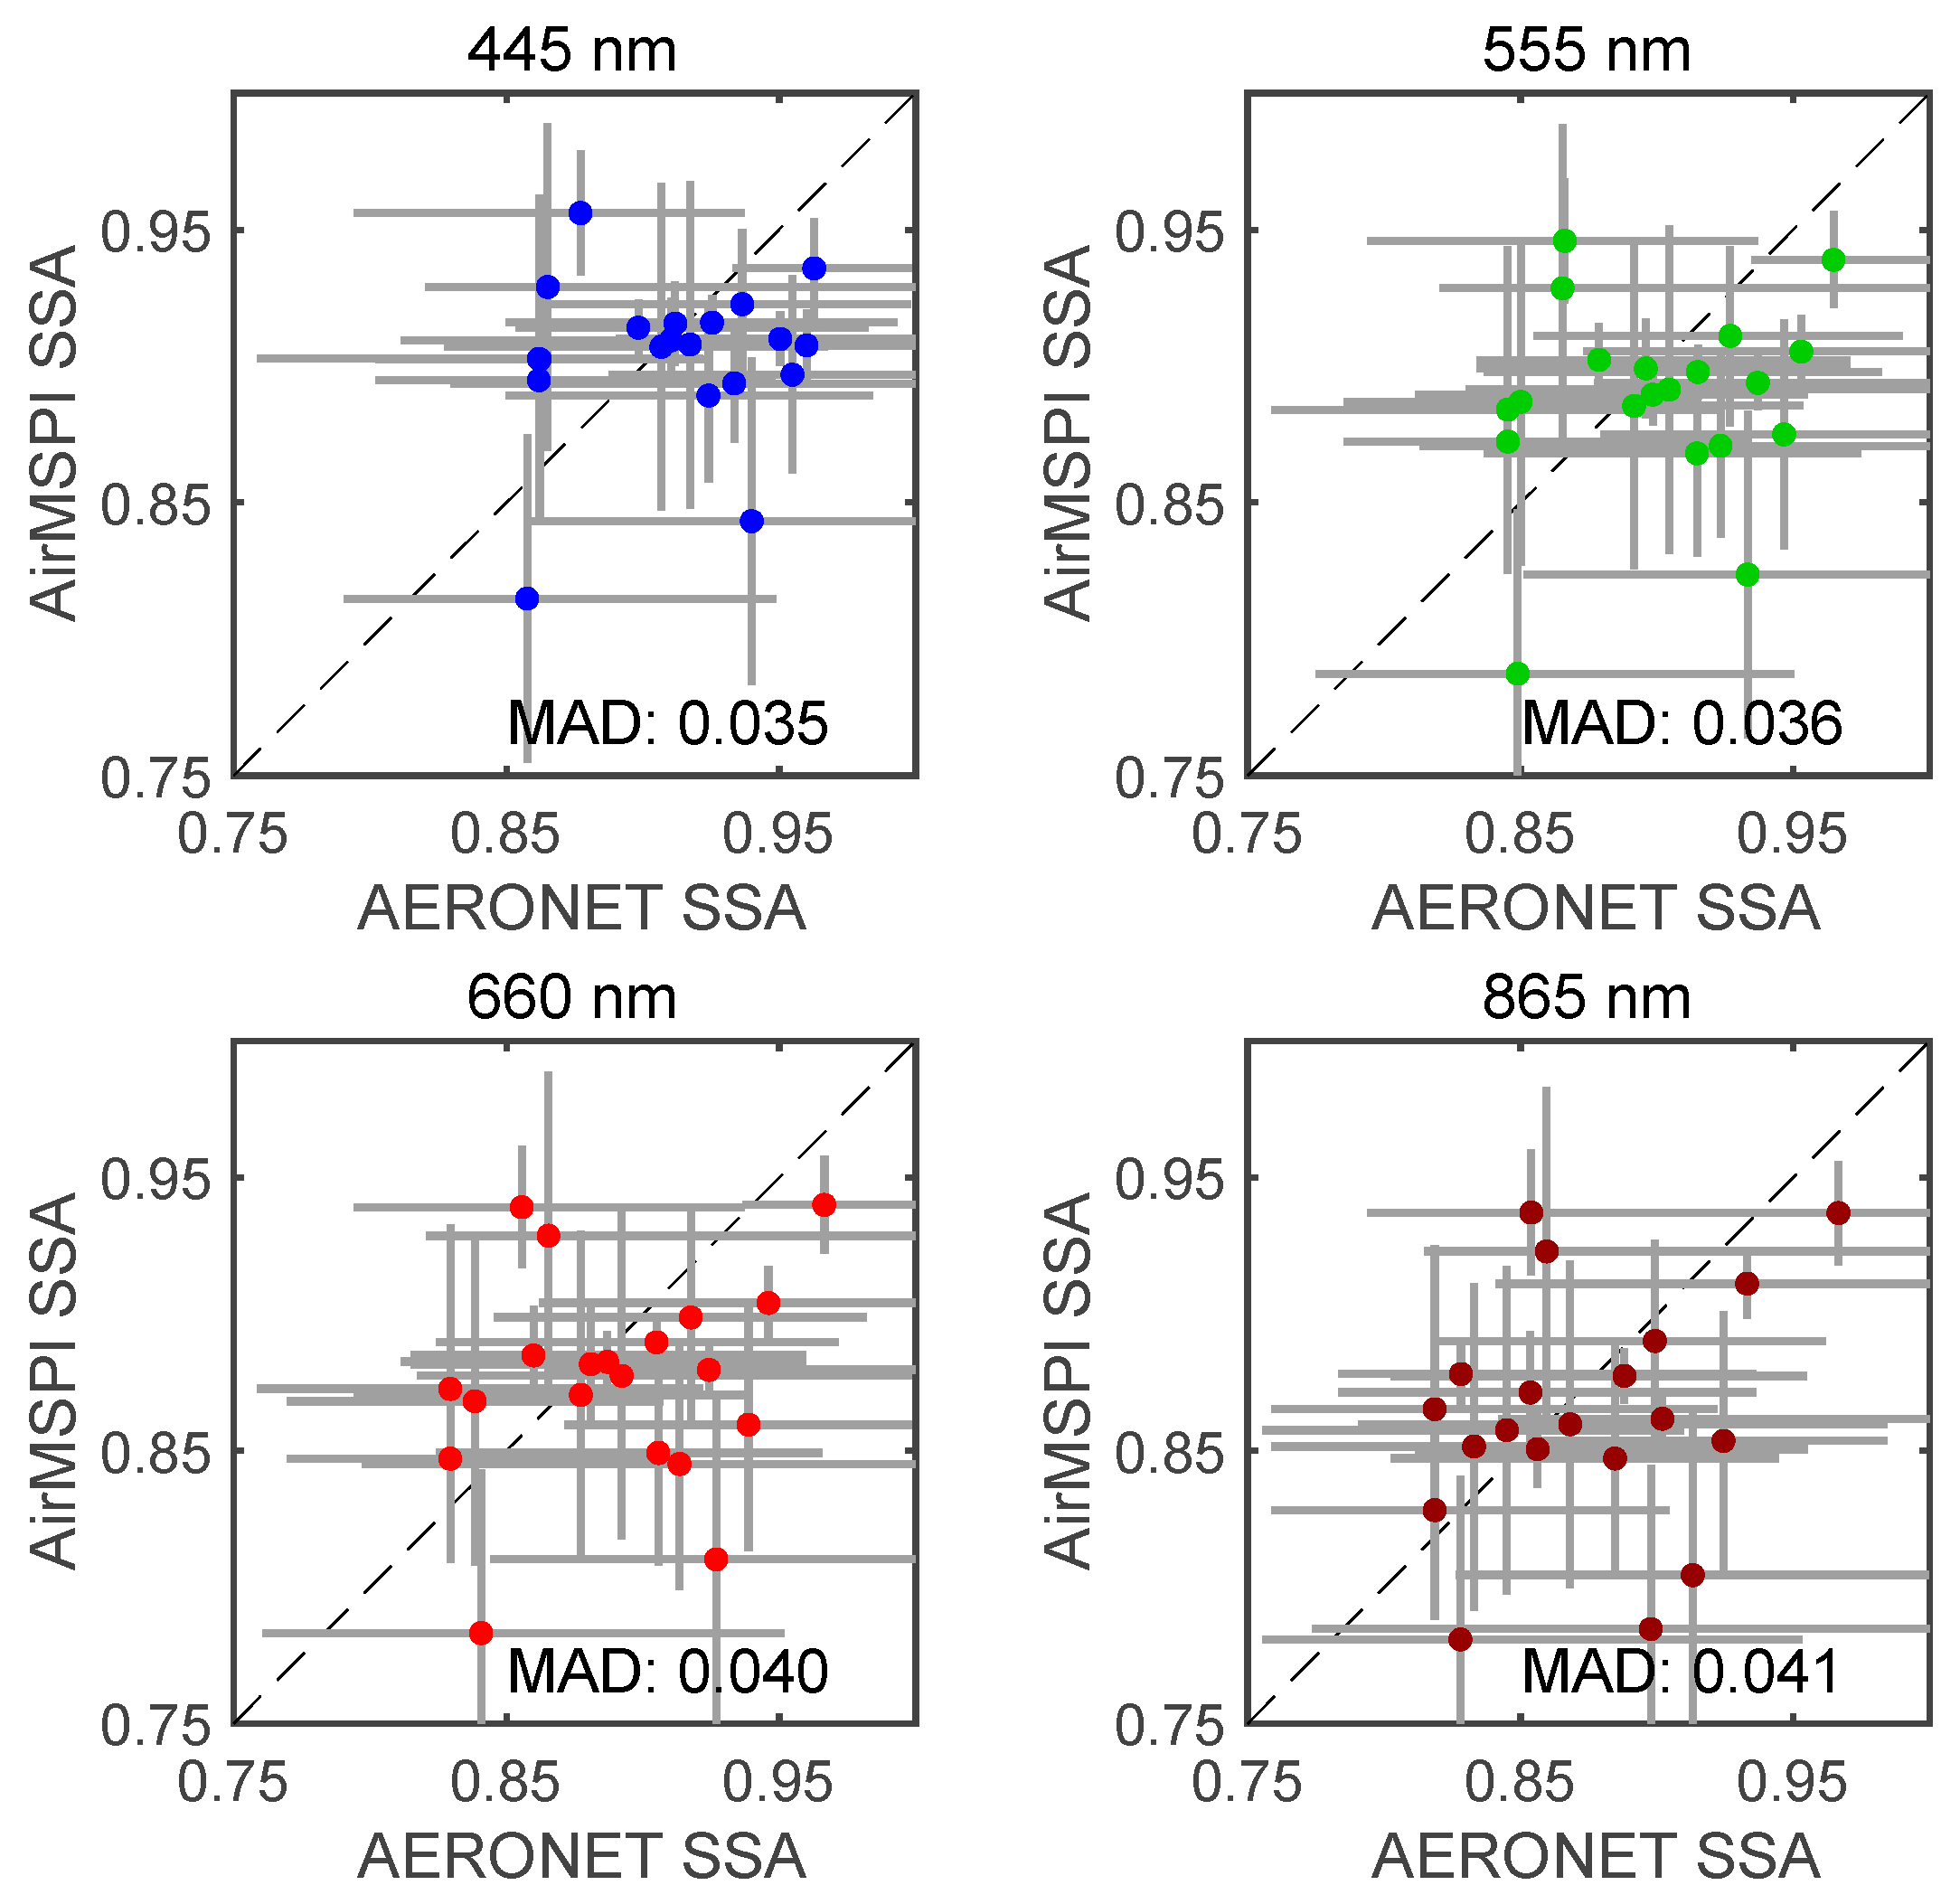
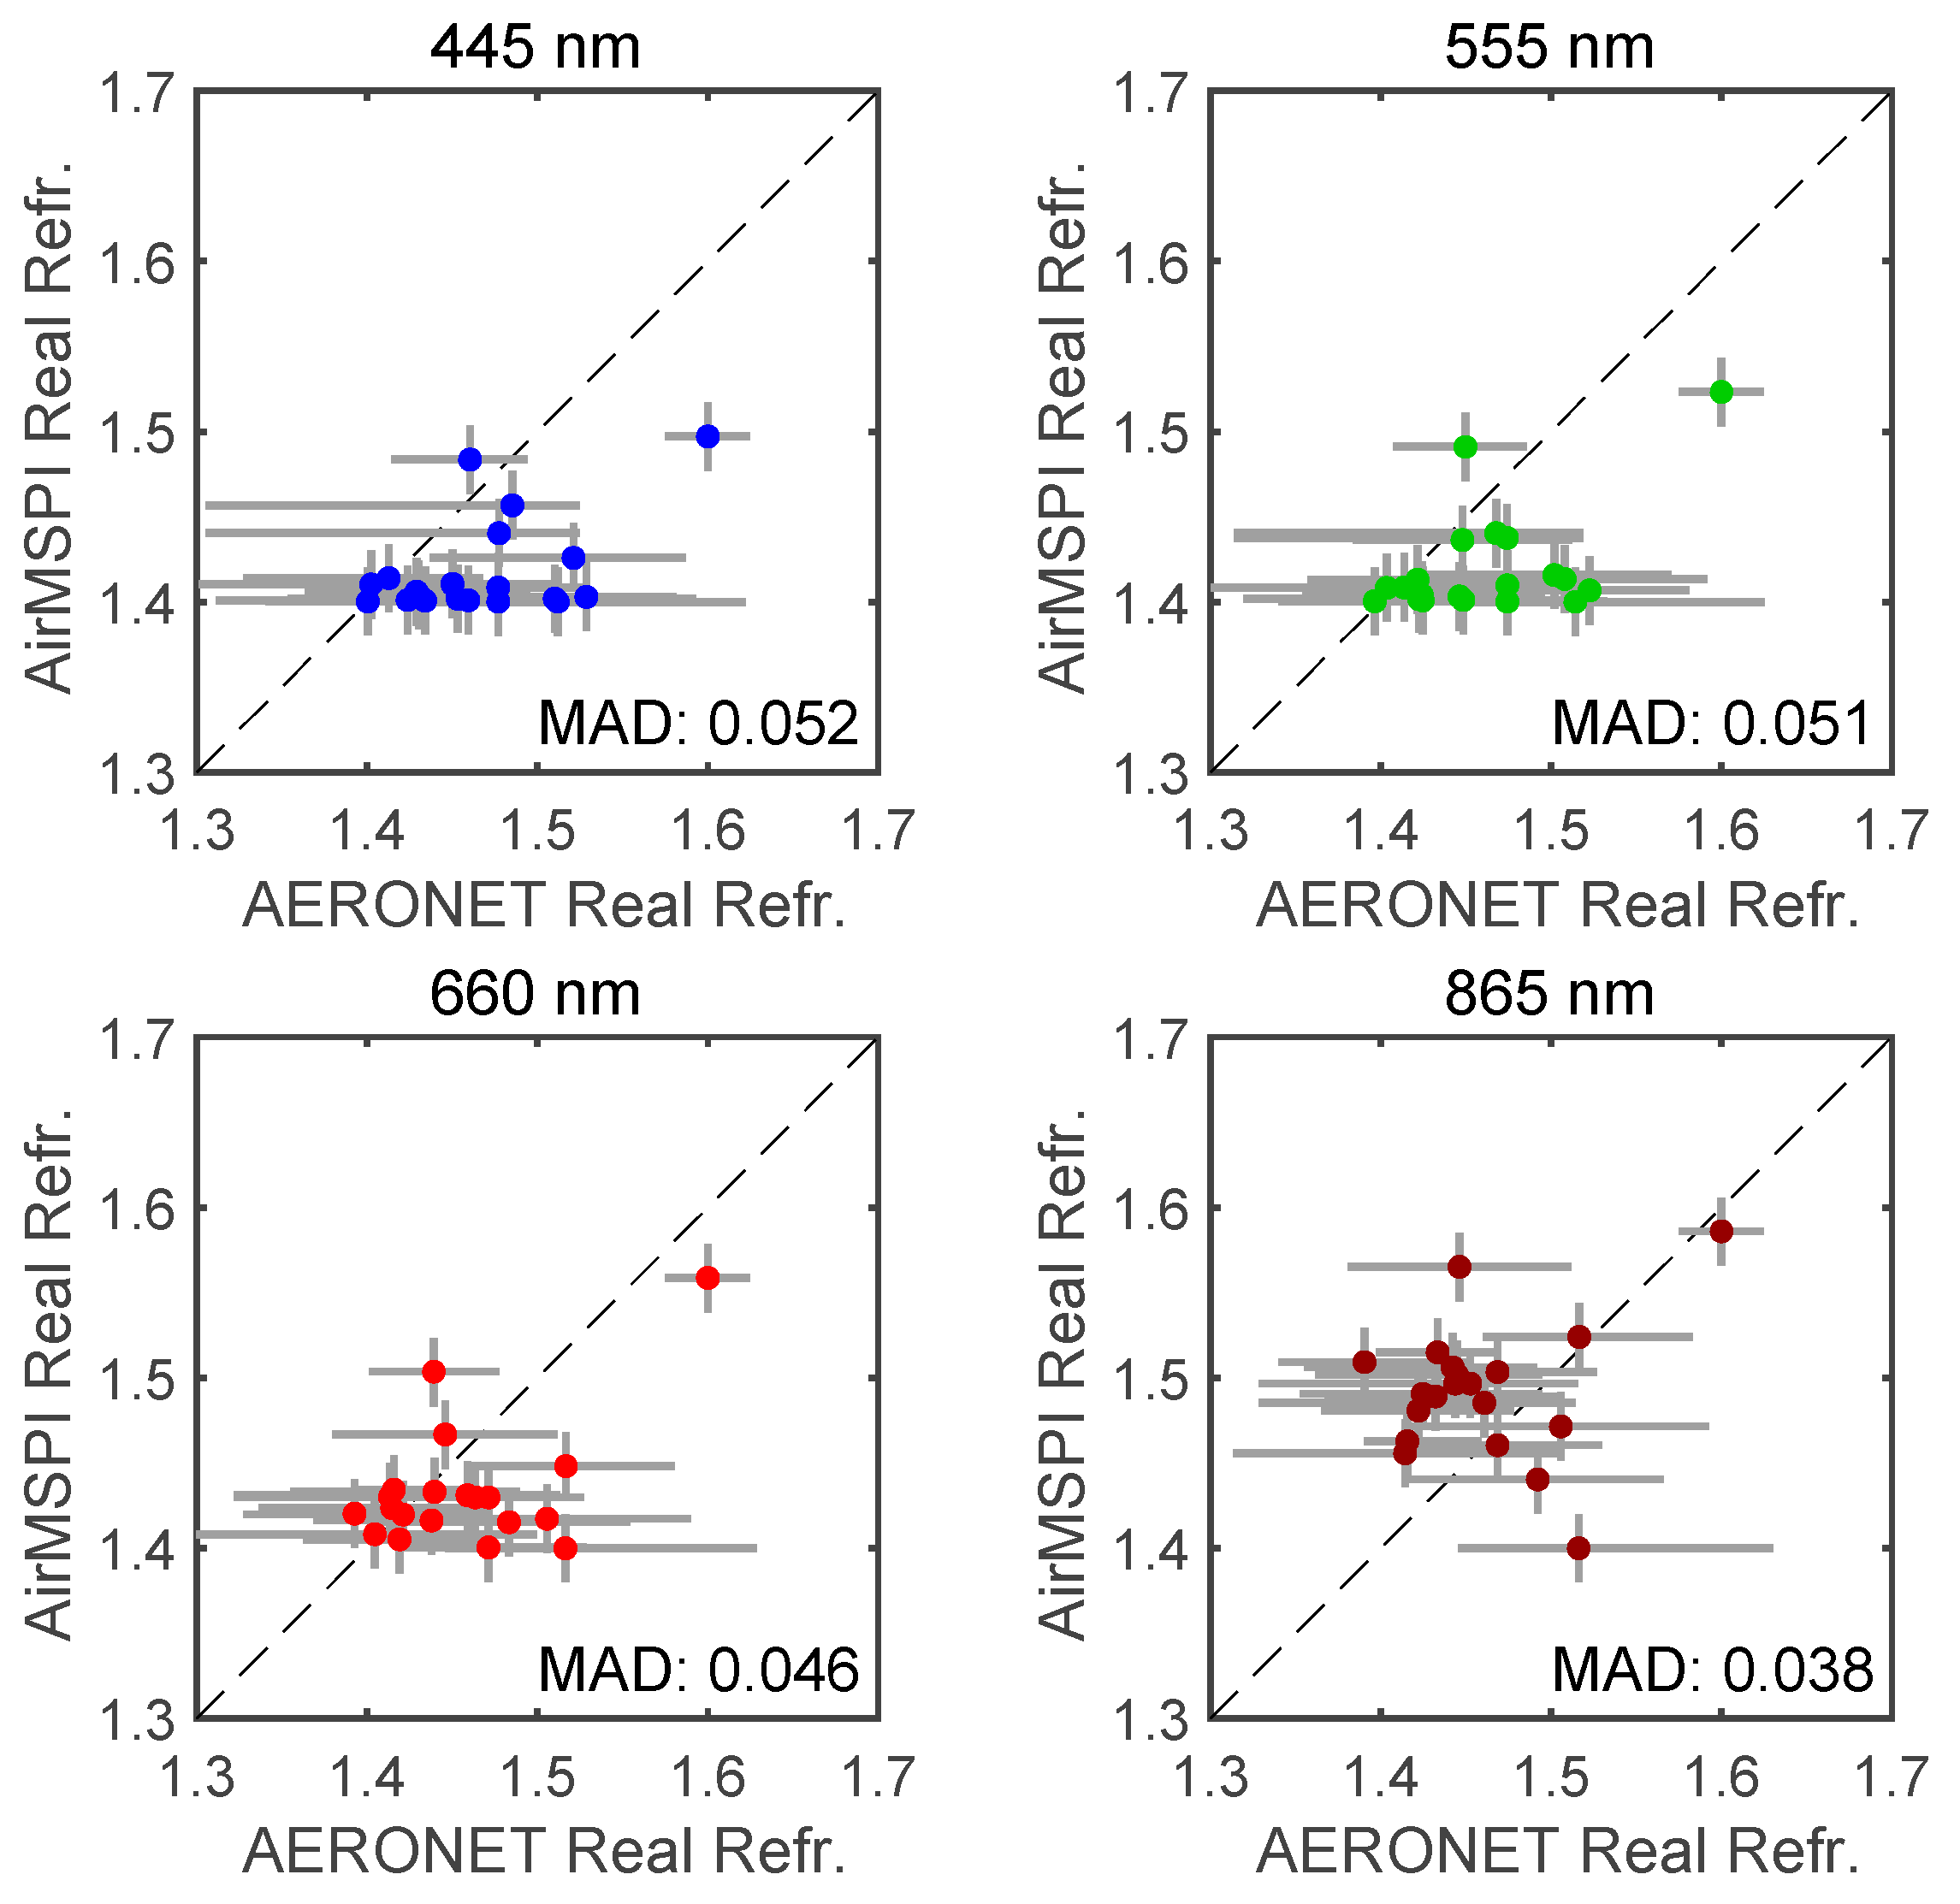
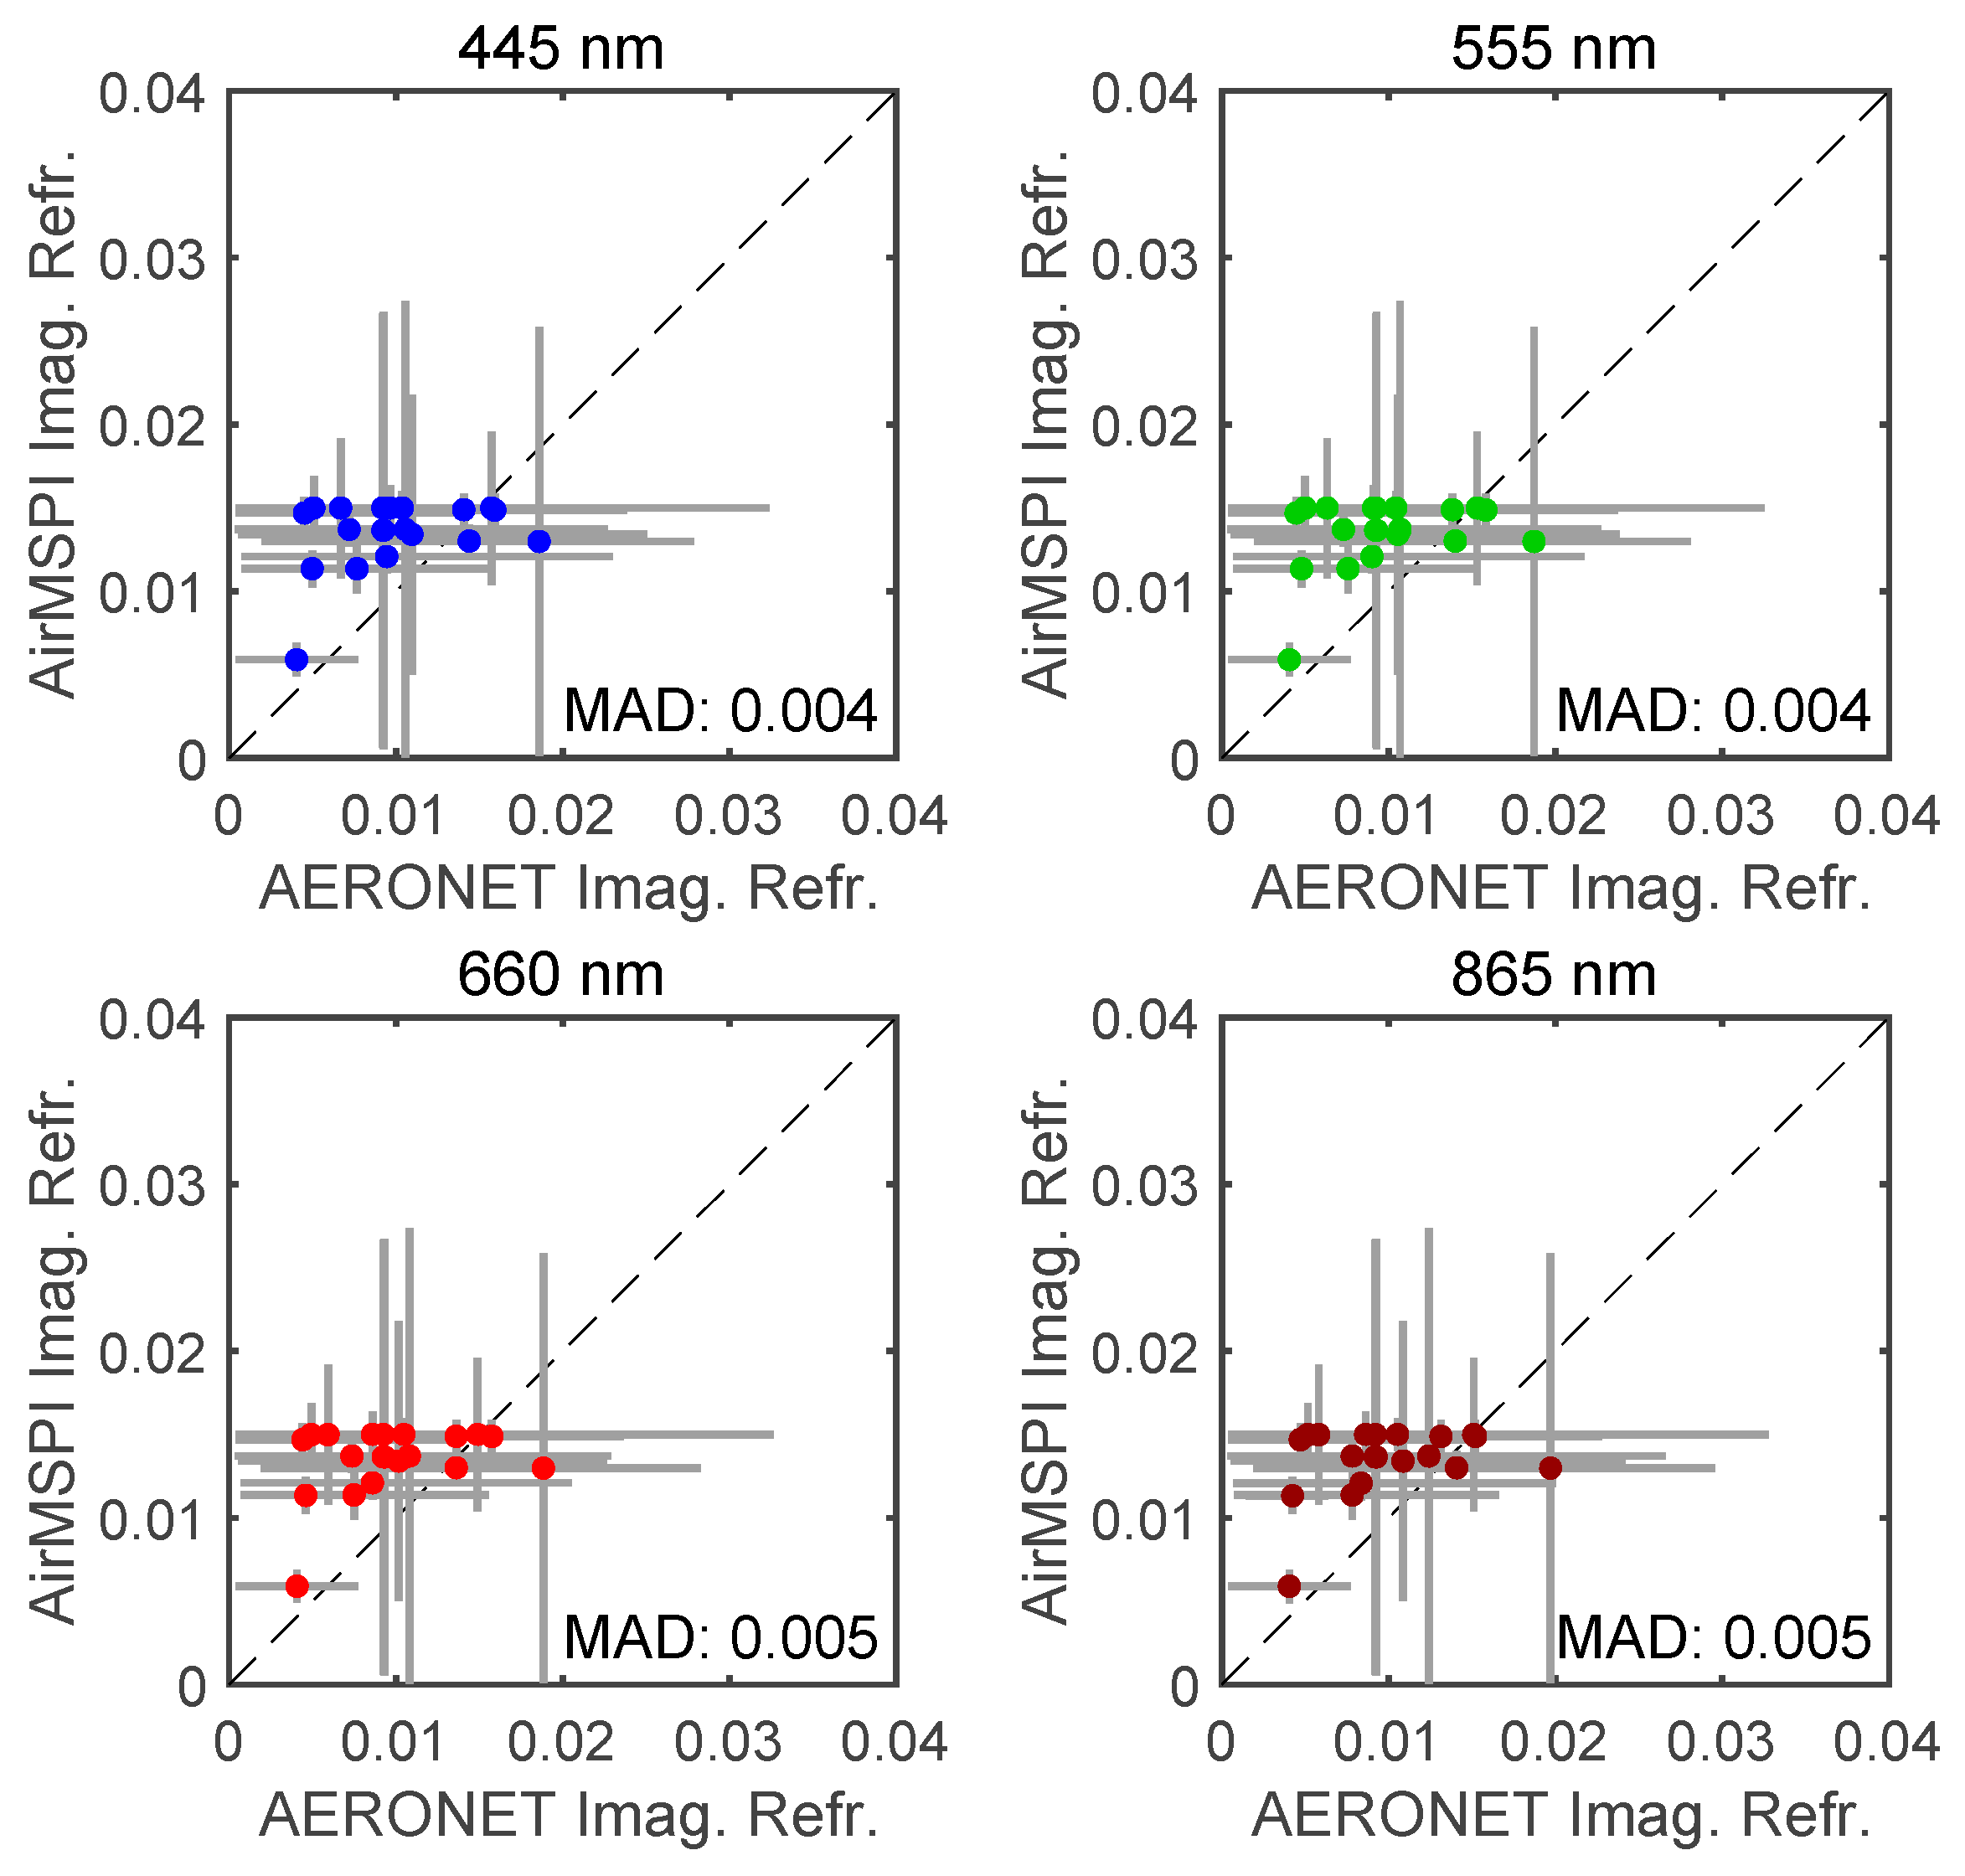
Figure 10 and Figure 11 compare AirMSPI and AERONET retrievals of AOD and SSA respectively. Since the temporal variation of aerosol loading and properties is not constant, non-symmetric AERONET error bars can be observed in Figure 10 and Figure 11. Under the circumstance of no AERONET reference data before or after AirMSPI measurement, only AERONET measurement/retrieval error is reported. Figure 12 and Figure 13 compare real and imaginary parts of aerosol refractive index, respectively. The AERONET spectral aerosol products were linearly interpolated in wavelength to match the AirMSPI band centers. Comparisons of fine and coarse mode effective radii are shown in Figure 14. To facilitate the comparison of aerosol size, an effective radius was calculated for fine and coarse mode aerosols from AirMSPI retrievals using Equation (35) in a previous study [19]. For AOD, linear regression is performed. Values of regression related parameters (a, b, R2) and MAD are indicated in all panels. The AOD regression shows a spectral means of coefficient of determination 0.91, slope 0.93, and intercept 0.03, reflecting high retrieval quality. While SSA and refractive index in Figure 11, Figure 12 and Figure 13 show relatively larger differences between the AirMSPI and AERONET retrievals, the differences are generally within their respective uncertainties, which in turn depend on AirMSPI and AERONET observation errors and the sensitivities of the respective retrieval algorithms. Figure 14 shows a maximum difference of 30% between AirMSPI and AERONET retrieved fine mode aerosol size, whereas larger differences (up to 80%) are observed in coarse mode aerosol size. As noted above, shortwave infrared spectral bands, which AirMSPI lacks, are necessary to constrain the coarse mode aerosol size.
Table 6 summarizes MAD in several key aerosol properties from correlated multi-pixel inversion approach (this paper) and from the original multi-pixel inversion approach adapted to AirMSPI [19]. These properties include AOD, SSA, real and imaginary parts of refractive index ( n r , n i ), and effective radii of fine and coarse particles ( r eff ,   fine , r eff ,   coarse ). The bias is evaluated by taking the mean of the absolute difference between AirMSPI and AERONET retrievals at collocated pixels. The correlated multi-pixel inversion has slightly higher MAD than that of original multi-pixel retrieval, namely by ~0.01, 0.015, 0.001, 0.002, and 0.05 for AOD and SSA in visible, n r , n i , r eff ,   fine , and r eff ,   coarse , respectively. The deviation of both correlated and original multi-pixel retrievals from AERONET reference data are mostly within the retrieval uncertainties from our algorithms (see Section 3.3 and Section 4.2 of the previous study [19]) and those estimated for AERONET, as observed in Figure 10, Figure 11, Figure 12, Figure 13 and Figure 14 of this work, as well as Figure 4, Figure 5, Figure 6, Figure 7 and Figure 8 in the previous study [19].
Note that to enhance the retrieval efficiency, two PCs are adopted to perform the retrieval and achieve the retrieval quality in Table 6. Including more PCs in our retrieval would allow capturing more spatial variations of aerosol properties across the imaged area and improve accuracy, but at a cost of decreased retrieval efficiency. In correlated multi-pixel inversion, the retrieval efficiency is gained from two aspects: (a) reduction of parameter space by retrieving PCs of correlated fields; (2) use of PC-based RT model. For a case study with 22 correlated aerosol parameters and 30 uncorrelated (assumed) surface parameters per super-pixel, the correlated multi-pixel saves 50% CPU time by using two PCs. The speed gain can be greater if we further capitalize the correlation in surface parameters, as well as the correlation between aerosol and surface parameters. It is anticipated that correlated multi-pixel inversion will save 90% CPU time if an image of 100 × 100 pixels is retrieved simultaneously and all 52 parameters are correlated with each other.

6. Summary and Outlook

Without utilizing correlations among aerosol parameters, optimization-based retrievals are confronted with a high-dimensional parameter space. However, certain types of aerosols or certain combinations of aerosol fields generally prevail within a targeted area, and consequently some aerosol parameters are correlated with each other (in other words, have high linear dependency, as captured by PC analysis). Due to the lack of accurate physical models, however, it is hard to quantify the physical processes and accurately quantify the correlations between all parameters. To mitigate the influence of model assumptions, a priori information about aerosol correlation informed by ground or other types of measurements is helpful. This motivates our development of PC-based aerosol inversion approach to improve the inversion stability and efficiency by reducing the number of retrieval parameters. The algorithm makes use of multiple types of constraints, including across-pixel smoothness constraints transformed to be imposed on the PCs to retrieve zero sum of the PC weights, and orthogonality and unit norm conditions on PC weights and PC vectors, respectively. While applying smoothness constraints to the PCs instead of the individual aerosol parameters, the regularization (smoothness) remains faithful to both aerosol correlations and smooth spatial and spectral variation within the scene. To accelerate the multi-pixel retrieval, a PC-based RT model is developed, which capitalizes on the aerosol correlations and mutual orthogonality of the PC vectors. The retrieval methodology was tested by comparing aerosol retrievals from 27 AirMSPI datasets acquired between 2012 and 2016 with collocated aerosol reference data reported by AERONET. Mean absolute differences between AirMSPI and AERONET retrievals are found to be ~0.029 and 0.038 for AOD and SSA, respectively.
The correlated multi-pixel inversion established in this paper is informed by prior estimates of aerosol properties within the retrieval in order to generate initial guesses for the PC vectors and to calculate the co-variance of a priori. Potential sources of such information can include AERONET climatologies, chemical transport model results, or satellite-based aerosol inversion output obtained, for example, from the MISR operational aerosol retrieval [13,14], and the near-real time POLDER aerosol retrieval [35]. Though not implemented in this study, it would be interesting to further impose on retrieval the correlations in surface properties and the correlations between aerosol and surface properties. To derive a priori of the correlations in surface properties, PC analysis can be performed over a surface reflectance dataset, such as the one based on the Multi-Angle Implementation of Atmospheric Correction (MAIAC) algorithm [36,37], the ASTER spectral library [38], and the U.S. Geological Survey (USGS) digital spectral library [39]. To impose the correlation between aerosol and surface, however, one might encounter a complex surface condition over a targeted area (e.g., with co-existence of multiple types of surfaces such as soil, water, snow, forest, etc.). Under such circumstances, surface pixel classification can be performed to identify surface types first, either from existing surface climatology or from various indices for vegetation, snow, soil, water, etc. based on their spectral difference. Then one can assign surface-type dependent sets of PCs to pixels, each set containing a small number of PCs. Finally, these surface-type dependent sets of PCs are retrieved simultaneously with the imposition of the constraints regarding smooth variations of relevant aerosol/surface properties in spatial, spectral and/or temporal directions. To account for dependent sets of PCs in a state vector, some modifications are necessary in formulating the smoothness constraints. Using such a strategy is expected to gain more retrieval efficiency than if one directly relaxes more PCs in retrievals to capture strong spatial variations of surface properties.
While the correlated multi-pixel approach developed here allows a retrieval of both PC vectors and PC weights, another way to capture regionally limited variability in aerosol type is to use a traditional lookup table (LUT) based aerosol retrieval. This approach is implemented in some operational aerosol retrievals employed by, e.g., Multi-angle Imaging SpectroRadiometer (MISR) [13,14] and Moderate resolution Imaging Spectroradiometer (MODIS) [40], and has extremely high retrieval efficiency. With reliable estimates of aerosol properties from other sources as noted above, a “smart” LUT can be generated, which then serves as the basis for a reliable set of PC vectors. If there is high confidence in the representativeness of these PCs, the retrieval could be confined to the PC weights only, which will be faster than the combined inversion of PC vectors and PC weights. Such an approach would compensate for the weakness in traditional LUT approach, namely that aerosol mixtures are confined to a discretized aerosol parameter space. Further testing of these ideas are planned using multi-angle satellite observations from MISR [41].

Author Contributions

F.X. formulated the correlation-based multi-pixel inversion approach and radiative transfer model for fast multi-pixel polarized radiance modeling, and tested the approach using AirMSPI data. D.J.D. and O.D. reviewed the whole formalism and provided editorial changes. Y.S. provided discussions on imposing correlation constraint to improve aerosol retrieval and editorial suggestions.

Funding

Feng Xu and David J. Diner’s work was performed at the Jet Propulsion Laboratory (JPL), California Institute of Technology under contract with the National Aeronautics and Space Administration. Oleg Dubovik is supported by the CaPPA (Chemical and Physical Properties of the Atmosphere) project funded by the French National Research Agency through PIA (Programme d’Investissement d’Avenir) program under contract (ANR-11-LABX-0005-01), the Hauts-de-France Regional Council, and the European Funds for Regional Economic Development. Yoav Schechner is a Landau Fellow supported by the Taub Foundation. His research, supported by the US-Israel Binational Science Foundation (BSF grant 2016325), is partly conducted in the Ollendorff Minerva Center. Minerva is funded through the BMBF.

Acknowledgments

We are grateful to Carol J. Bruegge, Michael J. Garay, Gerard van Harten, Veljko M. Jovanovic, Olga V. Kalashnikova, Brian E. Rheingans, Felix C. Seidel, Irina N. Tkatcheva, and Mika Tosca of JPL for their support of AirMSPI data acquisition and calibration in multiple NASA field campaigns. We also thank Xu Liu at NASA Langley Research Center and Vijay Natraj at JPL for helpful discussions on principal component analysis to accelerate radiative transfer modeling and atmospheric remote sensing.

Conflicts of Interest

The authors declare no conflict of interest.

Appendix A. Symbols and Abbreviations

Table A1. List of symbols and abbreviations.
Symbol/AbbreviationDescription
aSlope of a regression line
a ¯ Mean slope of a set of regression lines
a λ Spectral weight of surface BRDF
ACoefficient for a basic smooth function shape, e.g., “g(z) = Az 2 + Bz + C” for a parabola
AFischer matrix
AERONETAerosol Robotic Network
AirMSPIAirborne Multiangle SpectroPolarimetric Imager
AODAerosol optical depth
ASTERAdvanced Spaceborne Thermal Emission and Reflection Radiometer
AsurfSurface albedo
bIntercept of a regression line
b ¯ Mean intercept of a set of regression lines
BCoefficient for a basic smooth function shape, e.g., “g(z) = Az 2 + Bz + C” for a parabola
BRDFBidirectional reflectance distribution function
BRFBidirectional reflectance factor (BRF) associated with Stokes vector component I
cConstant column vector that weight correlated fields in PC analysis
CCoefficient for a basic smooth function shape, e.g., “g(z) = Az 2 + Bz + C” for a parabola
C i Covariance matrix of i-th type of constraint
C Δ x , rand Covariance matrix of random errors in the measurements
Cv,sphereColumn volume concentration of spherical aerosols
Cv,totTotal column volume concentration of aerosols
dDifferentiation array
d ES Earth-Sun distance
DOLPDegree of linear polarization
dV/dln(r)Volume weighted aerosol size distribution
E 0 Exo-atmospheric solar irradiance
f i Column vector of i-th type of constraint
f i Column vector that contains model prediction to fit i-th type of constraint
Δ f i Column vector that contains the errors of i-th type of constraint
ffineFine mode aerosol fraction
fv,sphereVolume fraction of spherical aerosols
g(z)Smooth function with variable z
g λ Spectral anisotropy parameter of surface BRDF
GRASPGeneralized Retrieval of Aerosol and Surface ProperEes
hCartesian coordinate in the direction h
haCentral height of aerosol vertical profile (constrained by Gaussian profile)
IFirst Stokes vector component
IIdentity matrix
ImeasMeasured radiance
k λ Spectral anisotropy parameter of surface BRDF
k γ Shadowing width of polarized BRDF
K Jacobian matrix
K i The Jacobian matrix associated with i-th type of constraint
L(j)Length of j-th type of correlated parameters (fields)
mOrder of difference in constructing smoothness matrix
MNumber of types of constraints imposed on retrieval
MADMean absolute difference
MAIACMultiAngle Implementation of Atmospheric Correction
MISRMulti-angle Imaging SpectroRadiometer
MODISModerate Resolution Imaging Spectroradiometer
nr, jReal part of refractive index at j-th wavelength
ni, jImaginary part refractive index at j-th wavelength
N a Total number of retrieval parameters
N a Total number of a priori estimate of parameters
N c Total number of constraints imposed on retrieval
N corr Number of correlated parameters (fields)
N f Total number of observations (all pixels are accounted)
N i Total number of i-th type of constraint
N PC Total number of principle components
N pixel Total number of pixels
N SC Number of aerosol size components
N TP , uncorr Total number of types of uncorrelated parameters
OConstraining matrix that reflects zero-sum of PC weights
pBRDFPolarized BRDF
PProbability distribution function (PDF)
PCPrincipal component
PCAPrincipal component analysis
POLDERPolarization and Directionality of Earth’s Reflectance
qRatio of Stokes components Q and I
qIterative step during optimization
qBRFTOATop-of-atmosphere BRF associated with Stokes vector component Q
QSecond Stokes vector component
rRadius of aerosol
reff,coarseEffective radius of coarse mode aerosols
reff,fineEffective radius of fine mode aerosols
RReflection matrix
R2Coefficient of determination
R atmos Reflection matrix for atmosphere associated with light illumination from top of the atmosphere
R atmos Reflection matrix for atmosphere associated with light illumination from bottom of the atmosphere
R CAS Reflection matrix for the coupled atmosphere-surface system (CAS)
RPVRahman-Pinty-Verstraete (surface BRDF model)
R surf Surface reflection matrix
R surf ,   BRDF Depolarizing part of surface reflection matrix
R surf ,   pBRDF Polarizing part of surface reflection matrix
RTRadiative transfer
saStandard deviation of aerosol vertical profile (constrained by Gaussian profile)
S i , m Differentiation matrix of m-th order for i-th type of constraint
SSASingle scattering albedo
tTemporal coordinate
TTransmission matrix
T atmos Transmission matrix for atmosphere associated with light illumination from top of the atmosphere
T atmos Transmission matrix for atmosphere associated with light illumination from bottom of the atmosphere
TOATop-of-atmosphere
uCartesian coordinate in the direction u
uRatio of Stokes components U and I
uBRFTOATop-of-atmosphere BRF associated with Stokes vector component U
UThird Stokes vector component
UConstraining matrix that reflects the unit length of a PC
USGSU.S. Geological Survey
vCartesian coordinate in the direction v
v PC matrix containing NPC columns PC vectors
vBRFTOATop-of-atmosphere BRF associated with Stokes vector component V
v k The k-th PC vector
v state Column vector containing all PC vectors
wPC weight matrix containing Npixel column vectors containing PC weights
w i Weight matrix for i-th type of constraint
w p Column vector containing PC weights for p-th pixel
w state Column vector containing all PC weights
x Column state vector including all retrieval parameters
x a   p r i o r i a priori of state vector
x ¯ corr Column vector containing spatial and temporal mean of correlated parameters (fields)
x corr , p Column vector containing correlated parameters (fields) for p-th pixel
x q , aer The vector consisting of correlated aerosol properties – calculated from the solution at q-th iteration
x q , surf The vector consisting of uncorrelated surface reflection properties – containing in the solution at q-th iteration
x retrieved Retrieved column state vector
Δ x syst Systematic error in retrieval
x uncorr , p Column vector containing uncorrelated parameters (fields) for p-th pixel
x true Column state vector associated with true solution
x wv Column vector including PC weights and vectors
( Δ x ) j The retrieval error in j-th parameter
y i i-th observational signal
Y HS Output of RT calculation with high stream approximation
Y LS Output of RT calculation with low stream approximation
zVariable of a smooth function
zminLower bound of z
zmaxUpper bound of z
ZNumber of observations per pixel
δ Kronecker delta
δ s Scale factor that perturbs a PC vector
ε rand Random error in measurements
ε λ Spectral weight of pBRDF
ε i 2 First diagonal element of Ci
ε c 2 User-specified threshold value to diagnose the convergence of optimization
ε f 2 Expected variance due to measurement errors
θ 0 Solar zenith angle
θ v View zenith angle
λ Wavelength
μ 0 Cosine of solar zenith angle
γ i Lagrange factor for i-th type of constraint
ϕ 0 Solar azimuthal angle
Ψ i Objective cost function for i-th type of constraint
Ψ total Overall objective cost function
Ψ i Gradient of the objective cost function for i-th type of constraint
Ψ total Gradient of the overall objective cost function
Ω i The smoothness matrix associated with i-th type of constraints
Ω Ra The rearranged smoothness matrix from Ω
Ω uncorr The smoothness matrix imposed on uncorrelated parameters (fields)
Ω corr x ¯ The smoothness matrix imposed on spatial and temporal mean mean of correlated parameters (fields)
Ω corr w Smoothness matrix imposed on pixel resolved PC weights
Ω corr v Smoothness matrix imposed on a PC vector
Ω corr wv Smoothness matrix imposed on correlated parameters (fields)
σ spatio - temporal ,   x Standard deviation of a correlated field x
σ e ,   x Uncertainty estimate of a correlated field x
σ s Slope variance of polarized BRDF
τ aer , tot Total aerosol optical depth
τ aer , abs Total absorption aerosol optical depth
τ atmos Atmospheric optical depth
Γ Constraining matrix that reflects the mutual orthogonality in PCs

Appendix B. Smoothness Matrix to Constrain Uncorrelated Parameter Retrieval

To explain construction of the smoothness matrix for PC vectors and weights, we start by describing the smoothness matrix used in the original multi-pixel algorithm formulated by Dubovik et al. [6]. This appendix forms the basis for extension to PC-based smoothness matrix, described in Appendix C and Appendix D. Two major classes of constraints are imposed on the PC retrieval: across-pixel (spatial) constraints and within-pixel (e.g., spectral) constraints. The following matrix incorporates both across-pixel and within-pixel constraints for a set of uncorrelated aerosol parameters:
γ uncorr Ω uncorr = γ uncorr , Δ Ω uncorr , Δ + ( γ uncorr , Ω uncorr , 1 0 0 0 γ uncorr , Ω uncorr , 2 0 0 0 γ uncorr , Ω uncorr , N pixel )
where γ uncorr , Δ Ω uncorr , Δ is a block matrix that includes across-pixel smoothness constraints, γ uncorr , Ω uncorr , , p is a block matrix that includes within-pixel smoothness constraints over the parameters associated with p-th pixel, and 0 is the zero block matrix. Pixel resolved matrices γ uncorr , Ω uncorr , , p do not interfere with each other, so they are arranged along the diagonal axis of the large matrix on the right-hand-side of the above equation. To facilitate the use of γ uncorr Ω uncorr calculated via Equation (A1), the uncorrelated parameters are grouped together in the order of x uncorr = [ x ( t 1 ) ; x ( t 2 ) ; ; x ( t N t ) ] , where x ( t j ) = [ x ( v 1 ; t j ) ; x ( v 2 ; t j ) ; ;   x ( v N v ; t j ) ] , x ( v i ; t j ) = [ x ( u 1 ; v i ; t j ) ; x ( u 2 ; v i ; t j ) ; ;   x ( u N u ; v i ; t j ) ] , and x ( u k ; v i ; t j ) is a vector that contains uncorrelated parameters for the pixel ( u k , v i ) observed at temporal point t j . Evaluations of γ uncorr , Δ Ω uncorr , Δ and γ uncorr , Ω uncorr , , p are discussed in Appendix B.1 and Appendix B.2, respectively.

Appendix B.1. Across-Pixel Smoothness Matrix

The across-pixel constraints that ensure smooth variation of a parameter in space and time is expressed by,
γ uncorr , Δ Ω uncorr , Δ = γ uncorr , u Ω uncorr , u + γ uncorr , v Ω uncorr , v + γ uncorr , t Ω uncorr , t
To simplify the explanation, consider an image of N u pixels along the horizontal spatial dimension u, two pixels along the horizontal spatial dimension v ( N v = 2) and two successive measurements in time ( N t = 2) of some parameter x. The construction of a smoothness matrix along the vertical direction is neglected for simplicity. In this case, the single-column state vector is arranged as,
x uncorr = x ( u 1 ; v 1 ; t 1 ) x ( u 2 ; v 1 ; t 1 ) x ( u 3 ; v 1 ; t 1 ) x ( u N u ; v 1 ; t 1 ) x ( u 1 ; v 2 ; t 1 ) x ( u 2 ; v 2 ; t 1 ) x ( u 3 ; v 2 ; t 1 ) x ( u N u ; v 2 ; t 1 ) t o   c o n t i n u e c o n t i n u e d x ( u 1 ; v 1 ; t 2 ) x ( u 2 ; v 1 ; t 2 ) x ( u 3 ; v 1 ; t 2 ) x ( u N u ; v 1 ; t 2 ) x ( u 1 ; v 2 ; t 2 ) x ( u 2 ; v 2 ; t 2 ) x ( u 3 ; v 2 ; t 2 ) x ( u N u ; v 2 ; t 2 )
The corresponding smoothness matrix constraining the horizontal and temporal variation of x is given by,
γ uncorr , u / v / t Ω uncorr , u / v / t = [ diag ( γ uncorr , u / v / t S uncorr ( m uncorr , u / v / t ) ) ] T [ diag ( γ uncorr , u / v / t S uncorr ( m uncorr , u / v / t ) ) ]
where γ uncorr , u / v / t controls the strength of smoothness constraint, which varies for different types of parameters. Specifically, the component that ensures the smooth variation of x in the direction u is expressed as,
γ uncorr , u S uncorr , u ( m uncorr , u ) = γ uncorr , u [ s uncorr , u ( m uncorr , u ) 0 0 s uncorr , u ( m uncorr , u ) ]
where
s uncorr , u ( m uncorr , u ) = [ d 1 ( m uncorr , u ) ( 1 ) d 1 ( m uncorr , u ) ( 2 ) d 1 ( m uncorr , u ) ( m uncorr , u + 1 ) 0 0 0 d 2 ( m uncorr , u ) ( 1 ) d 2 ( m uncorr , u ) ( 2 ) d 2 ( m uncorr , u ) ( m uncorr , u + 1 ) 0 0 0 d N u m uncorr , u ( m uncorr , u ) ( 1 ) d N u m uncorr , u ( m uncorr , u ) ( 2 ) d N u m uncorr , u ( m uncorr , u ) ( m uncorr , u + 1 ) ]
As an example, the differentiation array for the first order of difference in above equation is,
d j ( m uncorr , u = 1 ) = [ 1 Δ 1 ( j ) , 1 Δ 1 ( j ) ]
where Δ 1 ( j ) accounts for the distance between neighboring pixels in the direction u and is evaluated by Equation (40), and for the second order of difference,
d j ( m uncorr , u = 2 ) = [ 2 Δ 1 ( j ) [ Δ 1 ( j ) + Δ 1 ( j + 1 ) ] , 2 Δ 1 ( j ) Δ 1 ( j + 1 ) , 2 Δ 1 ( j + 1 ) [ Δ 1 ( j ) + Δ 1 ( j + 1 ) ] ]
Moreover, the smoothness matrix in the direction v is,
γ uncorr , v S uncorr , v ( m uncorr , v ) = γ uncorr , v [ s uncorr , v ( m uncorr , v ) 0 0 s uncorr , v ( m uncorr , v ) ]
where
s uncorr , v ( m uncorr , v = 1 ) = [ d 1 ( m uncorr , v ) ( 1 ) 0 0 d 1 ( m uncorr , v ) ( 2 ) 0 0 0 d 1 ( m uncorr , v ) ( 1 ) 0 0 d 1 ( m uncorr , v ) ( 2 ) 0 0 0 d 1 ( m uncorr , v ) ( 1 ) 0 0 d 1 ( m uncorr , v ) ( 2 ) ]
where we assume m uncorr , v = 1 and the calculation of the differentiation array d accounts for the distance between neighboring pixels in the direction v and is evaluated by Equation (40).
The smoothness matrices in the direction t is,
s uncorr , t ( m uncorr , t = 1 ) = [ d 1 ( m uncorr , t ) ( 1 ) 0 0 0 0 0 d 1 ( m uncorr , t ) ( 2 ) 0 0 0 0 0 0 d 1 ( m uncorr , t ) ( 1 ) 0 0 0 0 0 d 1 ( m uncorr , t ) ( 2 ) 0 0 0 0 d 1 ( m uncorr , t ) ( 1 ) 0 0 0 0 0 d 1 ( m uncorr , t ) ( 2 ) 0 0 0 0 0 0 d 1 ( m uncorr , t ) ( 1 ) 0 0 0 0 0 d 1 ( m uncorr , t ) ( 2 ) 0 0 0 0 ]
where we assume m uncorr , t = 1 and the calculation of the differentiation array d accounts for the temporal gap between successive measurements and is evaluated by Equation (40).
Note that the above formalism applies to all uncorrelated but smoothly varying parameters. The incorporation of these smoothness matrices for different parameters into an overall matrix γ uncorr , Δ Ω uncorr , Δ is designed to account for the locations of these parameters in a retrieval state vector.

Appendix B.2. Within-Pixel Smoothness Matrix

Certain types of parameters, such as the spectral weight of the microfacet model-based pBRDF function and spectral shape parameters in the RPV model-based BRDF function as a function of wavelength, are subjected to inherent smoothness. The smooth variation of such a type of within-pixel parameters is ensured by
γ uncorr , Ω uncorr , = [ ( γ uncorr , Ω uncorr , ) p 1 0 0 0 ( γ uncorr , Ω uncorr , ) p 2 0 0 0 ( γ uncorr , Ω uncorr , ) N pixel ]
where for any pixel p,
( γ uncorr , Ω uncorr , ) p = [ γ uncorr , S uncorr , ( m uncorr , ) ] p T [ W ( m uncorr , ) ] 1 [ γ uncorr , S uncorr , ( m uncorr , ) ] p
where
[ γ uncorr , S uncorr , ( m uncorr , ) ] p = [ C p ( m uncorr , ( 1 ) ) ( 1 ) 0 0 0 C p   ( m uncorr , ( 2 ) ) ( 2 ) 0 0 0 C p   ( m uncorr , ( N TP , uncorr ) ) ( N TP , uncorr ) ]
with the following submatrix for j-th type of uncorrelated parameters,
C p ( m uncorr , ( j ) ) ( j ) = γ uncorr , ( j ) [ d 1 ( m uncorr , ( j ) ) ( 1 ) d 1 ( m uncorr , ( j ) ) ( 2 ) d 1 ( m uncorr , ( j ) ) ( m uncorr , ( j ) + 1 ) 0 0 0 d 2 ( m uncorr , ( j ) ) ( 1 ) d 2 ( m uncorr , ( j ) ) ( 2 ) d 2 ( m uncorr , ( j ) ) ( m uncorr , ( j ) + 1 ) 0 0 0 d TP , uncorr ( j ) m uncorr , ( j ) ( m uncorr , ( j ) ) ( 1 ) d TP , uncorr ( j ) m uncorr , ( j ) ( m uncorr , ( j ) ) ( 2 ) d TP , uncorr ( j ) m uncorr , ( j ) ( m uncorr , ( j ) ) ( m uncorr , ( j ) + 1 ) ]
where we assume j-th parameter belongs to [ TP uncorr ( j ) ] -th type of uncorrelated parameters, the calculation of the differentiation array d accounts for the distance between neighboring wavelengths and proceeds in the way as expressed in Equations (A7) and (A8).
The weight matrix in Equation (A13) is expressed as,
W ( m uncorr , ) = [ W ( m uncorr , ( 1 ) ) ( 1 ) 0 0 0 0 W ( m uncorr , ( 2 ) ) ( 2 ) 0 0 0 0 W ( m uncorr , ( 3 ) ) ( 3 ) 0 0 0 0 0 0 W ( m uncorr , ( N TP , uncorr ) ) ( N TP , uncorr ) ]
where
W ( m uncorr , ( i ) ) ( i ) = [ 1 Δ m uncorr , ( i ) ( 1 ) 0 0 0 1 Δ m uncorr , ( i ) ( 2 ) 0 0 0 1 Δ m uncorr , ( i ) ( L ( i ) m uncorr , ( i ) ) ]
where Δ m ( j ) is evaluated by Equation (40).
To generate γ corr x ¯ Ω corr x ¯ (see Equation (50) for Ω corr x ¯ ), the evaluation of smoothness matrix of the correlated fields in the column vector x ¯ containing multi-pixel mean fields proceeds in a similar way as formulated for the within-pixel constraint.

Appendix C. Smoothness Matrix for Correlated Parameters

As shown in Appendix B, the original multi-pixel inversion algorithm imposes smoothness constraints directly on the aerosol fields. In the correlated multi-pixel inversion, the correlated parameters are not directly retrieved; the retrieval involves the PC vectors, PC weights, and multi-pixel mean fields. Therefore, the smoothness constraints must be imposed on PCs and PC weights. Like the implementation for uncorrelated parameter retrievals, the overall smoothness matrix includes both across-pixel ( γ corr , Δ wv Ω corr , Δ wv ) and within-pixel constraints ( γ corr , wv Ω corr , wv ), namely,
{ γ corr wv Ω corr , 1 wv = γ corr , Δ wv Ω corr , Δ , 1 wv + γ corr , wv Ω corr , , 1 wv γ corr wv Ω corr , 2 wv = γ corr , Δ wv Ω corr , Δ , 2 wv + γ corr , wv Ω corr , , 2 wv
The explicit forms of γ corr , Δ wv Ω corr , Δ wv and γ corr , wv Ω corr , wv will be given in the Appendix C.1 and Appendix C.2.

Appendix C.1. Across-Pixel Smoothness Constraints

To simplify the discussion, the formalism given in this and the next section assumes that the smoothness constraint applied to a parameter x occurs in the dimension u. It can be easily extended to enable construction of smoothness matrices in other spatial dimensions.
To constrain across-pixel variation of a certain parameter, the γ corr , Δ wv Ω corr , Δ wv matrix in Equation (A18) is given by
{ γ corr , Δ wv Ω corr , Δ , 1 wv = i = 1 N corr [ γ corr , Δ wv d ( S wv , i ( m corr , Δ wv ) x i ) d x i ] T [ γ corr , Δ wv d ( S wv , i ( m corr , Δ wv ) x i ) d x i ] γ corr , Δ wv Ω corr , Δ , 2 wv = i = 1 N corr [ γ corr , Δ wv d ( S wv , i ( m corr , Δ wv ) x i ) d x i ] T [ γ corr , Δ wv S wv , i ( m corr , Δ wv ) ]
where the column vector x i has the same length as that of the state vector and contains all-pixel PC weights and the i–th elements of all PC vectors (all rest elements of x i are zero), and γ corr , Δ wv S wv , i ( m corr , Δ wv ) includes two matrix components B and C that account for the contributions by PCs and PC weights, respectively, in the following form,
γ corr , Δ wv S wv , i ( m corr , Δ wv ) = [ 0 B w ,   p 1 ( m corr , Δ wv ) ( i ) 0 B w ,   p 2 ( m corr , Δ wv ) ( i ) 0 B w ,   N pixel m corr , Δ wv ( m corr , Δ wv ) ( i ) C p 1 ( m corr , Δ wv ) ( 1 , i ) 0 uncorr , p 1 C p 1 ( m corr , Δ wv ) ( 2 , i ) 0 uncorr , p 2 C p 1 ( m corr , Δ wv ) ( m corr , Δ wv + 1 , i ) 0 uncorr , p 1 + m corr , Δ wv 0 0 0 0 0 C p 2 ( m corr , Δ wv ) ( 1 , i ) 0 uncorr , p 2 C p 2 ( m corr , Δ wv ) ( 2 , i ) 0 uncorr , p 3 C p 2 ( m corr , Δ wv ) ( m corr , Δ wv + 1 , i ) 0 uncorr , p 2 + m corr , Δ wv 0 0 0 0 C N pixel m corr , Δ wv ( m corr , Δ wv ) ( 1 , i ) 0 uncorr , N pixel m corr , Δ wv C N pixel m corr , Δ wv ( m corr , Δ wv ) ( 2 , i ) 0 uncorr , N pixel m corr , Δ wv + 1 C N pixel m corr , Δ wv ( m corr , Δ wv ) ( m corr , Δ wv + 1 , i ) 0 uncorr , N pixel ]
where the first column of zero matrices accommodate the multi-pixel mean of correlated parameters, and the explicit form of B matrix is expressed as,
B w ,   p ( m corr , Δ wv ) ( i ) = [ B p ( m corr , Δ wv ( i ) ) ( i , w ( 1 ) ) B p ( m corr , Δ wv ( i ) ) ( i , w ( 2 ) ) B p ( m corr , Δ wv ( i ) ) ( i , w ( N PC ) ) ]
with
B p ( m corr , Δ wv ( i ) ) ( i , w ( k ) ) = γ corr , Δ wv ( i ) [ m = 0 m corr , Δ wv ( i ) d p ( m corr , Δ wv ( i ) ) ( m + 1 ) w p + m ( k ) 0 0 0 m = 0 m corr , Δ wv ( i ) d p ( m corr , Δ wv ( i ) ) ( m + 1 ) w p + m ( k ) 0 0 0 m = 0 m corr , Δ wv ( i ) d p ( m corr , Δ wv ( i ) ) ( m + 1 ) w p + m ( k ) ]
where the i-th correlated parameter.
The matrix C is a null matrix except its i-th row has fill-in values, namely
C p ( m corr , Δ wv ) ( m , i ) = γ corr , Δ wv ( i ) d p ( m corr , Δ wv ( i ) ) ( m ) [ 0 0 0 v 1 ( i ) v 2 ( i ) v N PC ( i ) 0 0 0 ]
Moreover, Equation (59) is implemented to evaluate d ( S wv , i ( m corr , Δ wv ) x i ) / d x i in Equation (A19).

Appendix C.2. Within-Pixel Smoothness Matrix

The overall within-pixel smoothness matrix γ corr , wv Ω corr , wv in Equation (A18) is expressed as,
{ γ corr , wv Ω , 1 = i = 1 N TP , corr [ γ corr , wv d ( S wv ( m corr , wv ) x i ) d x i ] T [ W ( m corr , wv ) ] 1 [ γ corr , wv d ( S wv ( m corr , wv ) x i ) d x i ] γ corr , wv Ω , 2 = i = 1 N TP , corr [ γ corr , wv d ( S wv ( m corr , wv ) x i ) d x i ] T [ W ( m corr , wv ) ] 1 [ γ corr , wv S wv ( m corr , wv ) ]
where the column vector x i has the same length as that of the state vector and contains all-pixel PC weights and the i-th type of correlated fields included in all PC vectors (all rest elements of x i are zero), and the weight matrix W that has a similar structure as Equations (A16) and (A17) (but for the i-th type of correlated parameters and is expanded to account for the number of pixels). To account for the smooth variation of a type of correlated parameters, the contributions of PC vectors and weights are coupled in the following way,
γ corr , wv S wv ( m corr , wv ) = [ γ corr , wv S v ( m corr , wv ) γ corr , wv S w ( m corr , wv ) 0 0 γ corr , wv S v ( m corr , wv ) 0 γ corr , wv S w ( m corr , wv ) 0 γ corr , wv S v ( m corr , wv ) 0 γ corr , wv S w ( m corr , wv ) ]
where
γ corr , wv S v ( m corr , wv ) = [ γ corr , wv S v ( m corr , wv , k = 1 ) γ corr , wv S v ( m corr , wv , k = 2 ) γ corr , wv S v ( m corr , wv , k = N PC ) ]
with
γ corr , wv S v ( m corr , wv , k ) = [ γ corr , wv ( 1 ) S v ( m corr , wv ( 1 ) , k ) ( 1 ) 0 0 0 γ corr , wv ( 2 ) S v ( m corr , wv ( 2 ) , k ) ( 2 ) 0 0 0 γ corr , wv ( N TP , corr ) S v ( m corr , wv ( N TP , corr ) , k ) ( N TP , corr ) ]
S v ( m corr , wv , k ) ( j ) = w p ( k ) × [ d 1 ( m corr , wv ) ( 1 ) d 1 ( m corr , wv ) ( 2 ) d 1 ( m corr , wv ) ( m corr , wv + 1 ) 0 0 0 0 0 0 0 d 2 ( m corr , wv ) ( 1 ) d 2 ( m corr , wv ) ( 2 ) d 2 ( m corr , wv ) ( m corr , wv + 1 ) 0 0 0 0 0 0 0 0 d L ( j ) m corr , wv ( m corr , wv ) ( 1 ) d L ( j ) m corr , wv ( m corr , wv ) ( 2 ) d L ( j ) m corr , wv ( m corr , wv ) ( m corr , wv + 1 ) ]
In Equation (A25), γ corr , wv S w ( m corr , wv ) is expressed as,
γ corr , wv S w ( m corr , wv ) = [ γ corr , wv S w 1 ( m corr , wv ) γ corr , wv S w 2 ( m corr , wv ) γ corr , wv S w N pixel ( m corr , wv ) ]
with
γ corr , wv S w p m corr , wv = [ γ corr , wv ( 1 ) S w p ( m corr , wv ( 1 ) , k = 1 ) ( 1 ) γ corr , wv ( 1 ) S w p ( m corr , wv ( 1 ) , k = 2 ) ( 1 ) γ corr , wv ( 1 ) S w p ( m corr , wv ( 1 ) , k = N PC ) ( 1 ) 0 uncorr , p γ corr , wv ( 2 ) S w p ( m corr , wv ( 2 ) , k = 1 ) ( 2 ) γ corr , wv ( 2 ) S w p ( m corr , wv ( 2 ) , k = 2 ) ( 2 ) γ corr , wv ( 2 ) S w p ( m corr , wv ( 2 ) , k = N PC ) ( 2 ) 0 uncorr , p γ corr , wv ( N TP , corr ) S w p ( m corr , wv ( N TP , corr ) , k = 1 ) ( N TP , corr ) γ corr , wv ( N TP , corr ) S w p ( m corr , wv ( N TP , corr ) , k = 2 ) ( N TP corr ) γ corr , wv ( N TP , corr ) S w p ( m corr , wv ( N TP , corr ) , k = N PC ) ( N TP , corr ) 0 uncorr , p ]
with the column vector for j-th type of correlated parameter described by,
γ corr , wv ( j ) S w ( m corr , wv ( j ) , k ) ( j ) = γ corr , wv ( j ) × [ i = 1 m corr , wv ( j ) + 1 d 1 ( m corr , wv ( j ) ) ( i ) × v k ( [ n = 1 j 1 L ( n ) ] + i ) i = 1 m corr , wv ( j ) + 1 d 2 ( m corr , wv ( j ) ) ( i ) × v k ( [ n = 1 j 1 L ( n ) ] + i ) i = 1 m corr , wv ( j ) + 1 d L ( j ) m corr , wv ( m corr , wv ( j ) ) ( i ) × v k ( [ n = 1 j 1 L ( n ) ] + i ) ]
Moreover, Equation (59) is implemented to evaluate d ( S wv ( m corr , Δ wv ) x i ) / d x i in Equation (A24).

Appendix D. Decoupled Smoothness Constraints

Smooth variations are often directly observed in PC weights and elements in a PC vector associated with a certain type of parameter. Direct imposition of smoothness helps stabilize the first few iterations when a priori information about the PC vectors and weights is insufficient. In an integrated form, the across-pixel and within-PC smoothness matrix is expressed as
γ corr w / v Ω corr w / v = γ corr w Ω corr w + γ corr v Ω corr v
where γ corr w Ω corr w and γ corr v Ω corr v represent the matrix form of smoothness constraints imposed on PC weights and PC vectors, respectively. The explicit forms of γ corr w Ω corr w and γ corr v Ω corr v are given in the Appendix D.1 and Appendix D.2, respectively.

Appendix D.1. Across-Pixel Smoothness Constraints on PC Weights

The smoothness constraints imposed directly on PC weights is expressed as
γ corr w Ω corr w = k = 1 N PC [ γ corr , k w S w ( m corr , K w ) ( k ) ] T [ γ corr , k w S w ( m corr , k w ) ( k ) ]
where
γ corr , k w S w ( m corr , k w ) ( k ) = [ 0 0 0 0 0 0 C p 1 ( 1 , k ) 0 uncorr , p 1 C p 1 ( 2 , k ) 0 uncorr , p 2 C p 1 ( m corr , k w + 1 , k ) 0 uncorr , p 1 + m corr , k w 0 0 0 0 C p 2 ( 1 , k ) 0 uncorr , p 2 C p 2 ( 2 , k ) 0 uncorr , p 3 C p 2 ( m corr , k w + 1 , k ) 0 uncorr , p 2 + m corr w ( k ) 0 0 0 C N pixel m corr , k w ( 1 , k ) 0 uncorr , N pixel m corr , k w C N pixel m corr , k w ( 2 , k ) 0 uncorr , N pixel m corr , k w + 1 C N pixel m corr , k w ( m corr , k w + 1 , k ) 0 uncorr , N pixel ]
where the first two columns of zero matrices are to accommodate the multi-pixel mean of correlated parameters and PC vectors, and C(i, k) is calculated by
C p ( m , k ) = d k , p ( m corr w ( k ) ) ( m ) γ corr , k w [ 0 0 0 δ ( k , 1 ) δ ( k , 2 ) δ ( k , N PC ) 0 0 0 ] N Pixel × N PC
where the delta function δ ( k , k ) = 1 for k = k′ and 0 for kk′, respectively, and the differentiation arrays are expressed similarly as Equations (A7) and (A8), except that an extra subscript “k” is introduced to the differentiation arrays d to allow different strength and orders of difference of smoothness constraints to impose on a specific (k-th) principal component.

Appendix D.2. Within-PC Smoothness Constraints

The matrix form of within-PC smothness constraints imposed directly upon a PC is evaluated by,
γ corr v Ω corr v = k = 1 N PC [ γ corr , k v S v ( m corr , k v ) ( k ) ] T [ W ( m corr , k v ) ] 1 [ γ corr , k v S v ( m corr , k v ) ( k ) ]
where
[ γ corr , k v S v ( m corr , k v ) ( k ) ] v = [ 0 T ( m corr , k v ) ( 1 ) T ( m corr , k v ) ( 2 ) T ( m corr , k v ) ( N PC ) 0 0 ]
where the first zero matrix accommodates the multi-pixel mean of correlated parameters, the last two zero matrices accommodate the PC weights and uncorrelated parameters, and T ( m corr , k v ) ( k ) is evaluated by,
T ( m corr , k v ) ( k ) = [ C   ( m corr , k v ( 1 ) , k ) ( 1 ) 0 0 0 C   ( m corr , k v ( 2 ) , k ) ( 2 ) 0 0 0 C   ( m corr , k v ( N TP , corr ) , k ) ( N TP , corr ) ]
where
C ( m corr , k v ( j ) , k ) ( j ) = γ corr , k v ( j ) [ d k , 1 ( m corr , k v ( j ) ) ( 1 ) d k , 1 ( m corr , k v ( j ) ) ( 2 ) d k , 1 ( m corr , k v ( j ) ) ( m corr , k v ( j ) + 1 ) 0 0 0 d k , 2 ( m corr , k v ( j ) ) ( 1 ) d k , 2 ( m corr , k v ( j ) ) ( 2 ) d k , 2 ( m corr , k v ( j ) ) ( m corr , k v ( j ) + 1 ) 0 0 0 d k , L ( j ) m corr , k v ( j ) ( m corr , k v ( j ) ) ( 1 ) d k , L ( j ) m corr , k v ( j ) ( m corr , k v ( j ) ) ( 2 ) d k , L ( j ) m corr , k v ( j ) ( m corr , k v ( j ) ) ( m corr , k v ( j ) + 1 ) ]
where d depends on the type of correlated parameters and is expressed in Equations (A7) and (A8). It can also vary as a function of a specific principal component. The weights matrix W ( m corr , k v ) in Equation (A36) is evaluated in the same way as for within-pixel constraints for uncorrelated parameters (see Equation (A16)).

References

  1. Phillips, D.L. A technique for numerical solution of certain integral equation of first kind. J. ACM 1962, 9, 84–97. [Google Scholar] [CrossRef]
  2. Twomey, S. On the numerical solution of Fredholm integral equations of the first kind by the inversion of the linear system produced by quadrature. J. ACM 1963, 10, 97–101. [Google Scholar] [CrossRef]
  3. Twomey, S. Introduction to the Mathematics of Inversion in Remote Sensing and Indirect Measurements; Elsevier: New York, NY, USA, 1977. [Google Scholar]
  4. Tikhonov, A.N. On the solution of incorrectly stated problems and a method of regularization. Dokl. Akad. Nauk SSSR 1963, 151, 501–504. [Google Scholar]
  5. Tikhonov, A.N.; Arsenin, V.Y. Solution of Ill-Posed Problems; Wiley: New York, NY, USA, 1977. [Google Scholar]
  6. Dubovik, O.; Herman, M.; Holdak, A.; Lapyonok, T.; Tanré, D.; Deuzé, J.L.; Ducos, F.; Sinyuk, A.; Lopatin, A. Statistically optimized inversion algorithm for enhanced retrieval of aerosol properties from spectral multi-angle polarimetric satellite observations. Atmos. Meas. Tech. 2011, 4, 975–1018. [Google Scholar] [CrossRef] [Green Version]
  7. Liu, X.; Smith, W.L.; Zhou, D.K.; Larar, A. Principal component-based radiative transfer model for hyperspectral sensors: Theoretical concept. Appl. Opt. 2006, 45, 201–209. [Google Scholar] [CrossRef] [PubMed]
  8. Natraj, V.; Spurr, R.J.D. A fast linearized pseudo-spherical two orders of scattering model to account for polarization in vertically inhomogeneous scattering-absorbing media. J. Quant. Spectrosc. Radiat. Transf. 2007, 107, 263–293. [Google Scholar] [CrossRef]
  9. Spurr, R.J.D.; Natraj, V.; Lerot, C.; van Roozendael, M.; Loyola, D. Linearization of the principal component analysis method for radiative transfer acceleration: Application to retrieval algorithms and sensitivity studies. J. Quant. Spectrosc. Radiat. Transf. 2013, 125, 1–17. [Google Scholar] [CrossRef]
  10. Liu, X.; Zhou, D.K.; Larar, A.M.; Smith, W.L.; Mango, S.A. Case-study of a principal-component-based radiative transferforward model and retrieval algorithm using EAQUATE data. Q. J. R. Meteorol. Soc. 2007, 133, 243–256. [Google Scholar] [CrossRef]
  11. Liu, X.; Zhou, D.K.; Larar, A.M.; Smith, W.L.; Schluessel, P.; Newman, S.M.; Taylor, J.P.; Wu, W. Retrieval of atmospheric profiles and cloud properties from IASI spectra using super-channels. Atmos. Chem. Phys. 2009, 9, 9121–9142. [Google Scholar] [CrossRef] [Green Version]
  12. Liu, X.; Liu, L.; Zhang, S.; Zhou, X. New spectral fitting method for full-spectrum solar-induced chlorophyll fluorescence retrieval based on principal components analysis. Remote Sens. 2015, 7, 10626–10645. [Google Scholar] [CrossRef]
  13. Martonchik, J.V.; Diner, D.J.; Kahn, R.A.; Verstraete, M.M.; Pinty, B.; Gordon, H.R.; Ackerman, T.P. Techniques for the retrieval of aerosol properties over land and ocean using multiangle data. IEEE Trans. Geosci. Remote Sens. 1998, 36, 1212–1227. [Google Scholar] [CrossRef]
  14. Martonchik, J.V.; Kahn, R.A.; Diner, D.J. Retrieval of aerosol properties over land using MISR observations. In Satellite Aerosol Remote Sensing over Land; Kokhanovsky, A., de Leeuw, G., Eds.; Springer: Berlin, Germany, 2009. [Google Scholar]
  15. Diner, D.J.; Martonchik, J.V.; Kahn, R.A.; Pinty, B.; Gobron, N.; Nelson, D.L.; Holben, B.N. Using angular and spectral shape similarity constraints to improve MISR aerosol and surface retrievals overland. Remote Sens. Environ. 2005, 94, 155–171. [Google Scholar] [CrossRef]
  16. Dubovik, O.; Li, Z.; Mishchenko, M.I.; Tanré, D.; Karol, Y.; Bojkov, B.; Cairns, B.; Diner, D.J.; Espinosa, W.R.; Goloub, P.; et al. Polarimetric remote sensing of atmospheric aerosols: Instruments, methodologies, results, and perspectives. J. Quant. Spectrosc. Radiat. Transf. 2019, 224, 474–511. [Google Scholar] [CrossRef]
  17. Kokhanovsky, A.A. The modern aerosol retrieval algorithms based on the simultaneous measurements of the intensity and polarization of reflected solar light: A review. Front. Environ. Sci. 2015, 3, 4. [Google Scholar] [CrossRef]
  18. Xu, F.; Dubovik, O.; Zhai, P.-W.; Diner, D.J.; Kalashnikova, O.V.; Seidel, F.C.; Litvinov, P.; Bovchaliuk, A.; Garay, M.J.; van Harten, G.; et al. Joint retrieval of aerosol and water-leaving radiance from multispectral, multiangular and polarimetric measurements over ocean. Atmos. Meas. Tech. 2016, 9, 2877–2907. [Google Scholar] [CrossRef] [Green Version]
  19. Xu, F.; van Harten, G.; Diner, D.J.; Kalashnikova, O.V.; Seidel, F.C.; Bruegge, C.J.; Dubovik, O. Coupled retrieval of aerosol properties and land surface reflection using the Airborne Multiangle SpectroPolarimetric Imager. J. Geophys. Res. Atmos. 2017, 122, 7004–7026. [Google Scholar] [CrossRef]
  20. Cahalan, R.F.; Ridgway, W.; Wiscombe, W.J.; Bell, T.L.; Snider, J.B. The albedo of fractal stratocumulus clouds. J. Atmos. Sci. 1994, 51, 2434–2455. [Google Scholar] [CrossRef]
  21. Hou, W.; Wang, J.; Xu, X.; Reid, J.S.; Han, D. An algorithm for hyperspectral remote sensing of aerosols: 1. Development of theoretical framework. J. Quant. Spectrosc. Radiat. Transf. 2016, 178, 400–415. [Google Scholar] [CrossRef]
  22. Hou, W.; Wang, J.; Xu, X.; Reid, J.S. An algorithm for hyperspectral remote sensing of aerosols: 2. Information content analysis for aerosol parameters and principal components of surface spectra. J. Quant. Spectrosc. Radiat. Transf. 2017, 192, 14–29. [Google Scholar] [CrossRef]
  23. Dubovik, O.; University of Lille; Xu, F.; Jet Propulsion Laboratory. Personal communication, 2018.
  24. Dubovik, O. Optimization of numerical inversion in photopolarimetric remote sensing. In Photopolarimetry in Remote Sensing; Videen, G., Yatskiv, Y., Mishchenko, M., Eds.; Kluwer Academic Publishers: Dordrecht, The Netherlands, 2004; pp. 65–106. [Google Scholar]
  25. Dubovik, O.; King, M.D. A flexible inversion algorithm for retrieval of aerosol optical properties from Sun and sky radiance measurements. J. Geophys. Res. 2000, 105, 673–696. [Google Scholar] [CrossRef]
  26. Levenberg, K. A method for the solution of certain non-linear problems in Least Squares. Quart. Appl. Math. 1944, 2, 164–168. [Google Scholar] [CrossRef]
  27. Marquardt, D. An algorithm for least-squares estimation of nonlinear parameters. SIAM J. Appl. Math. 1963, 11, 431–441. [Google Scholar] [CrossRef]
  28. Xu, F.; Davis, A.B.; West, R.A.; Esposito, L.W. Markov chain formalism for polarized light transfer in plane-parallel atmospheres, with numerical comparison to the Monte Carlo method. Opt. Express 2010, 19, 946–967. [Google Scholar] [CrossRef] [PubMed]
  29. Lacis, A.A.; Hansen, J.E. A parameterization for the absorption of solar radiation in the Earth’s atmosphere. J. Atmos. Sci. 1974, 31, 118–133. [Google Scholar] [CrossRef]
  30. Dubovik, O.; Sinyuk, A.; Lapyonok, T.; Holben, B.N.; Mishchenko, M.; Yang, P.; Eck, T.F.; Volten, H.; Muñoz, O.; Veihelmann, B.; et al. Application of spheroid models to account for aerosol particle nonsphericity in remote sensing of desert dust. J. Geophys. Res. 2006, 111, D11208. [Google Scholar] [CrossRef]
  31. Rahman, H.; Pinty, B.; Verstraete, M.M. Coupled surface-atmosphere reflectance (CSAR) model 2. Semiempirical surface model usable with NOAA advanced very high resolution radiometer data. J. Geophys. Res. 1993, 98, 20791–20801. [Google Scholar] [CrossRef]
  32. Litvinov, P.; Hasekamp, O.; Cairns, B. Models for surface reflection of radiance and polarized radiance: Comparison with airborne multi-angle photopolarimetric measurements and implications for modeling top-of-atmosphere measurements. Remote Sens. Environ. 2011, 115, 781–792. [Google Scholar] [CrossRef]
  33. Van Harten, G.; Diner, D.J.; Daugherty, B.J.S.; Rheingans, B.E.; Bull, M.A.; Seidel, F.C.; Chipman, R.A.; Cairns, B.; Wasilewski, A.P.; Knobelspiesse, K.D. Calibration and validation of airborne multiangle spectropolarimetric imager (AirMSPI) polarization measurements. Appl. Opt. 2018, 57, 4499–4513. [Google Scholar] [CrossRef]
  34. Dubovik, O.; Smirnov, A.; Holben, B.N.; King, M.D.; Kaufman, Y.J.; Eck, T.F.; Slutsker, I. Accuracy assessment of aerosol optical properties retrieval from AERONET sun and sky radiance measurements. J. Geophys. Res. 2000, 105, 9791–9806. [Google Scholar] [CrossRef]
  35. Dubovik, O.; Lapyonok, T.; Litvinov, P.; Herman, M.; Fuertes, D.; Ducos, F.; Lopatin, A.; Chaikovsky, A.; Torres, B.; Derimian, Y.; et al. GRASP: A versatile algorithm for characterizing the atmosphere. SPIE Newsroom 2014, 25. [Google Scholar] [CrossRef]
  36. Lyapustin, A.; Martonchik, J.; Wang, Y.; Laszlo, I.; Korkin, S. Multiangle implementation of atmospheric correction (MAIAC): 1. Radiative transfer basis and look-up tables. J. Geophys. Res. Atmos. 2011, 116, D03210. [Google Scholar] [CrossRef]
  37. Lyapustin, A.; Wang, Y.; Laszlo, I.; Kahn, R.; Korkin, S.; Remer, L.; Levy, R.; Reid, J.S. Multiangle implementation of atmospheric correction (MAIAC): 2. Aerosol algorithm. J. Geophys. Res. Atmos. 2011, 116, D03211. [Google Scholar] [CrossRef]
  38. Baldridge, A.M.; Hook, S.J.; Grove, C.I.; Rivera, G. The ASTER spectral library version 2.0. Remote Sens. Environ. 2009, 113, 711–715. [Google Scholar] [CrossRef]
  39. Clark, R.N.; Swayze, G.A.; Wise, R.; Livo, E.; Hoefen, T.; Kokaly, R.; Sutley, S.J. USGS digital spectral library splib06a. USA Geol. Surv. Digit. Data Ser. 2007, 231, 2007. [Google Scholar]
  40. Levy, R.C.; Remer, L.A.; Mattoo, S.; Vermote, E.F.; Kaufman, Y.J. Second-generation operational algorithm: Retrieval of aerosol properties over land from inversion of moderate resolution imaging spectroradiometer spectral reflectance. J. Geophys. Res. 2007, 112, D13211. [Google Scholar] [CrossRef]
  41. Diner, D.J.; Beckert, J.C.; Reilly, T.H.; Bruegge, C.J.; Conel, J.E.; Kahn, R.; Martonchik, J.V.; Ackerman, T.P.; Davies, R.; Gerstl, S.A.W.; et al. Multiangle imaging spectro-radiometer (MISR) description and experiment overview. IEEE Trans. Geosci. Remote Sens. 1998, 36, 1072–1087. [Google Scholar] [CrossRef]
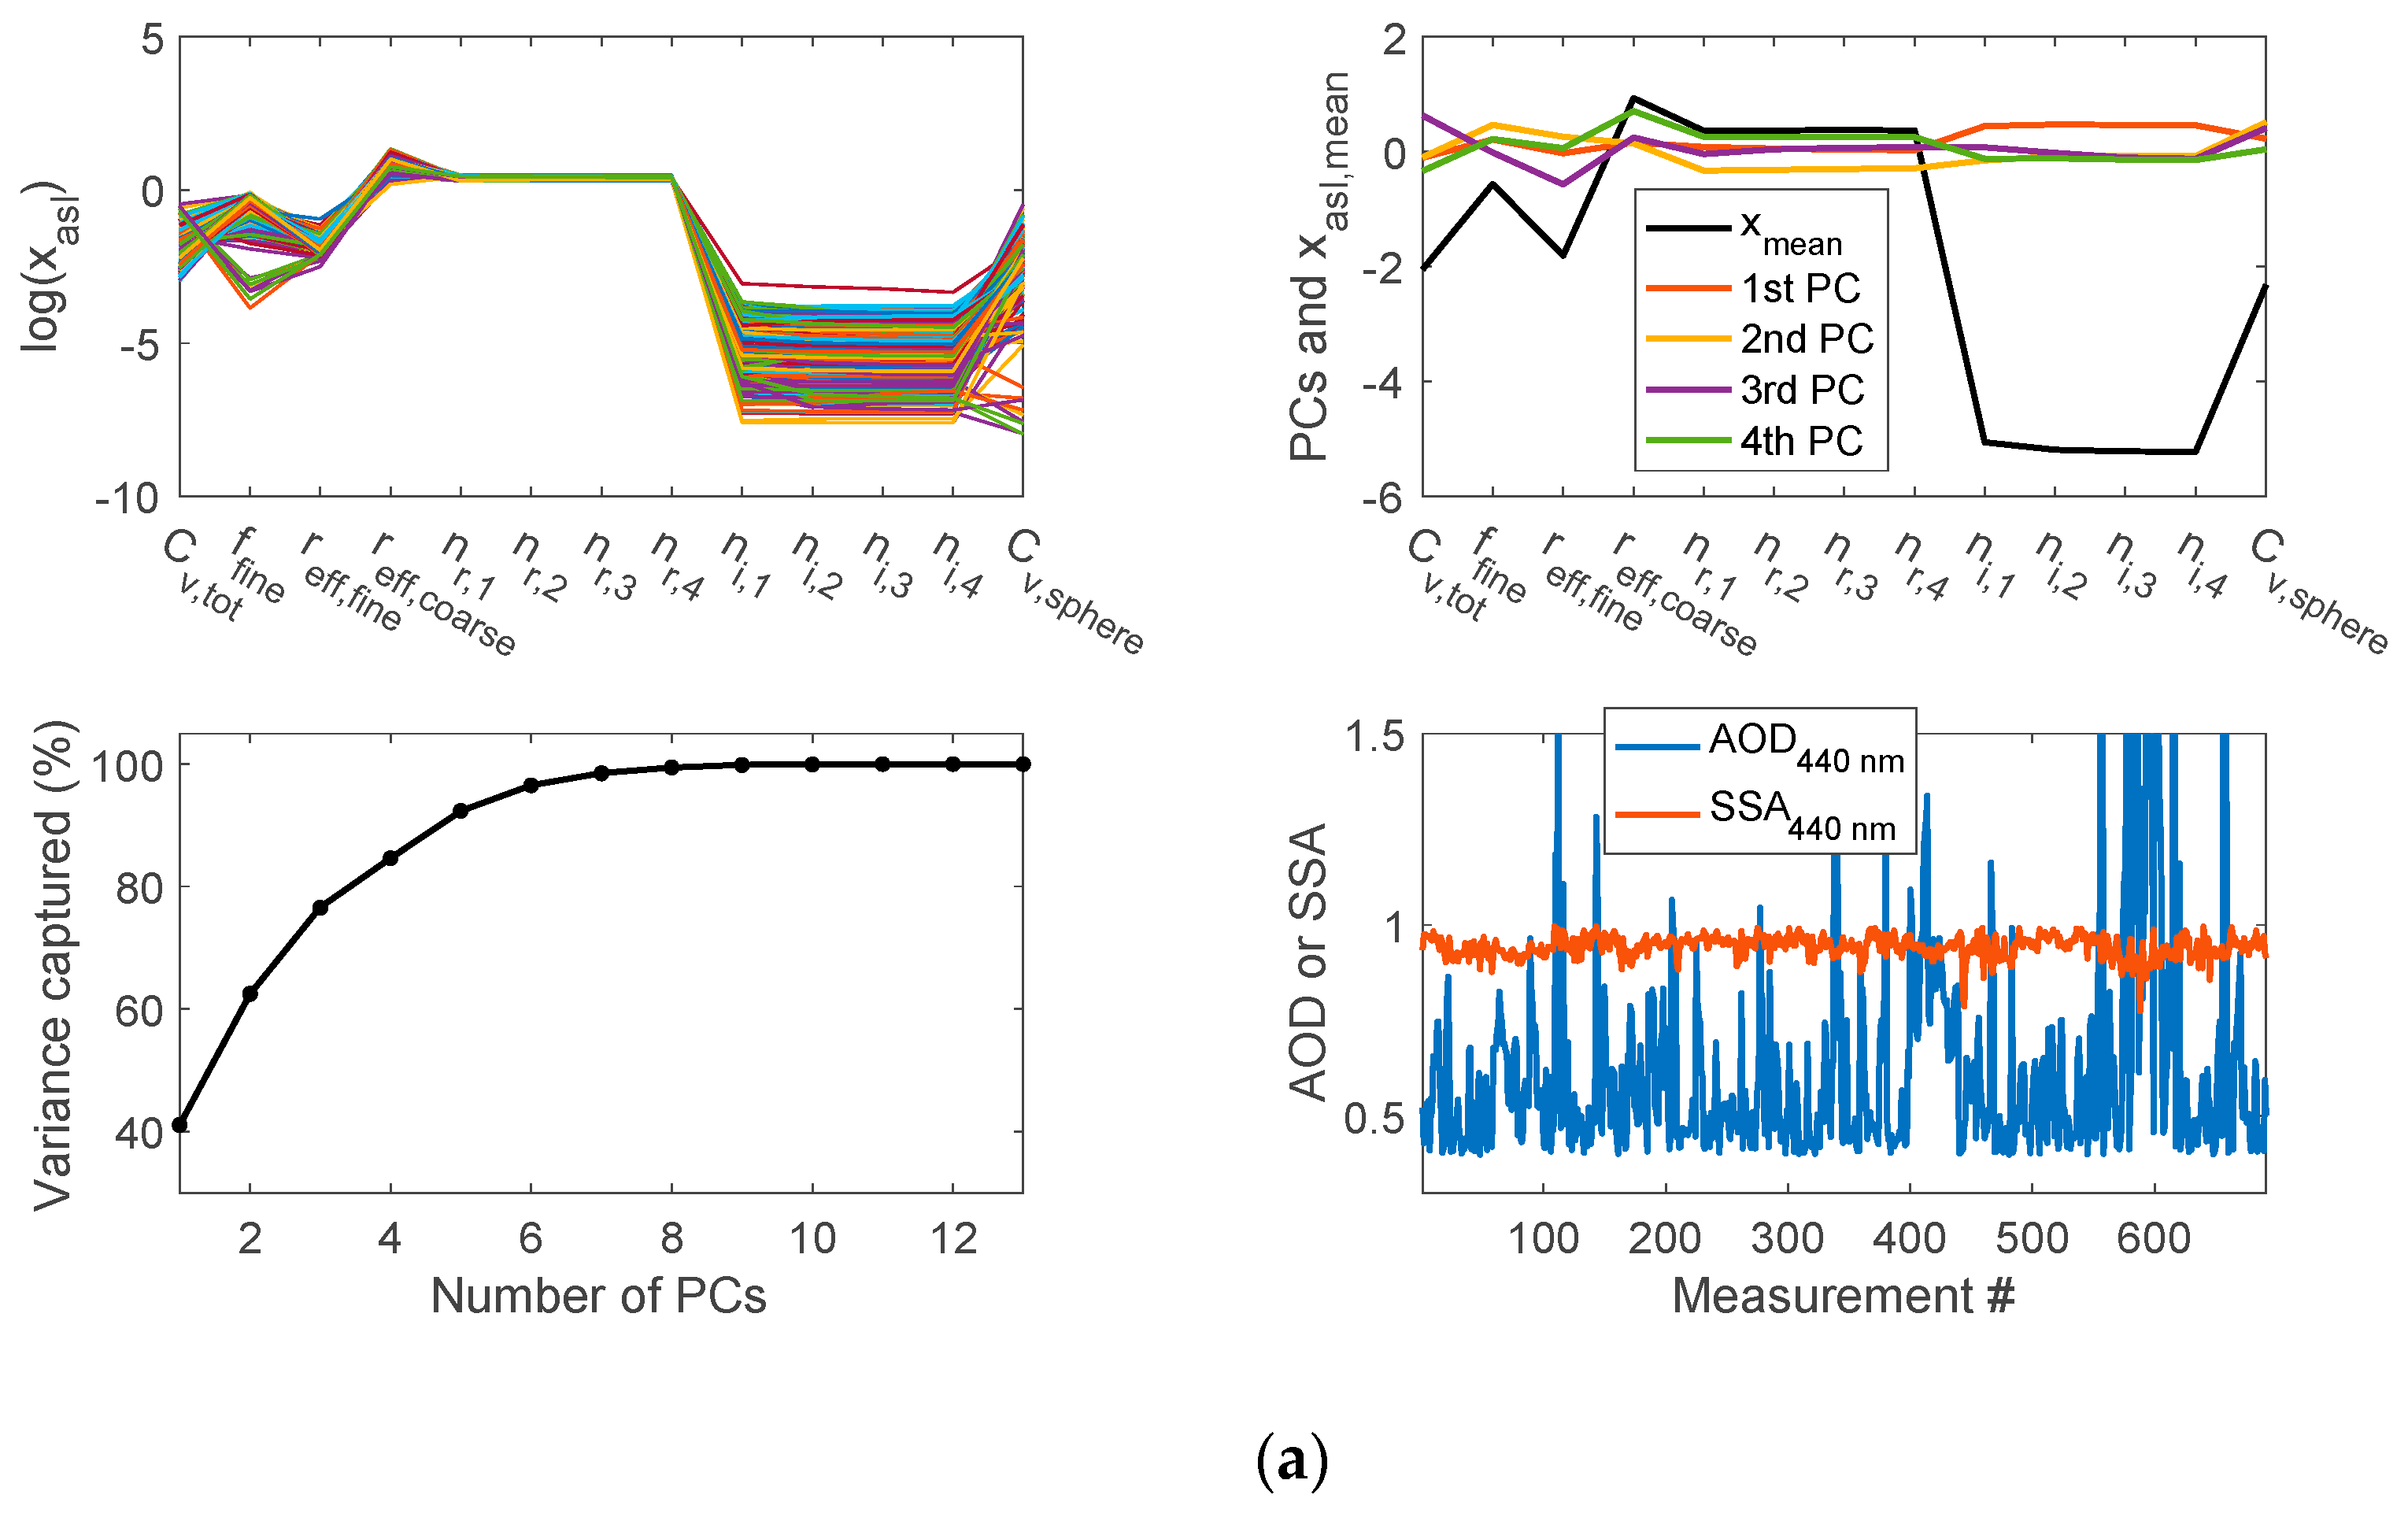
Figure 1. (a) Top left panel: AERONET inversion of aerosol fields and properties (in natural logarithm space) including total volume concentration ( C v , tot ), fraction of fine mode aerosols ( f fine ), effective radii of fine ( r eff ,   fine ) and coarse ( r eff ,   coarse ) mode aerosols, column effective real part of refractive indices ( n r ,   1 4 ) at 0.439, 0.675, 0.870, and 1.018 μm, respectively, imaginary part of refractive indices ( n i ,   1 4 ), and spherical particle volume concentration ( C v , sphere ). Though not specified by use of legend, each color is associated with an independent set of retrieval parameters. Top right panel: spatial and temporal mean of all retrievals and the first four principal components (PCs). Bottom left panel: percentage variance of the aerosol fields captured by PCs, indicating that 41%, 62%, 77%, and 85% of variance is captured by the first one, two, three, and four PCs, respectively. Bottom right panel: Aerosol optical depth (AOD) and single scattering albedo (SSA) at 440 nm that are reported in the AERONET retrievals analyzed here. (b) Regression of the derived aerosol properties from four PC against input AERONET values. The scatter plot is colored by the density of the points. Each panel corresponds to a specific aerosol property indicated in the title.
Remotesensing 11 00746 g001aRemotesensing 11 00746 g001b
Figure 2. Same as Figure 1 but analysis was performed for a circular domain of 2000 km around AERONET site in Namibe, Angola. The first four PCs capture 56%, 74%, 83%, and 90% variance of the aerosol fields.
Remotesensing 11 00746 g002
Figure 3. General structure of the correlated multi-pixel inversion approach. The interpretation of symbols used in the figure can be found in Table A1 of Appendix A.
Remotesensing 11 00746 g003
Figure 4. Depiction of the coupled atmosphere-surface (CAS) system model. The sun illuminates the top-of-atmosphere with solar zenith angle θ 0 and azimuthal plane ϕ 0 . The sensor views the atmosphere at view zenith angle θ v and azimuthal angle ϕ v . A Gaussian vertical distribution profile for aerosols. The Markov chain model is used for computing polarized RT in the atmosphere. It is then coupled with surface reflection using an adding method.
Remotesensing 11 00746 g004
Figure 5. The scheme of PC-based forward radiative transfer modeling of remote sensing observations from an airborne or spaceborne sensor. The interpretation of symbols used in the figure can be found in Table A1 of Appendix A.
Remotesensing 11 00746 g005
Figure 6. (a) Pixel-resolved spectral aerosol optical depth (AOD) used in simulating the radiance and degree of linear polarization (DOLP) in (b). The AODs for seven Airborne Multiangle SpectroPolarimetric Imager (AirMSPI) spectral bands are plotted in different colors: pink (355 nm), purple (380 nm), dark blue (445 nm), light blue (470 nm), green (555 nm), red (660 nm), and brown (865 nm). b) The principal component based RT (PC-RT) simulation of radiance using three PCs (upper left panel) and DOLP (lower left panel) at AirMSPI’s nine viewing angles within (−66°, +66°) range around nadir, and the relative error of PC based RT simulation of radiance (top right) and absolute error of DOLP (bottom right) as compared to direct RT computation pixel-by-pixel. Errors are estimated by 100 × (YPC-RT − YDirect-RT)/YDirect-RT for Y = radiance and by (YPC-RT − YDirect-RT) for Y = DOLP. The viewing geometries are adopted from one of the scenes acquired by AirMSPI during the ACEPOL field campaign. The unpolarized and polarized surface reflectance is calculated from the retrieved BRDF and pBRDF parameters, respectively.
Remotesensing 11 00746 g006
Figure 7. Algorithm flowchart for correlated multi-pixel retrieval of aerosol and land surface reflection properties. The interpretation of symbols used in the figure can be found in Table A1 of Appendix A.
Remotesensing 11 00746 g007
Figure 8. (a) High resolution AirMSPI nadir imagery of Baskin, Louisiana, acquired on September 9, 2013. The left image is of radiance at 445, 555, and 660 nm. The location of the Baskin AERONET site is marked. The right image displays DOLP in the three polarimetric bands (470, 660, and 865 nm). The yellow box indicates the area viewed at all 9 AirMSPI view angles, and where data were used for retrieval algorithm testing. (b) Lower-resolution imagery (~1.0 km) of the retrieval area after pixel aggregation. The left, middle, and right panels are images of BRF at 445, 555, and 660 nm, respectively. (c) Retrieved AOD, SSA, and surface albedo (A) maps at 555 nm in the left, middle, and right panels, respectively. (d) The AirMSPI retrieved AOD, SSA, and volume weighted aerosol size distribution at the pixel closest to the Baskin AERONET site, compared to the AERONET-derived values.
Remotesensing 11 00746 g008
Figure 9. (a) Regression of pixel-scale AOD retrieved from correlated multi-pixel inversion (CMPI) against the previous retrievals using multi-pixel inversion (MPI, [19]). The AirMSPI dataset used for retrieval is the same as in Figure 5 over the AERONET Baskin site. The results for seven AirMSPI spectral bands are plotted in different colors: pink (355 nm), purple (380 nm), dark blue (445 nm), light blue (470 nm), green (555 nm), red (660 nm), and brown (865 nm). (b) The same as Figure 9a but for SSA. (c) Comparison of image-mean volume-weighted aerosol size distribution retrieved from correlated multi-pixel inversion and multi-pixel inversion.
Remotesensing 11 00746 g009aRemotesensing 11 00746 g009b
Figure 10. Regression of AirMSPI retrieved aerosol optical depth (AOD) against AERONET measured values. The upper three panels are for 355, 445, and 470 nm, and the lower three panels are for 555, 660, and 865 nm. Linear interpolation is used to obtain AERONET AOD values at the AirMSPI wavelengths. The AERONET uncertainties are from the ±~1-h window around the time of AirMSPI overflight plus measurement uncertainties (0.01), while the AirMSPI uncertainties are the root mean square of the retrieval uncertainties and standard deviation of pixel-resolved AODs over the whole image. Linear regression analysis yields values of slope a, intercept b, coefficient of determination R2, and mean absolute difference (MAD). Values of each are indicated in all panels.
Remotesensing 11 00746 g010
Figure 11. Comparison of AirMSPI retrieved single scattering albedo (SSA) against AERONET retrievals. The upper left and right panels are for 445 and 555 nm and the lower left and right panels are for 660 and 865 nm. Linear interpolation is used to obtain AERONET SSA values at the AirMSPI wavelengths. The AirMSPI errors are computed from statistics obtained over the whole image plus the errors evaluated using the method in Section 3.3. Values of MAD are shown.
Remotesensing 11 00746 g011
Figure 12. Same as Figure 11 but for the real part of aerosol refractive index.
Remotesensing 11 00746 g012
Figure 13. Same as Figure 11 but for the imaginary part of aerosol refractive index.
Remotesensing 11 00746 g013
Figure 14. Same as Figure 11 but for the effective radii of fine and coarse mode aerosols.
Remotesensing 11 00746 g014
Table 1. Correlation coefficient of AERONET retrieved aerosol properties analyzed in Figure 1 (for 2000 km circular around Fresno, California). The correlation is calculated for all parameters in logarithmic space.
Cv,totffinereff,finereff,coarsenr,1nr,2nr,3nr,4ni,1ni,2ni,3ni,4Cv,sphere
Cv,tot1.00−0.34−0.410.08−0.12−0.010.010.02−0.01−0.16−0.23−0.250.06
ffine-1.000.180.30−0.34−0.36−0.34−0.350.220.320.310.300.67
reff,fine--1.00−0.01−0.17−0.35−0.41−0.43−0.16-0.08−0.01−0.01−0.06
reff,coarse---1.00−0.01−0.01−0.01−0.010.250.230.210.200.25
nr,1----1.000.940.880.840.330.310.280.28−0.29
nr,2-----1.000.980.960.280.220.180.17−0.28
nr,3------1.000.990.240.160.120.11−0.26
nr,4-------1.000.210.120.080.08−0.28
ni,1--------1.000.950.900.870.23
ni,2---------1.000.980.960.29
ni,3----------1.000.990.25
ni,4-----------1.000.23
Cv,sphere------------1.00
Table 2. Correlation coefficient of AERONET retrieved aerosol properties analyzed in Figure 2 (for 2000 km circular domain around Namibe, Angola).
Cv,totffinereff,finereff,coarsenr,1nr,2nr,3nr,4ni,1ni,2ni,3ni,4Cv,sphere
Cv,tot1.00−0.32−0.37−0.05−0.43−0.41−0.42−0.40−0.52−0.54−0.54−0.540.39
ffine-1.000.230.42−0.12−0.060.020.090.620.590.570.560.45
reff,fine--1.00−0.070.200.180.170.140.260.280.270.26−0.01
reff,coarse---1.000.140.190.250.330.360.410.410.420.26
nr,1----1.000.970.920.860.510.580.580.58−0.31
nr,2-----1.000.980.940.570.610.610.61−0.28
nr,3------1.000.980.610.630.630.62−0.22
nr,4-------1.000.620.630.630.62−0.17
ni,1--------1.000.960.940.920.19
ni,2---------1.000.990.990.12
ni,3----------1.001.000.09
ni,4-----------1.000.08
Cv,sphere------------1.00
Table 3. Initial guess of image-effective (multi-pixel mean) aerosol parameters and uncorrelated pixel-resolved surface parameters, and the order of difference and Lagrange multipliers for imposing within-pixel smoothness constraints.
RangeFirst GuessOrder of Finite Difference for Spectral Smoothness Constraints ( m uncorr , ) Lagrange Regularization Factor ( γ uncorr , )
Aerosol parameters (scene-averaged)
Volume concentration of size components (Cv, 1-5, μm3/μm2)[1.0 × 10−6,5]0.002--
Central height of aerosol distribution profile (ha, km)[0.05,10]1--
Standard deviation of aerosol distribution profile (sa)[0.5,2.5]0.75--
Real part of refractive index (nr(λ))[1.33,1.60]1.5010.1
Imaginary part of refractive index (ni(λ))[5.0 × 10−7,5.0 × 10−1]0.00520.01
Spherical particle volume fraction (fv,sphere)[0.5,1.0]0.95--
Surface parameters (pixel-resolved)
BRDF spectral weight (aλ)[0,0.7]0.015–0.130.1
Anisotropy parameter (kλ)[0,1]0.610.5
Anisotropy parameter (gλ)[−1,1]0.110.5
pBRDF weight (ελ)[0,10]0.01--
Shadowing width (kγ) [0,1]0.7510.1
Slope variance (σs )[0.05,0.5]0.075--
Table 4. Initial guess and the order of difference and Lagrange multipliers for imposing within-pixel and across-pixel smoothness constraints on the correlated aerosol fields through the first two PCs.
Initial Guess (PC 1)Range (PC 1) Initial Guess (PC 2)Range (PC 2) Order of Finite Difference for Spectral Smoothness Constraints   ( m corr , wv ) Lagrange Multiplier ( γ corr , wv ) Order of Finite Difference for Spatial Smoothness Constraints ( m corr , Δ wv ) Lagrange Multiplier ( γ corr , Δ wv )
log(Cv, 1-5)0.1–0.6[−0.75,+0.75]−3 × 10⁻¹–7 × 10⁻¹[−1,+1]--11
log(ha)≈−1 × 10⁻¹[−0.9,+0.9]≈5 × 10⁻¹[−1,+1]--10.01
log(sa)≈−2 × 10⁻²[−0.4,+0.4]≈7 × 10⁻²[−0.4,+0.4]--10.01
log(nr(λ))≈3 × 10⁻³[−0.1,+0.1]≈5 × 10⁻³[−0.1,+0.1]10.1110
log(ni(λ))≈−2 × 10⁻²[−0.1,+0.1]≈2 × 10⁻²[−0.1,+0.1]20.0111
log(fv,sphere)≈6 × 10⁻³[−0.05,+0.05]≈4 × 10⁻³[−0.05,+0.05]--10.1
Table 5. The order of difference and Lagrange multipliers for imposing within-PC constraints on the first two PC vectors and for imposing across-pixel constraint on the PC weights.
Initial GuessRange (in log-space)Order of Finite Difference for Spectral Smoothness Constraints on First (Second) PC Vectors
( m c o r r , v )
Lagrange Multiplier on First (Second) PC Vectors
( γ c o r r , v )
Order of Finite Difference for Spatial Smoothness Constraints on First (Second) PC weight
( m c o r r , Δ w )
Lagrange Multiplier on PC Weights ( γ c o r r , Δ w )
log(Cv, 1-5)−0.3–0.7[−1,+1]----
log(ha)≈5 × 10⁻¹[−1,+1]----
log(sa)≈7 × 10⁻²[−0.4,+0.4]----
log(nr(λ))≈5 × 10⁻³[−0.1,+0.1]1(1)0.01(0.001)--
log(ni(λ))≈2.5 × 10⁻²[−0.01,+0.01]2(2)0.001(0.00001)--
log(fv,sphere)≈4 × 10⁻³[−0.05,+0.05]--1(1)0.05(0.005)
wp0[−10,10]--1(1)0.05(0.005)
Table 6. Mean absolute bias (MAD) in key aerosol properties from correlated multi-pixel inversion approach using two PCs (this paper) and from original multi-pixel inversion approach adapted to AirMSPI [19]. The bias is calculated by taking the mean of the absolute difference between AirMSPI and AERONET retrievals at collocated pixels. A total of 27 AirMSPI datasets are used. Interpolation is used to calculate some AERONET parameters at central wavelengths of the AirMSPI spectral bands. By performing regression against AERONET reference AOD, the coefficients of determination (R2) are given in columns 3 and 5. The ranges of non-AOD parameters are too small and the sample size is limited. Therefore a reliable regression analysis is not established and R2 is reported only for AOD in the table.
ParametersCorrelated Multi-pixel InversionOriginal Multi-pixel Inversion
MADR2MADR2
AOD355 nm 0.0580.9170.0400.925
AOD445 nm0.0350.9270.0240.955
AOD470 nm0.0300.9330.0210.960
AOD555 nm0.0200.9330.0160.960
AOD660 nm0.0160.9220.0130.959
AOD865 nm0.0150.8150.0140.851
SSA445 nm0.035-0.030-
SSA555 nm0.036-0.030-
SSA660 nm0.040-0.032-
SSA865 nm0.041-0.035-
nr,445 nm0.052-0.039-
nr,555 nm0.051-0.039-
nr,660 nm0.046-0.036-
nr,865 nm0.038-0.037-
ni,445 nm0.004-0.004-
ni,555 nm0.004-0.004-
ni,660 nm0.005-0.004-
ni,865 nm0.005-0.005-
reff,fine (μm)0.024-0.022-
reff,coarse (μm)1.050-0.993-