Performance of Laser-Based Electronic Devices for Structural Analysis of Amazonian Terra-Firme Forests

 , , , , , ,
Abstract
1. Introduction
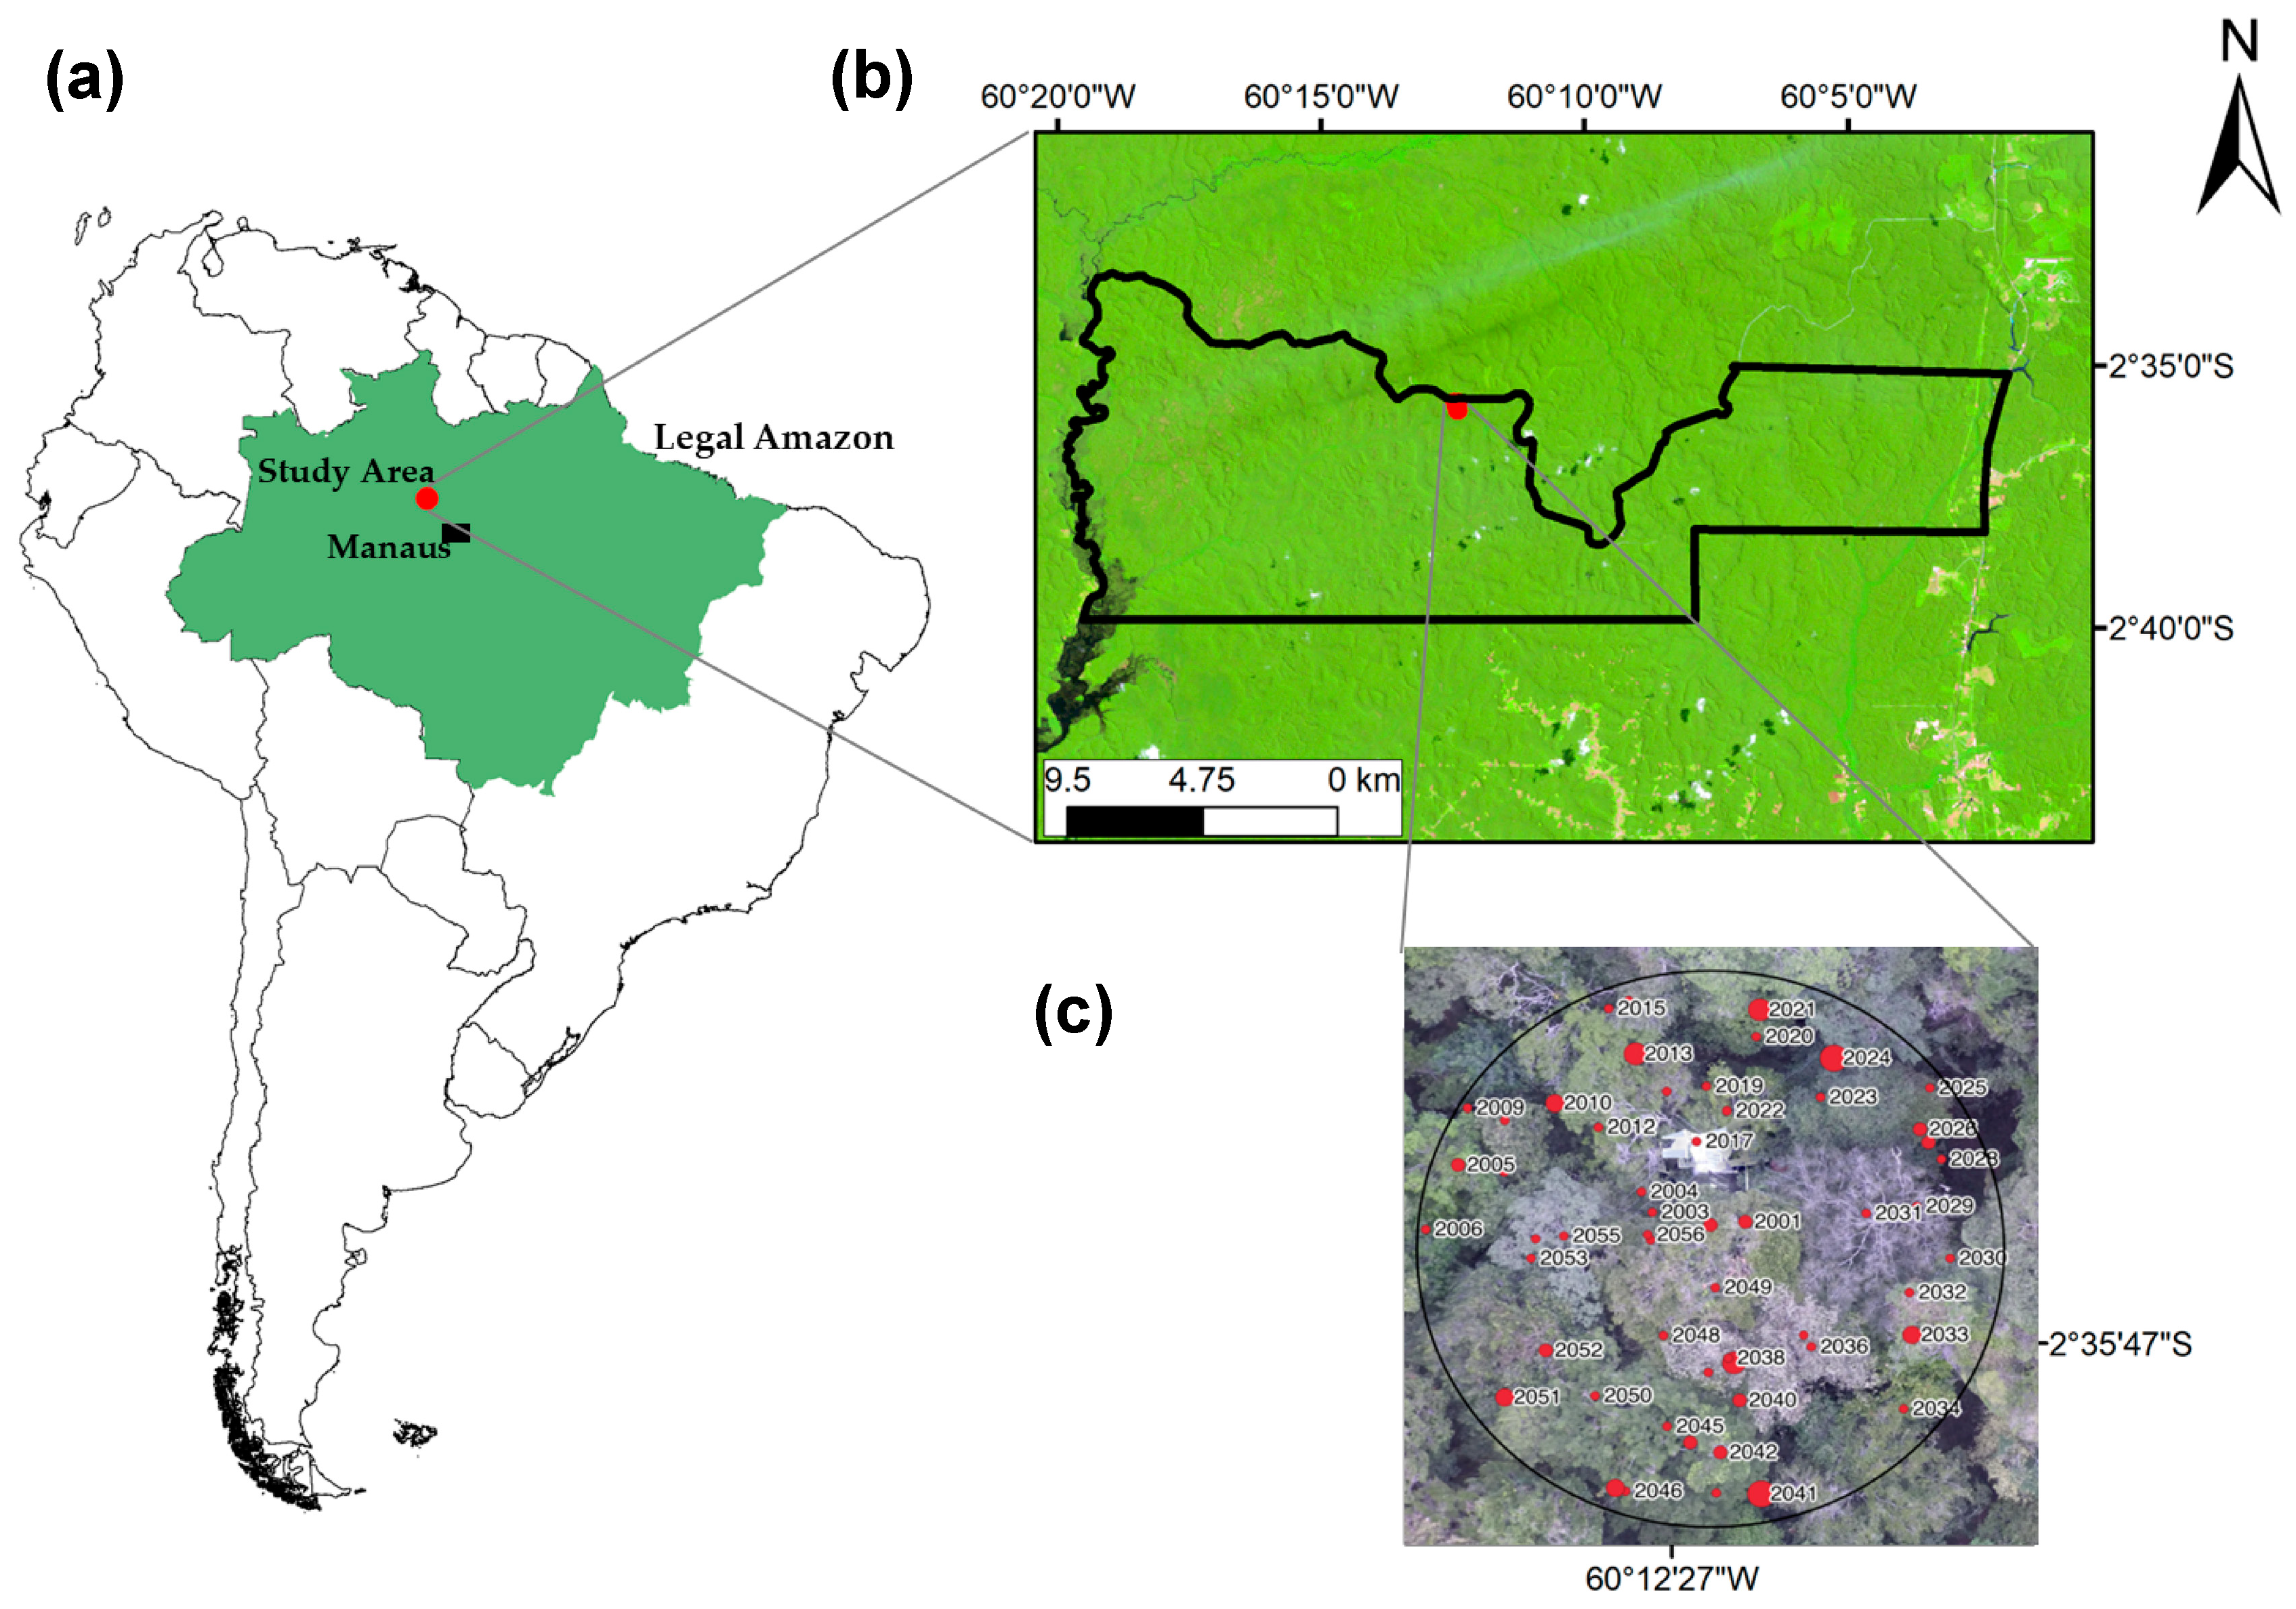
2. Materials and Methods
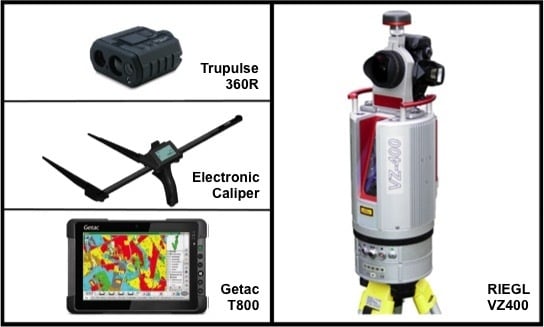
2.1. Measurements Obtained with Traditional Forest Inventory Techniques
2.2. Measurements Obtained with the Field-Map Bundle
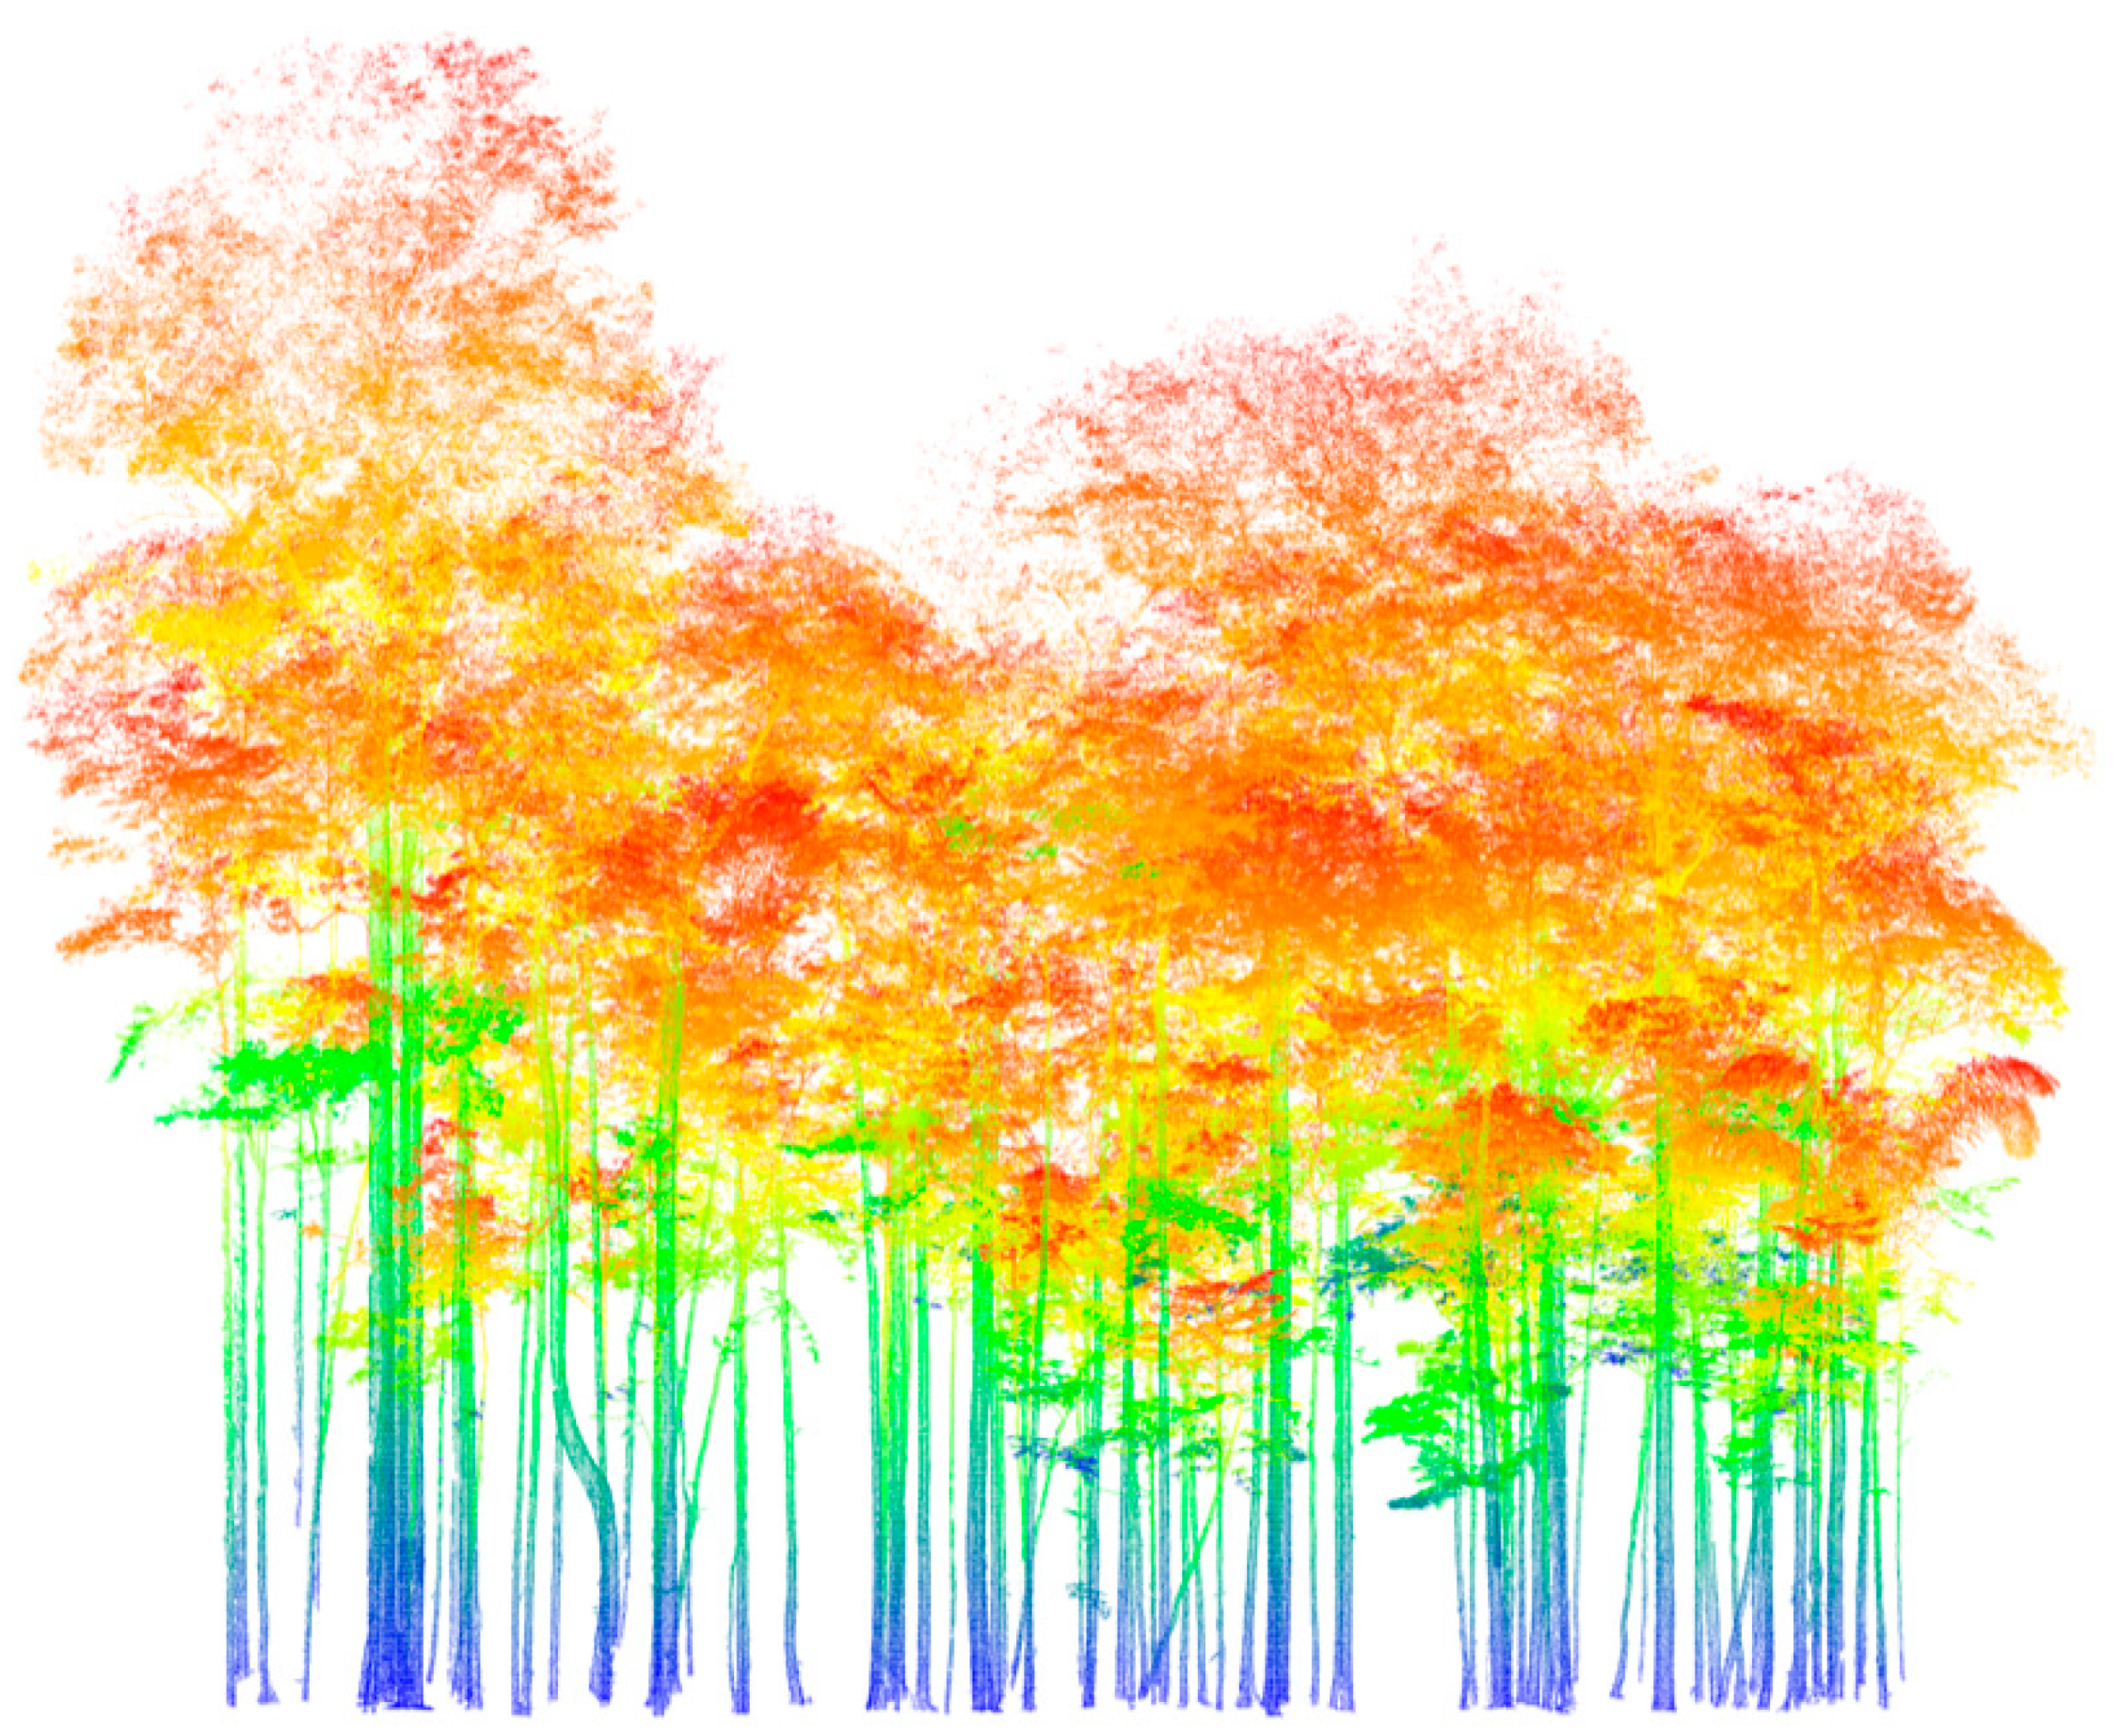
2.3. Measurements Obtained with Terrestrial Laser Scanning
Terrestrial Laser Scanning
Registration of the Point Cloud
Extracting Individual Trees
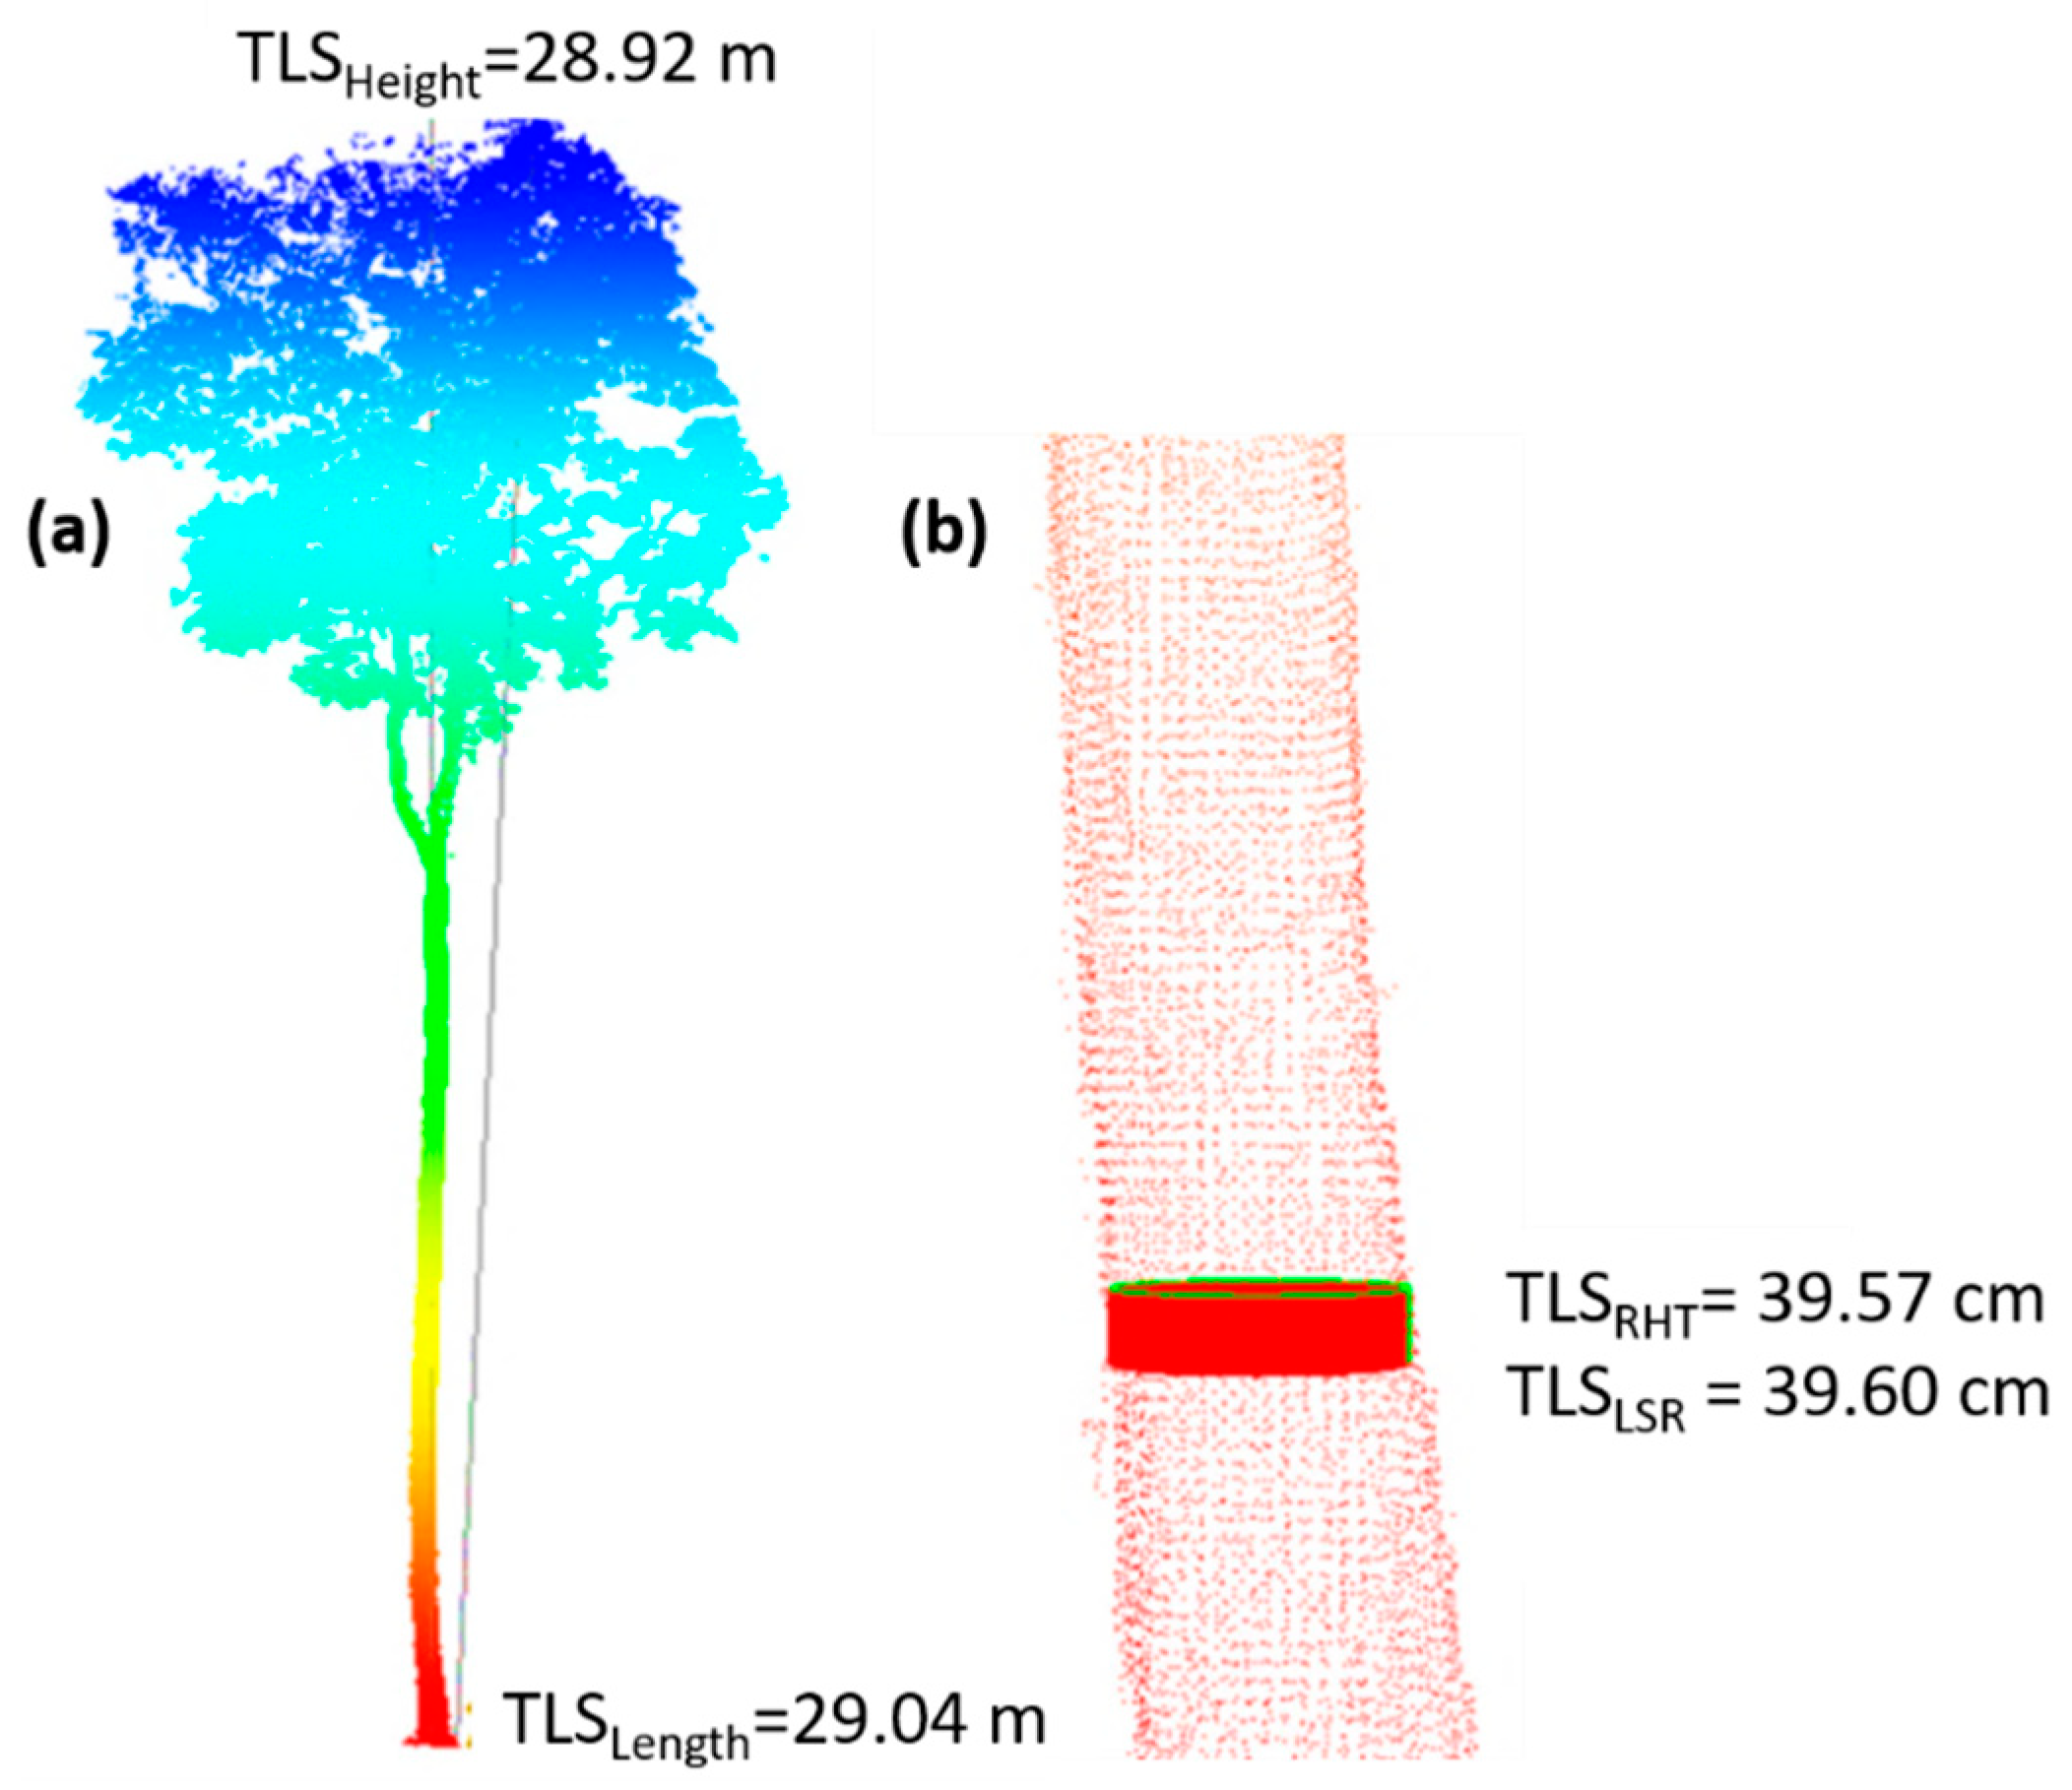
Acquisition of Biometric Variables from the Point Cloud
2.4. Data Analysis
3. Results
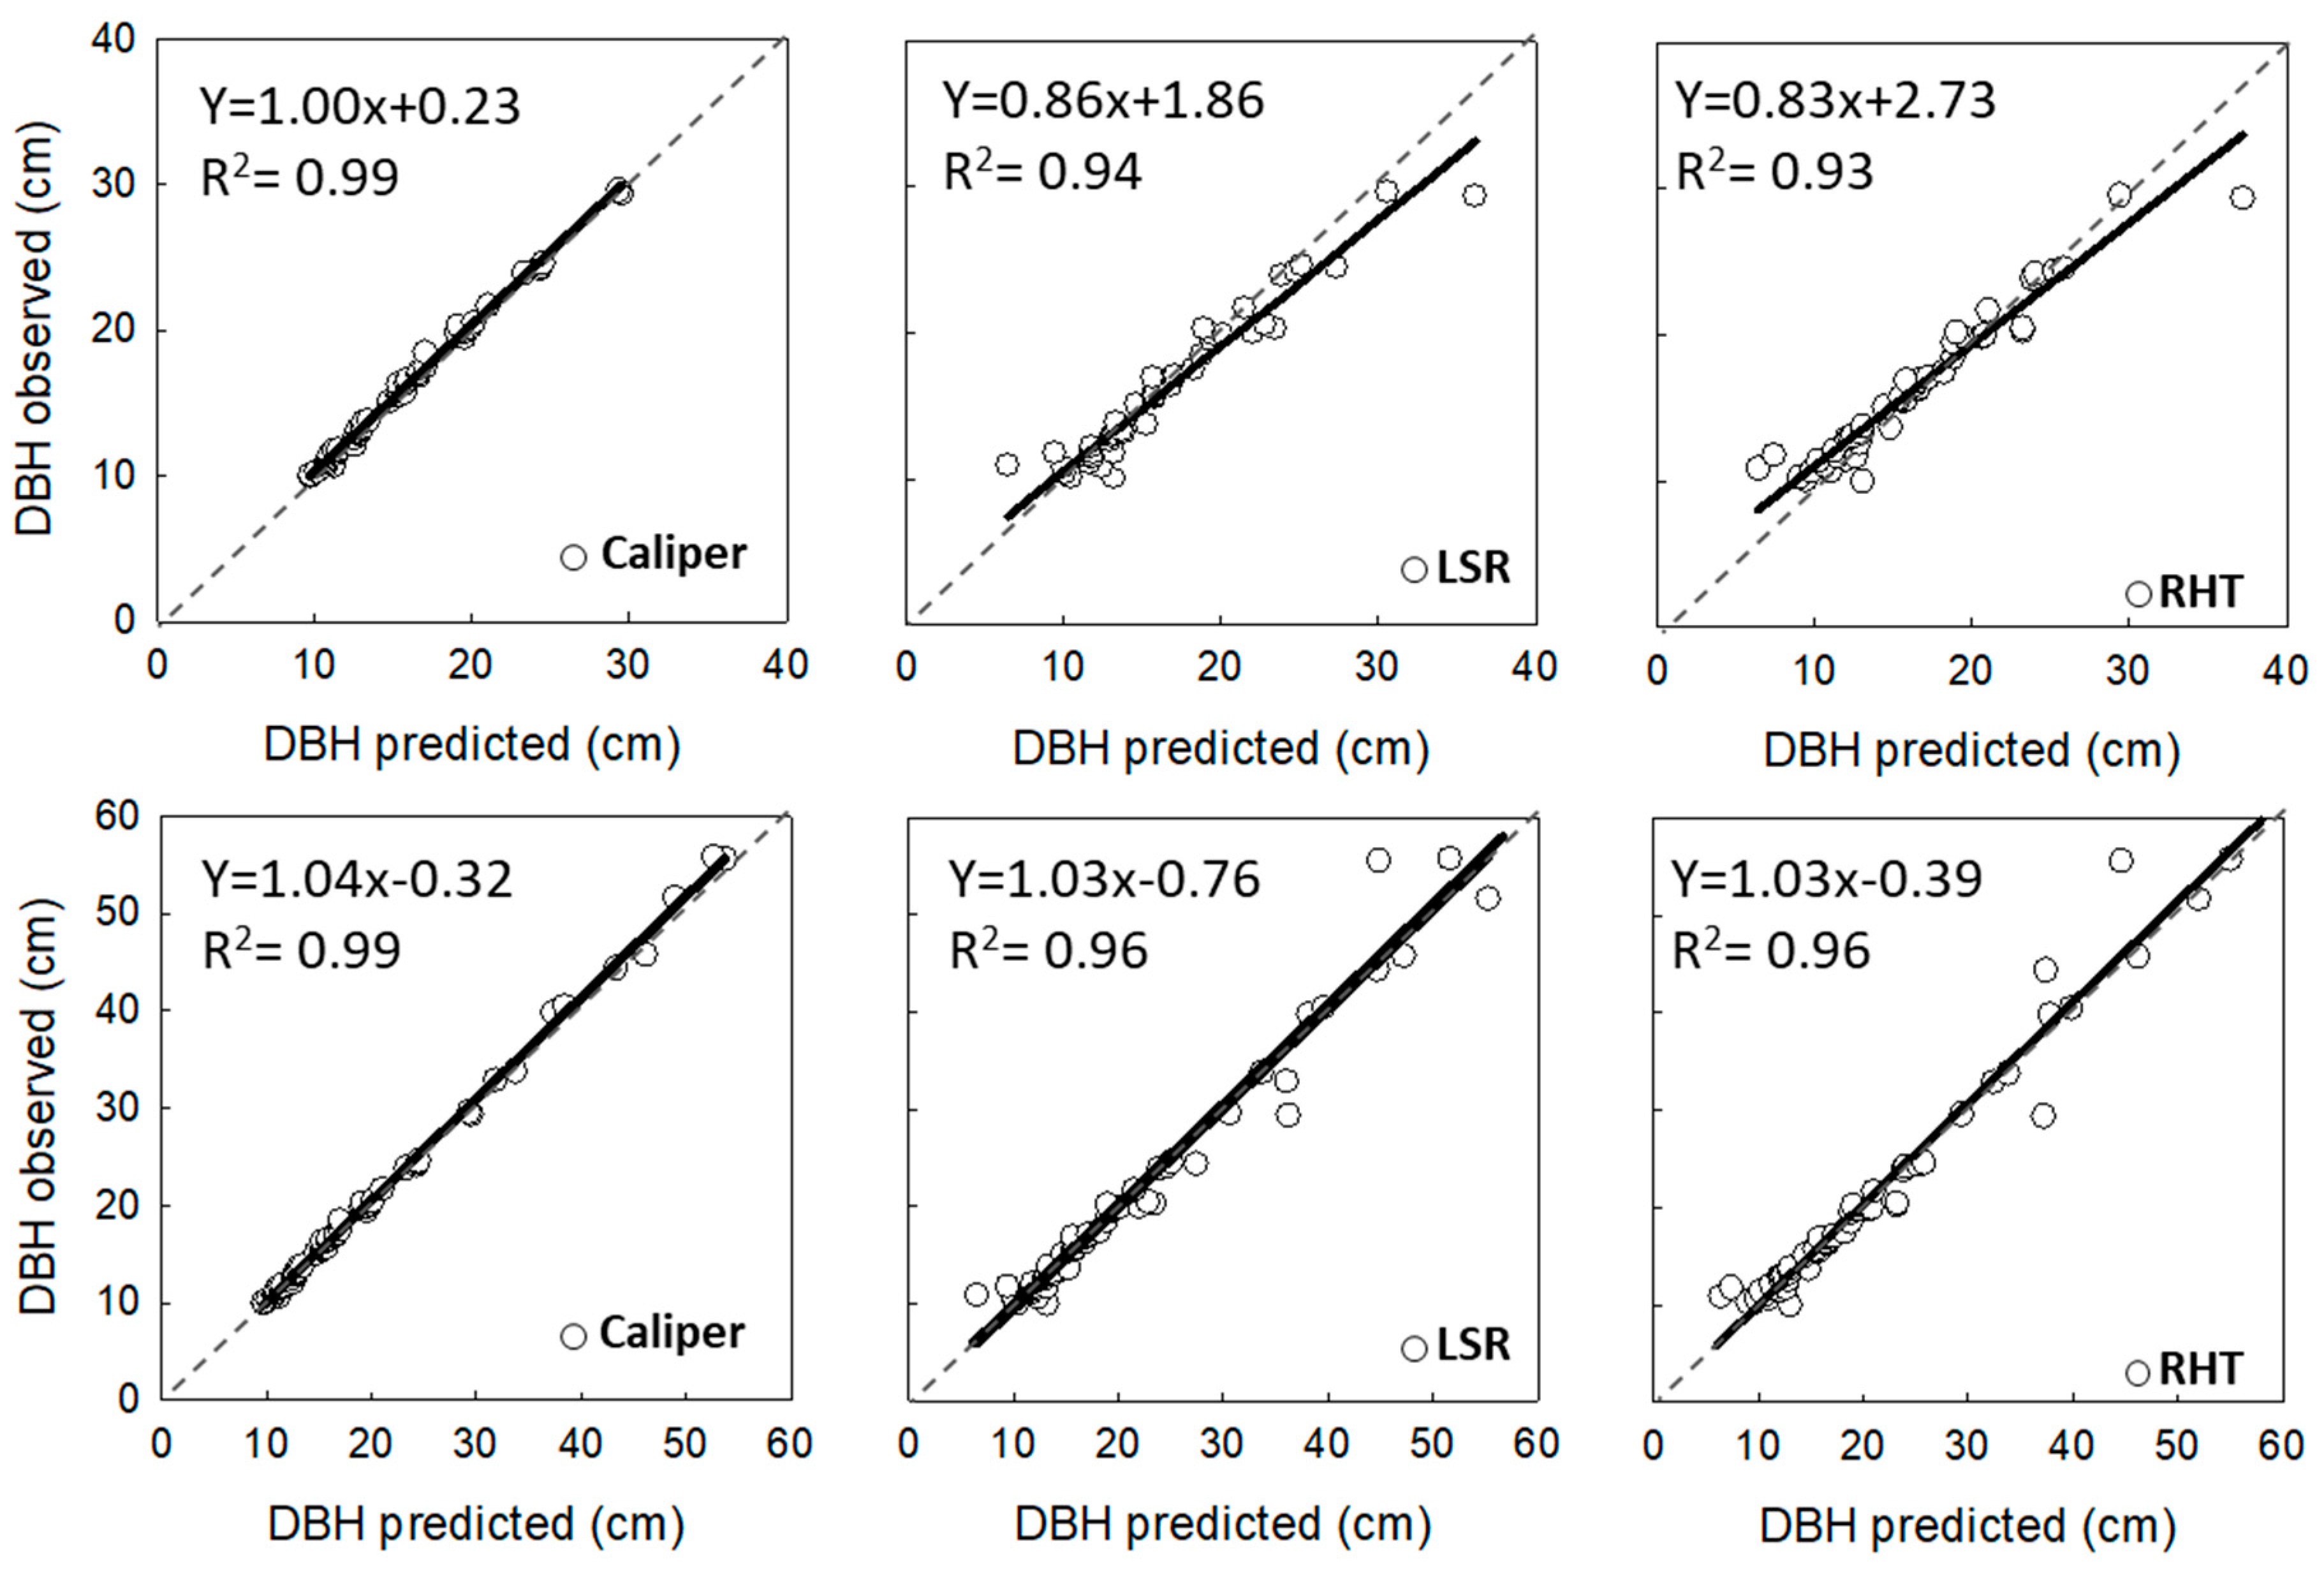
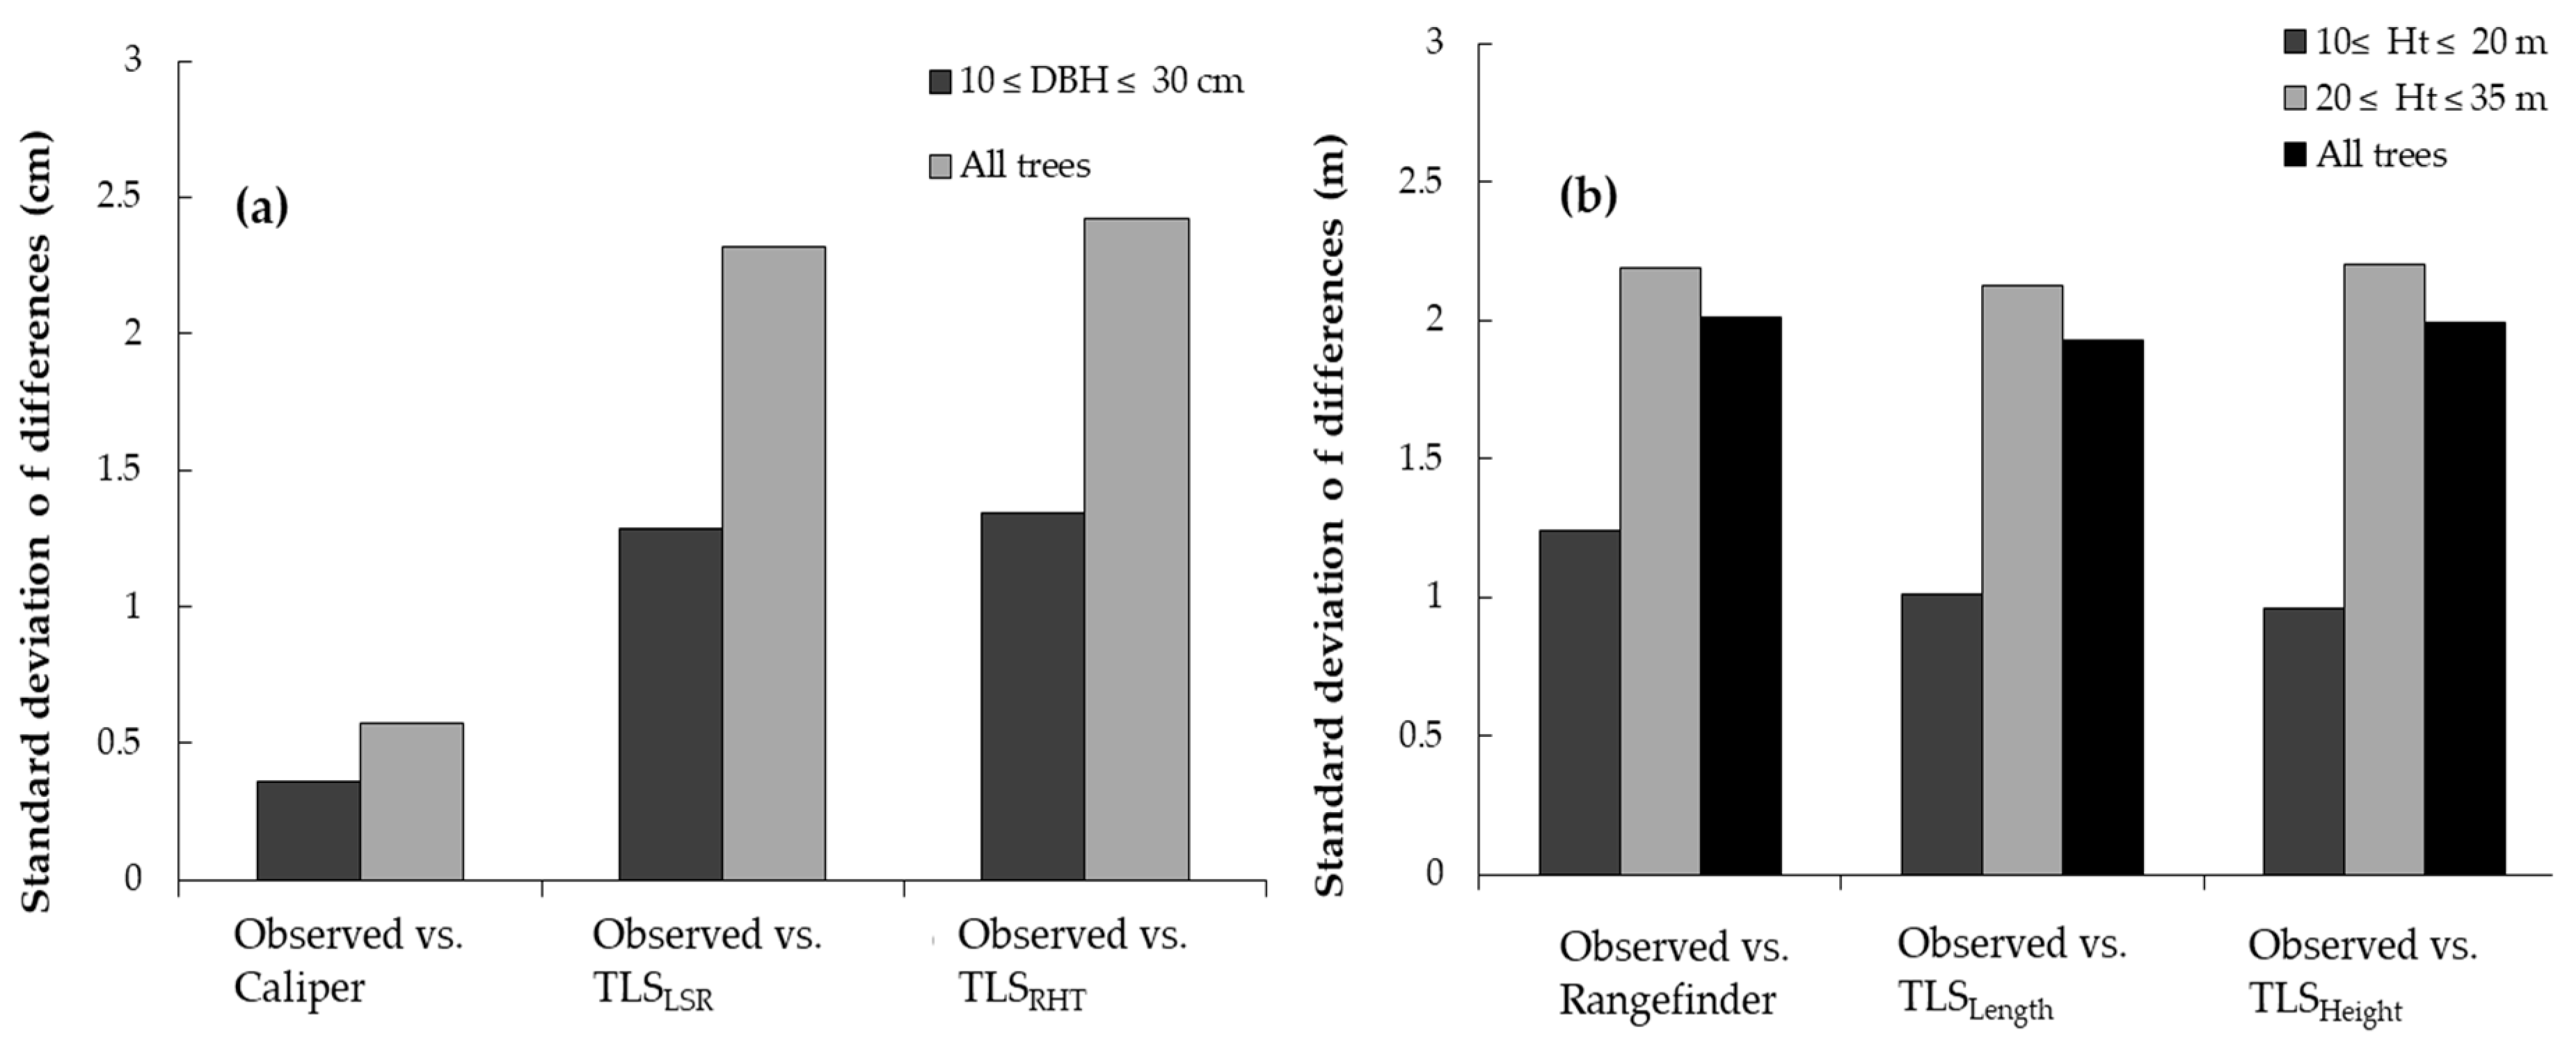
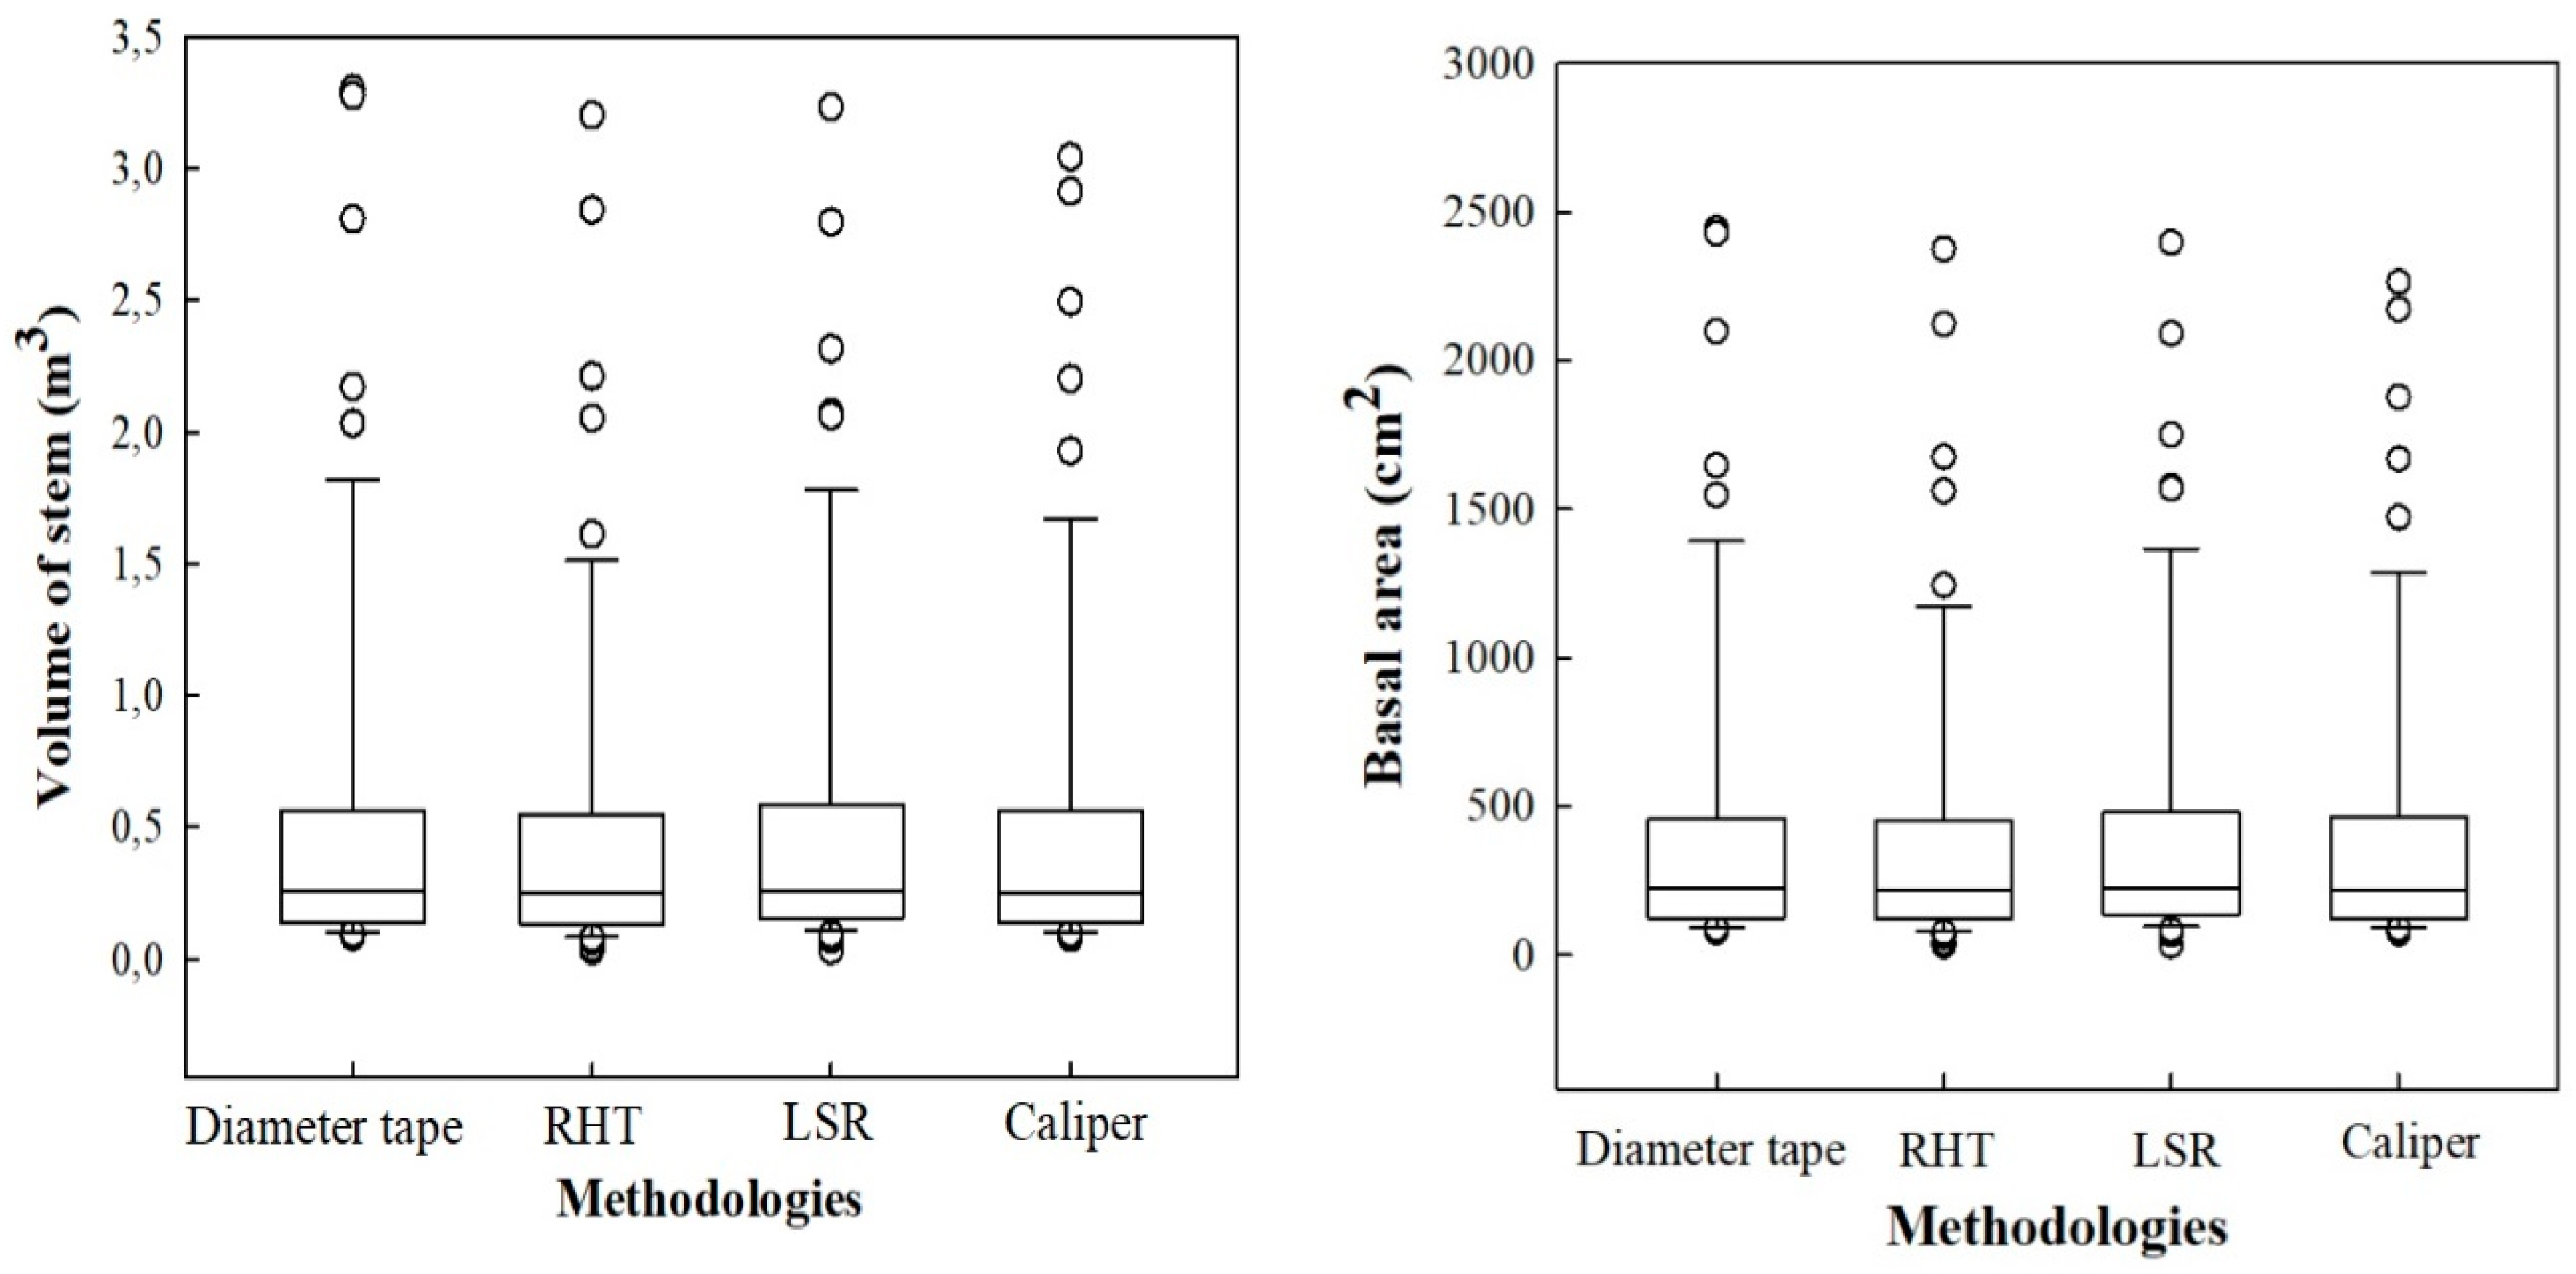
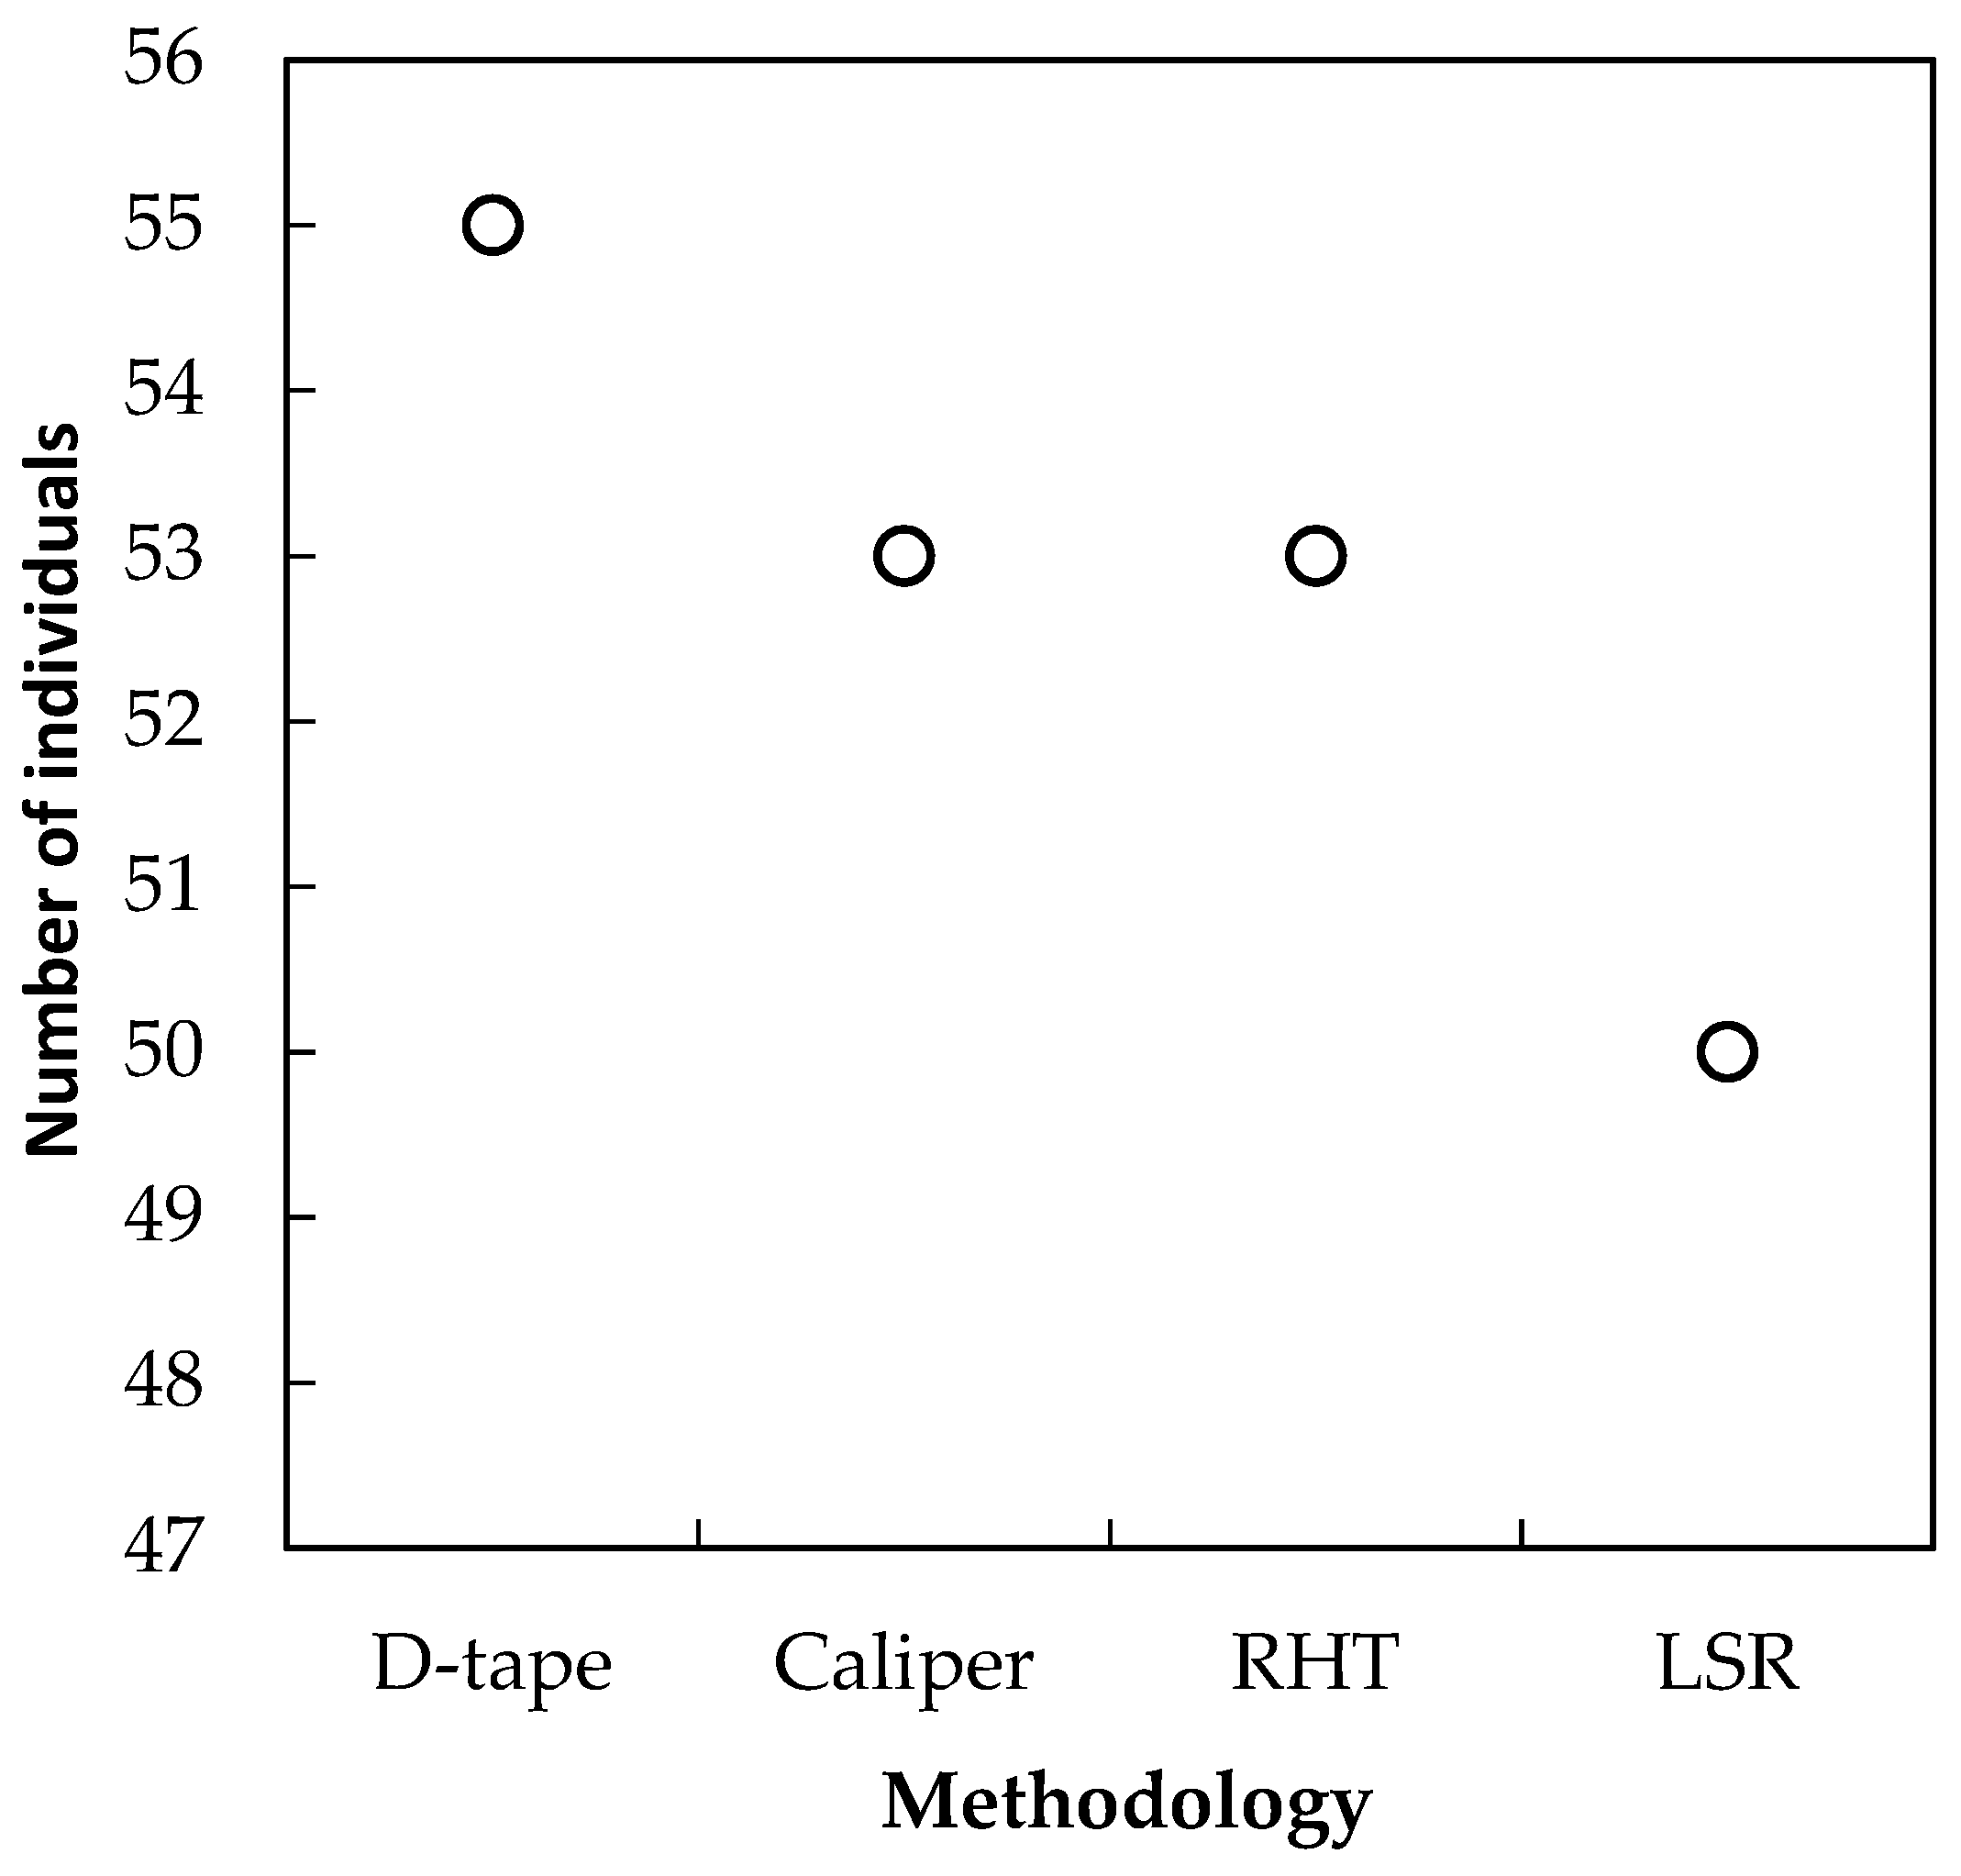
3.1. Analysis of Horizontal Vegetation Structure (Tree Diameter)
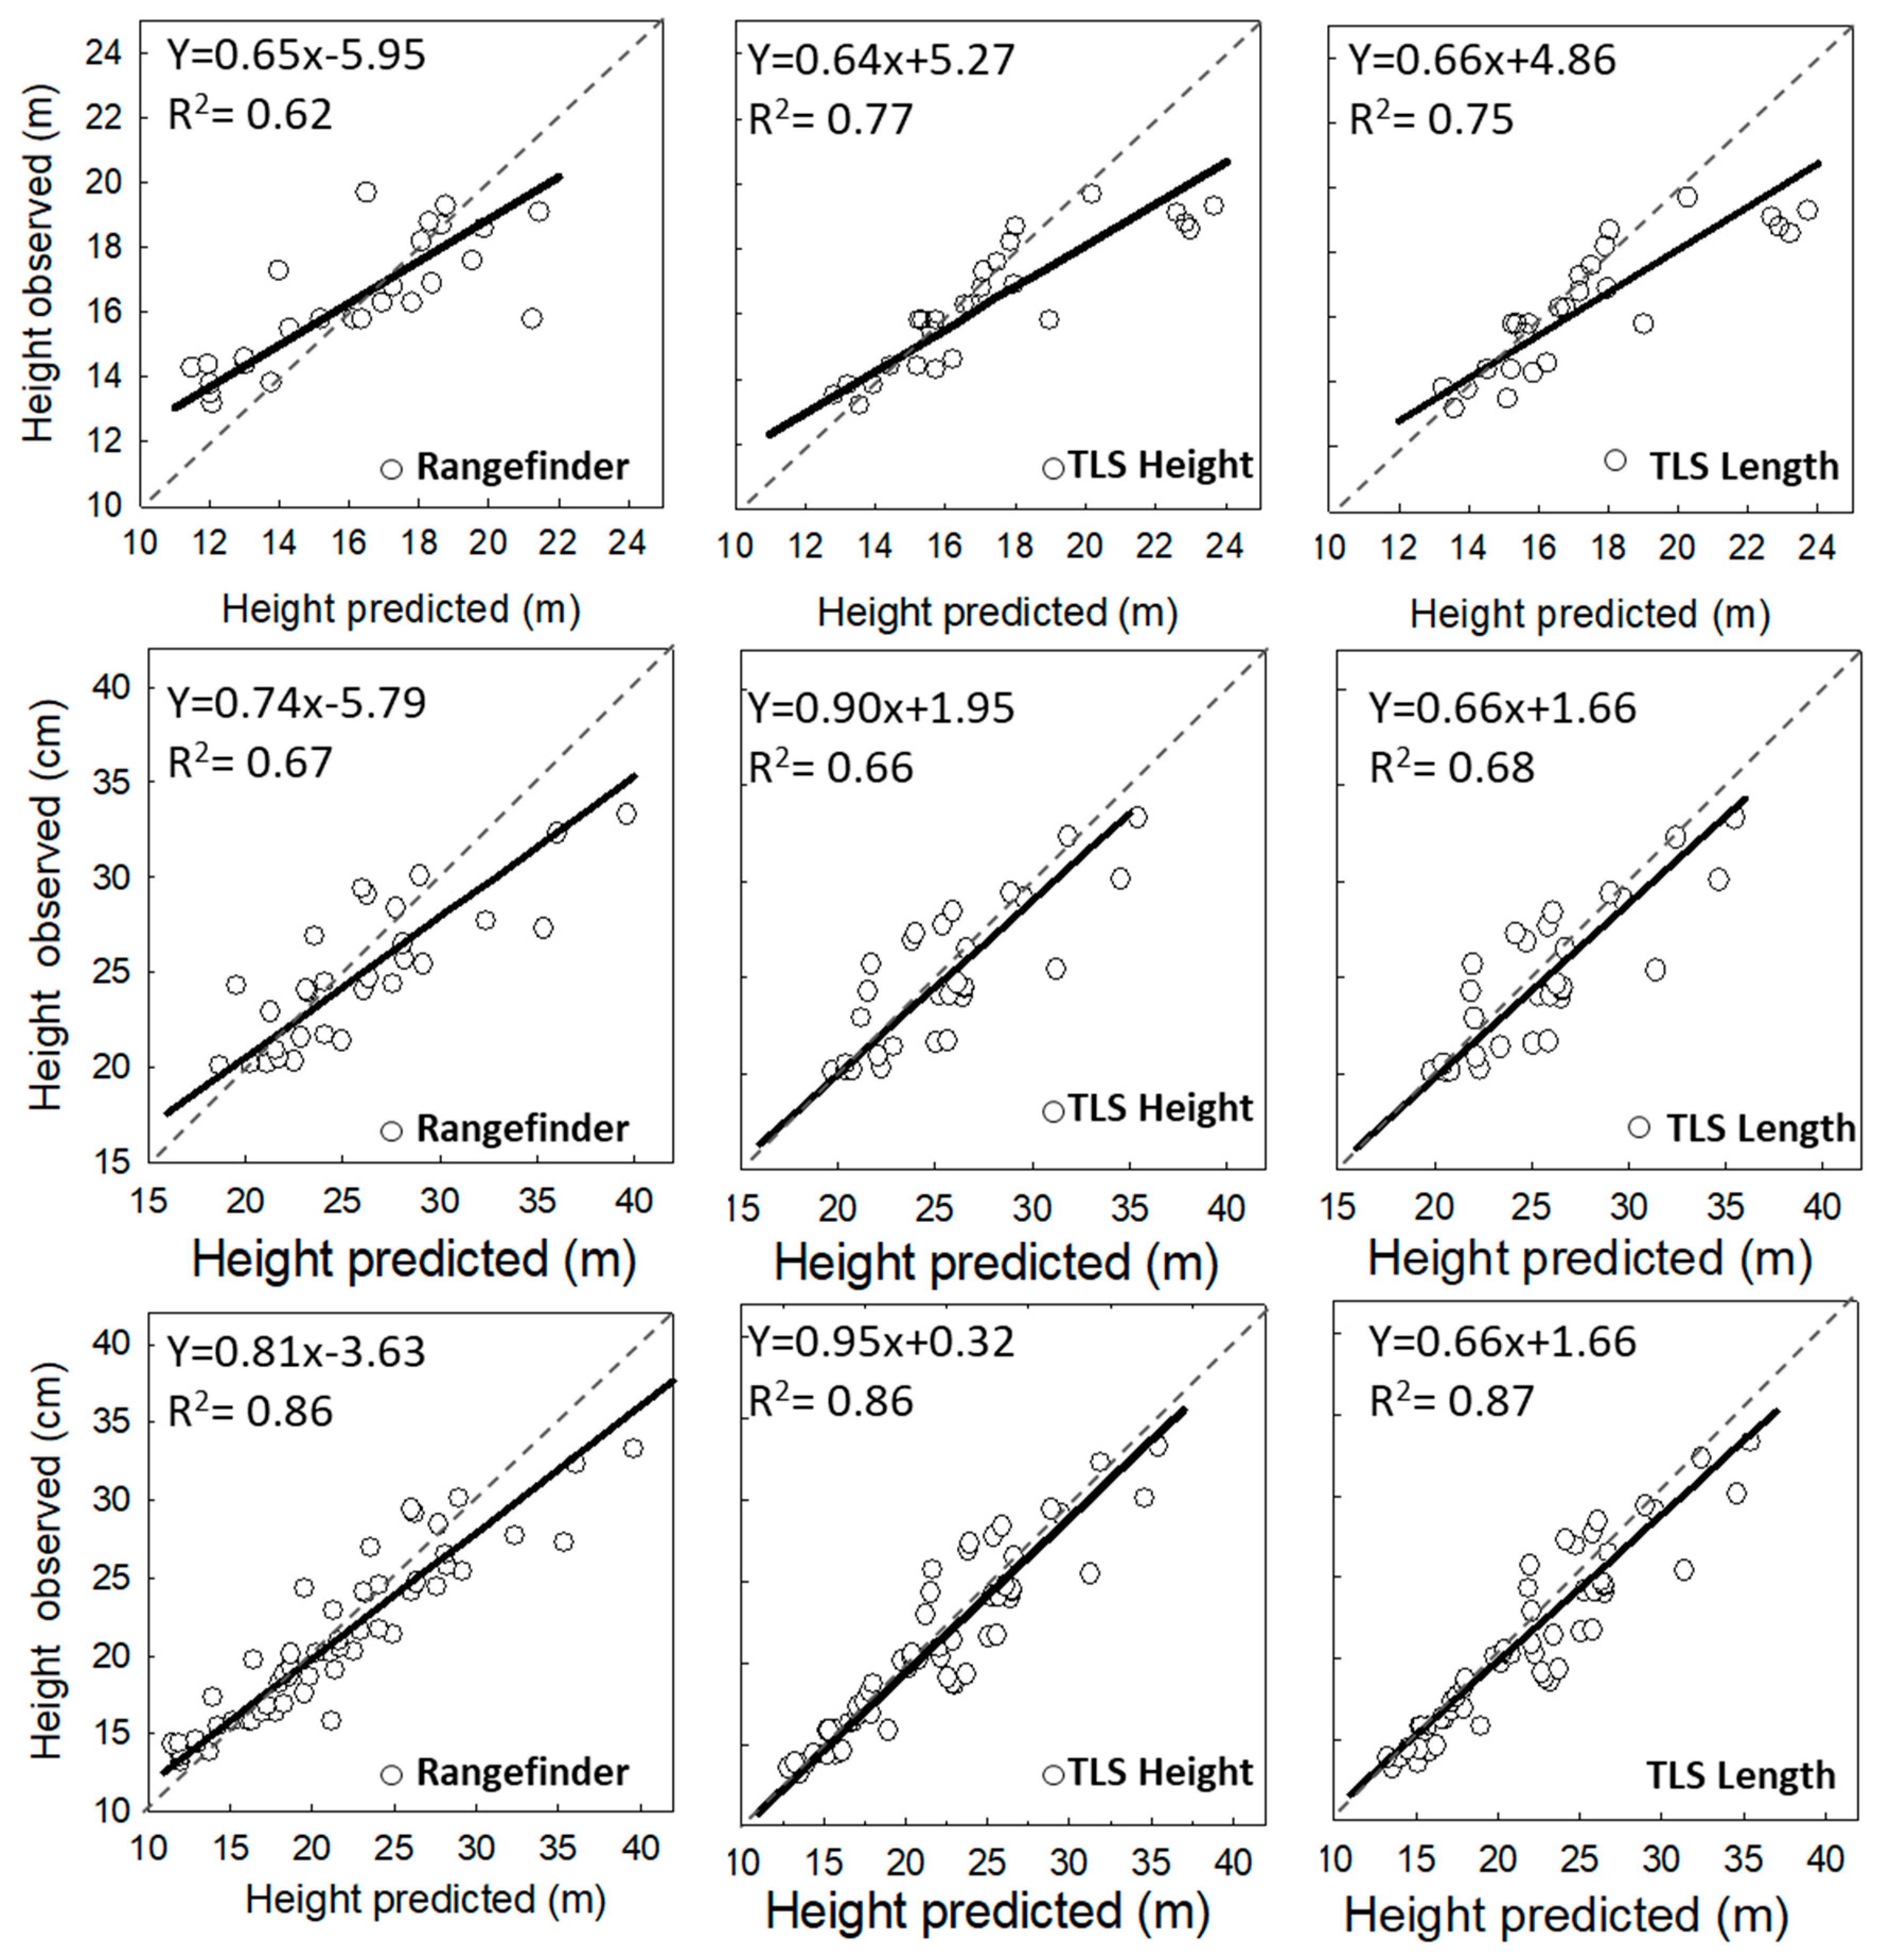
3.2. Analysis of Vertical Vegetation Structure (Tree Height)
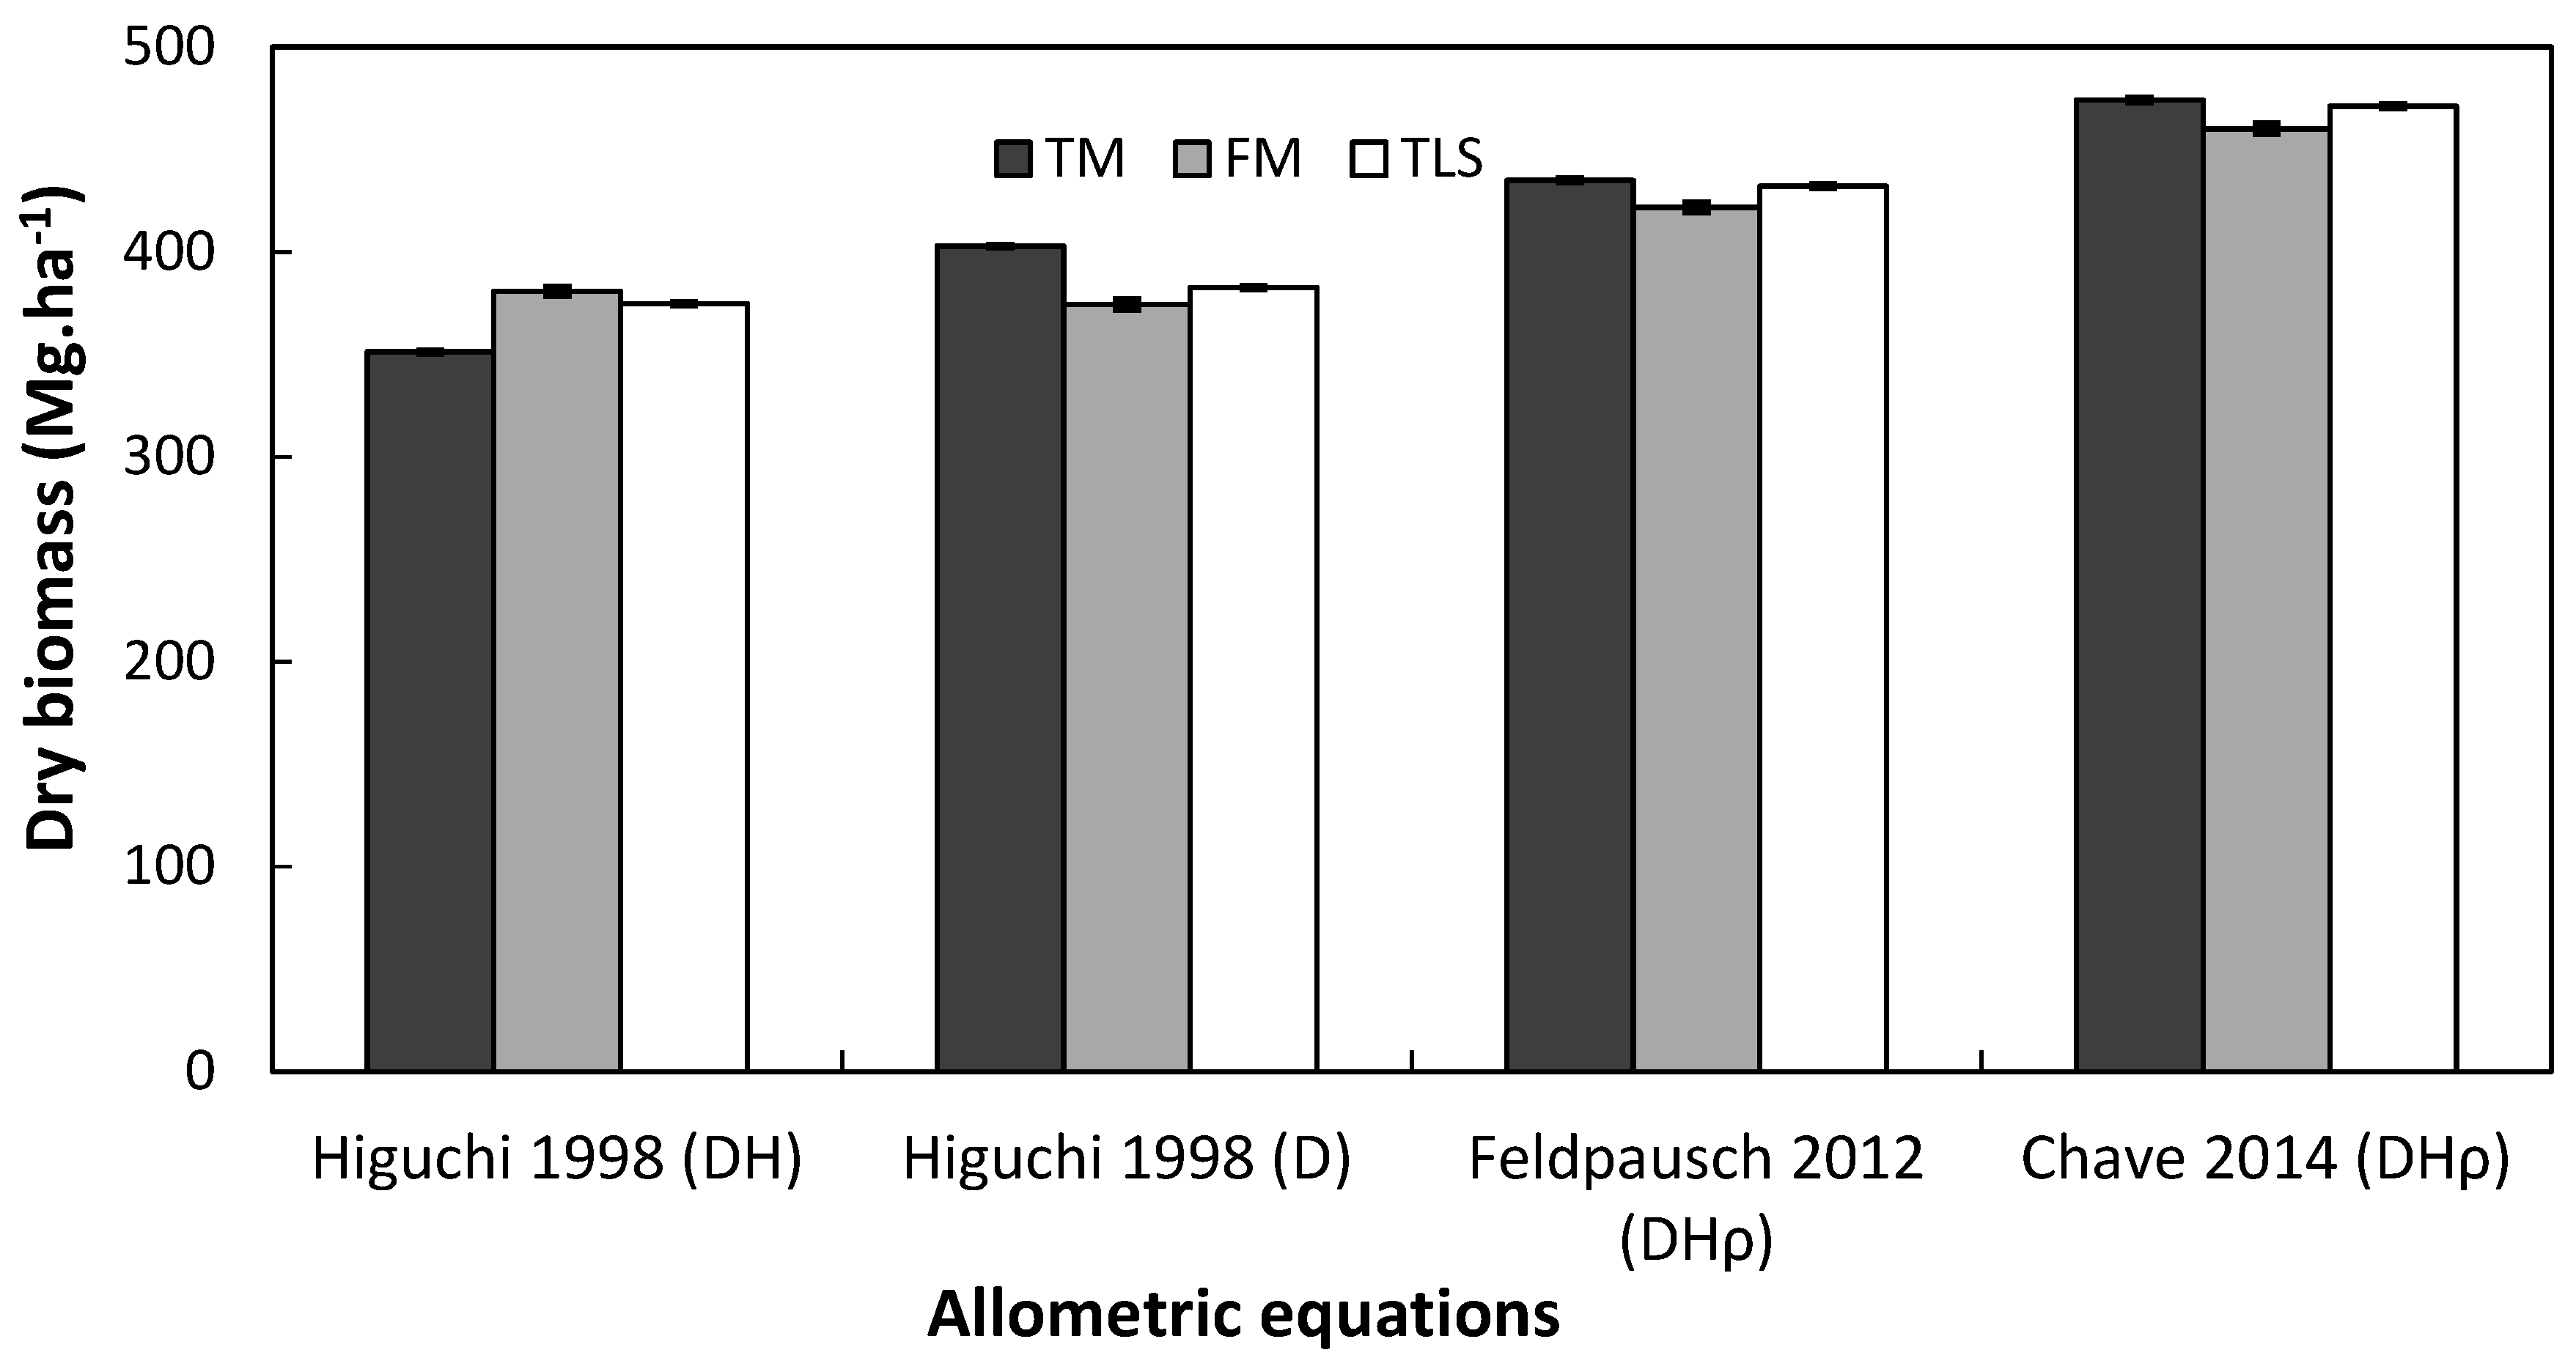
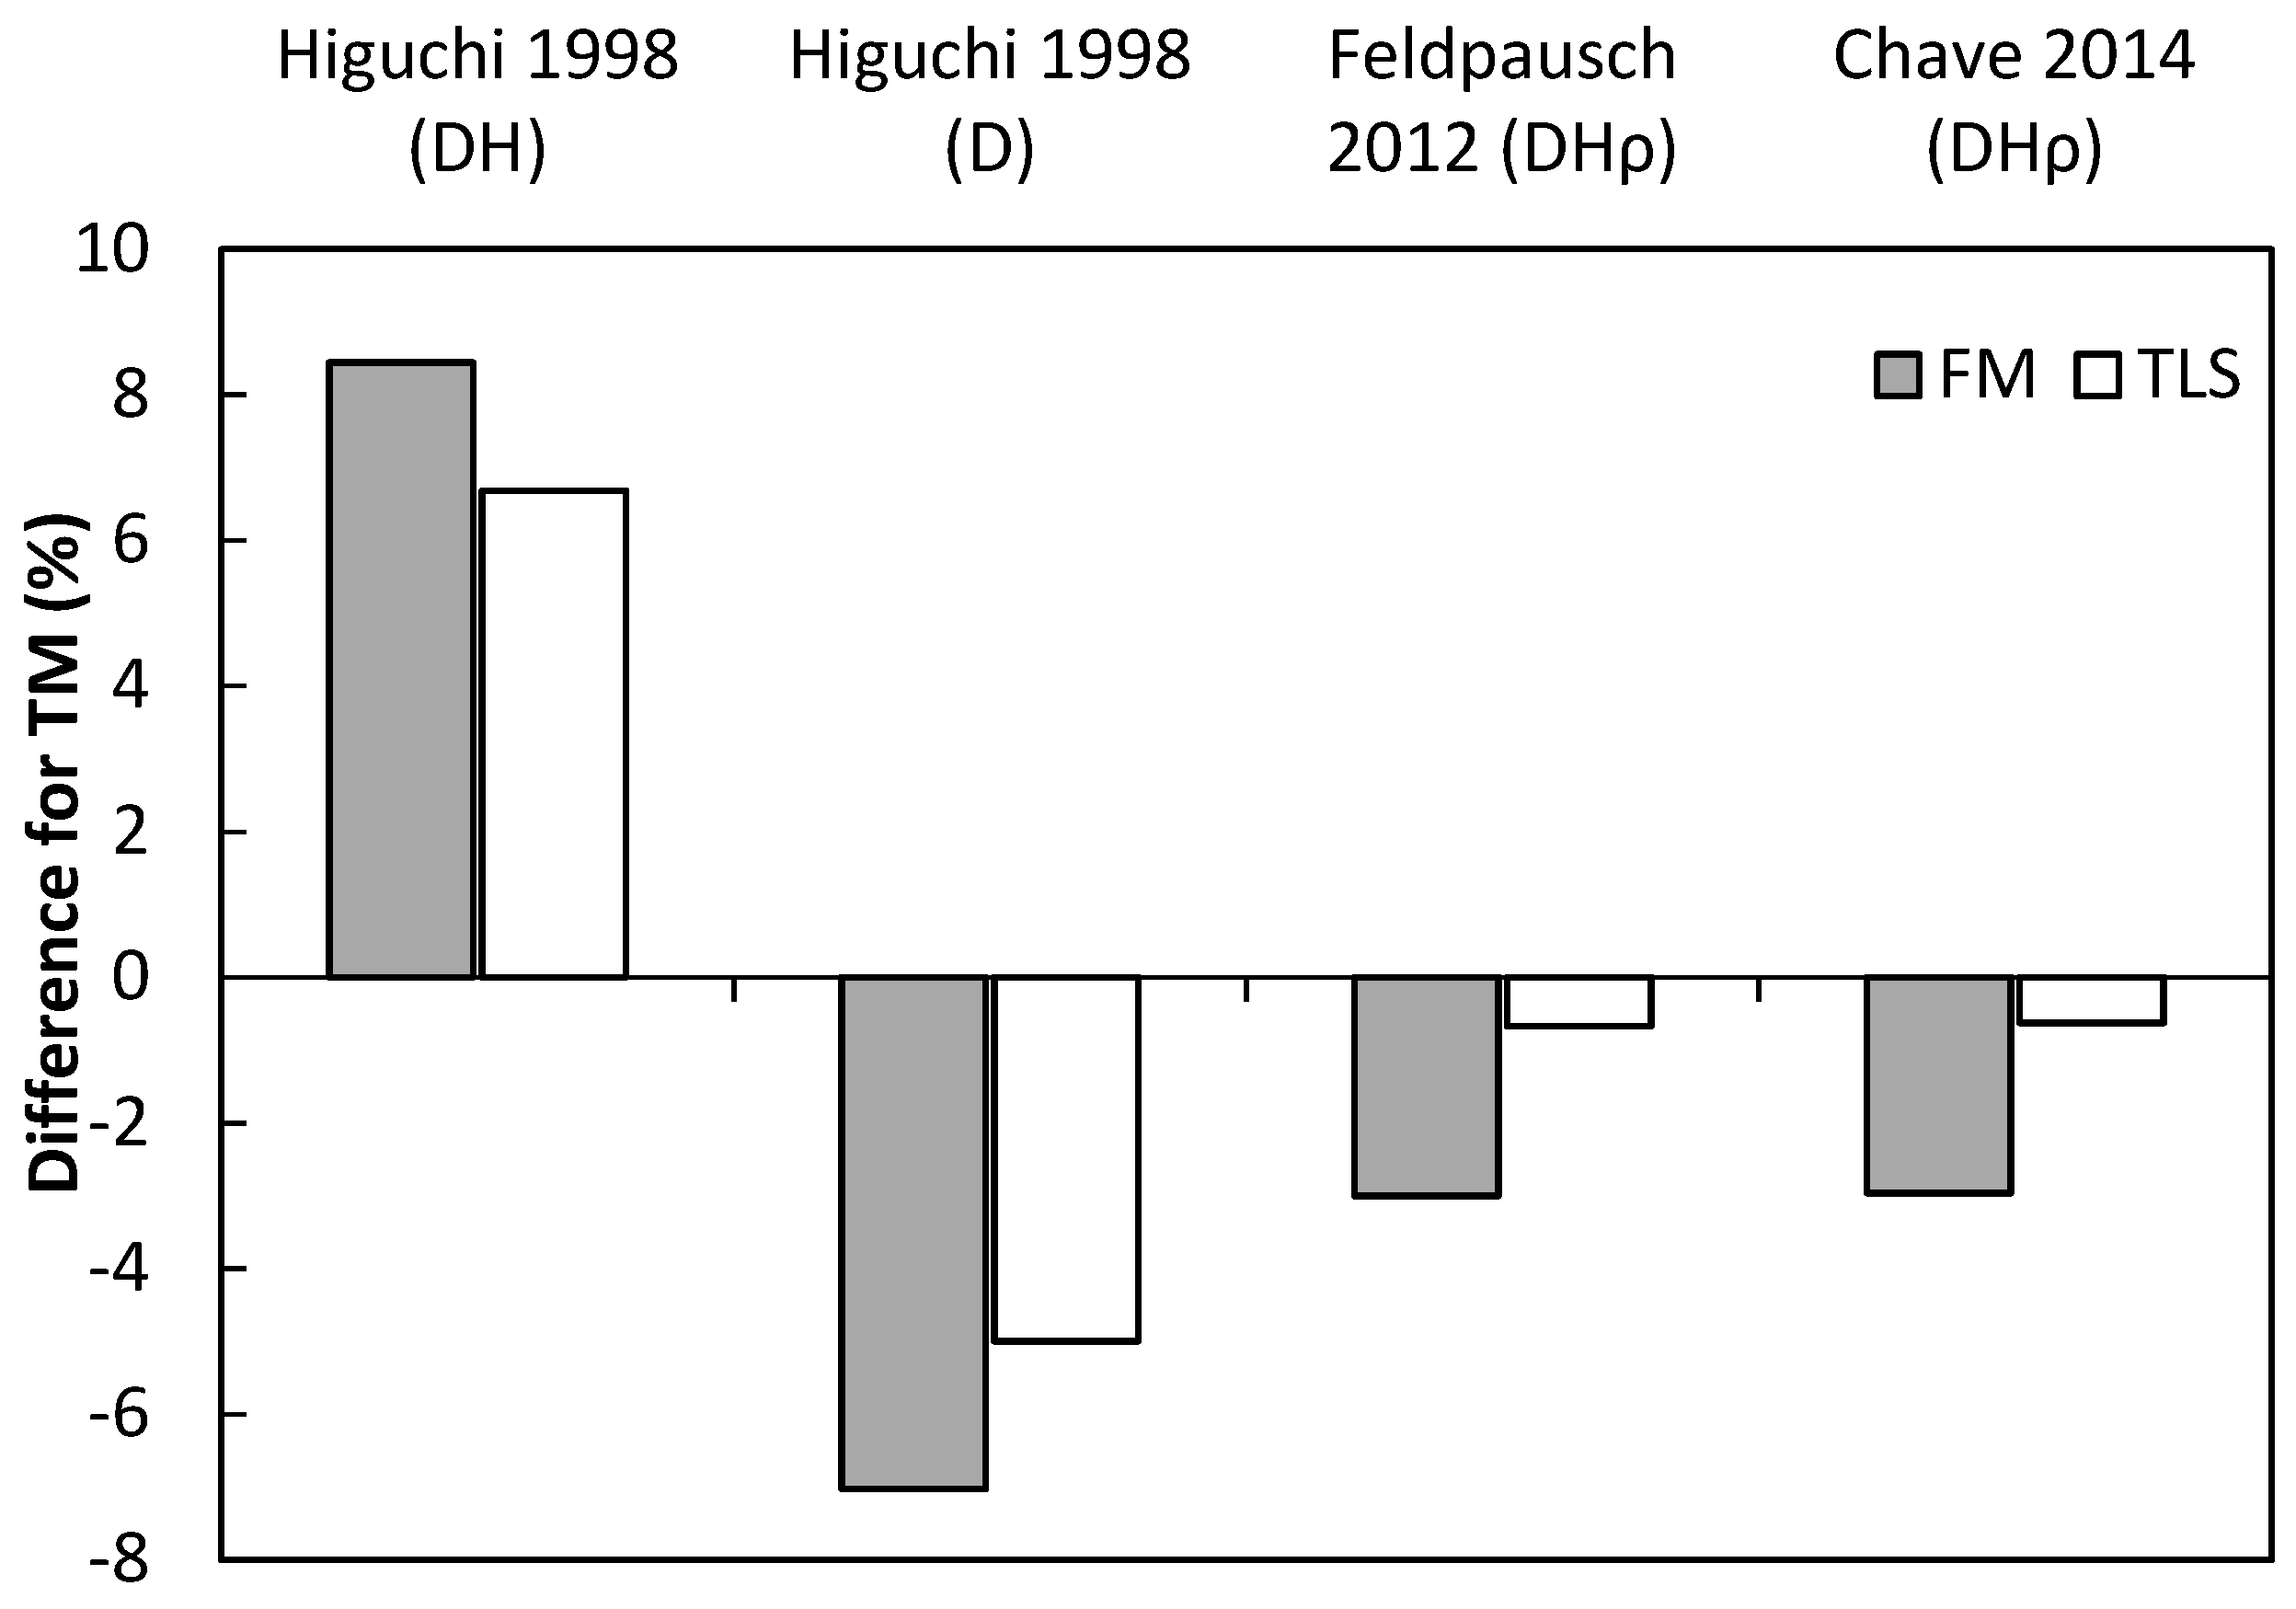
3.3. Analysis of Compound Structural Parameters (Tree Biomass)
4. Discussion
4.1. Performance of Laser-Based Electronic Devices for Analyzing Horizontal Vegetation Structure
4.2. Performance of Laser-Based Electronic Devices for Analyzing Vertical Vegetation Structure
4.3. Performance of Laser-Based Electronic Devices for Estimating Forest Biomass
5. Conclusions
Author Contributions
Funding
Acknowledgments
Conflicts of Interest
Appendix A

| Regions | Diameter Interval (cm) | Equations | References |
|---|---|---|---|
| Central Amazon | 5 ≤ D ≤ 20 | Ln(W) = −1.754 + 2.665lnD * | Higuchi et al. 1998 |
| D ≥ 20 | Ln(W) = −0.151 + 2.170lnD * | ||
| Central Amazon | 5 ≤ D ≤ 20 | W = 0.0336*D2.171Ht1.038 ** | Higuchi et al. 1998 |
| D ≥ 20 | W = 0.0009*D1.585Ht2.651 ** | ||
| Pantropical | D ≥ 5 | AGB = 0.0673*(ρD2Ht)0.976 | Chave et al. 2014 |
| Pantropical | D ≥ 10 | Ln(AGB) = −2.9205 + 0.9894ln(D2ρHt) | Feldpausch et al. 2012 |


References
- Saatchi, S.S.; Harris, N.L.; Brown, S.; Lefsky, M.; Mitchard, E.T.A.; Salas, W.; Zutta, B.R.; Buermann, W.; Lewis, S.L.; Hagen, S.; et al. Benchmark map of forest carbon stocks in tropical regions across three continents. Proc. Natl. Acad. Sci. USA 2011, 108, 9899–9904. [Google Scholar] [CrossRef] [PubMed]
- Mitchard, E.T.A.; Feldpausch, T.R.; Brienen, R.J.W.; Lopez-Gonzalez, G.; Monteagudo, A.; Baker, T.R.; Lewis, S.L.; Lloyd, J.; Quesada, C.A.; Gloor, M.; et al. Markedly divergent estimates of Amazon forest carbon density from ground plots and satellites. Glob. Ecol. Biogeogr. 2014, 23, 935–946. [Google Scholar] [CrossRef] [PubMed]
- Ometto, J.P.; Aguiar, A.P.; Assis, T.; Soler, L.; Valle, P.; Tejada, G.; Lapola, D.M.; Meir, P. Amazon forest biomass density maps: Tackling the uncertainty in carbon emission estimates. Clim. Chang. 2014, 124, 545–560. [Google Scholar] [CrossRef]
- Chave, J.; Andalo, C.; Brown, S.; Cairns, M.A.; Chambers, J.Q.; Eamus, D.; Fölster, H.; Fromard, F.; Higuchi, N.; Kira, T.; et al. Tree allometry and improved estimation of carbon stocks and balance in tropical forests. Oecologia 2005, 145, 87–99. [Google Scholar] [CrossRef] [PubMed]
- Feldpausch, T.R.; Lloyd, J.; Lewis, S.L.; Brienen, R.J.W.; Gloor, M.; Monteagudo Mendoza, A.; Lopez-Gonzalez, G.; Banin, L.; Abu Salim, K.; Affum-Baffoe, K.; et al. Tree height integrated into pantropical forest biomass estimates. Biogeosciences 2012, 9, 3381–3403. [Google Scholar] [CrossRef]
- Feldpausch, T.R.; Banin, L.; Phillips, O.L.; Baker, T.R.; Lewis, S.L.; Quesada, C.A.; Affum-Baffoe, K.; Arets, E.J.M.M.; Berry, N.J.; Bird, M.; et al. Height-diameter allometry of tropical forest trees. Biogeosciences 2011, 8, 1081–1106. [Google Scholar] [CrossRef]
- Banin, L.; Feldpausch, T.R.; Phillips, O.L.; Baker, T.R.; Lloyd, J.; Affum-Baffoe, K.; Arets, E.J.M.M.; Berry, N.J.; Bradford, M.; Brienen, R.J.W.; et al. What controls tropical forest architecture? Testing environmental, structural and floristic drivers. Glob. Ecol. Biogeogr. 2012, 21, 1179–1190. [Google Scholar] [CrossRef]
- Ploton, P.; Barbier, N.; Takoudjou Momo, S.; Réjou-Méchain, M.; Boyemba Bosela, F.; Chuyong, G.; Dauby, G.; Droissart, V.; Fayolle, A.; Goodman, R.C.; et al. Closing a gap in tropical forest biomass estimation: Taking crown mass variation into account in pantropical allometries. Biogeosciences 2016, 13, 1571–1585. [Google Scholar] [CrossRef]
- Chave, J.; Condit, R.; Aguilar, S.; Hernandez, A.; Lao, S.; Perez, R. Error propagation and scaling for tropical forest biomass estimates. Philos. Trans. R. Soc. B Biol. Sci. 2004, 359, 409–420. [Google Scholar] [CrossRef] [PubMed]
- Chave, J.; Réjou-Méchain, M.; Búrquez, A.; Chidumayo, E.; Colgan, M.S.; Delitti, W.B.C.; Duque, A.; Eid, T.; Fearnside, P.M.; Goodman, R.C.; et al. Improved allometric models to estimate the aboveground biomass of tropical trees. Glob. Chang. Biol. 2014, 20, 3177–3190. [Google Scholar] [CrossRef] [PubMed]
- Momo Takoudjou, S.; Ploton, P.; Sonké, B.; Hackenberg, J.; Griffon, S.; de Coligny, F.; Kamdem, N.G.; Libalah, M.; Mofack, G.I.; Le Moguédec, G.; et al. Using terrestrial laser scanning data to estimate large tropical trees biomass and calibrate allometric models: A comparison with traditional destructive approach. Methods Ecol. Evol. 2018, 9, 905–916. [Google Scholar] [CrossRef]
- Dassot, M.; Constant, T.; Fournier, M. The use of terrestrial LiDAR technology in forest science: Application fields, benefits and challenges. Ann. For. Sci. 2011, 68, 959–974. [Google Scholar] [CrossRef]
- Newnham, G.J.; Armston, J.D.; Calders, K.; Disney, M.I.; Lovell, J.L.; Schaaf, C.B.; Strahler, A.H.; Danson, F.M. Terrestrial Laser Scanning for Plot-Scale Forest Measurement. Curr. For. Rep. 2015, 1, 239–251. [Google Scholar] [CrossRef]
- Lefsky, M.A. A global forest canopy height map from the moderate resolution imaging spectroradiometer and the geoscience laser altimeter system. Geophys. Res. Lett. 2010, 37, 1–5. [Google Scholar] [CrossRef]
- Hu, T.; Su, Y.; Xue, B.; Liu, J.; Zhao, X.; Fang, J.; Guo, Q. Mapping global forest aboveground biomass with spaceborne LiDAR, optical imagery, and forest inventory data. Remote Sens. 2016, 8, 565. [Google Scholar] [CrossRef]
- Bouvet, A.; Mermoz, S.; Le Toan, T.; Villard, L.; Mathieu, R.; Naidoo, L.; Asner, G.P. An above-ground biomass map of African savannahs and woodlands at 25 m resolution derived from ALOS PALSAR. Remote Sens. Environ. 2018, 206, 156–173. [Google Scholar] [CrossRef]
- Asner, G.P.; Knapp, D.E.; Martin, R.E.; Tupayachi, R.; Anderson, C.B.; Mascaro, J.; Sinca, F.; Chadwick, K.D.; Higgins, M.; Farfan, W.; et al. Targeted carbon conservation at national scales with high-resolution monitoring. Proc. Natl. Acad. Sci. USA 2014, 111, E5016–E5022. [Google Scholar] [CrossRef] [PubMed]
- Dittmann, S.; Thiessen, E.; Hartung, E. Applicability of different non-invasive methods for tree mass estimation: A review. For. Ecol. Manag. 2017, 398, 208–215. [Google Scholar] [CrossRef]
- Åkerblom, M.; Raumonen, P.; Mäkipää, R.; Kaasalainen, M. Automatic tree species recognition with quantitative structure models. Remote Sens. Environ. 2017, 191, 1–12. [Google Scholar] [CrossRef]
- Hackenberg, J.; Spiecker, H.; Calders, K.; Disney, M.; Raumonen, P. SimpleTree—An efficient open source tool to build tree models from TLS clouds. Forests 2015, 6, 4245–4294. [Google Scholar] [CrossRef]
- Liang, X.; Kankare, V.; Hyyppä, J.; Wang, Y.; Kukko, A.; Haggrén, H.; Yu, X.; Kaartinen, H.; Jaakkola, A.; Guan, F.; et al. Terrestrial laser scanning in forest inventories. ISPRS J. Photogramm. Remote Sens. 2016, 115, 63–77. [Google Scholar] [CrossRef]
- Wang, N.; Shen, Y.; Hua, J.; Wang, H.; Kang, M.; Su, X. Analyzing the canopy light distribution among different poplar genotypes using terrestrial laser scanner and the GreenLab model. In Proceedings of the 2016 IEEE International Conference on Functional-Structural Plant Growth Modeling, Simulation, Visualization and Applications (FSPMA), Qingdao, China, 7–11 November 2016; pp. 214–223. [Google Scholar]
- Calders, K.; Schenkels, T.; Bartholomeus, H.; Armston, J.; Verbesselt, J.; Herold, M. Monitoring spring phenology with high temporal resolution terrestrial LiDAR measurements. Agric. For. Meteorol. 2015, 203, 158–168. [Google Scholar] [CrossRef]
- Yang, X.; Strahler, A.H.; Schaaf, C.B.; Jupp, D.L.B.; Yao, T.; Zhao, F.; Wang, Z.; Culvenor, D.S.; Newnham, G.J.; Lovell, J.L.; et al. Three-dimensional forest reconstruction and structural parameter retrievals using a terrestrial full-waveform lidar instrument (Echidna®). Remote Sens. Environ. 2013, 135, 36–51. [Google Scholar] [CrossRef]
- Krooks, A.; Kaasalainen, S.; Kankare, V.; Joensuu, M.; Raumonen, P.; Kaasalainen, M. Tree structure vs. height from terrestrial laser scanning and quantitative structure models. Silva Fenn. 2014, 48, 1–11. [Google Scholar] [CrossRef]
- Raumonen, P.; Casella, E.; Calders, K.; Murphy, S.; Åkerbloma, M.; Kaasalainen, M. Massive-scale tree modelling from tls data. ISPRS Ann. Photogramm. Remote Sens. Spat. Inf. Sci. 2015, II-3/W4, 189–196. [Google Scholar] [CrossRef]
- Lau Sarmiento, A.I.; Bartholomeus, H.; Herold, M.; Martius, C.; Malhi, Y.; Patrick Bentley, L.; Shenkin, A.; Raumonen, P. Application of terrestrial LiDAR and modelling of tree branching structure for plantscaling models in tropical forest trees. In Proceedings of the 14th Conference on Lidar Applications for Assessing and Managing Forest Ecosystems, La Grande Motte, France, 28–30 September 2015; pp. 96–98. [Google Scholar]
- Rahman, M.Z.; Bakar, M.A.A.; Razak, K.A.; Rasib, A.W.; Kanniah, K.D.; Kadir, W.H.W.; Omar, H.; Faidi, A.; Kassim, A.R.; Latif, Z.A. Non-Destructive, Laser-Based Individual Tree Aboveground Biomass Estimation in a Tropical Rainforest. Forests 2017, 8, 86. [Google Scholar] [CrossRef]
- Rahman, M.Z.; Majid, Z.; Bakar, M.A.A.; Kadir, W.H.W. Individual tree measurement in tropical environment using terrestrial laser scanning. J. Teknol. 2015, 73, 127–133. [Google Scholar] [CrossRef]
- Olagoke, A.; Proisy, C.; Féret, J.B.; Blanchard, E.; Fromard, F.; Mehlig, U.; de Menezes, M.M.; dos Santos, V.F.; Berger, U. Extended biomass allometric equations for large mangrove trees from terrestrial LiDAR data. Trees Struct. Funct. 2016, 30, 935–947. [Google Scholar] [CrossRef]
- Palace, M.; Sullivan, F.B.; Ducey, M.; Herrick, C. Estimating Tropical Forest Structure Using a Terrestrial Lidar. PLoS ONE 2016, 11, e0154115. [Google Scholar] [CrossRef] [PubMed]
- Lovell, J.L.; Jupp, D.L.B.; Newnham, G.J.; Culvenor, D.S. Measuring tree stem diameters using intensity profiles from ground-based scanning lidar from a fixed viewpoint. ISPRS J. Photogramm. Remote Sens. 2011, 66, 46–55. [Google Scholar] [CrossRef]
- Lovell, J.L.; Jupp, D.L.B.; Culvenor, D.S.; Coops, N.C. Using airborne and ground-based ranging lidar to measure canopy structure in Australian forests. Can. J. Remote Sens. 2003, 29, 607–622. [Google Scholar] [CrossRef]
- Strahler, A.H.; Jupp, D.L.; Woodcock, C.E.; Schaaf, C.B.; Yao, T.; Zhao, F.; Yang, X.; Lovell, J.; Culvenor, D.; Newnham, G.; et al. Retrieval of forest structural parameters using a ground-based lidar instrument (Echidna®). Can. J. Remote Sens. 2008, 34, S426–S440. [Google Scholar] [CrossRef]
- Yao, T.; Yang, X.; Zhao, F.; Wang, Z.; Zhang, Q.; Jupp, D.; Lovell, J.; Culvenor, D.; Newnham, G.; Ni-Meister, W.; et al. Measuring forest structure and biomass in New England forest stands using Echidna ground-based lidar. Remote Sens. Environ. 2011, 115, 2965–2974. [Google Scholar] [CrossRef]
- Condit, R. Tropical Forest Census Plots; Springer: Berlin/Heidelberg, Germany, 1998; ISBN 978-3-662-03666-2. [Google Scholar]
- Rovero, F.; Ahumada, J. The Tropical Ecology, Assessment and Monitoring (TEAM) Network: An early warning system for tropical rain forests. Sci. Total Environ. 2017, 574, 914–923. [Google Scholar] [CrossRef] [PubMed]
- Marthews, T.R.; Riutta, T.; Oliveras Menor, I.; Urrutia, R.; Moore, S.; Metcalfe, D.; Malhi, Y.; Phillips, O.; Huaraca Huasco, W.; Ruiz Jaén, M.; et al. Measuring Tropical Forest Carbon Allocation and Cycling: A RAINFOR-GEM Field Manual for Intensive Census Plots (v3.0). Manual, Global Ecosystems Monitoring Network. 2014. Available online: http://gem.tropicalforests.ox.ac.uk/ (accessed on 5 February 2018).
- Anderson-Teixeira, K.J.; Davies, S.J.; Bennett, A.C.; Gonzalez-Akre, E.B.; Muller-Landau, H.C.; Joseph Wright, S.; Abu Salim, K.; Almeyda Zambrano, A.M.; Alonso, A.; Baltzer, J.L.; et al. CTFS-ForestGEO: A worldwide network monitoring forests in an era of global change. Glob. Chang. Biol. 2015, 21, 528–549. [Google Scholar] [CrossRef] [PubMed]
- Phillips, O.; Baker, T.; Feldpausch, T.; Brienen, R. Field Manual for Establishment and Remeasurement (RAINFOR). Available online: http://www.rainfor.org/upload/ManualsEnglish/RAINFOR_field_manual_version_2016.pdf (accessed on 5 February 2018).
- van Laar, A.; Akça, A. Forest Mensuration, 2nd ed.; Managing Forest Ecosystems; Springer: Dordrecht, The Netherlands, 2007; Volume 13, ISBN 978-1-4020-5990-2. [Google Scholar]
- Wilkes, P.; Lau, A.; Disney, M.; Calders, K.; Burt, A.; Gonzalez de Tanago, J.; Bartholomeus, H.; Brede, B.; Herold, M. Data acquisition considerations for Terrestrial Laser Scanning of forest plots. Remote Sens. Environ. 2017, 196, 140–153. [Google Scholar] [CrossRef]
- Burt, A.; Disney, M.; Calders, K. Extracting individual trees from lidar point clouds using treeseg. Methods Ecol. Evol. 2018. [Google Scholar] [CrossRef]
- Meir, P.; Shenkin, A.; Disney, M.; Rowland, L.; Malhi, Y.; Herold, M.; da Costa, A.C.L. Plant structure-function relationships and woody tissue respiration: Upscaling to forests from laser-derived measurements. In Plant Respiration: Metabolic Fluxes and Carbon Balance; Tcherkez, G., Ghashghaie, J., Eds.; Springer: Dordrecht, The Netherlands, 2017; ISBN 9783319687032. [Google Scholar]
- Tavares, G.G.; Sabino, T.L.R.; da Fonseca, L.G. Métodos computacionais para aproximação do diâmetro à altura do peito de árvores de regiões de mangue via escaneamento tridimensional a laser. Rev. Interdiscip. Pesqui. em Eng. 2016, 2, 138–155. [Google Scholar]
- Calders, K.; Newnham, G.; Burt, A.; Murphy, S.; Raumonen, P.; Herold, M.; Culvenor, D.; Avitabile, V.; Disney, M.; Armston, J.; et al. Nondestructive estimates of above-ground biomass using terrestrial laser scanning. Methods Ecol. Evol. 2015, 6, 198–208. [Google Scholar] [CrossRef]
- De Tanago, J.G.; Lau, A.; Bartholomeusm, H.; Herold, M.; Avitabile, V.; Raumonen, P.; Martius, C.; Goodman, R.; Disney, M.; Manuri, S.; et al. Estimation of above-ground biomass of large tropical trees with Terrestrial LiDAR. Methods Ecol. Evol. 2017, 2017, 1–12. [Google Scholar] [CrossRef]
- Peel, M.C.; Finlayson, B.L.; McMahon, T.A. Updated world map of the Köppen-Geiger climate classification. Hydrol. Earth Syst. Sci. Discuss. 2007, 4, 439–473. [Google Scholar] [CrossRef]
- Araújo, A.C.; Nobre, A.D.; Kruijt, B.; Elbers, J.A.; Dallarosa, R.; Stefani, P.; Von Randow, C.; Manzi, A.O.; Culf, A.D.; Gash, J.H.C.; et al. Comparative measurements of carbon dioxide fluxes from two nearby towers in a central Amazonian rainforest: The Manaus LBA site. J. Geophys. Res. 2002, 107, 1–20. [Google Scholar] [CrossRef]
- Luizão, R.C.C.; Luizão, F.J.; Paiva, R.Q.; Monteiro, T.F.; Sousa, L.S.; Kruijt, B. Variation of carbon and nitrogen cycling processes along a topographic gradient in a central Amazonian forest. Glob. Chang. Biol. 2004, 10, 592–600. [Google Scholar] [CrossRef]
- IBGE. Manual Técnico da Vegetação Brasileira; IBGE: Rio de Janeiro, Brazil, 2012; ISBN 9788524042720.
- Vieira, S.; de Camargo, P.B.; Selhorst, D.; da Silva, R.; Hutyra, L.; Chambers, J.Q.; Brown, I.F.; Higuchi, N.; dos Santos, J.; Wofsy, S.C.; et al. Forest structure and carbon dynamics in Amazonian tropical rain forests. Oecologia 2004, 140, 468–479. [Google Scholar] [CrossRef] [PubMed]
- Carneiro, V.M.C.; Higuchi, N.; Dos Santos, J.; Pinto, A.C.M.; Teixeira, L.M.; Lima, A.J.N.; Da Silva, R.P.; Rocha, R.M. Composição florística e análise estrutural da floresta de terra-firme na região de Manaus, estado do Amazonas, Brasil. In Proceedings of the 5º Congresso Florestal Nacional—A Floresta e as Gentes, Viseu, Portugal, 16–19 May 2005. [Google Scholar]
- Clark, D.A.; Brown, S.; Kicklighter, D.W.; Chambers, J.Q.; Thomlinson, J.R.; Ni, J. Measuring net primary production in forest concepts and field methods. Ecol. Appl. 2001, 11, 356–370. [Google Scholar] [CrossRef]
- Feldpausch, T.R.; Banin, L.; Phillips, O.L.; Baker, T.R.; Lewis, S.L.; Quesada, C.A.; Affum-Baffoe, K.; Arets, E.J.M.M.; Berry, N.J.; Bird, M.; et al. Height-diameter allometry of tropical forest trees (Supplemental Information). Biogeosciences 2011, 8, 1081–1106. [Google Scholar] [CrossRef]
- Larjavaara, M.; Muller-Landau, H.C. Measuring tree height: A quantitative comparison of two common field methods in a moist tropical forest. Methods Ecol. Evol. 2013, 4, 793–801. [Google Scholar] [CrossRef]
- Henning, J.G.; Radtke, P.J. Detailed Stem Measurements of Standing Trees from Ground-Based Scanning Lidar. For. Sci. 2006, 52, 67–80. [Google Scholar]
- Hosoi, F.; Omasa, K. Voxel-Based 3-D Modeling of Individual Trees for Estimating Leaf Area Density Using High-Resolution Portable Scanning Lidar. IEEE Trans. Geosci. Remote Sens. 2006, 44, 3610–3618. [Google Scholar] [CrossRef]
- Riegl Laser Measurement Systems Riegl Vz-400 Features and Components. Available online: http://www.riegl.com/uploads/tx_pxpriegldownloads/10_DataSheet_VZ-400_2017-06-14.pdf (accessed on 2 March 2019).
- Calders, K.; Disney, M.I.; Armston, J.; Burt, A.; Brede, B.; Origo, N.; Muir, J.; Nightingale, J. Evaluation of the Range Accuracy and the Radiometric Calibration of Multiple Terrestrial Laser Scanning Instruments for Data Interoperability. IEEE Trans. Geosci. Remote Sens. 2017, 55, 2716–2724. [Google Scholar] [CrossRef]
- Rusu, R.B.; Cousins, S. 3D is here: Point Cloud Library (PCL). In Proceedings of the 2011 IEEE International Conference on Robotics and Automation, Shanghai, China, 9–13 May 2011; pp. 1–4. [Google Scholar]
- Hopkinson, C.; Chasmer, L.; Young-Pow, C.; Treitz, P. Assessing forest metrics with a ground-based scanning lidar. Can. J. For. Res. 2004, 34, 573–583. [Google Scholar] [CrossRef]
- Trochta, J.; Krůček, M.; Vrška, T.; Král, K. 3D Forest: An application for descriptions of three-dimensional forest structures using terrestrial LiDAR. PLoS ONE 2017, 12, e0176871. [Google Scholar] [CrossRef] [PubMed]
- Xu, L.; Oja, E. Randomized Hough Transform (RHT): Basic Mechanisms, Algorithms, and Computational Complexities. CVGIP Image Underst. 1993, 57, 131–154. [Google Scholar] [CrossRef]
- Chernov, N.; Lesort, C. Least squares fitting of circles. J. Math. Imaging Vis. 2005, 23, 239–252. [Google Scholar] [CrossRef]
- Bohonak, A.J. Software for Reduced Major Axis Regression. 2004. Available online: http://www.bio.sdsu.edu/pub/andy/RMA.html (accessed on 7 February 2019).
- Walther, B.A.; Moore, J.L. The concepts of bias, precision and accuracy, and their use in testing the performance of species richness estimators, with a literature review of estimator performance. Ecogr. (Cop.) 2005, 28, 815–829. [Google Scholar] [CrossRef]
- West, M.J. Stereological methods for estimating the total number of neurons and synapses: Issues of precision and bias. Trends Neurosci. 1999, 22, 51–61. [Google Scholar] [CrossRef]
- Higuchi, N.; Dos Santos, J.; Ribeiro, R.J.; Minette, L.; Biot, Y. Biomassa da parte aérea da vegetação da floresta tropical úmida de terra-firme da Amazônia brasileira. Acta Amaz. 1998, 28, 153–166. [Google Scholar] [CrossRef]
- Goodman, R.C.; Phillips, O.L.; Baker, T.R. The importance of crown dimensions to improve tropical tree biomass estimates. Ecol. Appl. 2014, 24, 680–698. [Google Scholar] [CrossRef] [PubMed]
- Mitchard, E.T.A.; Saatchi, S.S.; Baccini, A.; Asner, G.P.; Goetz, S.J.; Harris, N.L.; Brown, S. Uncertainty in the spatial distribution of tropical forest biomass: A comparison of pan-tropical maps. Carbon Balance Manag. 2013, 8, 1–13. [Google Scholar] [CrossRef] [PubMed]
- Behre, E.C. Comparison of diameter tape and caliper measurements in second-growth spruce. J. For. 1926, 24, 178–182. [Google Scholar]
- McArdle, R.E. Relative accuracy of calipers and diameter tape in measuring Douglas fir trees. J. For. 1928, 26, 338–342. [Google Scholar]
- Binot, J.M.; Pothier, D.; Lebel, J. Comparison of relative accuracy and time requirement between the caliper, the diameter tape and an electronic tree measuring fork. For. Chron. 1995, 71, 197–200. [Google Scholar] [CrossRef]
- Clark, N.; Wynne, R.; Schmoldt, D. A review of past research on dendrometers. For. Sci. 2000, 46, 570–576. [Google Scholar]
- Condit, R.; Hubbell, S.P.; Lafrankie, J.V.; Sukumar, R.; Manokaran, N.; Foster, R.B.; Ashton, P.S. Species-Area and Species-Individual Relationships for Tropical Trees: A Comparison of Three 50-ha Plots. J. Ecol. 1996, 84, 549. [Google Scholar] [CrossRef]
- Condit, R.; Ashton, P.; Baker, P.; Bunyavejchewin, S. Spatial patterns in the distribution of tropical tree species. Science 2000, 288, 1414–1418. [Google Scholar] [CrossRef] [PubMed]
- Saatchi, S.S. Interactive comment on “Tree height integrated into pan-tropical forest biomass estimates” by. Biogeosci. Discuss. 2012, 9, C351–C353. [Google Scholar]
- Bragg, D.C. The Sine Method as a More Accurate Height Predictor for Hardwoods; e-GTR-SRS-101; U.S. Department of Agriculture, Forest Service, Southern Research Station: Asheville, NC, USA, 2007; pp. 23–32.
- Hunter, M.O.; Keller, M.; Victoria, D.; Morton, D.C. Tree height and tropical forest biomass estimation. Biogeosciences 2013, 10, 8385–8399. [Google Scholar] [CrossRef]
- Gimenez, B.O.; dos Santos, L.T.; Gebara, J.; Celes, C.H.S.; Durgante, F.M.; Lima, A.J.N.; dos Santos, J.; Higuchi, N. Tree Climbing Techniques and Volume Equations for Eschweilera (Matá-Matá), a Hyperdominant Genus in the Amazon Forest. Forests 2017, 8, 154. [Google Scholar] [CrossRef]
- Clark, D.A.; Clark, D.B. Getting to the canopy: Tree height growth in a neotropical rain forest. Ecology 2001, 82, 1460–1472. [Google Scholar] [CrossRef]
- Bragg, D.C. An Improved Tree Height Measurement Technique Tested on Mature Southern Pines. South. J. Appl. For. 2007, 32, 28–43. [Google Scholar]
- Sullivan, M.J.P.; Lewis, S.L.; Hubau, W.; Qie, L.; Baker, T.R.; Banin, L.F.; Chave, J.; Cuni-Sanchez, A.; Feldpausch, T.R.; Lopez-Gonzalez, G.; et al. Field methods for sampling tree height for tropical forest biomass estimation. Methods Ecol. Evol. 2018, 2018, 1–11. [Google Scholar] [CrossRef] [PubMed]
- Kato, A.; Kajiwara, K.; Honda, Y.; Watanabe, M.; Enoki, T.; Yamaguchi, Y.; Kobayashi, T. Efficient field data collection of tropical forest using terrestrial laser scanner. In Proceedings of the 2014 IEEE Geoscience and Remote Sensing Symposium, Quebec City, QC, Canada, 13–18 July 2014; pp. 816–819. [Google Scholar]
- Prasada, O.P.; Hussin, Y.A.; Weir, M.J.C.; Karna, Y.K. Derivation of forest inventory parameters for carbon estimation using terrestrial LiDAR. Int. Arch. Photogramm. Remote Sens. Spat. Inf. Sci. ISPRS Arch. 2016, 41, 677–684. [Google Scholar] [CrossRef]
- Kankare, V.; Holopainen, M.; Vastaranta, M.; Puttonen, E.; Yu, X.; Hyyppä, J.; Vaaja, M.; Hyyppä, H.; Alho, P. Individual tree biomass estimation using terrestrial laser scanning. ISPRS J. Photogramm. Remote Sens. 2013, 75, 64–75. [Google Scholar] [CrossRef]
- Olofsson, K.; Holmgren, J.; Olsson, H. Tree stem and height measurements using terrestrial laser scanning and the RANSAC algorithm. Remote Sens. 2014, 6, 4323–4344. [Google Scholar] [CrossRef]
- Liu, J.; Liang, X.; Hyyppä, J.; Yu, X.; Lehtomäki, M.; Pyörälä, J.; Zhu, L.; Wang, Y.; Chen, R. Automated matching of multiple terrestrial laser scans for stem mapping without the use of artificial references. Int. J. Appl. Earth Obs. Geoinf. 2017, 56, 13–23. [Google Scholar] [CrossRef]
- Asner, G.P.; Powell, G.V.N.; Mascaro, J.; Knapp, D.E.; Clark, J.K.; Jacobson, J.; Kennedy-Bowdoin, T.; Balaji, A.; Paez-Acosta, G.; Victoria, E.; et al. High-resolution forest carbon stocks and emissions in the Amazon. Proc. Natl. Acad. Sci. USA 2010, 107, 16738–16742. [Google Scholar] [CrossRef] [PubMed]
- Asner, G.P.; Mascaro, J. Mapping tropical forest carbon: Calibrating plot estimates to a simple LiDAR metric. Remote Sens. Environ. 2014, 140, 614–624. [Google Scholar] [CrossRef]
- Sibona, E.; Vitali, A.; Meloni, F.; Caffo, L.; Dotta, A.; Lingua, E.; Motta, R.; Garbarino, M. Direct Measurement of Tree Height Provides Different Results on the Assessment of LiDAR Accuracy. Forests 2017, 8, 7. [Google Scholar] [CrossRef]
- Hancock, S.; Anderson, K.; Disney, M.; Gaston, K.J. Measurement of fine-spatial-resolution 3D vegetation structure with airborne waveform lidar: Calibration and validation with voxelised terrestrial lidar. Remote Sens. Environ. 2017, 188, 37–50. [Google Scholar] [CrossRef]
- Odipo, V.; Nickless, A.; Berger, C.; Baade, J.; Urbazaev, M.; Walther, C.; Schmullius, C. Assessment of Aboveground Woody Biomass Dynamics Using Terrestrial Laser Scanner and L-Band ALOS PALSAR Data in South African Savanna. Forests 2016, 7, 294. [Google Scholar] [CrossRef]
- Simard, M.; Pinto, N.; Fisher, J.B.; Baccini, A. Mapping forest canopy height globally with spaceborne lidar. J. Geophys. Res. Biogeosci. 2011, 116, 1–12. [Google Scholar] [CrossRef]
- Su, Y.; Guo, Q.; Xue, B.; Hu, T.; Alvarez, O.; Tao, S.; Fang, J. Spatial distribution of forest aboveground biomass in China: Estimation through combination of spaceborne lidar, optical imagery, and forest inventory data. Remote Sens. Environ. 2016, 173, 187–199. [Google Scholar] [CrossRef]
- Disney, M.I.; Boni Vicari, M.; Calders, K.; Burt, A.; Lewis, S.L.; Raumonen, P.; Wilkes, P. Weighing trees with lasers: Advances, challenges and opportunities. R. Soc. Interface 2018. [Google Scholar] [CrossRef] [PubMed]
- Malhi, Y.; Jackson, T.; Patrick Bentley, L.; Lau, A.; Shenkin, A.; Herold, M.; Calders, K.; Bartholomeus, H.; Disney, M.I. New perspectives on the ecology of tree structure and tree communities through terrestrial laser scanning. Interface Focus 2018, 8, 20170052. [Google Scholar] [CrossRef] [PubMed]
- Blakey, R.V.; Law, B.S.; Kingsford, R.T.; Stoklosa, J. Remote Sensing of Environment Terrestrial laser scanning reveals below-canopy bat trait relationships with forest structure. Remote Sens. Environ. 2017, 198, 40–51. [Google Scholar] [CrossRef]
- Ledo, A.; Cornulier, T.; Illian, J.B.; Iida, Y.; Kassim, A.R.; Burslem, D.F.R.P. Re-evaluation of individual diameter: Height allometric models to improve biomass estimation of tropical trees. Ecol. Appl. 2016, 26, 2376–2382. [Google Scholar] [CrossRef] [PubMed]
- Nogueira, E.M.; Nelson, B.W.; Fearnside, P.M.; França, M.B.; de Oliveira, Á.C.A. Tree height in Brazil’s ‘arc of deforestation’: Shorter trees in south and southwest Amazonia imply lower biomass. For. Ecol. Manag. 2008, 255, 2963–2972. [Google Scholar] [CrossRef]
- Nogueira, E.M.; Fearnside, P.M.; Nelson, B.W.; França, M.B. Wood density in forests of Brazil’s ‘arc of deforestation’: Implications for biomass and flux of carbon from land-use change in Amazonia. For. Ecol. Manag. 2007, 248, 119–135. [Google Scholar] [CrossRef]
- King, D.A. Allometry and life history of tropical trees. J. Trop. Ecol. 1996, 12, 25–44. [Google Scholar] [CrossRef]
- Clark, D.; Clark, D.A. Landscape-scale variation in forest structure and biomass in a tropical rain forest. For. Ecol. Manag. 2000, 137, 185–198. [Google Scholar] [CrossRef]
- Lutz, J.A.; Furniss, T.J.; Johnson, D.J.; Davies, S.J.; Allen, D.; Alonso, A.; Anderson-Teixeira, K.J.; Andrade, A.; Baltzer, J.; Becker, K.M.L.; et al. Global importance of large-diameter trees. Glob. Ecol. Biogeogr. 2018, 27, 849–864. [Google Scholar] [CrossRef]


| Method | Total Error | Systematic Error | Random Error | |||
|---|---|---|---|---|---|---|
| Et (cm) | Etprop (%) | Es (cm) | Esprop (%) | Er (cm) | Erprop (%) | |
| 10 ≤ DBH < 30 cm (n = 46) | ||||||
| Caliper | 0.5 | 3.0 | −0.3 | −2.1 | 0.4 | 2.2 |
| TLSRHT | 1.8 | 11.5 | <0.1 | −1.2 | 1.8 | 11.6 |
| TLSLSR | 1.6 | 10.5 | 0.5 | 2.2 | 1.2 | 10.4 |
| All trees (n = 55) | ||||||
| Caliper | 0.9 | 3.2 | −0.5 | −2.3 | 0.7 | 2.3 |
| TLSRHT | 2.4 | 11.1 | −0.4 | −1.8 | 2.4 | 11.0 |
| TLSLSR | 2.3 | 10.2 | 0.2 | 1.6 | 2.0 | 10.1 |
| Methodology | Total Error | Systematic Error | Random Error | MAE (m) | |||
|---|---|---|---|---|---|---|---|
| Et (m) | Etprop (%) | Es (m) | Esprop (%) | Er (m) | Erprop (%) | ||
| Height 10–20 m (n = 26) | |||||||
| Rangefinder | 1.9 | 11.9 | −0.3 | −2.0 | 1.9 | 12.0 | 1.5 |
| TLSHeight | 1.8 | 10.2 | 0.9 | 4.9 | 1.2 | 9.1 | 1.2 |
| TLSLength | 1.9 | 10.5 | 1.0 | 5.8 | 1.6 | 8.9 | 1.2 |
| Height 20–35 m (n = 29) | |||||||
| Rangefinder | 3.1 | 11.5 | 1.00 | 3.9 | 2.9 | 11.0 | 2.1 |
| TLSHeight | 2.4 | 9.8 | 0.5 | 2.5 | 2.2 | 9.6 | 1.7 |
| TLSLength | 2.4 | 9.7 | 0.7 | 3.2 | 2.3 | 9.3 | 1.7 |
| Height all trees (n = 55) | |||||||
| Rangefinder | 2.6 | 11.7 | 0.4 | 1.1 | 2.6 | 11.8 | 2.0 |
| TLSHeight | 2.2 | 10.0 | 0.7 | 3.6 | 1.8 | 9.3 | 1.6 |
| TLSLength | 2.2 | 10.1 | 0.9 | 4.5 | 2.0 | 9.1 | 1.6 |
| Allometric Equation | Total Error | Systematic Error | Random Error | MAE (kg) | ||||
|---|---|---|---|---|---|---|---|---|
| Technology | Et (kg) | Etprop (%) | Es (kg) | Esprop (%) | Er (kg) | Erprop (%) | ||
| iguchi 1998 DH | FM | 403.1 | 31.0 | −28.1 | −2.4 | 405.9 | 31.2 | 179.2 |
| Higuchi 1998 DH | TLS | 277.3 | 26.6 | −36.1 | −2.6 | 274.9 | 26.8 | 125.4 |
| Higuchi 1998 D | TM | 209.75 | 41.42 | 66.25 | 12.86 | 77.5 | 6.1 | 38.4 |
| Higuchi 1998 D | FM | 191.9 | 39.7 | 29.9 | 6.4 | 200.6 | 26.3 | 70.9 |
| Higuchi 1998 D | TLS | 182.3 | 52.1 | 40.4 | 10.9 | 200.8 | 24.3 | 104.5 |
| Feldpausch 2012 DHρ | TM | 286.3 | 42.8 | 107.5 | 14.8 | 143.4 | 24.6 | 72.4 |
| Feldpausch 2012 DHρ | FM | 268.3 | 41.7 | 90.7 | 10.7 | 190.3 | 26.9 | 82.4 |
| Feldpausch 2012 DHρ | TLS | 288.7 | 56.8 | 103.8 | 17.5 | 233.7 | 33.6 | 102.3 |
| Chave 2014 DHρ | TM | 351.4 | 51.4 | 157.8 | 27.6 | 192.3 | 27.2 | 106.7 |
| Chave 2014 DHρ | FM | 328.5 | 49.2 | 139.8 | 23.0 | 224.1 | 29.6 | 105.0 |
| Chave 2014 DHρ | TLS | 347.8 | 66.4 | 154.0 | 30.5 | 263.6 | 37.0 | 132.6 |
© 2019 by the authors. Licensee MDPI, Basel, Switzerland. This article is an open access article distributed under the terms and conditions of the Creative Commons Attribution (CC BY) license (http://creativecommons.org/licenses/by/4.0/).
Share and Cite
Pereira, I.S.; Mendonça do Nascimento, H.E.; Boni Vicari, M.; Disney, M.; DeLucia, E.H.; Domingues, T.; Kruijt, B.; Lapola, D.; Meir, P.; Norby, R.J.; et al. Performance of Laser-Based Electronic Devices for Structural Analysis of Amazonian Terra-Firme Forests. Remote Sens. 2019, 11, 510. https://doi.org/10.3390/rs11050510
Pereira IS, Mendonça do Nascimento HE, Boni Vicari M, Disney M, DeLucia EH, Domingues T, Kruijt B, Lapola D, Meir P, Norby RJ, et al. Performance of Laser-Based Electronic Devices for Structural Analysis of Amazonian Terra-Firme Forests. Remote Sensing. 2019; 11(5):510. https://doi.org/10.3390/rs11050510
Chicago/Turabian StylePereira, Iokanam Sales, Henrique E. Mendonça do Nascimento, Matheus Boni Vicari, Mathias Disney, Evan H. DeLucia, Tomas Domingues, Bart Kruijt, David Lapola, Patrick Meir, Richard J. Norby, and et al. 2019. "Performance of Laser-Based Electronic Devices for Structural Analysis of Amazonian Terra-Firme Forests" Remote Sensing 11, no. 5: 510. https://doi.org/10.3390/rs11050510
APA StylePereira, I. S., Mendonça do Nascimento, H. E., Boni Vicari, M., Disney, M., DeLucia, E. H., Domingues, T., Kruijt, B., Lapola, D., Meir, P., Norby, R. J., Ometto, J. P. H. B., Quesada, C. A., Rammig, A., & Hofhansl, F. (2019). Performance of Laser-Based Electronic Devices for Structural Analysis of Amazonian Terra-Firme Forests. Remote Sensing, 11(5), 510. https://doi.org/10.3390/rs11050510