Changes in a Giant Iceberg Created from the Collapse of the Larsen C Ice Shelf, Antarctic Peninsula, Derived from Sentinel-1 and CryoSat-2 Data


Abstract
1. Introduction
2. Materials
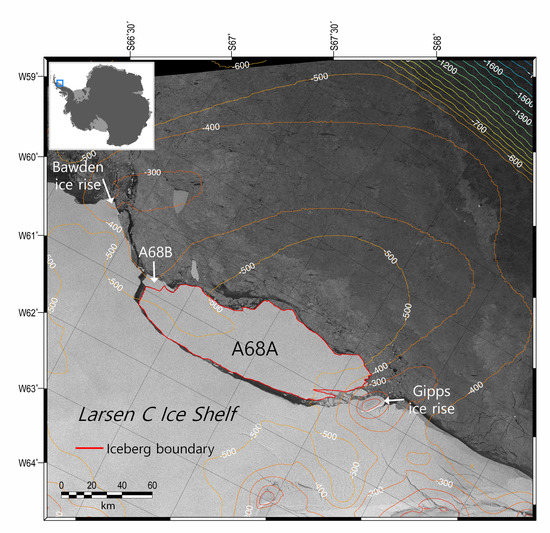
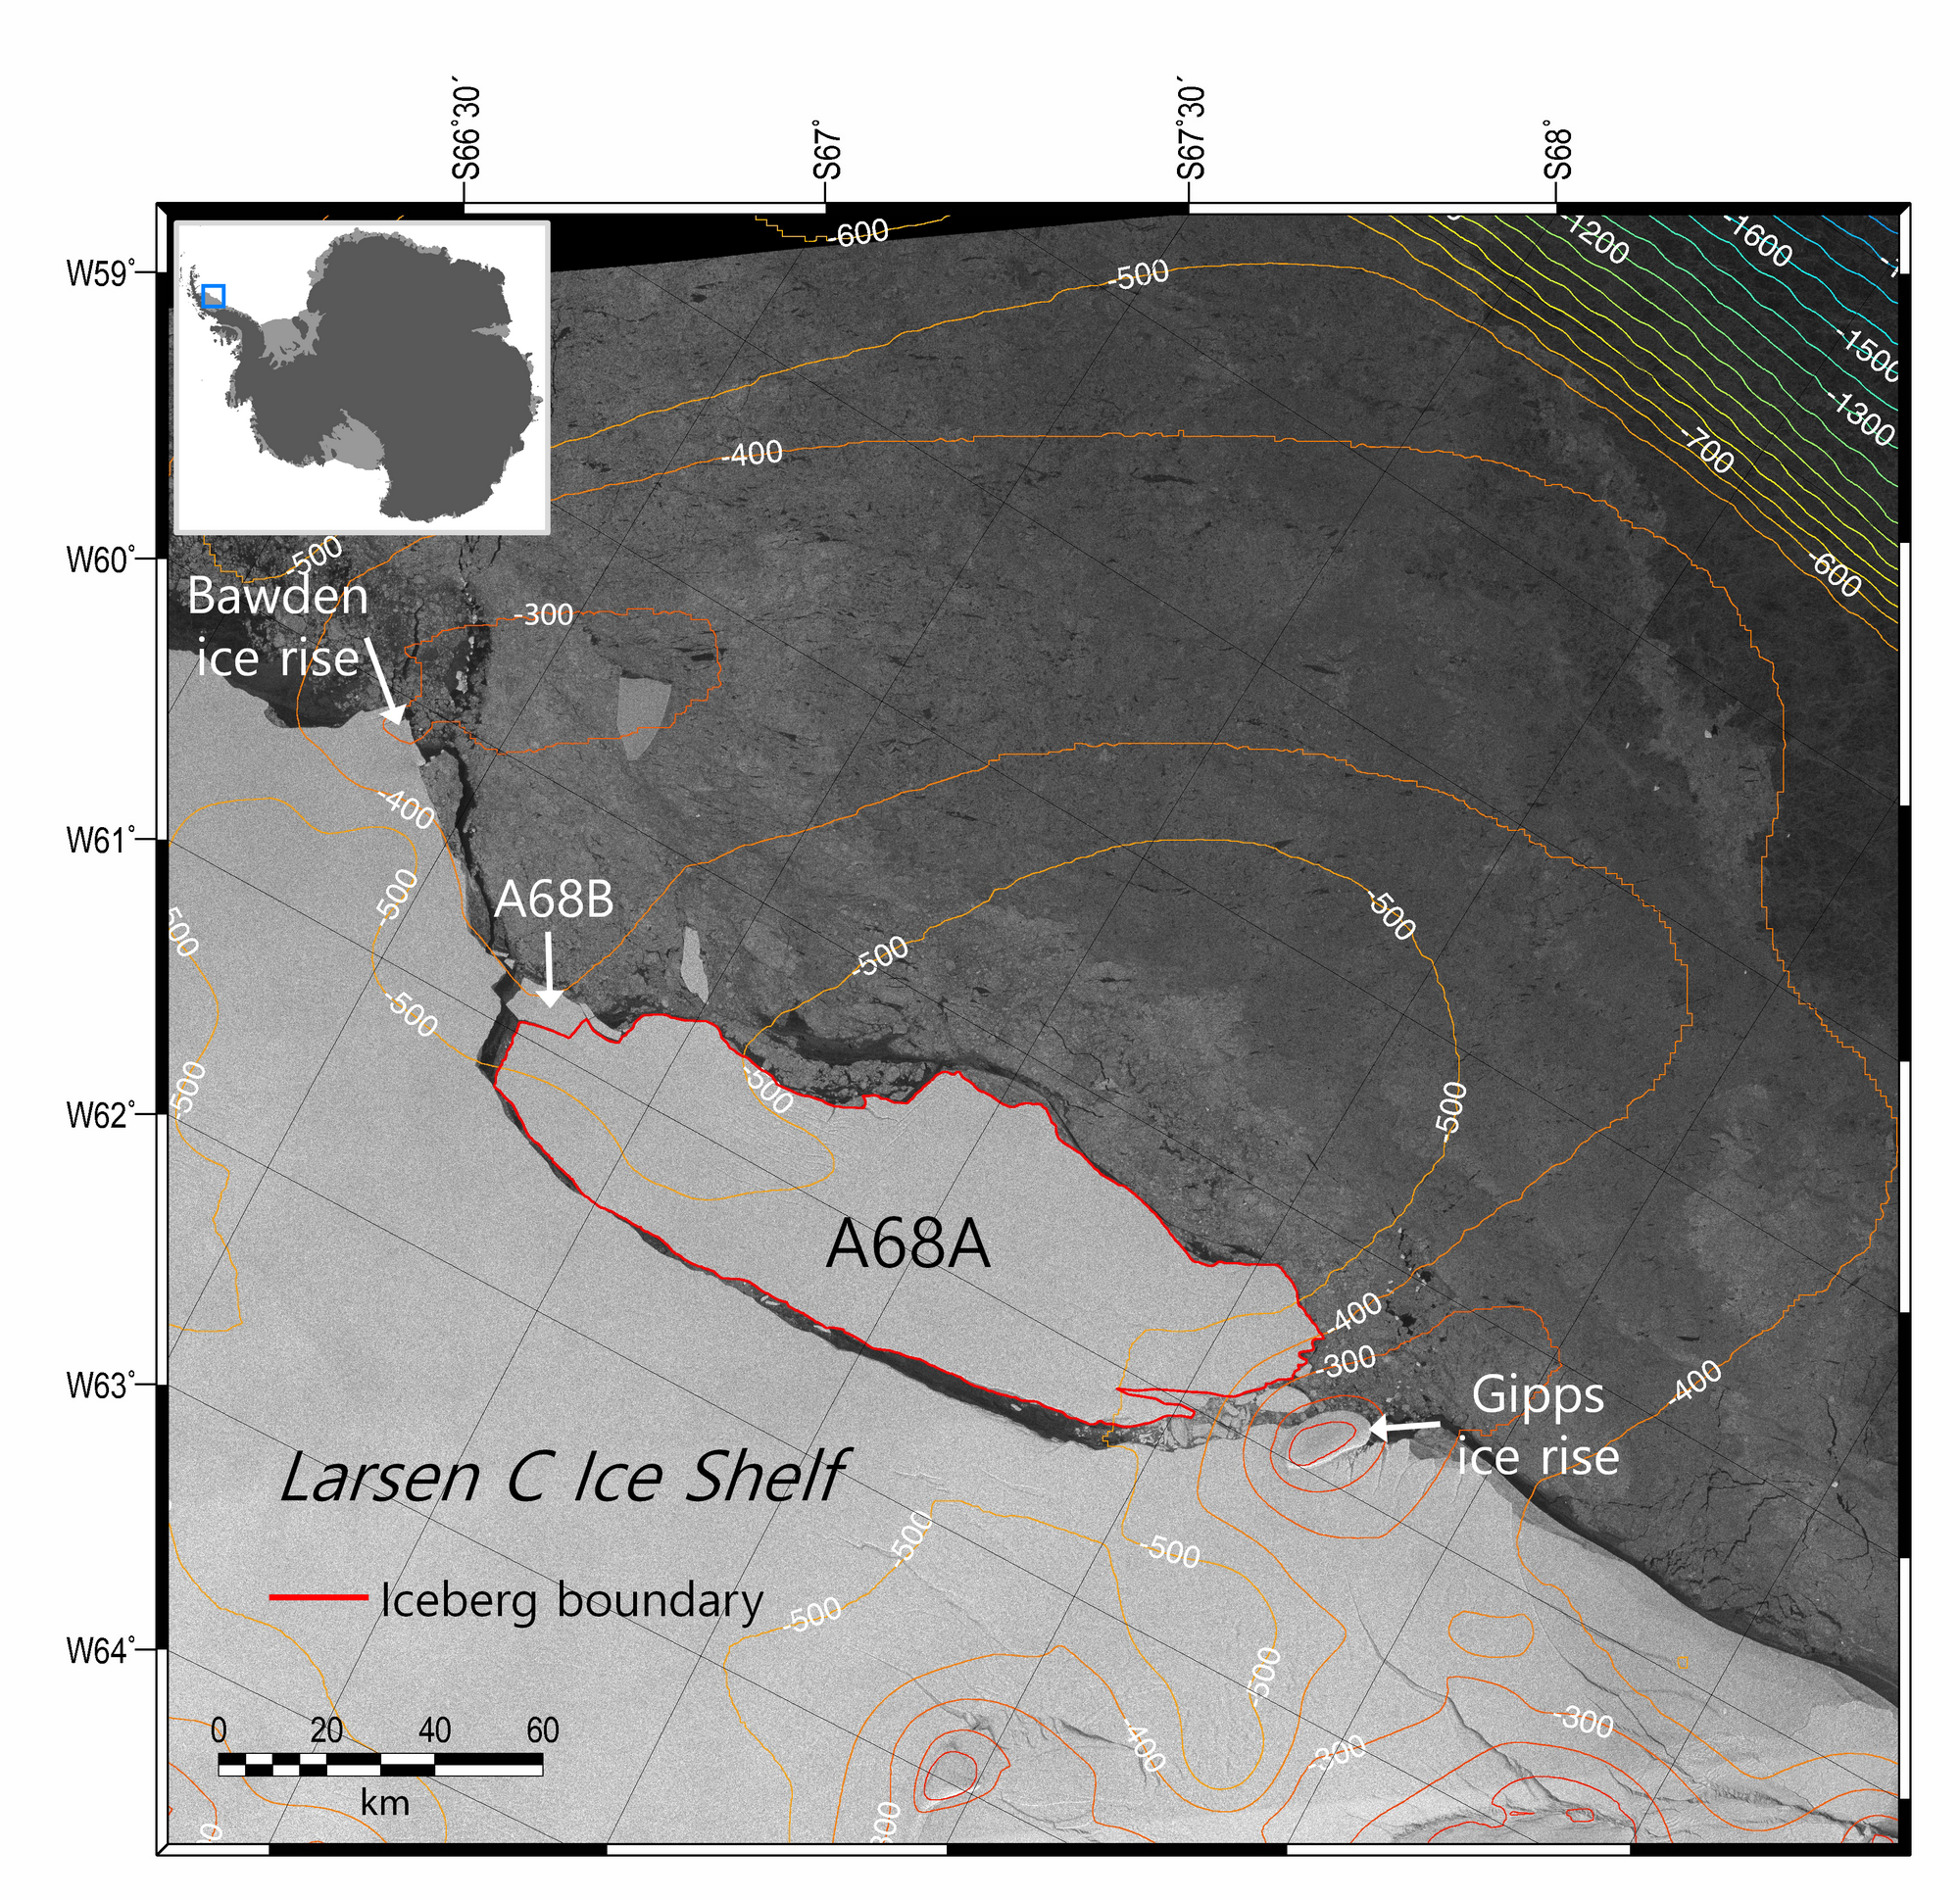
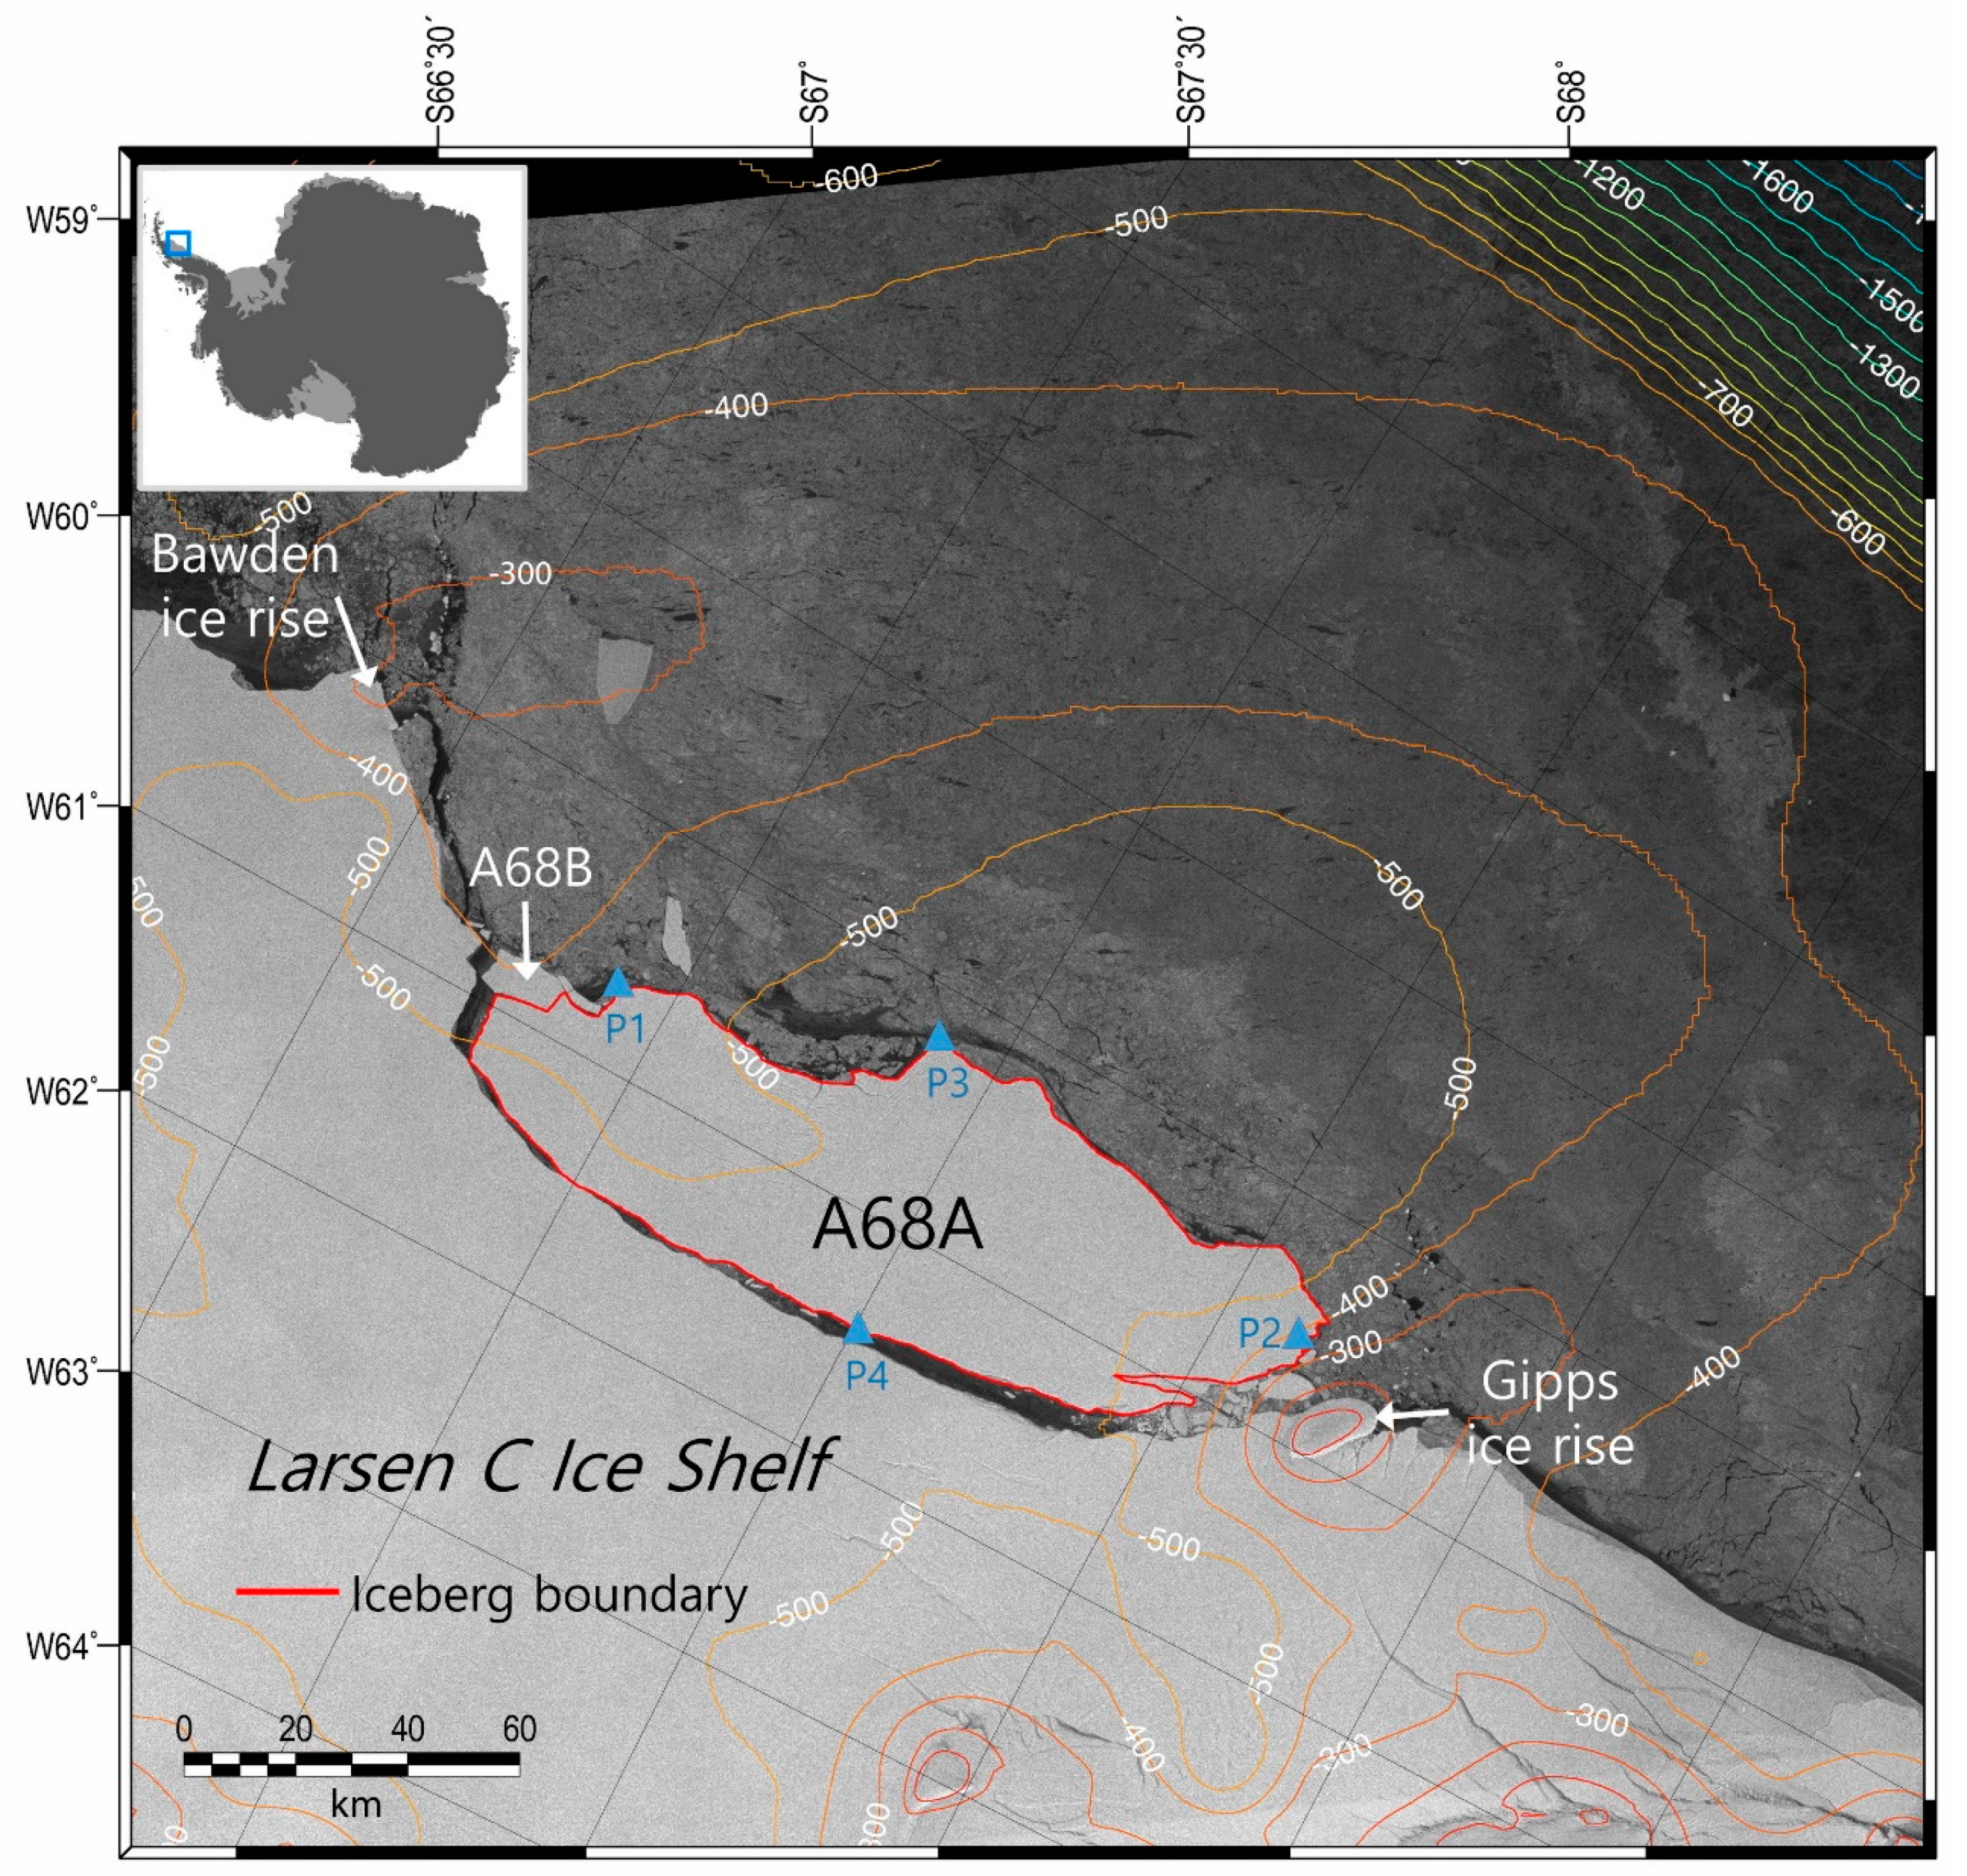
2.1. Iceberg A68
2.2. Data
3. Methods
4. Results and Discussion
5. Conclusions
Author Contributions
Funding
Conflicts of Interest
References
- Silva, T.A.M.; Bigg, G.R.; Nicholls, K.W. Contribution of giant icebergs to the Southern Ocean freshwater flux. J. Geophys. Res. Oceans 2006, 111, C03004. [Google Scholar] [CrossRef]
- Romanov, Y.A.; Romanova, N.A.; Romanov, P. Shape and size of Antarctic icebergs derived from ship observation data. Antarct. Sci. 2011, 24, 77–87. [Google Scholar] [CrossRef]
- Tournadre, J.; Bouhier, N.; Girard-Ardhuin, F.; Rémy, F. Antarctic icebergs distributions 1992–2014. J. Geophys. Res. Oceans 2016, 121, 327–349. [Google Scholar] [CrossRef]
- Martin, S.; Drucker, R.S.; Kwok, R. The areas and ice production of the western and central Ross Sea polynyas, 1992–2002, and their relation to the B-15 and C-19 iceberg events of 2000 and 2002. J. Mar. Syst. 2007, 68, 201–214. [Google Scholar] [CrossRef]
- Merino, N.; Le Sommer, J.; Durand, G.; Jourdain, N.C.; Madec, G.; Mathiot, P.; Tournadre, J. Antarctic icebergs melt over the Southern Ocean: Climatology and impact on sea ice. Ocean Model. 2016, 104, 99–110. [Google Scholar] [CrossRef]
- Robinson, N.J.; Williams, M.J.M. Iceberg-induced changes to polynya operation and regional oceanography in the southern Ross Sea, Antarctica, from in situ observations. Antarct. Sci. 2012, 24, 514–526. [Google Scholar] [CrossRef]
- Wilson, K.; Turney, C.S.M.; Fogwill, C.J.; Blair, E. The impact of the giant iceberg B09B on population size and breeding success of Adélie penguins in Commonwealth Bay, Antarctica. Antarct. Sci. 2016, 28, 187–193. [Google Scholar] [CrossRef]
- Kooyman, G.L.; Ainley, D.G.; Ballard, G.; Ponganis, P.J. Effects of giant icebergs on two emperor penguin colonies in the Ross Sea, Antarctica. Antarct. Sci. 2007, 19, 31–38. [Google Scholar] [CrossRef]
- Schwarz, J.N.; Schodlok, M.P. Impact of drifting icebergs on surface phytoplankton biomass in the Southern Ocean: Ocean colour remote sensing and in situ iceberg tracking. Deep Sea Res. Part I Oceanogr. Res. Pap. 2009, 56, 1727–1741. [Google Scholar] [CrossRef]
- Lasserre, F. Simulations of shipping along Arctic routes: Comparison, analysis and economic perspectives. Polar Rec. 2015, 51, 239–259. [Google Scholar] [CrossRef]
- Scambos, T.; Ross, R.; Bauer, R.; Yermolin, Y.; Skvarca, P.; Long, D.; Bohlander, J.; Haran, T. Calving and ice-shelf break-up processes investigated by proxy: Antarctic tabular iceberg evolution during northward drift. J. Glaciol. 2008, 54, 579–591. [Google Scholar] [CrossRef]
- Budge, J.S.; Long, D.G. A comprehensive database for Antarctic iceberg tracking using scatterometer data. IEEE J. Sel. Top. Appl. Earth Obs. Remote Sens. 2018, 11, 434–442. [Google Scholar] [CrossRef]
- Stuart, K.M.; Long, D.G. Tracking large tabular icebergs using the SeaWinds Ku-band microwave scatterometer. Deep Sea Res. Part II Top. Stud. Oceanogr. 2011, 58, 1285–1300. [Google Scholar] [CrossRef]
- Wesche, C.; Dierking, W. Near-coastal circum-Antarctic iceberg size distributions determined from Synthetic Aperture Radar images. Remote Sens. Environ. 2015, 156, 561–569. [Google Scholar] [CrossRef]
- Mazur, A.K.; Wåhlin, A.K.; Krężel, A. An object-based SAR image iceberg detection algorithm applied to the Amundsen Sea. Remote Sens. Environ. 2017, 189, 67–83. [Google Scholar] [CrossRef]
- Moctezuma-Flores, M.; Parmiggiani, F. Tracking of the iceberg created by the Nansen Ice Shelf collapse. Int. J. Remote Sens. 2017, 38, 1224–1234. [Google Scholar] [CrossRef]
- Li, T.; Shokr, M.; Liu, Y.; Cheng, X.; Li, T.; Wang, F.; Hui, F. Monitoring the tabular icebergs C28A and C28B calved from the Mertz Ice Tongue using radar remote sensing data. Remote Sens. Environ. 2018, 216, 615–625. [Google Scholar] [CrossRef]
- Parmiggiani, F.; Moctezuma-Flores, M.; Guerrieri, L.; Battagliere, M.L. SAR analysis of the Larsen-C A-68 iceberg displacements. Int. J. Remote Sens. 2018, 39, 5850–5858. [Google Scholar] [CrossRef]
- Wang, F.; Bamber, J.L.; Cheng, X. Accuracy and performance of CryoSat-2 SARIn mode data over Antarctica. IEEE Geosci. Remote Sens. Lett. 2015, 12, 1516–1520. [Google Scholar] [CrossRef]
- Benn, D.I.; Åström, J.A. Calving glaciers and ice shelves. Adv. Phys. X 2018, 3, 1513819. [Google Scholar] [CrossRef]
- Jansen, D.; Luckman, A.J.; Cook, A.; Bevan, S.; Kulessa, B.; Hubbard, B.; Holland, P.R. Brief Communication: Newly developing rift in Larsen C Ice Shelf presents significant risk to stability. Cryosphere 2015, 9, 1223–1227. [Google Scholar] [CrossRef]
- Hogg, A.E.; Gudmundsson, G.H. Impacts of the Larsen-C Ice Shelf calving event. Nat. Clim. Chang. 2017, 7, 540–542. [Google Scholar] [CrossRef]
- Mueller, R.D.; Padman, L.; Dinniman, M.S.; Erofeeva, S.Y.; Fricker, H.A.; King, M.A. Impact of tide-topography interactions on basal melting of Larsen C Ice Shelf, Antarctica. J. Geophys. Res. Oceans 2012, 117, C05005. [Google Scholar] [CrossRef]
- Torres, R.; Snoeij, P.; Geudtner, D.; Bibby, D.; Davidson, M.; Attema, E.; Potin, P.; Rommen, B.; Floury, N.; Brown, M.; et al. GMES Sentinel-1 mission. Remote Sens. Environ. 2012, 120, 9–24. [Google Scholar] [CrossRef]
- Chuter, S.J.; Bamber, J.L. Antarctic ice shelf thickness from CryoSat-2 radar altimetry. Geophys. Res. Lett. 2015, 42, 10721–10729. [Google Scholar] [CrossRef]
- Helm, V.; Humbert, A.; Miller, H. Elevation and elevation change of Greenland and Antarctica derived from CryoSat-2. Cryosphere 2014, 8, 1539–1559. [Google Scholar] [CrossRef]
- Förste, C.; Bruinsma, S.; Abrikosov, O.; Flechtner, F.; Marty, J.C.; Lemoine, J.-M.; Dahle, C.; Numayer, H.; Barthellmes, F.; König, R.; et al. EIGEN-6C4—The latest combined global gravity field model including GOCE data up to degree and order 1949 of GFZ Potsdam and GRGS Toulouse. In Proceedings of the EGU General Assembly Conference Abstract, Vienna, Austria, 27 April–2 May 2014; Volume 16. [Google Scholar]
- Knudsen, P.; Andersen, O.B. A global mean ocean circulation estimation using GOCE gravity models—The DTU12MDT mean dynamic topography model. In 20 Years of Progress in Radar Altimetry Abstract Book; European Space Agency: Paris, France, 2012; p. 123. [Google Scholar]
- Padman, L.; Erofeeva, S.Y.; Fricker, H.A. Improving Antarctic tide models by assimilation of ICESat laser altimetry over ice shelves. Geophys. Res. Lett. 2008, 35, L22504. [Google Scholar] [CrossRef]
- Gelaro, R.; McCarty, W.; Suárez, M.J.; Todling, R.; Molod, A.; Takacs, L.; Randles, C.A.; Darmenov, A.; Bosilovich, M.G.; Rekchle, R.; et al. The modern-era retrospective analysis for research and applications, version 2 (MERRA-2). J. Clim. 2017, 30, 5419–5454. [Google Scholar] [CrossRef]
- Fretwell, P.; Pritchard, H.D.; Vaughan, D.G.; Bamber, J.L.; Barrand, N.E.; Bell, R.; Bianchi, C.; Bingham, R.G.; Blankenship, D.D.; Casassa, G.; et al. Bedmap2: Improved ice bed, surface and thickness datasets for Antarctica. Cryosphere 2013, 7, 375–393. [Google Scholar] [CrossRef]
- Silva, T.A.M.; Bigg, G.R. Computer-based identification and tracking of Antarctic icebergs in SAR images. Remote Sens. Environ. 2005, 94, 287–297. [Google Scholar] [CrossRef]
- Ford, M. Shoreline changes interpreted from multi-temporal aerial photographs and high resolution satellite images: Wotje Atoll, Marshall Island. Remote Sens. Environ. 2013, 135, 130–140. [Google Scholar] [CrossRef]
- Zwally, H.J.; Yi, D.; Kwok, R.; Zhao, Y. ICESat measurements of sea ice freeboard and estimates of sea ice thickness in the Weddell Sea. J. Geophys. Res. Oceans 2008, 113, C02S15. [Google Scholar] [CrossRef]
- Griggs, J.A.; Bamber, J.L. Ice shelf thickness over Larsen C, Antarctica, derived from satellite altimetry. Geophys. Res. Lett. 2009, 36, L19501. [Google Scholar] [CrossRef]
- Griggs, J.A.; Bamber, J.L. Antarctic ice-shelf thickness from satellite radar altimetry. J. Glaciol. 2011, 57, 485–498. [Google Scholar] [CrossRef]
- Paolo, F.S.; Fricker, H.A.; Padman, L. Volume loss from Antarctic ice shelves is accelerating. Science 2015, 348, 327–331. [Google Scholar] [CrossRef] [PubMed]
- Han, H.; Lee, H. Tide-corrected flow velocity and mass balance of Campbell Glacier Tongue, East Antarctica, derived from interferometric SAR. Remote Sens. Environ. 2015, 160, 180–192. [Google Scholar] [CrossRef]
- Zwally, H.J.; Giovinetto, M.B.; Li, J.; Cornejo, H.G.; Beckley, M.A.; Brenner, A.C.; Saba, J.L.; Yi, D. Mass changes of the Greenland and Antarctic ice sheets shelves and contributions to sea-level rise: 1992–2002. Ann. Glaciol. 2005, 51, 509–527. [Google Scholar] [CrossRef]
- Wagner, T.J.W.; Wadhams, P.; Bates, R.; Elosegui, P.; Stern, A.; Vella, D.; Povl Abrahamsen, E.; Crawford, A.; Nicholls, K.W. The “footloose” mechanism: Iceberg decay from hydrostatic stresses. Geophys. Res. Lett. 2014, 41, 5522–5529. [Google Scholar] [CrossRef]
- Liu, H.; Li, X.; Guo, H. The dynamic processes of sea ice on the east coast of Antarctica―A case study based on spaceborne synthetic aperture radar data from TerraSAR-X. IEEE J. Sel. Top. Appl. Earth Obs. Remote Sens. 2016, 9, 1187–1198. [Google Scholar] [CrossRef]
- Thomas, R.H. The dynamics of marine ice sheets. J. Glaciol. 1979, 24, 167–177. [Google Scholar] [CrossRef]
- Walter, F.; O’Neel, S.; McNamara, D.; Pfeffer, W.T.; Bassis, J.N.; Fricker, H.A. Iceberg calving during transition from grounded to floating ice: Columbia Glacier, Alaska. Geophys. Res. Lett. 2010, 37, L15501. [Google Scholar] [CrossRef]
- Ren, D.; Leslie, L.M.; Lynch, M.J. Verification of model simulated mass balance, flow fields and tabular calving events of the Antarctic ice sheet against remotely sensed observations. Clim. Dyn. 2013, 40, 2617–2636. [Google Scholar] [CrossRef][Green Version]
- Jansen, D.; Schodlok, M.; Rack, W. Basal melting of A-38B: A physical model constrained by satellite observations. Remote Sens. Environ. 2007, 111, 195–203. [Google Scholar] [CrossRef]
- Stephenson, G.R., Jr.; Sprintall, J.; Gille, S.T.; Vernet, M.; Helly, J.J.; Kaufmann, R.S. Subsurface melting of a free-floating Antarctic iceberg. Deep Sea Res. Part II Top. Stud. Oceanogr. 2011, 58, 1336–1345. [Google Scholar] [CrossRef]


| No. Intersections | Date | Freeboard (m) | No. Intersections | Dates | Freeboard (m) |
|---|---|---|---|---|---|
| 1 | 2017.09.08 2018.06.18 (1) | 34.5 ± 0.2 36.1 ± 0.1 | 10 | 2018.02.24 2018.09.09 | 34.6 ± 0.4 32.7 ± 0.7 |
| 2 | 2017.09.08 2018.08.11 (1) | 34.4 ± 0.2 35.3 ± 0.2 | 11 | 2018.02.24 2018.10.06 (1) | 36.1 ± 0.6 36.1 ± 0.2 |
| 3 | 2017.09.08 2018.10.06 (1) | 35.1 ± 0.2 35.7 ± 0.2 | 12 | 2018.02.24 2018.10.06 (2) | 34.5 ± 0.9 33.0 ± 0.3 |
| 4 | 2017.09.08 2018.10.06 (2) | 32.7 ± 1.2 31.9 ± 0.4 | 13 | 2018.02.24 2018.11.03 | 36.5 ± 0.2 35.9 ± 0.3 |
| 5 | 2017.09.08 2018.11.03 | 35.1 ± 0.3 35.3 ± 0.1 | 14 | 2018.02.24 2018.11.05 | 33.5 ± 0.6 33.0 ± 0.5 |
| 6 | 2018.01.30 2018.08.11 (2) | 35.7 ± 0.6 36.7 ± 0.5 | 15 | 2018.03.25 2018.10.06 (1) | 36.4 ± 0.5 37.0 ± 0.8 |
| 7 | 2018.01.30 2018.09.09 | 37.8 ± 1.9 38.6 ± 0.7 | 16 | 2018.03.25 2018.10.06 (2) | 35.8 ± 0.7 36.1 ± 0.4 |
| 8 | 2018.01.30 2018.10.06 (1) | 37.0 ± 2.1 37.5 ± 1.1 | 17 | 2018.03.25 2018.11.03 | 38.0 ± 0.3 37.9 ± 0.2 |
| 9 | 2018.01.30 2018.11.03 | 38.7 ± 0.6 39.0 ± 0.4 | 18 | 2018.03.25 2018.11.05 | 36.0 ± 0.2 35.1 ± 0.4 |
© 2019 by the authors. Licensee MDPI, Basel, Switzerland. This article is an open access article distributed under the terms and conditions of the Creative Commons Attribution (CC BY) license (http://creativecommons.org/licenses/by/4.0/).
Share and Cite
Han, H.; Lee, S.; Kim, J.-I.; Kim, S.H.; Kim, H.-c. Changes in a Giant Iceberg Created from the Collapse of the Larsen C Ice Shelf, Antarctic Peninsula, Derived from Sentinel-1 and CryoSat-2 Data. Remote Sens. 2019, 11, 404. https://doi.org/10.3390/rs11040404
Han H, Lee S, Kim J-I, Kim SH, Kim H-c. Changes in a Giant Iceberg Created from the Collapse of the Larsen C Ice Shelf, Antarctic Peninsula, Derived from Sentinel-1 and CryoSat-2 Data. Remote Sensing. 2019; 11(4):404. https://doi.org/10.3390/rs11040404
Chicago/Turabian StyleHan, Hyangsun, Sungjae Lee, Jae-In Kim, Seung Hee Kim, and Hyun-cheol Kim. 2019. "Changes in a Giant Iceberg Created from the Collapse of the Larsen C Ice Shelf, Antarctic Peninsula, Derived from Sentinel-1 and CryoSat-2 Data" Remote Sensing 11, no. 4: 404. https://doi.org/10.3390/rs11040404
APA StyleHan, H., Lee, S., Kim, J.-I., Kim, S. H., & Kim, H.-c. (2019). Changes in a Giant Iceberg Created from the Collapse of the Larsen C Ice Shelf, Antarctic Peninsula, Derived from Sentinel-1 and CryoSat-2 Data. Remote Sensing, 11(4), 404. https://doi.org/10.3390/rs11040404