Article

Semantic Segmentation-Based Building Footprint Extraction Using Very High-Resolution Satellite Images and Multi-Source GIS Data

1
Ministry of Education Key Laboratory for Earth System Modeling, Department of Earth System Science, Tsinghua University, Beijing 100084, China
2
Joint Center for Global Change Studies (JCGCS), Beijing 100084, China
3
Department of Computer Science, Tsinghua University, Beijing 100084, China
4
Tencent, Shenzhen 518000, China
5
College of Surveying and Geo-Informatics, Tongji University, Shanghai 200092, China
*
Author to whom correspondence should be addressed.
These authors contributed equally to this work.
Remote Sens. 2019, 11(4), 403; https://doi.org/10.3390/rs11040403
Submission received: 8 January 2019 / Revised: 8 February 2019 / Accepted: 13 February 2019 / Published: 16 February 2019
(This article belongs to the Special Issue Remote Sensing based Building Extraction)

Abstract

:
Automatic extraction of building footprints from high-resolution satellite imagery has become an important and challenging research issue receiving greater attention. Many recent studies have explored different deep learning-based semantic segmentation methods for improving the accuracy of building extraction. Although they record substantial land cover and land use information (e.g., buildings, roads, water, etc.), public geographic information system (GIS) map datasets have rarely been utilized to improve building extraction results in existing studies. In this research, we propose a U-Net-based semantic segmentation method for the extraction of building footprints from high-resolution multispectral satellite images using the SpaceNet building dataset provided in the DeepGlobe Satellite Challenge of IEEE Conference on Computer Vision and Pattern Recognition 2018 (CVPR 2018). We explore the potential of multiple public GIS map datasets (OpenStreetMap, Google Maps, and MapWorld) through integration with the WorldView-3 satellite datasets in four cities (Las Vegas, Paris, Shanghai, and Khartoum). Several strategies are designed and combined with the U-Net–based semantic segmentation model, including data augmentation, post-processing, and integration of the GIS map data and satellite images. The proposed method achieves a total F1-score of 0.704, which is an improvement of 1.1% to 12.5% compared with the top three solutions in the SpaceNet Building Detection Competition and 3.0% to 9.2% compared with the standard U-Net–based method. Moreover, the effect of each proposed strategy and the possible reasons for the building footprint extraction results are analyzed substantially considering the actual situation of the four cities.

1. Introduction

High-resolution remote sensing images have been increasingly popular and widely used in many geoscience applications, including automatic mapping of land use or land cover types, and automatic detection or extraction of small objects such as vehicles, ships, trees, roads, buildings, etc. [1,2,3,4,5,6]. As one of these geoscience applications, the automatic extraction of building footprints from high-resolution imagery is beneficial for urban planning, disaster management, and environmental management [7,8,9,10]. The spatial distributions of buildings are also essential for monitoring urban settlements, modeling urban demographics, updating the geographical database, and many other aspects [11,12]. Due to the diversity of buildings (e.g., in color, shape, size, materials, etc.) in different regions and the similarity of buildings to the background or other objects [9], developing reliable and accurate building extraction methods has become an important and challenging research issue receiving greater attention.
Over the past few decades, many building extraction studies were based on traditional image processing methods, such as shadow-based methods, edge-based methods, object-based methods, and more [13,14,15]. For instance, Belgiu and Drǎguţ [16] proposed and compared supervised and unsupervised multi-resolution segmentation methods combined with the random forest (RF) classifier for building extraction using high-resolution satellite images. Chen et al. [17] proposed edge regularity indices and shadow line indices as new features of building candidates obtained from segmentation methods, and employed three machine learning classifiers (AdaBoost, RF, and support vector machine (SVM)) to identify buildings. Huang and Zhang [18] proposed the morphological shadow index (MSI) to detect shadows (used as a spatial constraint of buildings) and proposed dual-threshold filtering to integrate the information from the morphological building index with the one from MSI. Ok et al. [19] proposed a novel fuzzy landscape generation method that models the directional spatial relationship of the building and its shadow for automatic building detection. These studies were based on traditional methods and focused on extracting buildings in a relatively small study region. However, the methods have not been evaluated in complex regions with a high diversity of buildings.
In recent years, deep learning methods have been broadly utilized in various remote sensing image–based applications, including object detection [2,3,20], scene classification [21,22], land cover, and land use mapping [23,24]. Since it was proposed in 2014, deep convolutional neural network (CNN)-based semantic segmentation algorithms [25] have been applied to many pixel-wise remote sensing image analysis tasks, such as road extraction, building extraction, urban land use classification, maritime semantic labeling, vehicle extraction, damage mapping, weed mapping, and other land cover mapping tasks [5,6,26,27,28,29,30,31]. Several recent studies used semantic segmentation methods for building extraction from remote sensing images [9,10,11,12,32,33,34,35,36,37,38]. For example, Shrestha et al. [10] proposed a fully connected network-based building extraction approach combined with the exponential linear unit (ELU) and conditional random fields (CRFs) using the Massachusetts building dataset. Lu et al. [32] employed the richer convolutional features network–based approach to detect building edges using the Massachusetts building dataset. Xu et al. [12] proposed a building extraction method based on the Res-U-Net model combined with guided filters using the ISPRS (International Society for Photogrammetry and Remote Sensing) 2D semantic labeling dataset. Sun et al. [7] proposed a building extraction method that combines the SegNet model with the active contour model using the ISPRS Potsdam dataset and the proposed Marion dataset. These existing studies demonstrated the excellent performance of the semantic segmentation algorithms for building extraction tasks.
As an essential part of the semantic segmentation algorithms, the public semantic labeling datasets used in previous state-of-the-art building extraction studies can be summarized as follows: (1) The Massachusetts building dataset [39] (used in References [10,32,35]) contains 151 aerial images (at 100 cm spatial resolution, with red/green/blue (RGB) bands, each with a size of 1500 × 1500 pixels) of the Boston area. (2) The ISPRS Vaihingen and Potsdam datasets [40] (used in References [7,12]) contain 38 image patches (at 5 cm resolution, each at a size of around 6000 × 6000 pixels) and 33 image patches (at 9 cm resolution, each with a size of around 2500 × 2500 pixels) with the near infrared, red, and green bands and the corresponding digital surface model (DEM) data. (3) The Inria dataset [41] (used in References [36,37]) contains aerial images covering 10 regions in the USA and Austria (at 30 cm resolution, with RGB bands). (4) The WHU (Wuhan University) building dataset [42] (used in Reference [38]) includes an aerial dataset containing 8189 image patches (at 30 cm resolution, with RGB bands, each with a size of 512 × 512 pixels) and a satellite dataset containing 17,388 image patches (at 270 cm resolution, with the same bands and size as the aerial dataset). (5) The AIRS (Aerial Imagery for Roof Segmentation) dataset [43] contains aerial images covering the area of Christchurch city in New Zealand (at 7.5 cm resolution, with RGB bands).
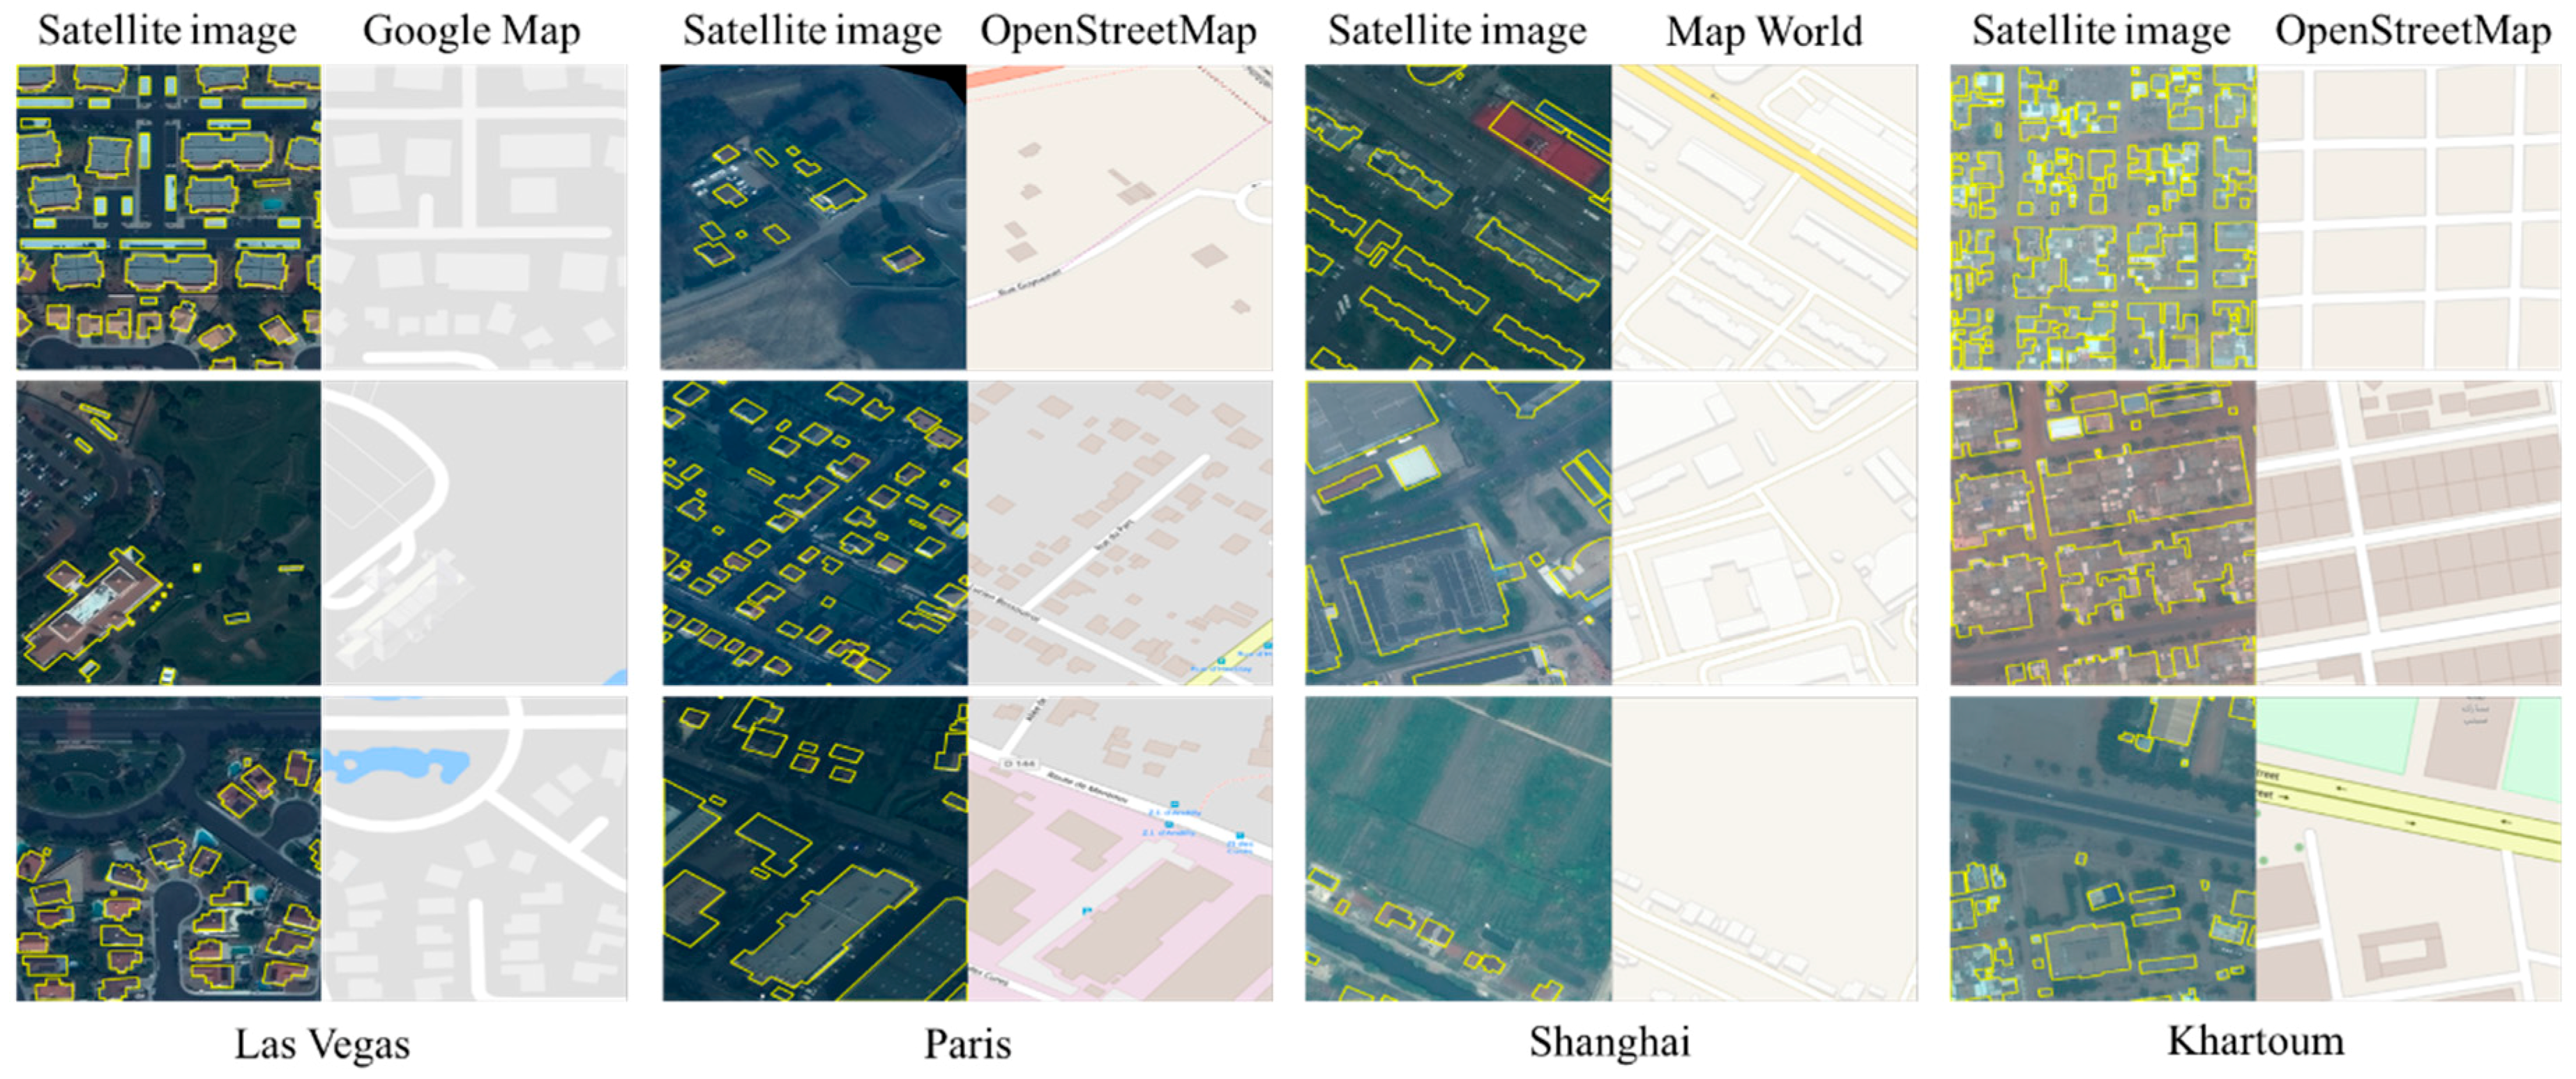
In this study, our proposed building extraction method is trained and evaluated based on the SpaceNet building dataset [44] proposed in 2017 and further explored in the 2018 DeepGlobe Satellite Image Understanding Challenge [11]. The SpaceNet building dataset provided in the DeepGlobe Challenge contains WorldView-3 multispectral imagery and the corresponding building footprints of four cities (Las Vegas, Paris, Shanghai, and Khartoum) located on four continents. The buildings in the SpaceNet dataset are much more diverse compared with the five datasets mentioned above. Details of the SpaceNet dataset are described in Section 2.
In addition, many studies employed data-fusion strategies that integrate different data to improve the building extraction results. Airborne light detection and ranging (LiDAR) data are among the most broadly utilized data in numerous building extraction studies [7,45,46,47,48,49,50,51,52,53]. For instance, Awrangjeb et al. [52] proposed a rule-based building roof extraction method from a combination of LiDAR data and multispectral imagery. Pan et al. [53] proposed a semantic segmentation network–based method for semantic labeling of the ISPRS dataset using high-resolution aerial images and LiDAR data. However, public and free LiDAR datasets are still very limited. On the other hand, GIS data (e.g., OpenStreetMap) has been utilized in several building extraction and semantic labeling studies [54,55,56,57] as either the reference map of the labeled datasets [54,55] or auxiliary data combined with satellite images [56,57]. For instance, Audebert [56] investigated different ways of integrating OpenStreetMap data and semantic segmentation networks for semantic labeling of aerial and satellite images. Du et al. [57] proposed an improved random forest method for semantic classification of urban buildings, which combines high-resolution images with GIS data. Nevertheless, OpenStreetMap data still cannot provide enough building information for many places in the world, including the selected regions in Las Vegas, Shanghai, and Khartoum of the SpaceNet building dataset used in our study.
In this research, we propose a semantic segmentation–based building footprint extraction method using the SpaceNet building dataset provided in the CVPR 2018 DeepGlobe Satellite Challenge. Several public GIS map datasets (OpenStreetMap [58], Google Maps [59], and MapWorld [60]) are integrated with the provided WorldView-3 satellite datasets to improve the building extraction results. The proposed method obtains an overall F1-score of 0.704 for the validation dataset, which achieved fifth place in the DeepGlobe Building Extraction Challenge. Our main contributions can be summarized as follows:
(1) To the best of our knowledge, this is the first attempt conducted to explore the combination of multisource GIS map datasets and multispectral satellite images for building footprint extraction in four cities that demonstrates great potential for reducing extraction confusion caused by overlapping objects and improving the extraction of building outlines.
(2) We propose a U-Net–based semantic segmentation model for building footprint extraction. Several strategies (data augmentation, post-processing, and integration of GIS map data and satellite images) are designed and combined with the semantic segmentation model, which increases the F1-score of the standard U-Net–based method by 3.0% to 9.2%.
(3) The effect of each proposed strategy, the final building footprint extraction results, and the potential causes are analyzed comprehensively based on the actual situation of four cities. Even compared with the top three solutions in the SpaceNet Building Detection Competition, our proposed method improves the total F1-score by 1.1%, 6.1%, and 12.5%.
The rest of the paper is organized as follows. Section 2 introduces the study area and the datasets of this research, including the SpaceNet building dataset provided in the DeepGlobe Challenge and the auxiliary GIS map data. Section 3 introduces our proposed method, including data preparation and augmentation, the semantic segmentation model for building footprint extraction, and the integration and post-processing of results. Section 4 describes the building footprint extraction results of the proposed method. Section 5 discusses and analyzes the building footprint extraction results obtained from different methods and proposed strategies, and the potential causes for each city. Section 6 summarizes the conclusions of this research.

2. Study Area and Datasets

2.1. SpaceNet Building Dataset Provided in the DeepGlobe Challenge

In this research, we used the SpaceNet building dataset provided in the CVPR 2018 DeepGlobe Satellite Challenge. The study area of this dataset includes four cities (Las Vegas, Paris, Shanghai, and Khartoum), which covers both urban and suburban regions. The whole labeled dataset contains 24,586 image scenes in which each has a size of 200 m × 200 m. A total of 302,701 building footprint polygons were fully annotated in the whole study area by a GIS team at the DigitalGlobe. In the DeepGlobe challenge, a total of 10,593 image scenes were publicly provided with labeled files (in geojson format). For the other image scenes, the labeled files were not published in the challenge and the prediction results could only be evaluated during the challenge. Thus, we selected the 10,593 image scenes with labeled files as the dataset for this study. Table 1 shows the number of image scenes and annotated building footprint polygons of each city. The image scenes of each city were further divided randomly into 70% training samples and 30% validation samples for training and evaluation of the proposed method.
The source dataset of this study is WorldView-3 satellite imagery, including the original single-band panchromatic imagery (0.3 m resolution, 650 pixels × 650 pixels), the 8-band multi-spectral imagery (1.24 m resolution, 163 pixels × 163 pixels), and the Pan-sharpened 3-band RGB and 8-band multispectral imagery (0.3 m resolution, 650 pixels × 650 pixels). We selected the Pan-sharpened 8-band multispectral imagery as the satellite dataset for our proposed method. The annotation dataset contains a summary file of the spatial coordinates of all annotated building footprint polygons and geojson files corresponding to each image scene. These files were converted into single-band binary images as the labeled dataset for our proposed method, in which values of 0 and 1 indicate that pixels belong to nonbuilding and building areas, respectively. In the SpaceNet building dataset provided in the DeepGlobe Challenge, small building polygons with an area equal to or smaller than 20 pixels were discarded because these were actually artifacts generated from the image tiling process (e.g., one building divided into multiple parts by a tile boundary). Examples of the satellite images and annotated building footprints can be found in Figure 1.

2.2. Auxiliary Data Used in Our Proposed Method

Besides the multispectral satellite imagery, we also used several public GIS map datasets as the auxiliary data for our proposed method because of the extra useful information they provide for building footprint extractions. Contrary to previous studies that used single-source auxiliary GIS data, we selected the map dataset with the most abundant information from several public GIS map datasets for each city. For Las Vegas, we selected the Google Maps dataset [59], which contains more information than the OpenStreetMap [58]. For Paris, we selected the popular OpenStreetMap dataset because of its abundant information. For Shanghai, we selected the MapWorld dataset [60] because it contains abundant information on buildings and there is no coordinate shifting between that dataset and the satellite imagery. For Khartoum, we selected the OpenStreetMap dataset, which is slightly more informative than the Google Maps dataset but still lacks building information for most areas. All of the map datasets were collected in a raster image format, according to the geospatial information of their corresponding satellite images (i.e., longitude, latitude, and spatial resolution) and resized into 650 × 650 pixels for further integration with the satellite imagery. Examples of the multi-source GIS map images and corresponding satellite images can be found in Figure 1.

3. Materials and Methods

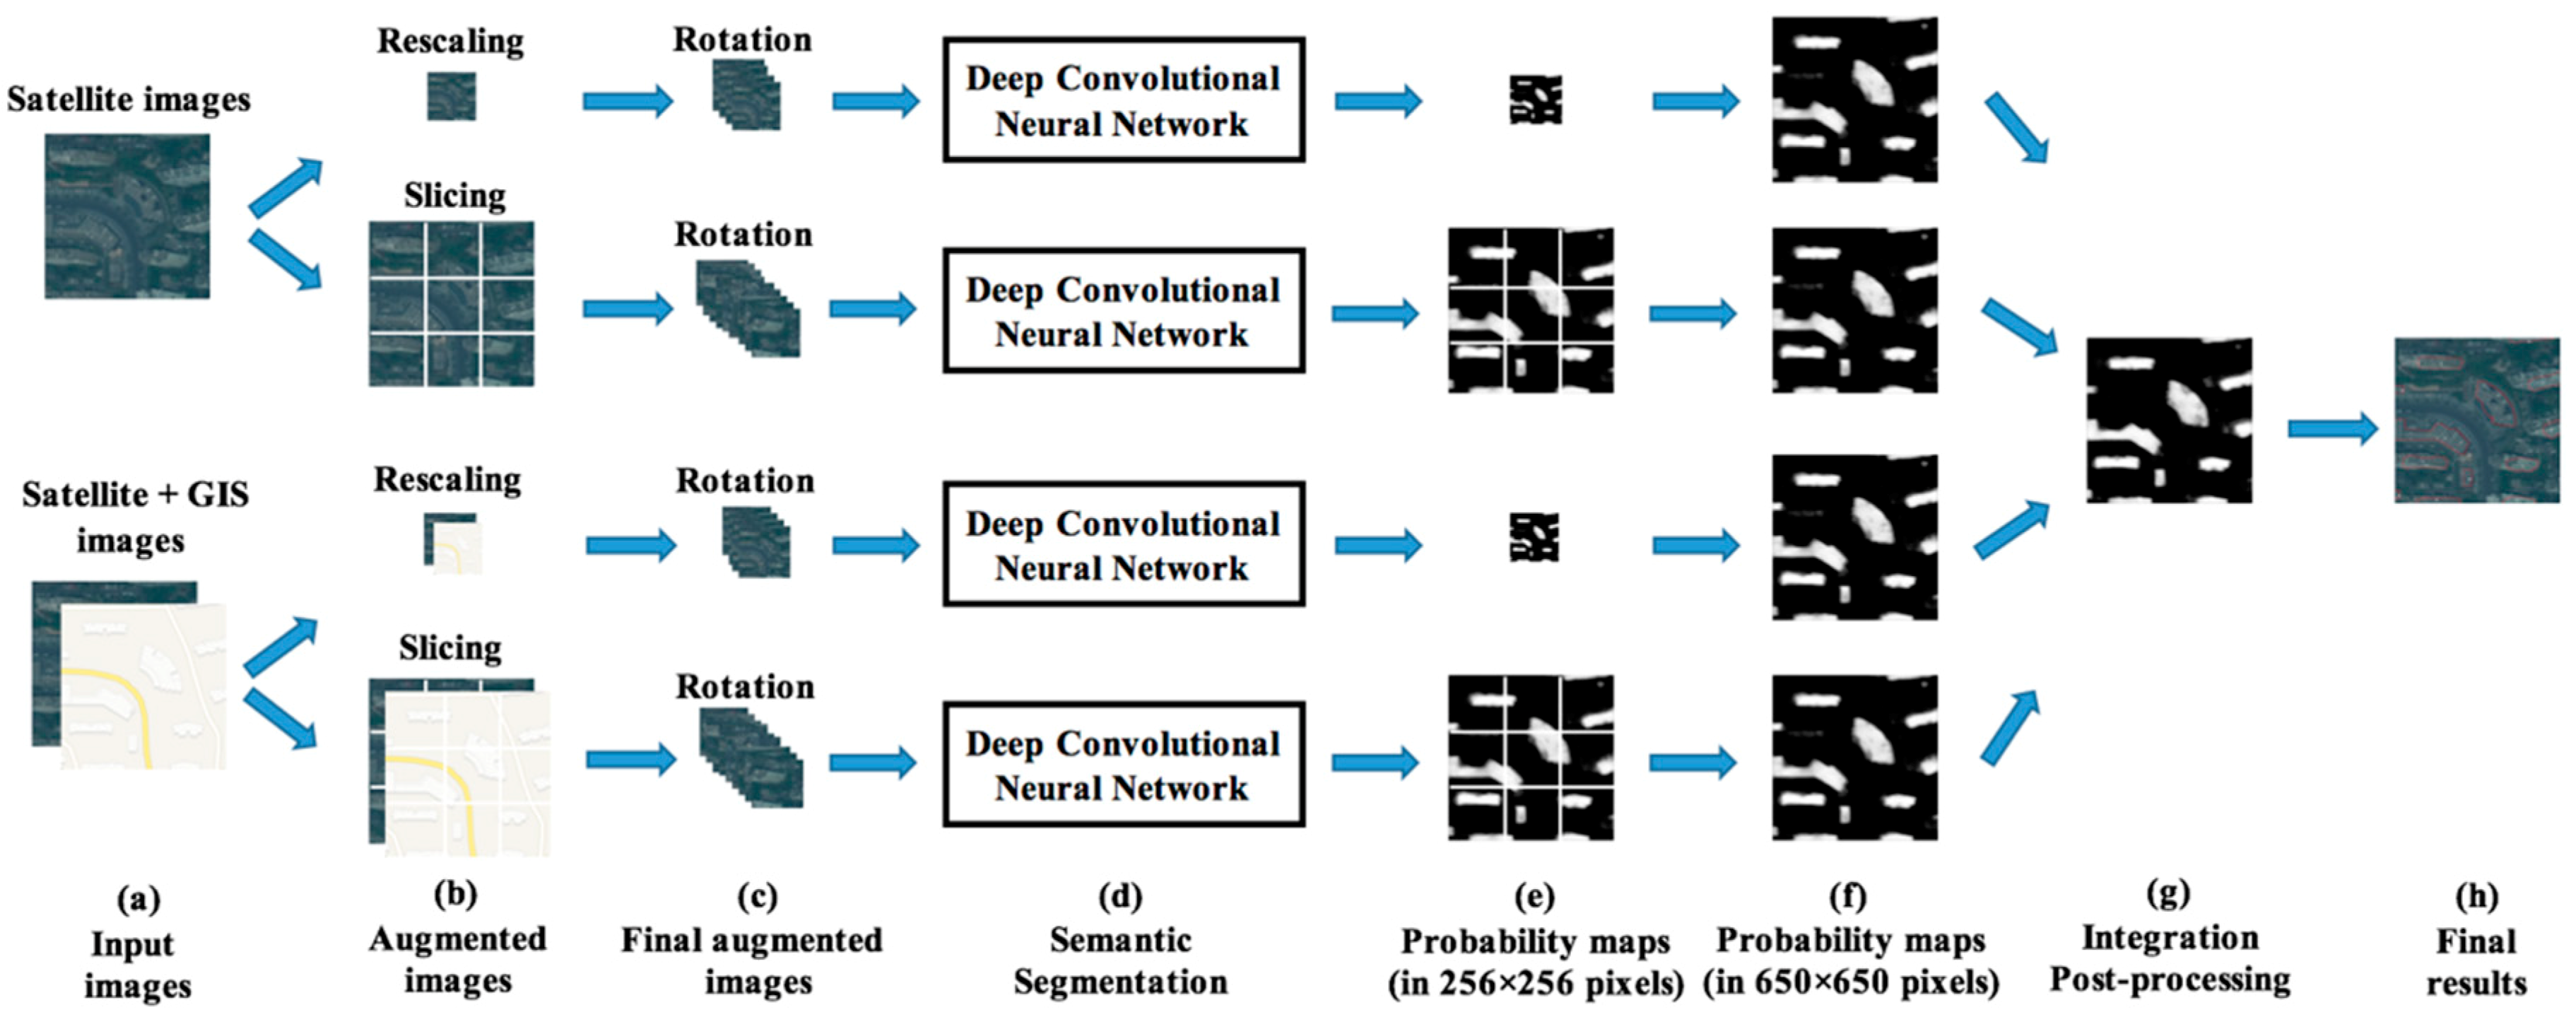
In this study, we designed a semantic segmentation–based approach for building footprint extraction. Figure 2 shows the overall flowchart of the proposed approach. It consists of 3 main stages including data preparation and augmentation, semantic segmentation for building footprint extraction, and integration and post-processing of results. In the first stage, we designed a data fusion method to make full use of both the satellite images and the extra information of GIS map data. We applied data augmentation (rescaling, slicing, and rotation) to our dataset in order to avoid potential problems (e.g., overfitting), which resulted from insufficient training samples, and to improve the generalization ability of the model. In the second stage, we trained and evaluated the U-Net–based semantic segmentation model, which is widely used in many remote sensing image segmentation studies. In the third stage, we applied the integration and post-processing strategies for further refinement of the building extraction results. Details of each stage are described in the following sections.

3.1. Data Preparation and Augmentation

3.1.1. Integration of Satellite Data and GIS Map Data

As mentioned in Section 2, besides the WorldView-3 multispectral satellite imagery provided in the SpaceNet dataset, we also used multiple public GIS map datasets as the auxiliary data for our proposed method. Although these public GIS map datasets provide extra information for building footprint extraction, it is unreasonable to train a separate deep neural network using the 3-band map datasets. The main reason is that many buildings are not displayed on the map image (especially tiny buildings and those in Khartoum city). In many regions, the building areas or outlines displayed in map images are not consistent with the ground truth buildings annotated based on the satellite images.
In this research, the training and validation datasets were preprocessed into two collections for each city. The first collection contained the eight-band multi-spectral satellite images while the second collection integrated the multi-spectral satellite images and the GIS map dataset. In order to unify the structure of the semantic segmentation network for the 2 dataset collections and enable the model trained by one dataset collection to be used as the pre-trained model for the other, we stacked the first 5 bands (red, red edge, coastal, blue, and green) of each WorldView-3 satellite image with the 3 bands (red, green, and blue) of its corresponding map image to generate an 8-band integrated image.

3.1.2. Data Augmentation

Data augmentation was proven to be an effective strategy to avoid potential problems (e.g., overfitting) resulting from insufficient training samples and to improve the generalization ability of deep learning models in many previous studies [9,10,32]. Considering the large number of hyper-parameters in the semantic segmentation model and the relatively small number of training samples in the SpaceNet building dataset (fewer than 5000 samples for each city), we applied the following data augmentation strategy (rescaling, slicing, and rotation) in order to increase the quantity and diversity of training samples and semantic segmentation models. Each dataset collection described in Section 3.1.1 was further preprocessed into 2 formats of input images for the training of each semantic segmentation model. First, each image with a size of 650 × 650 pixels was rescaled into an image of 256 × 256 pixels. Second, each image with a size of 650 × 650 pixels was sliced into 3 × 3 sub-images of 256 × 256 pixels. Moreover, we further augmented the training dataset through four 90° rotations. Consequently, we obtained 4 collections of preprocessed and augmented input datasets for each city, which we used for training and evaluating each deep convolutional neural network.

3.2. Semantic Segmentation Model for Building Footprint Extraction

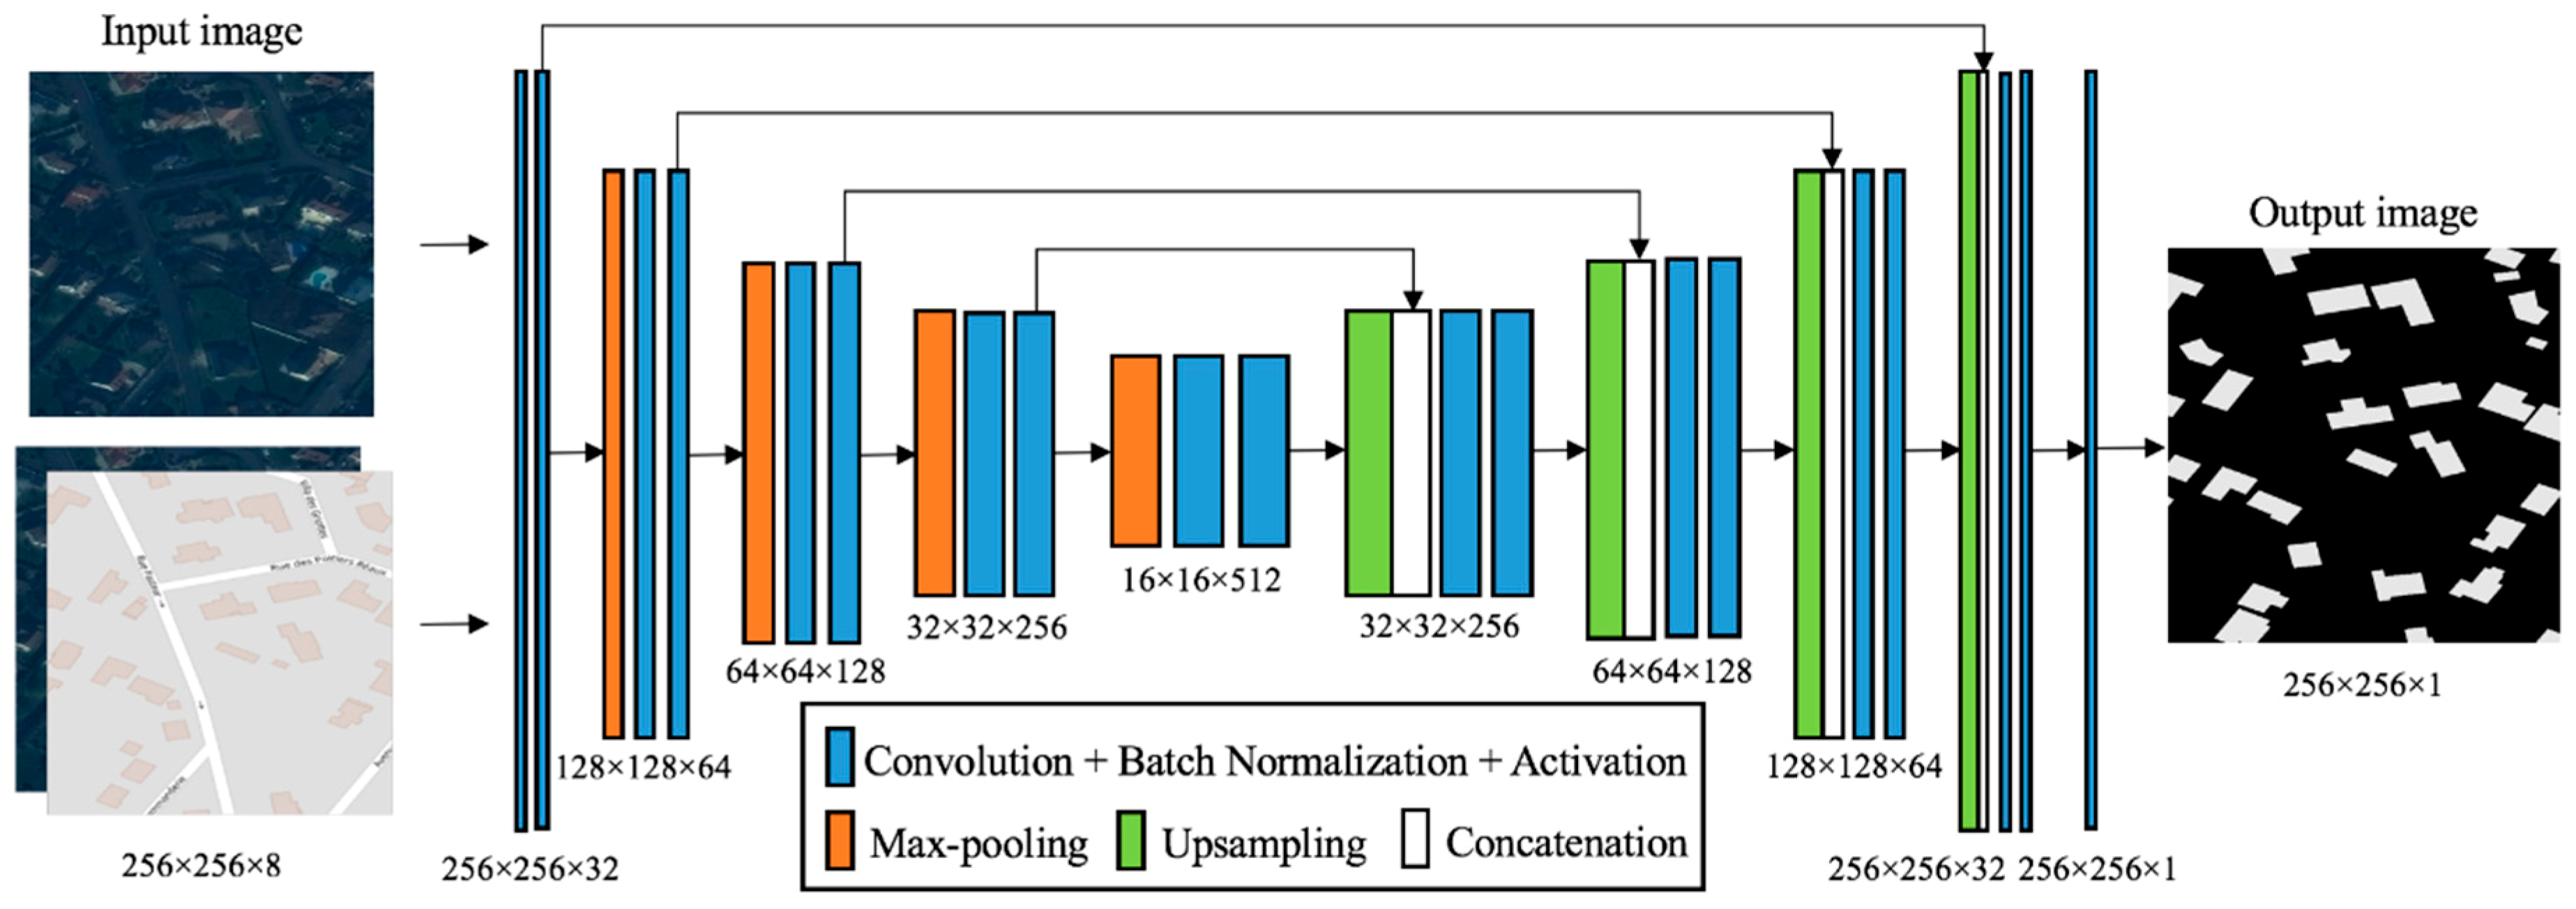
3.2.1. Architecture of Semantic Segmentation Model for the Building Extraction

In this study, the semantic segmentation model for the building extraction is based on the U-Net architecture [61]. U-Net is a popular deep convolutional neural network architecture for semantic segmentation and has been used in several satellite image segmentation studies [5,12,30,62]. Since U-Net was initially designed for the binary segmentation of biomedical images with a relatively small number of training samples, it is a good choice for the building extraction task in this study as well. We modified the size of layers in the U-Net architecture to fit our building extraction task. We also added a batch normalization layer behind each convolutional layer.
Figure 3 shows the architecture of the semantic segmentation model for our building extraction task, including the name and size of each layer. It consists of the following 6 parts: (1) the convolutional layers for feature extraction through multiple 3 × 3 convolution kernels (denoted by Convolution); (2) the batch normalization layer for accelerating convergence during the training phase (denoted by Batch Normalization); (3) the activation function layer for nonlinear transformation of the feature maps, in which we used the widely used rectified linear unit (ReLU) in this study (denoted by Activation); (4) the max-pooling layer for downsampling of the feature maps (denoted by Max-pooling); (5) the upsampling layer for recovering the size of the feature maps that are downsampled by the max-pooling layer (denoted by Upsampling); and (6) the concatenation layer for combining the upsampled feature map in deep layers with the corresponding feature map from shallow layers (denoted by Concatenation).
For the last batch-normalized layer of the semantic segmentation model (in the same size as the input image), we applied the sigmoid function as the activation function layer and obtained the pixel-wise probability map (indicating the probability that a pixel belonged to the building type). Lastly, we binarized the probability map using a given threshold (0.5 in common cases) to obtain the predicted building footprint extraction result (the output of the semantic segmentation network), and vectorized the output image to obtain a list of predicted building polygons.

3.2.2. Training and Evaluation of Semantic Segmentation Model

To train the semantic segmentation model, we selected Adam as the optimization method and the binary cross entropy as the loss function. Due to the limited size of GPU memory, the batch size in the training phase was set to 8 in this study. The learning rate was set to 0.001 and the maximum number of epochs was set to 100. Moreover, we monitored the average Jaccard coefficient as an indicator for early stopping in order to avoid the potential problem of overfitting. Formula (1) shows the calculation process of the average Jaccard coefficient (denoted by J), in which y gt ( i ) denotes the ground truth label of the i th pixel, y pred ( i ) denotes the predicted label of the i th pixel, and n denotes the total number of pixels. The training phase was terminated before reaching the maximum number of epochs if the average Jaccard coefficient had no improvement for more than 10 epochs.
J = 1 n i = 1 n ( y gt ( i )   ×   y pred ( i )   /   ( y gt ( i ) + y pred ( i ) y gt ( i )   ×   y pred ( i ) ) )
During the training phase, the semantic segmentation model was evaluated by the validation dataset at the end of each epoch. Besides the pixel-based accuracy that is commonly used in semantic segmentation tasks, we also recorded the object-based accuracy of the validation dataset in each epoch since it was the evaluation metric of the DeepGlobe challenge. For pixel-based accuracy, we compared the binarized building extraction image results predicted from the semantic segmentation model with the rasterized ground truth image. For object-based accuracy, we compared the vectorized building extraction image results (a list of predicted building polygons) with the ground truth building polygons (details are described in Section 3.4). As described in Section 3.1, for each city, 4 preprocessed and augmented dataset collections were used for the training and evaluation of the semantic segmentation model. For each dataset collection, the predicted building extraction results with the highest object-based accuracy were used for further integration and post-processing, which is described in the following section.

3.3. Integration and Post-Processing of Results

After training and evaluating the semantic segmentation model based on each of the 4 dataset collections, we obtained 4 groups of probability maps (each with a size of 256 × 256 pixels) for each validation sample. The value of each pixel in the probability map indicates the predicted probability that the pixel belongs to the building area. For each validation sample, the 4 groups of probability maps were obtained from (1) the satellite image with a rescaling strategy, (2) the satellite image with a slicing strategy, (3) the satellite + map image with a rescaling strategy, and (4) the satellite + map image with a slicing strategy, respectively. For the first and third groups, we rescaled the single probability map into the one at the original sample size. For the second and fourth groups, we combined 9 probability maps into a single map corresponding to the complete image. As a result, we obtained 4 probability maps (each with a size of 650 × 650 pixels) for each validation sample.
We proposed a 2-level integration strategy for integrating the results obtained from each model into the final building footprint extraction results. At the first level, for both the satellite and satellite + map image–based dataset collections, we averaged the pixel values of 2 probability maps (obtained from 2 preprocessing methods) into an integrated probability map. At the second level, the 2 integrated probability maps (obtained from the 2 dataset collections) were further averaged into the final building probability map.
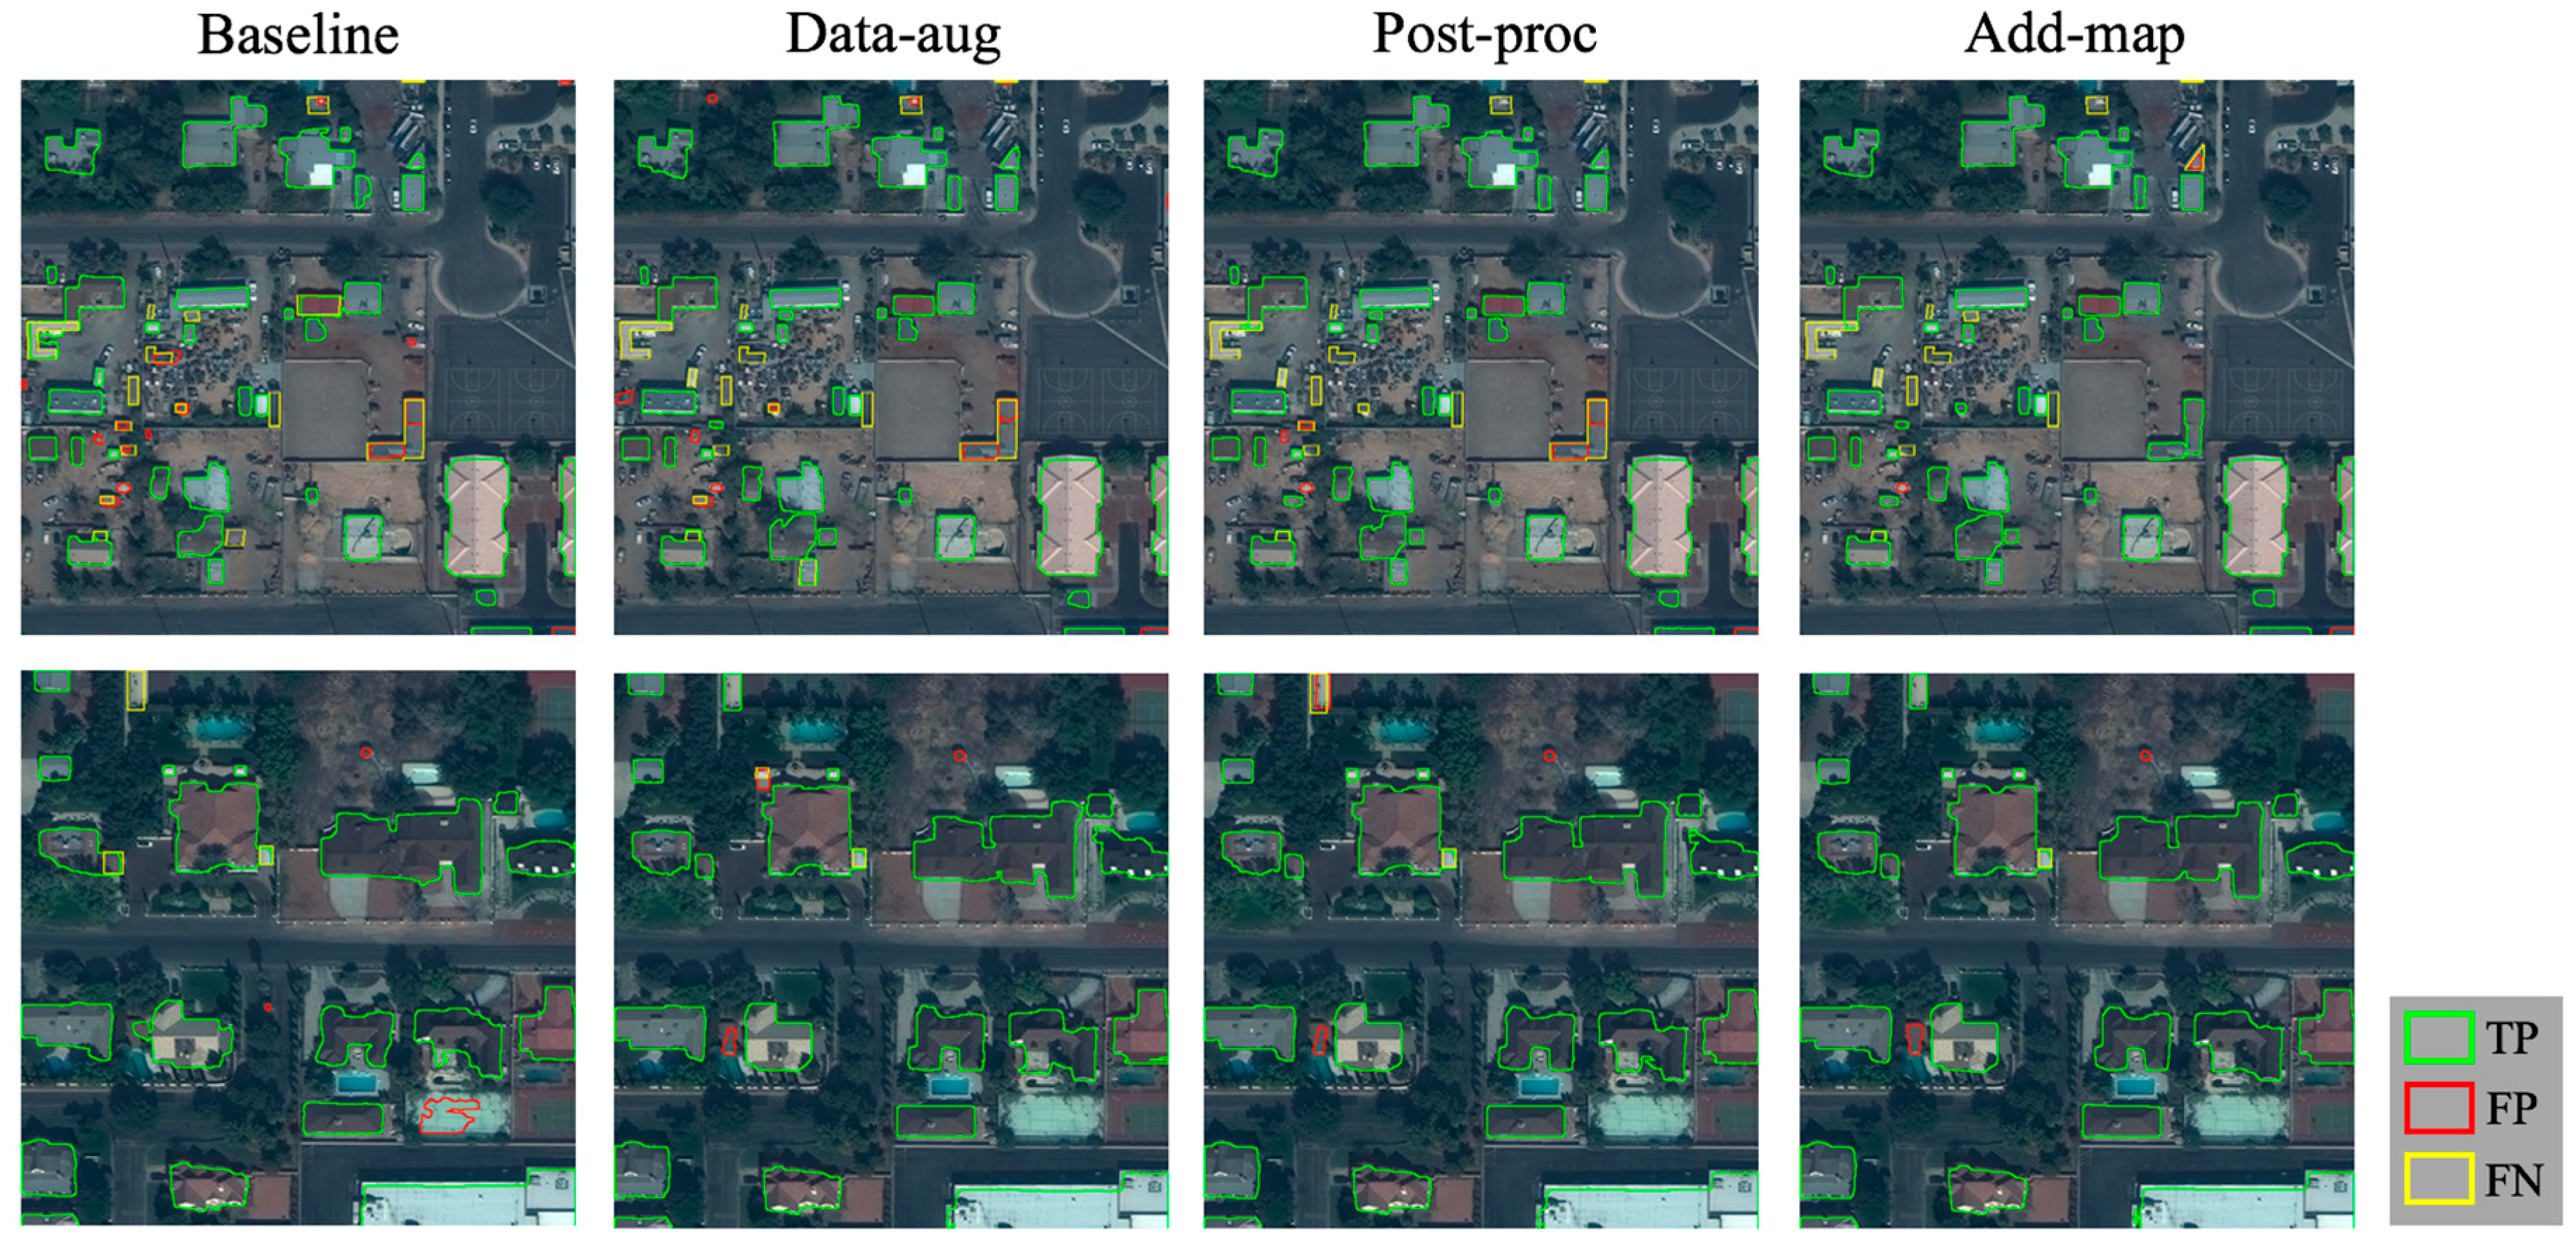
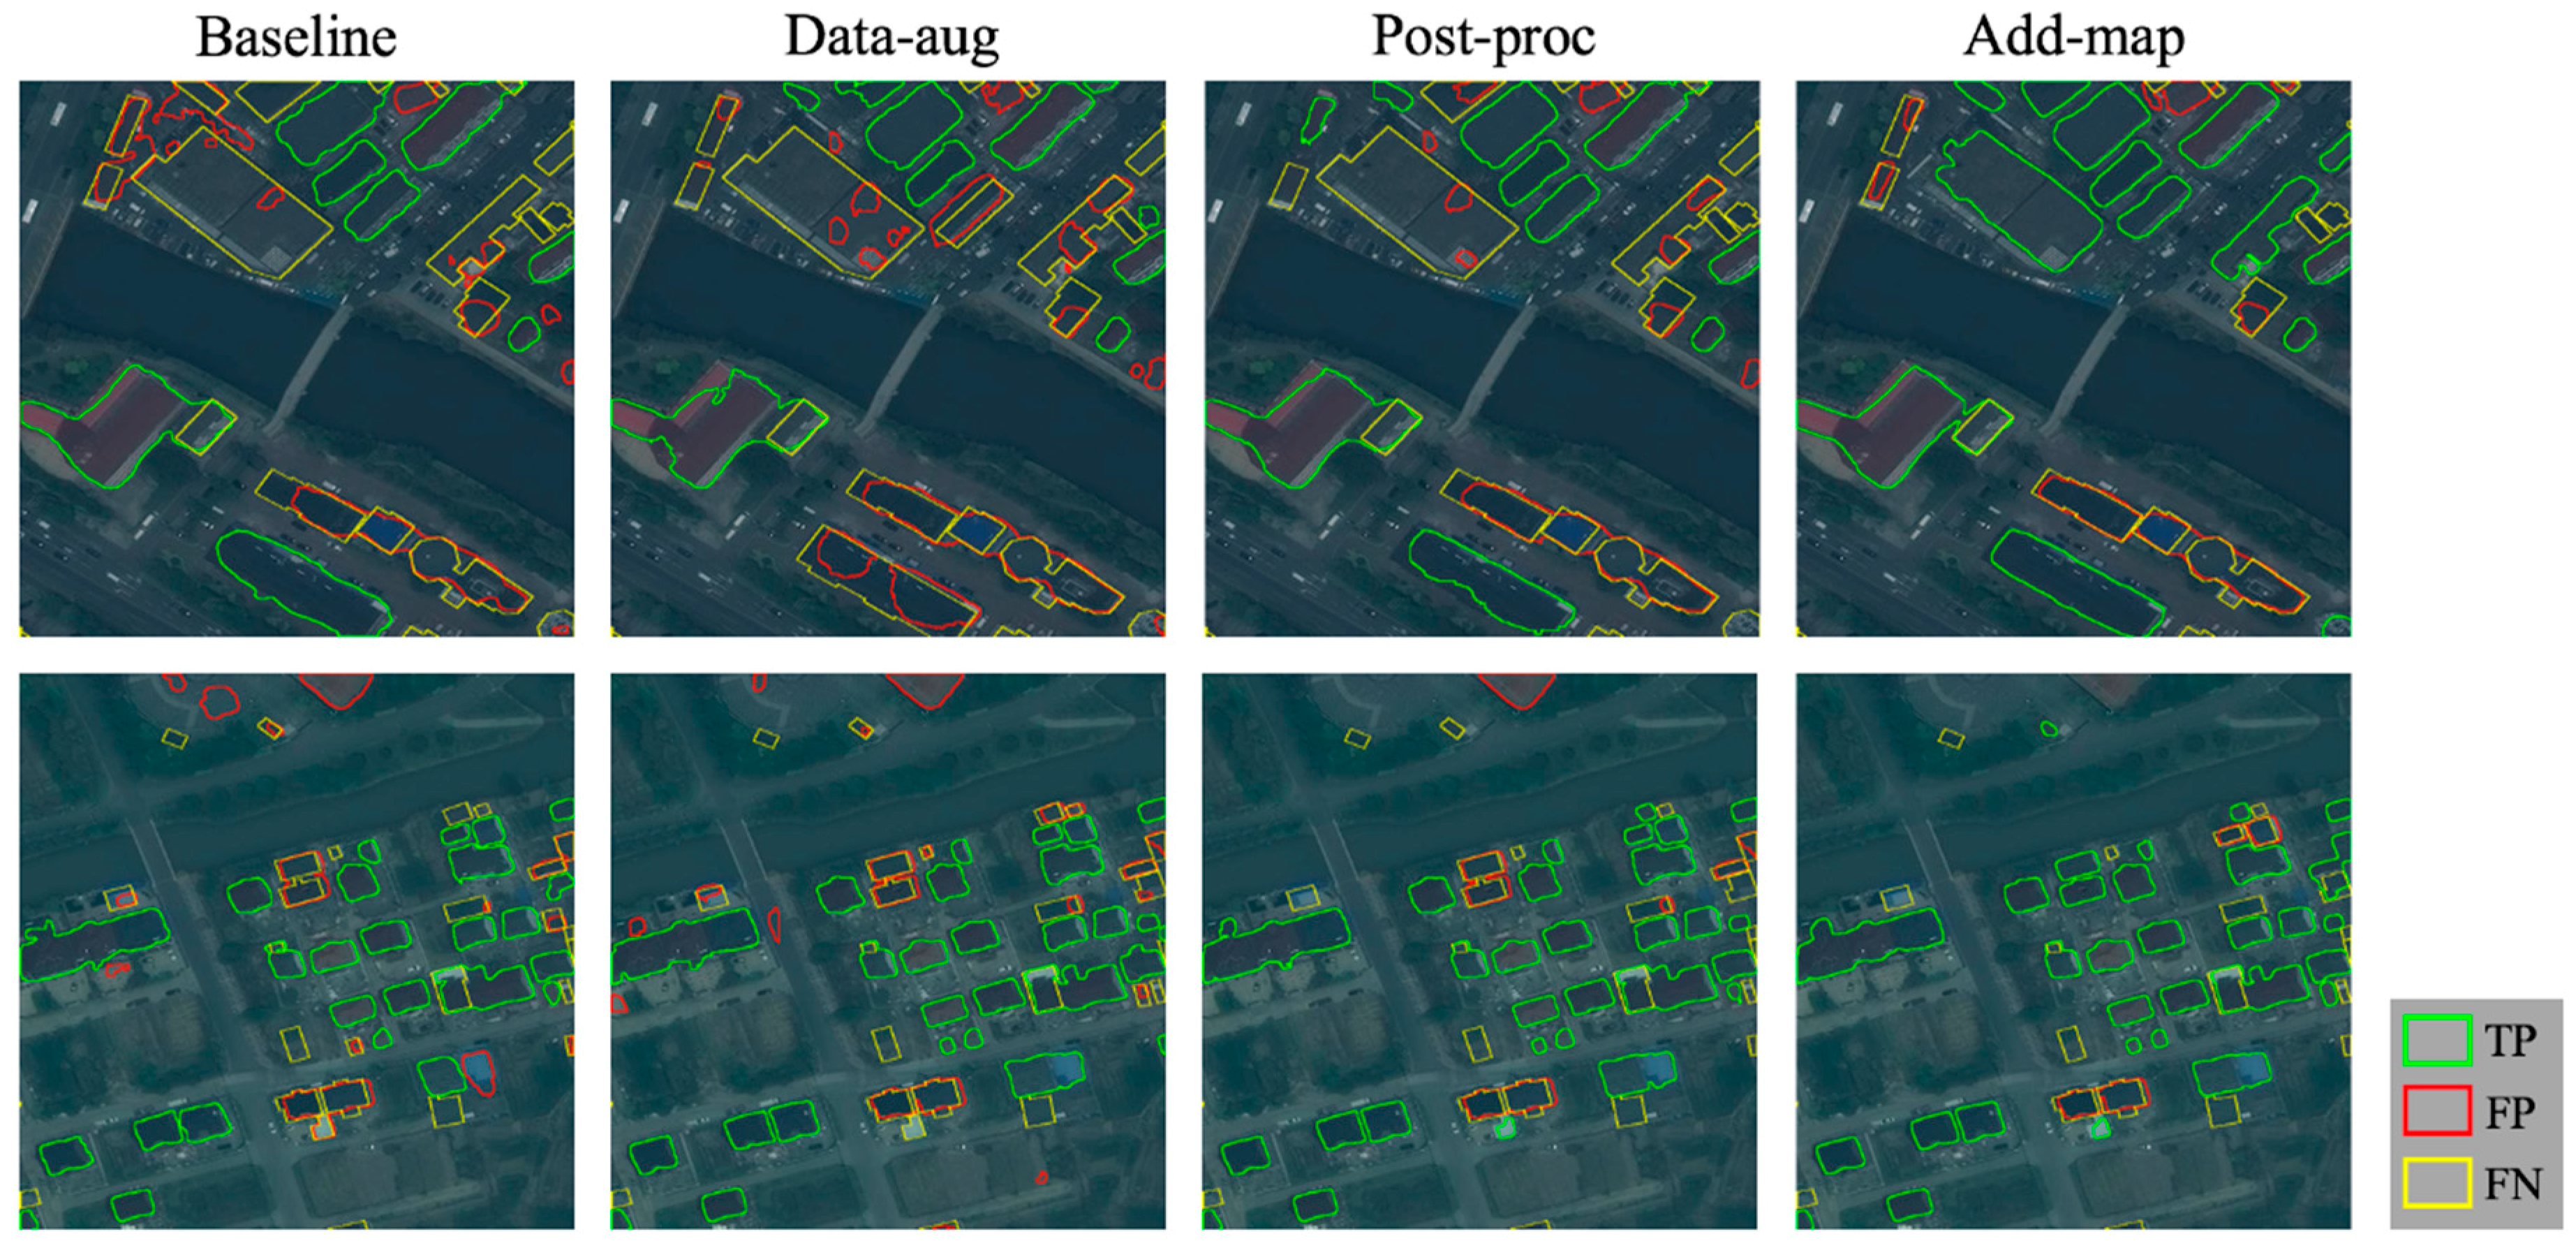
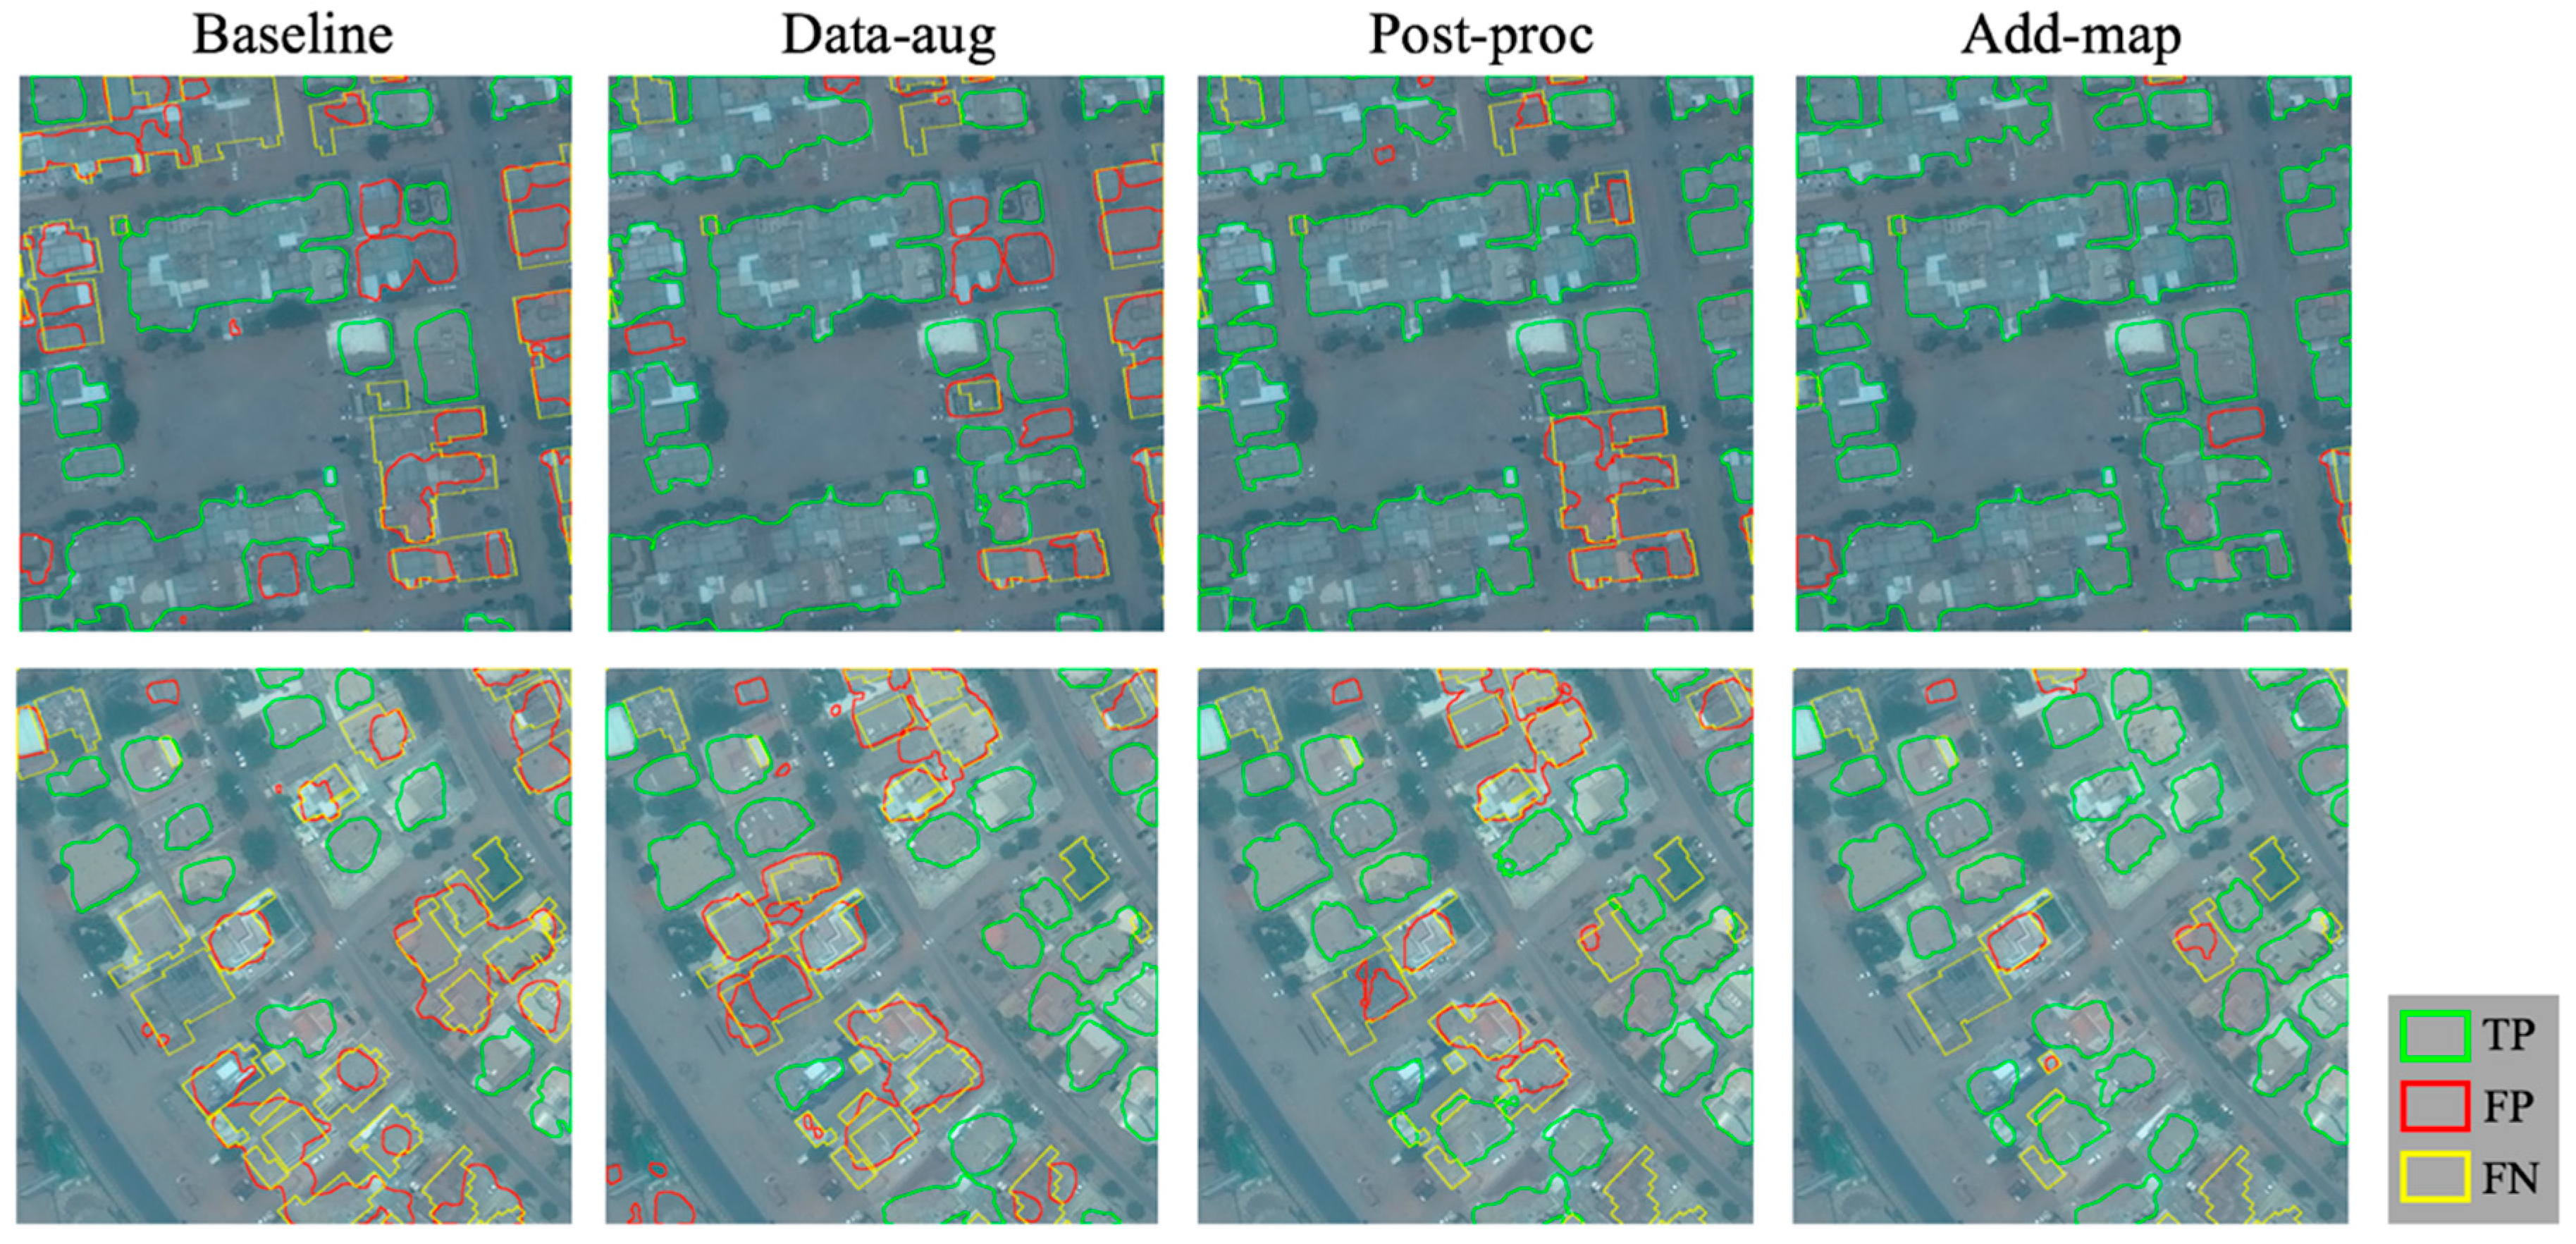
After obtaining the integrated building probability map, we applied 2 post-processing strategies to optimize the final predicted results. In the first strategy, we adjusted the threshold of the probability (indicating whether a pixel belongs to a building area or a nonbuilding area) from 0.45 to 0.55 for each city. The optimized probability threshold was then used for vectorizing the probability map into the binary building extraction image result. In the second strategy, in order to filter out potential noise in the building extraction image results, we adjusted the threshold of the polygon size (indicating the minimal possible size of a building polygon) from 90 to 240 pixels for each city. The optimized thresholds of probability and polygon size of the validation dataset were also applied to the test dataset for each city.

3.4. Evaluation Metric

The building extraction results can be evaluated by several methods including the pixel-based and object-based methods that are the most broadly used in existing building extraction studies [7,63]. In the pixel-based evaluation method (used in References [9,10,12]), the binary building extraction image result (predicted from the semantic segmentation network) is directly compared with the binary ground truth image. In the object-based evaluation method (often used in building edge or footprint detection studies, such as in Reference [32]), the building extraction image result needs to be converted into the predicted building polygons for comparison with the ground truth building polygons. The DeepGlobe challenge selected the object-based method to evaluate the building footprint extraction results. Compared with the pixel-based method, the object-based method emphasizes not only the importance of accurate detection of building areas, but also the complete identification of building outlines.
In the DeepGlobe challenge, the ground truth dataset for evaluating building extraction results contained the spatial coordinates of the vertices corresponding to each annotated building footprint polygon. Thus, we needed to convert the single-band building extraction image results (the output of the semantic segmentation network) into a list of building polygons (in the same format as the ground truth dataset). Formula (2) shows the definition of the IoU (intersection over union) for evaluating whether a detected building polygon is accurate, which is equal to the intersection area of a detected building polygon (denoted by A) and a ground truth building polygon (denoted by B) divided by the union area of A and B. If a detected building polygon intersects with more than one ground truth building polygon, then the ground truth building with the highest IoU value will be selected.
I o U =   A r e a ( A B )   A r e a ( A B )
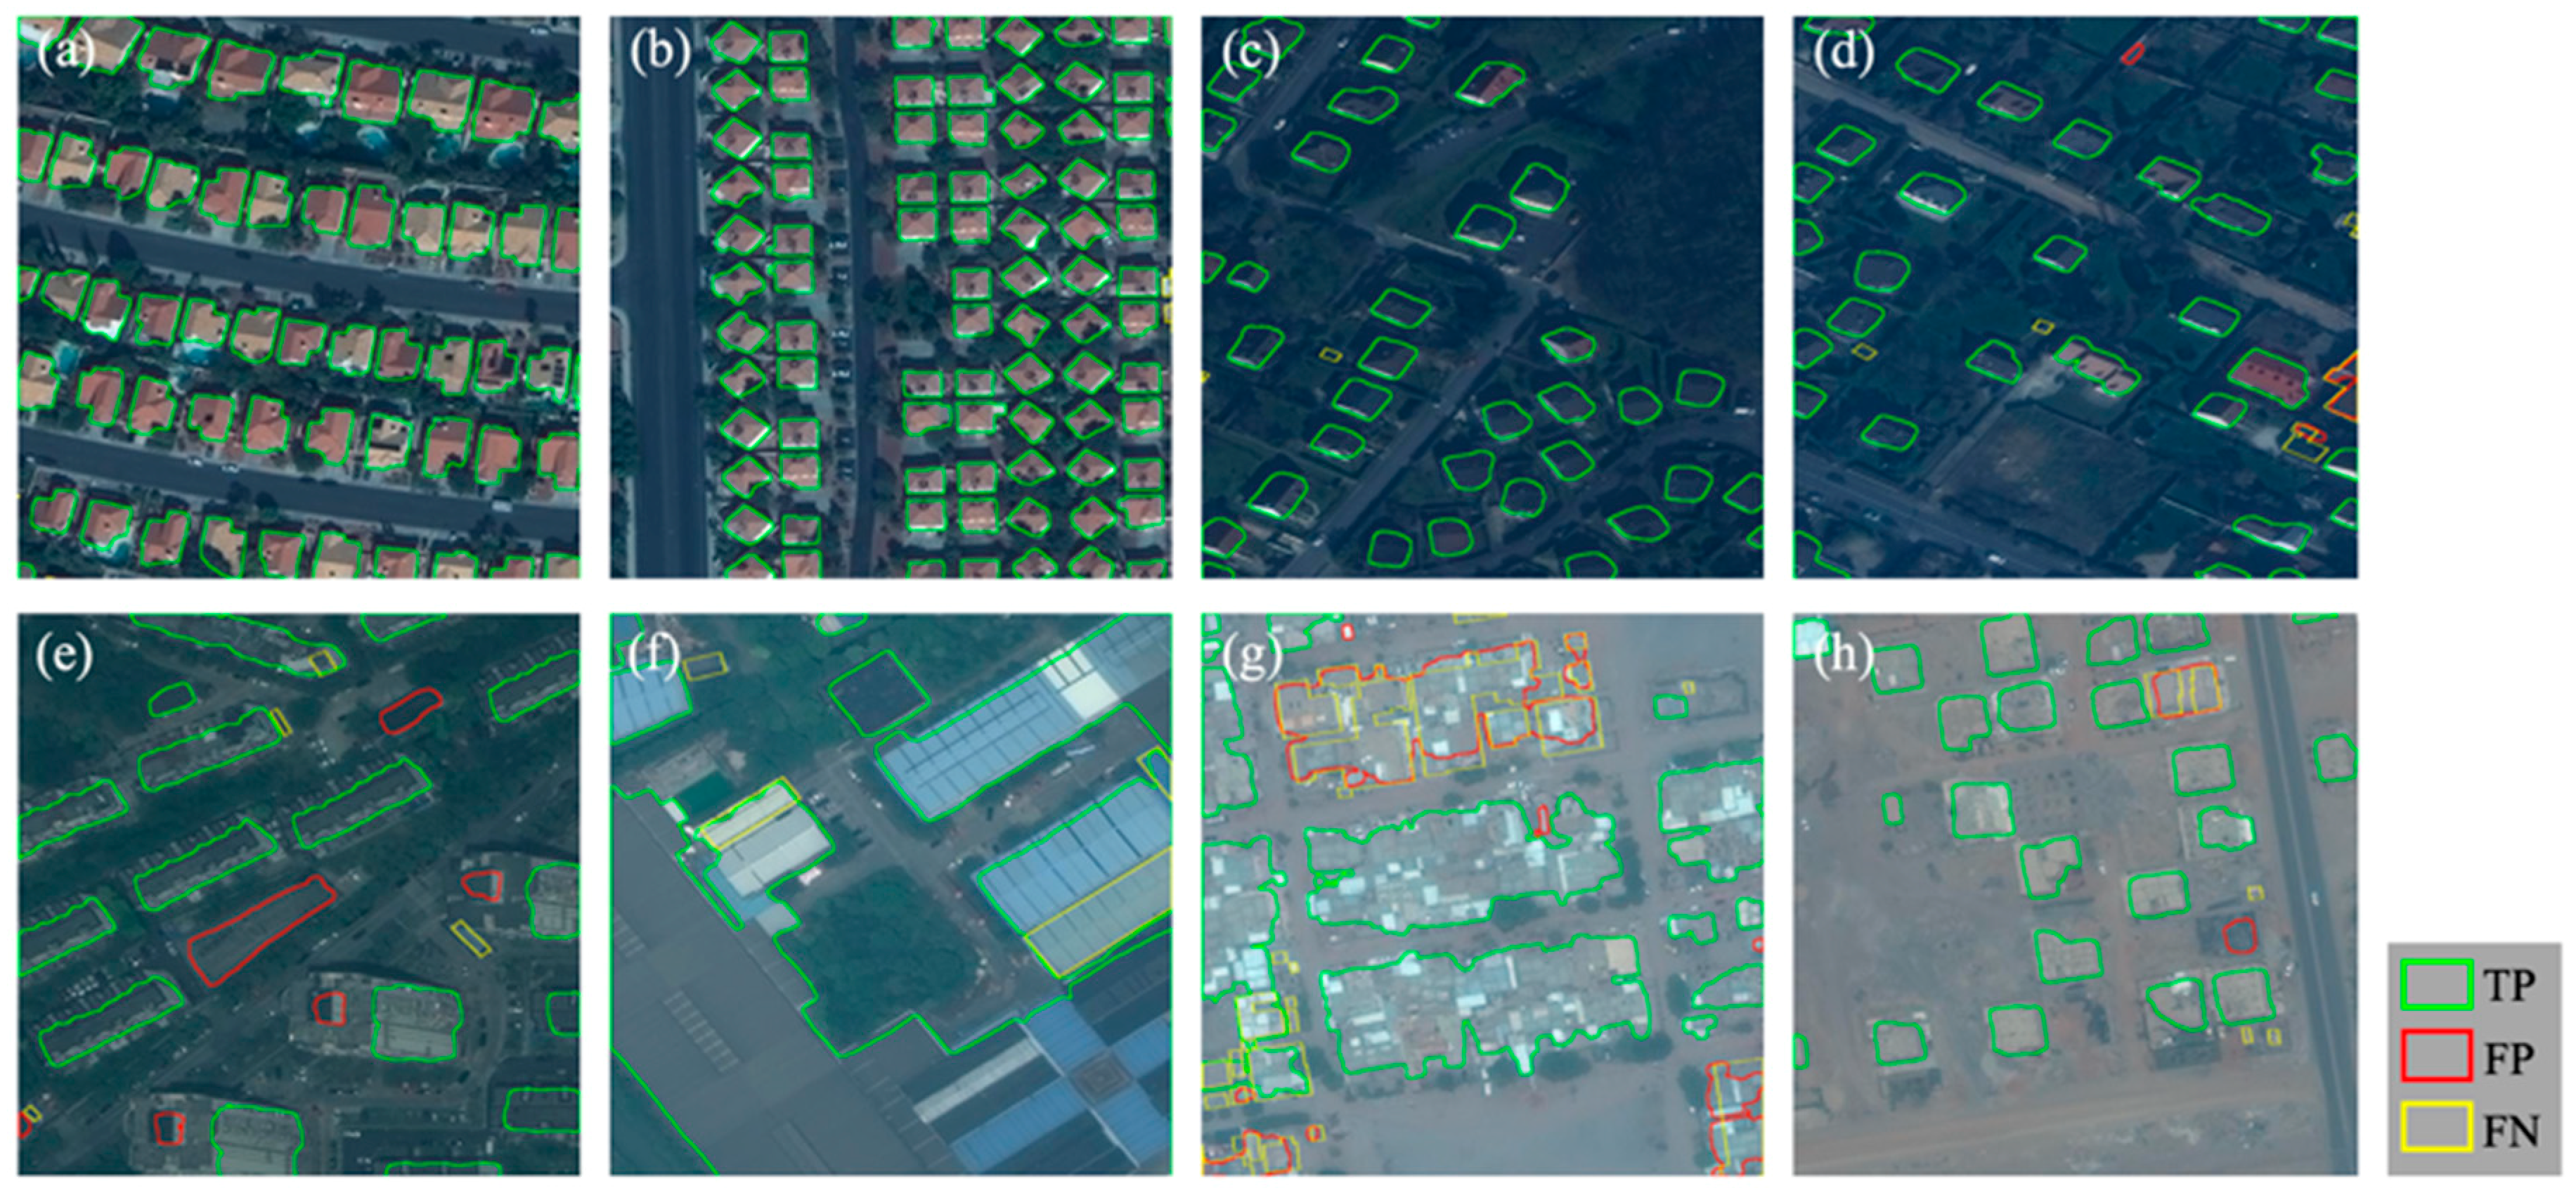
The precision, recall, and F1-score were calculated according to Formulas (3)–(5), where true positive (TP) indicates the number of building polygons that are detected correctly, false positive (FP) indicates the number of other objects that are detected as building polygons by mistake, and false negative (FN) indicates the number of building polygons not detected. A building polygon will be scored as correctly detected if the IoU between the detected building polygon and a ground truth building polygon is larger than 0.5. The results of each city were evaluated independently and the final F1-score is the average value of F1-scores for each city.
P r e c i s i o n =   T P   T P + F P
R e c a l l =   T P   T P + F N
F 1 - s c o r e =   2   ×   P r e c i s i o n   ×   R e c a l l   ( P r e c i s i o n + R e c a l l ) =   2   ×   T P   ( 2   ×   T P + F P + F N )

4. Experimental Results Analysis

4.1. Experiment Setting and Semantic Segmentation Results

In this study, training and evaluation of the semantic segmentation network was based on the Keras deep learning framework [64] and the NVIDIA Titan V GPU hardware platform. The image scenes of each city were randomly divided into 70% training samples and 30% validation samples for the semantic segmentation networks. The number of training and validation samples for each city can be found in Table 2. Considering the significant differences between the four cities, the semantic segmentation network of each city was trained and evaluated independently based on its own training and validation samples.
As shown in Figure 2, the semantic segmentation networks were trained and evaluated based on four dataset collections for each city: the original satellite dataset (Satellite-org), the augmented satellite dataset (Satellite-aug), the original satellite dataset combined with the GIS map dataset (Satellite-Map-org), and the augmented satellite dataset combined with the GIS map dataset (Satellite-Map-aug). Table 3 shows the validation accuracies of the semantic segmentation network in four cities when using different types of datasets. We find that the validation accuracies of the four cities are all over 93% and vary slightly among the cities and the types of datasets, which indicates accurate detection of building areas of the semantic segmentation network. Moreover, the average validation accuracy of the four cities is the highest when using the augmented satellite dataset combined with the GIS map dataset (Satellite-Map-aug). The evaluation of the building footprint extraction results is described in Section 4.2.

4.2. Building Footprint Extraction Results of the Proposed Method

Table 4 shows the building footprint extraction results of the proposed method evaluated by the validation dataset in the four cities in terms of TP, FP, FN, precision, recall, and the F1-score. There are significant differences between the results in different cities. Our method obtains the highest F1-score of 0.8911 for Las Vegas and the lowest F1-score of 0.5415 for Khartoum. Table 5 shows the results of our proposed method in the final phase of the CVPR 2018 DeepGlobe Satellite Challenge, which are evaluated by an unlabeled dataset selected from other regions in the four cities. The evaluation results in the final phase can only be seen through the online submission, and each team has only five submission chances. The experimental results demonstrate that our proposed method achieves similar F1-scores for the validation dataset and the dataset provided in the final phase. Figure 4 shows some examples of the building footprint extraction results of our proposed method in which the green, red, and yellow polygons denote correctly extracted buildings (TP), other objects extracted as buildings by mistake (FP), and ground truth buildings that are not extracted correctly by the proposed method (FN), respectively. The building footprint extraction results of the four cities are analyzed in detail, according to the actual situation of each city in Section 5.3.

5. Discussion

5.1. Comparison of Building Footprint Extraction Results Obtained from Different Methods

In this section, we compare the building footprint extraction results obtained from our proposed method with those achieved from the top three solutions in the SpaceNet Building Detection Competition (round 2) [11]. Table 6 shows the final F1-scores of the four cities obtained from our proposed method and from the top three solutions (XD_XD, wleite, and nofto, the competitors’ usernames). The numbers in bold type indicate the highest F1-scores. The solution proposed by the XD_XD is based on an ensemble of U-Net models, which combines multi-spectral satellite images with OpenStreetMap data. Different from our proposed method, XD_XD’s solution uses the OpenStreetMap as the only auxiliary data for all cities, and the OpenStreetMap vector layers (each layer represents a single land use type) are rasterized into four or five bands to integrate with the multi-spectral satellite image. Wleite and nofto use a similar approach, including traditional feature extraction (e.g., Sobel filter-based edge detection, average, variance, and skewness for small neighborhood squares around each evaluated pixel) and two random forest classifiers (one for predicting whether a pixel belongs to the border and the other one for predicting whether a pixel is inside a building).
Compared with the winning solution (XD_XD), the F1-score of our proposed method increased significantly (by 3%) for Shanghai and by 1.1% and 0.6% for Paris and Las Vegas. The F1-score decreased slightly (by 0.2%) for Khartoum. This method improved the total F1-score by 1.1%, 6.1%, and 12.5% compared with the top three solutions in the competition. All four methods performed best in Las Vegas, second best in Paris, third best in Shanghai, and worst in Khartoum. Possible reasons for this phenomenon are analyzed in Section 5.3.

5.2. Building Extraction Results Obtained from Different Strategies of Our Proposed Method

In this section, we compare and analyze the effects of each strategy in our proposed method on the building footprint extraction results in different cities. Table 7 shows the precision, recall, and F1-score of the four cities after applying the different strategies. The numbers in bold type indicate the highest values. Baseline refers to training the semantic segmentation model using the rescaled satellite images. Data-aug (data augmentation) refers to training the semantic segmentation model using the augmented satellite images. Post-proc (post-processing) refers to applying the post-processing strategy to the integrated results of the baseline and data-aug. Add-map (adding GIS map data) refers to integrating the results obtained from the satellite image–based dataset collection with those from the combined satellite and GIS map image–based dataset collection. The F1-scores obtained after applying the different strategies are summarized in Figure 5.
Compared with the baseline, our proposed method improved the F1-score by 3.01%, 7.38%, 9.24%, and 8.71% for Las Vegas, Paris, Shanghai, and Khartoum, respectively. The improvement is much more significant for Paris, Shanghai, and Khartoum than for Las Vegas, which had an F1-score of 0.8849 using the baseline model. For the data augmentation strategy, the F1-score improvements for Paris and Khartoum (3.64% and 3.91%) are more remarkable than for Las Vegas and Shanghai (1.19% and 1.29%). We can conclude that, for cities with fewer initial training samples, the data augmentation strategy significantly improves the F1-score. The post-processing strategy was more beneficial for Shanghai and Khartoum, with relatively low F1-scores compared to Las Vegas and Paris, with relatively high F1-scores. The strategy of integrating satellite data with GIS map data improved the F1-score more for Shanghai than for the other three cities, which might be due to the relatively poor building extraction results of the baseline model and the substantial building information of the MapWorld datasets. It is worth noting that the F1-score of Khartoum increased by 2.05% after the add-map strategy even though the OpenStreetMap dataset lacked building information for most areas in Khartoum. We can conclude that other information in the map data (e.g., many roads and other land use types) might also contribute to the improved building extraction results.
Figure 6, Figure 7, Figure 8 and Figure 9 show some examples of the building footprint extraction results after applying the different strategies in which green, red, and yellow polygons denote correctly extracted buildings (TP), other objects extracted as buildings by mistake (FP), and ground truth buildings that were not extracted correctly (FN), respectively. The experimental results demonstrate that the proposed strategies led to remarkable improvements in the building footprint results in many aspects. For instance, we could obtain more complete building outlines (e.g., the top images in Figure 6, Figure 7 and Figure 8), and the neighboring buildings were more likely to be successfully extracted separately (e.g., the bottom images in Figure 8 and Figure 9). Moreover, there was less confusion between tiny buildings and noise in the results (e.g., top images in Figure 6 and bottom images in Figure 8). Analysis about the results regarding the actual situation in different cities is demonstrated in the following section.

5.3. Analysis of Building Footprint Extraction Results for Different Cities

Figure 10 shows typical examples of the footprint extraction results obtained from our proposed method in the four cities. The two left columns of the images are selected examples with good results. The two right columns are selected examples with inferior results. The results of our proposed method are analyzed based on the specific situation of each city as follows.
Our method achieved the best results for Las Vegas. Most of the satellite images in the Las Vegas dataset are collected from residential regions. Compared with the other three cities, the buildings in Las Vegas have a more unified architectural style. Buildings partly covered by trees can also be successfully extracted by our proposed method for most regions (e.g., buildings on the left of Figure 10a,b). Tiny buildings and buildings of a similar color as the background region are relatively harder to extract correctly using the proposed method (e.g., FN buildings denoted by yellow polygons in Figure 10c,d).
Our method obtained the second highest F1-score for Paris. The satellite images are collected from the western part of Paris. Similar to Las Vegas, the buildings in Paris have a relatively unified architectural style. However, more buildings in Paris are a similar color as the background (e.g., trees and roads), which are difficult to correctly detect compared with those in Las Vegas. The proposed method also had difficulty identifying the outlines of two neighboring buildings separately and completely extracting large buildings that consist of several parts (e.g., buildings in the bottom of Figure 10g,h).
Our method obtained the second lowest F1-score for Shanghai. Most of the satellite images are collected from suburban regions of Shanghai. Compared with the other three cities, buildings in the Shanghai dataset are more diverse in many aspects, including the construction area, the building height, the architectural style, etc. There are more high-rise buildings in Shanghai with a larger distance between the roof and the footprint polygons on the satellite images (e.g., Figure 4e). Buildings located in residential areas (e.g., Figure 10i,j) are relatively easier to extract correctly by the proposed method than those located in agricultural areas, industrial areas, gardens, etc. (e.g., Figure 10k,l). Moreover, our proposed method had difficulty correctly extracting buildings with green roofs, of a similar color as the background, partly covered by trees, or of extremely small size, etc. (e.g., FN buildings denoted by yellow polygons in Figure 10k,l), even though the integration of satellite and map data solved the above problems to a great extent when compared with using only the provided satellite datasets (see Section 5.2).
Our method obtained the lowest F1-score for Khartoum. Most of the satellite images in the Khartoum dataset are collected from residential regions, where the buildings have great variance in structural organization and construction area. There are many building groups in Khartoum, and it is hard to judge, even by the human eye, whether a group of neighboring buildings should be extracted entirely or separately in many regions (e.g., Figure 10o,p). To the best of our knowledge, all of the existing public GIS map datasets show very limited building information in Khartoum. All of these aspects might result in inferior performance of building footprint extraction in Khartoum.

6. Conclusions

In this study, we proposed a U-Net–based semantic segmentation method for building footprint extraction from high-resolution satellite images using the SpaceNet building dataset provided in the DeepGlobe Challenge. Multisource GIS map datasets (OpenStreetMap, Google Maps, and MapWorld) are explored to improve the building extraction results in four cities (Las Vegas, Paris, Shanghai, and Khartoum). In our proposed method, we designed a data fusion and augmentation method for integrating multispectral WorldView-3 satellite images with selected GIS map datasets. We trained and evaluated four U-Net–based semantic segmentation models based on augmented and integrated dataset collections. Lastly, we integrated the results obtained from the semantic segmentation models and employed a post-processing method to further improve the building extraction results.
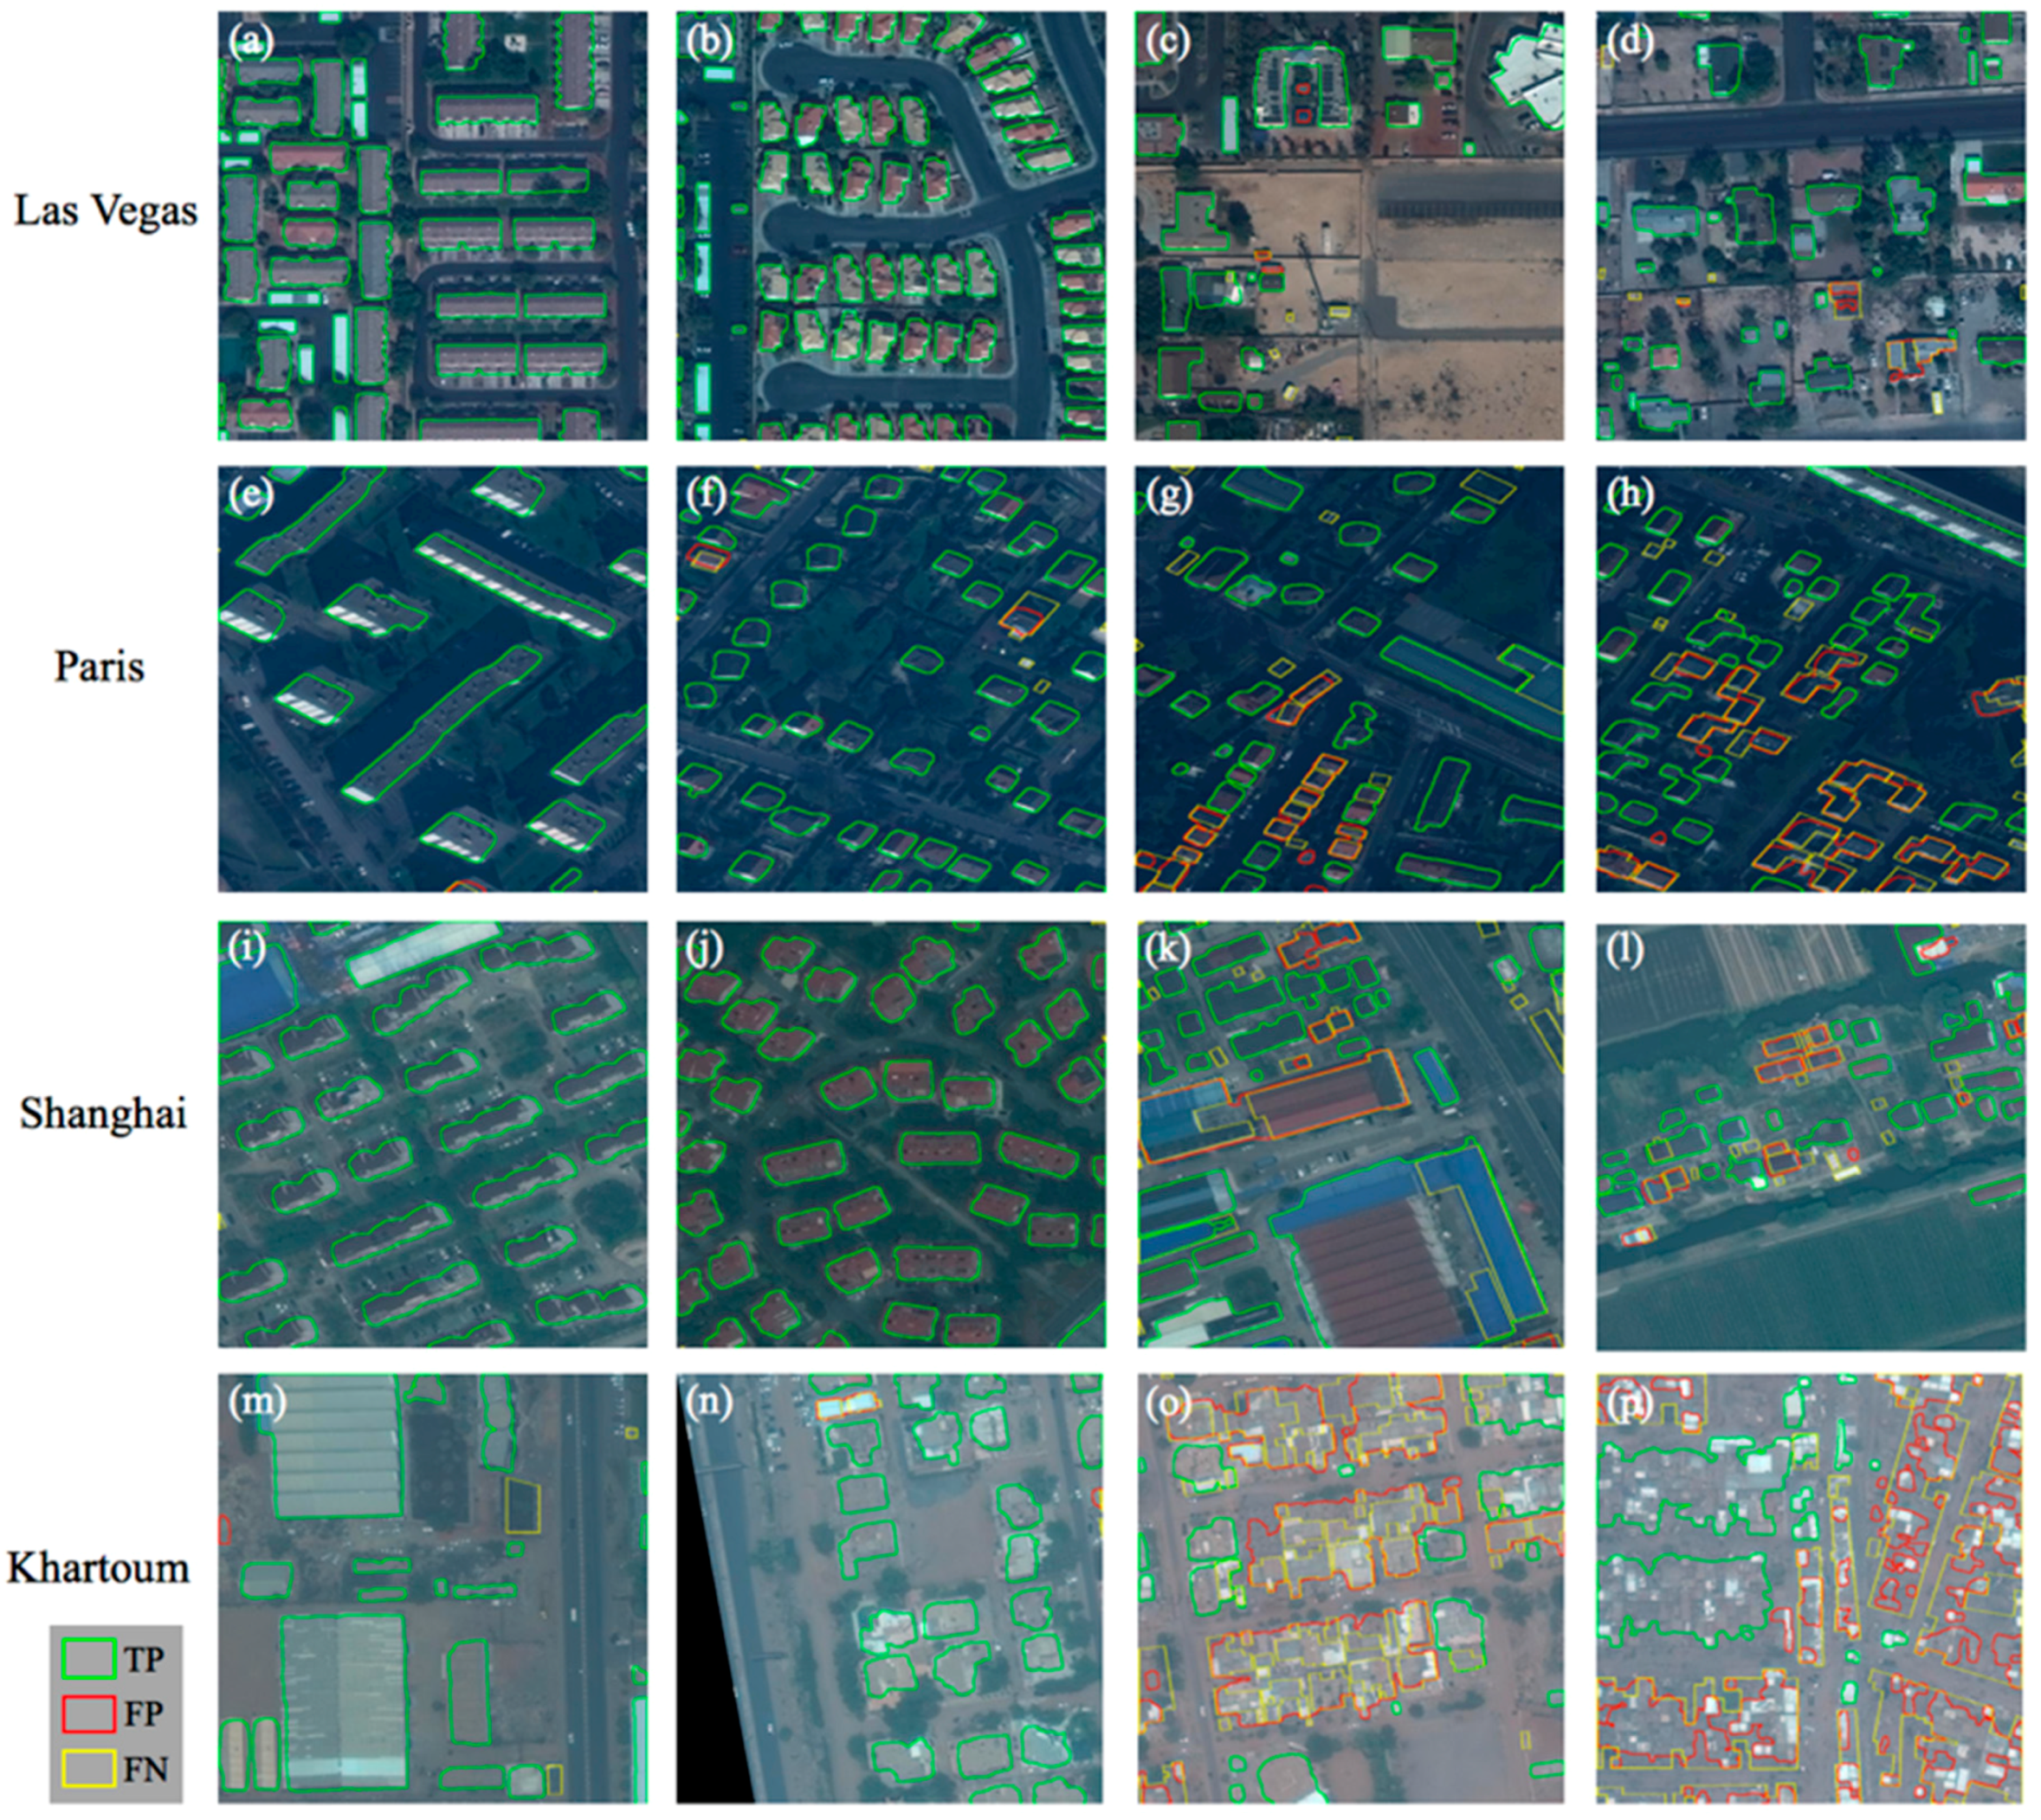
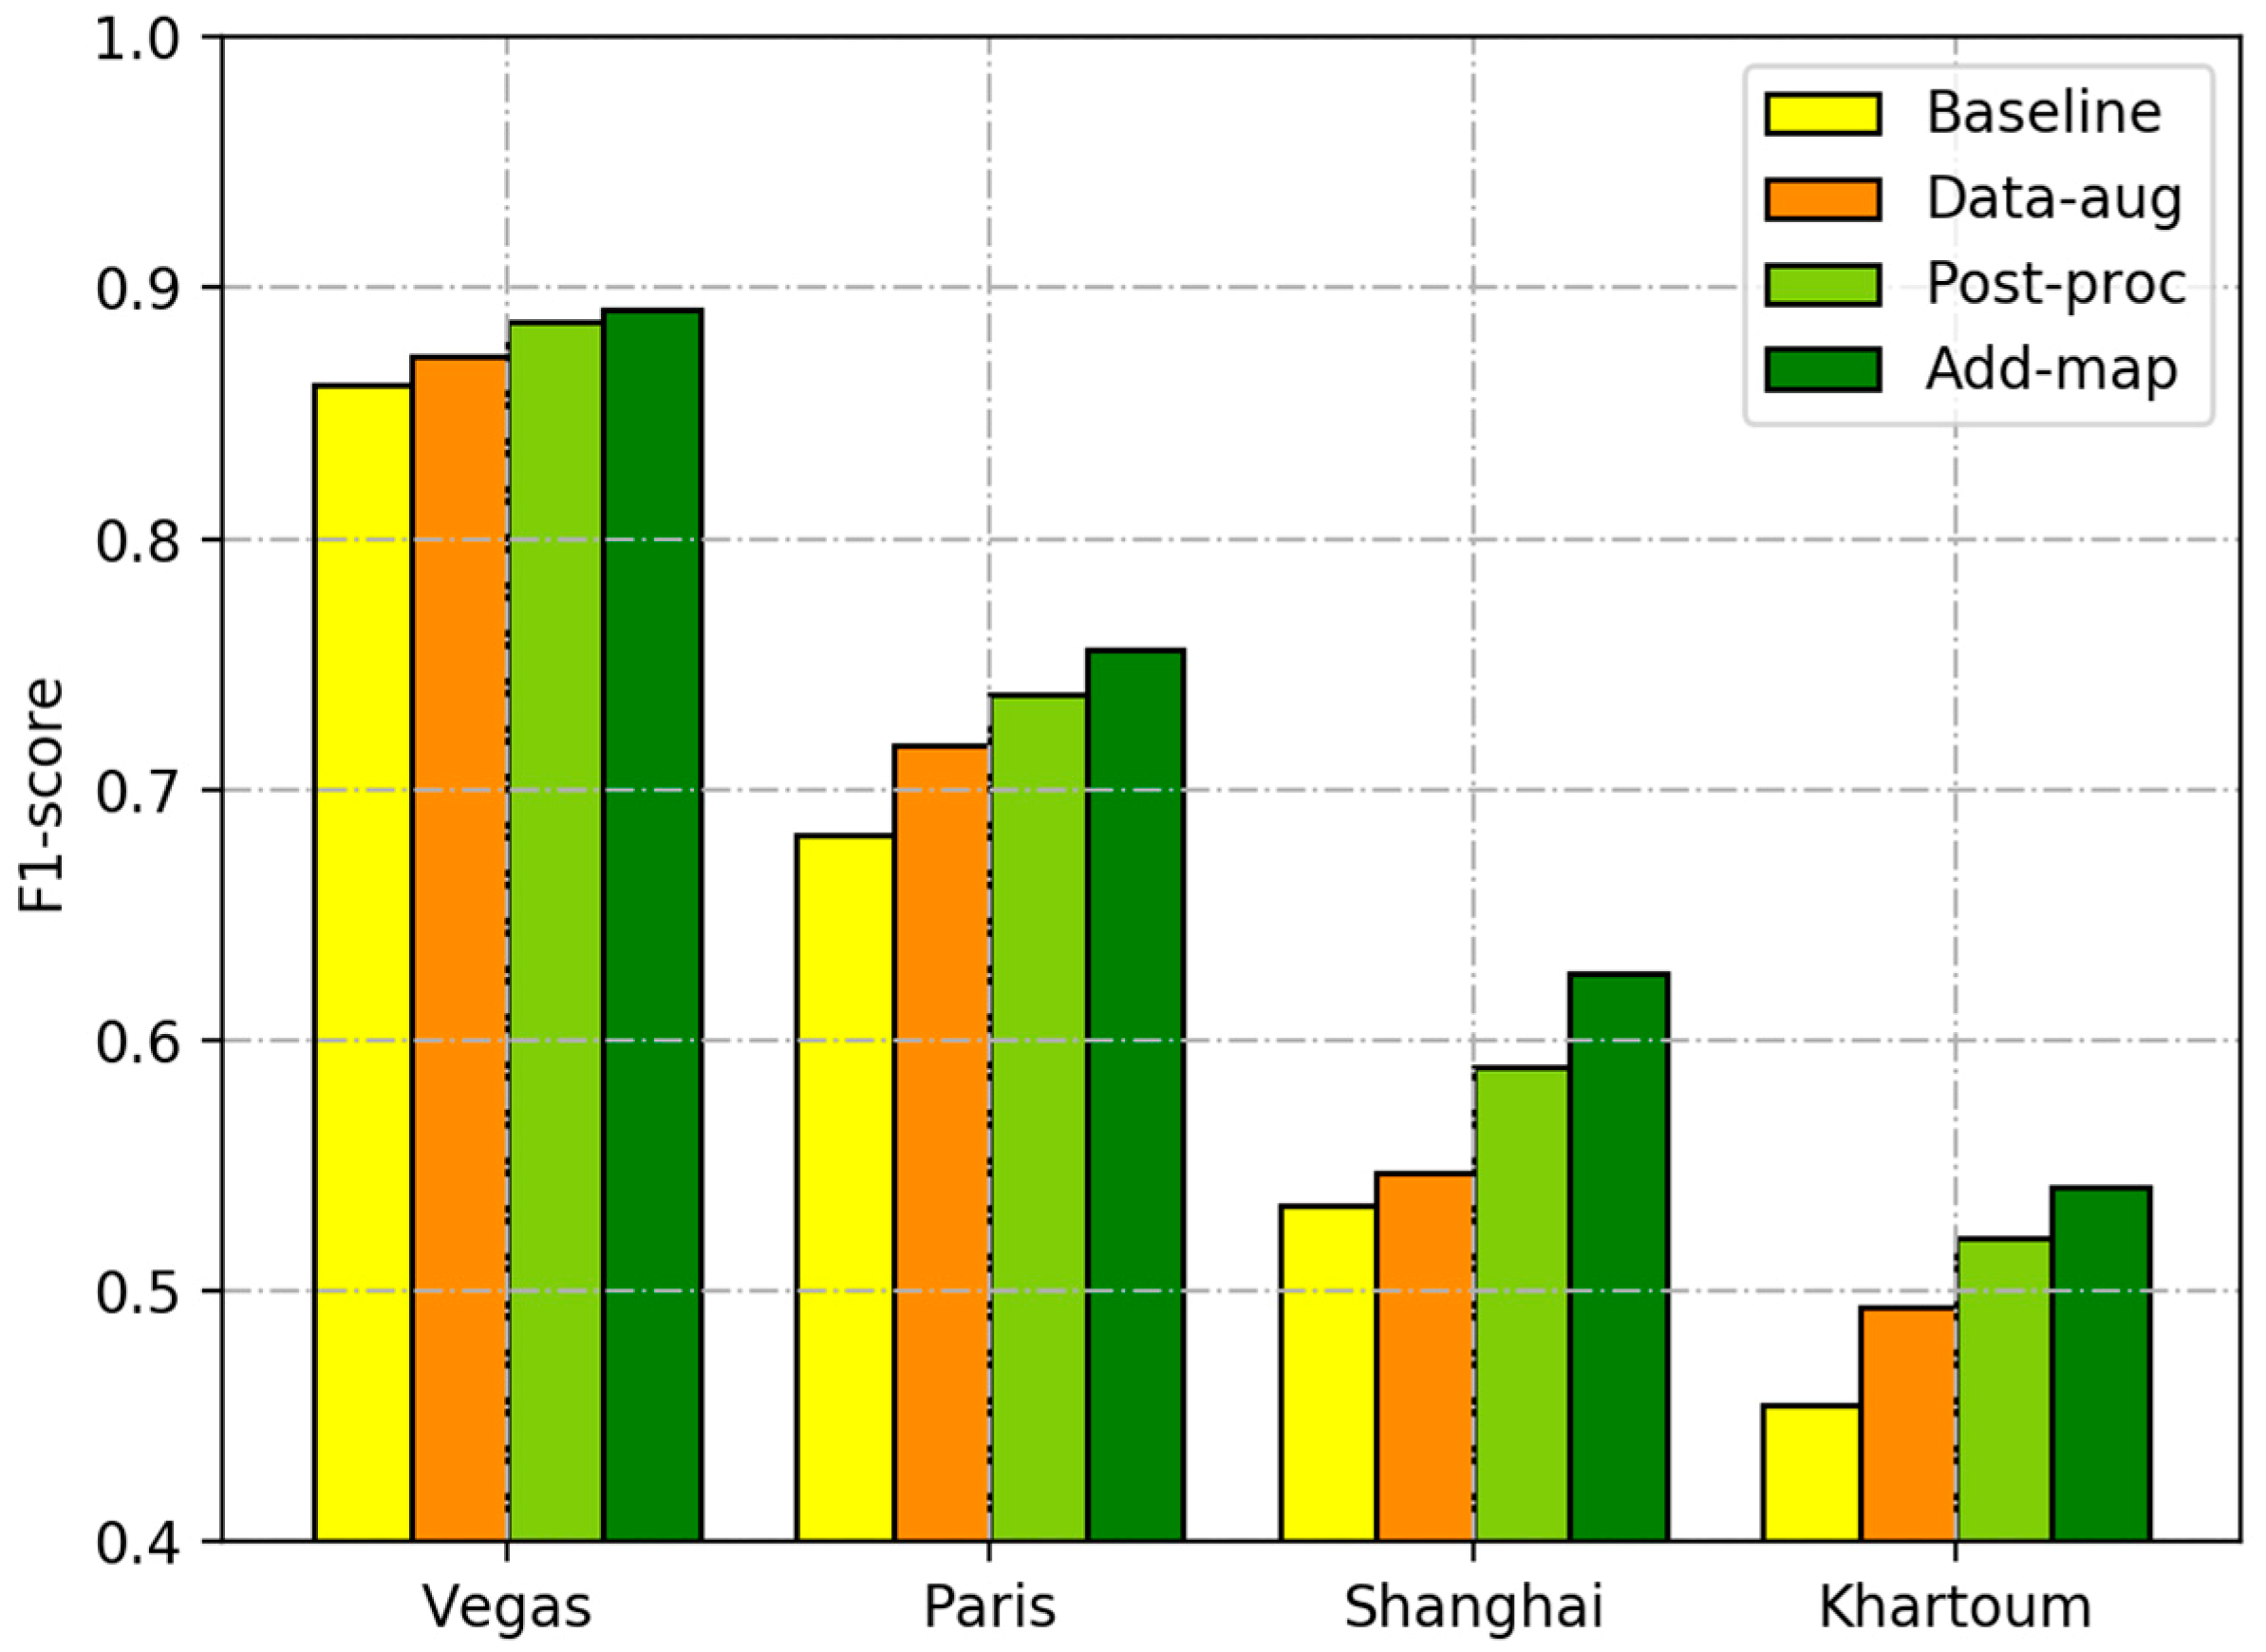
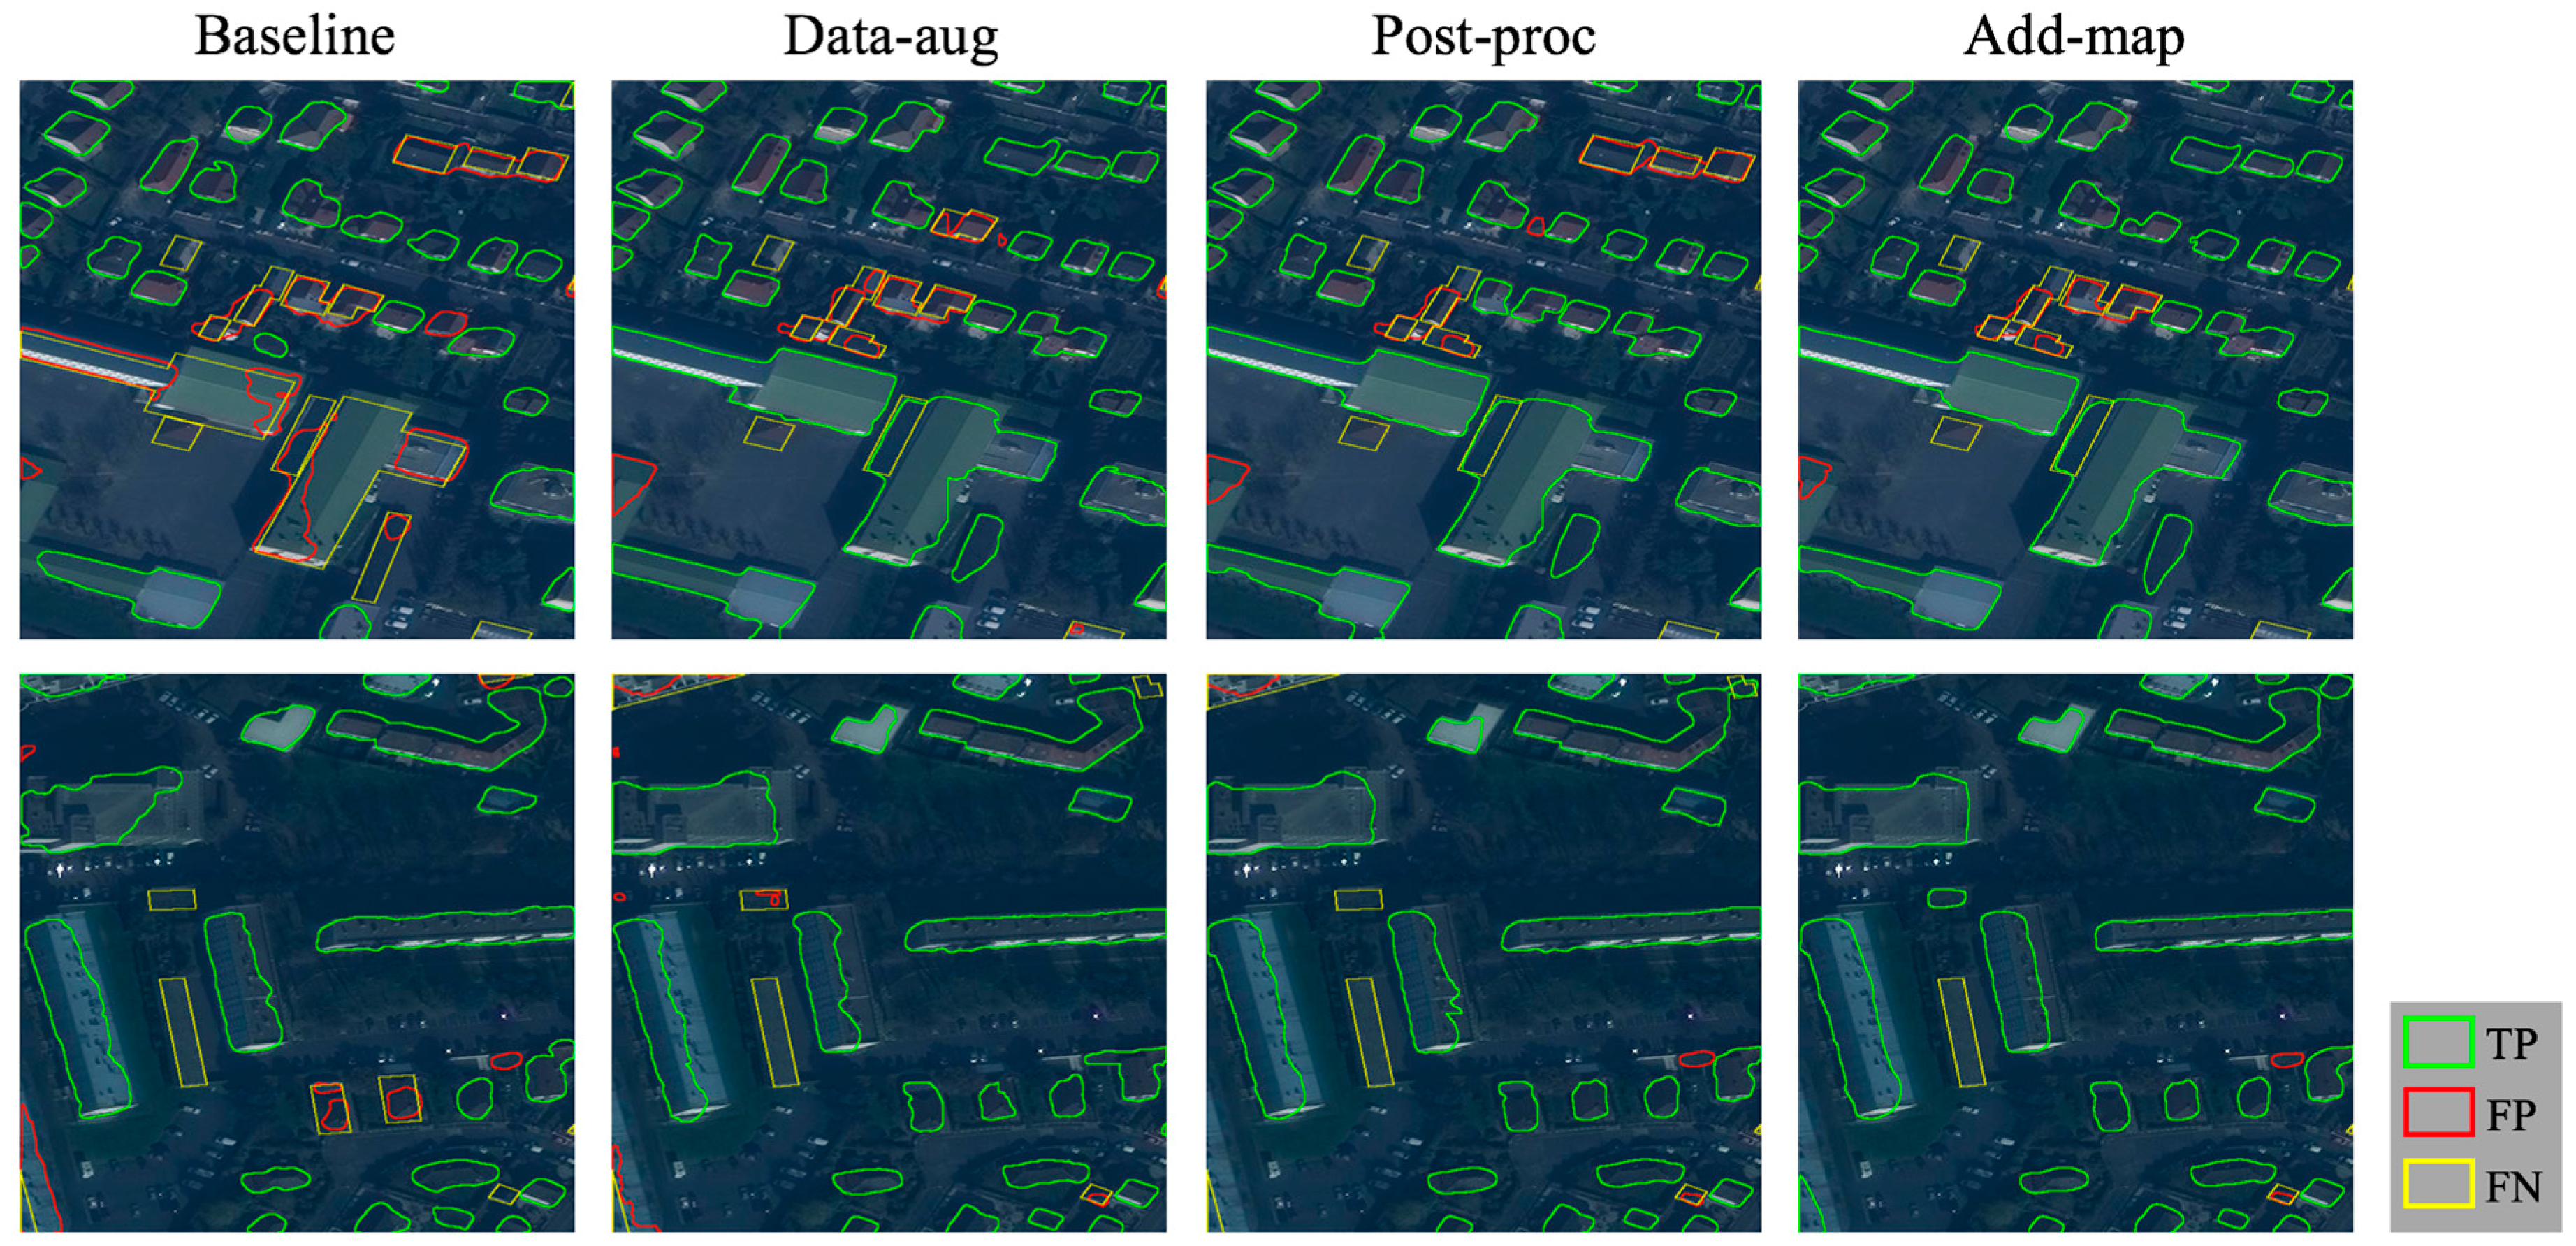
The experimental results show that our proposed method improves the total F1-score by 1.1%, 6.1%, and 12.5% when compared with the top three solutions in the SpaceNet Building Detection Competition. The F1-scores of Las Vegas, Paris, Shanghai, and Khartoum are 0.8911, 0.7555, 0.6266, and 0.5415, respectively. The significant difference in the results is due to many possible aspects, including the consistency or the diversity of buildings in a city (e.g., construction area, building height, and architectural style), the similarity between buildings and background, and the number of training samples. We also analyze the effects of proposed strategies on the building extraction results. Our proposed strategies improved the F1-score by 3.01% to 9.24% for the four cities compared with those obtained from the baseline method, which achieved precise building outlines and less confusion between tiny buildings and noise. The data augmentation strategy improves the F1-scores greatly for Paris and Khartoum, with fewer training samples, and slightly for Las Vegas and Shanghai, with more training samples. The post-processing strategy brings more improvement for Shanghai and Khartoum, with lower initial F1-scores, than for Las Vegas and Paris, with higher initial F1-scores. The strategy of integrating satellite and GIS data brings the most improvement for Shanghai, with a low initial F1-score and substantial building information in GIS map data. In our future research, we will try to combine the semantic segmentation model with other image processing algorithms (e.g., traditional image segmentation and edge detection algorithms) to further improve the extraction of building outlines. We will also explore different data fusion strategies for combining satellite images and GIS data, and other state-of-the-art semantic segmentation models for building footprint extraction using the SpaceNet building dataset.

Author Contributions

Conceptualization, W.L., C.H. and J.F.; Data curation, W.L.; Formal analysis, W.L.; Funding acquisition, H.F.; Investigation, W.L., C.H. and J.F.; Methodology, W.L., C.H. and J.F.; Project administration, H.F.; Resources, H.F.; Software, W.L., C.H. and J.F.; Supervision, H.F.; Validation, W.L. and C.H.; Visualization, W.L., C.H., and J.Z.; Writing—original draft, W.L.; Writing—review & editing, H.F. and L.Y.

Funding

This research was supported in part by the National Key R&D Program of China (Grant No. 2017YFA0604500 and 2017YFA0604401), by the National Natural Science Foundation of China (Grant No. 51761135015), and by the Center for High Performance Computing and System Simulation, Pilot National Laboratory for Marine Science and Technology (Qingdao).

Acknowledgments

The authors would like to thank the editors and reviewers for their valuable comments.

Conflicts of Interest

The authors declare no conflict of interest.

References

  1. Zhang, B.; Wang, C.; Shen, Y.; Liu, Y. Fully Connected Conditional Random Fields for High-Resolution Remote Sensing Land Use/Land Cover Classification with Convolutional Neural Networks. Remote Sens. 2018, 10, 1889. [Google Scholar] [CrossRef]
  2. Li, W.; Fu, H.; Yu, L.; Cracknell, A. Deep learning based oil palm tree detection and counting for high-resolution remote sensing images. Remote Sens. 2016, 9, 22. [Google Scholar] [CrossRef]
  3. Li, W.; Dong, R.; Fu, H.; Le, Y. Large-Scale Oil Palm Tree Detection from High-Resolution Satellite Images Using Two-Stage Convolutional Neural Networks. Remote Sens. 2019, 11, 11. [Google Scholar] [CrossRef]
  4. Tang, T.; Zhou, S.; Deng, Z.; Lei, L.; Zou, H. Arbitrary-oriented vehicle detection in aerial imagery with single convolutional neural networks. Remote Sens. 2017, 9, 1170. [Google Scholar] [CrossRef]
  5. Xu, Y.; Xie, Z.; Feng, Y.; Chen, Z. Road Extraction from High-Resolution Remote Sensing Imagery Using Deep Learning. Remote Sens. 2018, 10, 1461. [Google Scholar] [CrossRef]
  6. Audebert, N.; Le Saux, B.; Lefèvre, S. Segment-before-detect: Vehicle detection and classification through semantic segmentation of aerial images. Remote Sens. 2017, 9, 368. [Google Scholar] [CrossRef]
  7. Sun, Y.; Zhang, X.; Zhao, X.; Xin, Q. Extracting building boundaries from high resolution optical images and LiDAR data by integrating the convolutional neural network and the active contour model. Remote Sens. 2018, 10, 1459. [Google Scholar] [CrossRef]
  8. Tian, J.; Cui, S.; Reinartz, P. Building change detection based on satellite stereo imagery and digital surface models. IEEE Trans. Geosci. Remote Sens. 2014, 52, 406–417. [Google Scholar] [CrossRef]
  9. Li, L.; Liang, J.; Weng, M.; Zhu, H. A Multiple-Feature Reuse Network to Extract Buildings from Remote Sensing Imagery. Remote Sens. 2018, 10, 1350. [Google Scholar] [CrossRef]
  10. Shrestha, S.; Vanneschi, L. Improved Fully Convolutional Network with Conditional Random Fields for Building Extraction. Remote Sens. 2018, 10, 1135. [Google Scholar] [CrossRef]
  11. Demir, I.; Koperski, K.; Lindenbaum, D.; Pang, G.; Huang, J.; Basu, S.; Hughes, F.; Tuia, D.; Raska, R. Deepglobe 2018: A challenge to parse the earth through satellite images. In Proceedings of the IEEE Conference on Computer Vision and Pattern Recognition Workshops, Salt Lake City, UT, USA, 18–22 June 2018; pp. 238–241. [Google Scholar]
  12. Xu, Y.; Wu, L.; Xie, Z.; Chen, Z. Building Extraction in Very High Resolution Remote Sensing Imagery Using Deep Learning and Guided Filters. Remote Sens. 2018, 10, 144. [Google Scholar] [CrossRef]
  13. Cheng, G.; Han, J. A survey on object detection in optical remote sensing images. ISPRS J. Photogramm. 2016, 117, 11–28. [Google Scholar] [CrossRef]
  14. Ziaei, Z.; Pradhan, B.; Mansor, S.B. A rule-based parameter aided with object-based classification approach for extraction of building and roads from WorldView-2 images. Geocarto Int. 2014, 29, 554–569. [Google Scholar] [CrossRef]
  15. Ok, A.O. Automated detection of buildings from single VHR multispectral images using shadow information and graph cuts. ISPRS J. Photogramm. 2013, 86, 21–40. [Google Scholar] [CrossRef]
  16. Belgiu, M.; Drǎguţ, L. Comparing supervised and unsupervised multiresolution segmentation approaches for extracting buildings from very high resolution imagery. ISPRS J. Photogramm. 2014, 96, 67–75. [Google Scholar] [CrossRef] [PubMed]
  17. Chen, R.; Li, X.; Li, J. Object-based features for house detection from RGB high-resolution images. Remote Sens. 2018, 10, 451. [Google Scholar] [CrossRef]
  18. Huang, X.; Zhang, L. Morphological building/shadow index for building extraction from high-resolution imagery over urban areas. IEEE J. Sel. Top. Appl. Earth Obs. Remote Sens. 2012, 5, 161–172. [Google Scholar] [CrossRef]
  19. Ok, A.O.; Senaras, C.; Yuksel, B. Automated detection of arbitrarily shaped buildings in complex environments from monocular VHR optical satellite imagery. IEEE Trans. Geosci. Remote Sens. 2013, 51, 1701–1717. [Google Scholar] [CrossRef]
  20. Ding, P.; Zhang, Y.; Deng, W.J.; Jia, P.; Kuijper, A. A light and faster regional convolutional neural network for object detection in optical remote sensing images. ISPRS J. Photogramm. 2018, 141, 208–218. [Google Scholar] [CrossRef]
  21. Hu, F.; Xia, G.S.; Hu, J.; Zhang, L. Transferring deep convolutional neural networks for the scene classification of high-resolution remote sensing imagery. Remote Sens. 2015, 7, 14680–14707. [Google Scholar] [CrossRef]
  22. Liu, Y.; Zhong, Y.; Fei, F.; Zhu, Q.; Qin, Q. Scene Classification Based on a Deep Random-Scale Stretched Convolutional Neural Network. Remote Sens. 2018, 10, 444. [Google Scholar] [CrossRef]
  23. Li, W.; Fu, H.; Yu, L.; Gong, P.; Feng, D.; Li, C.; Clinton, N. Stacked autoencoder-based deep learning for remote-sensing image classification: A case study of African land-cover mapping. Int. J. Remote Sens. 2016, 37, 5632–5646. [Google Scholar] [CrossRef]
  24. Huang, B.; Zhao, B.; Song, Y. Urban land-use mapping using a deep convolutional neural network with high spatial resolution multispectral remote sensing imagery. Remote Sens. Environ. 2018, 214, 73–86. [Google Scholar] [CrossRef]
  25. Long, J.; Shelhamer, E.; Darrell, T. Fully convolutional networks for semantic segmentation. In Proceedings of the IEEE Conference on Computer Vision and Pattern Recognition, Boston, MA, USA, 7–12 June 2015; pp. 3431–3440. [Google Scholar]
  26. Li, W.; He, C.; Fang, J.; Fu, H. Semantic Segmentation based Building Extraction Method using Multi-source GIS Map Datasets and Satellite Imagery. In Proceedings of the IEEE Conference on Computer Vision and Pattern Recognition Workshops, Salt Lake City, UT, USA, 18–22 June 2018; pp. 238–241. [Google Scholar]
  27. Cao, R.; Zhu, J.; Tu, W.; Li, Q.; Cao, J.; Liu, B.; Zhang, Q.; Qiu, G. Integrating Aerial and Street View Images for Urban Land Use Classification. Remote Sens. 2018, 10, 1553. [Google Scholar] [CrossRef]
  28. Lin, H.; Shi, Z.; Zou, Z. Maritime semantic labeling of optical remote sensing images with multi-scale fully convolutional network. Remote Sens. 2017, 9, 480. [Google Scholar] [CrossRef]
  29. Piramanayagam, S.; Saber, E.; Schwartzkopf, W.; Koehler, F. Supervised Classification of Multisensor Remotely Sensed Images Using a Deep Learning Framework. Remote Sens. 2018, 10, 1429. [Google Scholar] [CrossRef]
  30. Bai, Y.; Mas, E.; Koshimura, S. Towards Operational Satellite-Based Damage-Mapping Using U-Net Convolutional Network: A Case Study of 2011 Tohoku Earthquake-Tsunami. Remote Sens. 2018, 10, 1626. [Google Scholar] [CrossRef]
  31. Sa, I.; Popović, M.; Khanna, R.; Chen, Z.; Lottes, P.; Liebisch, F.; Nieto, J.; Stachniss, C.; Walter, A.; Siegwart, R. WeedMap: A large-scale semantic weed mapping framework using aerial multispectral imaging and deep neural network for precision farming. Remote Sens. 2018, 10, 1423. [Google Scholar] [CrossRef]
  32. Lu, T.; Ming, D.; Lin, X.; Hong, Z.; Bai, X.; Fang, J. Detecting building edges from high spatial resolution remote sensing imagery using richer convolution features network. Remote Sens. 2018, 10, 1496. [Google Scholar] [CrossRef]
  33. Yang, H.; Wu, P.; Yao, X.; Wu, Y.; Wang, B.; Xu, Y. Building Extraction in Very High Resolution Imagery by Dense-Attention Networks. Remote Sens. 2018, 10, 1768. [Google Scholar] [CrossRef]
  34. Wu, G.; Guo, Z.; Shi, X.; Chen, Q.; Xu, Y.; Shibasaki, R.; Shao, X. A boundary regulated network for accurate roof segmentation and outline extraction. Remote Sens. 2018, 10, 1195. [Google Scholar] [CrossRef]
  35. Alshehhi, R.; Marpu, P.R.; Woon, W.L.; Dalla Mura, M. Simultaneous extraction of roads and buildings in remote sensing imagery with convolutional neural networks. ISPRS J. Photogramm. 2017, 130, 139–149. [Google Scholar] [CrossRef]
  36. Huang, B.; Lu, K.; Audebert, N.; Khalel, A.; Tarabalka, Y.; Malof, J.; Boulch, A.; Le Saux, B.; Collins, L.; Bradbury, K.; et al. Large-scale semantic classification: Outcome of the first year of Inria aerial image labeling benchmark. In Proceedings of the IEEE International Geoscience and Remote Sensing Symposium (IGARSS), Valencia, Spain, 22–27 July 2018. [Google Scholar]
  37. Li, X.; Yao, X.; Fang, Y. Building-A-Nets: Robust Building Extraction from High-Resolution Remote Sensing Images with Adversarial Networks. IEEE J. Sel. Top. Appl. Earth Obs. Remote Sens. 2018, 99, 3680–3687. [Google Scholar] [CrossRef]
  38. Ji, S.; Wei, S.; Lu, M. A scale robust convolutional neural network for automatic building extraction from aerial and satellite imagery. Int. J. Remote Sens. 2018, 1–15. [Google Scholar] [CrossRef]
  39. Mnih, V. Machine Learning for Aerial Image Labeling. Ph.D. Thesis, University of Toronto, Toronto, ON, Canada, 2013. [Google Scholar]
  40. Rottensteiner, F.; Sohn, G.; Jung, J.; Gerke, M.; Baillard, C.; Benitez, S.; Breitkopf, U. The ISPRS benchmark on urban object classification and 3D building reconstruction. ISPRS Ann. Photogramm. Remote Sens. Spat. Inf. Sci. 2012, 1, 293–298. [Google Scholar] [CrossRef]
  41. Maggiori, E.; Tarabalka, Y.; Charpiat, G.; Alliez, P. Can semantic labeling methods generalize to any city? The Inria aerial image labeling benchmark. In Proceedings of the IEEE International Symposium on Geoscience and Remote Sensing (IGARSS), Fort Worth, TX, USA, 23–28 July 2017. [Google Scholar]
  42. Ji, S.; Wei, S.; Lu, M. Fully Convolutional Networks for Multisource Building Extraction from an Open Aerial and Satellite Imagery Data Set. IEEE Trans. Geosci. Remote Sens. 2018, 99, 1–13. [Google Scholar] [CrossRef]
  43. Chen, Q.; Wang, L.; Wu, Y.; Wu, G.; Guo, Z.; Waslander, S.L. Aerial imagery for roof segmentation: A large-scale dataset towards automatic mapping of buildings. ISPRS J. Photogramm. 2019, 147, 42–55. [Google Scholar] [CrossRef]
  44. Van Etten, A.; Lindenbaum, D.; Bacastow, T.M. Spacenet: A remote sensing dataset and challenge series. arXiv, 2018; arXiv:1807.01232. [Google Scholar]
  45. Qin, R.; Tian, J.; Reinartz, P. Spatiotemporal inferences for use in building detection using series of very-high-resolution space-borne stereo images. Int. J. Remote Sens. 2016, 37, 3455–3476. [Google Scholar] [CrossRef]
  46. Du, S.; Zhang, Y.; Zou, Z.; Xu, S.; He, X.; Chen, S. Automatic building extraction from LiDAR data fusion of point and grid-based features. ISPRS J. Photogramm. 2017, 130, 294–307. [Google Scholar] [CrossRef]
  47. Gilani, S.A.N.; Awrangjeb, M.; Lu, G. An automatic building extraction and regularisation technique using lidar point cloud data and orthoimage. Remote Sens. 2016, 8, 258. [Google Scholar] [CrossRef]
  48. Sohn, G.; Dowman, I. Data fusion of high-resolution satellite imagery and LiDAR data for automatic building extraction. ISPRS J. Photogramm. 2007, 62, 43–63. [Google Scholar] [CrossRef]
  49. Tournaire, O.; Brédif, M.; Boldo, D.; Durupt, M. An efficient stochastic approach for building footprint extraction from digital elevation models. ISPRS J. Photogramm. 2010, 65, 317–327. [Google Scholar] [CrossRef]
  50. Wang, Y.; Cheng, L.; Chen, Y.; Wu, Y.; Li, M. Building point detection from vehicle-borne LiDAR data based on voxel group and horizontal hollow analysis. Remote Sens. 2016, 8, 419. [Google Scholar] [CrossRef]
  51. Lee, D.H.; Lee, K.M.; Lee, S.U. Fusion of lidar and imagery for reliable building extraction. Photogramm. Eng. Remote Sens. 2008, 74, 215–225. [Google Scholar] [CrossRef]
  52. Awrangjeb, M.; Ravanbakhsh, M.; Fraser, C.S. Automatic detection of residential buildings using LIDAR data and multispectral imagery. ISPRS J. Photogramm. 2010, 65, 457–467. [Google Scholar] [CrossRef]
  53. Pan, X.; Gao, L.; Marinoni, A.; Zhang, B.; Yang, F.; Gamba, P. Semantic Labeling of High Resolution Aerial Imagery and LiDAR Data with Fine Segmentation Network. Remote Sens. 2018, 10, 743. [Google Scholar] [CrossRef]
  54. Huang, Z.; Cheng, G.; Wang, H.; Li, H.; Shi, L.; Pan, C. Building extraction from multi-source remote sensing images via deep deconvolution neural networks. In Proceedings of the IEEE International Geoscience and Remote Sensing Symposium (IGARSS), Beijing, China, 10–15 July 2016; pp. 1835–1838. [Google Scholar]
  55. Yuan, J.; Cheriyadat, A.M. Learning to count buildings in diverse aerial scenes. In Proceedings of the 22nd ACM SIGSPATIAL International Conference on Advances in Geographic Information Systems, Dallas, TX, USA, 4–7 November 2014; pp. 271–280. [Google Scholar]
  56. Audebert, N.; Le Saux, B.; Lefèvre, S. Joint learning from earth observation and openstreetmap data to get faster better semantic maps. In Proceedings of the EARTHVISION 2017 IEEE/ISPRS CVPR Workshop on Large Scale Computer Vision for Remote Sensing Imagery, Honolulu, HI, USA, 21–26 July 2017. [Google Scholar]
  57. Du, S.; Zhang, F.; Zhang, X. Semantic classification of urban buildings combining VHR image and GIS data: An improved random forest approach. ISPRS J. Photogramm. 2015, 105, 107–119. [Google Scholar] [CrossRef]
  58. OpenStreetMap Static Map. Available online: http://staticmap.openstreetmap.de/ (accessed on 15 April 2018).
  59. Google Map Static API. Available online: https://developers.google.com/maps/documentation/static-maps/ (accessed on 15 April 2018).
  60. MapWorld Static API. Available online: http://lbs.tianditu.gov.cn/staticapi/static.html (accessed on 15 April 2018).
  61. Ronneberger, O.; Fischer, P.; Brox, T. U-net: Convolutional networks for biomedical image segmentation. In Proceedings of the International Conference on Medical Image Computing and Computer-Assisted Intervention, Munich, Germany, 5–9 October 2015; pp. 234–241. [Google Scholar]
  62. Iglovikov, V.; Mushinskiy, S.; Osin, V. Satellite imagery feature detection using deep convolutional neural network: A kaggle competition. arXiv, 2017; arXiv:1706.06169. [Google Scholar]
  63. Wang, X.; Liu, S.; Du, P.; Liang, H.; Xia, J.; Li, Y. Object-Based Change Detection in Urban Areas from High Spatial Resolution Images Based on Multiple Features and Ensemble Learning. Remote Sens. 2018, 10, 276. [Google Scholar] [CrossRef]
  64. Chollet, F. Deep Learning with Python; Manning Publications Co.: Shelter Island, NY, USA, 2017. [Google Scholar]
Figure 1. Examples of WorldView-3 satellite images, annotated building footprints (denoted by yellow polygons), and multi-source geographic information system (GIS) map images of four cities.
Remotesensing 11 00403 g001
Figure 2. Overall flowchart of the proposed approach for building extraction, including (a–c) data preparation and augmentation, (d) semantic segmentation for building footprint extraction, and (e–h) integration and post-processing of results.
Remotesensing 11 00403 g002
Figure 3. Architecture of semantic segmentation model for building extraction.
Remotesensing 11 00403 g003
Figure 4. Examples of building footprint extraction results of our proposed method in (a,b) Las Vegas, (c,d) Paris, (e,f) Shanghai, and (g,h) Khartoum. Green, red, and yellow polygons denote correctly extracted buildings (TP), other objects extracted as buildings by mistake (FP), and ground truth buildings that were not extracted correctly by the proposed method (FN), respectively.
Remotesensing 11 00403 g004
Figure 5. F1-scores obtained after applying different strategies of our proposed method.
Remotesensing 11 00403 g005
Figure 6. Examples of building extraction results for Las Vegas using different strategies.
Remotesensing 11 00403 g006
Figure 7. Examples of building extraction results for Paris using different strategies.
Remotesensing 11 00403 g007
Figure 8. Examples of building extraction results for Shanghai using different strategies.
Remotesensing 11 00403 g008
Figure 9. Examples of building extraction results for Khartoum using different strategies.
Remotesensing 11 00403 g009
Figure 10. Examples of footprint extraction results obtained from our proposed method in four cities. The two left columns show selected examples with good building extraction results. The two right columns show selected examples with inferior building extraction results.
Remotesensing 11 00403 g010
Table 1. Number of image scenes and annotated building footprint polygons of each city.
CityLas VegasParisShanghaiKhartoumTotal
Number of images385111484582101210,593
Number of buildings108,32816,20767,90625,046217,487
Table 2. Number of training and validation samples in four cities.
NumberLas VegasParisShanghaiKhartoum
Training samples26958033207708
Validation samples11563451375304
Table 3. Validation accuracies of semantic segmentation networks in four cities.
Type of DatasetLas VegasParisShanghaiKhartoumAverage
Satellite-org0.96840.97520.96100.93860.9608
Satellite-aug0.96460.97760.96130.93990.9609
Satellite-Map-org0.96810.97720.96770.93710.9625
Satellite-Map-aug0.96920.97720.96810.94200.9641
Table 4. Results of the proposed method evaluated by the validation dataset. TP, true positive. FP, false positive. FN, false negative.
IndexLas VegasParisShanghaiKhartoum
TP27,526309711,3233495
FP162956438351968
FN5098144196613951
Precision0.94410.84590.74700.6398
Recall0.84370.68250.53960.4694
F1-score0.89110.75550.62660.5415
Table 5. Results of proposed method evaluated by the dataset provided in the final phase.
IndexLas VegasParisShanghaiKhartoum
TP30,068405611,6744031
FP191284441322106
FN5187200689744443
Precision0.94020.82780.73860.6568
Recall0.85290.66010.56540.4757
F1-score0.89440.74000.62500.5518
Table 6. F1-scores obtained from different methods.
MethodLas VegasParisShanghaiKhartoumTotal
Ours0.8910.7560.6270.5420.704
XD_XD0.8850.7450.5970.5440.693
wleite0.8290.6790.5810.4830.643
nofto0.7870.5840.5200.4240.579
Table 7. Results obtained after applying different strategies of our proposed method.
StrategyIndexLas VegasParisShanghaiKhartoum
BaselinePrecision0.88490.73700.59730.4885
Recall0.83840.63420.48310.4248
F1-score0.86110.68170.53420.4544
Data-augPrecision0.88960.74740.56490.5338
Recall0.85700.69110.53040.4589
F1-score0.87300.71810.54710.4935
Post-procPrecision0.93080.82720.68750.6141
Recall0.84640.66660.51630.4525
F1-score0.88660.73830.58970.5210
Add-mapPrecision0.94410.84590.74700.6398
Recall0.84370.68250.53960.4694
F1-score0.89110.75550.62660.5415

