Article

Discriminating between C3, C4, and Mixed C3/C4 Pasture Grasses of a Grazed Landscape Using Multi-Temporal Sentinel-1a Data

by
Richard Azu Crabbe
1,*,
David William Lamb
1,2 and
Clare Edwards
1,3
1
Precision Agriculture Research Group, University of New England, Armidale, NSW 2351, Australia
2
Food Agility Cooperative Research Centre, University of New England, Armidale, NSW 2351, Australia
3
Central Tablelands Local Land Services, Mudgee, NSW 2850, Australia
*
Author to whom correspondence should be addressed.
Remote Sens. 2019, 11(3), 253; https://doi.org/10.3390/rs11030253
Submission received: 10 December 2018 / Revised: 17 January 2019 / Accepted: 23 January 2019 / Published: 27 January 2019

Abstract

:
In livestock grazing environments, the knowledge of C3/C4 species composition of a pasture field is invaluable, since such information assists graziers in making decisions around fertilizer application and stocking rates. The general aim of this research was to explore the potential of multi-temporal Sentinel-1 (S1) Synthetic Aperture Radar (SAR) to discriminate between C3, C4, and mixed-C3/C4 compositions. In this study, three Random Forest (RF) classification models were created using features derived from polarimetric SAR (polSAR) and grey-level co-occurrence textural metrics (glcmTEX). The first RF model involved only polSAR features and produced a prediction accuracy of 68% with a Kappa coefficient of 0.49. The second RF model used glcmTEX features and produced prediction accuracies of 76%, 62%, and 75% for C3, C4, and mixed C3/C4 grasses, respectively. The glcmTEX model achieved an overall prediction accuracy of 73% with a Kappa coefficient of 0.57. The polSAR and glcmTEX features were then combined (COMB model) to improve upon their individual classification performances. The COMB model produced prediction accuracies of 89%, 81%, and 84% for C3, C4, and mixed C3/C4 pasture grasses, and an overall prediction accuracy of 86% with a Kappa coefficient of 0.77. The contribution of the various model features could be attributed to the changes in dominant species between sampling sites through time, not only because of climatic variability but also because of preferential grazing.

Graphical Abstract

1. Introduction

In pasture grass fields, the botanical composition is often C3 and C4 plants. C3 and C4 pasture grasses are different both physiologically and morphologically [1]. Aside from C3 grass being sensitive to cool temperatures and C4 grass favoring warm or hot conditions [2], C3 grasses are also noted to be more nutritious and palatable for pastoral livestock [3,4]. Grazing often enhances the physiological and morphological differences between C3 and C4 grasses by modifying species composition and competition among the species. Due to the higher nutrient content and palatability of C3 grass plants [5], the potential effects of preferential grazing cannot be underestimated. Preferential grazing of C3 plants tends to skew species composition of fields in favour of C4 plants [6,7]. Moreover, un-grazed C4 plants tend to reach a reproductive stage with distinctive inflorescence (size and shape of spikelets).
Knowledge of C3/C4 composition of a pasture grass is important to graziers, as such information provides feedback on pasture growth rates and feed quality. This informs decisions around predictability of site productivity (including livestock carrying capacity), fodder reserves, and post-grazing recovery [8]. In Australia, earlier studies have used Landsat products for pasture grass classification. Vickery et al. [9] distinguished pasture types of different pastoral fields on the basis of species growth rate while Hill et al. [10] also used Landsat data to discriminate perennial, annual, sown, and native pasture types. Hill et al. [11] combined Landsat TM and multi-frequency SAR data to characterize and map pasture types in Western Australia. Moreover, given that C3 and C4 grass have different active growth periods, satellite optical remote sensing data has also been used to discriminate C3/C4 grass types. Wang et al. [12] used phenological metrics derived from time series MODIS surface reflectance imagery to discriminate short and tall types of C3 and C4 grasses. Similarly, a study conducted over fragmented landscapes in China fused Landsat 7 ETM+ and MODIS surface reflectance images to discriminate C3 and C4 grasses on the basis of differences in their phenological profile [13]. Peterson et al. [14] utilized multi-temporal Landsat TM bands and the normalized difference vegetation index to discriminate C3 and C4 pasture species and, as a result, observed that these species are spectrally distinguishable in spring and mid-summer. Shoko and Mutanga [15] similarly classified C3 and C4 grasses by sampling hyperspectral bands matching those of Landsat 8 OLI Sentinel 2 MSI and Worldview 2 to identify summer as the optimal season that C3 and C4 grasses in South Africa are spectrally distinguishable. Furthermore, Shoko and Mutanga [16] explored the exclusive use of Sentinel-2A to separate C3 and C4 species and found that the standard spectral bands of Sentinel-2A are capable of separating these species.
Despite the varying levels of success of the previous work, optical remote sensing is challenged by its inability to collect data on cloudy days and limited structural information of plants that can be derived from the optical wave bands. For example, the use of optical remote sensing is limited with the increasing leaf area index [17,18] and increasing proportions of non-photosynthetic senescent plant parts of the botanical composition [19,20]. To overcome these problems, other studies have explored Synthetic Aperture Radar (SAR) data. SAR imaging is different from optical remote sensing in that it makes use of microwave radiation, which is unaffected by all types of cloud, haze, and rain [21,22]. In pasture grass environment, the varying shape, size, density, orientation, and dielectric constant (moisture content) of the leaves, florets, and culms often interact with the incident microwave energy. The return microwave signal, often called the backscattering coefficient, is determined by the structural attributes of the plants and the characteristics of the SAR sensor (incidence angle, wavelength, and polarization). For instance, when the size of pasture grass components (such as the leaves or florets) is smaller than the wavelength of the probing sensor, low values of the backscattering coefficient are recorded due to specular scattering. Conversely, a canopy size that matches the wavelength of the sensor promotes diffuse scattering, which tends to increase the backscattering coefficient. Sometimes the incident microwave energy penetrates through the grass volume to interact with different vegetative components or the underlying soil surface (via moisture content and roughness). In other words, different scattering mechanisms occur when the incident microwave energy penetrates the grass volume. Different approaches have been used to derive these polarimetric scattering mechanisms [23,24,25]. The scattering processes due to the structural and moisture content information of sensing targets, proved useful for the discrimination of different crops including grasses [26,27,28,29].
The Sentinel-1A (S1) is a C-band SAR that observes the earth and provides global data with an average update interval of 12 days. Up to two polarimetric (VV/VH or HH/VH) images from the interferometric wide swath mode are currently made available to users at no cost. Some earlier studies have shown improvements to optical crop classification models using polarimetric features of time-series SAR images [30,31,32,33]. Although these past studies explored the potential of SAR data for crop classification, their objectives did not include discrimination of C3 and C4 grasses. In a situation where preferential grazing affects gross changes in the physical presentation of C3 and C4 grasses, it may be possible that SAR data may provide the means of delineating and mapping these species groups.
Differentiation in the physical characteristics of C3 and C4 grasses due to grazing may be captured through the texture of image pixels [34]. The image texture, which simply explains the tonal variation between pixels in a small neighborhood that moved across the entire image, provides detailed spatial architectural information that has been useful for feature classification. The statistical approach for extracting textural features from images has been popular thanks to Grey-Level Co-occurrence Matrix (GLCM) [35]. The GLCM textural approach is founded on second-order statistics of the frequency distribution of pixel brightness values. There are many textural metrics that can be estimated from GLCM images. In estimating these metrics, ‘weights’ are applied and these weights fall into three groups, which include the contrast, orderliness, and descriptive statistics [36]. The contrast group consists of contrast, dissimilarity, and homogeneity while the orderliness group consists of angular second moment (ASM), energy, entropy, and maximum probability (MAX). The descriptive statistics of the GLCM are mean, variance, and correlation. Further detail of these GLCM textural metrics can be found in Haralick et al. [35] and Hall-Beyer [36]. One of the areas of application of GLCM textural metrics is land cover classification. Over the years, many studies have used these GLCM textural metrics to either create or improve models that discriminate land cover types [37,38,39,40,41,42]. Treitz et al. [43] utilized GLCM textural measures derived from C-band SAR data to improve discrimination of different agricultural crops from a Kappa value of 39% to 78%. Similarly, Zhou et al. [44] relied on GLCM textural measures estimated from multi-temporal S1 images to improve the discrimination of winter wheat from other land cover types.
Random Forest (RF) is a tree ensemble machine learning technique that was developed by [45]. RF functions on the principles of bootstrap aggregation and random variable selection to grow an ensemble of decision trees, which tends to generate low correlation between the decision trees and achieve low-bias trees. For RF classification, each decision tree casts a vote for the most dominant class at a particular input feature and the class with the majority of votes becomes the output class. Many machine learning algorithms are plagued with the problem of over-fitting but RF is robust to overfitting [37,45,46]. Furthermore, RF is characteristically appropriate for handling multi-class classification and the RF process incorporates the selection of variable importance. In RF training, three parameters are primarily required including mtry, ntree, and nodesize. The mtry parameter defines the number of randomly selected features in each split of a tree node. The ntree parameter defines the number of trees to grow for each forest while the nodesize defines the minimum terminal nodes applied in the model. Practically, it is only the mtry that needs tuning since it is the only parameter that can significantly influence the predictability of an RF model [47,48]. The application of the RF method for land cover classification has been reported in many past studies [37,46,49], but only few studies have relied on RF to discriminate C3 and C4 grasses [50,51] Aside from all these characteristics of RF, this study used the RF classifier with the aim of enhancing prediction performance.
To the best of our knowledge, this work is the first time pasture grass species of a spatially heterogeneous grazing landscape have been discriminated into C3 and C4 classes using S1 data. Based on the assumption of grazing-induced morphological differences (such as leaf area and orientation, plant height, and size and shape of inflorescence) between C3 and C4 grasses, the objective of this study was to explore the ability of RF classification of multi-temporal dual-polarimetric S1 data to discriminate C3, C4, and mixed C3/C4 (MX) pasture grass species of a grazed landscape. The specific aims were to discriminate C3, C4, and MX pasture grasses using (1) polarimetric SAR features (polSAR), (2) GLCM textural features (glcmTEX), and (3) the combination of polSAR and glcmTEX features.

2. Materials and Methods

2.1. Description of Study Site and Selection of Sampling Sites

This study was conducted on one of the University of New England’s SMART Farms located near Armidale, NSW Australia (30°26′6″S, 151°37′30″E). The 740 ha property used is a complex pasture landscape, which comprises open native pasture grasslands, scattered trees, remnant vegetation communities, and native forests (Figure 1). The topography ranges from undulating to hilly. The soil in the study area is predominantly Vertosols and Ferrosols of basalt origin with Chromosol in granite areas [52] with a mean annual rainfall of 755 mm and mean annual maximum and minimum temperatures are 20.3 °C and 6.2 °C (1997–2017), respectively [53] This study site is composed of many fields of numerous pasture grass types, which have grazing livestock (e.g. sheep and cattle) rotated onto throughout the year. In this study, 20 different field sampling sites, defined by variability in soil, pasture species, and all subjected to livestock grazing were sampled (Figure 1). Each of the 20 sampling sites measured 30 m × 30 m to encapsulate the resampled 10 m × 10 m spatial resolution of the S1 imagery, which allows for a 10 m radius buffer around the ‘central pixel’ location for uncertainty in spatial registration of the image pixels. Each site was also selected on the basis of having an additional 50 m radius buffer region around it (such as no trees or shrubs), to minimize the potential confounding influence (mixed pixels) of evergreen species.

2.2. Field Measurement (Pasture Composition Data)

Field sampling campaigns were conducted between 2017 (February, July, October, and December) and 2018 (January, March, and July). The field campaigns in February and July 2017 involved only 10 sites, but this number of sites was increased to 20 in subsequent sampling dates. All of these visual surveys were conducted by the same pasture officer each sampling period. Field sampling dates within each time window were selected to coincide with S1 satellite overpasses (Table 1). Moreover, these dates were selected on the basis of no rainfall occurring three days beforehand to minimize the influence of moisture on radar backscatter signals. The geographic locations of all sampling sites were taken using a sub-meter differential GPS unit (Trimble GPS Pathfinder Pro XRS DGPS Receiver Sunnyvale, CA, USA).
The field sampling followed the BOTANAL protocol [54] where an observer would characterize the pasture species composition within 10 ‘random throws’ of a 0.5 m × 0.5 m quadrat frame within each designated sample site. In addition to the 10 throws, the observer performed a random walk over each sample site to detail any other significant species that may not have been captured in the random throw protocol.
Pasture plants observed at each sampling site were grouped into C3 and C4 classes. At any given sampling site, a 70% threshold was applied to ascribe a given class to the entire site [55]. Any site where this threshold was not met by a single class (namely C3 or C4) was allocated to an MX class (Table 2). As the image classification of C3, C4, and MX pasture classes was conducted at pixel scale (i.e., 10 m × 10 m), the dominant class of the site was assigned to every single pixel constituting that sampling site. Each sampling site was composed of nine pixels.

2.3. Pre-Processing of Sentinel-1 Data

The Single Look Complex (SLC) and Ground Range Detected (GRD) images of S1 were accessed from the Scientific Hub of the European Space Agency (ESA) [56]. Precise orbit ephemeris data from the archive of ESA was downloaded and applied to both SLC and GRD images in order to minimize errors in radiometric and geometric calibrations. The GRD images were radio-metrically corrected and filtered of random speckle noise using a Refine Lee algorithm [57]. Since the topography of study location (slope and aspect) affects radar backscattering coefficients, a 1 m digital elevation model was used to remove topographic distortions in the return reflected signals [58] and geographically matched the GRD images to the study location using a bilinear interpolation resampling method. This digital elevation model was generated by an aerial LiDAR system that was flown over the entire study site in 2013. Further details of the digital elevation model have been reported in Verma et al. [59].
Due to the high sensitivity of S1 VH polarization to plant canopy structure and biomass [60,61], backscattering coefficients in only the VH polarization mode was used for the GLCM analysis. To derive the GLCM textural features, a window size of 9 × 9 pixels moved at intervals of one pixel in all directions (0°, 45°, 90°, and 135°) of the neighborhood was explored [42]. From this, the mean values from all four directions were estimated for each GLCM textural feature. The SLC images were TOPSAR (Terrain Observation with Progress Scans SAR) split to the sub-swath that hosts the study site in order to expedite subsequent processing. The sub-swath SLC images were first radio-metrically corrected to complex values in order to perform the polarimetric decomposition. The bursts in SLC images were removed using the TOPSAR deburst technique, and then a Refine Lee polarimetric filter was applied using ‘one look’ and a 7 × 7 pixel window size to improve polarimetric information. An eigenvector dual polarization decomposition technique was then used to retrieve the scattering mechanism parameters. As with GRD images, the 1 m digital elevation model was used to terrain-correct the SLC products. The GRD and SLC images were co-located by using a GRD product image as the master image and pixel values of an SLC product as a slave image, which is then resampled into the geographical coordinates of the master image. Given the geographic size of each sampling site and the study objective of a pixel-based analysis, a 3 × 3 pixel moving window was applied to extract pixel values for all the estimated features. The backscatter values from VH polarization (hereafter referred to as VH) and backscatter values from VV polarization (hereafter referred to as VV) were extracted from the GRD images. Furthermore, the product of backscatter values of the VV and VH polarizations (hereafter, referred to as ‘polPRD’) and the ratio of VH to VV (hereafter, referred to as ‘polRAT’) were extracted. It is worth noting that the backscatter values were of gamma naught and in linear scale. On the other hand, the GLCM textural features derived from the GRD data were contrast, dissimilarity, homogeneity, angular second moment (ASM), energy, entropy, maximum value (MAX), mean, variance, and correlation. To distinguish the GLCM textural features from other features in subsequent sections of this work, all GLCM textural features were prefixed with ‘glcm’ (e.g., glcmContrast). These GLCM textural metrics are, hereafter, referred to as ‘glcmTEX’ features. The eigenvector polarimetric decomposition of the SLC data provided three parameters, which includes entropy, anisotropy, and scattering alpha. The polarimetric decomposition parameters plus VV, VH, polPRD, and polRAT are, hereafter, referred to as the ‘polSAR’ features. Pre-processing of the S1 data was exclusively performed using the Sentinel Application (SNAP) tool customized for ESA Sentinel products [62].

2.4. Model Data and Pre-Processing

The study involved 1080 instances with 17 features. The C3 class was composed of 450 instances while C4 and MX had 207 and 414 instances, respectively. The entire study data was randomly partitioned into training and testing sets, where 80% of the data was used for model training, while the remaining 20% was set aside to test the model [63]. Due to different scales of measurement of the model features and the need to reduce the feature space for improved model performance, both training and testing sets were scaled using a MinMax method. In this method, each feature is scaled to a range between 0–1 using its minimum and maximum values. These minimum and maximum values of the training set were further used to scale the testing set. As the class sizes of this study were not balanced, and to avoid overfitting, a stratified 10-fold cross validation method was used for hyper-parameter tuning [50,64]. The optimal number of features randomly selected in each split of the tree node, mtry, was selected on the basis of a minimum out-of-bag error rate (i.e., highest accuracy) resulting from a grid search between 2 and the maximum number of features. After several trial and error routines, the number of trees to grow (ntree) was set to 1000 with a minimum number of terminal nodes set to 1 (a default value for classification analysis). In model training, the Gini impurity technique was used in splitting decision tree nodes [45,65] and the mean decrease impurity index assisted in evaluating the relative importance of model features. Model features with an overall importance score of not less than 15% were selected for further analysis. A similar threshold method of feature selection for RF was recently used in Maxwell et al. [65].

2.5. Model Building and Evaluation

In this study, three different RF models were built and evaluated. The first RF model was created using polSAR features while the second model was created using glcmTEX features. Lastly, the polSAR and glcmTEX features were combined to create the third model (hereafter called ‘COMB’). The evaluation of all models was based on overall accuracy, the Kappa coefficient, and the F1 score. The F1 score was selected not only because of the unevenness in class distribution but to also evaluate the class-wise performance of the models. Data preprocessing, analysis, and RF modeling were all performed in R using the CARET package [66]

3. Results

3.1. Spatio-Temporal Distribution of C3, C4, and Mixed C3/C4 (MX) Pasture Grass Types

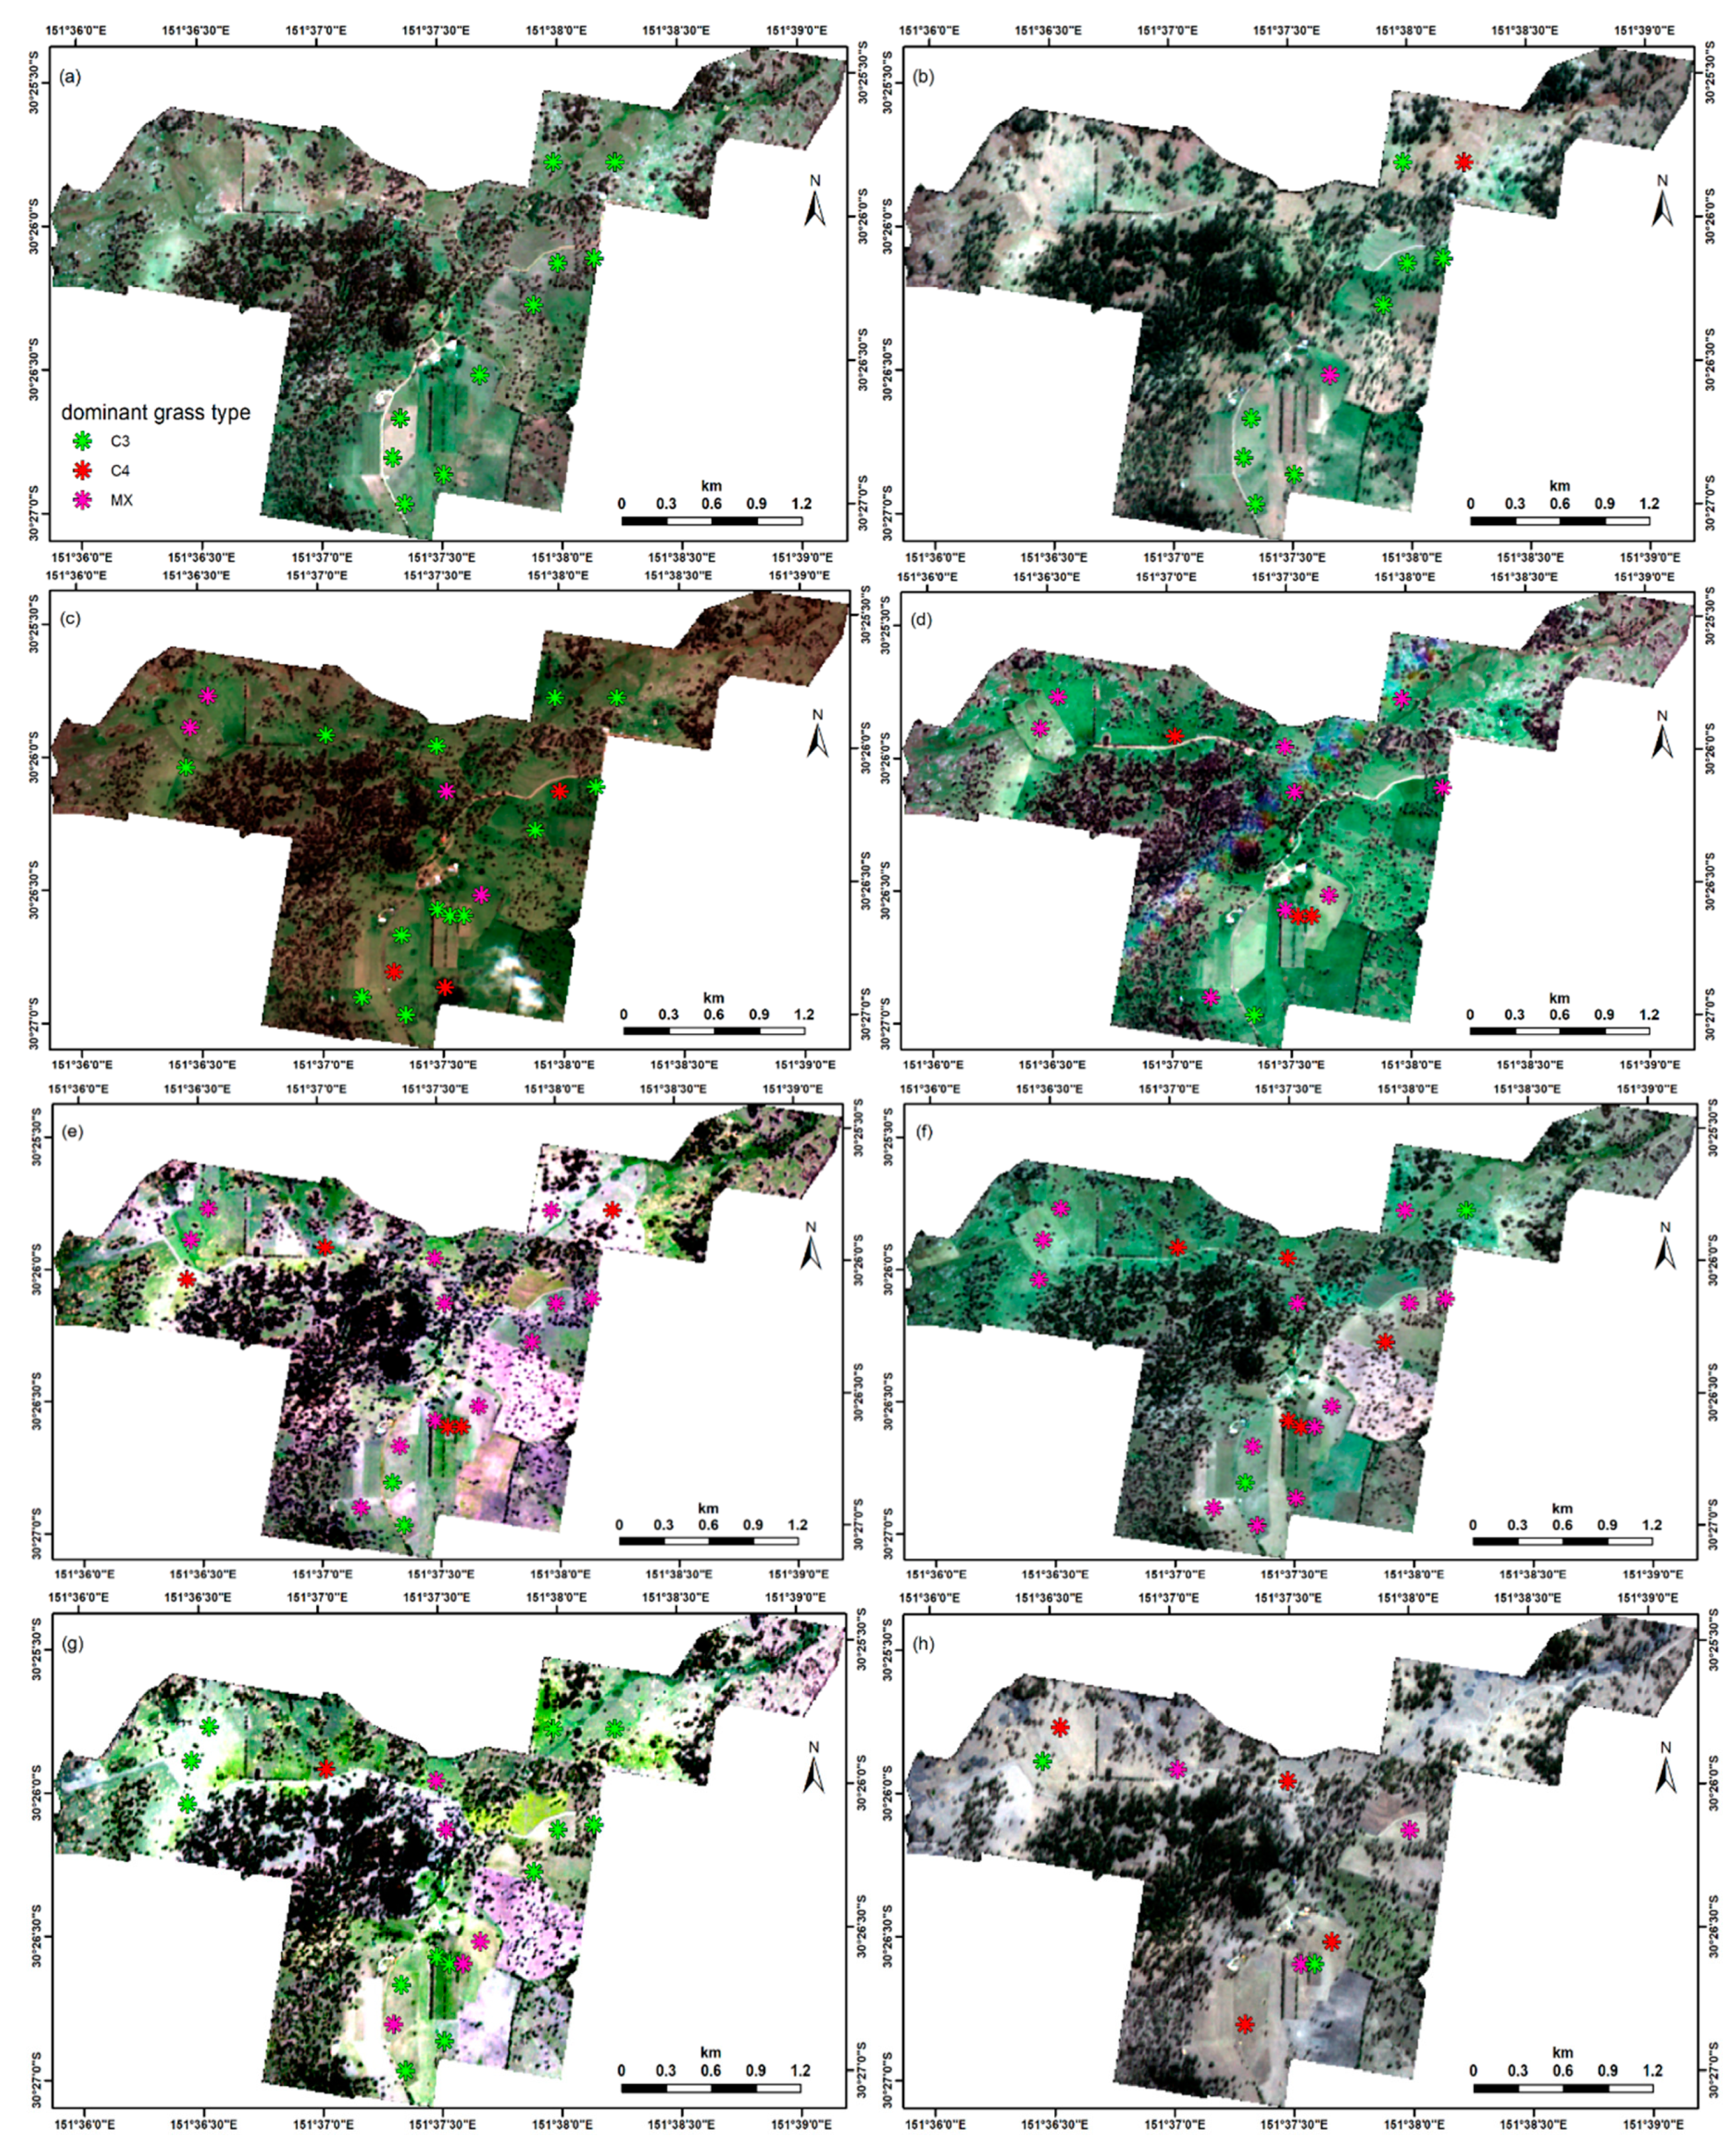
Depending upon the season and levels of grazing intensity, different dominant grass species were observed between sites (Figure 2). In February 2017, only C3 grassess were observed in all the sampled sites, but this composition changed in July 2017 since some of the sites became predominantly MX (1 out of 10 sites) and C4 (1 out of 10 sites) grasses. In October 2017 (spring season), the proportions of C4 and MX grasses increased as more sites were sampled. Although, altogether C3 grasses were preponderant (13 out of 20 sites) in this spring season, three of the sites were observed as C4-dominant whereas four sites were dominated by MX.
In the summer months of December 2017 as well as January and February 2018, the majority of the sites were composed of MX with C3 grasses being the least dominant (Figure 2d–f). In December 2017, nine out of the 13 sites were predominantly composed of MX while C4 species were observed in three sites only. The dominance of C3 was observed in only one site. Similar distribution was observed for January 2018 since the dominance of MX was observed in 12 different sites (out of possible 19 sites) while C4 dominated five sites and C3 species accounted for only two sites. Moreover, in February 2018, 13 out of 20 sites were characterized with MX whereas five sites represent C4 grass. Meanwhile, C3 grasses predominantly occurred in two sites only.
In March 2018 (Autumn), the proportion of the C3 grasses increased since the majority of the sites were composed of this grass type (12 out of 19 sites). While there was only one site composed of C4 grasses, five sites were dominated by mixed C3/C4 grasses (Figure 2g). In July 2018 (winter), only nine sites were reported on due to using the other sites for other experiments. In this date, pasture grasses were generally dry with post-grazing remnants of different sward heights and densities. Two site were identified with C3 grasses while four sites were characterized with C4 grasses, and three sites were predominantly MX grasses (Figure 2h).

3.2. Optimal Number of Candidate Features

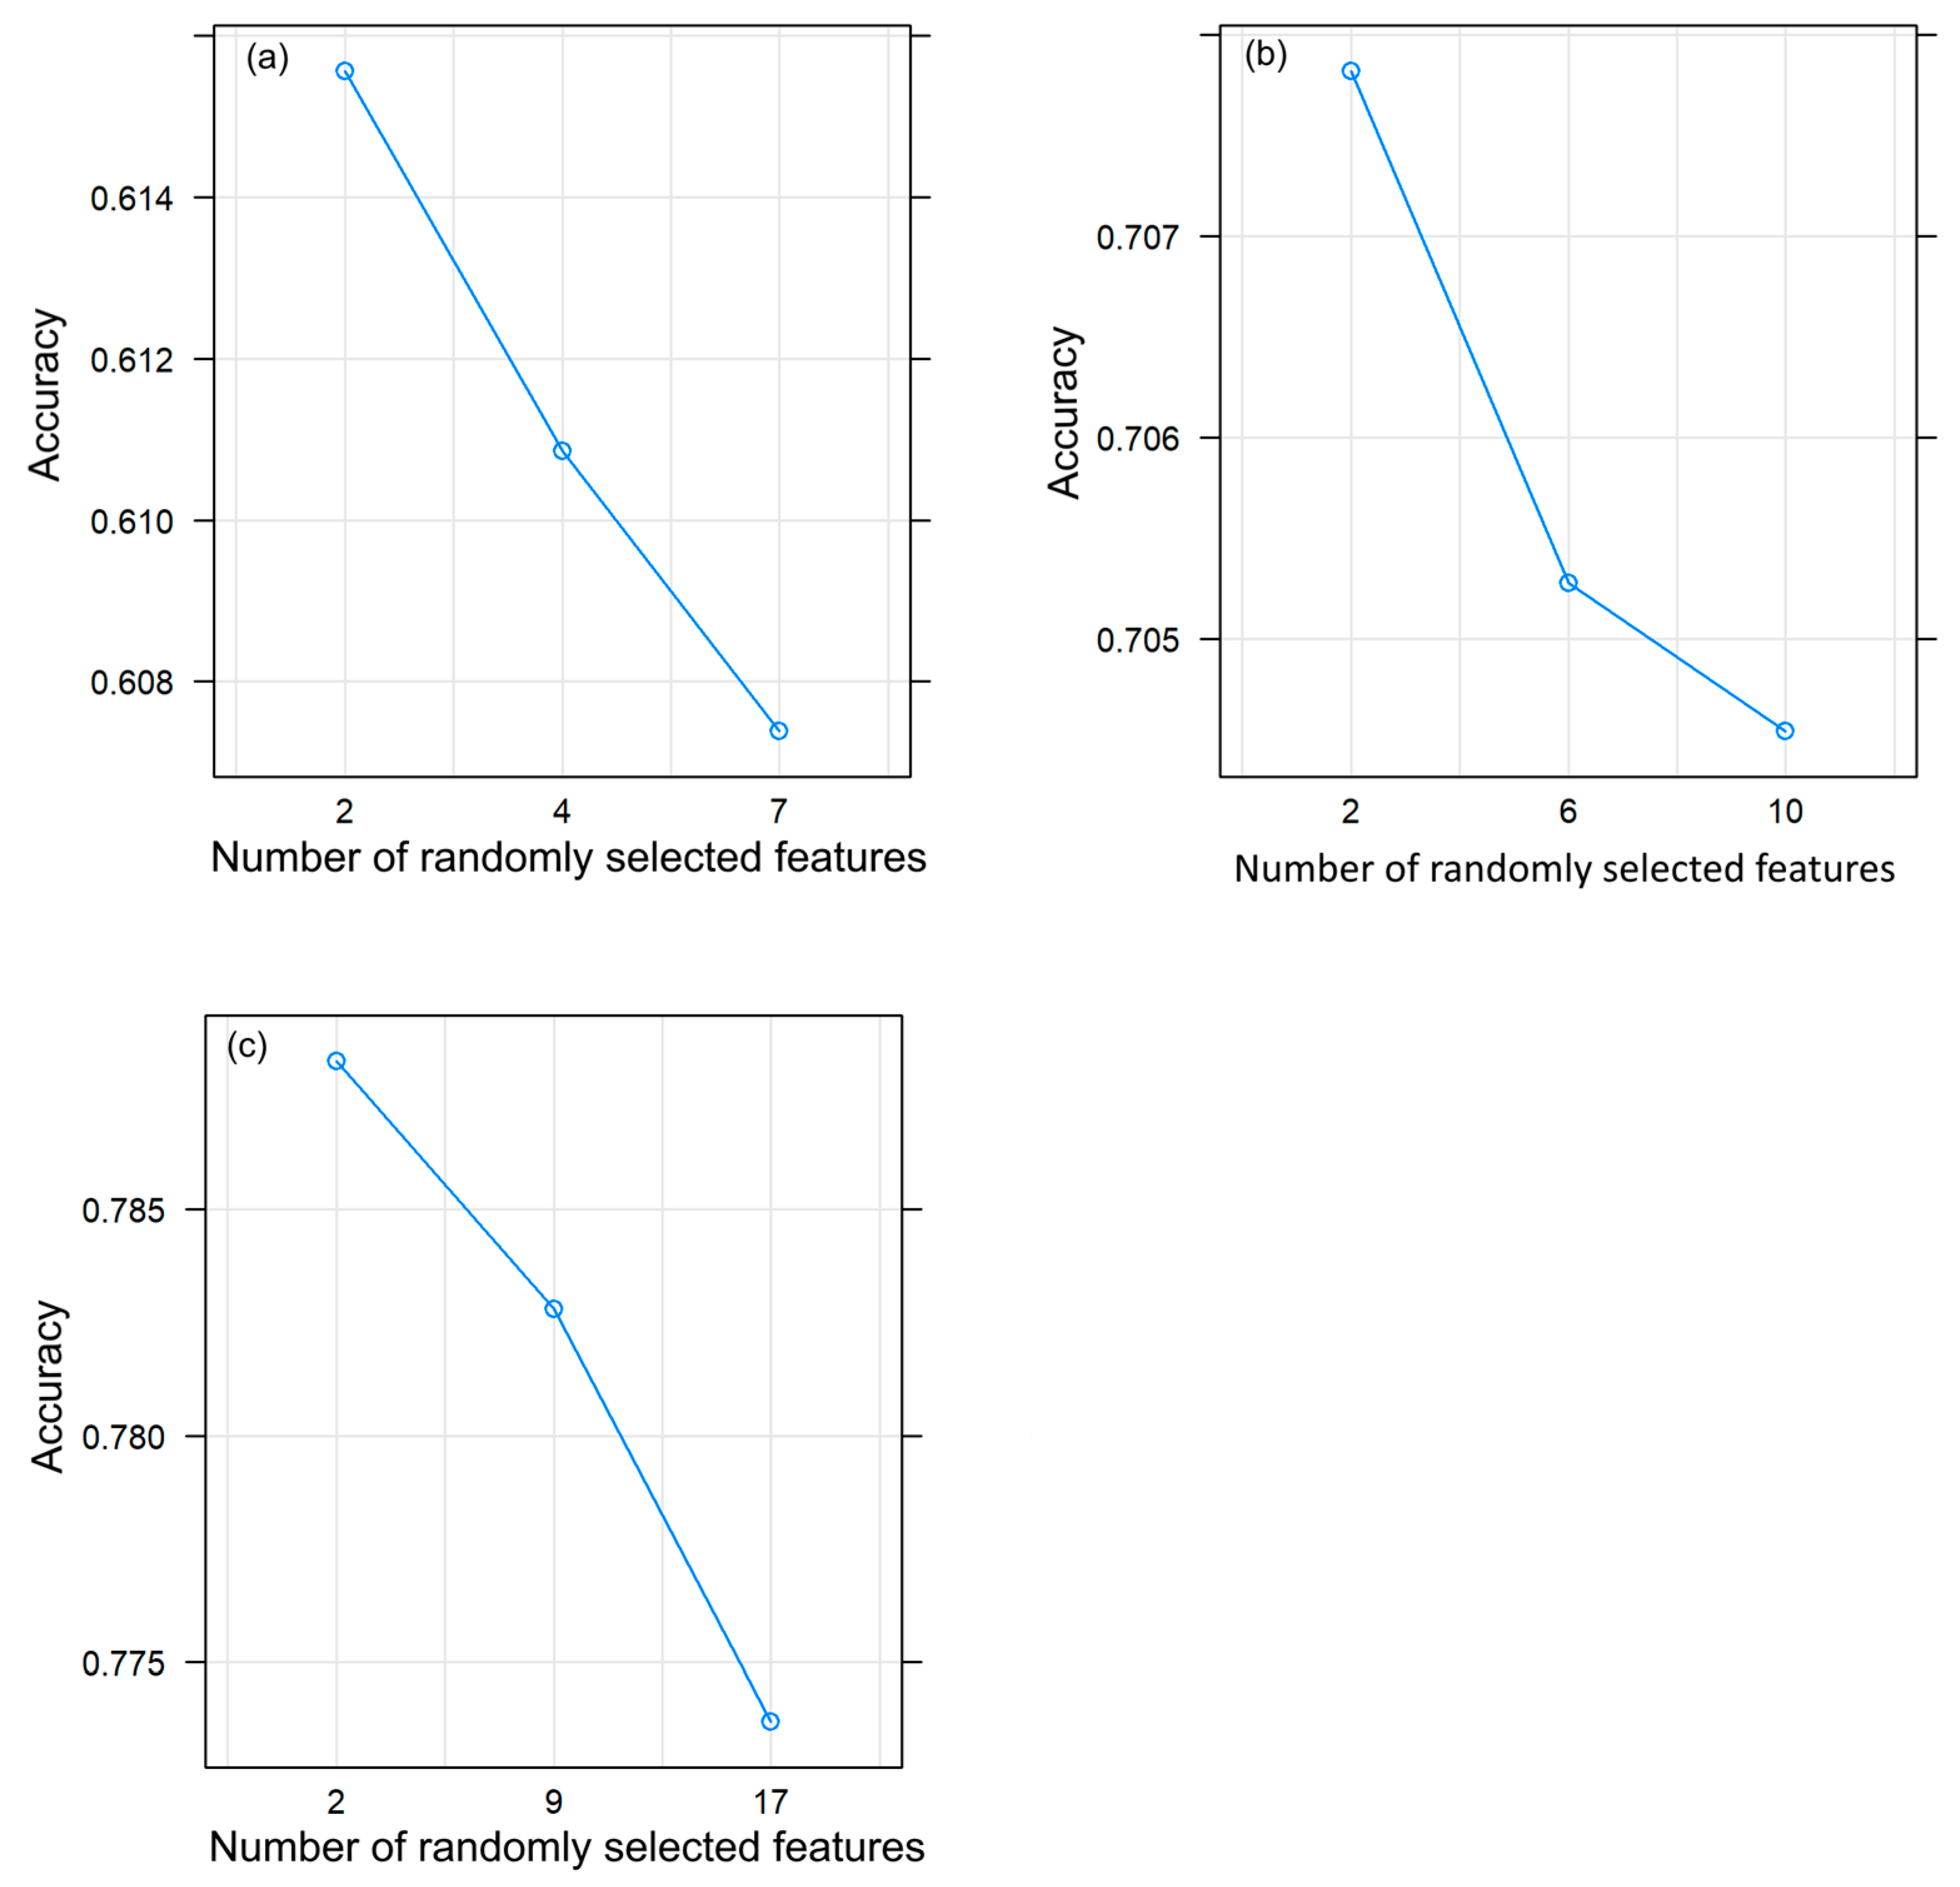
The optimal number of candidate features randomly sampled at each split for all the three models are summarized in Figure 3. For all of the models, the optimal number of features in each random split was 2 (Figure 3a–c) since that was the size of the mtry parameter that produced the highest classification accuracies. Specifically, a classification accuracy of approximately 61.6% (0.616) was observed for the polSAR model whereas the highest accuracy for the glcmTEX model was approximately 70.8% (0.708). Meanwhile, this optimal mtry value produced an accuracy of approximately 79% (0.790) for the COMB model.

3.3. Selection of Important Model Features

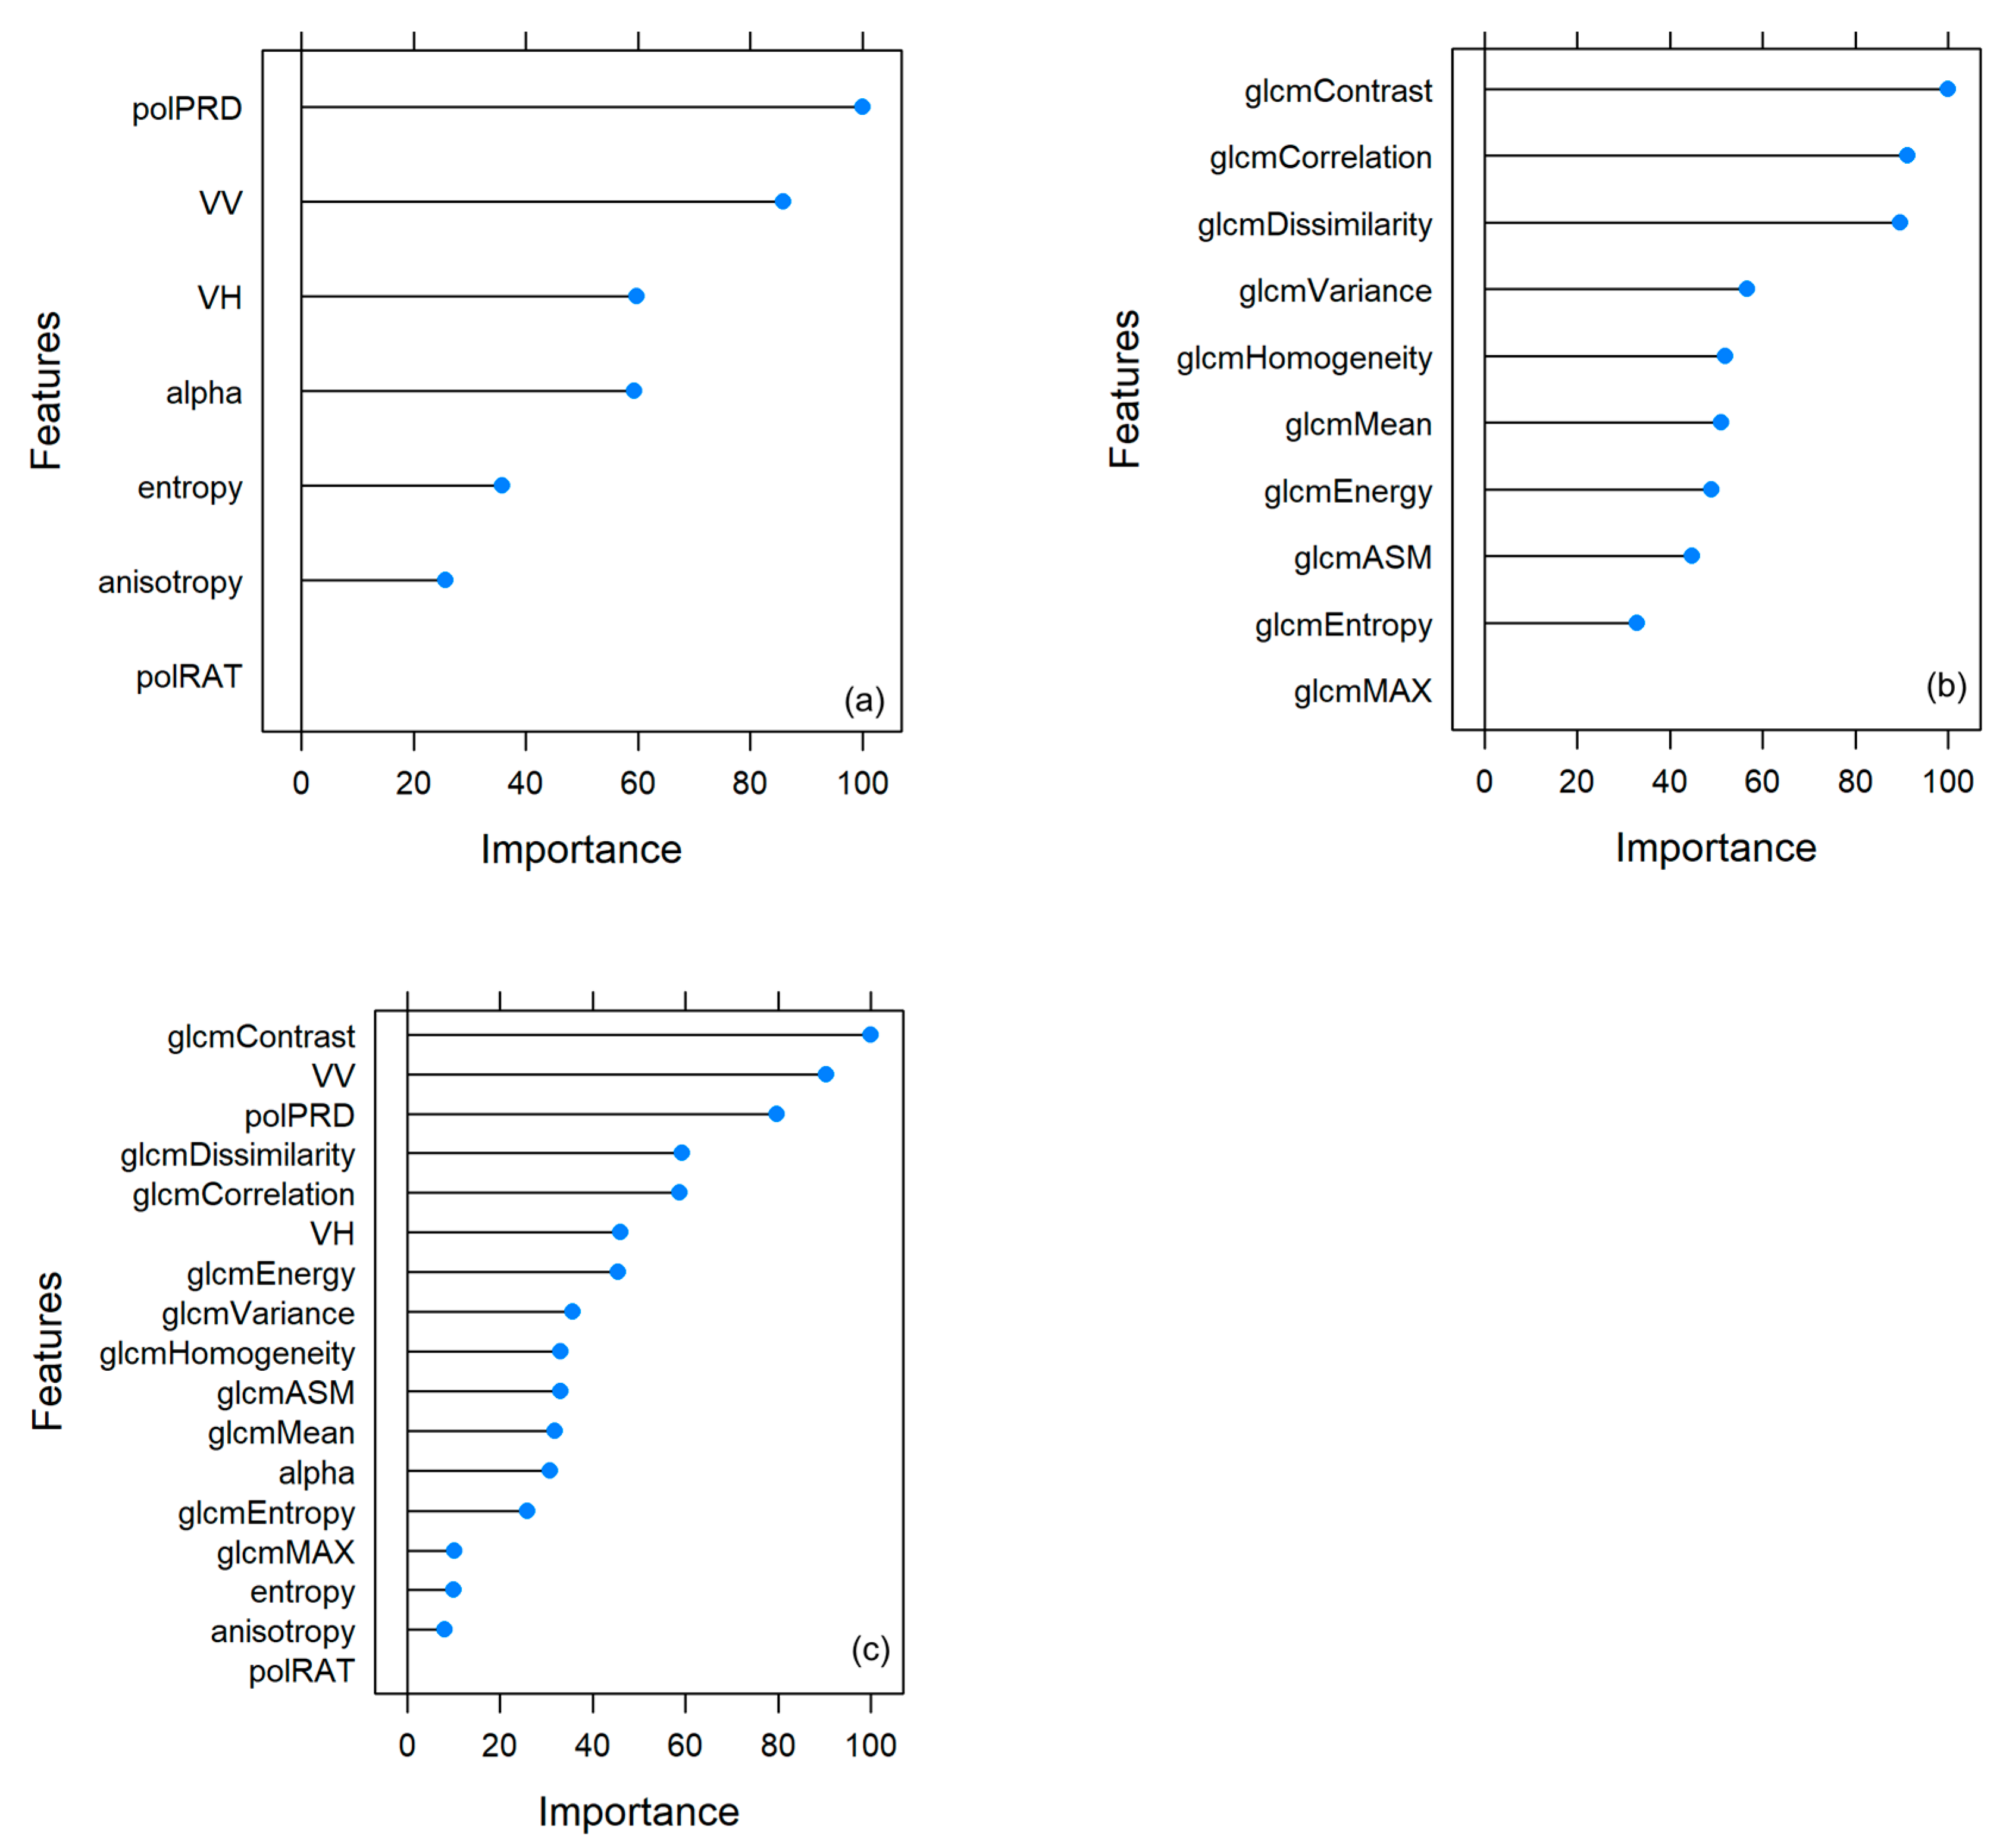
The contribution of each model feature in explaining the discrimination between C3, C4, and MX pasture grasses is captured in Figure 4. The x-axis of the figure shows the performance of the features scaled to 100. In other words, a higher value on the x-axis means that the feature was more important in discriminating between the three classes. For the polSAR model, the features that contributed significant information in discriminating the different grass species, as ranked in a descending order of magnitude, were polPRD (100%), the backscattering value of VV polarisation (85.9%), and the backscattering value of VH polarisation (59.7%). The scattering angle (alpha) contributed similar magnitude of information as the backscattering in the VH polarization (59.3%). Meanwhile, the scattering entropy and anisotropy information were important for as much as 35.7% and 25.7%, respctively, in separating C3, C4, and MX grasses. The polRAT feature was redundant since it contributed no information in the model. The important features, ranked from highest to lowest, for the glcmTEX model have been reported in Figure 4b. The glcmContrast textural metric offered the most highly variable information (100%) to differentaiate between C3, C4, and MX grasses. The second and third most important model features were observed in glcmCorrelation and glcmDissimilarity, as the information contributed by these features were ranked as 91.3% and 89.7%, respectively. Meanwhile, the overall information contribution of glcmVariance, glcmHomogeneity, and glcmMean to the glcmTEX model was 56.6%, 51.9%, and 51.1%, respectively. The ‘orderliness’ metrics in glcmEnergy, glcmASM, and glcmEntropy contributed varied information of the magnitudes 48.9%, 44.8%, and 32.9% in the model. However, the glcmMAX was redundant in the model as the information it carried might have been contributed by other retained features. The performance of the features in the COMB model is illustrated in Figure 4c. While all the features contributed considerable information (importance score > 15%) in discriminating C3, C4, and MX grass species, the polRAT feature was redundant since its contrubution was nullified by other retained features. The information from glcmContrast, VV, and polPRD was the most significant in discriminating the grass types as the feature importance scores observed were 100%, 90.4%, and 79.6%, respectively. The information contributed by other features were similar in their magnitude of influence of the model performance including glcmDissimilarity (59.2%), glcmCorrelation (58.7%), VH (46.0%), and glcmEnergy (45.4%). The other features were glcmVariance (35.6%), glcmHomogeneity (33.1%), glcmASM (33.1%), glcmMean (31.9%), and alpha (30.7%). Furthermore, similar levels of information were observed for glcmMAX (10.1%), entropy (10.0%), and anisotropy (8.1%). This combined model showed that not only polRAT and glcmMAX were redundant but entropy and anisotropy contributed insignificant information towards the model (Figure 4c).

3.4. The Performance of polSAR, glcmTEX, and COMB Models

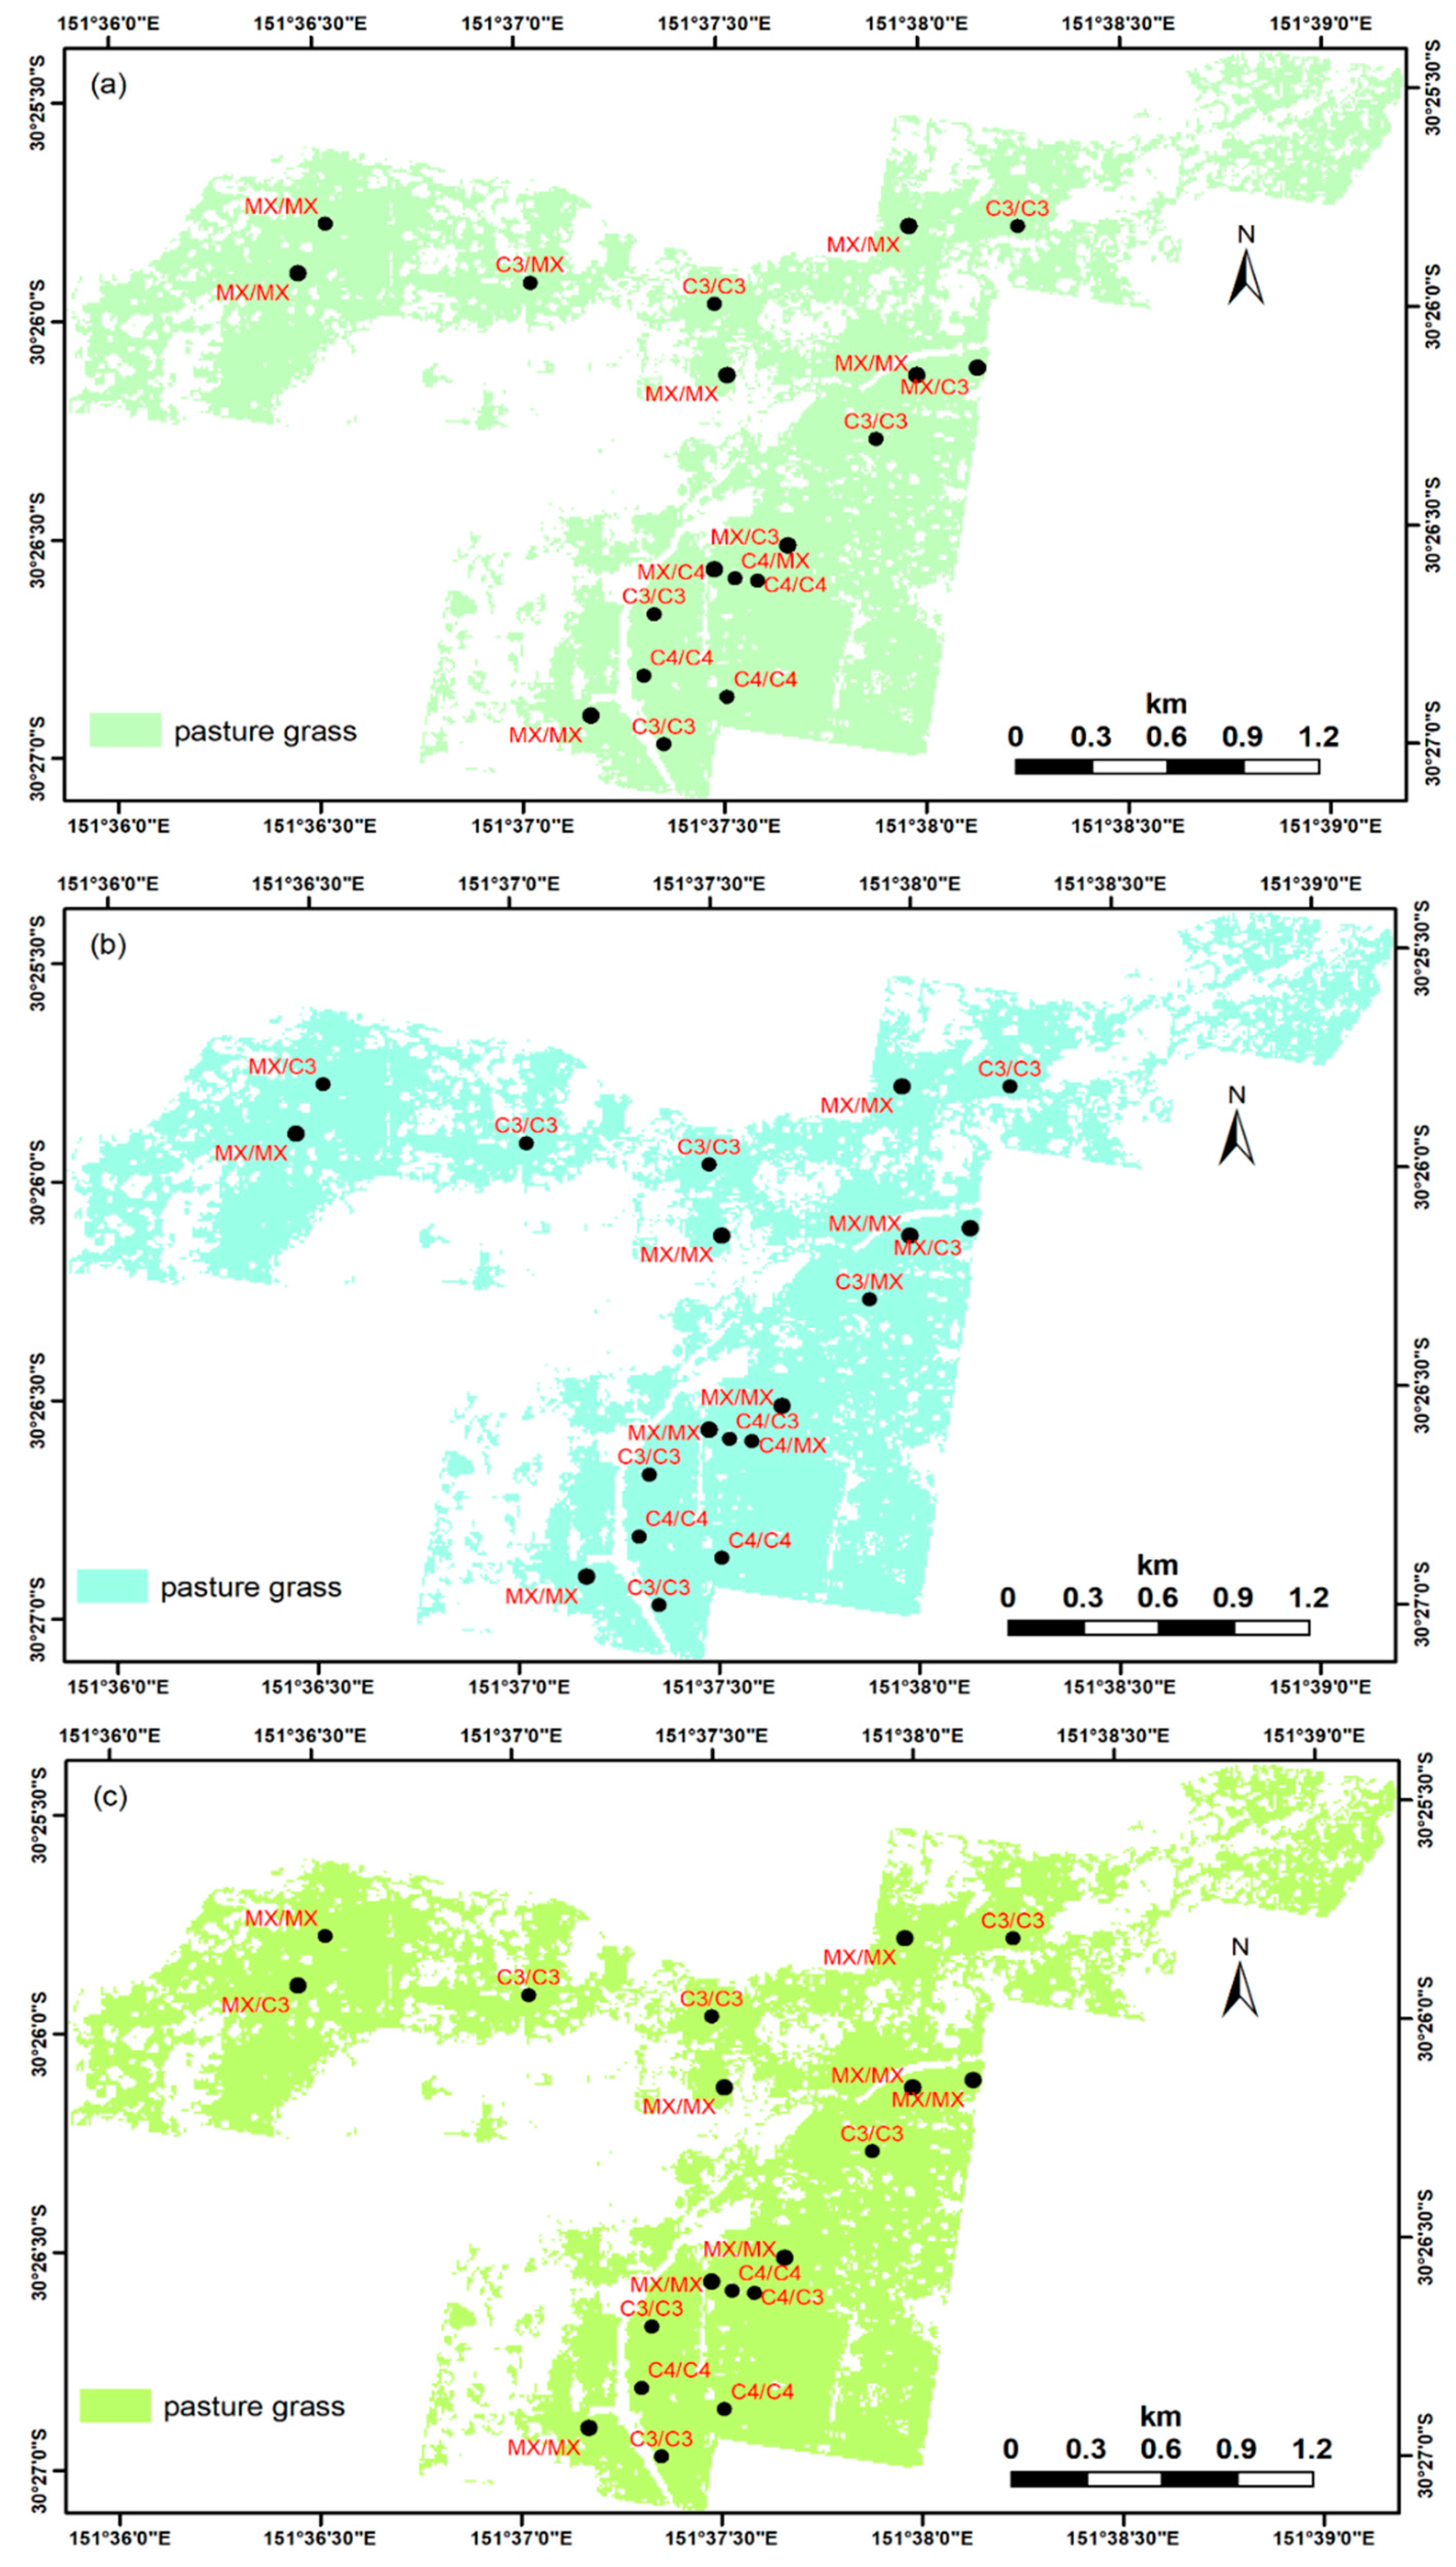
The three models performed differently in discriminating the pasture grasses into C3, C4, and MX components. The spatial representation of these models’ performance is illustrated in Figure 5. The observed versus the predicted class (i.e., illustrated in Figure 5 as ‘observed class/predicted class’) for a subset of the more than 1000 instances spanning the spatio-temporal changes in the grasses that can be estimated visually for polSAR (Figure 5a), glcmTEX (Figure 5b), and the COMB (Figure 5c). Spatially, Figure 5 displays instances the polSAR model predicted a class correctly while the glcmTEX model misclassified that instance and vice versa. Hence, the combination of the polSAR and glcmTEX (COMB model) showed minimization of the prediction errors (Figure 5c). Although, for the sake of clarity, all of the observations were not reported in Figure 5, the complete result of the performance of the models is presented in Figure 6 (showing both class-wise and overall accuracies). The class-wise performance of the model was captured by the F1 score while the overall model performance was explained by the accuracy and Kappa values. The polSAR model showed similar performance in discriminating C3 and MX species. The F1 score for C3 and MX was 0.70 while that of the C4 was only 0.59. The overall accuracy of this model was 68% with a Kappa coefficient of 0.49 (Figure 6a). The use of the textural information produced performances, which have also been summarized in Figure 6b. In terms of class-wise predictions, this model achieved an F1 score of 0.76 for C3, 0.62 for C4, and 0.75 for MX. On the whole, the textural features achieved an accuracy of 73% (Kappa = 0.57) in separating the three classes. The merging of the polarimetric SAR and textural information improved the individual performance of polSAR and glcmTEX (Figure 6a). The F1 score for C3 was 0.89 whereas C4 and MX classes were 0.81 and 0.84, respectively. Furthermore, the general performance of this model was an improvement over that of the stand-alone models (polSAR and glcmTEX) in that an overall accuracy of 86% (Kappa = 0.77) was achieved.

4. Discussion

4.1. Spatio-Temporal Changes in C3 and C4 Pasture Grasses

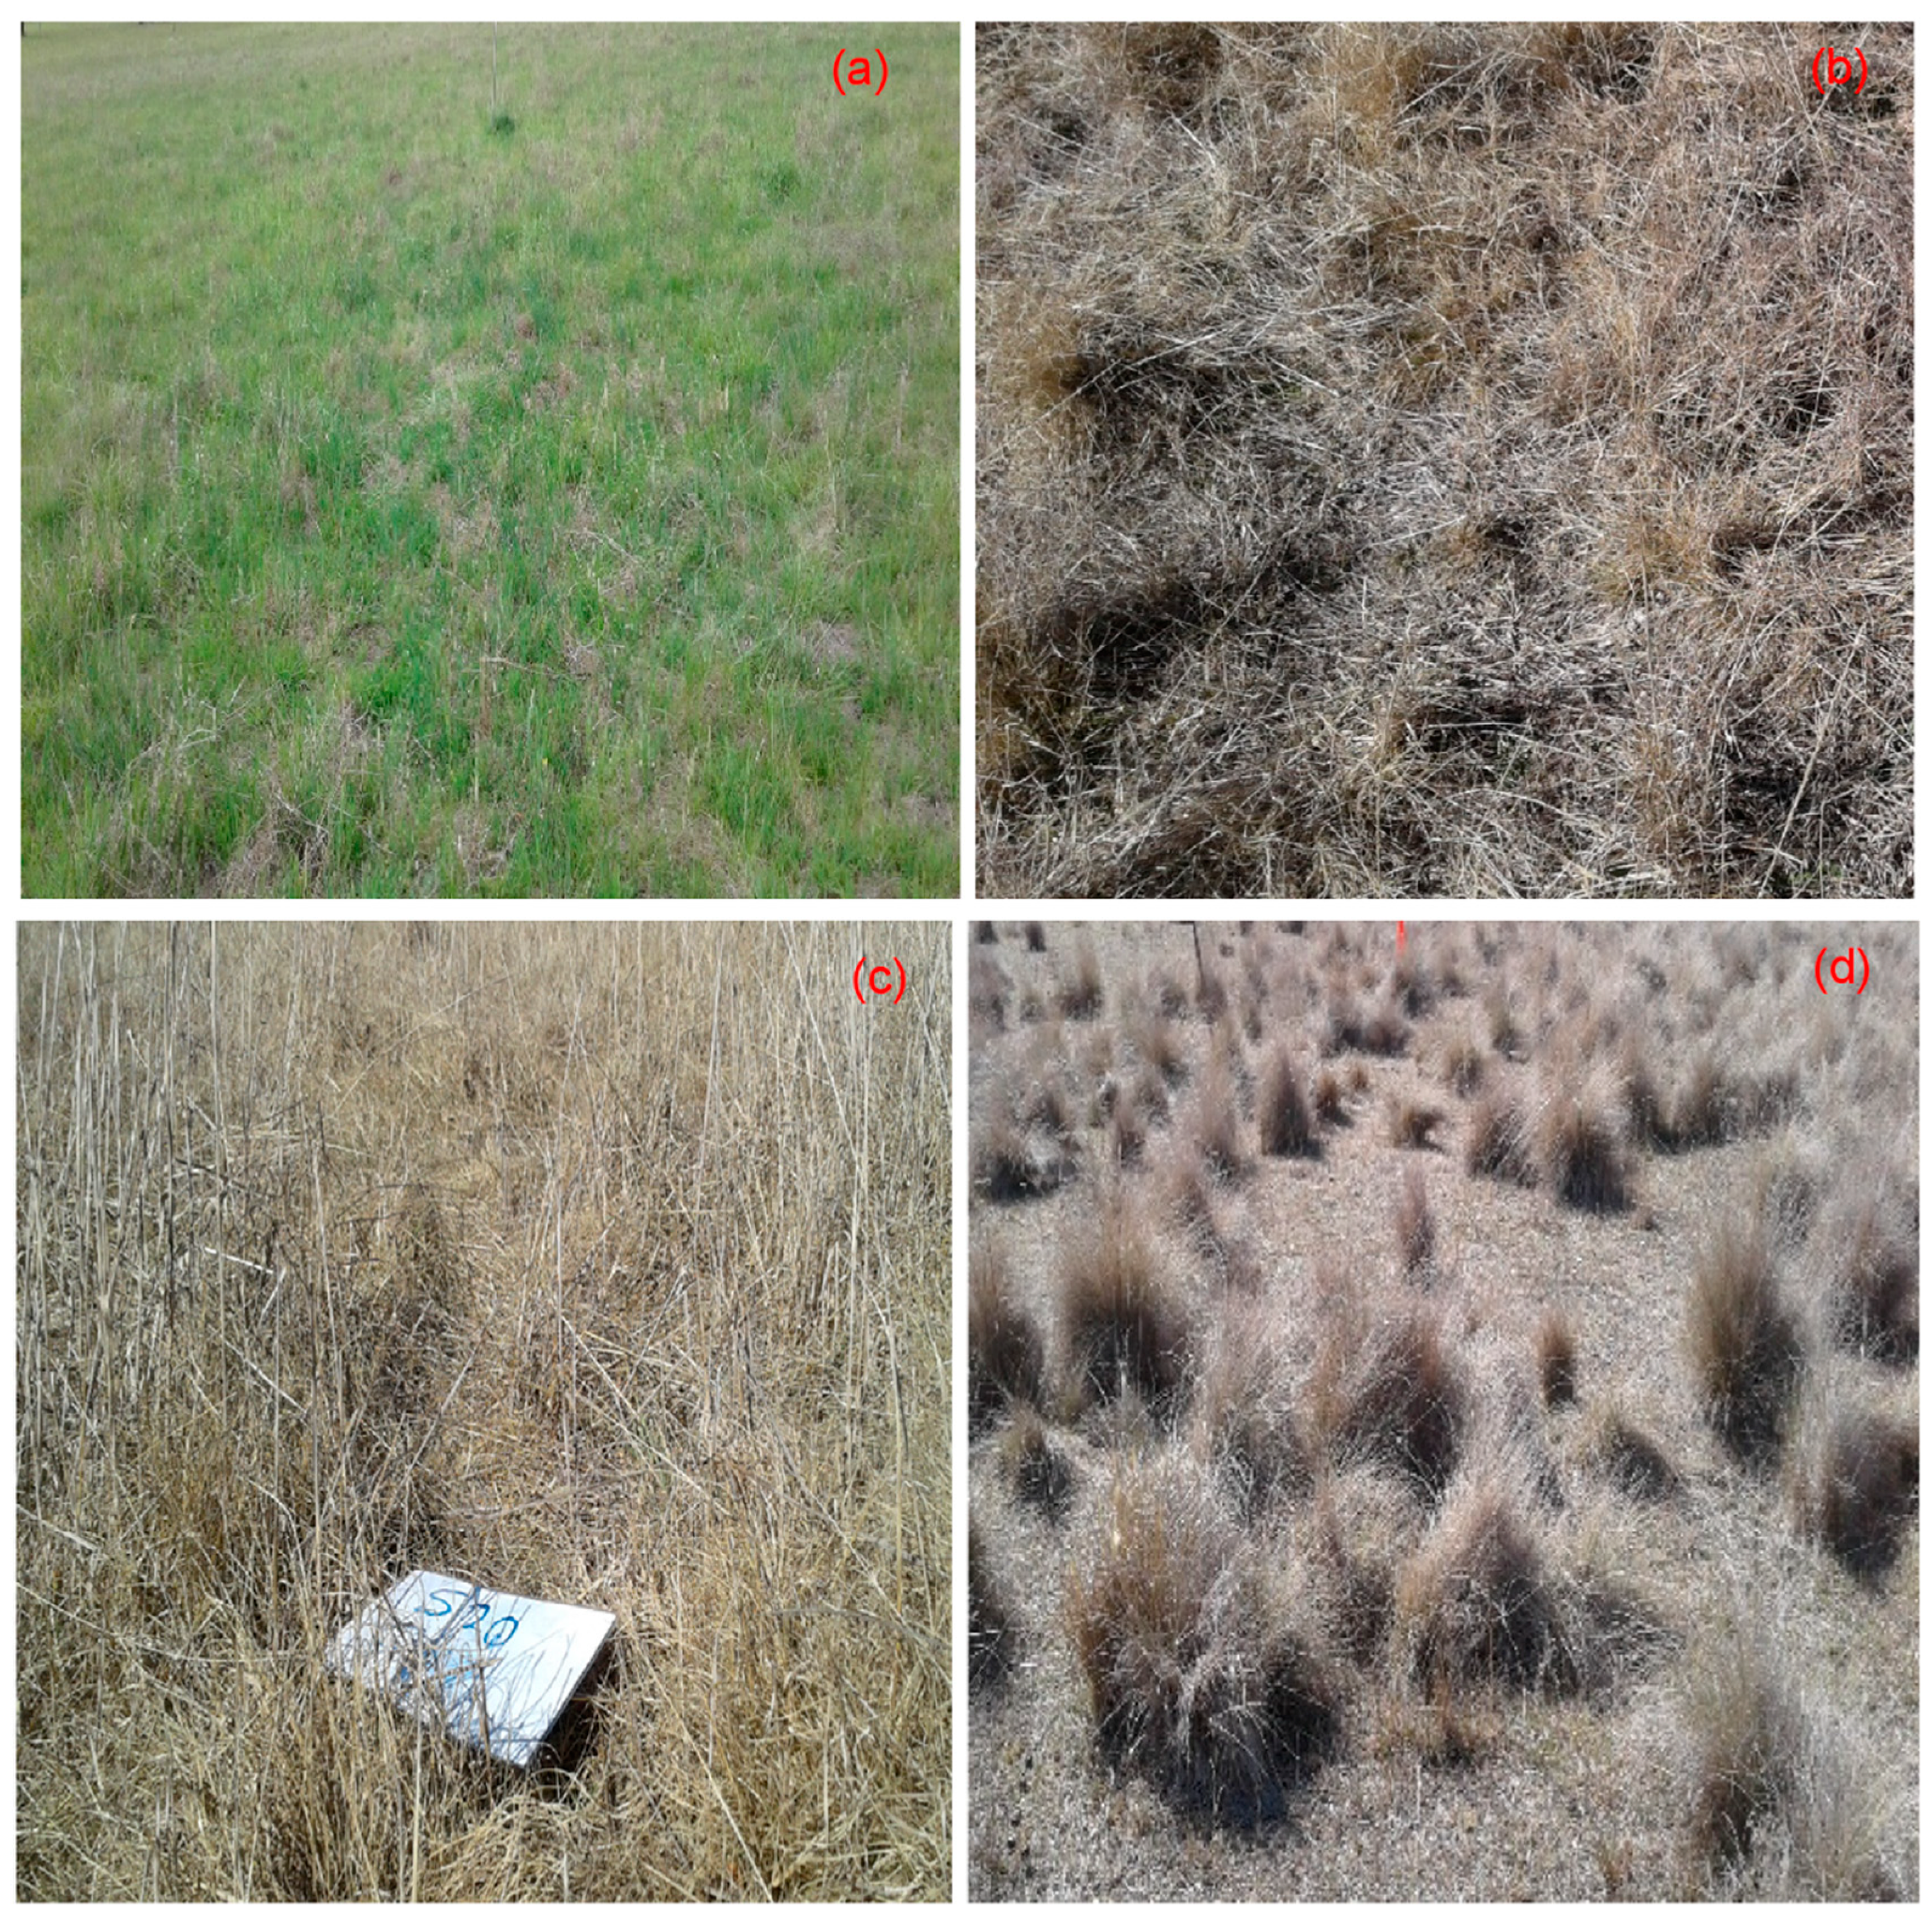
The phenological growth profile of plants due to changes in climate (mainly rainfall and temperature) often encourages the classification of C3 and C4 grasses (Figure 7a,b). In Australia, the C3 grasses are noted to favor cool conditions with air temperatures below 15 °C or high altitude areas [2] and such observation is justified by the result of this current study, as shown in July and October 2017 and March 2018 measurements (Figure 2). Particularly, the summer months preceding March 2018 (Figure 2d–f) revealed a limited presence of dominant C3 grasses due to warm temperatures. However, as cool temperatures arrived in March and perhaps were complemented with autumn rains, the C3 grass species began to dominate the site (Figure 2g). The preponderance of C3 grass in the late summer season (February 2017) in Figure 2a could be attributed to summer rainfalls coinciding with cool temperatures. Although on a regional scale, Hattersley [2] reported a conspicuous decrease in C4 grasses due to the high altitude of this study area (>1200 m). It can, however, be observed in this study that in the summer (December 2017, January and February 2018), there was an increase in the C4 grass as many of the pre-summer C3 grass sites became either C4 or MX class (Figure 2d–f). Although the site used in this study is characterized with a high altitude, it is not surprising to observe preponderance of C4 sites since an earlier study reported a strong positive correlation between summer temperatures of more than 30 °C and C4 grasses in Australia [2]. The C4 grasses become more dominant among the sites when high summer temperatures are accompanied with rainfalls. The spatial and temporal distribution of C3 and C4 grasses cannot be limited to only environmental factors such as air temperature, rainfall, and topography, especially in active livestock grazing environments. Aside from the role of climate and topography, our sampling sites were grazed and, thus, we observed the contributions of grazing activity to changes in the botanical composition of C3 and C4 pasture species (Figure 7c,d).

4.2. Optimal Hyperparameter and Evaluation of the Random Forest Classification Models

In the RF classification analysis, the number of randomly selected features made available for splitting each decision tree node cannot be underestimated given that this parameter (mtry) minimizes the correlation between decision trees. Although an excessively large mtry value might result in feature selection bias by selecting features with the largest effects, a very low mtry value could lead to a model with poor performance since it may exclude the more relevant features for a split. In this study, the influence of the mtry parameters on the models was not investigated, but some earlier studies have shown that mtry value can affect the predictability of the model [47,48].
The different features constituting a model contributed dissimilar depths of information in expressing variability between C3, C4, and MX grasses (Figure 4). All of the polSAR features except polRAT contributed to the discrimination of the pasture classes. The two highest contributing polSAR features were polPRD and VV (Figure 4a). This result is not surprising given that the VH component of the polPRD provides information on the differential volume scattering between the species types. At the same time, the VV polarization is sensitive to surface scattering and is likely to have accounted for the effects of livestock grazing (e.g. exposed soil surface). Furthermore, discriminating the pasture grasses due to differences in canopy structures appeared useful given that the alpha parameter also contributed significantly to the model performance. The usefulness of scattering mechanisms (as elicited via alpha) in pasture grass classification of a similar environment has been reported in an earlier study [11]. In terms of class-wise performance, the polSAR model was more than 10% accurate in predicting C3 and MX grass species than the C4. This performance may be attributed to higher attenuation of incident microwave energy at C4 sites. Unlike the other species, C4 sites were often left un-grazed leaving tall, dense, and matured canopies, which tend to absorb the incident radar pulses (Figure 7c). The relatively lower accuracy in predicting C4 grasses, however, affected the model’s overall prediction accuracy since it achieved only 68%.
For this same study area, an earlier study observed the importance of textural features estimated from C-band SAR in characterizing native and improve pasture types [42]. In this study, all the textural features, except for glcmMAX, contributed significantly in separating C3, C4, and MX grasses. The textural features are spatial statistical indices that capture the structural variations in the plant canopies since the plants grow through time and are also grazed by livestock (grazing environment). Like the polSAR model, the glcmTEX model was more accurate in predicting C3 and MX grasses than the C4 species (Figure 6). In other words, the relatively higher errors observed in glcmTEX and polSAR when predicting C4 grass species is likely to be caused by higher attenuation of the incident microwave energy since this energy travels through tall and dense C4 grass species (due to C4 species being less grazed). Compared to polSAR, the textural features captured more variability in all the species types. The prediction accuracies, both in class-wise and overall terms, of the glcmTEX model were higher than that of the polSAR (Figure 6b). This performance of the glcmTEX was expected, as grazing promotes differentiation in plant morphology and growth rates [6,8], which results in tonal variations in pixels. Specifically, preferential grazing of C3 species by livestock as experienced in our sampling sites encouraged incomparable biomass and sward heights with C4 species often taller and having more biomass (Figure 7a). However, some unpalatable C3 species such as Poa labillardierei with distinctive tall, dense, and tufted canopy structure are also not grazed by livestock, which provides different spatial properties from the neighboring pixels at grazed locations (Figure 7b).
The combination of the polSAR and glcmTEX features resulted in a model (COMB) that improved the stand-alone polSAR and glcmTEX models (Figure 6c). The major features that contributed to the COMB model were VV, glcmContrast, polPRD, alpha, and glcmCorrelation (Figure 4c). Specifically, the COMB model outperformed the polSAR and glcmTEX models by 19% and 13%, respectively, for C3 grass prediction. In the case of C4 prediction, the COMB model’s accuracy exceeded the polSAR model by 22% and the glcmTEX model by 19%. Moreover, the COMB model outperformed polSAR and glcmTEX models by 14% and 9%, respectively, for the prediction of mixed C3/C4 grasses. Altogether, the COMB model improved the polSAR model by 18% and the glcmTEX model by 13%. The clear reason for this improved performance lies in the combined strengths of polarimetric and textural information of SAR data. Furthermore, this classification result is consistent with previous studies, which also reported improvements in land cover classification by integrating GLCM textural measures with spectral data [40,41,43,44]. It is, however, worth noting that features such as polRAT, entropy, anisotropy, and glcmMAX contributed insignificant magnitude of information to explain variability between the pasture classes. In multi-dimensional studies with relationships between features (especially in how those features were derived), it is not surprising to have some features contributing little or no information to the model outcome because the information those redundant features carried might have been contributed by other retained features.
Many of the past studies involving C3 and C4 grass classification used products of optical satellite remote sensing, which contrasts this current study given that we explored SAR data. However, the classification accuracies of this study compare with the results of these earlier studies [14,15,16,50]. This study used random forest classification models in order to increase performance of discrimination between C3, C4, and MX grass species. Therefore, the study does not presume that these models are transferable to different sites since such sites might have characteristics that are not similar to the current study site.

4.3. Evaluation of Livestock Grazing Activities in Discriminating C3, C4, and Mixed C3/C4 Pasture Grasses

The study site is grazed by sheep and cattle, but, at the moment, no data is collected on grazing activities. Meanwhile, it is evident on the fields that livestock often discriminate grazing between C3 and C4 grasses (Figure 7c,d). The degree of preferential grazing of C3 and C4 pasture species varies between the sampling sites. Preferential grazing is typically high in under-stocked fields with a large amount of available feed (especially in peak growing seasons) and especially when the field is composed of different types of pasture with varied nutritive quality. In this study, the occurrence of preferential grazing of C3 pasture grass suggests that the leaf area of the C3 species were likely reduced, with shorter height, and due to the continuous process of regeneration and recovery, the canopies exhibit a totally different morphology. The impacts of preferential grazing are likely to influence the radar backscattering process since the canopy of C3 dominant grass interactions with incident C-band microwave energy may be dominated by a surface scattering mechanism. Alternatively, the grazed C3 dominant sites with less dense and short sward height might have less absorption and depolarization of microwave energy due to the reduced number of scatterers that interact with the incident radiation.

4.4. Importance and Uncertainty Analysis of the Study

In Australia, classification of pasture grass types including annual, perennial, and native grasses on a large scale using satellite-based optical and SAR data is not a recent development. As early as the late 1990s, Hill et al. [10] included NOAA-AVHRR and classified Landsat TM data to discriminate perennial, annual, and native pasture grasses. In this same study area, Hill et al. [42] earlier explored single date C-band RADARSAT-1 data to discriminate and characterize pasture types including improved and native species. However, this study is the first time C3 and C4 pasture grasses of the study area have been discriminated from space-borne SAR. The results of this work show that SAR is capable of separating C3 and C4 grasses, and is even more accurate in predicting C3 grass species in the presence of grazing. In effect, this study, in part, reveals the value of SAR remote sensing in improving the understanding of the dynamism of grazing activities. Additionally, this study implied the importance of complementing pasture grass phenology with livestock grazing effects in discriminating plant species of different nutritive and palatability values. In the future, the results of this study can be improved with the measurement of grazing intensity to further the interpretation of preferential grazing of C3 and C4 grasses. The potential of SAR data to discriminate C3 and C4 grasses looks promising by virtue of the observations in this study and other past land cover/use classification studies.
However, in grazing environments like our study site, the pasture sward height and density is reduced, which may enhance the influence of soil roughness and moisture on the incident microwave energy to, in turn, promote high radar backscattering coefficients. As C3 grasses tend to be more grazed, C3-dominant sites are likely to be dominated by surface scattering due to the contribution from the exposed soil (soil moisture and soil roughness). In such an event, the use of the SAR to discriminate the plants based on the physical characteristics of their canopies becomes unreliable. Moreover, preferential grazing of the C3 grasses may limit SAR’s predictability of C4 species as incident microwave traveling through tall and dense C4 grasses (limitedly grazed due to less palatability), get absorbed or depolarized. Another condition that can limit the potential of SAR in discriminating the plants is the canopy moisture levels in senescence or the dormancy period. During the winter, post-grazing remnants of the plants left behind are all dry and, thus, likely to cause low radar backscatter values due to a low dielectric constant (canopy moisture) of the canopy. In other words, in dry seasons, when there is little or no grazing activity that contributes to morphological differences in the plants, it is likely that C3 and C4 grasses are differentiated by sward height and density of the post-grazing pasture remnants.

5. Conclusions

Sentinel-1 C-band synthetic aperture radar data has proven capable of discriminating C3, C4, and mixed C3/C4 fields under livestock preferential grazing. In this study, random forest classification models were created using various features derived from polarimetric synthetic aperture radar (polSAR model) and grey-level co-occurrence matrix textural features (glcmTEX model) to discriminate C3, C4, and mixed C3/C4. The polSAR model discriminated C3 and mixed C3/C4 grasses with accuracy of 70% while this model achieved 59% prediction accuracy for C4 grass. The overall prediction accuracy of the polSAR model was 68% (Kappa = 0.49). On the other hand, the glcmTEX model accounted for 76% of the C3 grasses, 62% for C4 grasses, and 75% for mixed C3/C4 sites. The overall prediction accuracy of the glcmTEX model was, however, 73% (Kappa = 0.57). The polarimetric SAR and GLCM textural features were combined into another model (COMB). The COMB model, by drawing the individual strengths of its components, offered higher classification performance than the stand-alone models. This model predicted C3, C4, and mixed C3/C4 grasses at accuracy values of 89%, 81%, and 84%, respectively. Meanwhile, the overall prediction accuracy of the COMB model was 86% (Kappa = 0.77). Altogether, Sentinel-1 is useful for monitoring pasture grass types of a grazing environment.

Author Contributions

R.A.C. and D.W.L. conceived and designed the experiments; R.A.C. and C.E. performed the experiments; R.A.C. wrote the manuscript; D.W.L. and C.E. contributed to the manuscript.

Funding

This research received no external funding.

Acknowledgments

The first author acknowledges receipt of a Tuition Fee Scholarship from the University of New England. Food Agility CRC Ltd is funded under the Commonwealth Government CRC Program. The CRC Program supports industry-led collaborations between industry, researchers, and the community. All authors gratefully acknowledge the contribution of Derek Schneider, Joshua Stover, and Karl Anderson (all from the UNE-PARG) for their assistance in field sampling and useful comments.

Conflicts of Interest

The authors declare no conflict of interest.

References

  1. Ueno, O. Structural and biochemical characterization of the C3-C4 intermediate Brassica gravinae and relatives, with particular reference to cellular distribution of Rubisco. J. Exp. Bot. 2011, 62, 5347–5355. [Google Scholar] [CrossRef] [PubMed]
  2. Hattersley, P.W. The distribution of C3 and C4 grasses in Australia in relation to climate. Oecologia 1983, 57, 113–128. [Google Scholar] [CrossRef]
  3. Lodge, G.; Whalley, R. Seasonal variations in the herbage mass, crude protein and in-vitro digestibility of native perennial grasses on the north-west slopes of New South Wales. Rangel. J. 1983, 5, 20–27. [Google Scholar] [CrossRef]
  4. Archer, K.A.; Robinson, G.G. Agronomic potential of native grass species on the Northern Tablelands of New South Wales. II. Nutritive value. Aust. J. Agric. Res. 1988, 39, 425–436. [Google Scholar] [CrossRef]
  5. McPherson, G.R.; Rasmussen, G.A. Seasonal herbivory effects on herbaceous plant communities of the Edwards Plateau. Tex. J. Sci. 1989, 41, 59–70. [Google Scholar]
  6. Zhang, Q.; Ding, Y.; Ma, W.; Kang, S.; Li, X.; Niu, J.; Hou, X.; Li, X.; Sarula. Grazing primarily drives the relative abundance change of C4 plants in the typical steppe grasslands across households at a regional scale. Rangel. J. 2014, 36, 565–572. [Google Scholar] [CrossRef]
  7. Davies, K.W.; Boyd, C.S.; Bates, J.D. Eighty Years of Grazing by Cattle Modifies Sagebrush and Bunchgrass Structure. Rangel. Ecol. Manag. 2018, 71, 275–280. [Google Scholar] [CrossRef]
  8. Mikhailova, E.A.; Bryant, R.; Cherney, D.; Post, C.; Vassenev, I. Botanical composition, soil and forage quality under different management regimes in Russian grasslands. Agric. Ecosyst. Environ. 2000, 80, 213–226. [Google Scholar] [CrossRef]
  9. Vickery, P.J.; Hill, M.; Donald, G. Satellite derived maps of pasture growth status: Association of classification with botanical composition. Aust. J. Exp. Agric. 1997, 37, 547–562. [Google Scholar] [CrossRef]
  10. Hill, M.J.; Vickery, P.J.; Furnival, E.P.; Donald, G.E. Pasture land cover in eastern Australia from NOAA-AVHRR NDVI and classified Landsat TM. Remote Sens. Environ. 1999, 67, 32–50. [Google Scholar] [CrossRef]
  11. Hill, M.J.; Ticehurst, C.J.; Lee, J.-S.; Grunes, M.R.; Donald, G.E.; Henry, D. Integration of optical and radar classifications for mapping pasture type in Western Australia. IEEE Trans. Geosci. Remote Sens. 2005, 43, 1665–1681. [Google Scholar] [CrossRef]
  12. Wang, C.; Hunt, E.R.; Zhang, L.; Guo, H. Phenology-assisted classification of C3 and C4 grasses in the U.S. Great Plains and their climate dependency with MODIS time series. Remote Sens. Environ. 2013, 138, 90–101. [Google Scholar] [CrossRef]
  13. Liu, X.; Bo, Y.; Zhang, J.; He, Y. Classification of C3 and C4 Vegetation Types Using MODIS and ETM+ Blended High Spatio-Temporal Resolution Data. Remote Sens. 2015, 7, 15244–15268. [Google Scholar] [CrossRef] [Green Version]
  14. Peterson, D.L.; Price, K.P.; Martinko, E.A. Discriminating between cool season and warm season grassland cover types in northeastern Kansas. Int. J. Remote Sens. 2002, 23, 5015–5030. [Google Scholar] [CrossRef]
  15. Shoko, C.; Mutanga, O. Seasonal discrimination of C3 and C4 grasses functional types: An evaluation of the prospects of varying spectral configurations of new generation sensors. Int. J. Appl. Earth Obs. Geoinf. 2017, 62, 47–55. [Google Scholar] [CrossRef]
  16. Shoko, C.; Mutanga, O. Examining the strength of the newly-launched Sentinel 2 MSI sensor in detecting and discriminating subtle differences between C3 and C4 grass species. ISPRS J. Photogramm. Remote Sens. 2017, 129, 32–40. [Google Scholar] [CrossRef]
  17. Lamb, D.W.; Steyn-Ross, M.; Schaare, P.; Hanna, M.M.; Silvester, W.; Steyn-Ross, A. Estimating leaf nitrogen concentration in ryegrass (Lolium spp.) pasture using the chlorophyll red-edge: Theoretical modelling and experimental observations. Int. J. Remote Sens. 2002, 23, 3619–3648. [Google Scholar] [CrossRef]
  18. Prabhakara, K.; Hively, W.D.; McCarty, G.W. Evaluating the relationship between biomass, percent groundcover and remote sensing indices across six winter cover crop fields in Maryland, United States. Int. J. Appl. Earth Obs. Geoinf. 2015, 39, 88–102. [Google Scholar] [CrossRef] [Green Version]
  19. Asrar, G.; Fuchs, M.; Kanemasu, E.; Hatfield, J. Estimating Absorbed Photosynthetic Radiation and Leaf Area Index from Spectral Reflectance in Wheat 1. Agron. J. 1984, 76, 300–306. [Google Scholar] [CrossRef]
  20. Gallo, K.P.; Daughtry, C.S.T. Techniques for Measuring Intercepted and Absorbed Photosynthetically Active Radiation in Corn Canopies 1. Agron. J. 1986, 78, 752–756. [Google Scholar] [CrossRef]
  21. Schmullius, C.C.; Evans, D.L. Review article Synthetic aperture radar (SAR) frequency and polarization requirements for applications in ecology, geology, hydrology, and oceanography: A tabular status quo after SIR-C/X-SAR. Int. J. Remote Sens. 1997, 18, 2713–2722. [Google Scholar] [CrossRef]
  22. McNairn, H.; Brisco, B. The application of C-band polarimetric SAR for agriculture: A review. Can. J. Remote Sens. 2004, 30, 525–542. [Google Scholar] [CrossRef]
  23. Cloude, S.R.; Pottier, E. A review of target decomposition theorems in radar polarimetry. IEEE Trans. Geosci. Remote Sens. 1996, 34, 498–518. [Google Scholar] [CrossRef]
  24. Freeman, A.; Durden, S.L. Three-component scattering model to describe polarimetric SAR data. IEEE Trans. Geosci. Remote Sens. 1998, 36, 963–973. [Google Scholar] [CrossRef]
  25. Yamaguchi, Y.; Moriyama, T.; Ishido, M.; Yamada, H. Four-component scattering model for polarimetric SAR image decomposition. IEEE Trans. Geosci. Remote Sens. 2005, 43, 1699–1706. [Google Scholar] [CrossRef]
  26. Waske, B.; Braun, M. Classifier ensembles for land cover mapping using multitemporal SAR imagery. ISPRS J. Photogramm. Remote Sens. 2009, 64, 450–457. [Google Scholar] [CrossRef]
  27. Buckley, J.R.; Smith, A.M. Monitoring grasslands with radarsat 2 quad-pol imagery. In Proceedings of the 2010 IEEE International Geoscience and Remote Sensing Symposium, Honolulu, HI, USA, 25–30 July 2010; pp. 3090–3093. [Google Scholar]
  28. Haldar, D.; Chakraborty, M.; Manjunath, K.R.; Parihar, J.S. Role of Polarimetric SAR data for discrimination/biophysical parameters of crops based on canopy architecture. ISPRS Int. Arch. Photogramm. Remote Sens. Spat. Inf. Sci. 2014, XL–8, 737–744. [Google Scholar] [CrossRef]
  29. Smith, A.M.; Buckley, J.R. Investigating RADARSAT-2 as a tool for monitoring grassland in western Canada. Can. J. Remote Sens. 2011, 37, 93–102. [Google Scholar] [CrossRef]
  30. Skriver, H. Crop classification by multitemporal C- and L-band single- and dual-polarization and fully polarimetric SAR. IEEE Trans. Geosci. Remote Sens. 2012, 50, 2138–2149. [Google Scholar] [CrossRef]
  31. Larrañaga, A.; Álvarez-Mozos, J. On the added value of quad-pol data in a multi-temporal crop classification framework based on RADARSAT-2 imagery. Remote Sens. 2016, 8, 335. [Google Scholar] [CrossRef]
  32. Mascolo, L.; Lopez-Sanchez, J.M.; Vicente-Guijalba, F.; Nunziata, F.; Migliaccio, M.; Mazzarella, G. A complete procedure for crop phenology estimation with PolSAR data based on the complex Wishart classifier. IEEE Trans. Geosci. Remote Sens. 2016, 54, 6505–6515. [Google Scholar] [CrossRef]
  33. Bargiel, D. A new method for crop classification combining time series of radar images and crop phenology information. Remote Sens. Environ. 2017, 198, 369–383. [Google Scholar] [CrossRef]
  34. Berberoğlu, S.; Akin, A.; Atkinson, P.M.; Curran, P.J. Utilizing image texture to detect land-cover change in Mediterranean coastal wetlands. Int. J. Remote Sens. 2010, 31, 2793–2815. [Google Scholar] [CrossRef] [Green Version]
  35. Haralick, R.M.; Shanmugam, K.; Its’Hak, D. Textural Features for Image Classification. IEEE Tran. Syst. Man Cybern. 1973, SMC-3, 610–621. [Google Scholar] [CrossRef]
  36. Hall-Beyer, M. GLCM Texture: A Tutorial v. 3.0 March 2017; University of Calgary: Calgary, AB, Canada, 2017. [Google Scholar]
  37. Rodriguez-Galiano, V.F.; Chica-Olmo, M.; Abarca-Hernandez, F.; Atkinson, P.M.; Jeganathan, C. Random Forest classification of Mediterranean land cover using multi-seasonal imagery and multi-seasonal texture. Remote Sens. Environ. 2012, 121, 93–107. [Google Scholar] [CrossRef]
  38. Beekhuizen, J.; Clarke, K.C. Toward accountable land use mapping: Using geocomputation to improve classification accuracy and reveal uncertainty. Int. J. Appl. Earth Obs. Geoinf. 2010, 12, 127–137. [Google Scholar] [CrossRef]
  39. Wang, M.; Fei, X.; Zhang, Y.; Chen, Z.; Wang, X.; Tsou, J.Y.; Liu, D.; Lu, X. Assessing texture features to classify coastal wetland vegetation from high spatial resolution imagery using completed local binary patterns (CLBP). Remote Sens. 2018, 10, 778. [Google Scholar] [CrossRef]
  40. Wikantika, K.; Uchida, S.; Yamamoto, Y. An evaluation of the use of integrated spectral and textural features to identify agricultural land cover types in Pangalengan, West Java, Indonesia. Jpn. Agric. Res. Q. 2004, 38, 137–148. [Google Scholar] [CrossRef]
  41. Zhang, X.; Feng, X.; Jiang, H. Object-oriented method for urban vegetation mapping using IKONOS imagery. Int. J. Remote Sens. 2010, 31, 177–196. [Google Scholar] [CrossRef]
  42. Hill, M.J.; Smith, A.M.; Foster, T.C. Remote Sensing of Grassland with RADARSAT; Case studies from Australia and Canada. Can. J. Remote Sens. 2000, 26, 285–296. [Google Scholar] [CrossRef]
  43. Treitz, P.M.; Howarth, P.J.; Filho, O.R.; Soulis, E.D. Agricultural crop classification using SAR tone and texture statistics. Can. J. Remote Sens. 2000, 26, 18–29. [Google Scholar] [CrossRef]
  44. Zhou, T.; Pan, J.; Zhang, P.; Wei, S.; Han, T. Mapping winter wheat with multi-temporal SAR and optical images in an urban agricultural region. Sensors 2017, 17, 1210. [Google Scholar] [CrossRef] [PubMed]
  45. Breiman, L. Random Forests. Mach. Learn. 2001, 45, 5–32. [Google Scholar] [CrossRef] [Green Version]
  46. Gislason, P.O.; Benediktsson, J.A.; Sveinsson, J.R. Random Forests for land cover classification. Pattern Recognit. Lett. 2006, 27, 294–300. [Google Scholar] [CrossRef]
  47. Díaz-Uriarte, R.; Alvarez de Andrés, S. Gene selection and classification of microarray data using random forest. BMC Bioinform. 2006, 7, 3. [Google Scholar] [CrossRef] [PubMed]
  48. Shi, D.; Yang, X. An Assessment of Algorithmic Parameters Affecting Image Classification Accuracy by Random Forests. Available online: https://www.ingentaconnect.com/content/asprs/pers/2016/00000082/00000006/art00010%3bjsessionid=3e039vgfeg5ce.x-ic-live-03# (accessed on 20 November 2018).
  49. Adelabu, S.; Dube, T. Employing ground and satellite-based QuickBird data and random forest to discriminate five tree species in a Southern African Woodland. Geocarto Int. 2015, 30, 457–471. [Google Scholar] [CrossRef]
  50. Yan, D.; de Beurs, K.M. Mapping the distributions of C3 and C4 grasses in the mixed-grass prairies of southwest Oklahoma using the Random Forest classification algorithm. Int. J. Appl. Earth Obs. Geoinf. 2016, 47, 125–138. [Google Scholar] [CrossRef]
  51. Adjorlolo, C.; Mutanga, O.; Ismail, R.; Cho, M.A. Optimizing spectral resolutions for the classification of C3 and C4 grass species, using wavelengths of known absorption features. J. Appl. Remote Sens. 2012, 6, 063560. [Google Scholar] [CrossRef]
  52. Isbell, R.F. The Australian Soil Classification; Australian soil and land survey handbook; CSIRO Australia: Collingwood, VIC, Australia, 1996; ISBN 978-0-643-05813-2. [Google Scholar]
  53. BoM Climate Statistics for Australian Locations. Available online: http://www.bom.gov.au/climate/averages/tables/cw_056037_All.shtml (accessed on 21 October 2018).
  54. Tothill, J.C.; Jones, R.M.; Hargreaves, J.N.G.; Commonwealth Scientific and Industrial Research Organization (Australia); Division of Tropical Crops and Pastures. BOTANAL: A Comprehensive Sampling and Computing Procedure for Estimating Pasture Yield and Composition; CSIRO, Division of Tropical Crops and Pastures: Brisbane, Australia, 1978; ISBN 978-0-643-02797-8. [Google Scholar]
  55. Liu, C.; Berry, P.M.; Dawson, T.P.; Pearson, R.G. Selecting thresholds of occurrence in the prediction of species distributions. Ecography 2005, 28, 385–393. [Google Scholar] [CrossRef] [Green Version]
  56. Open Access Hub. Available online: https://scihub.copernicus.eu/ (accessed on 22 October 2018).
  57. Lee, J.-S. Refined filtering of image noise using local statistics. Comput. Graph. Image Process. 1981, 15, 380–389. [Google Scholar] [CrossRef] [Green Version]
  58. Crabbe, R.A.; Lamb, D.W. Estimating Biophysical Variables of Pasture Cover Using Sentinel-1 Data; Precision Agriculture NZ Inc.: Christchurch, New Zealand, 2017. [Google Scholar]
  59. Verma, N.; Lamb, D.; Reid, N.; Wilson, B. Comparison of Canopy Volume Measurements of Scattered Eucalypt Farm Trees Derived from High Spatial Resolution Imagery and LiDAR. Remote Sens. 2016, 8, 388. [Google Scholar] [CrossRef]
  60. Le Toan, T.; Beaudoin, A.; Riom, J.; Guyon, D. Relating forest biomass to SAR data. IEEE Trans. Geosci. Remote Sens. 1992, 30, 403–411. [Google Scholar] [CrossRef]
  61. Ranson, K.J.; Sun, G. Northern forest classification using temporal multifrequency and multipolarimetric SAR images. Remote Sens. Environ. 1994, 47, 142–153. [Google Scholar] [CrossRef]
  62. Toolboxes. Available online: https://sentinel.esa.int/web/sentinel/toolboxes (accessed on 22 October 2018).
  63. Lyons, M.B.; Keith, D.A.; Phinn, S.R.; Mason, T.J.; Elith, J. A comparison of resampling methods for remote sensing classification and accuracy assessment. Remote Sens. Environ. 2018, 208, 145–153. [Google Scholar] [CrossRef]
  64. Bogner, C.; Seo, B.; Rohner, D.; Reineking, B. Classification of rare land cover types: Distinguishing annual and perennial crops in an agricultural catchment in South Korea. PLoS ONE 2018, 13, e0190476. [Google Scholar] [CrossRef] [PubMed]
  65. Maxwell, A.E.; Warner, T.A.; Fang, F. Implementation of machine-learning classification in remote sensing: An applied review. Int. J. Remote Sens. 2018, 39, 2784–2817. [Google Scholar] [CrossRef]
  66. Kuhn, M. Building Predictive Models in R Using the caret Package. J. Stat. Softw. 2008, 28. [Google Scholar] [CrossRef]
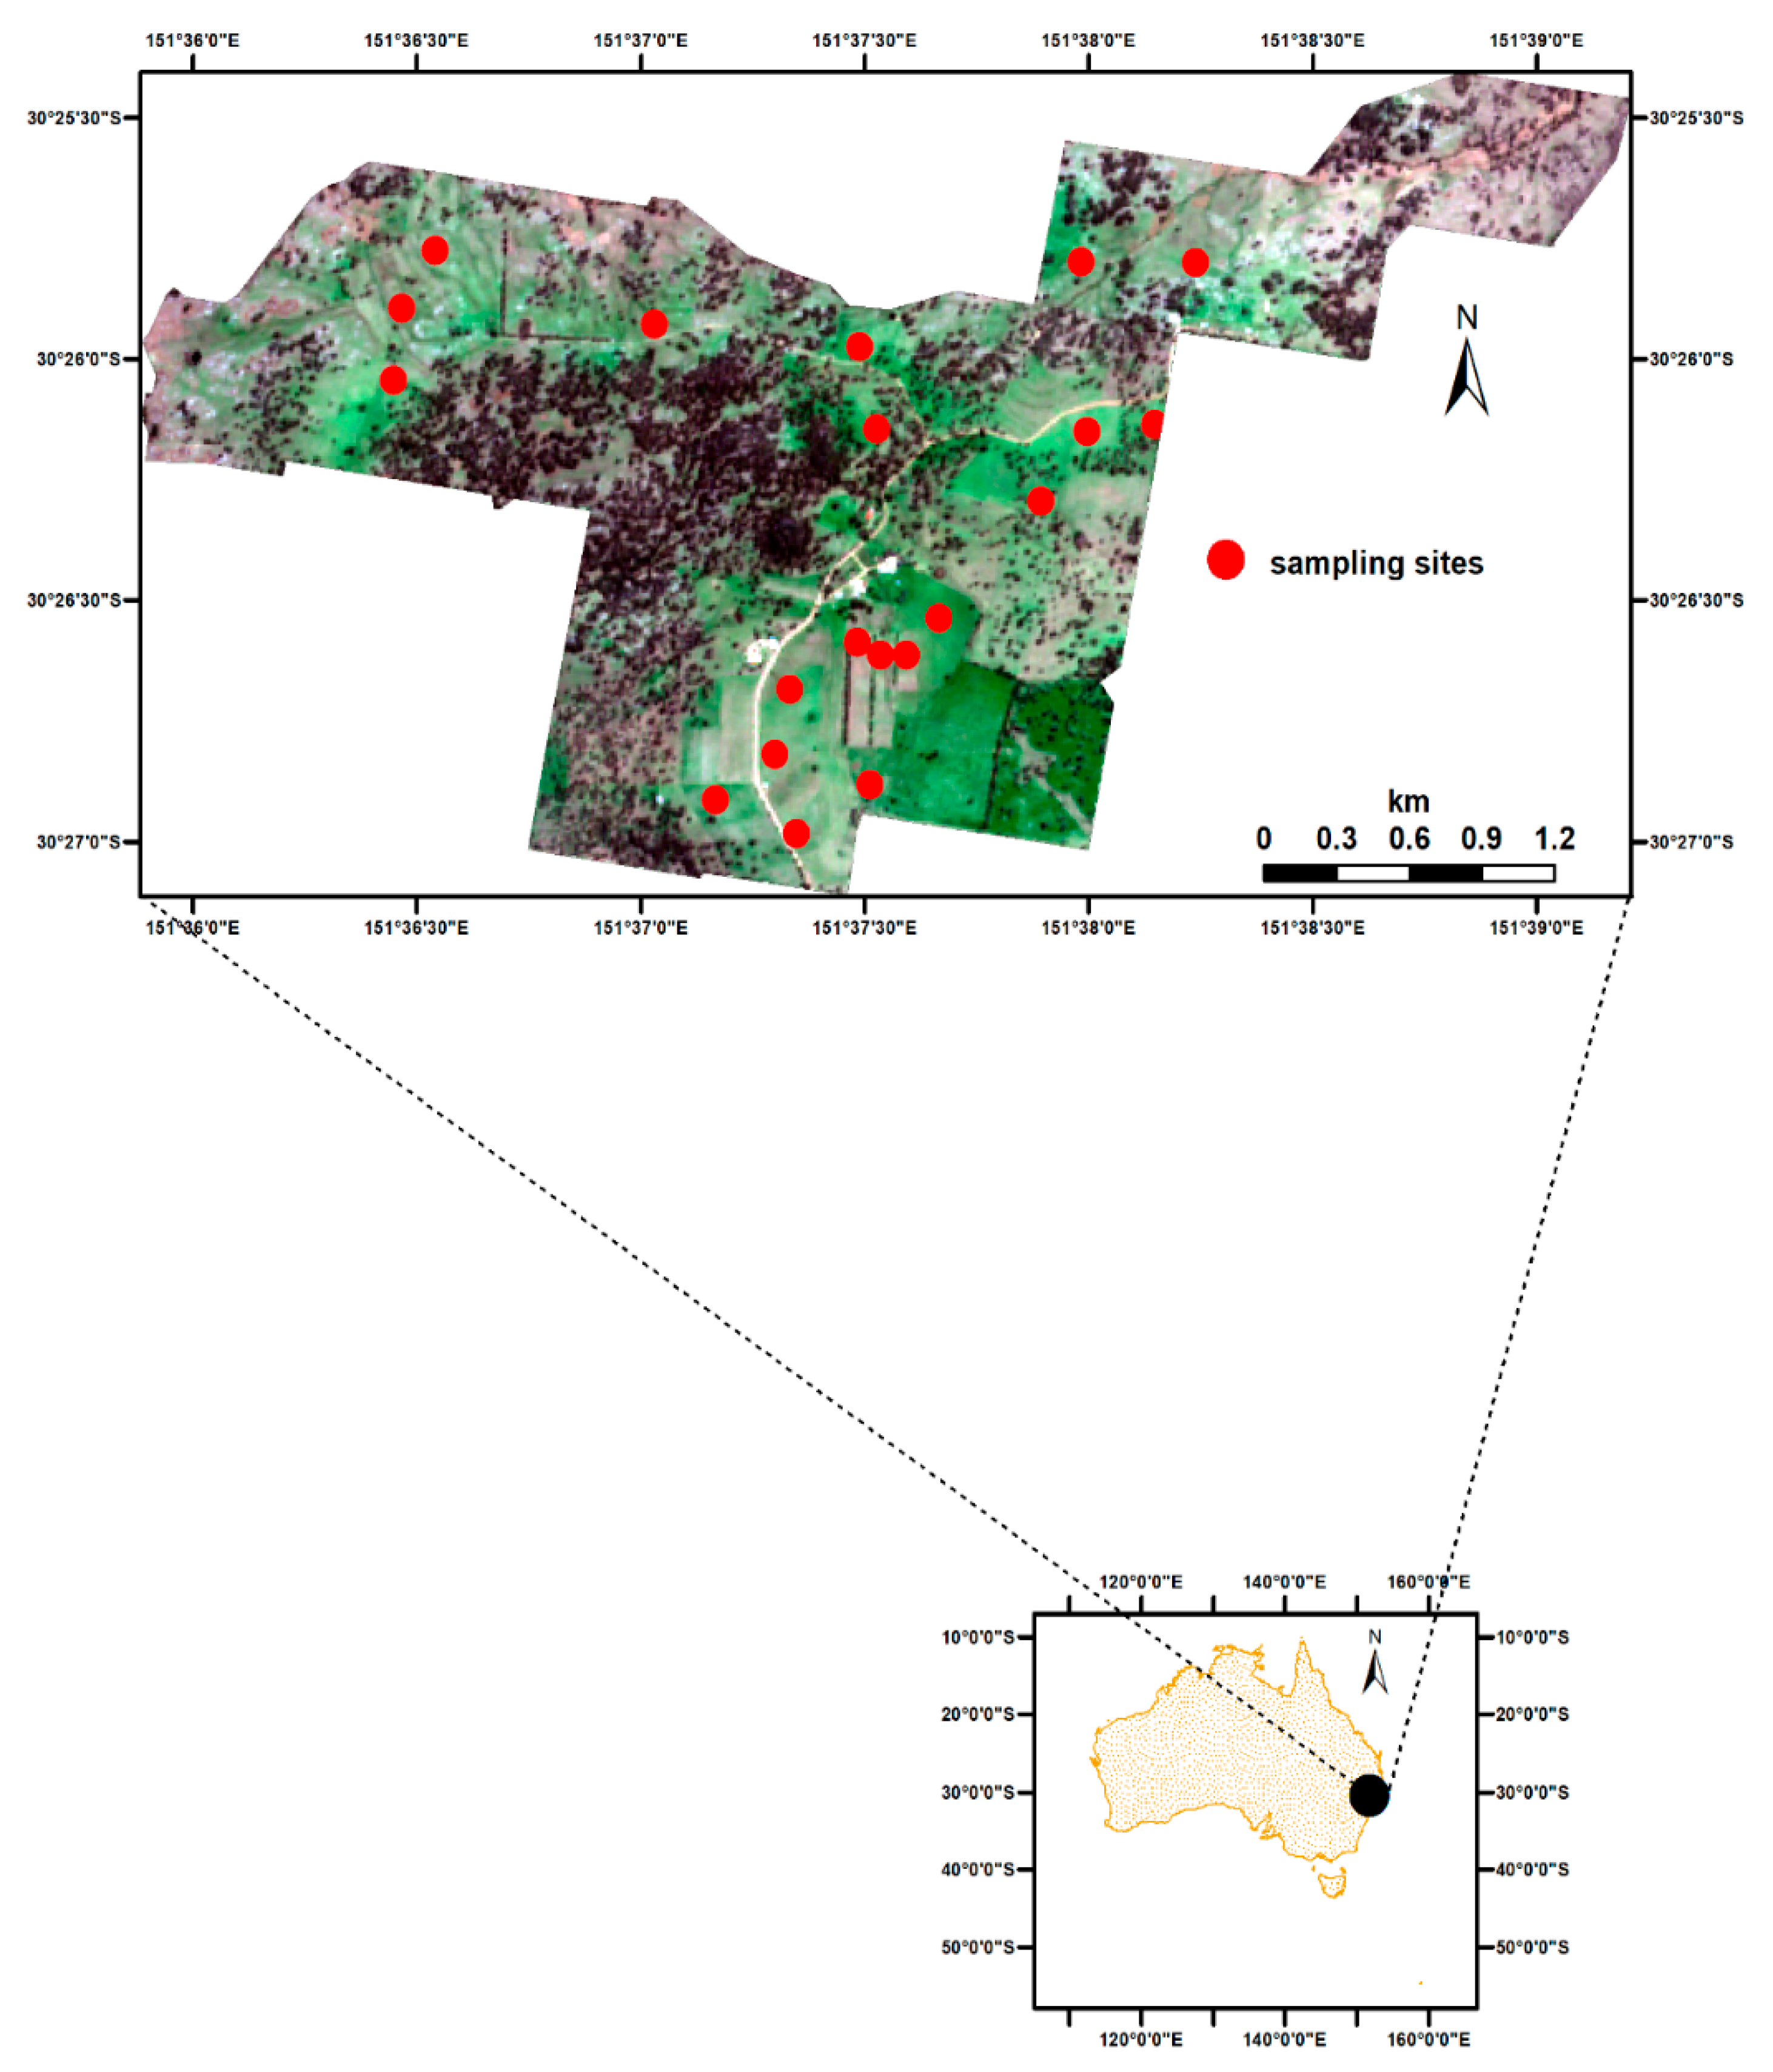
Figure 1. True color (RGB) Sentinel-2A image of study site (inset: location of study site in Australia) with the central location point of the 20 sampling sites (indicated by red circles and are not drawn to scale) from which 1080 instances were derived. Each sampling site was 900 m2.
Remotesensing 11 00253 g001
Figure 2. Spatio-temporal characterization of C3, C4, and mixed C3/C4 grasses. The images used are from Sentinel-2 observations of the study site with sensing dates as close as possible to that of Sentinel-1 overpass. The field sampling dates are: (a) February 2017, (b) July 2017, (c) October 2017, (d) December 2017, (e) January 2017, (f) February 2018, (g) March 2018, and (h) July 2018.
Remotesensing 11 00253 g002
Figure 3. Tuning for the optimal number of features (mtry) to be involved in each split of the random forest classifier. The mtry values selected for random forest classification using (a) polarimetric SAR features, (b) textural features from grey-level co-occurrence matrix (GLCM), and (c) the combination of polarimetric SAR and GLCM textural features. The number of features with the highest accuracy was used to train the model.
Remotesensing 11 00253 g003
Figure 4. Rank of model features based on their contributions to improving the discrimination of C3, C4, and MX pasture grasses. The performance of each feature indicated on the x-axis, scaled to 100, when random forest classification model was created using: (a) polarimetric synthetic aperture radar features (polSAR), (b) textural features from grey-level co-occurrence matrix (glcmTEX), and (c) the combination of polSAR and glcmTEX features. The polSAR features are composed of backscatter values of VH polarization (VH) and backscatter values of VV polarization (VV), the product of VV and VH (polPRD) and the ratio of VV to VH (polRAT). The other polSAR features are the eigenvector polarimetric decomposition parameters including entropy, anisotropy, and alpha. The glcmTEX features are prefixed with ‘glcm.’ The ASM denotes the angular second moment whereas MAX denotes the maximum value.
Remotesensing 11 00253 g004
Figure 5. Spatial characterization of the predictive performance of random forest models using different features including (a) polarimetric SAR features (polSAR), (b) grey-level co-occurrence matrix textural features (glcmTEX), and (c) combination of polSAR and glcmTEX features (COMB). This result is just a subset of the 1080 observations in order to preserve the clarity of the maps. The dark circles denote sampling sites with the red texts showing the pasture class observed on the field against the model predicted class (i.e., observed class/predicted class).
Remotesensing 11 00253 g005
Figure 6. Evaluation of random forest classification models using the F1 score, accuracy, and the Kappa coefficient. The random forest models, as defined by the type of features used, are expressed on the x-axis as: (a) polarimetric SAR features (polSAR), (b) textural features from grey-level co-occurrence matrix (glcmTEX), and (c) the combination of polSAR and glcmTEX features (COMB).
Remotesensing 11 00253 g006
Figure 7. Some photos of the sampling sites: (a) growing period in summer, (b) dry period in winter, (c) grazed C4 site, and (d) grazed C3 site with evidence of preferential grazing between palatable and unpalatable species.
Remotesensing 11 00253 g007
Table 1. Field sampling and corresponding Sentinel-1A image acquisition dates.
Field Measurement DateSentinel-1 Overpass Date
13 February, 201713 February, 2017
6 July, 20177 July, 2017
11 October, 201711 October, 2017
12 December, 201710 December, 2017
16 January, 201815 January, 2018
8 February, 20188 February, 2018
16 March, 201816 March, 2018
26 July, 201826 July, 2018
Table 2. Common native and introduced pasture species observed in the study sites that constituted the three classes of C3, C4, and mixed. A mixed class in a given site was ascribed when neither C3 nor C4 constituted at least 70% of the species composition.
C3 SpeciesC4 Species
Poa tussock (Poa labillardierei)Parramatta grass (Sporobolus elongatus)
Wheat grass (Anthosachne scabra)Red grass (Bothriochloa macra)
Phalaris (Phalaris aquatica)Paspalum (Paspalum dilatatum)
Wallaby grass (Austrodanthonia spp.) Paddock lovegrass (Eragrostis leptostachya)
Cocksfoot (Dactylis glomerata)Panic grass (Panicum effusum)