Abstract
The utility of land cover maps for natural resources management relies on knowing the uncertainty associated with each map. The continuous advances typical of remote sensing, including the increasing availability of higher spatial and temporal resolution satellite data and data analysis capabilities, have created both opportunities and challenges for improving the application of accuracy assessment. There are well established accuracy assessment methods, but their underlying assumptions have not changed much in the last couple decades. Consequently, revisiting how map error and accuracy have been performed and reported over the last two decades is timely, to highlight areas where there is scope for better utilization of emerging opportunities. We conducted a quantitative literature review on accuracy assessment practices for mapping via remote sensing classification methods, in both terrestrial and marine environments. We performed a structured search for land and benthic cover mapping, limiting our search to journals within the remote sensing field, and papers published between 1998–2017. After an initial screening process, we assembled a database of 282 papers, and extracted and standardized information on various components of their reported accuracy assessments. We discovered that only 56% of the papers explicitly included an error matrix, and a very limited number (14%) reported overall accuracy with confidence intervals. The use of kappa continues to be standard practice, being reported in 50.4% of the literature published on or after 2012. Reference datasets used for validation were collected using a probability sampling design in 54% of the papers. For approximately 11% of the studies, the sampling design used could not be determined. No association was found between classification complexity (i.e. number of classes) and measured accuracy, independent from the size of the study area. Overall, only 32% of papers included an accuracy assessment that could be considered reproducible; that is, they included a probability-based sampling scheme to collect the reference dataset, a complete error matrix, and provided sufficient characterization of the reference datasets and sampling unit. Our findings indicate that considerable work remains to identify and adopt more statistically rigorous accuracy assessment practices to achieve transparent and comparable land and benthic cover maps.
1. Introduction
Maps are an important tool for natural resources management, particularly for activities like spatial planning, monitoring ecosystem changes, ecosystem services evaluation, and habitat conservation. Any map is a model—a simplification of reality—[,], and as such it has an associated error. Estimating this error or assessing the accuracy of a map is not only important to evaluate classification methodologies and sources of uncertainty, but is key to assess if a map is fit for purpose []. Lack of knowledge on map accuracy can have serious consequences for environmental monitoring (e.g., carbon accounting) [], including economic implications [] and increased uncertainty in environmental modeling []. We should go one-step further and understand that even if a map has an associated statement of accuracy, its utility is still compromised if the methods and information presented are insufficient to reproduce the accuracy assessment.
The accuracy of maps produced from remote sensing methodologies is influenced by multiple factors such as the choice of data classifier [,,,], site-specific characteristics [], and the selection of the training data for the classification [,,,]. Nevertheless, the primary driver of the final statement of accuracy, besides work’s validity and reproducibility, is how the assessment is implemented []. Indeed, recent research has shown that overall accuracy can vary by up to 40% due only to random variation in the choice of training and validation sets []. In the past two decades, the remote sensing community has undertaken important efforts in developing a set of guiding principles for accuracy assessment [,,,,,,,], which were initially focused on land cover mapping, but have been more widely adopted to other applications (e.g. coral reefs, change detection). Currently, it is widely accepted that for a map to have a statistically rigorous estimate of accuracy, the assessment should be performed using an independent reference dataset collected through a probability sampling design. Moreover, “good practice” guidelines recommend the use of an error matrix and relevant per-class metrics [,] to estimate accuracy, and confidence intervals to quantify precision.
Despite significant evolution in the topic (e.g., [,,,]), major problems remain around implementation of accuracy assessments [,,,,,]. There are several concerns in relation with the metrics used to report accuracy [,,]. Metrics such as kappa coefficient have been demonstrated to provide redundant information, along with being possibly based on incorrect assumptions []. Quantification of uncertainty for accuracy metrics is not well implemented, and accuracy is often not reported together with any sort of dispersion measures (e.g., variance, confidence intervals) [,]. There is also critique about the non-spatial nature of the error matrix and that overall accuracy as a single measure does not represent how accuracy varies in space [,,] or explain spatial patterns that are visible in the map. Debate is found around what should be the appropriate spatial assessment unit to evaluate accuracy (i.e., pixels, cluster/block of pixels, and/or polygons) [] and the effects that different sampling designs (e.g., sample distribution of sampling units and sample size) might have on accuracy and precision [,,]. There are important issues as well with the labelling of the reference data and in general with the quality of the validation data used []. In addition to methodological challenges, one major deficiency in accuracy assessments is that they tend to be poorly documented. The lack of transparency along with shortcomings in a rigorous evaluation is a cause of concern; particularly with increasing sophistication and automation of remote sensing analysis for delivery of spatial data products and information services based on these across multiple disciplines and applications.
Recent developments in remote sensing, as well as continued influence from the fields of statistics and machine learning, offer potential solutions to some of the unresolved issues regarding accuracy assessment. In particular, the abundance of higher spatial resolution imagery and different satellite data types have implications for the type and quality of reference datasets and how they are collected [,]. For instance, the abundance of higher resolution imagery can facilitate more practical collection of reference data through probability sampling designs, as opposed to in situ data collection, which can present logistical challenges due to issues like access and cost.
While new directions in remote sensing offer potential solutions, at the same time they have created a need for improved methods to evaluate map error [,,]. Increasing complexity in image classification workflows (e.g., time-series, object-based image analysis and machine learning methods) might mean that the suitability of the “traditional” pixel based error matrix is limited [,,]. Examples include fusion of multiple satellite data sources of spatial and spectral resolution, and the use of methods (e.g., ensemble learning methods) that use internal measures of accuracy (e.g. cross-validation) to refine and learn classification algorithms. Although much work has been done to improve the calculation and interpretation of accuracy assessment measures, the underlying premise of current methods was established many decades ago and has not changed. Current methods with the error matrix at its core were mostly developed when only a limited range of sensors and classifiers were available; and regional- to global-scale maps were done with (much) coarser spatial resolution data (e.g., 1 km2 pixels) [,] and most studies were undertaken in small geographical regions (<5000 km2 ) for a single point in time. Certainly, the field of accuracy assessment has achieved important methodological developments. Nonetheless, it should continue to evolve and improve to satisfy the need for scientific credibility, which might imply, among other things, eliminating bad practices [] and higher standards for providing information to contextualize accuracy results.
In line with a recent set of criteria described by Stehman and Foody [] regarding how to perform and report accuracy assessment, we examine reproducibility and transparency in published accuracy assessments over the last two decades. For accuracy assessments to be defined as reproducible they should include an error matrix, a probability-based sampling scheme to collect the reference dataset, and a detailed characterization of the reference datasets and sampling unit. All these core elements should be well documented (i.e. verifiable and adequately explained) for an assessment to be defined as transparent. From the perspective of natural resources management, reproducibility and transparency are particularly important, because they provide the context for comparing maps, evaluating their differences and change through time, which is key to inform management decisions.
There have been recent calls to improve the reporting of accuracy for both thematic and change detection maps produced through remote sensing analysis, to make it more suitable to new classification methods and increasing reporting transparency [,,,]. Previous works that have reviewed land cover map accuracy have mostly focused on analyzing the effect of different classification methods and data types on map accuracy [,,] or have reviewed accuracy assessments only for object-based classification approaches []. To our knowledge, there has been no recent comprehensive review, based on a quantitative literature review, of trends in accuracy assessment for remote sensing derived maps and how accuracy is reported. Our aim is to present a synthesis of how accuracy is being reported by remote sensing practitioners in the last two decades. In this paper, we do not focus on producing new methodological recommendations, rather we seek to provide new data and perspectives as to what we might need to address to continue to adapt and improve accuracy assessment in the field of remote sensing.
2. Materials and Methods
2.1. Search Strategy and Article Selection
We carried out a systematic search for peer-reviewed literature articles in the Web of Science that included the following terms/strings within their abstract, title or keywords: thematic map* and accuracy assessment, landcover map* and accuracy assessment, map* and accuracy assessment, segmentation and accuracy assessment, object-based image analysis and accuracy assessment, error matrix and accuracy assessment, confusion matrix and accuracy assessment, remote sensing and accuracy assessment, map validation, using “OR” to combine the terms. We limited our search to papers published in English between the years 1998–2017. We chose 1998 as a starting point because that year was when the seminal work by Stehman and Czaplewski [] on the principles of thematic map accuracy was published. Although methodological aspects of accuracy assessment were outlined earlier that decade by Congalton [], this was the first comprehensive attempt to provide guidelines to remote sensing practitioners in relation to all accuracy assessment elements.
We focused our search on land cover maps in the context of vegetation monitoring. To identify relevant papers, we first constrained it to the following thematic areas: remote sensing, environmental sciences, and geosciences multidisciplinary (Figure 1). We then applied automated queries to filter out papers, where the main aim was mapping of hazards (e.g., landslides), snow, soil types, geological features, and inland water bodies. We further manually screened this initial search (n = 1816) to remove papers exclusively dealing with agricultural, urban, or other artificial surfaces. In addition, we checked that papers met the following eligibility criteria: articles should report on a study area, should have an image classification method based on remote sensing imagery to produce a categorical map, or included a classified categorical map. We excluded any studies that used simulated data, or that reported only maps of continuous variables. Finally, we compiled a database of potential articles that matched our eligibility criteria and randomly selected 225 papers to review. From the 225 selected papers, 3 were not considered suitable and were removed, as they were oriented towards accuracy analysis not the classification per se. We complemented our database on land cover studies with a database of similar information collected in marine benthic mapping papers published until 2008 from Roelfsema and Phinn []. Again, we only included studies published from 1998 onwards, and applied the same eligibility criteria as before, resulting in a further 60 papers being added to our review.

Figure 1.
Flow diagram outlining the publication selection process and actions to include in the database.
2.2. Data Extraction and Analysis
We extracted and standardized data on different features of accuracy assessment, including imagery used for the analysis, number of classes, response design, sampling design, accuracy metrics reported, and presence/absence of a confusion matrix. We also gathered information on the size of the study area mapped and the location. We classified the data into different categories for each feature to quantify the usage of each of these in remote sensing studies. The complete set of features and the categories used for the standardization is provided in Table S1.
We applied the following constraints to how the features were extracted:
To avoid pseudoreplication of methods within one selected study, we recorded data for only one classification result. Typically, papers that report on multiple classifications use one consistent methodological approach and often the same reference dataset applied to multiple classifications. Therefore, in such instances we included only the result from the best overall accuracy (assuming that the best performing classifier will be the one used for any further mapping). For papers that presented maps for multiple years, we included only the classification accuracy that corresponded to the reference data, which was usually the most recent year. In the case of change detection studies, when available we reported the accuracy of the change map, or if this was absent we reported on the results from the most recent map (in the case of post-classification comparison). Hereafter, we refer to each classification experiment per study area as a case.
Numerical results which were not explicitly stated in reviewed papers were not calculated by us. For instance, we did not estimate the overall accuracy from confusion matrices. There were two exceptions to this rule. For studies in which the number of sampling units were only given per class, we calculated the total number of validation units. The second exception was for the size of study area: We used the area in km2 reported by the World Bank database [] in cases where the study area was sufficiently well delimited (e.g., in the case of countries or continents), or in the case of landscapes, we estimated the area from the map if a sufficiently clear scale was provided.
Once the data were extracted and standardized, we evaluated if the accuracy analysis reported in the paper could be considered reproducible. To be considered reproducible, we required that the accuracy assessment included the following elements: i) a complete error matrix; ii) a clear reference to the validation data used; and iii) a probabilistic sampling design. If any of these elements was missing, the case was classified as not reproducible. Studies were also considered not reproducible when they reported the three elements but one or more of them were deficient in detail (e.g., deriving a validation dataset from an unreferenced source).
We quantified the percentage of cases that included or satisfied each element that we extracted from the reviewed literature (e.g., percentage of cases that included an error matrix). We also calculated the mean + (SD) of overall accuracy for a number of the categories we extracted from the literature (e.g., number of classes, number of validation samples, study site area). We investigated these elements in relation to spatial scale, as the size of the study area usually constrains several aspects of the remote sensing analysis such as the ease of collecting ground truth data, which have implications for accuracy assessment. We grouped studies into four scale categories based on the size of the study area mapped and the focus of the study: landscape (less than 8000 km2), regional (less than 100,000 km2), continental (studies performed at the continental level), and global. To test if increasing the number of sampling units could have a positive influence on accuracy, we performed a correlation analysis between the accuracy and the number of sampling units. We also applied a correlation analysis between accuracy and the number of classes to test if overall accuracy decreases as the map’s complexity, evaluated as a number of classes, increases.
3. Results
The database of 282 papers (Table S2) we compiled included studies from 66 different countries, published in 60 remote sensing or natural resources management related journals (Figures S1–S3). Broadly, the studies varied widely in the level of detail provided about the map validation process, as well as on the metrics used to report its accuracy. The study area size ranged from just one km2 to analysis done on a global scale, but ~60% of cases (n = 172) dealt with landscape level maps (less than 8000 km2).
Approximately two thirds of the cases that we analyzed lacked one or more elements required to consider the accuracy assessment verifiable, e.g., reproducible, comparable, transparent, and well documented. Only 32.6% of the cases in our sample included a probability sampling scheme to collect the reference dataset, a complete error matrix, and sufficient characterization of the reference datasets and sampling unit used. Nevertheless, no difference was found between the average accuracy of papers that had all the elements to be considered reproducible and those that lack one or more elements (t = −0.13, df = 191, p = 0.90).
3.1. Characterization of How Map Accuracy is Being Reported
During the period analyzed, the average yearly percentage of cases including a complete error matrix was 56.8% ± 9.7 (Figure 2a). The data extracted from our sample indicate that in the past 10 years, there is a considerable increase in the number of cases which report an error matrix (72.3% ± 14). Although cases that report an error matrix present, on average, slightly higher overall accuracies than those that do not include an error matrix (Figure 2b), there is only weak evidence for this effect (t = −1.88, df = 141, p = 0.06).
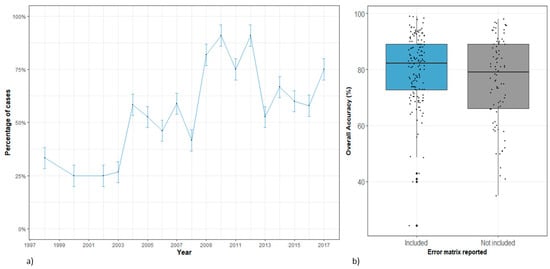
Figure 2.
Error matrix reporting in remote sensing literature from 1998–2017, and its relation with the obtained overall accuracy. (a) Number of cases that included (or not) an error matrix distributed by year published, (b) average accuracy for studies that included (or not) a complete error matrix in the publication.
Reporting all four standard accuracy assessment metrics (overall accuracy, kappa, user’s, and producer’s accuracy) was the most common scenario (28% cases), followed by 18% of the cases that included this same set of metrics, excluding kappa (Figure 3). Another 16% of the cases included only overall accuracy. It is noteworthy that no accuracy metrics were found in 11.2% of the cases and only 14.2% reported overall accuracy including confidence intervals, standard error, or standard deviation. The type of accuracy assessment metric was not related with the scale of analysis undertaken, but larger study areas tend to just report overall accuracy or make use of other types of measures (e.g., F1-score, root mean square error (RMSE), out of bag (OOB) error) (Figure 3).

Figure 3.
Type of accuracy assessment metrics reported at the different scales category. OA = overall accuracy, K = kappa, U = user’s accuracy, P = producer’s accuracy, R = correlation, Ka = allocation disagreement/and or quantity disagreement, Other = other accuracy metrics (e.g. F1-score, OOB, Tau).
The kappa index was reported in 43.8% of the cases, 50.4% of those being published between 2012–2017, indicating that its use continues to be standard practice. We found only seven cases, all of them at the landscape level, in which quantity disagreement and/or allocation disagreement was reported.
3.2. Sampling Designs for the Reference Data
Only 54.2% of cases used a probability sampling design to collect the validation dataset for accuracy assessment, with most of the papers using a stratified random design. Another 31.4% collected sampling units for the reference dataset either purposely, restricting them to certain homogeneous areas, or had protocols that resulted in data being collected using a non-probability scheme. Insufficient detail to determine the sampling design employed or a lack of any reference to sampling design, was found in 11.4% of cases. Only a few cases (n = 10) applied cross validation approaches for validation and training purposes. We found no difference in the average overall accuracy in cases using a probability sampling design when compared to cases that used a non-probability sampling design (t = 0.10, df = 214, p = 0.91) (Figure S4).
3.3. Relationship between the Type and Number of Sampling Units with Accuracy
Our analysis revealed that most studies, independent of the scale of analysis, used individual pixels as validation units. Not surprisingly, the interpretation of higher or similar spatial resolution satellite data to assemble reference datasets was the most prevalent practice (Table 1). Field-based in situ data (i.e., GPS tagged points) were the second most common validation unit. However, the use of field data for validation was 26% in 2017, which is almost half the average before 2008. For 13% of cases it was not possible to determine the sampling unit used for the accuracy assessment. In many of those cases, authors mentioned the use of regions of interests (ROIs) to gather reference data, usually in homogeneous areas, but then presented an accuracy assessment based on single pixels.

Table 1.
Percent of cases for each type of sampling validation unit.
In general, we found no relationship between the size of the study area and the number of sampling units used in the accuracy assessment, independent of the type of validation unit used or the scale of analysis (Table 2). Figure 4 provides an indication that cases using pixels as the spatial units of the reference data tended to have higher accuracies and a higher number of sampling validation units, than those based on field data.
Table 2.
Main features extracted grouped by study area size categories.
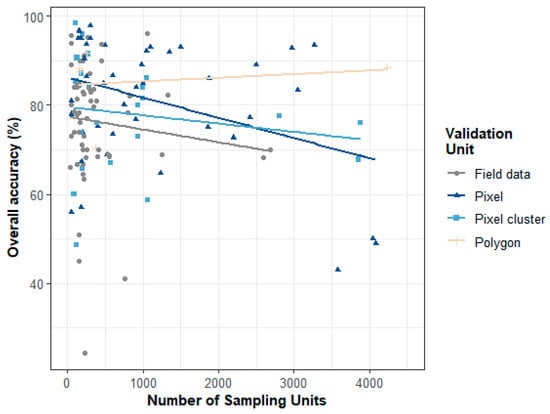
Figure 4.
Relation between the reported overall accuracy and the number of sampling units in the reference dataset for studies using field data (GPS points and field plots), pixels and pixel clusters, and polygons (refer to Table 1 for detailed definitions).
3.4. Relationship between Accuracy and Classification Characteristics (Number of Classes and Type of Satellite Data)
We estimated that the average number of map classes in our sample was 21.9 classes ± 10.2. The number of classes did not increase with the study area size, having similar values from landscape to global scale (Table 2). Contrary to what is often expected accuracy did not decrease as the number of classes increased, and we did not find any significant trend between classification complexity and the overall accuracy (r = 0.09, n = 228, p = 0.14) (Figure 5).

Figure 5.
Relationship between the number of classes and the overall classification accuracy (for clarity the number of classes is limited to 40).
We did not find any strong evidence that the resolution of image datasets used in the mapping process or the type of reference data had an effect on overall accuracy (Figure 6). There is only weak evidence for this effect, with pixel-based reference data tending to have a wider range and higher median value of overall accuracy compared to cases that used field-based data as reference. Lower accuracy values using field data at any spatial resolution might indicate the difficulties found when attempting to pair small plots or single points with coarser larger pixels.
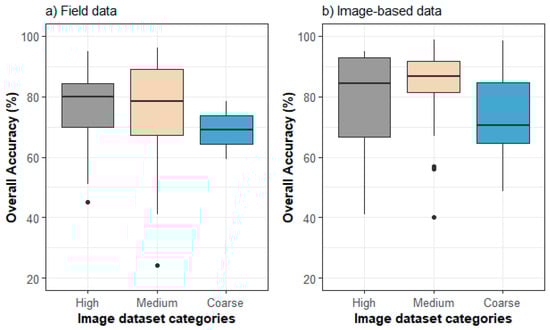
Figure 6.
Overall accuracy grouped by the type of image dataset according to spatial resolution used in the classification process, for different types of reference datasets based on (a) field data validation (field plots and GPS) and (b) image-based validation data (single pixels, pixel cluster, and polygons). High refers to less than 10 m pixel size, Medium 10–30 m pixel size, and Coarse refers to images with more than 30 m in pixel size.
4. Discussion
4.1. Implications for Lack of Reproducibility and Transparency
Castilla [] speculated that if accuracy assessments from a random sample of papers were scrutinized, the majority of them would be deficient in context of sampling method, definition of the reference datasets, and flaws in how accuracy metrics were calculated. In this research, we have provided data that supports this idea. By reviewing the elements of accuracy assessment in a sample of studies published during the past two decades we found that most papers did not provide sufficient detail on how accuracy assessment was performed. The main deficiencies identified were the characterization of the reference data in terms of description of sampling unit and reference data source, the absence of a probability sampling design, and the absence of an error matrix. While there have been improvements in the last decade, particularly with respect to publishing of error matrices, studies tend to include statements of accuracy without including all the necessary information to make accuracy assessments reproducible. This lack of transparency in reporting creates credibility issues, hinders the possibility to compare maps, and ultimately constrains utility of maps. Moreover, publishing the set of elements to make accuracy assessment transparent and reproducible is important to provide remote sensing scientists with the information required to evaluate the reliability of new methods and modeling techniques.
The notion of accuracy is a well-established concept among remote sensing practitioners [,] and although protocols that ensure scientific credibility of mapping results are well developed [], their implementation is still limited. Full explanation for this behavior will require further study involving survey techniques and interviews with remote sensing scientists. Nevertheless, it is more important to point out, as mentioned by [], that if there is demand from editors and reviewers to report all the necessary elements to make the accuracy reproducible, it is highly likely that this behavior will change, even in the near future.
Our aim in this work was not to provide a new set of guidelines or methods for accuracy assessment (for this the reader is to refer to Stehman and Foody []), but to identify trends in its reporting and urge for careful reporting in those areas that we found deficient. Thorough reporting is particularly important in the context of natural resources management. Without it, comparison between maps that use different methodologies to estimate area or change of resources through time is invalid. In this regard, making the reference data available online, along with all the necessary information for the accuracy assessment, would greatly contribute to future monitoring efforts. Moreover, it will provide decision makers with all the information to evaluate the validity and therefore utility of the spatial data that are being provided. Given the current use of spatial platforms as sources of validation data (particularly via large corporations like Google and Microsoft) and the availability of data repositories [,], depositing data online for it to be used by other scientists should be common practice.
4.2. Overall Trends in Features of the Accuracy Assessment: Error Matrix, Metrics, and Type of Validation Dataset
With respect to accuracy assessment metrics, we discovered that almost half of the studies report accuracy using overall accuracy, user’s, and producer’s, which have been recommended as the primary accuracy metrics [,]. It was somewhat a positive result that only about 10% of the reviewed published literature, did not include any measures of accuracy. Discouragement in the use of kappa has had little impact, and the uptake of allocation disagreement has been limited. Multiple metrics have been, and probably will be proposed as accuracy reporting evolves to be spatially explicit [,]. The suitability of different metrics will depend on the specific research question []. Nevertheless, it is key that whichever metric authors chose to report, the motivation and explanation of the statistic used, including how it was calculated, should be clearly stated. This will allow the reader to have an adequate interpretation of the accuracy in the study.
The error matrix is the core tool of accuracy assessment analysis, and its inclusion in publication provides key information on the context and validity of the accuracy result. By reviewing the error matrix of a map, it is possible to tell whether the overall accuracy has being unduly influenced by a particular class (one that is either harder or easier to map than other classes). For example, a common strategy to “boost” overall accuracy is to increase sampling within easier to map classes (usually spectrally homogenous areas). We did not find a trend of higher accuracy in cases that omitted reporting the error matrix, so this is probably not an overly pervasive issue. Nevertheless, it is important that studies publish an error matrix so a proper assessment of ‘map relevance’ [] can be made by readers and users. It is encouraging to see that during the last decade about 70% of the published papers reported the error matrix, hopefully, this tendency towards increasing transparency will continue.
The use of field data as reference data source has decreased over time, being replaced by interpretation of high spatial resolution imagery, and we suggest that it is likely that this trend will continue. It is noteworthy that in our sample, studies that use pixel based reference data tend to have larger sample sizes and higher overall accuracy (Figure 4) than studies using field based reference data. This could be an effect of using smaller plots than pixels, which have been reported to underestimate accuracy []. Nevertheless, if this is the norm and given the current trends, there should be mechanisms, which safeguard that image interpretation results are as much as possible consistent and reliable. Moreover, when compared with reality on the ground, discrete classes might not be meaningful, and as image interpretation is a subjective process [,], careful protocols are needed to avoid introducing errors in the labelling of reference data.
We found that sampling variance is seldom reported, despite being common practice in statistical and machine learning literature, and the fact that it has long been recommended for accuracy assessment [] and shown to be critical for remote sensing applications [,]. Potential explanations for not reporting confidence intervals are hard to elucidate, but they might range from logistic constraints (e.g., cost), complexity in the calculation, or just because the fact that it is not common practice. Whatever the cause, the consequence is that accuracy metrics are viewed as an absolute number, without any context or associated error, which further promotes the notion of accuracy targets that in many instances are unrealistic or unachievable []. The increasing use of readily available high resolution imagery as reference data [] should lift some of the traditional constraints of acquiring field data [], which could be an opportunity to reinvigorate the need for reporting of variance and estimation of sample size, and the use of probability sampling designs.
4.3. Other Aspects of Accuracy that are Relevant for Natural Resources Management: Reference Sample Size and Number of Classes
In natural resources management it is a common concern among practitioners as to whether the number of sample units is adequate, or if more sampling effort is needed to produce a “good” map. It is a valid concern as field data collection is costly and constrained by practicalities. For instance, reef data collection is restricted to areas accessible by boats or in the case of forest mapping many hours/days are required to reach some remote mountainous areas. For desktop based studies, resources are also a limitation, as generating validation data through image interpretation is a time consuming process. We did not find any relationship between the number of sampling units and overall accuracy (Figure 4), but we did find a large variation in the reference data sample size. The number of sampling units determines the precision of the accuracy estimate, so if accuracy assessments use an unbiased estimator and follow probability sampling (which is not always the case), increasing the number of sampling units should not increase overall accuracy. Nevertheless, the large variation in the number of reference sampling units indicates that there is probably a wide range of variability in the precision of the accuracy estimates in our sample. This highlights the importance of reporting variance alongside accuracy measures [], particularly when considering utility for management purposes. Moreover, accuracy assessments should be “map relevant” in the sense that they should reflect the areal composition of the study areas that are being mapped. In practice, sample sizes are determined by other criteria such as accessibility or availability of resources, which could lead to the application of a non-probability sampling design. Thus, we suggest that future work should look at the relation between the reference data sample size and confidence intervals size.
When mapping natural resources, it is frequently assumed that accuracy will depend on the level of detail extracted from the imagery, in combination with its pixel size. Anecdotally, many practitioners will agree that as they increase the number of classes, they achieve lower accuracy results. However, we did not find any trend between the overall accuracy and the number of classes, similarly to [] for object-based image classification (Figure 5). It is often expected that areas with fewer cover types can be classified more easily than other more complex systems that have a higher amount of edge/mixed pixels []. We suggest this is only true when considering a more complex classification scheme within the same classification system (i.e., same imagery, training and reference datasets, and classification process). Indeed, Yu et al. 2014 [] found only a partial or weak relationship when different hierarchy levels were taken into account, and found no relationship between complexity and accuracy.
4.4. Limitations of the Review
The analysis of accuracy assessment presented here has limitations that constrain the scope of the results. Although we are certain that our analysis was based on a representative sample, it must be recognized that search strategies have a degree of subjectivity. Therefore, considering the large extent of land cover mapping literature, we cannot rule out that a different set of keywords and combinations could have resulted in a different sample of literature that could have had a higher or lower percentage of papers being considered reproducible.
We provided a comprehensive perspective on accuracy reporting, in that we did not limit our analysis to just the main journals within the field of remote sensing, or high impact factor journals, as is often done. Also, by integrating information on both benthic and land cover maps our intention was to give a broader perspective within the context of natural resources management. Thus, our sample included a wide range of reference data sources, methods, imagery combinations, sampling techniques, and designs, etc. So although our paper includes literature outside the core remote sensing community, it comprehensively surveys the wider community involved in remote sensing applications, which is important as map production has become common practice in many disciplines.
Land and benthic cover classification are complex processes, thus multiple factors influence the map’s accuracy. In this research, we focus on analyzing accuracy in relation with factors directly related with its assessment. Thus, it was out of the scope of this work to analyze differences due to classification algorithms. Although we recognize it is an important factor, reviews that have evaluated accuracy in relation with classifier performance have found only small differences (<5%) between algorithms [], and when allocation of training and validation datasets are done simultaneously based on the same sampling design, indeed the sampling design can have much greater impact than the algorithm chosen []. Therefore we do not expect it to have a major influence in the interpretation of the results.
5. Conclusions
Whilst studies put significant effort on developing and presenting methodologies, far less attention is usually invested into the accuracy assessment phase of the classification process. In this synthesis, we focus on quantifying the quality of accuracy assessment implementation and reporting; providing perspective on current practices. By analyzing the elements of accuracy assessment, we found out that almost 70% of sampled literature were not adhering to recommended guidelines, and/or were not providing sufficient detail to evaluate if the reported assessment was valid. Our results have implications for practitioners (including editors and reviewers), who play a key role in improving accuracy assessment reporting, but also for managers and policy makers who regularly need to judge if maps involved in the decision making process comply with the minimum set of information to evaluate quality. We elaborate further on what other authors have recommended and suggest that at least, publications should a description or explanation of the following:
- Probability sampling design (including a map showing the distribution of the reference data).
- An error matrix, that conveys proportional areas.
- The sampling unit including the number of units used in the assessment, their type (i.e., single pixels, pixel cluster, etc.); size, and in the case of field plots their shape and size.
- Clear reference of the source of validation/training data; and where applicable a protocol or a description of how the labels for the reference data was obtained.
- The accuracy metrics with an adequate interpretation and a measure of sampling variance (i.e., confidence intervals, standard error, or standard deviation)
- Report any limitations found within any of the elements of the assessment process, particularly any deviations from the sampling design.
Finally, we encourage authors to publish, when possible, reference data online and any other supporting information on how the analysis was undertaken (e.g., code). By including the abovementioned information, we will certainly move towards increasing transparency and comparability of remote sensing-based maps used in natural resources management.
Supplementary Materials
The following are available online at https://www.mdpi.com/2072-4292/11/19/2305/s1, Figure S1: Global map showing the distribution of the reviewed literature. Figure S2 Distribution of the studies journal. Figure S3 Distribution of the studies by year. Figure S4 Relationship between the overall accuracy and the type of sampling design used in the studies to collect the reference data. Table S1 Description of the information extracted from each study. (Variables in the database.) Table S2 Reference list of 282 papers considered in the analysis. Table S3 Number of cases according to the study area categories. The database of papers used will be available on Zenodo(https://doi.org/10.5281/zenodo.3464691).
Author Contributions
Conceptualization, L.M.-B., M.B.L., S.R.P. and C.M.R.; Data curation, L.M.-B.; Formal analysis, L.M.-B.; Funding acquisition, M.B.L. and S.R.P.; Investigation, L.M.-B., M.B.L. and C.M.R., Resources, M.B.L.; Supervision, S.R.P.; Visualization, L.M.-B.; Writing—original draft, L.M.-B.; Writing—review & editing, L.M.-B., M.B.L., S.R.P. and C.M.R.
Funding
This research was funded by Australian Research Council Linkage grant number (LP150100972) and the Joint Remote Sensing Research Program.
Acknowledgments
The authors would like to acknowledge Yi Lu, Bradley Clarke-Wood, Sylvia Hay and Rachel Melrose for their support in data collection. We thank Ruben Venegas-Li for comments in the manuscript.
Conflicts of Interest
The authors declare no conflict of interest. The funders had no role in the design of the study; in the collection, analyses, or interpretation of data; in the writing of the manuscript, and in the decision to publish the results.
References
- Foody, G.M. Status of land cover classification accuracy assessment. Remote Sens. Environ. 2002, 80, 185–201. [Google Scholar] [CrossRef]
- Smits, P.C.; Dellepiane, S.G.; Schowengerdt, R.A. Quality assessment of image classification algorithms for land-cover mapping: A review and a proposal for a cost-based approach. Int. J. Remote Sens. 1999, 20, 1461–1486. [Google Scholar] [CrossRef]
- Zimmerman, P.L.; Housman, I.W.; Perry, C.H.; Chastain, R.A.; Webb, J.B.; Finco, M.V. An accuracy assessment of forest disturbance mapping in the western Great Lakes. Remote Sens. Environ. 2013, 128, 176–185. [Google Scholar] [CrossRef]
- Olofsson, P.; Foody, G.M.; Stehman, S.V.; Woodcock, C.E. Making better use of accuracy data in land change studies: Estimating accuracy and area and quantifying uncertainty using stratified estimation. Remote Sens. Environ. 2013, 129, 122–131. [Google Scholar] [CrossRef]
- Foody, G.M. Valuing map validation: The need for rigorous land cover map accuracy assessment in economic valuations of ecosystem services. Ecol. Econ. 2015, 111, 23–28. [Google Scholar] [CrossRef]
- Gregory, M.J.; Roberts, H.M.; Bell, D.M.; Ohmann, J.L.; Davis, R.J. How sampling and scale limit accuracy assessment of vegetation maps: A comment on Loehle et al. (2015). For. Ecol. Manag. 2015, 358, 361–364. [Google Scholar]
- Lu, D.; Weng, Q. A survey of image classification methods and techniques for improving classification performance. Int. J. Remote Sens. 2007, 28, 823–870. [Google Scholar] [CrossRef]
- Khatami, R.; Mountrakis, G.; Stehman, S.V. A meta-analysis of remote sensing research on supervised pixel-based land-cover image classification processes: General guidelines for practitioners and future research. Remote Sens. Environ. 2016, 177, 89–100. [Google Scholar] [CrossRef]
- Wilkinson, G.G. Results and implications of a study of fifteen years of satellite image classification experiments. IEEE Trans. Geosci. Remote Sens. 2005, 43, 433–440. [Google Scholar] [CrossRef]
- Heydari, S.S.; Mountrakis, G. Effect of classifier selection, reference sample size, reference class distribution and scene heterogeneity in per-pixel classification accuracy using 26 Landsat sites. Remote Sens. Environ. 2018, 204, 648–658. [Google Scholar] [CrossRef]
- Smith, J.H.; Stehman, S.V.; Wickham, J.D.; Yang, L.M. Effects of landscape characteristics on land-cover class accuracy. Remote Sens. Environ. 2003, 84, 342–349. [Google Scholar] [CrossRef]
- Zhen, Z.; Quackenbush, L.J.; Stehman, S.V.; Zhang, L. Impact of training and validation sample selection on classification accuracy and accuracy assessment when using reference polygons in object-based classification. Int. J. Remote Sens. 2013, 34, 6914–6930. [Google Scholar] [CrossRef]
- Millard, K.; Richardson, M.; Millard, K.; Richardson, M. On the Importance of Training Data Sample Selection in Random Forest Image Classification: A Case Study in Peatland Ecosystem Mapping. Remote Sens. 2015, 7, 8489–8515. [Google Scholar] [CrossRef]
- Shao, Y.; Lunetta, R.S. Comparison of support vector machine, neural network, and CART algorithms for the land-cover classification using limited training data points. ISPRS J. Photogramm. Remote Sens. 2012, 70, 78–87. [Google Scholar] [CrossRef]
- Hsiao, L.-H.; Cheng, K.-S.; Hsiao, L.-H.; Cheng, K.-S. Assessing Uncertainty in LULC Classification Accuracy by Using Bootstrap Resampling. Remote Sens. 2016, 8, 705. [Google Scholar] [CrossRef]
- Weber, K.T.; Langille, J. Improving classification accuracy assessments with statistical bootstrap resampling techniques. GIScience Remote Sens. 2007, 44, 237–250. [Google Scholar] [CrossRef]
- Lyons, M.B.; Keith, D.A.; Phinn, S.R.; Mason, T.J.; Elith, J. A comparison of resampling methods for remote sensing classification and accuracy assessment. Remote Sens. Environ. 2018, 208, 145–153. [Google Scholar] [CrossRef]
- Stehman, S.V.; Czaplewski, R.L. Design and Analysis for Thematic Map Accuracy Assessment - an application of satellite imagery. Remote Sens. Environ. 1998, 64, 331–344. [Google Scholar] [CrossRef]
- Stehman, S.V. Basic probability sampling designs for thematic map accuracy assessment. Int. J. Remote Sens. 1999, 20, 2423–2441. [Google Scholar] [CrossRef]
- Olofsson, P.; Foody, G.M.; Herold, M.; Stehman, S.V.; Woodcock, C.E.; Wulder, M.A. Good practices for estimating area and assessing accuracy of land change. Remote Sens. Environ. 2014, 148, 42–57. [Google Scholar] [CrossRef]
- Friedl, M.A.; Woodcock, C.; Gopal, S.; Muchoney, D.; Strahler, A.H.; Barker-Schaaf, C.; Oodcock, C.W.; Gopa, L.S.; Uchoney, D.M.; Ler, A.H.S.; et al. A note on procedures used for accuracy assessment in land cover maps derived from AVHRR data. Int J Remote Sens. 2000, 21, 1073–1077. [Google Scholar] [CrossRef]
- Strahler, A.H.; Boschetti, L.; Foody, G.M.; Friedl, M.A.; Hansen, M.C.; Herold, M.; Mayaux, P.; Morisette, J.T.; Stehman, S.V.; Woodcock, C.E. Global Land Cover Validation: Recommendations for Evaluation and Accuracy Assessment of Global Land Cover Maps; European Communities: Luxembourg, 2006. [Google Scholar]
- Skidmore, A.K. Accuracy assessment of spatial information. In Spatial statistics for Remote Sensing; Stein, A., Van der Meer, F., Gorte, B., Eds.; Springer: Dordrecht, The Netherlands, 1999; pp. 197–209. [Google Scholar]
- Congalton, R.G.; Green, K. Assessing the Accuracy of Remotely Sensed Data: Principles and Practices, 2nd ed.; CRC Press: Boca Raton, FL, USA, 2009; ISBN 9781420055122. [Google Scholar]
- Stehman, S.V. Sampling designs for accuracy assessment of land cover. Int. J. Remote Sens. 2009, 30, 5243–5272. [Google Scholar] [CrossRef]
- Ricotta, C. On possible measures for evaluating the degree of uncertainty of fuzzy thematic maps. Int. J. Remote Sens. 2005, 26, 5573–5583. [Google Scholar] [CrossRef]
- Foody, G. Impacts of Sample Design for Validation Data on the Accuracy of Feedforward Neural Network Classification. Appl. Sci. 2017, 7, 888. [Google Scholar] [CrossRef]
- Foody, G.M. Latent Class Modeling for Site- and Non-Site-Specific Classification Accuracy Assessment Without Ground Data. IEEE Trans. Geosci. Remote Sens. 2012, 50, 2827–2838. [Google Scholar] [CrossRef]
- Steele, B.M.; Patterson, D.A.; Redmond, R.L. Toward estimation of map accuracy without a probability test sample. Environ. Ecol. Stat. 2003, 10, 333–356. [Google Scholar] [CrossRef]
- Foody, G.M. Harshness in image classification accuracy assessment. Int. J. Remote Sens. 2008, 29, 3137–3158. [Google Scholar] [CrossRef]
- Castilla, G. We Must all Pay More Attention to Rigor in Accuracy Assessment: Additional Comment to “The Improvement of Land Cover Classification by Thermal Remote Sensing”. Remote Sens. 2015, 7, 8368–8390. Remote Sens. 2016, 8, 288. [Google Scholar] [CrossRef]
- Foody, G.M. The impact of imperfect ground reference data on the accuracy of land cover change estimation. Int. J. Remote Sens. 2009, 30, 3275–3281. [Google Scholar] [CrossRef]
- Wulder, M.A.; Franklin, S.E.; White, J.C.; Linke, J.; Magnussen, S. An accuracy assessment framework for large-area land cover classification products derived from medium-resolution satellite data. Int. J. Remote Sens. 2006, 27, 663–683. [Google Scholar] [CrossRef]
- Congalton, R.G. A review of assessing the accuracy of classifications of remotely sensed data. Remote Sens. Environ. 1991, 37, 35–46. [Google Scholar] [CrossRef]
- Pontius, R.G.; Millones, M. Death to Kappa: Birth of quantity disagreement and allocation disagreement for accuracy assessment. Int. J. Remote Sens. 2011, 32, 4407–4429. [Google Scholar] [CrossRef]
- Liu, C.; Frazier, P.; Kumar, L. Comparative assessment of the measures of thematic classification accuracy. Remote Sens. Environ. 2007, 107, 606–616. [Google Scholar] [CrossRef]
- Mitchell, P.J.; Downie, A.-L.; Diesing, M. How good is my map? A tool for semi-automated thematic mapping and spatially explicit confidence assessment. Environ. Model. Softw. 2018, 108, 111–122. [Google Scholar] [CrossRef]
- Cripps, E.; O’Hagan, A.; Quaife, T. Quantifying uncertainty in remotely sensed land cover maps. Stoch. Environ. Res. RISK Assess. 2013, 27, 1239–1251. [Google Scholar] [CrossRef]
- Stehman, S.V.; Wickham, J.D. Pixels, blocks of pixels, and polygons: Choosing a spatial unit for thematic accuracy assessment. Remote Sens. Environ. 2011, 115, 3044–3055. [Google Scholar] [CrossRef]
- Stehman, S.V. Practical Implications of Design-Based Sampling Inference for Thematic Map Accuracy Assessment. Remote Sens. Environ. 2000, 72, 35–45. [Google Scholar] [CrossRef]
- Garzon-Lopez, C.; Foody, G.; Bastin, L.; Rocchini, D.; Pal, M. The Sensitivity of Mapping Methods to Reference Data Quality: Training Supervised Image Classifications with Imperfect Reference Data. ISPRS Int. J. Geo Inf. 2016, 5, 199. [Google Scholar]
- Fehrmann, L.; Kukunda, C.B.; Nölke, N.; Schnell, S.; Seidel, D.; Magnussen, S.; Kleinn, C. A unified framework for land cover monitoring based on a discrete global sampling grid (GSG). Environ. Monit. Assess. 2019, 191, 46. [Google Scholar] [CrossRef]
- Yu, L.; Gong, P. Google Earth as a virtual globe tool for Earth science applications at the global scale: Progress and perspectives. Int. J. Remote Sens. 2012, 33, 3966–3986. [Google Scholar] [CrossRef]
- Pettorelli, N.; Wegmann, M.; Skidmore, A.; Mücher, S.; Dawson, T.P.; Fernandez, M.; Lucas, R.; Schaepman, M.E.; Wang, T.; O’Connor, B.; et al. Framing the concept of satellite remote sensing essential biodiversity variables: Challenges and future directions. Remote Sens. Ecol. Conserv. 2016, 2, 122–131. [Google Scholar] [CrossRef]
- Coops, N.C.; Wulder, M.A. Breaking the Habit(at). Trends Ecol. Evol. 2019, 34, 585–587. [Google Scholar] [CrossRef]
- Rose, R.A.; Byler, D.; Eastman, J.R.; Fleishman, E.; Geller, G.; Goetz, S.; Guild, L.; Hamilton, H.; Hansen, M.; Headley, R.; et al. Ten ways remote sensing can contribute to conservation. Conserv. Biol. 2015, 29, 350–359. [Google Scholar] [CrossRef] [PubMed]
- Radoux, J.; Bogaert, P.; Fasbender, D.; Defourny, P. Thematic accuracy assessment of geographic object-based image classification. Int. J. Geogr. Inf. Sci. 2011, 25, 895–911. [Google Scholar] [CrossRef]
- Gómez, C.; White, J.C.; Wulder, M.A. Optical remotely sensed time series data for land cover classification: A review. ISPRS J. Photogramm. Remote Sens. 2016, 116, 55–72. [Google Scholar] [CrossRef]
- Ye, S.; Pontius, R.G.; Rakshit, R. A review of accuracy assessment for object-based image analysis: From per-pixel to per-polygon approaches. ISPRS J. Photogramm. Remote Sens. 2018, 141, 137–147. [Google Scholar] [CrossRef]
- Stehman, S.V.; Foody, G.M. Key issues in rigorous accuracy assessment of land cover products. Remote Sens. Environ. 2019, 231, 111199. [Google Scholar] [CrossRef]
- Lechner, A.M.; Langford, W.T.; Bekessy, S.A.; Jones, S.D. Are landscape ecologists addressing uncertainty in their remote sensing data? Landsc. Ecol. 2012, 27, 1249–1261. [Google Scholar] [CrossRef]
- Yu, L.; Liang, L.; Wang, J.; Zhao, Y.; Cheng, Q.; Hu, L.; Liu, S.; Yu, L.; Wang, X.; Zhu, P.; et al. Meta-discoveries from a synthesis of satellite-based land-cover mapping research. Int. J. Remote Sens. 2014, 35, 4573–4588. [Google Scholar] [CrossRef]
- Roelfsema, C.M.; Phinn, S.R. Coral Reef Remote Sensing. In Coral Reef Remote Sensing; Goodman, J.A., Ed.; Springer: Dordrecht, The Netherlands, 2013; pp. 375–401. ISBN 9789048192922. [Google Scholar]
- The World Bank Land Area (sq. km)|Data. Available online: https://data.worldbank.org/indicator/ag.lnd.totl.k2 (accessed on 4 April 2019).
- Lesiv, M.; See, L.; Laso Bayas, J.; Sturn, T.; Schepaschenko, D.; Karner, M.; Moorthy, I.; McCallum, I.; Fritz, S.; Lesiv, M.; et al. Characterizing the Spatial and Temporal Availability of Very High Resolution Satellite Imagery in Google Earth and Microsoft Bing Maps as a Source of Reference Data. Land 2018, 7, 118. [Google Scholar] [CrossRef]
- Khatami, R.; Mountrakis, G.; Stehman, S.V. Mapping per-pixel predicted accuracy of classified remote sensing images. Remote Sens. Environ. 2017, 191, 156–167. [Google Scholar] [CrossRef]
- Comber, A.; Fisher, P.; Wadsworth, R. Comparing the consistency of expert land cover knowledge. Int. J. Appl. Earth Obs. Geoinf. 2005, 7, 189–201. [Google Scholar] [CrossRef]
- Janssen, F.L.L.; van der Wel, F.J.M. Accuracy assessment of satellite derived land cover data: A review. Photogramm. Eng. Remote Sens. 1994, 60, 419–426. [Google Scholar]
- Ma, L.; Li, M.; Ma, X.; Cheng, L.; Du, P.; Liu, Y. A review of supervised object-based land-cover image classification. ISPRS J. Photogramm. Remote Sens. 2017, 130, 277–293. [Google Scholar] [CrossRef]
- Andréfouët, S.; Kramer, P.; Torres-Pulliza, D.; Joyce, K.E.; Hochberg, E.J.; Garza-Pérez, R.; Mumby, P.J.; Riegl, B.; Yamano, H.; White, W.H.; et al. Multi-site evaluation of IKONOS data for classification of tropical coral reef environments. Remote Sens. Environ. 2003, 88, 128–143. [Google Scholar] [CrossRef]
© 2019 by the authors. Licensee MDPI, Basel, Switzerland. This article is an open access article distributed under the terms and conditions of the Creative Commons Attribution (CC BY) license (http://creativecommons.org/licenses/by/4.0/).