1. Introduction
Urbanization is the most irreversible and human-dominated form of land use, resulting in changes in land-cover, hydrological systems, biogeochemistry, climate, and biodiversity [
1]. City boundaries continue to expand, consuming rural areas, forests, heritage sites, and other important non-urban areas [
2]. The spatiotemporal analysis of urban expansion patterns and dynamics is important not only in urban geography, but also in sustainability, urban planning, and environmental studies [
3]. Southeast Asia, at the center of a significant economic transformation, is now undergoing rapid growth and urbanization. The mostly rural countries of Southeast Asia had the highest spatial expansion rates, with Laos at 7.3 percent and Cambodia at 4.3 percent [
4]. However, environmental impacts and risks are a major concern in these countries. Southeast Asia is a culturally rich and diverse region containing numerous world heritage sites as classified by UNESCO. Urban expansion, understandably, has adverse impacts on these sites in terms of land use change, air pollution, traffic, invasive species, and foreign cultures [
5]. Urbanization alters the surrounding natural landscape, making these sites susceptible to anthropogenic agents, while at the same time, urbanization improves accessibility to the sites, making them more vulnerable to tourism [
6].
Satellite imagery and geospatial mapping have been widely applied to better understand urbanization for several decades. Many previous studies used satellite images to drive land cover data and employed landscape metrics to analyze the spatial patterns of land expansion in cities and regions [
7,
8]. In addition, a large number of studies analyzed the driving factors for urban land expansion in different cities and regions [
9]. Remote sensing and GIS have also been used for heritage management [
10,
11]. As most heritage sites are tourist destinations located in cities, tourism creates growth and economic benefits for local communities and cities, and simultaneously makes both tangible and intangible cultural heritage vulnerable to irrevocable damage and loss [
11]. If the heritage site is destroyed or seriously damaged, these urban areas cease their functional priority. It is, therefore, essential to develop planning methods to protect heritage sites located on the urban fringe. Increasing availability of remotely sensed observations and a variety of other geospatial information facilitates the development of new tools and approaches for understanding urban environments [
12]. Many studies have given special attention to mapping urban growth and assessing the risk in the vicinity of cultural heritage sites. Agapiou et al. [
2] used time series multispectral satellite images and predictive models to understand future urban settlement patterning, with special focus on the Paphos area in Cyprus.
Angkor is a symbol of pride for the Cambodian nation and Khmer culture. It is an ancient archaeological landscape with extraordinary temples, monuments and layered remains of cities and settlements from the ninth to the fifteenth centuries [
13]. In 1992, Angkor was inscribed as a United Nations Educational, Scientific and Cultural Organization (UNESCO) designated world heritage site. At Angkor, the environment is inseparable from the monuments, including forests, natural features, and agricultural lands [
14,
15].
Tourists have been coming to Angkor for almost a century. Siem Reap city, located 5 km south of Angkor Wat, is the traditional gateway for visiting the Angkor world heritage site [
16]. In recent years, tourism to Angkor has risen exponentially and is a key developing sector of the Cambodian economy [
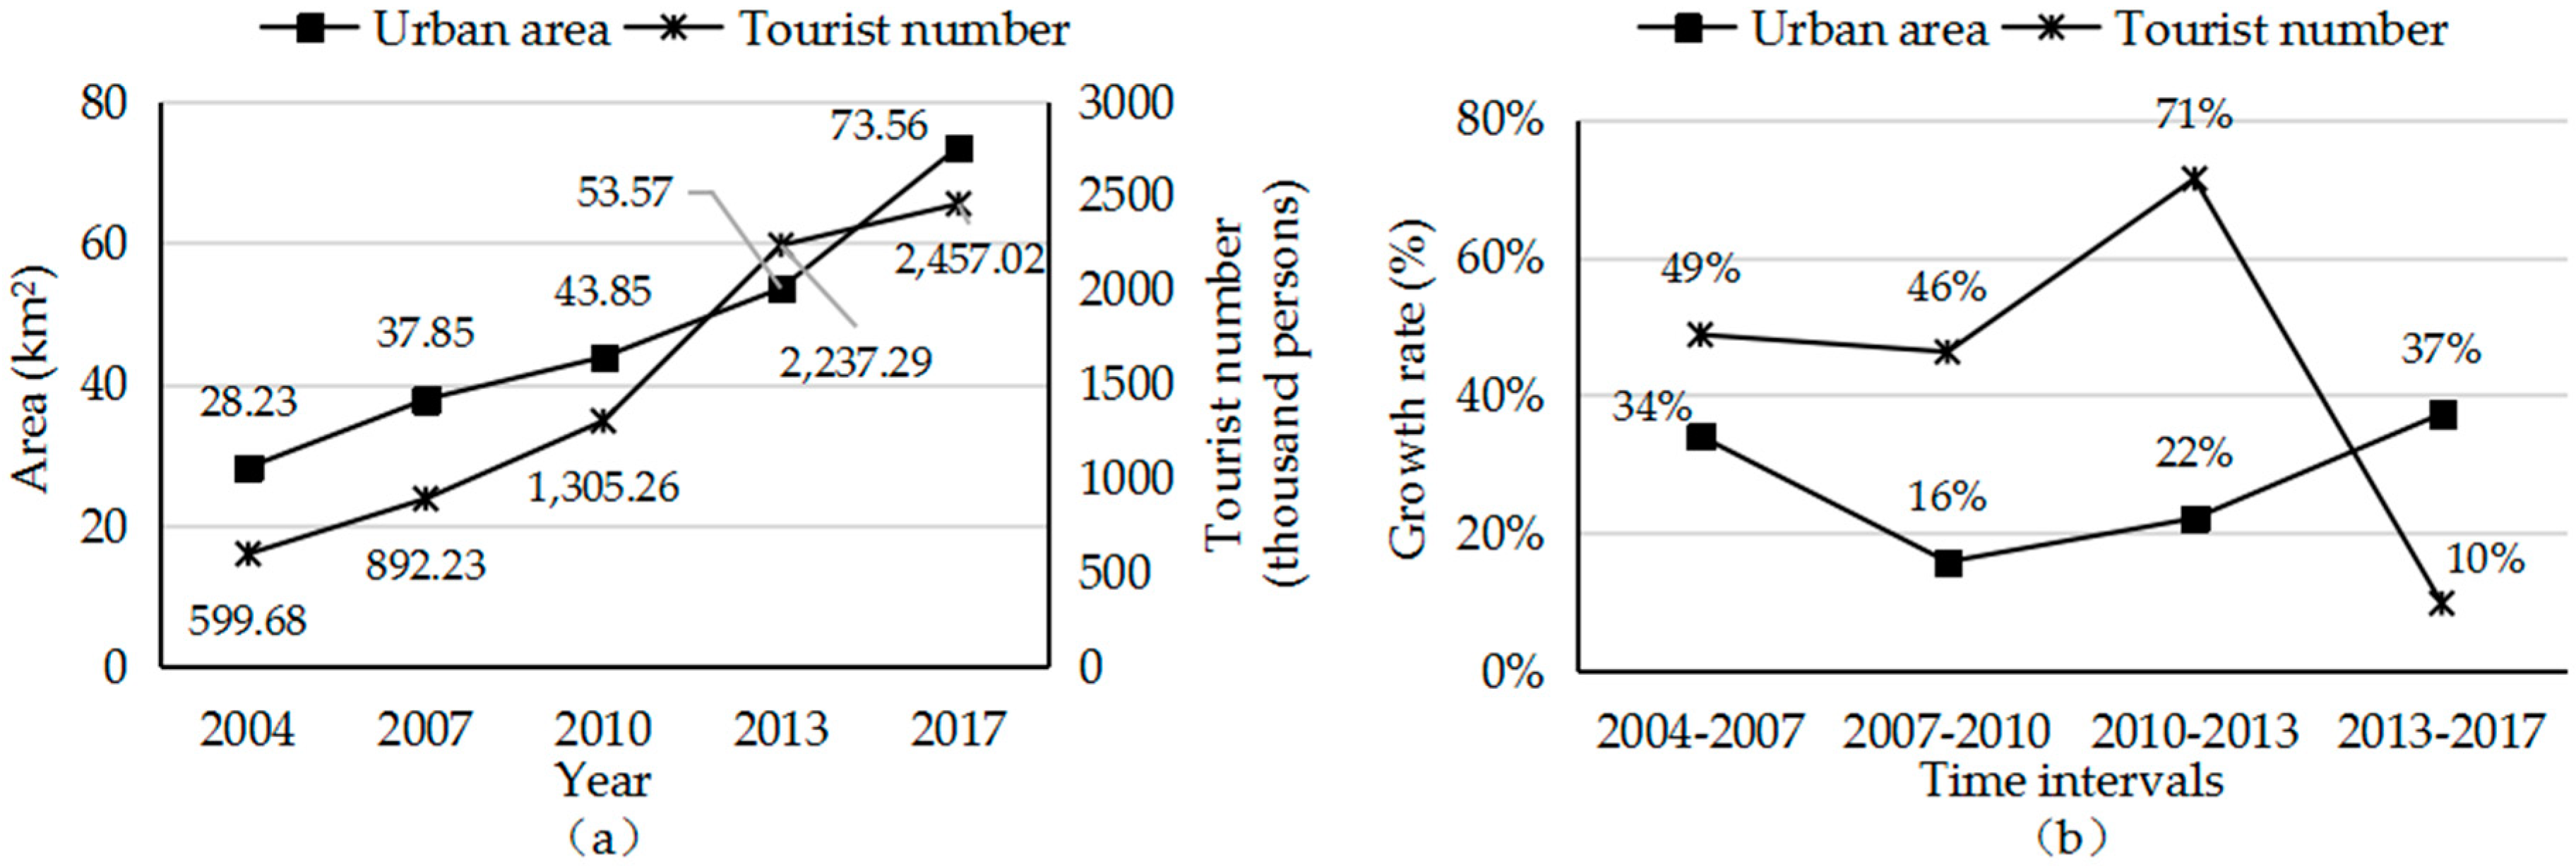
17]. The number of international tourists to the Angkor world heritage site has increased dramatically from 599,675 in 2004 to more than 2.45 million in 2017. The revenue from tourism in Cambodia has made a substantial contribution to growth in Cambodia’s gross domestic product (GDP). However, the rapid growth in visitation to Angkor has created processes that threaten the environment, local communities, and the value of the heritage (both tangible and intangible) [
13]. The Angkor site is now affected by many factors, including proliferation of housing and road development, rapid consumption of resources, reduction of forest land, and the destruction of the ecological environment [
18,
19]. The rapid expansion of Siem Reap city has increased the risk of further degradation [
20,
21]. Mackay et al. revealed a clear disconnect between economic beneficiaries and owners that prized traditional cultural values in the Angkor world heritage site [
22]. Stubbs et al. discussed applications of remote sensing to the understanding and management of Angkor [
5]. Liao et al. [
18] explored the land use/cover change in Angkor by using time series remote sensing images during the period from 1985 to 2013, showing that during the past 30 years, the urban land increased rapidly, mainly taking over agriculture and forest. Living with heritage is a joint Cambodian and international program focused on developing spatial methods for monitoring and analyzing landscape change in Angkor [
10]. In the context of Angkor’s preservation goals, sustainable development requires integration of the conservation practices of these sites with the sustainable use and management of natural resources in the broader landscape [
23].
The International Coordinating Committee for the Safeguarding and Development of the Historic Site of Angkor (ICC-Angkor) viewed the impending arrival of an international tourism industry as a force that would threaten Angkor’s long-term survival [
24]. Fearful of rampant and uncontrolled development, UNESCO stated in 1996 that tourism threatens to damage this Khmer cultural legacy far more swiftly and decisively than did any ancient invaders, or even the clandestine raiders of today [
25]. Therefore, this study aims to investigate and model the present urban expansion of Siem Reap city, explore the driving factors and assess the urban pressure on Angkor at different scales. In addition, this study applied a CA-Markov model to predict the growth of urban expansion over the next 5 to 10 years, so as to provide some insights for policy-makers to take effective planning and management actions in the future.
2. Study Area
The Angkor world heritage site includes the archaeological parks of Angkor, Rolous, and Banteay Srei on the Cambodian plains between the Kulen Mountains to the north and Tonle Sap Lake to the south [
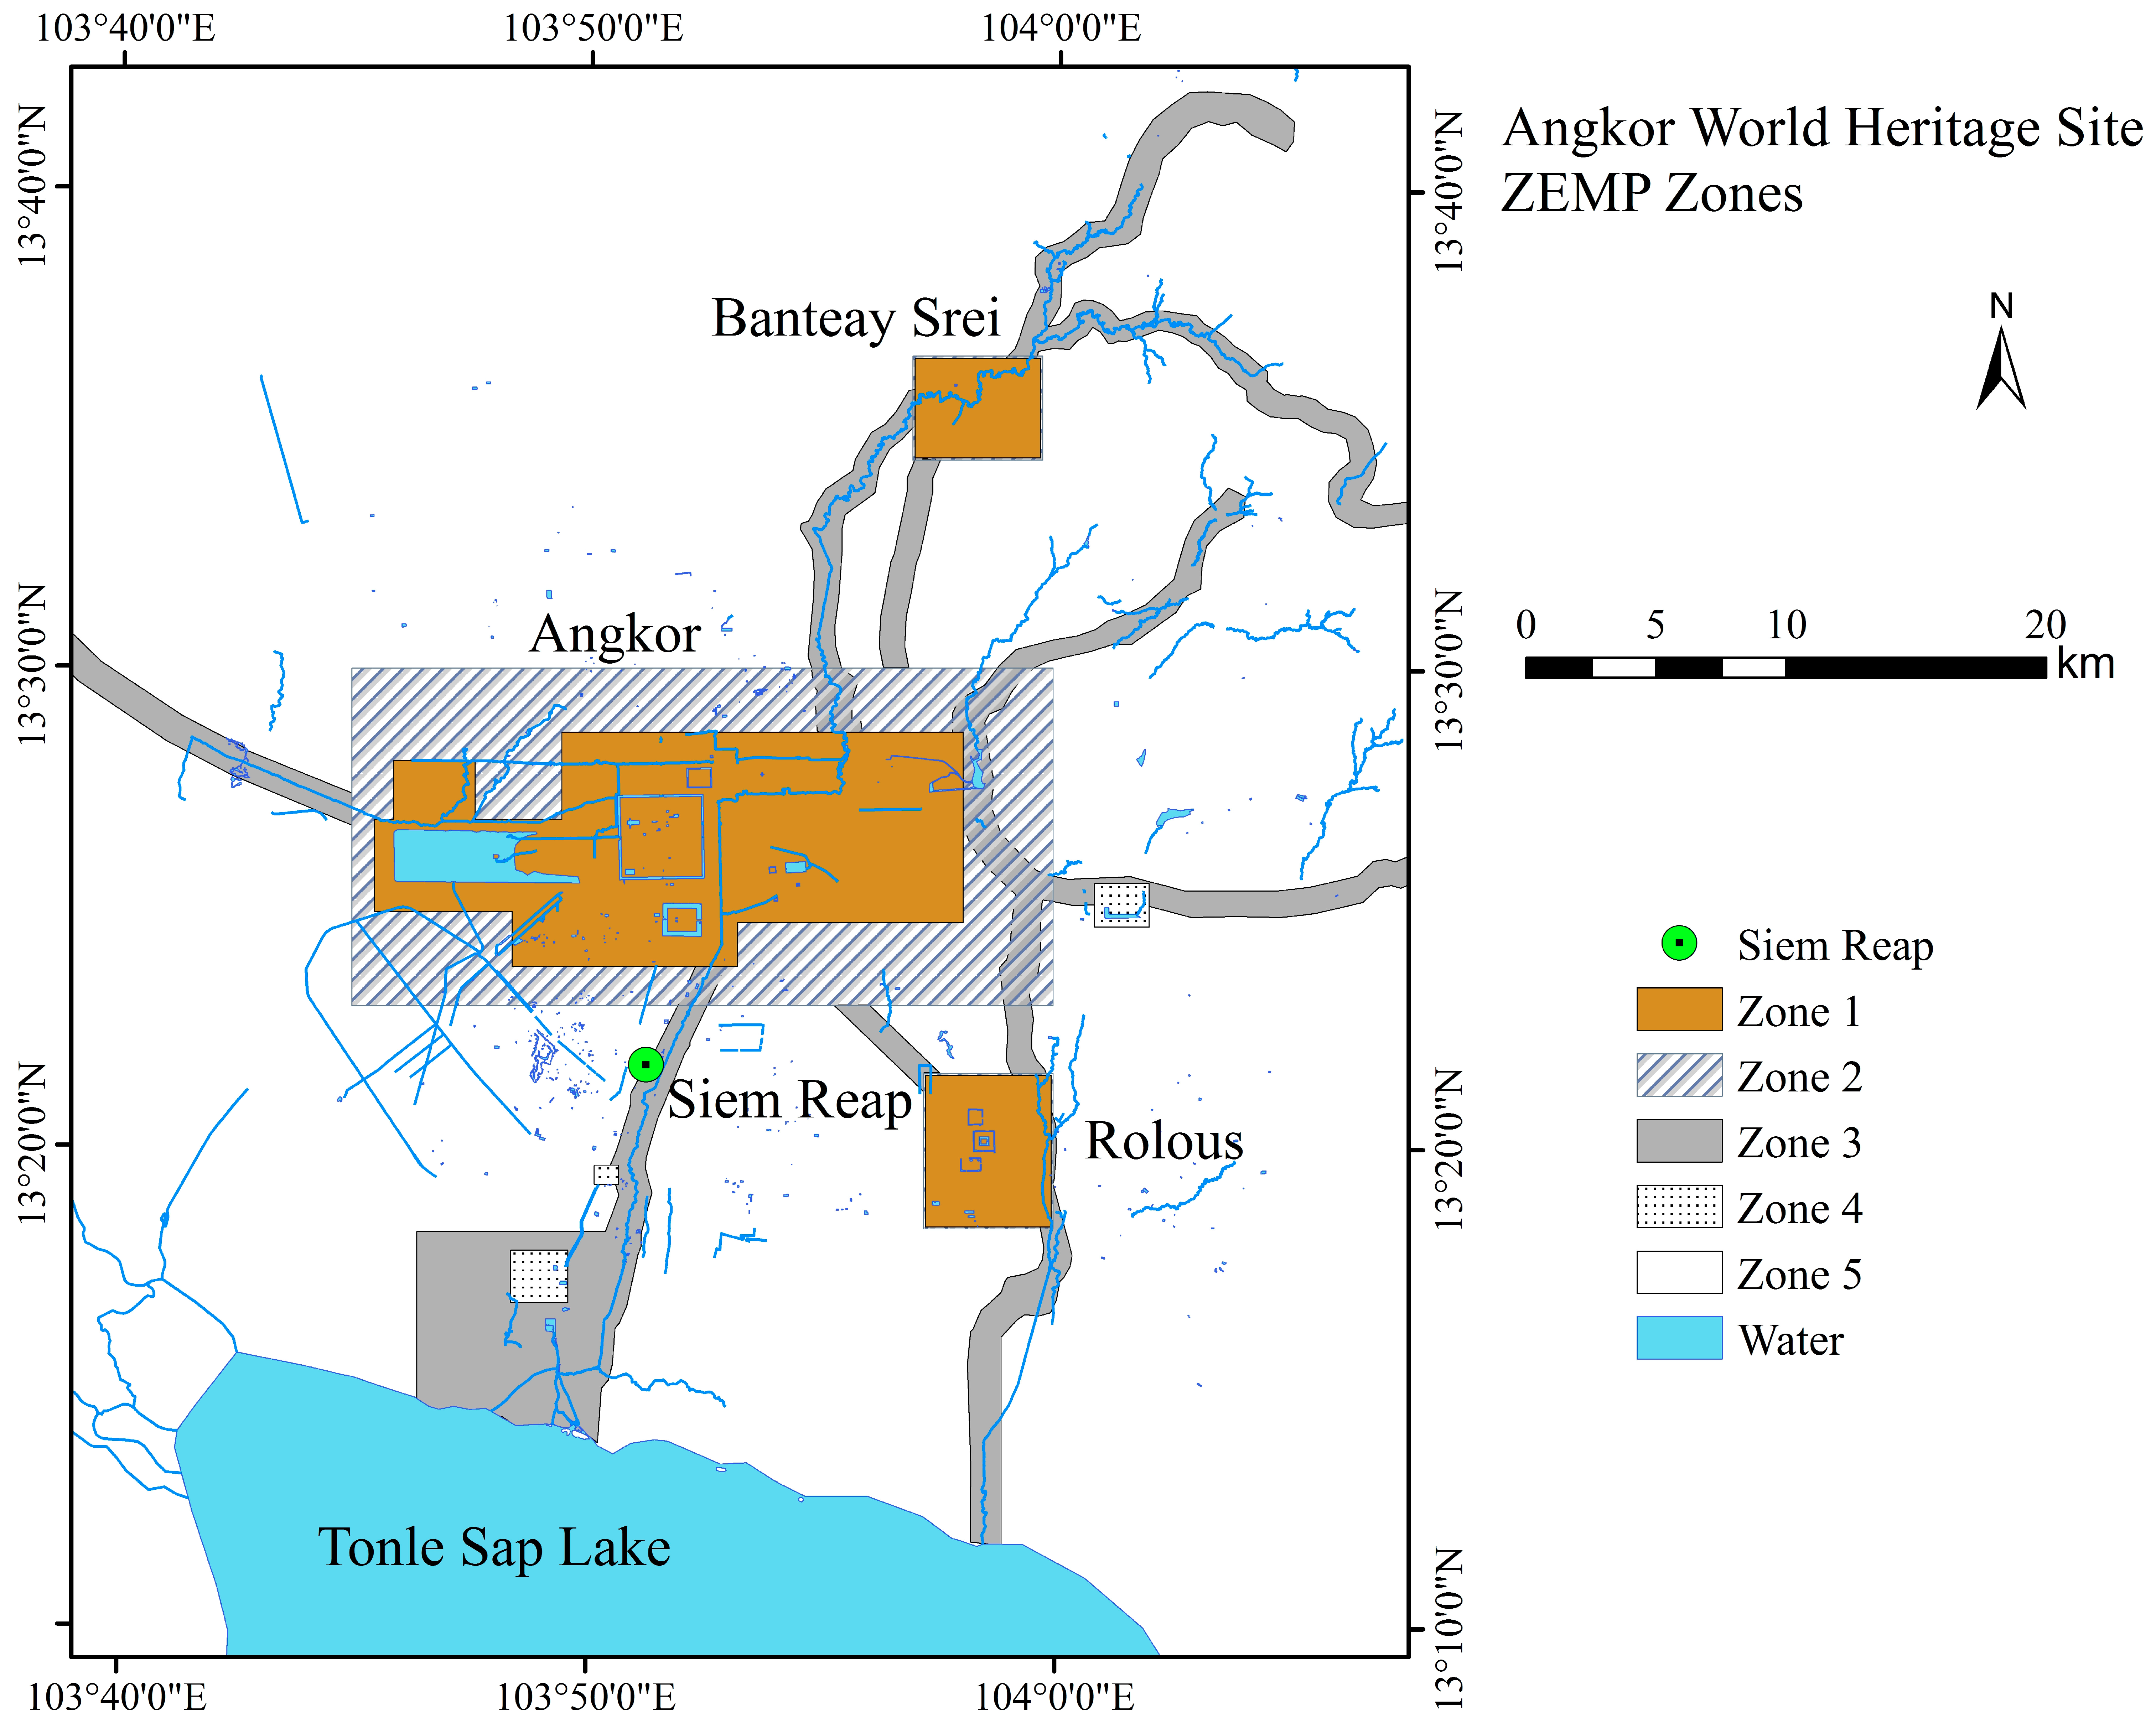
13]. In the early 1990s, UNESCO, in conjunction with the Cambodian government, established the Angkor Zoning and Environment Management Plan (ZEMP) team to designate the cultural significance of central Angkor and its vicinity. These zoning regulations were legally enforced, and approved through national legislation [
26]. The ZEMP prompted the government to establish the national system for the protection of cultural heritage sites, which is still used to this day (
Figure 1). The Angkor site is divided into five planning zones, namely Zone 1: Monumental Sites (core zone); Zone 2: Protected Archaeological Reserves (buffer zone); Zone 3: Protected Cultural Landscapes (along rivers), including historic buildings, land use practices, Siem Reap river, and Roluos river; Zone 4: Sites of Archaeological, Anthropological or Historic Interest (sites not included in Zone 1 or 2); and Zone 5: Siem Reap Province, designated in its entirety as the largest protected area because of the abundant archaeological sites located in the province [
26]. The Cambodian government decree stipulates that the core zone is essential for the conservation and display of the Angkor world heritage site, and the buffer zone is a development zone that is essential for the protection of local residents.
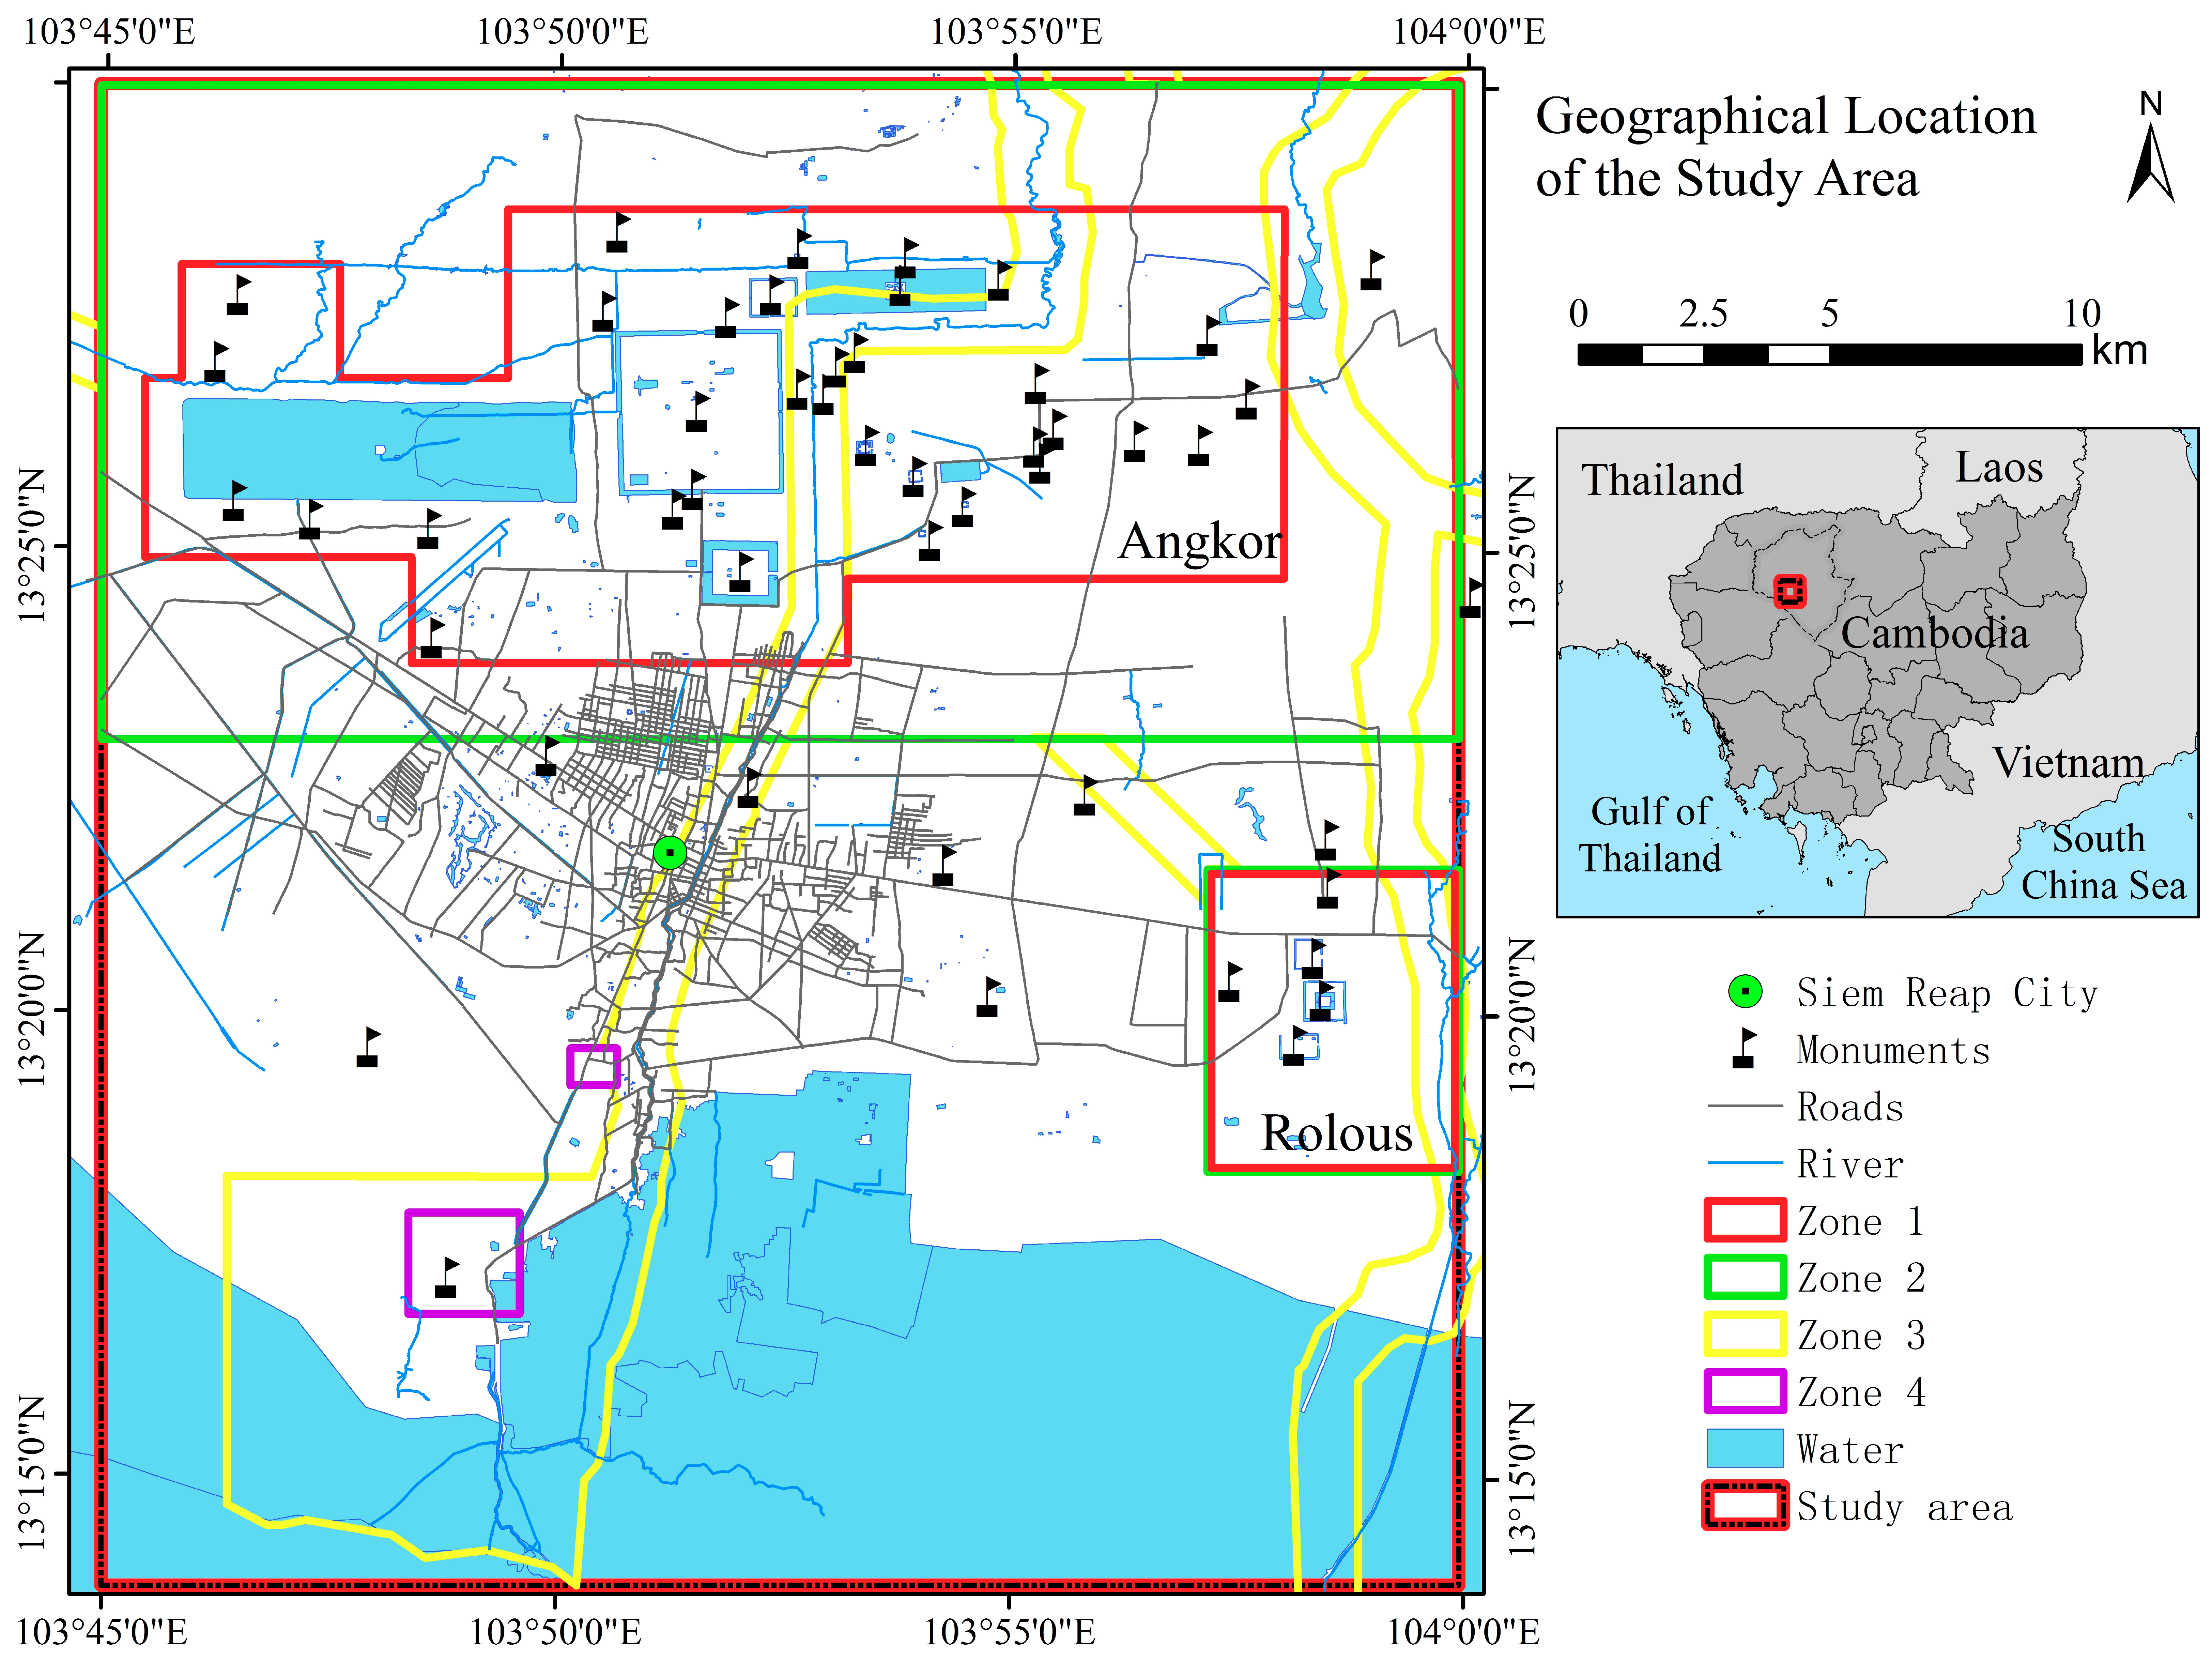
The study area is located in the Angkor region with a total area of 810 km
2, and lies between 103°45′E~104°00′E and 13°36′N~13°57′N (
Figure 2). The eastern, western, and northern boundaries of Angkor’s buffer zone were used to limit the spatial scope of the study area. In the south, the buffer zone extends to the southernmost protected cultural landscape. The study area includes the core and buffer zones of Angkor and Roluos, which were mainly affected by the urban expansion of Siem Reap city. Siem Reap city is located in relatively flat terrain, which provides a natural advantage for urban expansion. The core zones in Angkor and Roluos cover approximately 161.55 km
2 and 28.31 km
2, respectively. The buffer zones occupy 189.45 km
2 and 1.69 km
2, respectively. There were 48 monuments in the study area according to field investigations and literature records [
14]. The study area is in a low-latitude area and features a tropical monsoon climate with high temperature and precipitation, ranging from 29°C to 30°C [
27]. There is a large variation in precipitation with time and with geographic location, mainly a consequence of the terrain and monsoon activity. Generally speaking, the rainy season lasts from May to November while the dry season prevails from December to April. The average temperature ranges from 20°C in winter to 31°C in summer. Usually, tourists prefer to visit Angkor in the dry season [
19].
This study mainly focused on using remote sensing and GIS to assess the urban expansion of Siem Reap city in the core and buffer zones of Angkor and Roluos. Angkor and Roluos are the two popular tourist destinations in the Angkor world heritage site, and all land in the core and buffer zones are considered by the Cambodian government as public land and is inalienable and imprescriptible [
28].
3. Data and Methodology
3.1. Data Used
The GIS layers of the Angkor monument sites with demarcated core and buffer zones were provided by the APSARA National Authority. The built-up areas in Siem Reap and the Angkor site were analyzed using multi-source high-resolution remote sensing data acquired for 2004, 2007, 2010, 2013, and 2017, which constituted the individual study periods and collectively defined the total study duration. All remote sensing images collected for this study were obtained from optical sensors from 6 January to 12 March, representing the dry season. The detailed characteristics of the data are provided in
Table 1.
Tourism population data was derived from the tourism statistics report obtained from the official website of the Cambodian Tourism Administration. The data on land use and land cover, traffic lines, and rivers was obtained from Open Street Map [
29] and then verified and corrected based on high-resolution images and Google Earth. The slope data was obtained from a digital elevation model (DEM) with 30 m resolution, downloaded from the USGS website and processed in ArcGIS software.
3.2. Data Processing and Methodology
The coordinate system of all images was WGS 1984 UTM Zone 48N and the projection was Transverse Mercator. In remote sensing, images contain geometric distortion relative to the surface target due to the influence of the imaging projection mode, changes in the orientation elements outside the sensor, inhomogeneity of the sensing medium, and the curvature of Earth. In this study, the geometric figure on the image was different from the object in the selected map projection. The issue was solved using geometric correction. The 2004 Quick Bird data was pre-processed and additional data was corrected based on this product. ENVI 5.3 remote sensing processing software was used for image pre-processing, including geometric correction and registration, cropping, image enhancement, and other operations. Geometric correction reduced the error of control points to be within 0.5 pixels. The remote sensing data from each period was cropped using vector boundary data of the study area to improve work efficiency. The color synthesis method was used to enhance the images from different phases.
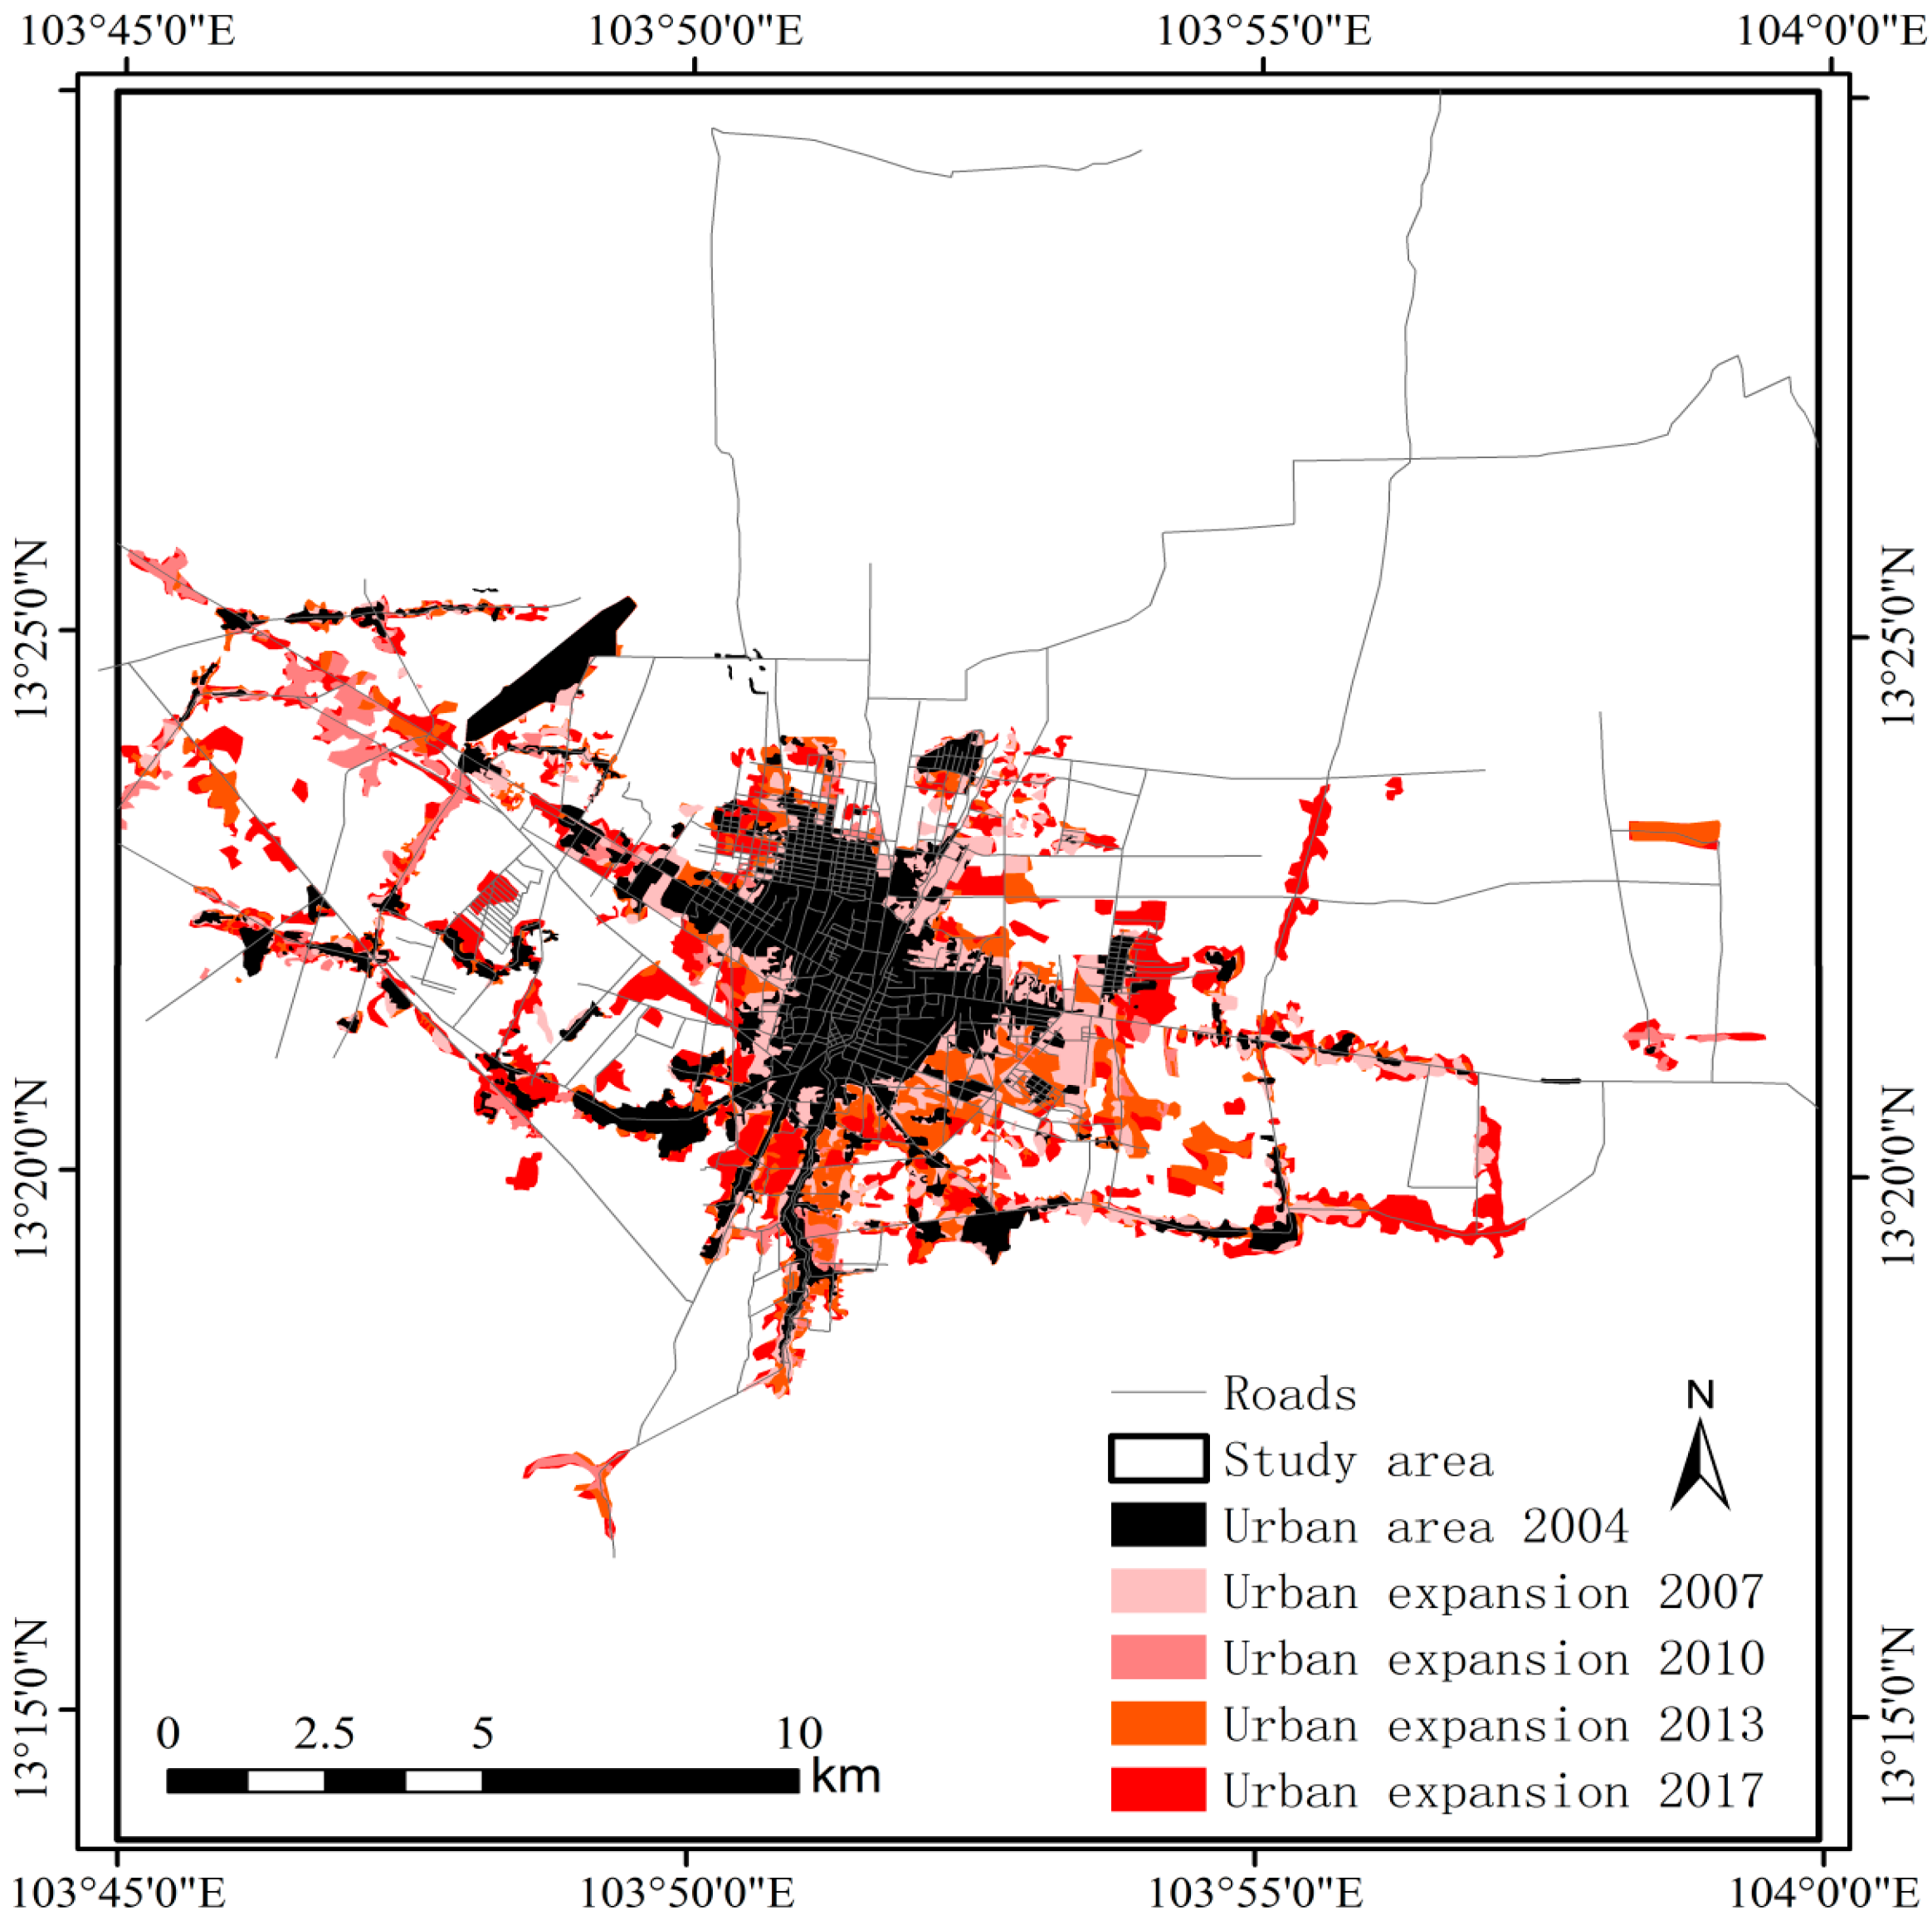
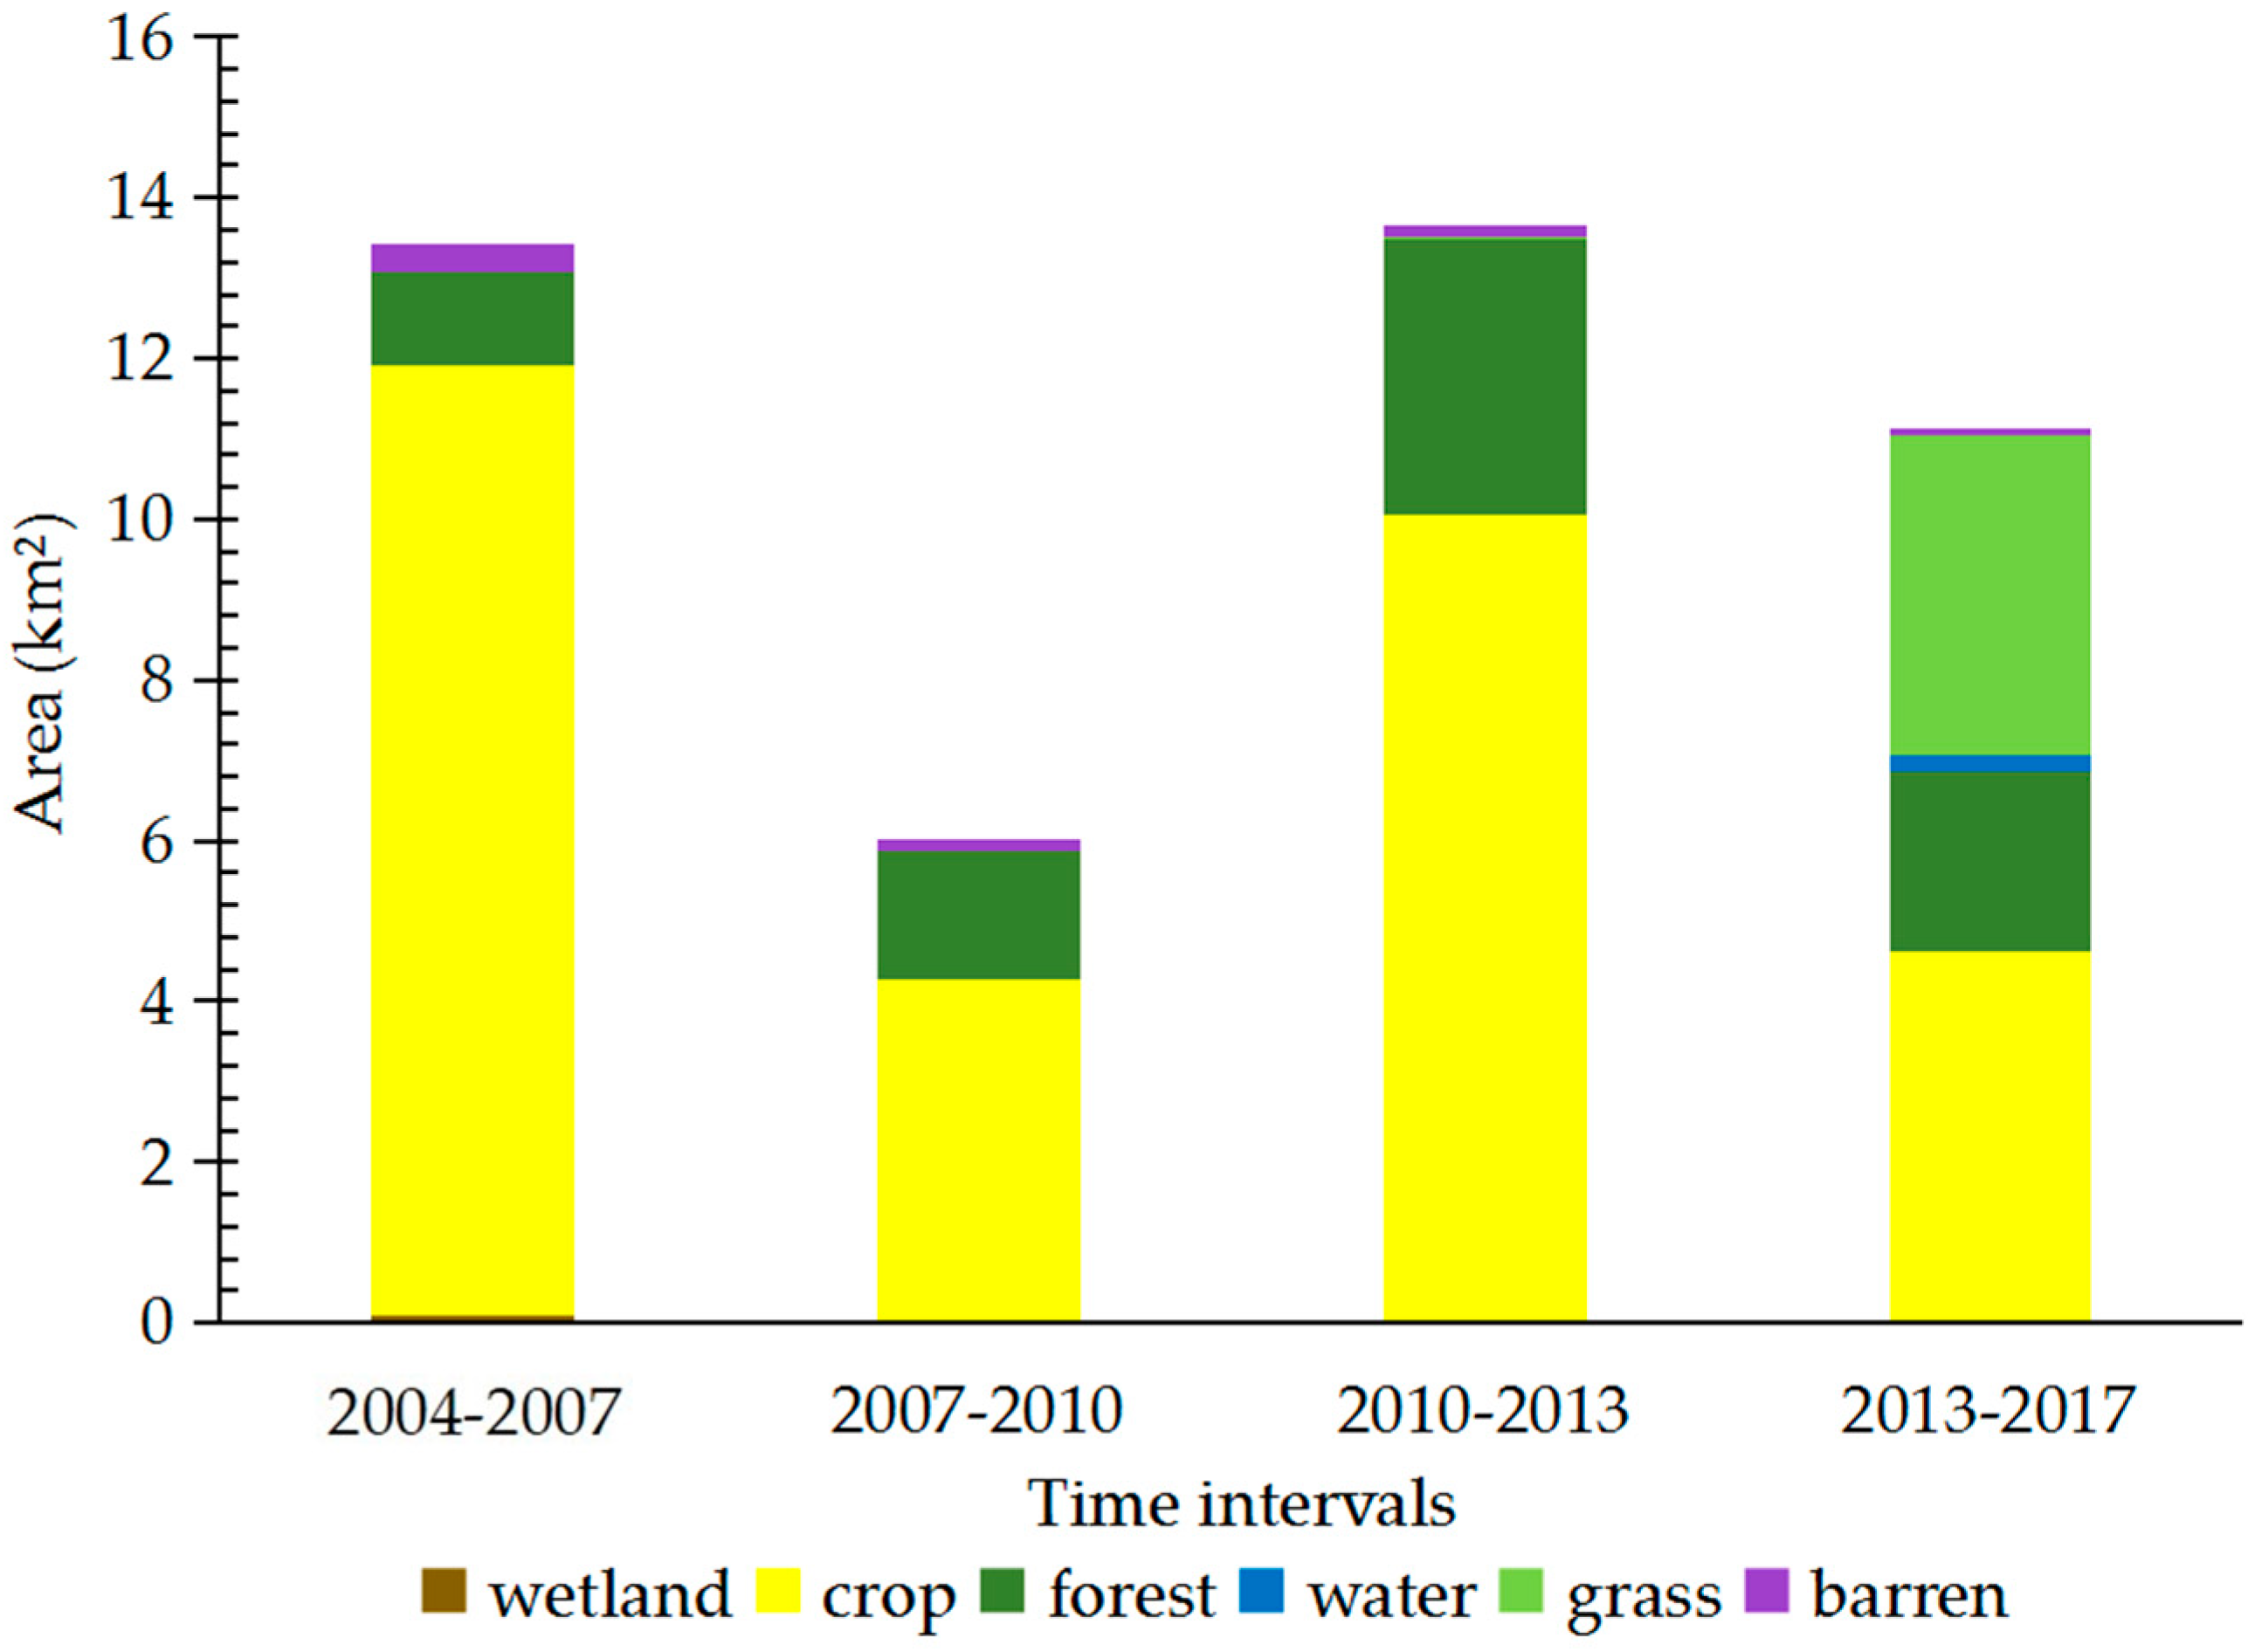
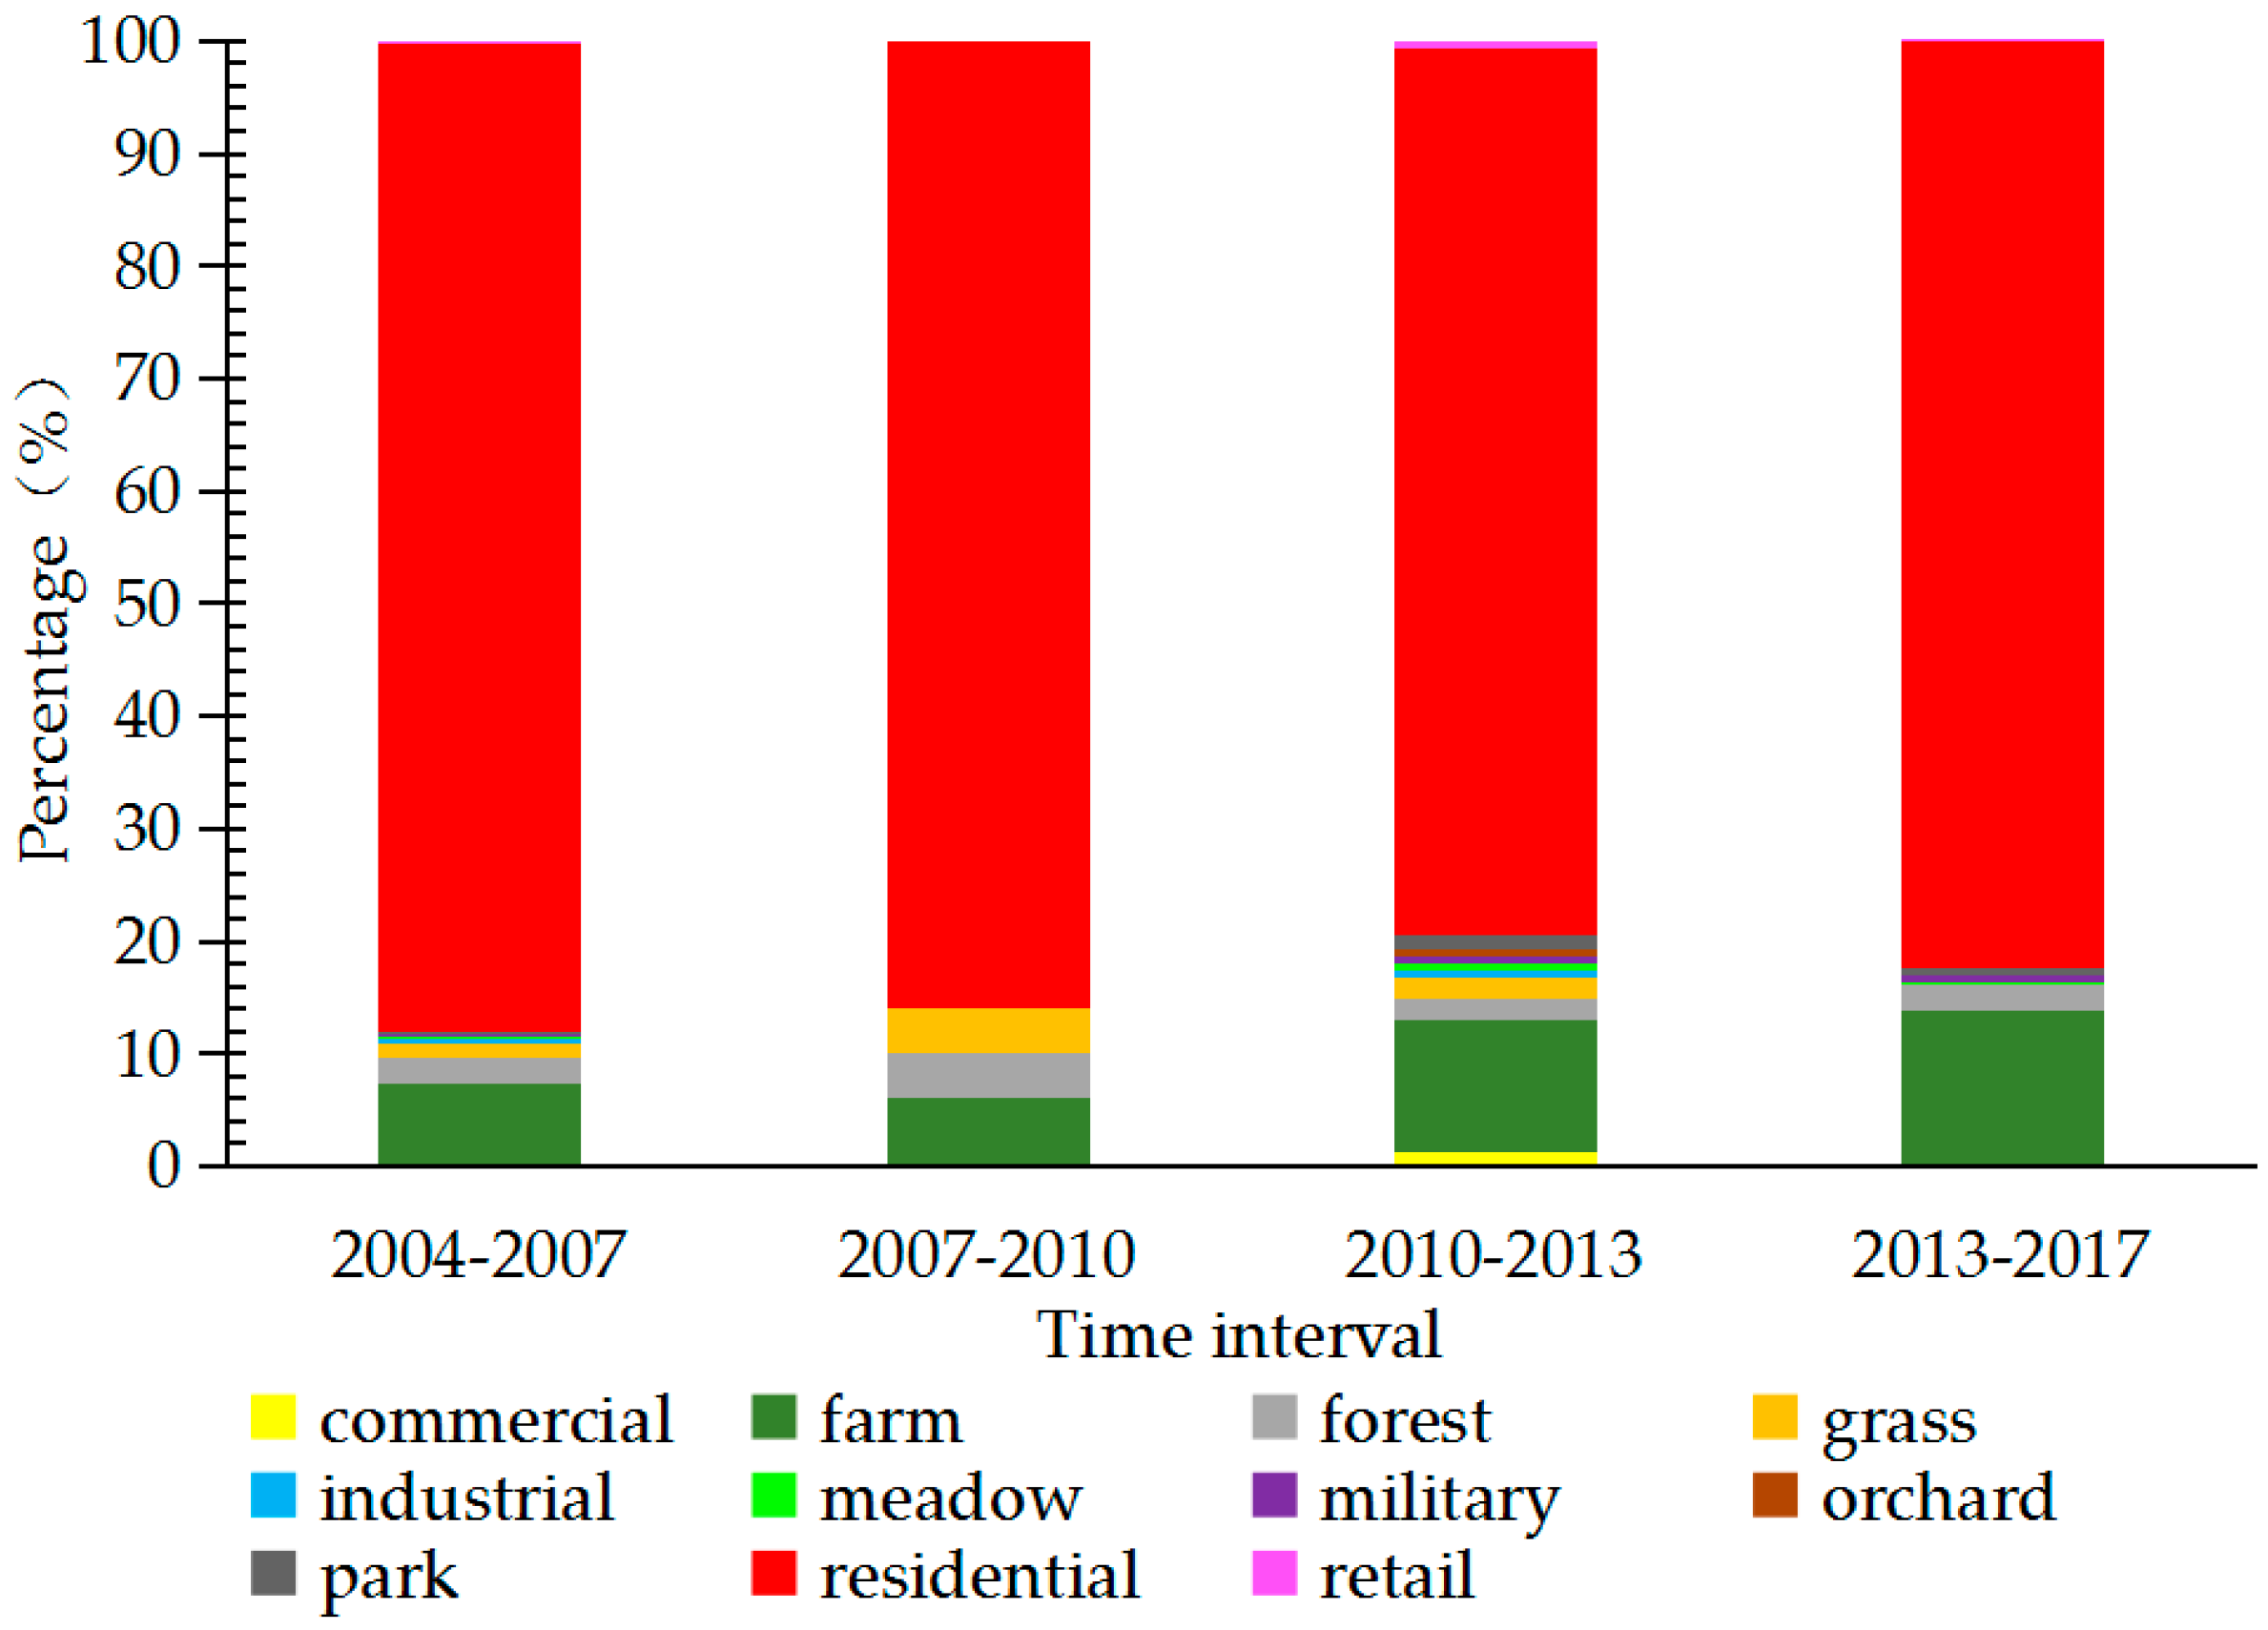
Following pre-processing of the remote sensing images, the next step was to map the successive land use changes in Siem Reap during the study period. Primarily, the built-up areas for each individual study period were digitized through meticulous visual interpretation of the remote sensing image from that particular year. The digitization process was completed using the ArcGIS 10.2 platform. Following this, the land use change maps for four time intervals, 2004–2007, 2007–2010, 2010–2013, and 2013–2017, were created by overlaying the vector boundary of the built-up area for each individual year with the vector boundary of the year preceding it. This was done successively for all years, with the exception of the year 2004 as this was the baseline. Simultaneously, the change in the land use/land cover category attributes (wetland, crop, forest, water, grass, barren) were also recorded from one study period to another. The urban land use map for 2017 was created, by thorough visual interpretation, to study the urban use of new built-up areas in 2017. A total of 11 main categories of urban land use were identified in the built-up areas of 2017, which included commercial, farm, forest, grass, industry, meadow, military, orchard, park, residential, and retail. The patches of land for which clear urban use could not be determined were marked as null in the land use attributes. The classification results were verified from land use and land cover maps obtained from Open Street Map.
3.2.1. Method of Quantifying Urban Expansion and Land Use Change
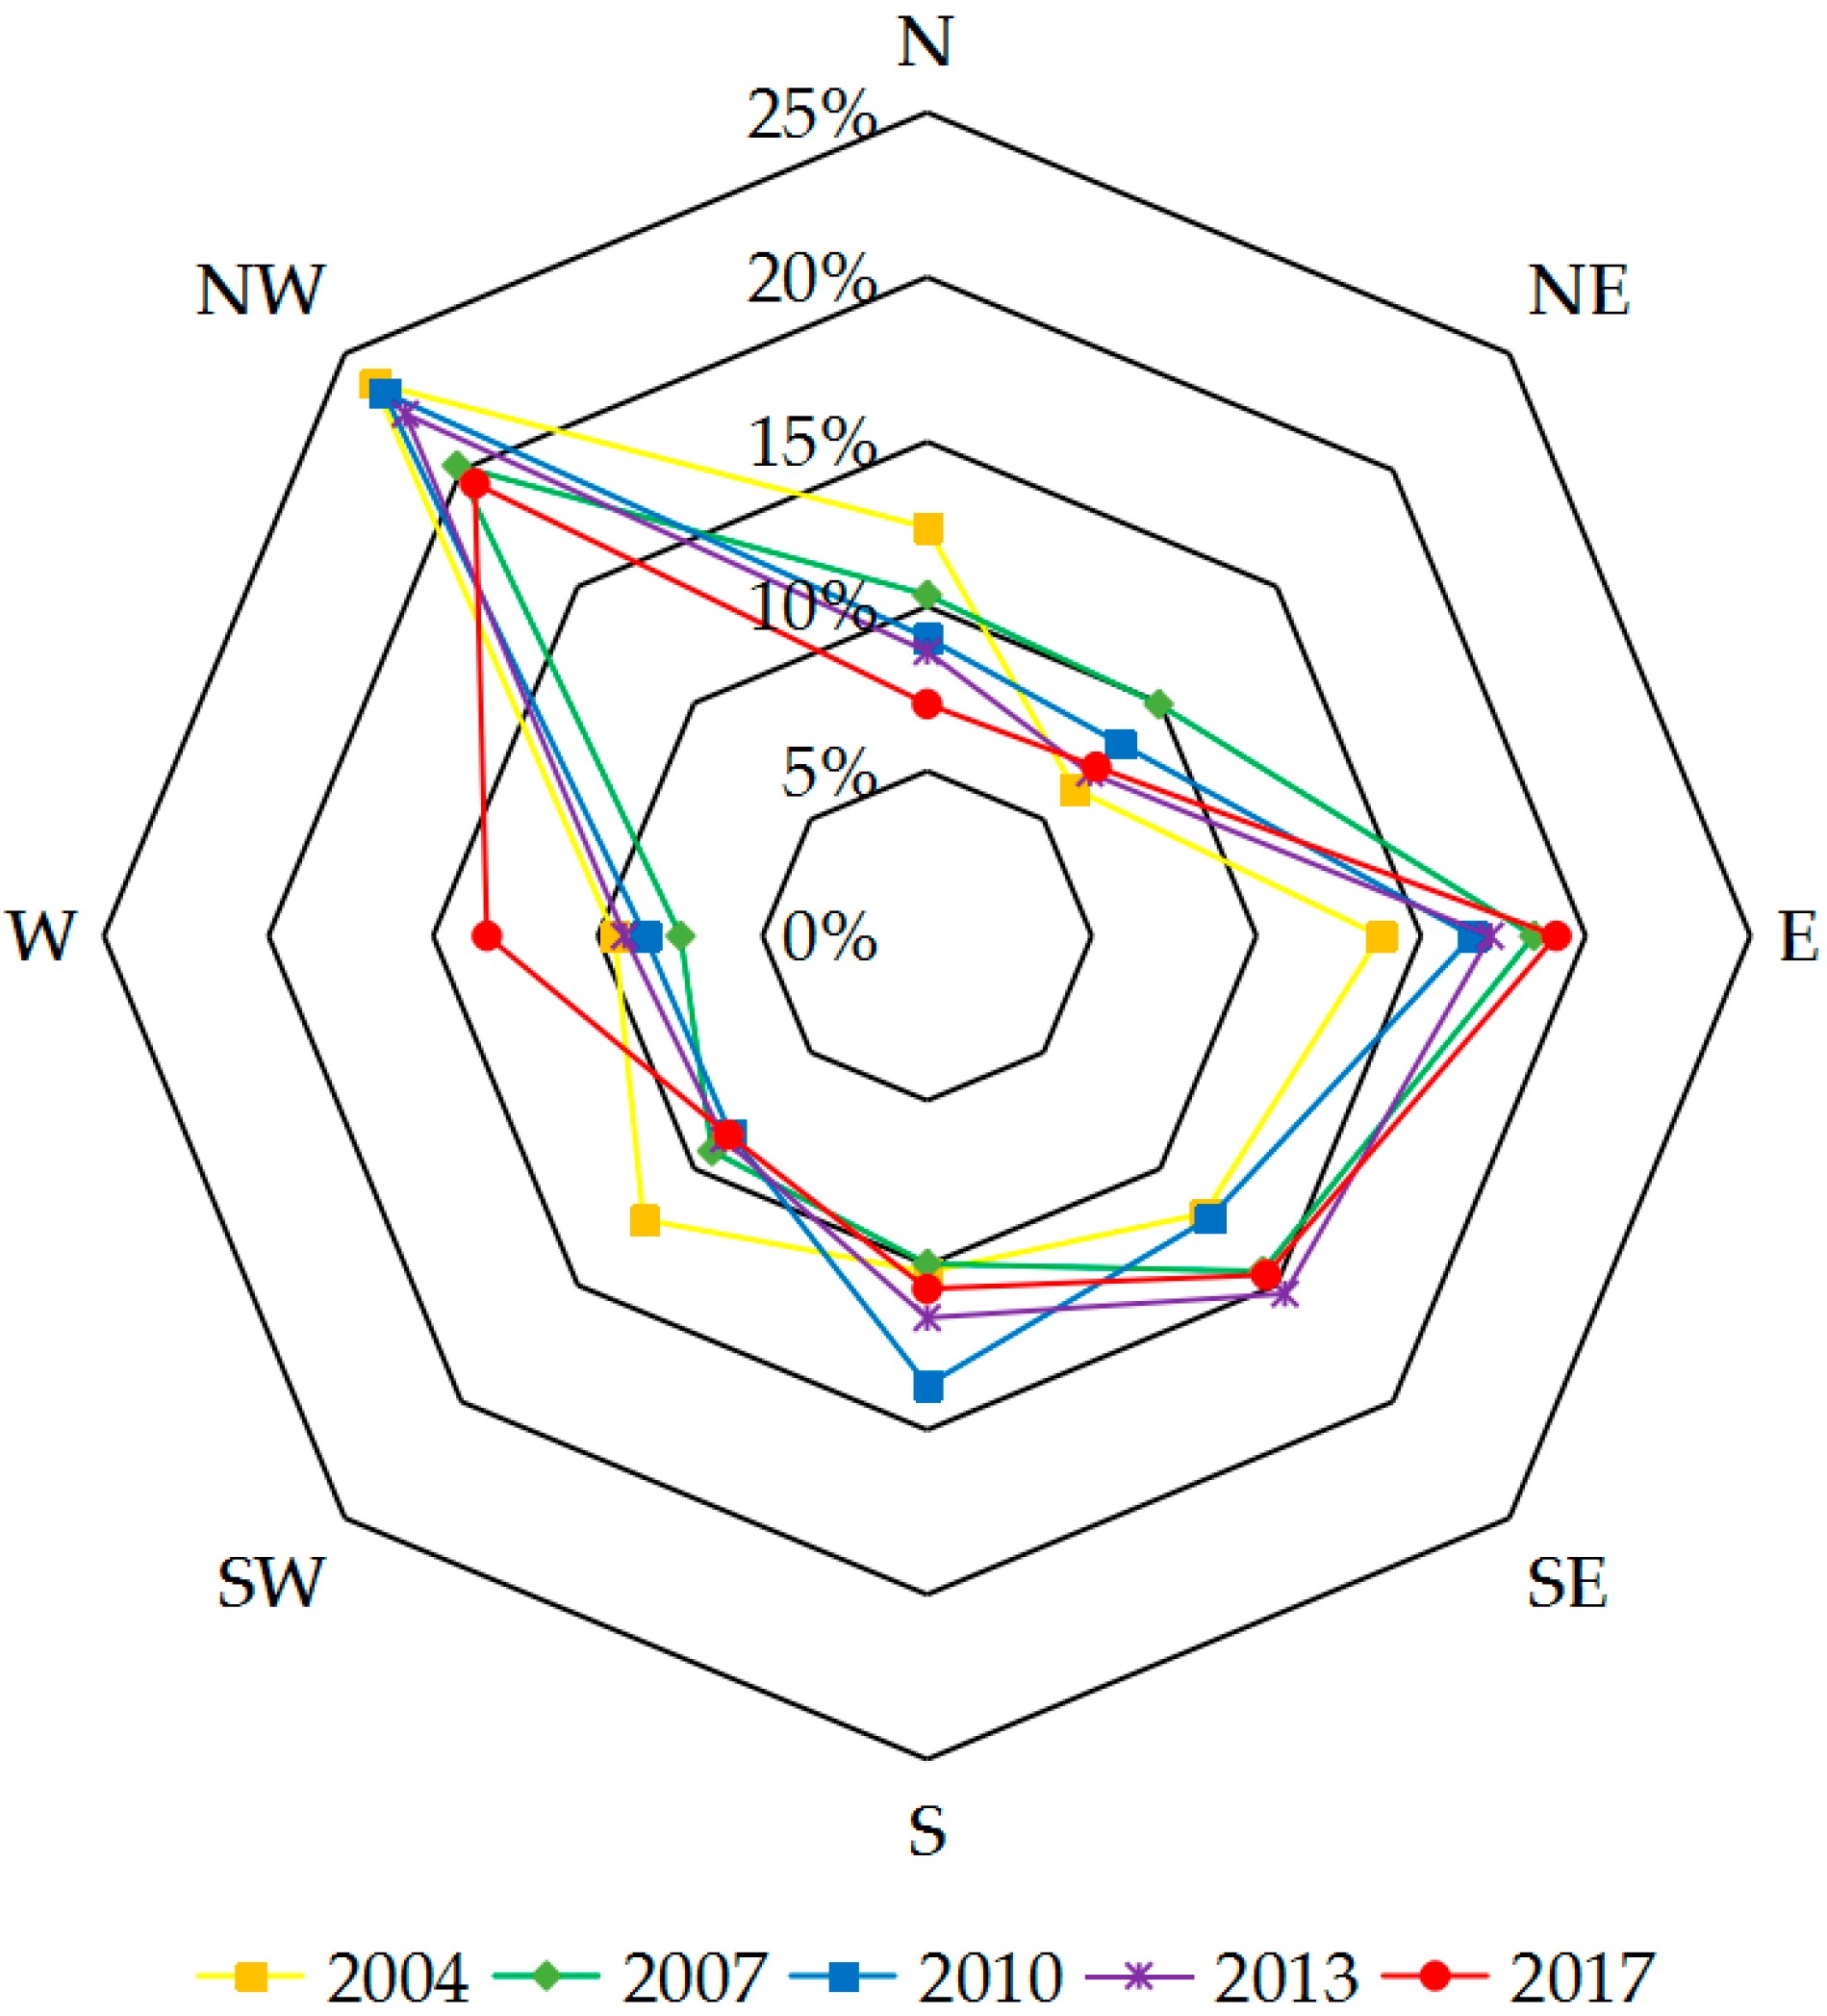
To determine the predominant direction of urbanization in the city, a circle with a radius of 14,700 m was created, centered on the 2017 built-up area vector file and covering the entire periphery of the city in 2017. From the center of this circle, a 45-degree segmented angle was used to divide the study area into eight azimuth areas in the eight geographical directions (N, NE, E, SE, S, SW, W, NW). The built-up area in each azimuth area was then calculated for each individual study period. The expansion intensity of the built-up area, within an azimuth area, was calculated by dividing the built-up area in individual azimuth areas by the total built-up area in Siem Reap city at that point in time.
The land use change maps, calculated for the four time intervals, were also overlaid on top of the urban land use map of 2017 to determine the prior uses of the new built-up areas at each point in time before 2017. As the land use change records also had null values, only the effective patches with meaningful attributes were sampled. The numbers of effective patches for each progressive time interval were 591, 50, 161, and 162 respectively. They collectively accounted for 95% of the new built-up area. The use of urban expansion was then quantified by counting the percentage of each urban land use type in the effective patches of the four land cover change time intervals.
3.2.2. Methodology to Simulate Urban Expansion
Markov Model
The Markov model is a theory based on the process of the formation of Markov random process systems for the prediction and optimal control theory method [
30]. Changes in urban and non-urban lands can be analyzed and summarized by the number of transition area probabilities from one status to various other statuses during a certain period of time using this model [
31,
32]. The application of the Markov model in land-use change modeling is promising because of its ability to quantify, not only the states of conversion between land-use types, but also the rate of conversion among the land use types [
33]. A homogenous Markov model for predicting land-use change can be represented mathematically as:
where L
(t+1) and L
(t) are the land-use status at time t+1 and t, respectively. P
ij is the transition probability matrix in a state which is calculated as follows:
Cellular Automata (CA) Model
Cellular automata (CA) are spatially dynamic models frequently used for land-use and land-cover change studies [
34,
35]. In a CA model, the transition of a cell from one land-cover to another depends on the state of the neighborhood cells [
36]. The CA model has an open structure and can be integrated with other models to simulate and predict urban growth patterns in GIS [
37]; thus, the CA model has a high spatial resolution and computational efficiency [
38]. The CA model can be expressed as follows:
where S is the set of limited and discrete cellular states, N is the cellular field, t and t + 1 indicate the different times, and f is the transformation rule of cellular states in local space.
CA-Markov Model
Both the Markov model and the CA model are time-discrete, state-discrete dynamic models. The CA-Markov model is widely used in the simulation and prediction of land use change [
39]. The CA model provides strong spatial computing power and the Markov model has the advantages of long-term prediction [
2,
40]. In this paper, the future range of built-up areas were predicted using the CA-Markov model applied using the IDRISI software platform. The map was based on the reality of traffic-oriented urban sprawl and expansion patterns in Siem Reap. The main factors affecting the conversion of the built-up area were summarized to be: The impact of protection and restriction policies; the impact of existing construction areas on new land development; the influence of traffic and distance between cities and towns; and the impact of other land types on the suitability of land development [
41,
42,
43].
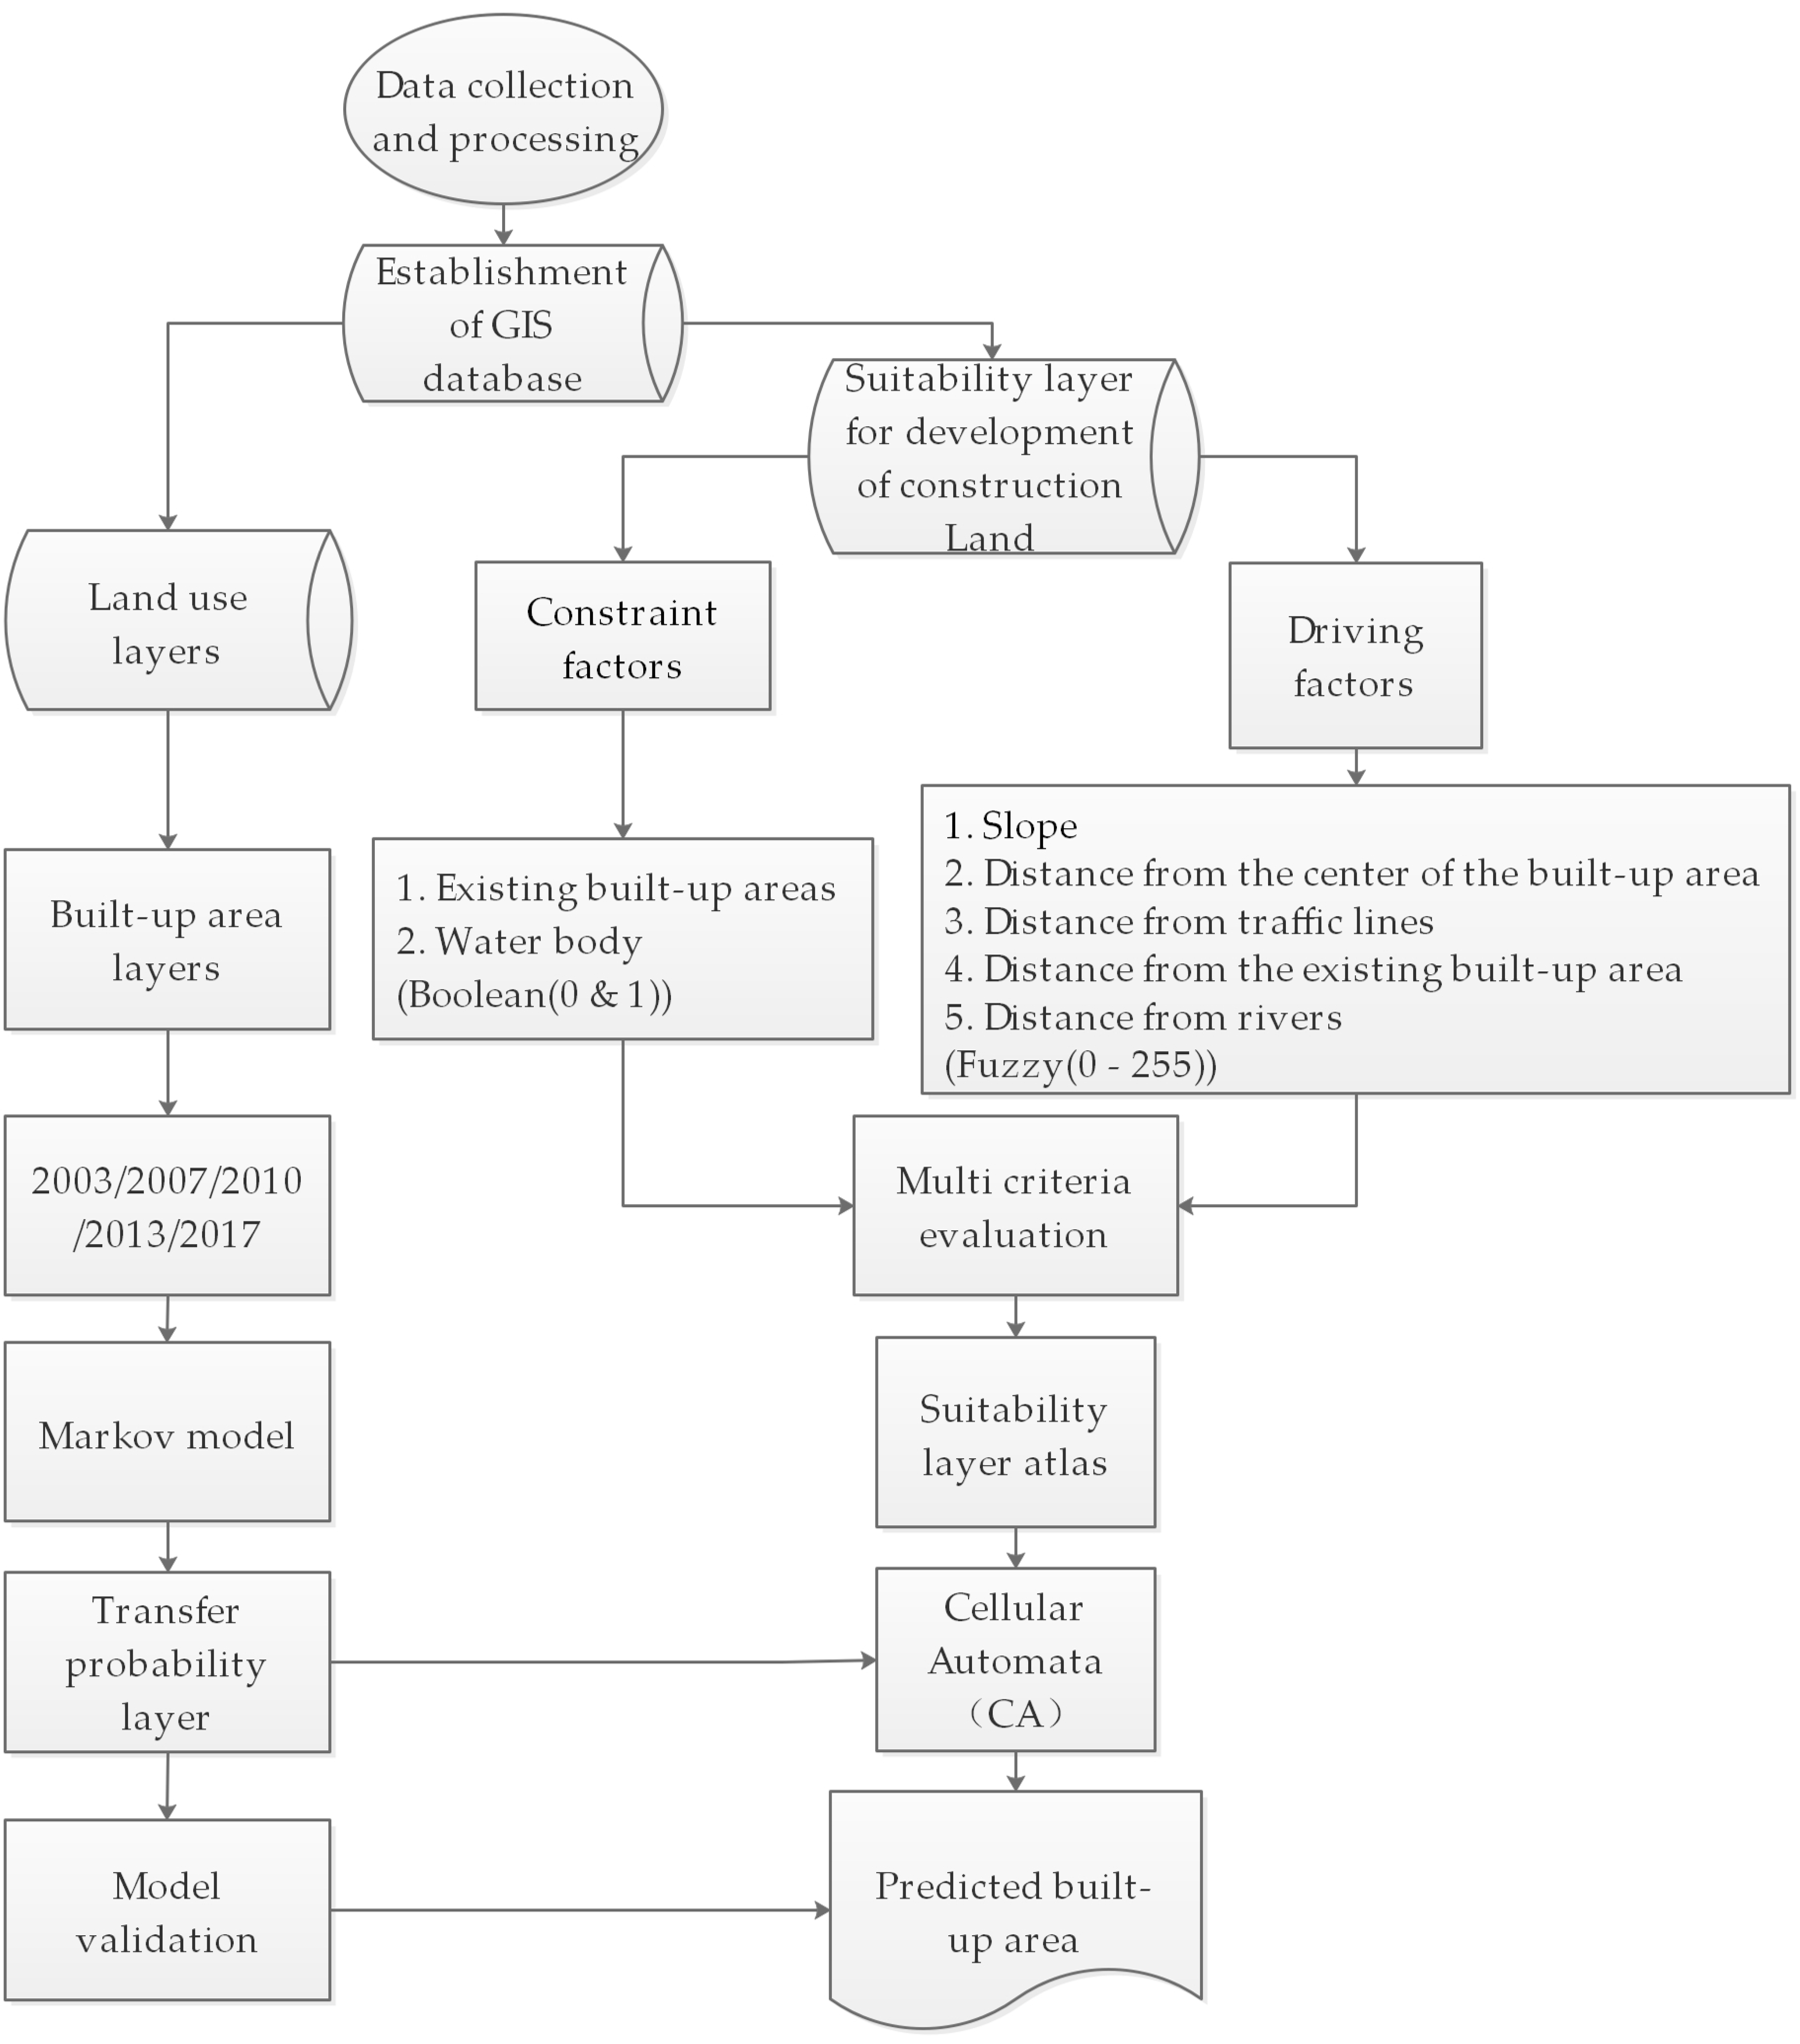
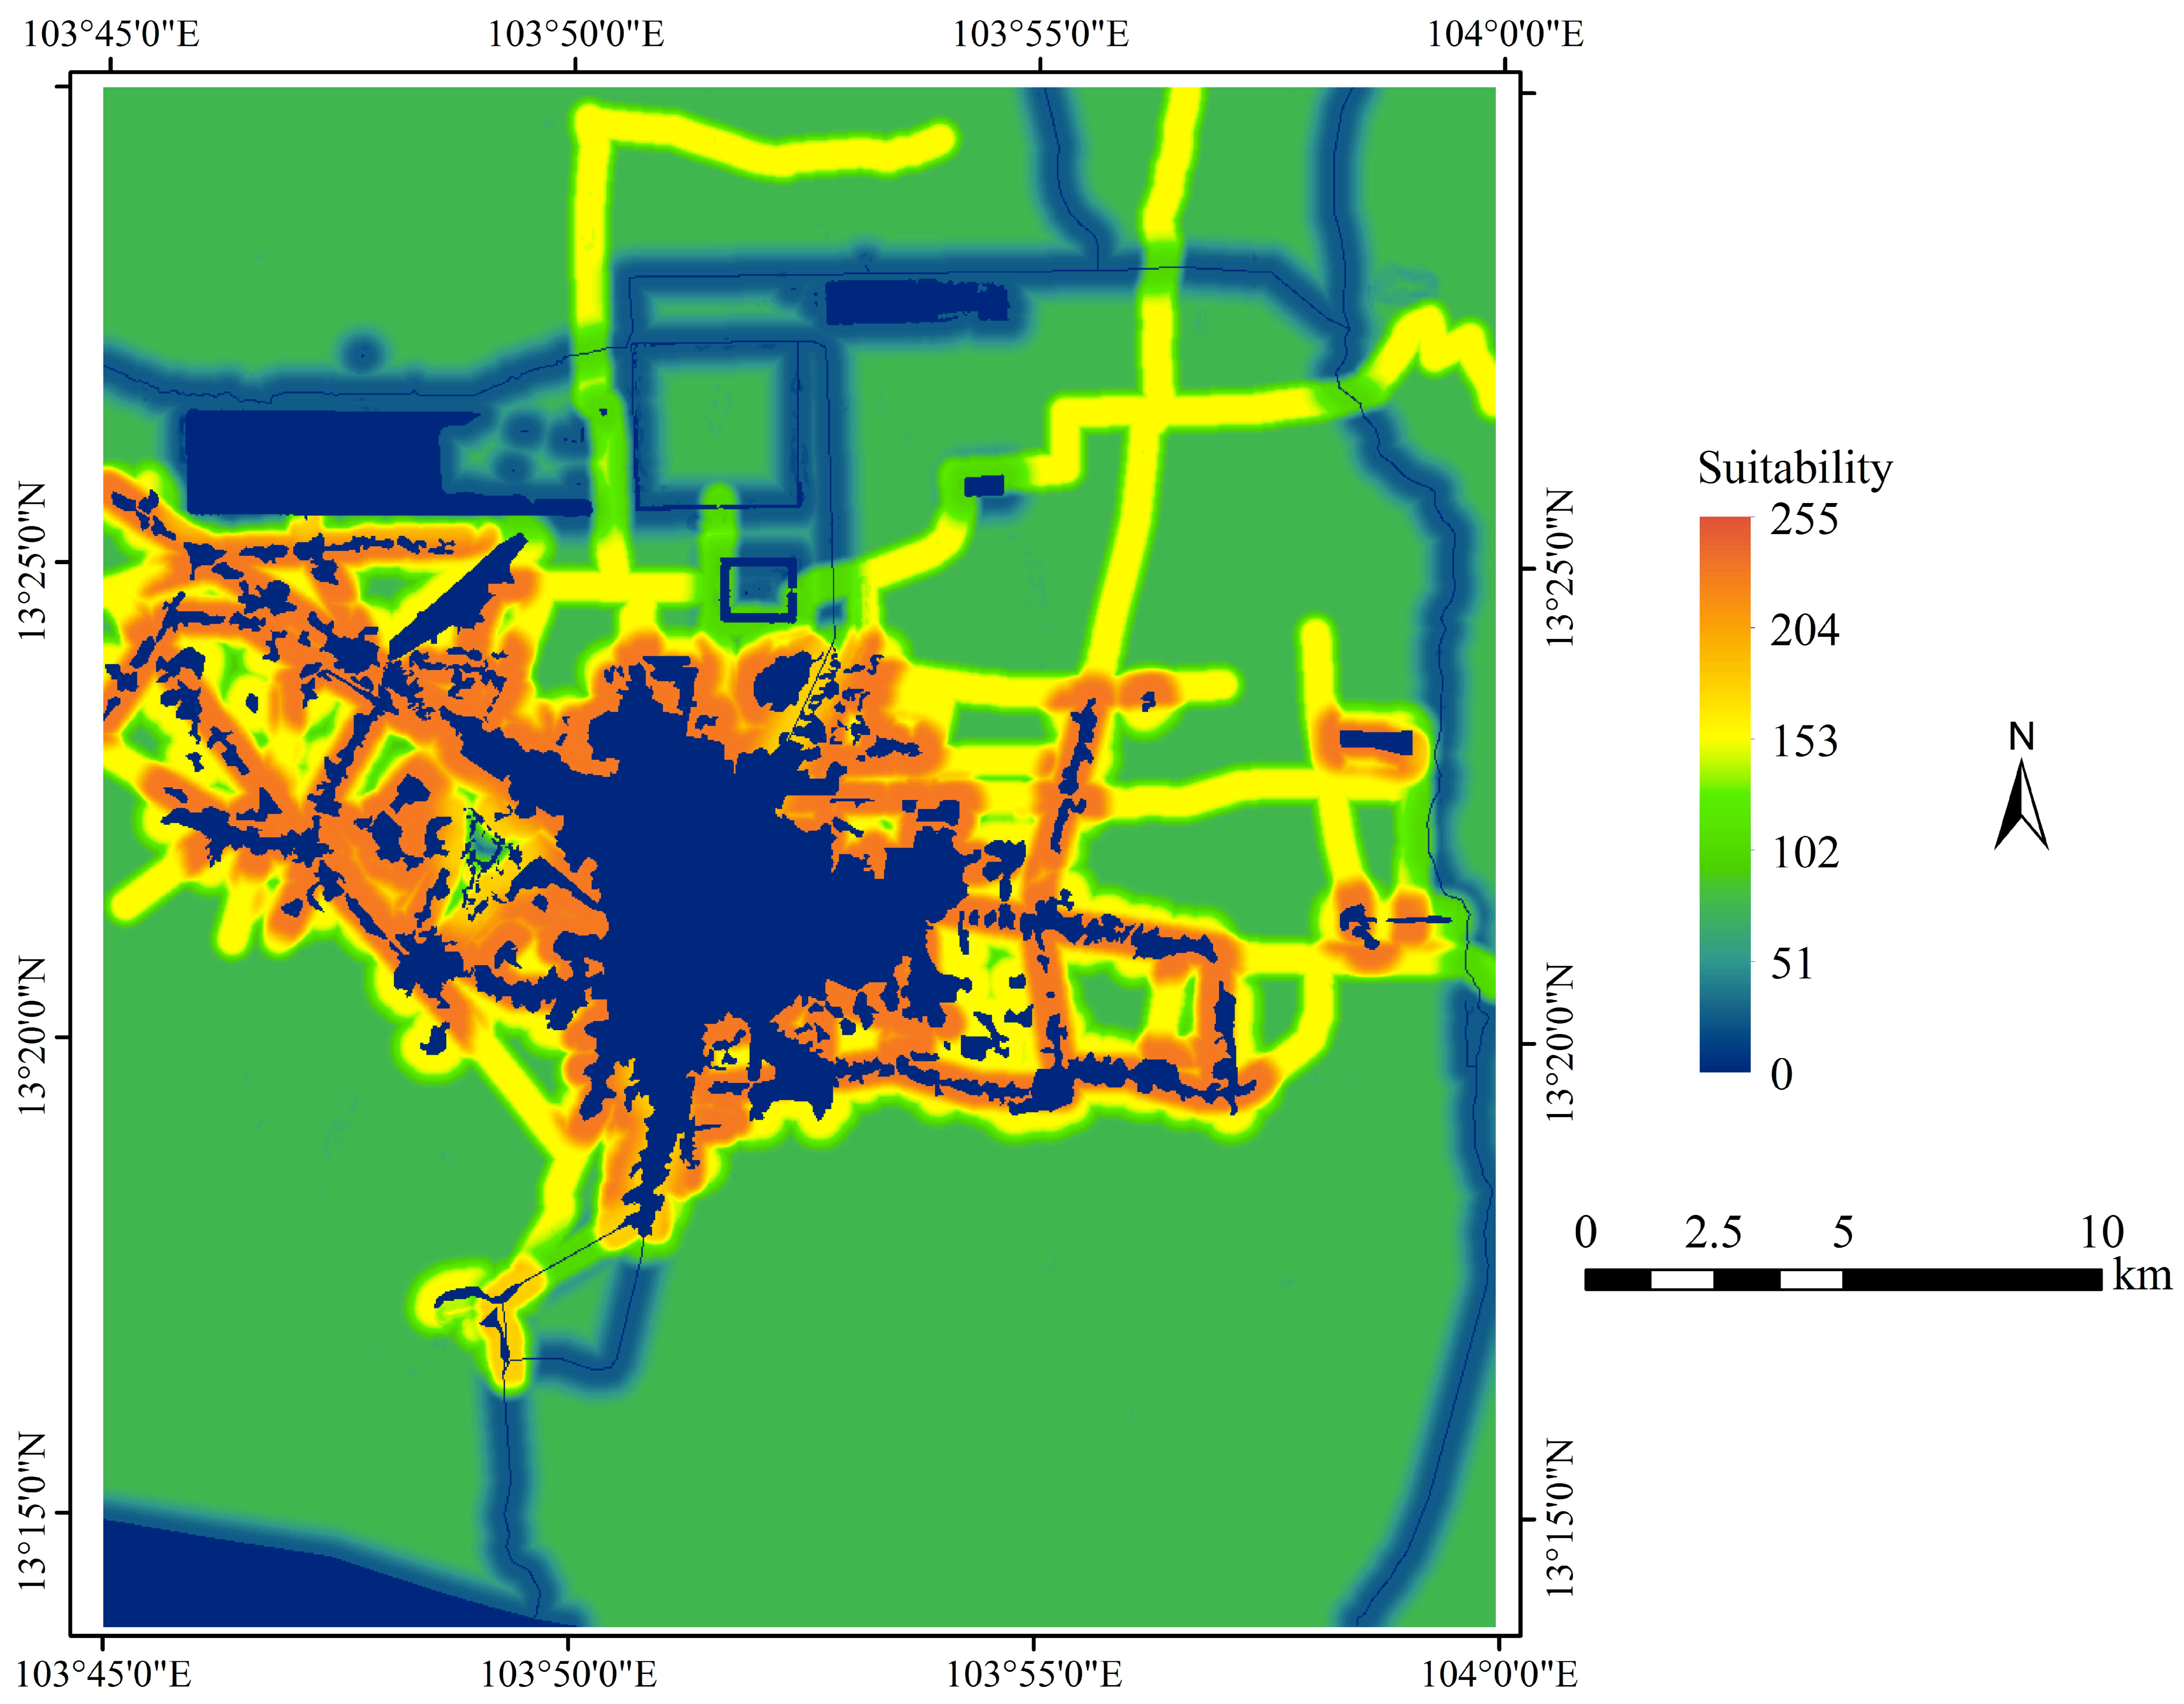
Therefore, based on the above principles, the study selected two constraint factors and five driving factors to develop a suitability map for predicting future urban expansion. The existing built-up areas and water bodies were classified as two constraint factors because they prohibit land construction.
Figure 3 shows the framework of urban expansion simulation. The five driving factors included the slope, the distance from the center of the existing built-up area, the distance to the built-up area, the distance to traffic lines, and the distance to rivers. The values for the two constraint factors were obtained from Open Street Map, and then verified and corrected based on high-resolution images. The data obtained from the study area was statistically verified to determine the range of influences of each individual driving factor on land development. The highest development suitability values were found to be decreasing outward at 300 m from the center of Siem Reap. There was no increase in land development beyond 1000 m [
44]. The development suitability was found to be optimal within a range of 200 m from the existing traffic lines, with the suitability gradually decreasing outward. No influence of traffic lines was observed beyond 500 m on development suitability [
45]. Likewise, the most suitable areas for development were located within a range of 250 m from the existing built-up area, with the suitability gradually decreasing outward. There was no impact on development suitability beyond 700 m from the built-up area [
46]. The development suitability for areas within a range of 100 m from rivers was low and gradually increased outward and remained unchanged outside 800 m [
47]. In the case of slopes, the development suitability of an area understandably decreases as the slope increases. Therefore, an area with a slope of less than 8% was considered the most suitable, 8%–15% was considered more suitable, 15%–25% was generally suitable, and a slope of more than 25% was not suitable [
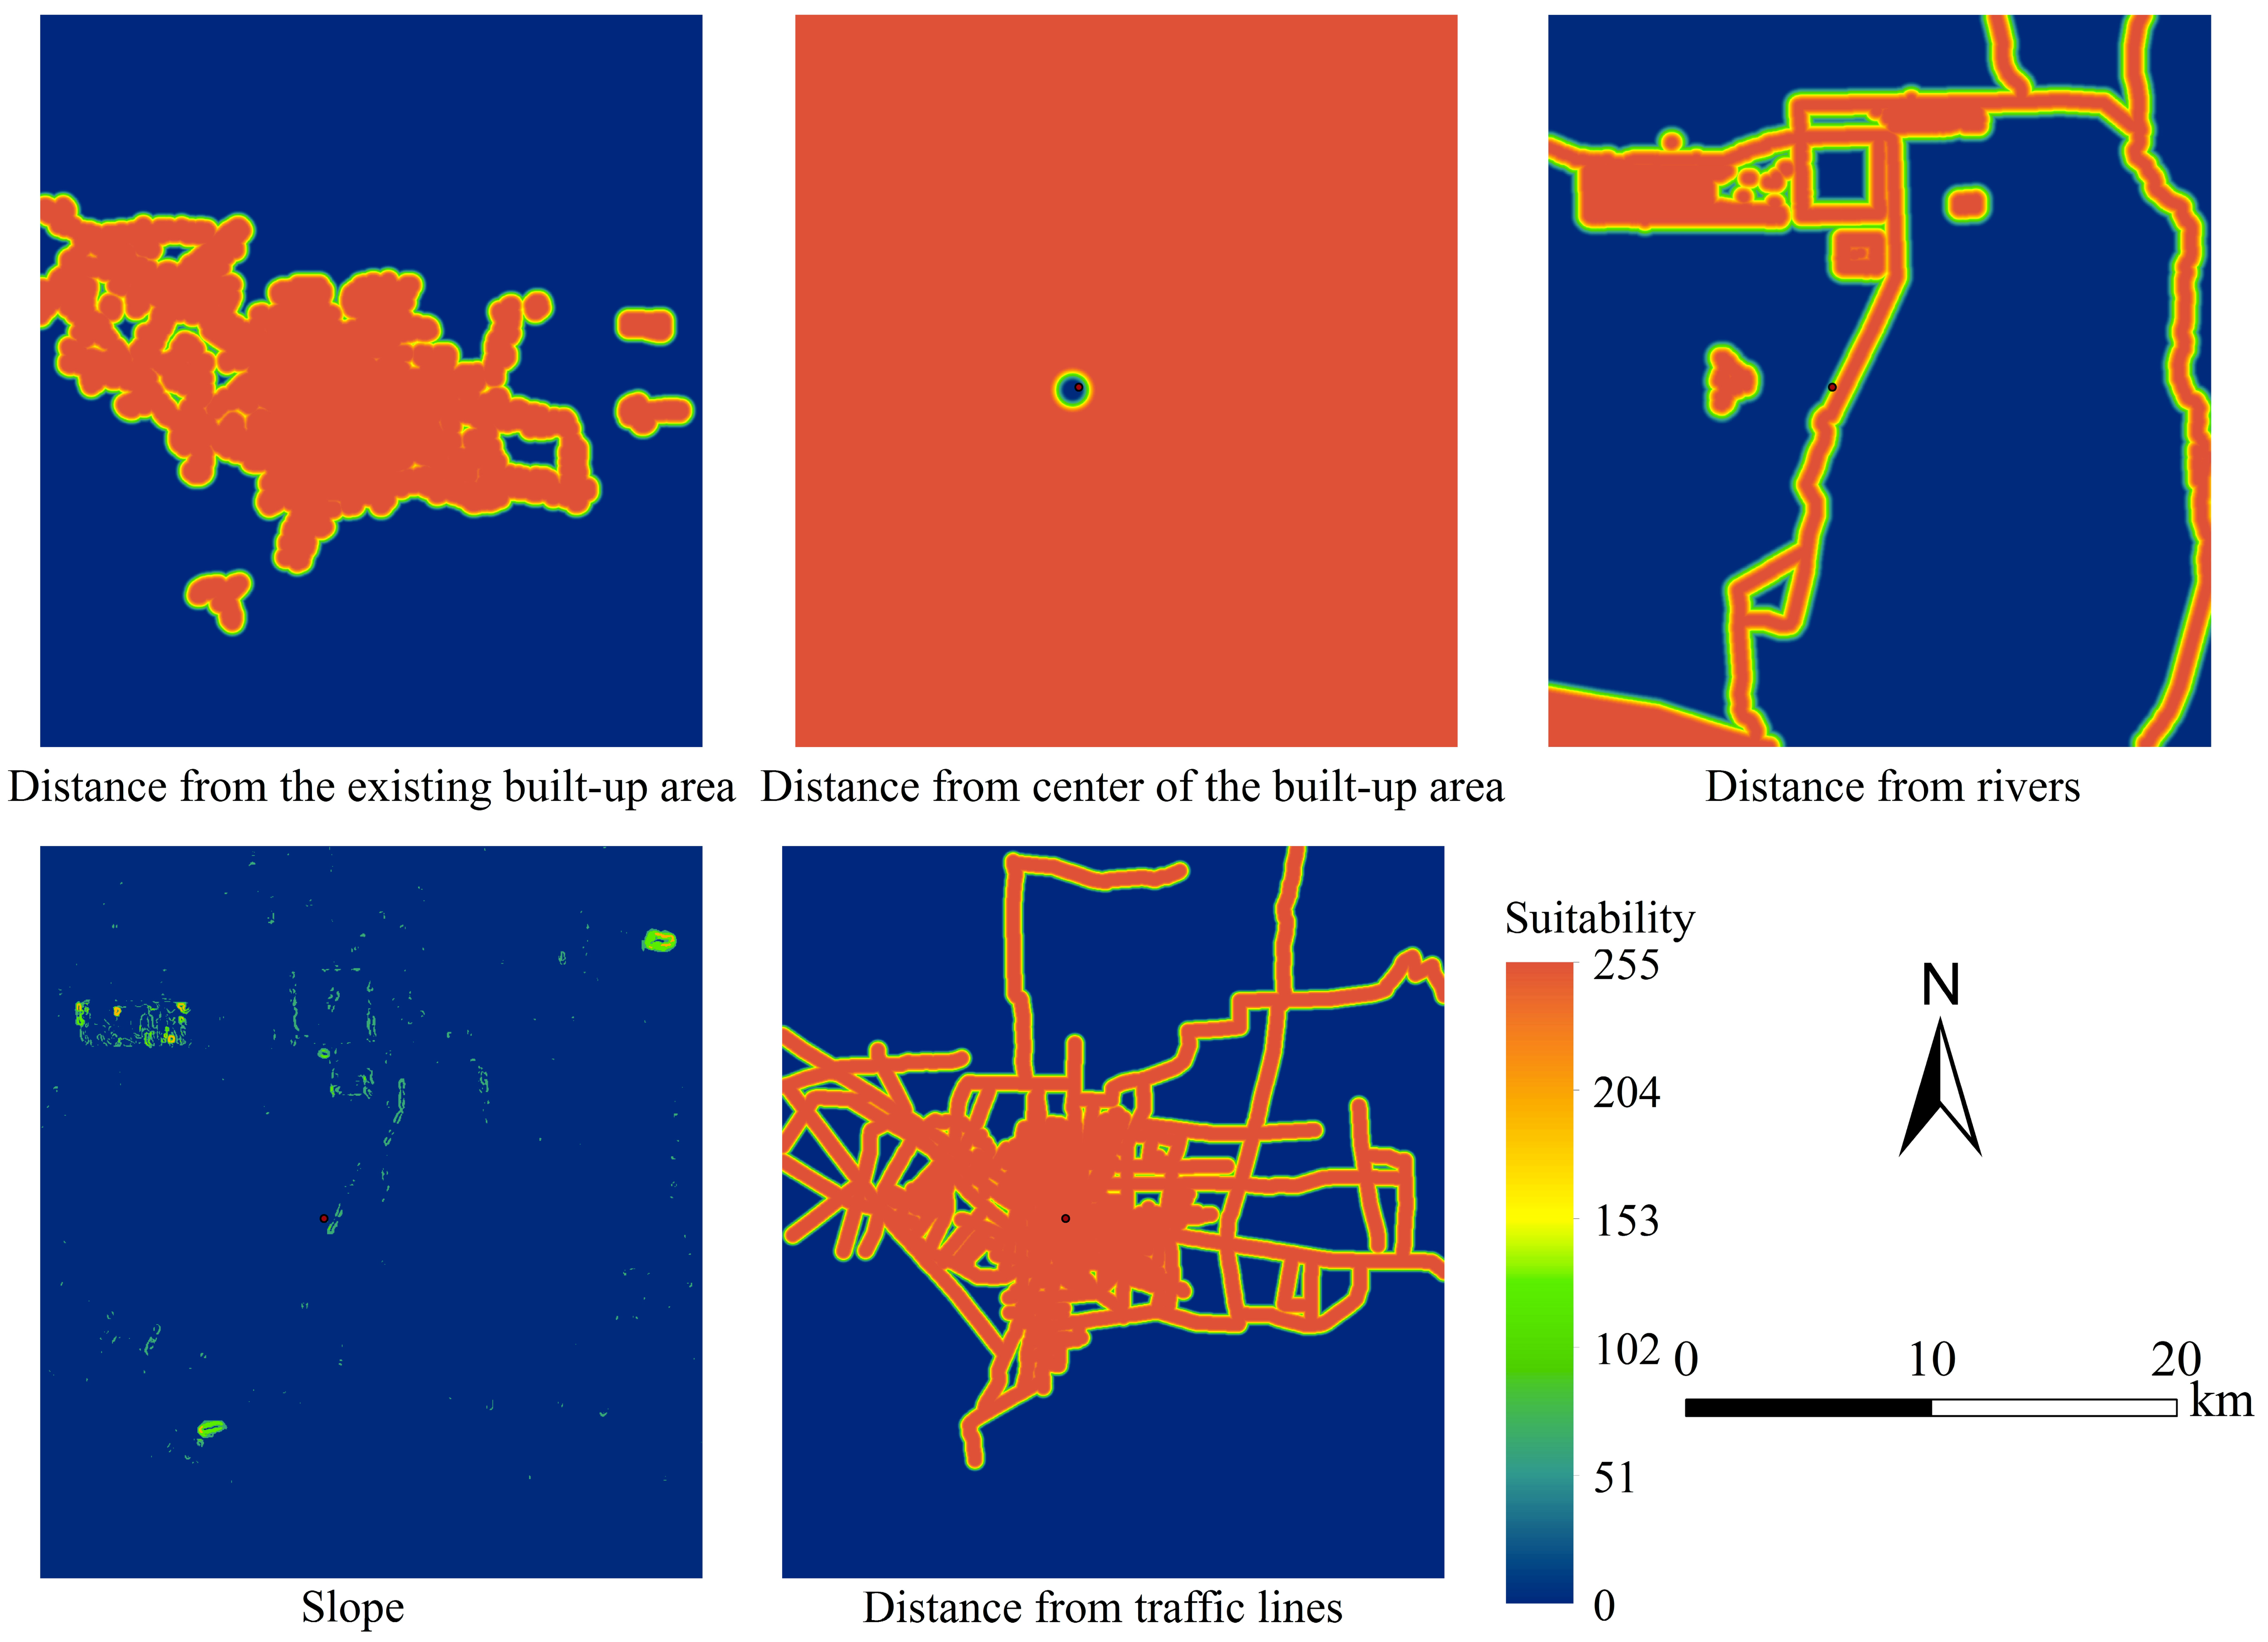
48]. The possibility of each pixel belonging to a fuzzy set was evaluated by the membership function of the fuzzy set. All factor layers were classified into different suitability grades according to the range of parameters.
Figure 4 shows the driving factors evaluated by the membership function of the fuzzy set.
The standardized constraint and driving factors were added to the multi-criteria evaluation (MCE) module. The weighted linear combination (WLC) method was selected to provide different weights of 0.3, 0.3, 0.2, 0.2, and 0.1 to binding factors. Using the collection editor tool, suitability layers were combined into a suitability map. The results are presented in
Figure 5.
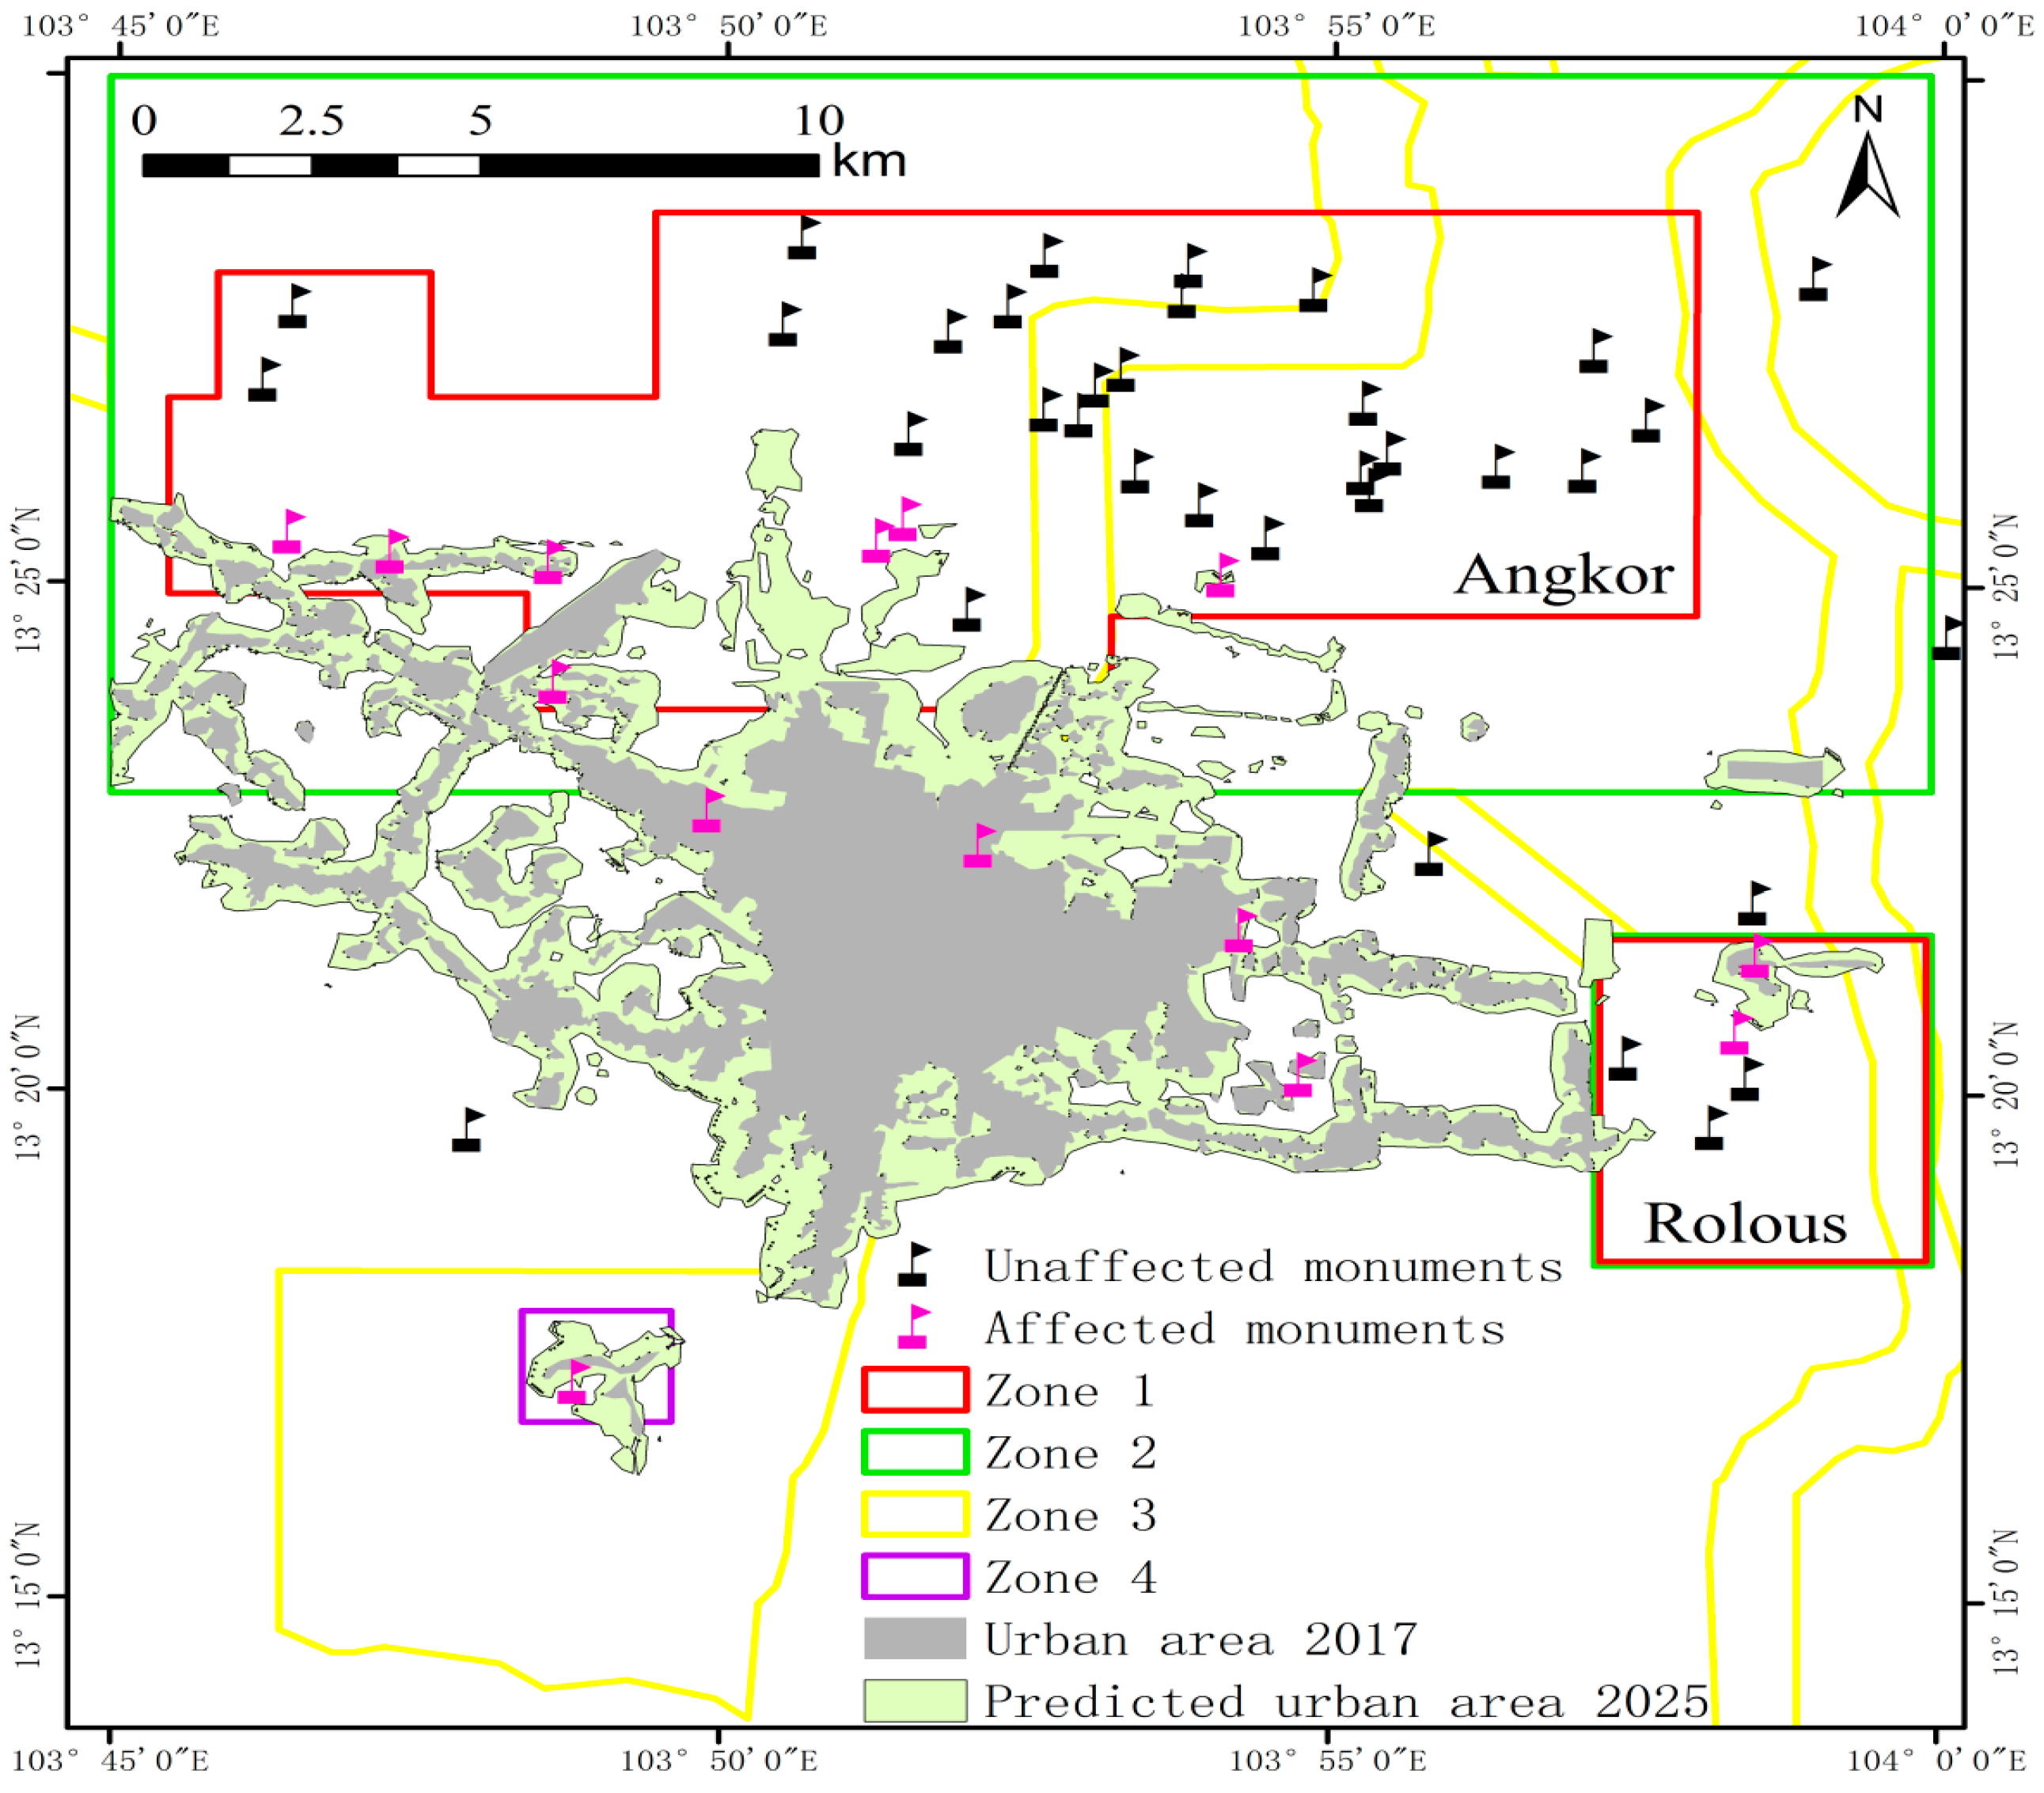
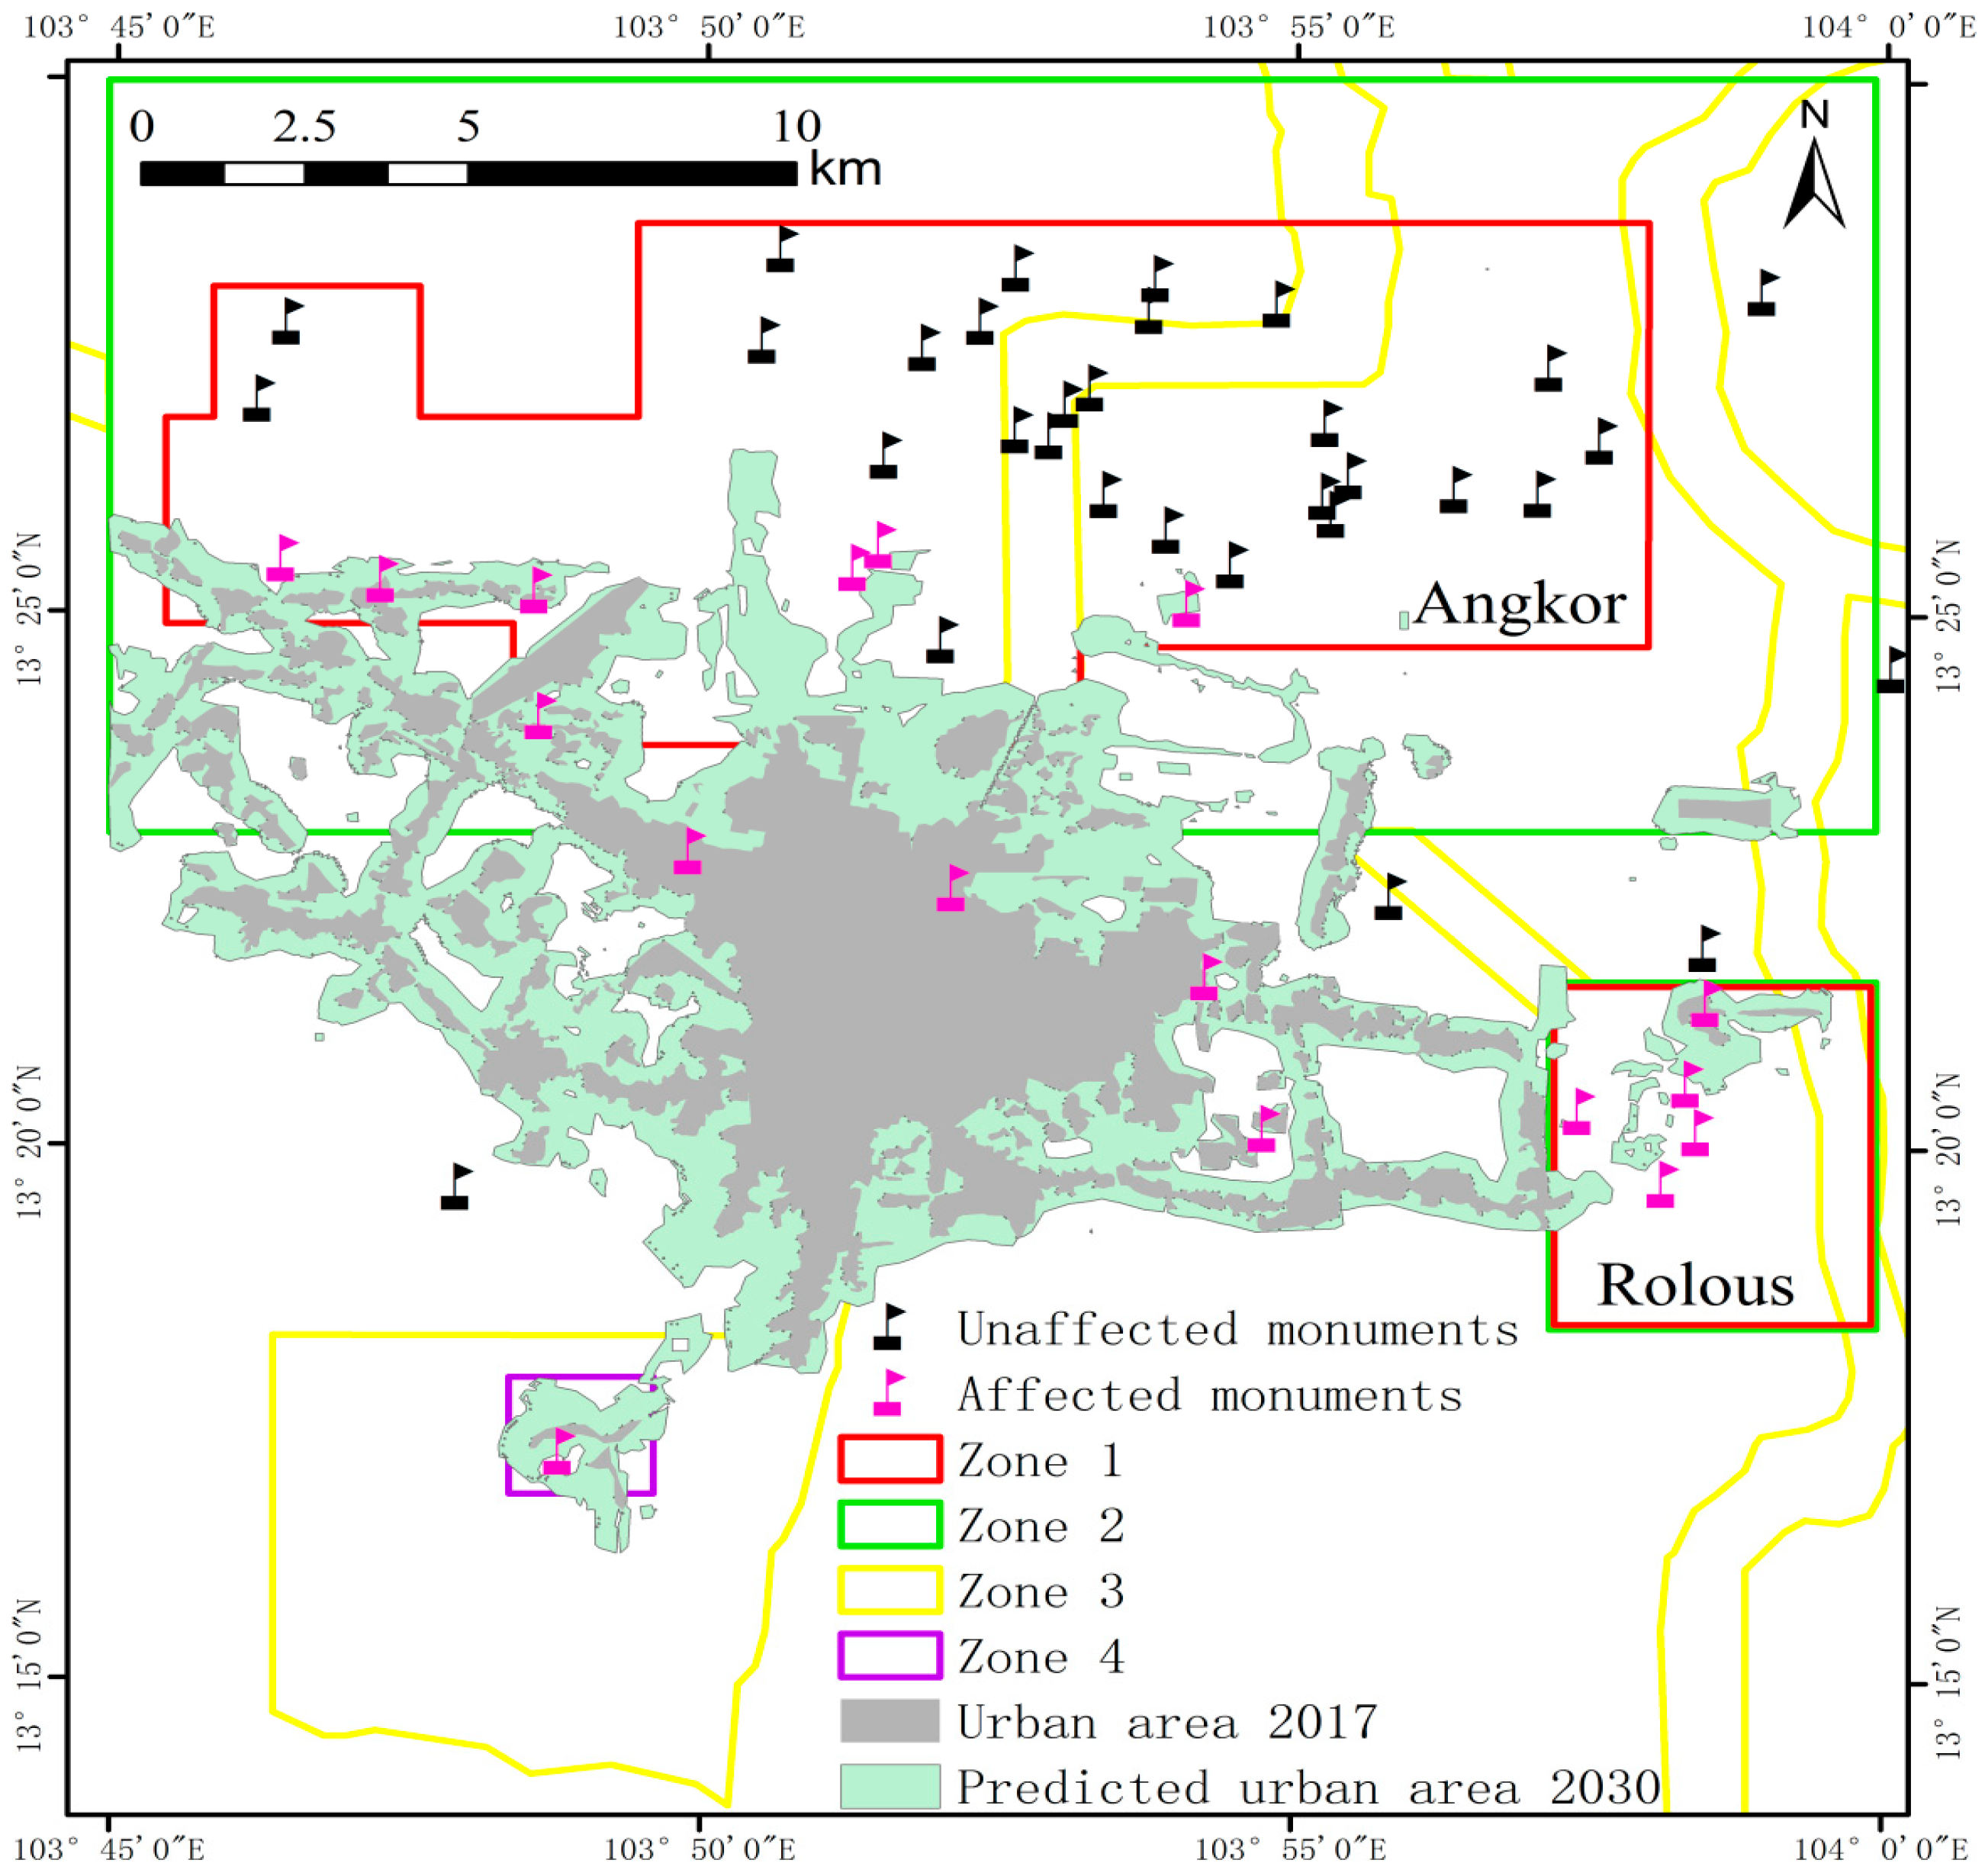
Markov operations were performed using the data from 2013 to 2017 to obtain the transition probability. For the CA-Markov analysis, the built-up area in 2017 was used as the base map, the transition probability layer was used as the Markov transition areas file, and the suitability map was used as the transition suitability image collection, while the number of cellular automata iterations were selected to be 8. The results from the CA-Markov analysis predicted the built-up areas in 2025 and 2030.
Model Validation
In order to validate the proposed approach, the kappa coefficient was employed to quantify the accuracy of the model by comparing the actual built-up areas with the simulated maps. First, the built-up areas were simulated using the proposed methodology for years 2010, 2013, and 2017, respectively. Then, the simulated results were compared with the actual maps.
Table 2 shows the comparisons between actual built-up areas and simulated built-up areas in 2010, 2013, and 2017. The kappa coefficients were 83%, 85%, and 87%, all of which were highly consistent. The standard accuracy of the models, which was not less than 80%, determined that they were potent predictive tools [
49,
50]. According to Landis and Koch [
51], this task verifies and approves the simulation process. Therefore, the approach can also be executed for future years (i.e., 2025, 2030).
The methodology for prediction used in this study has some limitations and is based on certain assumptions. This study assumed that politics would remain constant, and no new regulations would be passed till 2030; existing regulations would be enforced at the same level; the natural resources needed to support continued growth would be available (water, electricity, building materials), and tourism was expected to grow at a similar rate. These factors should be further considered in future studies in order to conduct a more in-depth analysis of the urban expansion in Siem Reap.
5. Discussion
The situation surrounding the Angkor world heritage site is a stark example of low-density urban sprawl. The growing numbers of tourists and development pressures threaten the conservation of Angkor. This paper quantified the expansion of built-up areas from 2004 to 2017, showing that urban expansion is not as prevalent in the northern core zone as in other directions in terms of area or intensity. This paper also explored the critical trends that are expected to manifest additional problems within the next few years due to urban development in Siem Reap.
The study analyzed the process of urbanization at primarily two scales, one at a broader scale to map and understand past changes in the Angkor region, the second at a more local scale to evaluate the threat to individual monuments. As hypothesized, the threat of urbanization to Angkor is increasing. The study had four objectives: first, to understand and record the changes in built-up areas over four time periods in Siem Reap city, and to understand the rate of the process; second, to record changes in the land use dynamics, in particular for areas being converted for urban land use; third, to map encroachments of built-up areas near the individual sites; and lastly, to estimate future urban expansion and estimate likely threats.
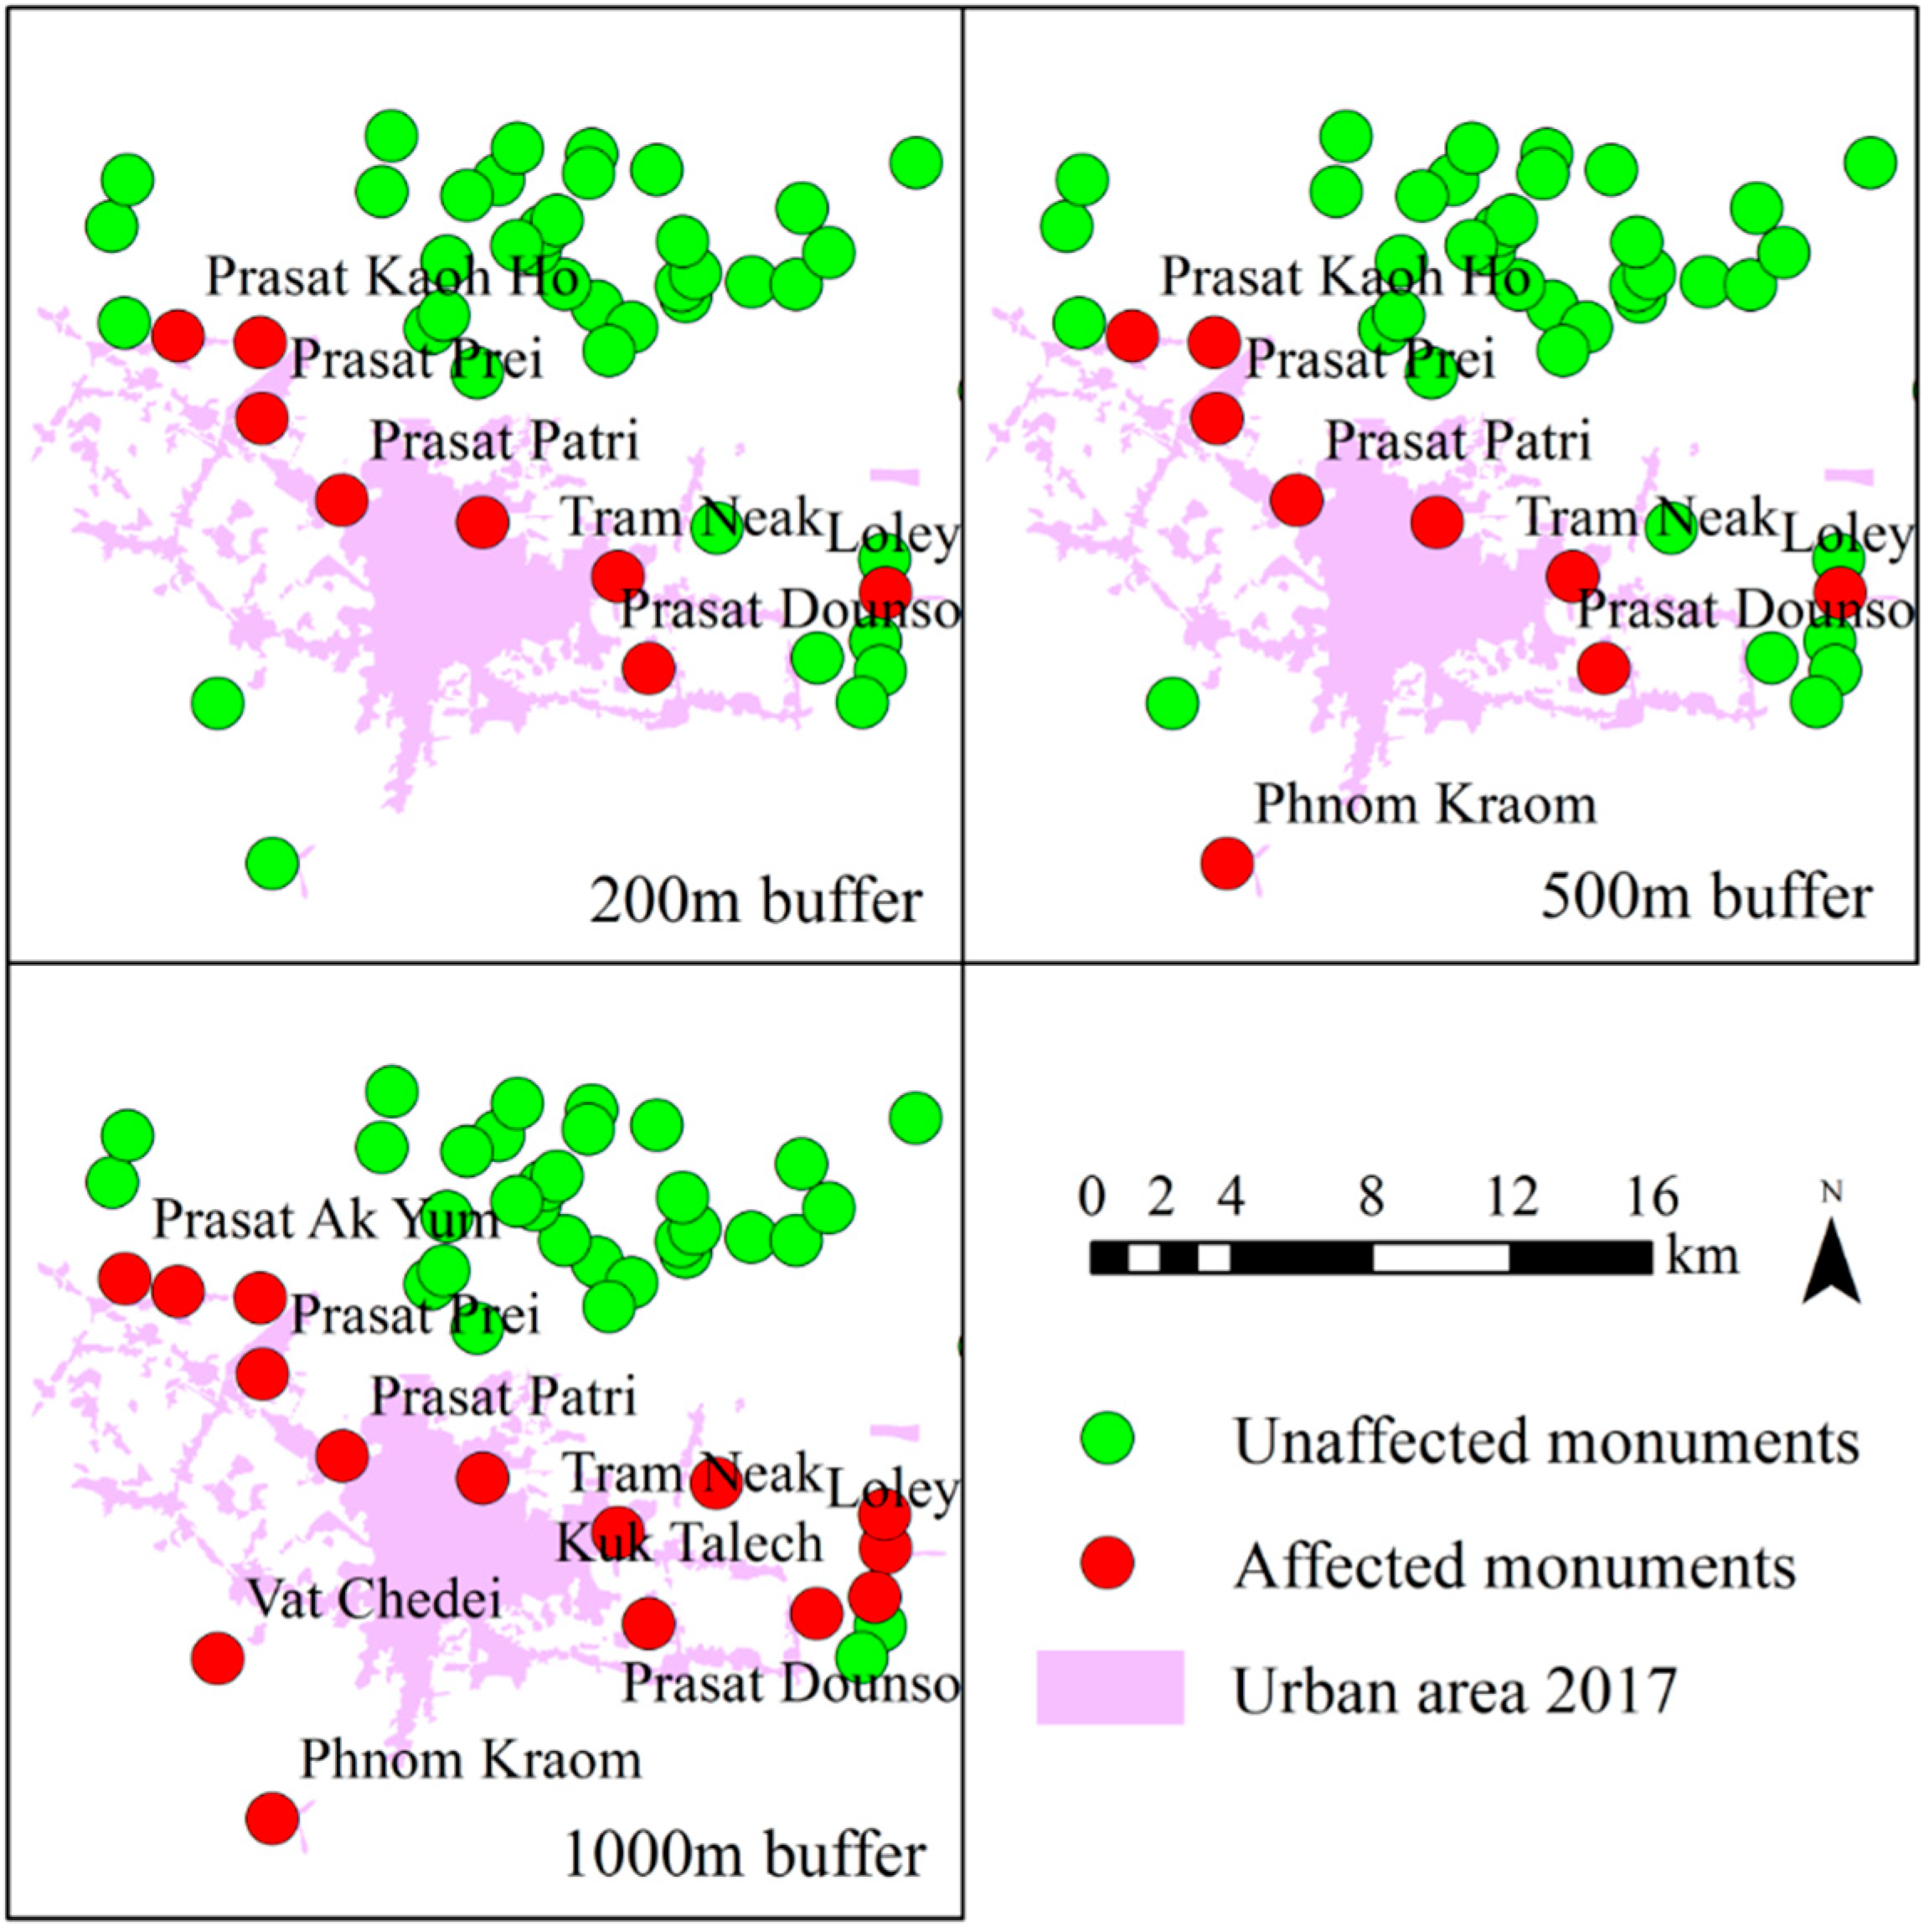
Regarding future changes in the Angkor region, the built-up areas are likely to expand in a linear fashion along major roadways, and are likely to cut right through the Angkor Archaeological Park. For 15 of the 48 monuments, the built-up area has been developed within 1000 m of the monuments which is concerning. Thus, the urban expansion pattern in Siem Reap is both linear and clustered. The urban expansion has profoundly impacted the sustainable development of Angkor and is expected to do so. It is understood that tourism is the main driver of this physical expansion. The fact that the need for tourism currently outweighs considerations for sustainable management to conserve the Angkor world heritage site makes solutions complicated.
However, the government has introduced a series of legal measures to prohibit and restrict development and construction in planned protected areas [
52], including the 1994 Zoning and Environmental Management Plan (ZEMP), the 2007 Angkor Management Plan, and the 2012 Tourism Management Plan. Various challenges complicate the process of conservation and sustainable development of Angkor [
53,
54].
The rate of urbanization has been shown to be gradually increasing. Importantly, our study reveals that urbanization has come at the cost of agricultural land, forests, and grasslands. Predominantly cultivable land has been converted, suggesting changes in the economics and population dynamics of the local region. To understand the underlying factors triggering this change from an agrarian community to an urban, an in-depth socio-economic analysis is required. However, what can be observed from our results at the broader scale is that the agricultural sector in the region and consequently employment is likely shifting to urban and tourism services.
Urban expansion thus has affected heritage sites at multiple levels, posing a challenge to Angkor’s zoning management. The increasing populations in communities, regions, and countries require specific infrastructure and resources to sustain, and this, consequently, changes the natural and built environments. Therefore, this paper argues that the successful design and implementation of protection zones is crucial to protect heritage sites from future urban growth and environmental pressures.
Maintaining the long-term integrity of Angkor poses a challenge to managers, who must strike a balance between development and preservation. It seems that this balance can often be achieved through the implementation of local land use regulations. Therefore, it is strongly recommended that ZEMP be empowered and applied in land use planning to constrain the future urban expansion of Siem Reap and to strengthen the planning and protection of the Angkor world heritage site. Protective actions need to be seriously considered. For example: Increase the size of the designated protective areas; monitor human-induced changes on the built and natural environments at regular intervals; increase local and international awareness for the protection and conservation of Angkor; and ensure compatible and sustainable development. Tourism planning and management should be an integral aspect of the site management system [
55]. If this planning vacuum persists, there is a risk that future development may proceed without any coordination and might even cause serious damage to Angkor.
6. Conclusions
Gillespie (2012) conducted an in-depth analysis of the protected zones at the Angkor world heritage site, and concluded that the protection zone design was expected to result in a burden on local management due to the lack of research and reflection [
56]. The results of this paper describe future challenges to the sites, thus providing key information crucial to protecting them from future urban growth and environmental pressures, towards a well-researched design and implementation of a protection zone management plan. The study builds a case for science-based policy and decision support.
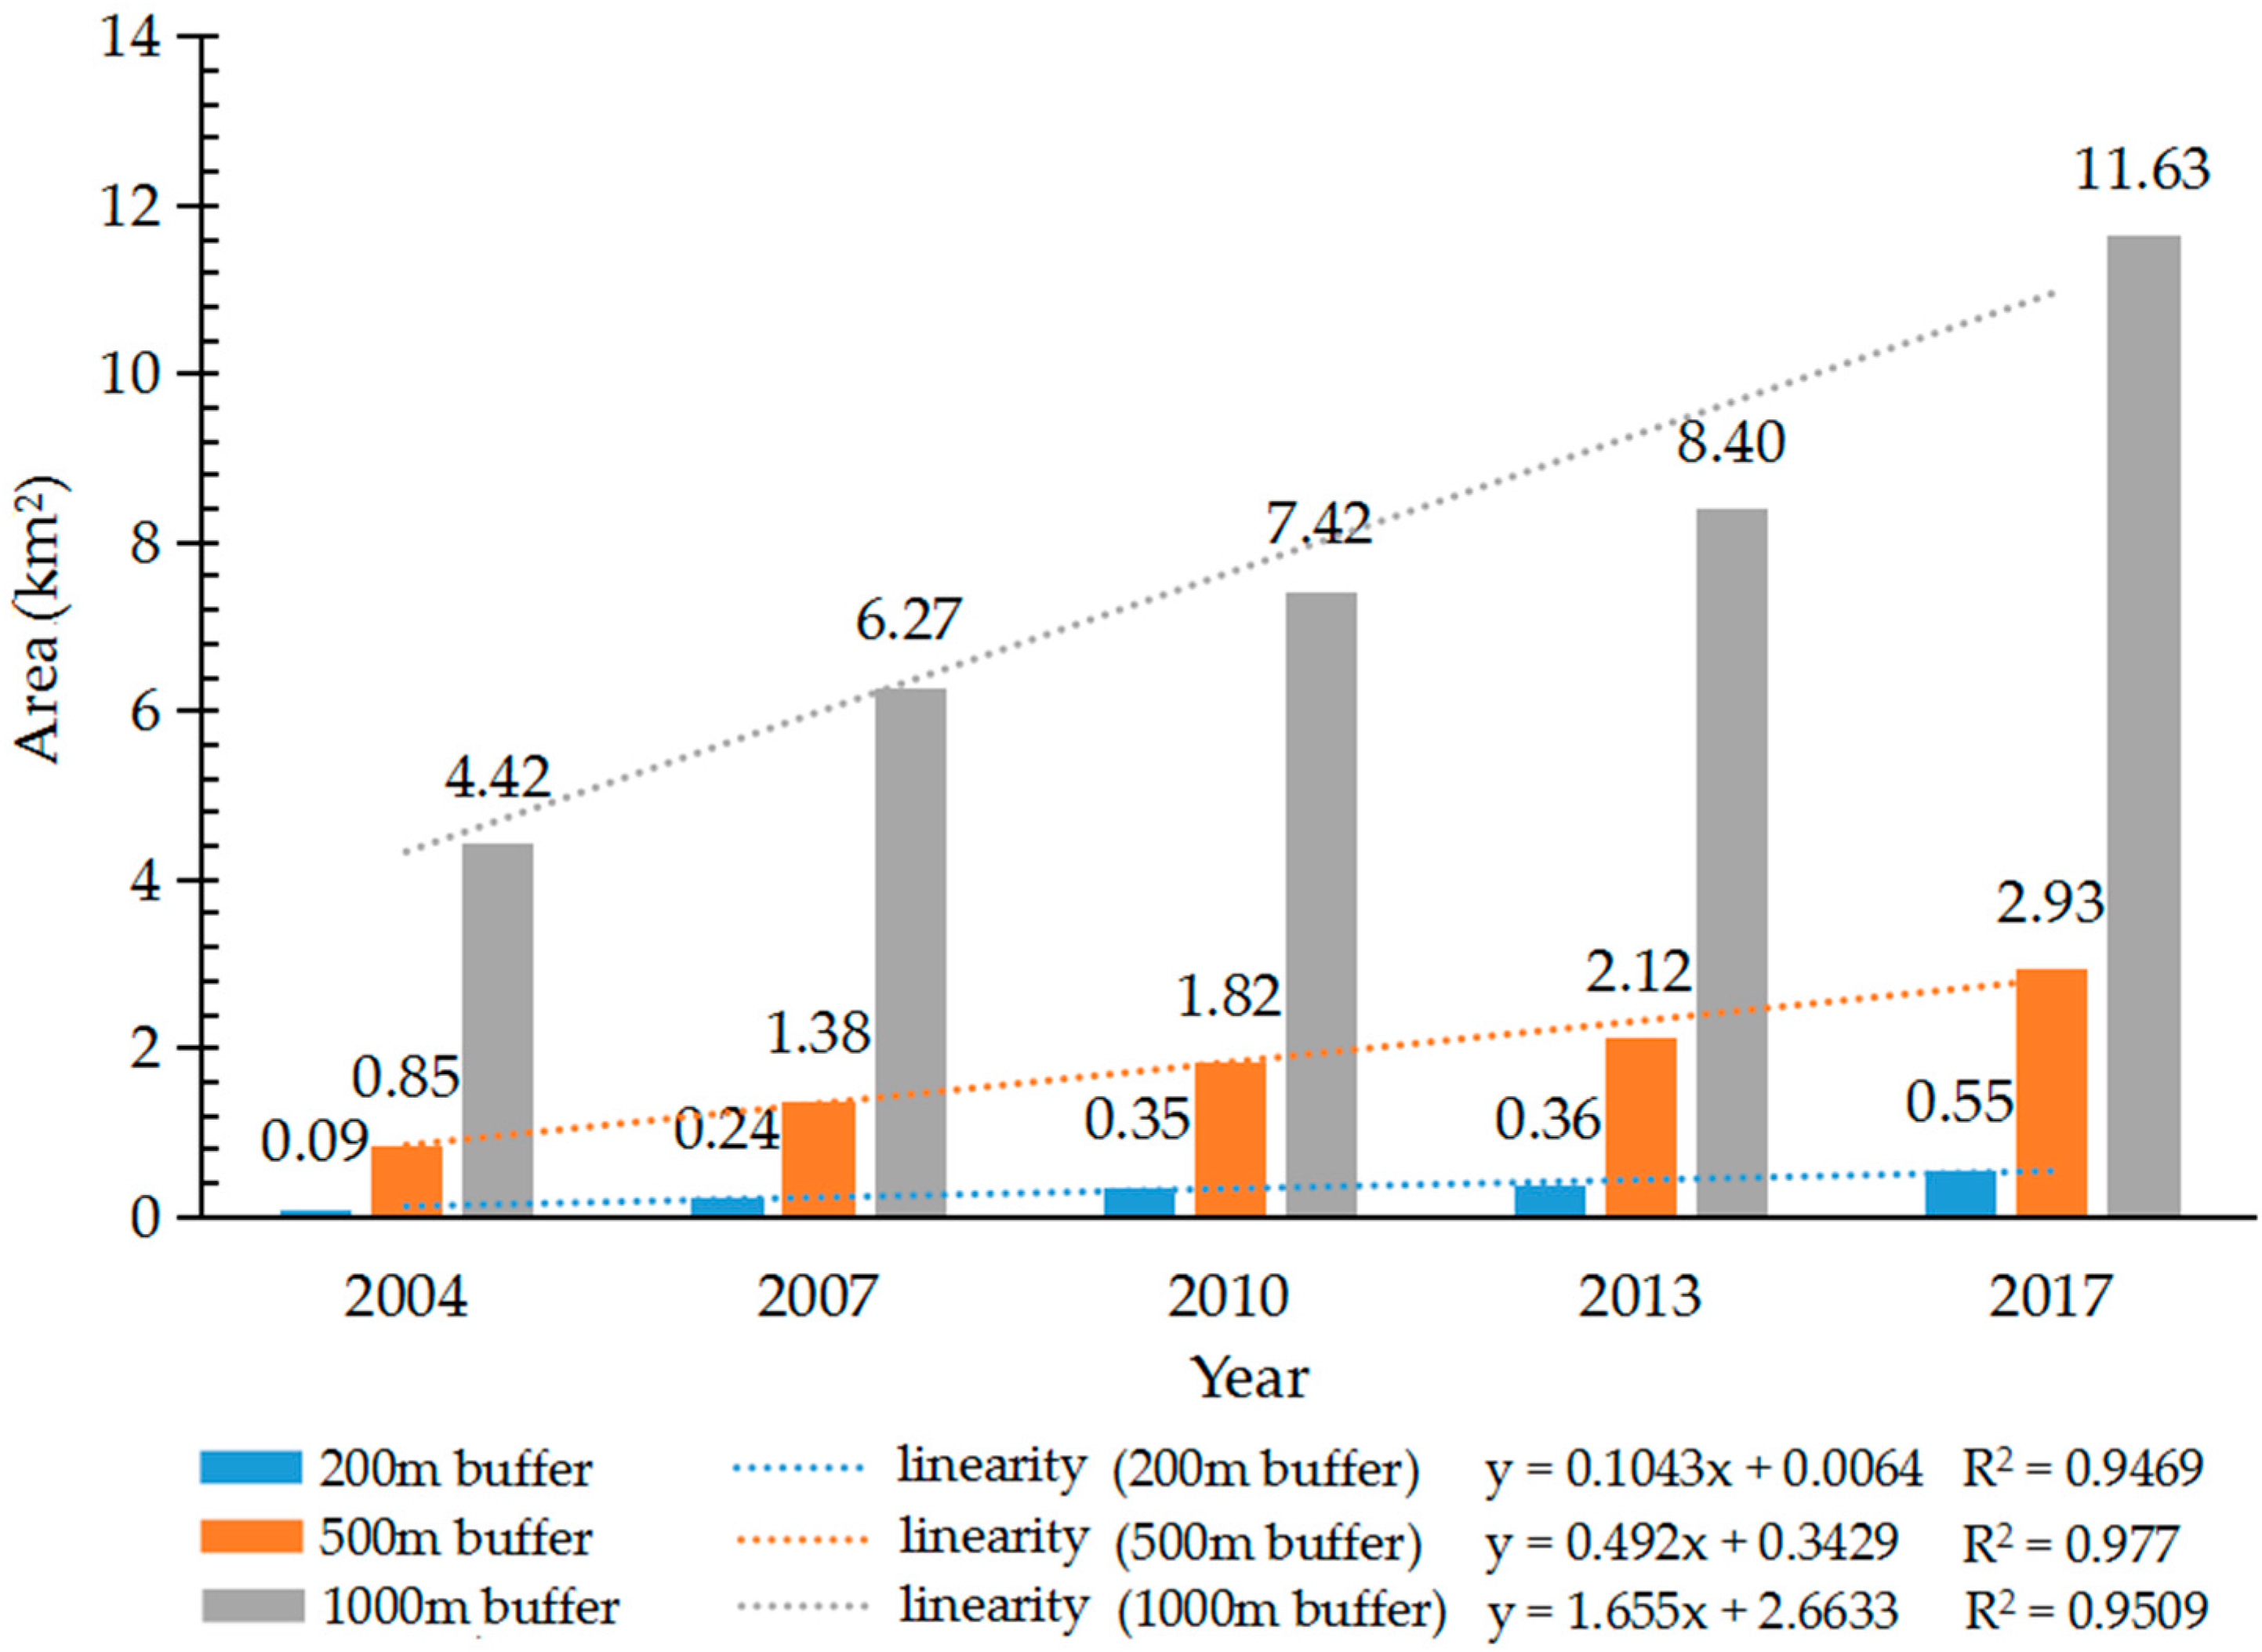
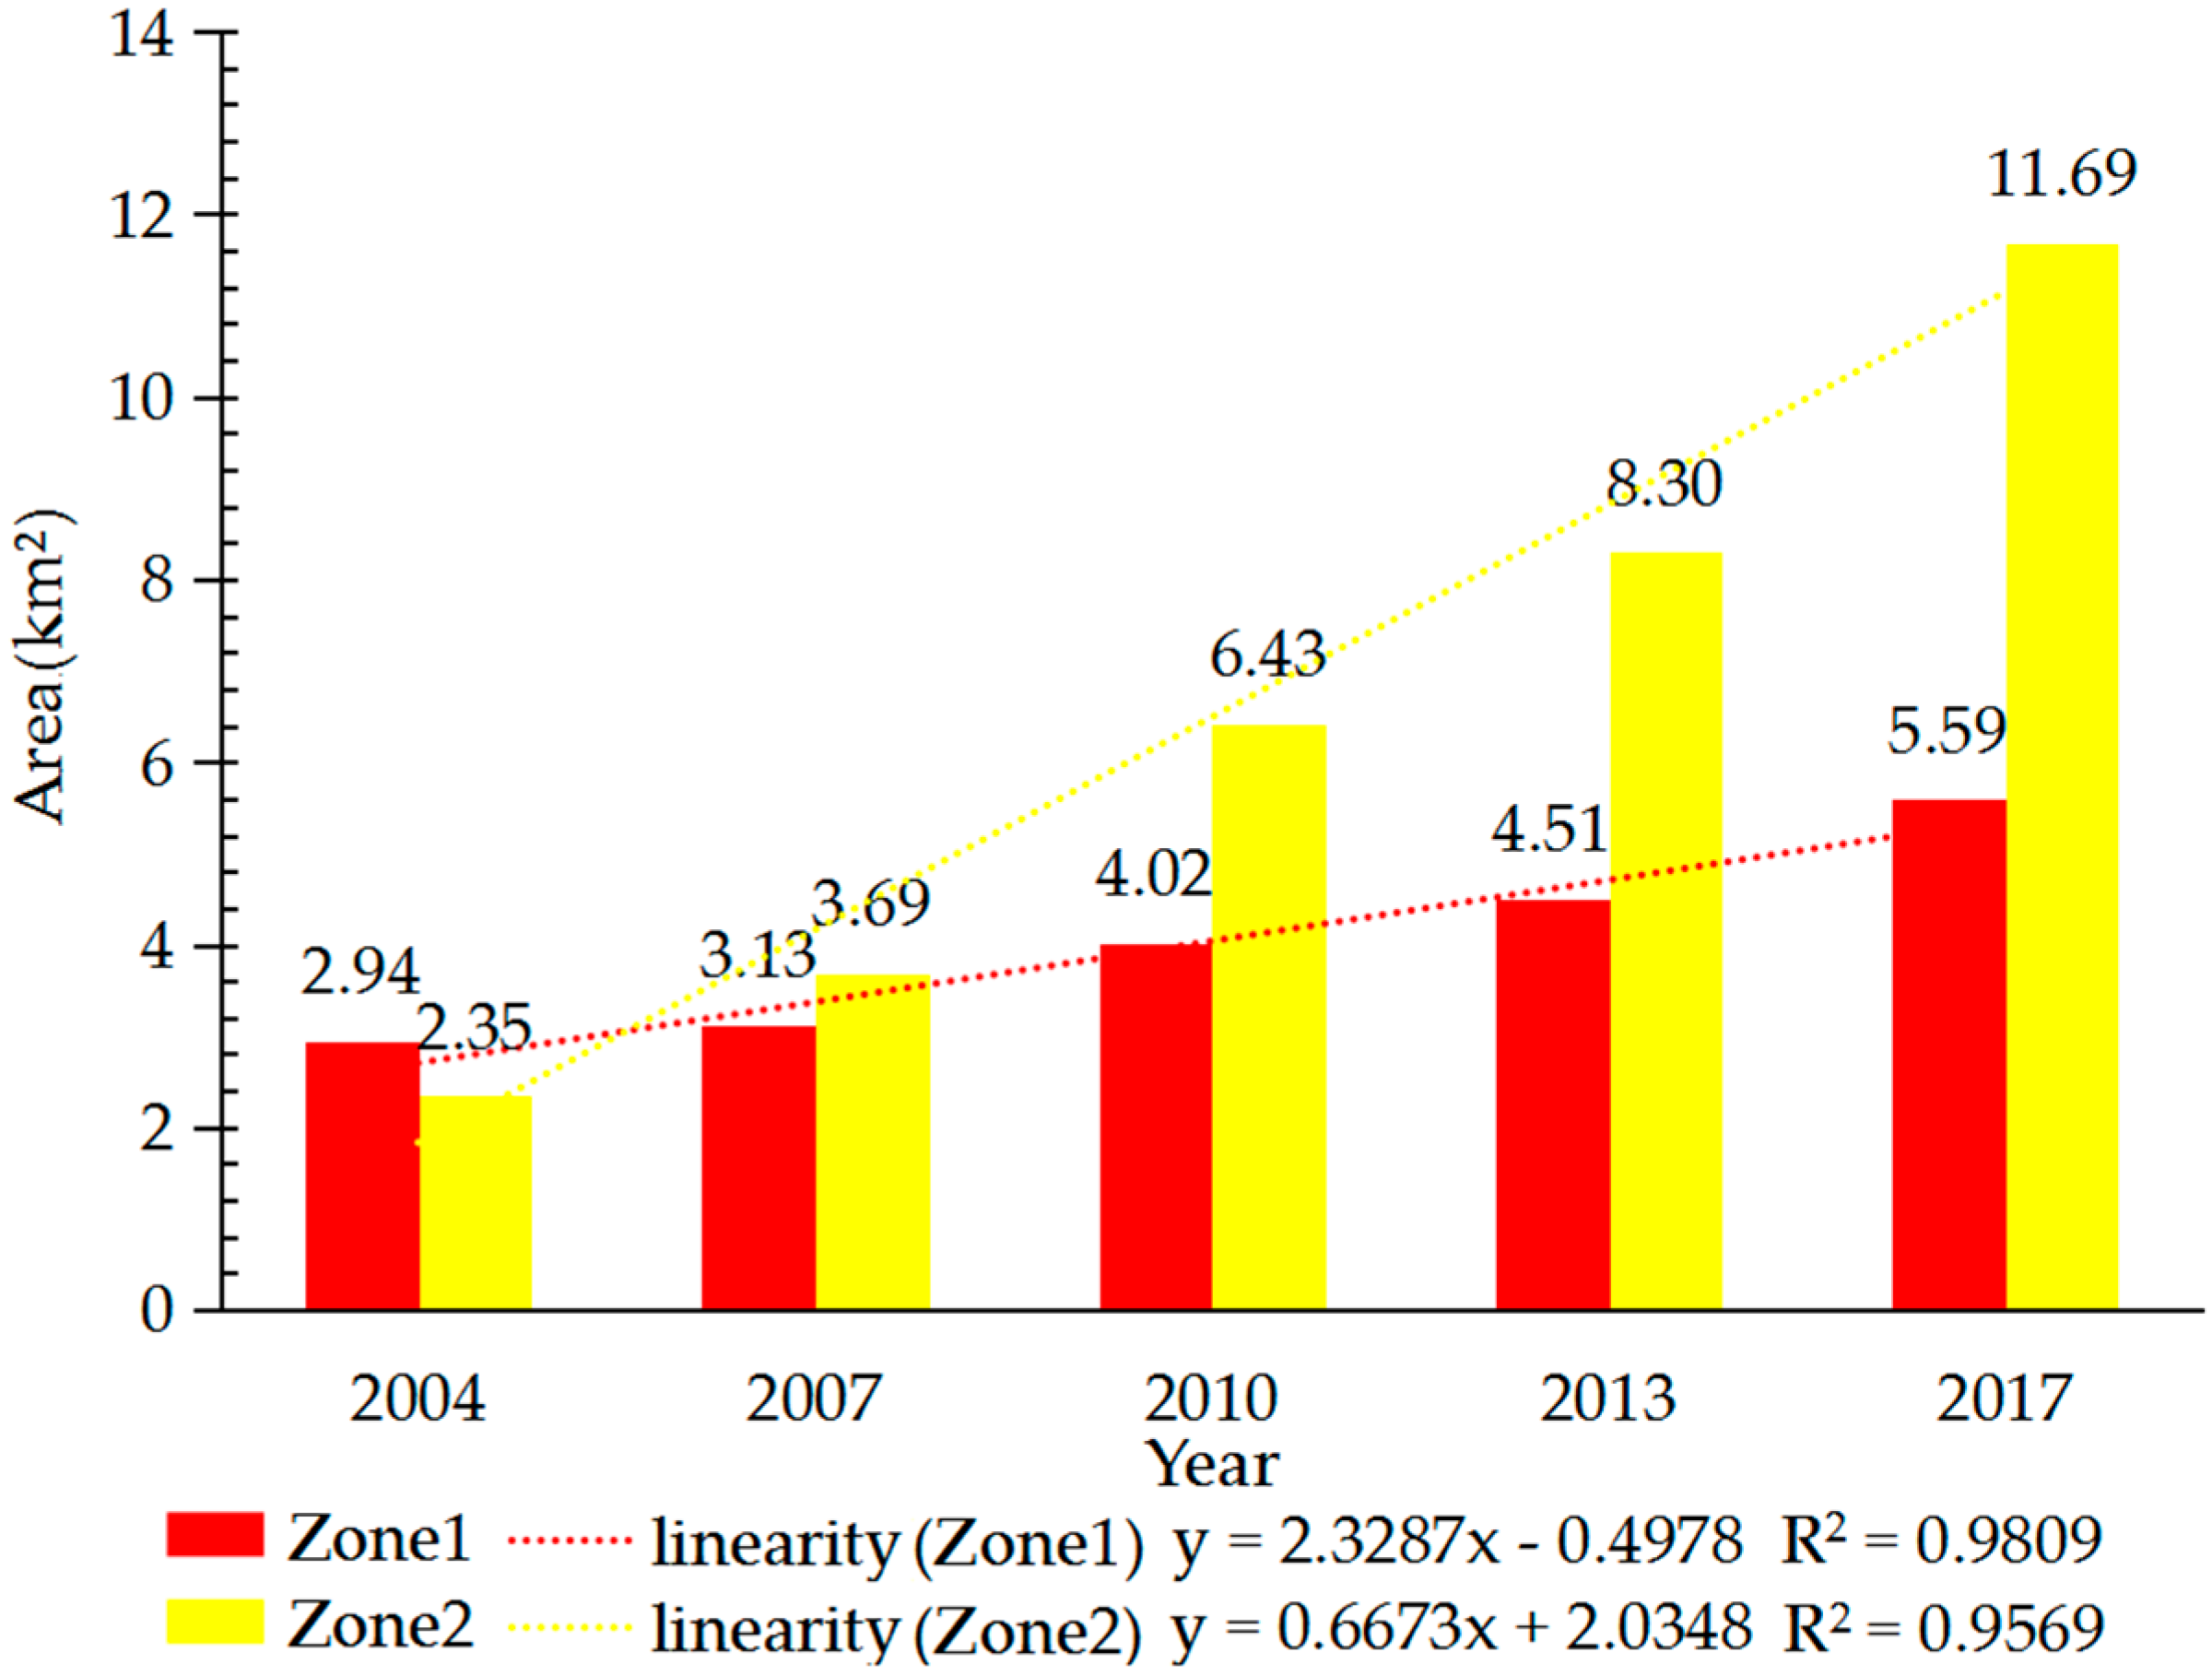
The study monitored and simulated urban expansion in the Angkor region. The results revealed that the urban area in Siem Reap increased from 28.23 km2 in 2004 to 73.56 km2 in 2017, a 160% increase. Urban growth was represented by a traffic-oriented pattern of urban sprawl. Siem Reap was revealed to be a typical city with tourism-driven urban expansion. Its urban expansion was highly consistent with the tourist population, but the change of the former lagged behind the latter. Urban expansion had the result of transforming arable land, forests, and grassland into urban residential land. Urban expansion was found to be present in the buffer zone at a radial distance of 500 m from heritage sites, and increased linearly from 0.85 km2 in 2004 to 2.93 km2 in 2017. The constructed land area in the core and buffer zones increased by 12.99 km2 between 2004 and 2017, and the land area in the buffer zone increased by 9.34 km2, accounting for 72% of the total increase. The residential construction-oriented urban expansion in the buffer zone mainly resulted in an increase in the amount of constructed land in the protected area. The forecast for urban expansion suggests that the built-up area in Siem Reap is expected to reach 135.09 km2 by 2025 and 159.14 km2 by 2030. The number of sites directly affected by urban expansion is expected to continue to increase. The core and buffer zones are still useful methods for protecting heritage sites, but they are also threatened by development-induced damage.
These scientific findings of past, present, and future land-use scenarios in the Angkor region assist planners and decision-makers in formulating sustainable development and environmental protection plans. Using an integrated approach combining remote sensing and GIS to quantify the environmental forces acting on world heritage sites gives site managers the ability to calibrate conservation principles and procedures with actual urban dynamics.
Based on these findings, it is clear that Angkor faces a challenge in providing a stable regulatory and sustainable development framework that can balance the inevitable tension between conservation of a much-valued heritage landscape with pressures to develop and accommodate an ever-expanding populace. The policy for managing urban development and protection of Angkor should be further improved. This paper provides insights for other heritage sites with similar challenges in developing countries.


