Article

Contrasting Performance of the Remotely-Derived GPP Products over Different Climate Zones across China

1
Chongqing Jinfo Mountain Field Scientific Observation and Research Station for Kaster Ecosystem, School of Geographical Sciences, Southwest University, Chongqing 400715, China
2
State Cultivation Base of Eco-agriculture for Southwest Mountainous Land, Southwest University, Chongqing 400715, China
3
China Aero Geophysical Survey and Remote Sensing Center for Land and Resources, Beijing 10083, China
*
Author to whom correspondence should be addressed.
Remote Sens. 2019, 11(16), 1855; https://doi.org/10.3390/rs11161855
Submission received: 10 July 2019 / Revised: 3 August 2019 / Accepted: 8 August 2019 / Published: 9 August 2019

Abstract

:
Precise quantification of terrestrial gross primary production (GPP) has been recognized as one of the most important components in understanding the carbon balance between the biosphere and the atmosphere. In recent years, although many large-scale GPP estimates from satellite data and ecosystem models have been generated, few attempts have been made to compare the different GPP products at national scales, particularly for various climate zones. In this study, two of the most widely-used GPP datasets were systematically compared over the eight climate zones across China’s terrestrial ecosystems from 2001 to 2015, which included the moderate resolution imaging spectroradiometer (MODIS) GPP and the breathing Earth system simulator (BESS) GPP products. Additionally, the coarse (0.05o) GPP estimates from the vegetation photosynthesis model (VPM) at the same time scale were used for auxiliary analysis with the two products. Both MODIS and BESS products exhibited a decreasing trend from the southeast region to the northwest inland. The largest GPP was found in the tropical humid region with 5.49 g C m−2 d−1 and 5.07 g C m−2 d−1 for MODIS and BESS, respectively, while the lowest GPP was distributed in the warm temperate arid region, midtemperate semiarid region and plateau zone. Meanwhile, the work confirmed that all these GPP products showed apparent seasonality with the peaks in the summertime. However, large differences were found in the interannual variations across the three GPP products over different climate regions. Generally, the BESS GPP agreed better than the MODIS GPP when compared to the seasonal and interannual variations of VPM GPP. Furthermore, the spatial correlation analysis between terrestrial GPP and the climatic factors, including temperature and precipitation, indicated that natural rainfall dominated the variability in GPP of Northern China, such as the midtemperate semiarid region, while temperature was a key controlling factor in the Southern China and the Tibet Plateau area.

Graphical Abstract

1. Introduction

Gross primary production (GPP) refers to the total amount of organic carbon fixed by terrestrial ecosystems through photosynthesis by green plants [1]. It directly reflects the productivity of vegetation under specific environmental conditions and characterizes the growth characteristics and health status of terrestrial ecosystems [2]. As it is the largest and most important component of global carbon cycles, accurately evaluating the spatiotemporal dynamics of terrestrial GPP has significant implications for rational use of land resources, increase of carbon sinks, and adaptive strategy to climate change [3,4,5,6]. The common methods for estimating GPP mainly encompass the continuous observations using the eddy covariance-based flux towers and satellite-based estimates with ecosystem models [7]. However, in situ measurements are usually constrained by scale and cost, leading to a spatially sparse distribution until now. Satellite remote sensing can obtain large-scale land surface data reflecting the vegetation-related and environmental variables quickly and cheaply [8]. In order to simulate the productivity over regional and global scales, several GPP models using the remote sensing data have been developed in past decades [9,10,11,12,13]. Subsequently, by means of these algorithms, the global GPP products were produced over a long period. Nevertheless, different products have large biases in performance due to the structures of models and the uncertainties in various input parameters.
The moderate resolution imaging spectroradiometer (MODIS) GPP data have been produced continuously across the globe since 2000 and also experienced ongoing improvements in recent years [14,15,16,17]. Currently, many studies on GPP in China are conducted with the earlier MODIS collection 5 (C5) vegetation products [18,19]. However, the improved MODIS collection 6 (C6) GPP has been openly shared since the end of 2015, with the biome property look up tables (BPLUT) updated and the meteorological data of daily Global Modeling and Assimilation Office (GMAO) [20,21]. More importantly, MODIS C6 contains significant revisions of the calibration approach to account for sensor aging [22]. Hence, it is urgent to examine the performance of the newly-released C6 products with 500 m resolution. Since the algorithm of MODIS GPP products was mainly restricted by the uncertainties from various upstream inputs, the products have always been controversial [23,24,25]. Aiming at the complexity of MODIS algorithms, Jiang and Ryu provided an alternative set of global GPP products using a simplified process-based model, the breathing Earth system simulator (BESS), for 8-day composite 1-km resolution [26]. The model is coupled with canopy photosynthesis, atmosphere and canopy radiative transfers, energy balance, and transpiration [27]. BESS GPP products were deemed reliable when compared against the MODIS C5.5 products, the coarse spatial resolution (0.5°) products from Max Planck Institute of Biochemistry, and the FLUXNET datasets at site scale (113 sites in total). Thus, the process-based BESS can serve as an independent set to complement the official MODIS GPP products. In addition, Zhang et al. [25] developed a global moderate resolution dataset of vegetation GPP for 2000–2016 using the vegetation photosynthesis model (VPM), which was based on the improved light use efficiency (LUE) theory [28,29]. This product showed satisfactory performance across the wide range of biome types with regards to site-level validations [30,31,32]. Actually, all these GPP datasets have experienced amounts of validation using the FLUXNET sites in recent years. However, intercomparison among these new global GPP products particularly between BESS and VPM over various climate zones remained scarce.
As the largest developing country in the world, China has emitted a lot of CO2 accompanying its fast economic development since the reform and opening up in the 1980s [33,34,35]. The increase in atmospheric greenhouse gases could cause severe consequences on the climate system [36], which will threaten the structures, function, and stability of natural ecosystems, altering the ecosystem services provided to society [37]. Meanwhile, forecasts indicate that China will experience increasing atmospheric temperature, a rising frequency of extreme weather events, thus enhancing spatiotemporal heterogeneity in rainfall and enlarging drylands in the future [38,39]. To cope well with the impacts of climate change, it is necessary to determine the responses of terrestrial GPP to environmental controls. In addition, China has an enormous land area that occupies approximately 10% of the world, with abundant vegetation resources having a large carbon sequestration potential distributed across a wide variety of climate regions. However, the performances of different models or products of GPP vary widely in various climate zones [17,25,26]. Essentially, the differences in diverse remote sensing-based GPP products can be ascribed to that the different algorithms, using different input data, and having different parameter values when explaining the environmental mechanisms over climate zones.
Therefore, this study aimed to: (1) compare the spatial differences of MODIS and BESS GPP products over the eight typical climate zones in China over the past 15 years; (2) evaluate the performance of MODIS and BESS GPP in describing seasonal variations, with the VPM GPP as auxiliary data; and (3) reveal the long-term trends of interannual GPP across different climate zones, as well as the determining climate factors.

2. Materials and Methods

2.1. Description of the Study Area

The climate types in China vary from tropical to cold temperate with latitude and from humid to dry with longitude (Figure 1). Many vegetation types of the world can be found in China due to diverse climates bringing about high biodiversity [40]. Vegetation types are spatially dominated by the local climate characteristics [41]. The grassland ecosystems are mainly distributed in the arid and semiarid regions of Northwestern China due to relatively scarce precipitation, whereas deciduous forest and evergreen forest are mainly planted in the cold northern and warm southern regions of China, respectively. Generally, dense vegetation types cover the areas with ample precipitation and heat resources [42,43]. Thus, the species composition and vegetation distribution are especially sensitive to global climate change. In this study, a total of eight climatic zones across China were divided, including (I) cold temperate humid region, (II) midtemperate humid region, (III) midtemperate semiarid region, (VI) warm temperate arid region, (V) warm temperate subhumid region, (VI) plateau zone, (VII) subtropical humid region, and (VIII) tropical humid region [44]. These climate zones can represent the main climate characteristics in China, and the remotely-derived GPP products of terrestrial ecosystems were evaluated over these contrasting climate regions. The details about three GPP datasets including MODIS, BESS and VPM are listed in Table 1.

2.2. MODIS GPP Product

The MODIS instruments on the satellites Terra and Aqua provide periodic observations of global air, vegetation, and soil-related information [45]. MOD17A2 is a global-scale, long-term series of terrestrial GPP with different time scales from weekly, monthly to yearly [46]. Version 6 is the latest generation of the MOD17A2 GPP product, which is based on the radiation-use efficiency model. It can be potentially used as input to ecosystem models for calculating terrestrial energy and carbon and water cycles [17]. The newly-released data are produced using the 8-day LAI/FPAR composite (500 m), and the native resolution is increased to 500 m in comparison with previous versions. In order to match the spatial resolution of the BESS GPP data, the spatial resolution of MODIS GPP is resampled to 1 km. This study used MOD17A2H (C6) from 2001 to 2015, which is available from the website https://e4ftl01.cr.usgs.gov/MOLT/MOD17A2H.006/. A total of 13,110 scenes of MODIS GPP images were obtained for analysis in this study. The detailed algorithm of MOD17A2 was proposed by Monteith [47] in 1972. The equation is as follows:
GPP = ε × APAR
ε = ε m a x × TMIN scalar × VPD scalar
APAR = (SWRad × 0.45) × FPAR
where ε is the estimated LUE and ε m a x is the assumed maximum LUE, mainly affected by the vegetation type; TMINscalar is the temperature stress factor, VPDscalar is the water stress factor, APAR is the photosynthetically active radiation absorbed by the vegetation, and SWRad is the short-wave solar radiation received at the surface; FPAR is the fraction of photosynthetically active radiation absorbed by green vegetation, which uses the MODIS FPAR product (MCD15A2H.006).

2.3. BESS GPP Product

The input data of the BESS GPP algorithm use three ancillary datasets, four reanalysis datasets, seven MODIS atmosphere (Collection 6) and land (Collection 5) products, and four additional satellite datasets [26]. A global continuous GPP product at high spatiotemporal (8-day, 1 km) resolutions is generated by a process-based satellite-driven method, instead of those widely-used machine-learning and semi-empirical models. The core algorithm comprises an atmospheric radiative transfer model, a forest light environmental simulator, and a two-leaf canopy radiative transfer model [27]. Meanwhile, a two-leaf longwave radiative transfer model jointly with a carbon-water-coupled module distinguishing C3 and C4 vegetation by employing Farquhar’s photosynthesis model [9,48], the quadratic Penman–Monteith [49,50] and energy balance equations, and a stomatal conductance equation are applied to calculate GPP and ET for sunlit and shaded canopy through an iterative procedure. BESS GPP had a detailed description in the paper of Jiang and Ryu [26]. The work extracted BESS products from 2001 to 2015 in comparison with MODIS GPP over different climate zones in China. In this study, the BESS GPP from 2001 to 2015 over the different climatic zones in China was freely extracted from http://environment.snu.ac.kr/bess_flux/.

2.4. VPM GPP Product

The VPM GPP product (V20) is based on an improved light-use efficiency model driven by remote sensing data and climate data from National Centers for Environmental Prediction (NCEP) Reanalysis II [25]. Two main input data sets, including the enhanced vegetation index (EVI) [51] and land surface water index (LSWI) [52], in the VPM model are derived from the MOD09A1 (C6) land surface reflectance data with a resolution of 500 m on an 8-day time scale. Additionally, poor quality data were identified, gaps were filled, and the data were smoothed using the best index slope extraction algorithm, linear interpolation, and the Savitzky–Golay filter. Furthermore, it considered the C3/C4 difference in plant photosynthesis pathways [28], which solved several critical problems in the previous GPP products. In this study, the VPM GPP products between 2001 and 2015 were used as auxiliary data with a temporal resolution of 8-day and spatial resolution of 0.05° × 0.05°. These data were downloaded from the website https://doi.org/10.6084/m9.figshare.c.3789814. The algorithm can be simplified as follows [53]:
GPP = ε × FPAR chl × PAR
ε = ε m a x × T s c a l a r × W s c a l a r
FPAR chl = ( EVI 0.1 ) × 1.25
W s c a l a r = 1 + L S W I 1 + L S W I m a x
T s c a l a r = ( T T m a x ) × ( T T m i n ) ( T T m a x ) × ( T T m i n ) ( T T o p t )
where PAR is photosynthetically active radiation; FPARchl is the fraction of PAR absorbed by chlorophyll, which is approximated by a linear function of EVI [23]; and Tscalar and Wscalar represent the effects of temperature and water on light use efficiency of vegetation, respectively [25]. The adjustment coefficient, LSWI is the land surface water index; LSWImax is the maximum land surface water index during the growth period; T, Tmax, Tmin, and Topt are the average, the maximum, the minimum, and the optimum temperature for specific plant types.

2.5. Data Analysis

Two indices, including the root-mean-square error (RMSE) and the coefficient of determination (R2), were used to comprehensively evaluate the performance of three remotely-derived GPP products at 8-day period. The linear trend (k) was also calculated to represent long-term interannual variations over diverse climate zones. Subsequently, to reveal the dominant environmental factors controlling the dynamics in GPP ιν 2001–2015, the Pearson correlation coefficient (r) was calculated to examine the relationships between the reliable GPP product and spatial temperature (T) and precipitation (P) patterns. The equations of R2, RMSE, k, and r are as follows:
R 2 = 1 ( y ^ y ) 2 /   y 2
RMSE =   ( y ^ y ) 2 / n
k = ( i = 1 n x i t i 1 n ( i = 1 n x i ) ( i = 1 n t i ) ) / ( i = 1 n t i 2 1 n ( i = 1 n t i ) 2 )
r x y = i = 1 n [ ( x i x ¯ ) ( y i y ¯ ) ] ( x i x ¯ ) 2 i = 1 n ( y i y ¯ ) 2
where y and y ^ represent the VPM GPP product and the GPP estimates of MODIS or BESS, respectively; ti referred to the year i, xi and yi represented the interannual GPP and the associated annual mean T and accumulated P of the year i, and x ¯ and y ¯ represented multiyear average GPP, T or P, respectively. A minimum RMSE and a maximum R2 were obtained by the optimal satellite-derived GPP products in general. All the statistics were performed through SPSS 19.0 (IBM, Chicago, IL, USA). Moreover, the MODIS reprojection tool (MRT) and the interactive data language (IDL) in ENVI 5.3 were used to process a large number of remote sensing data sets.

3. Results

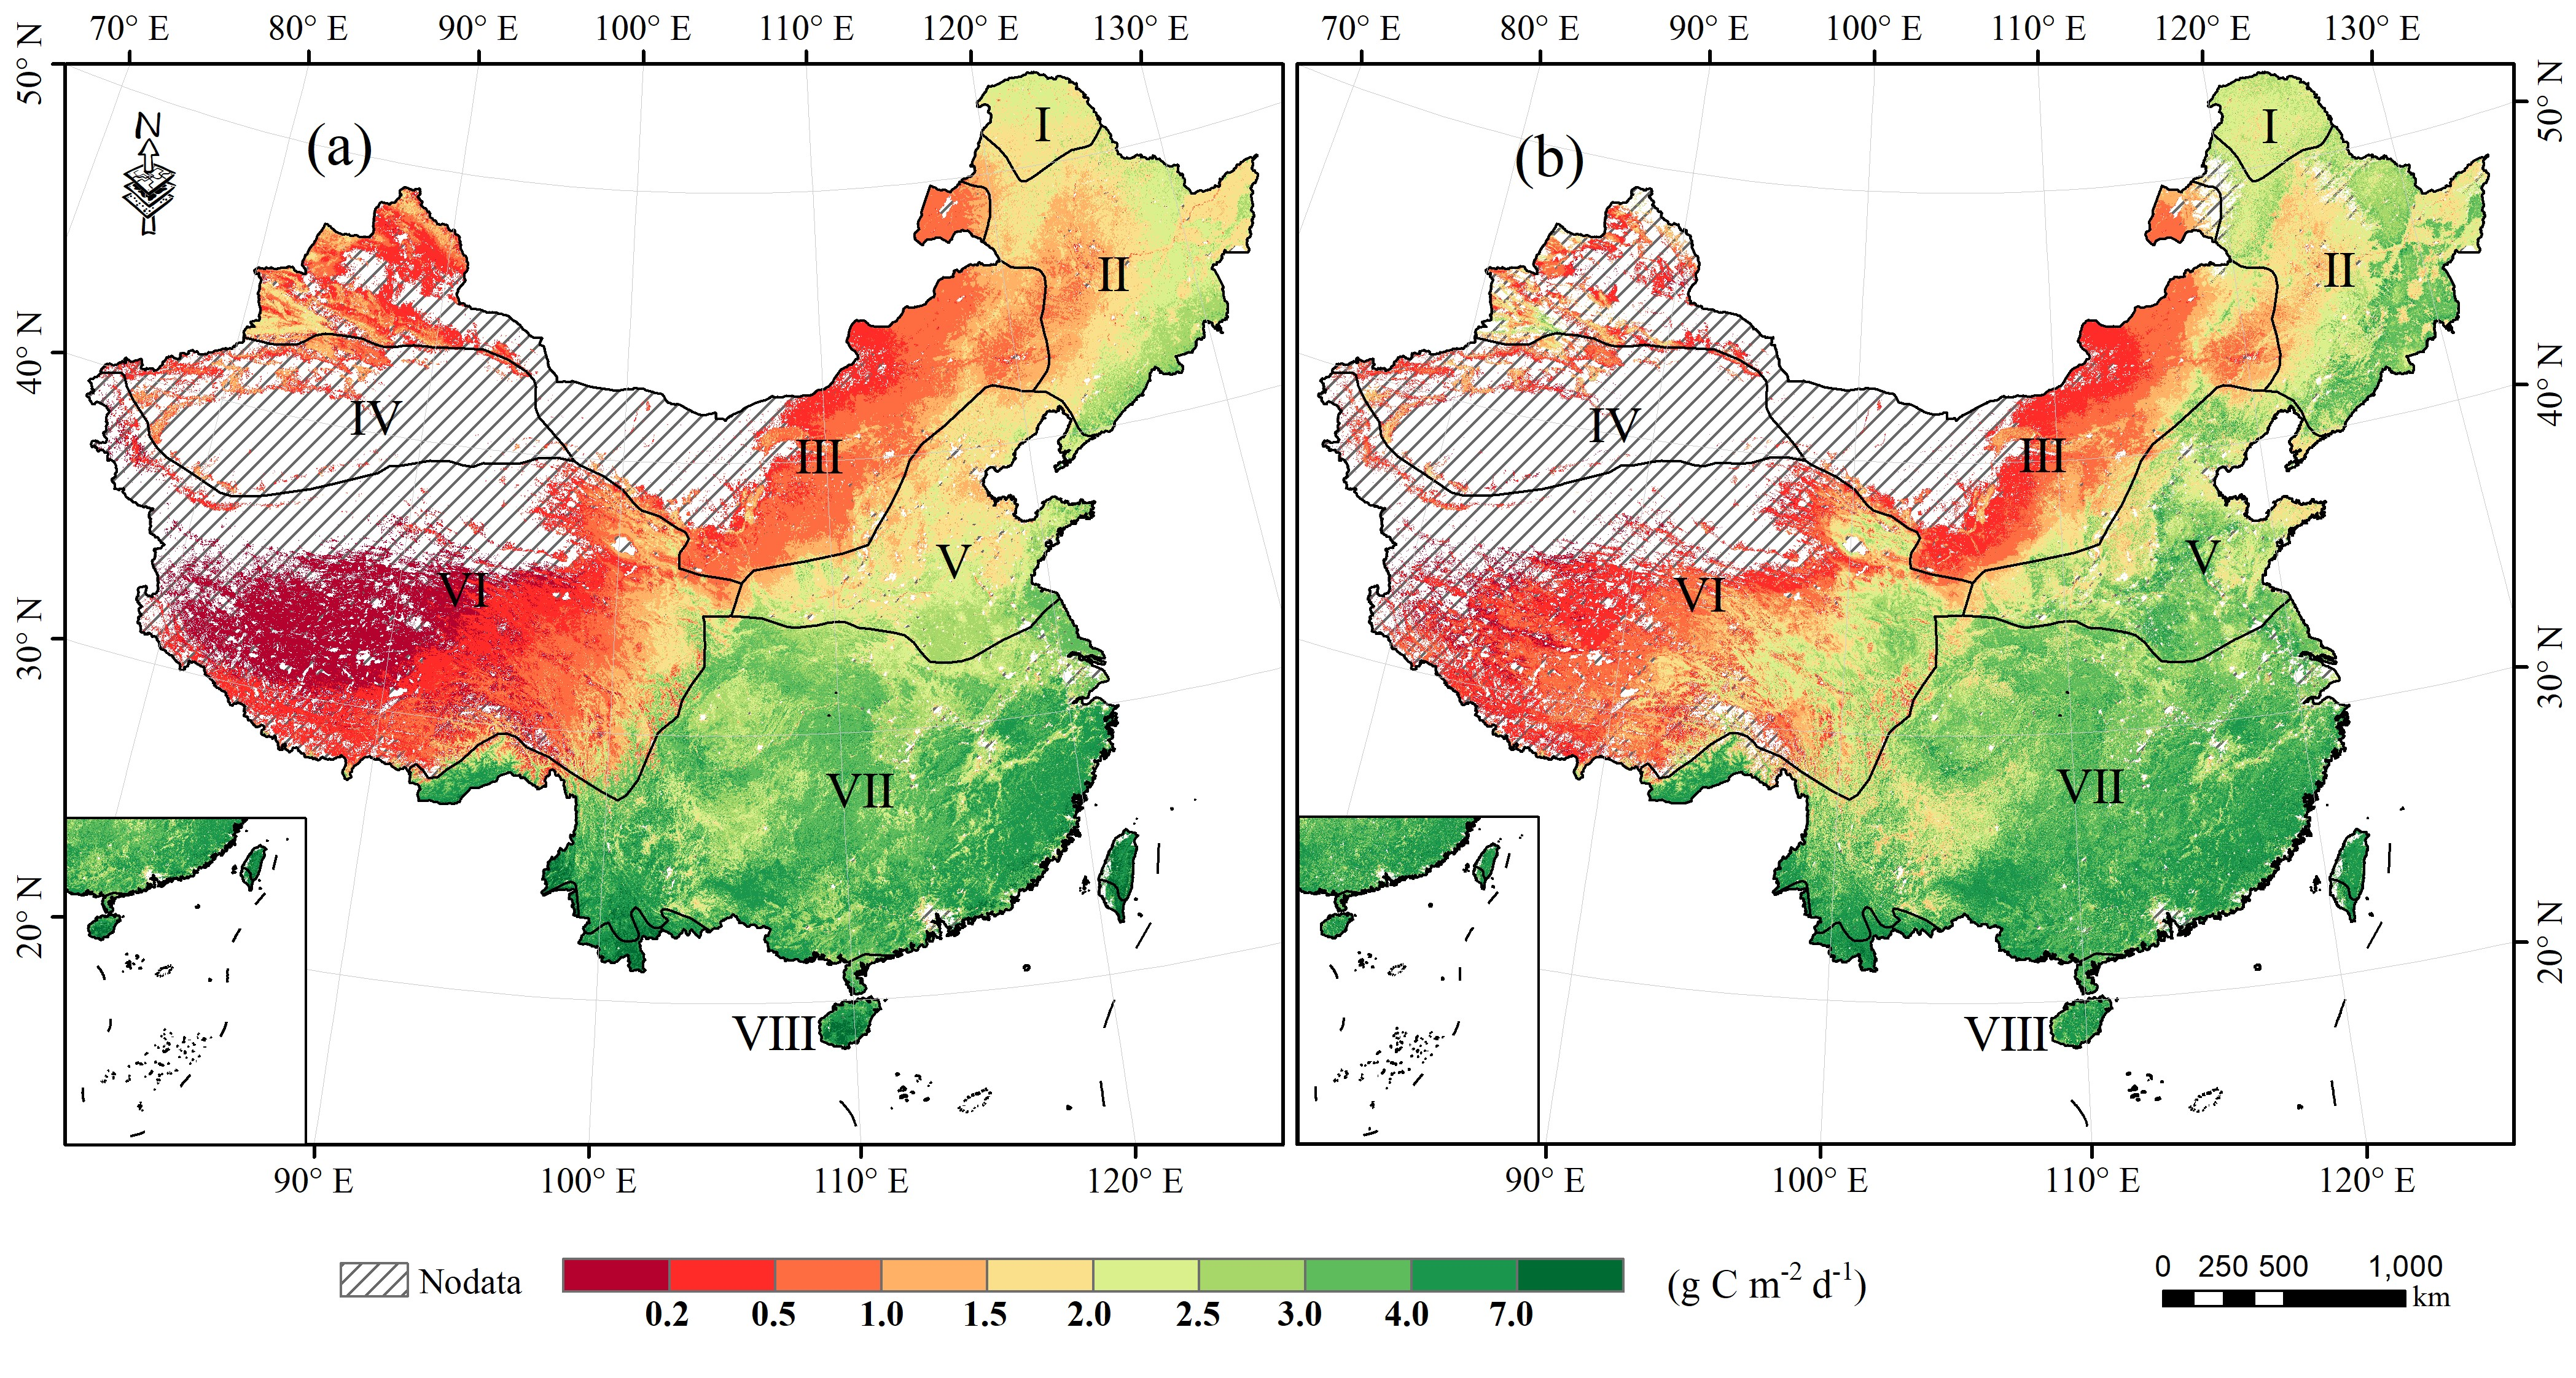
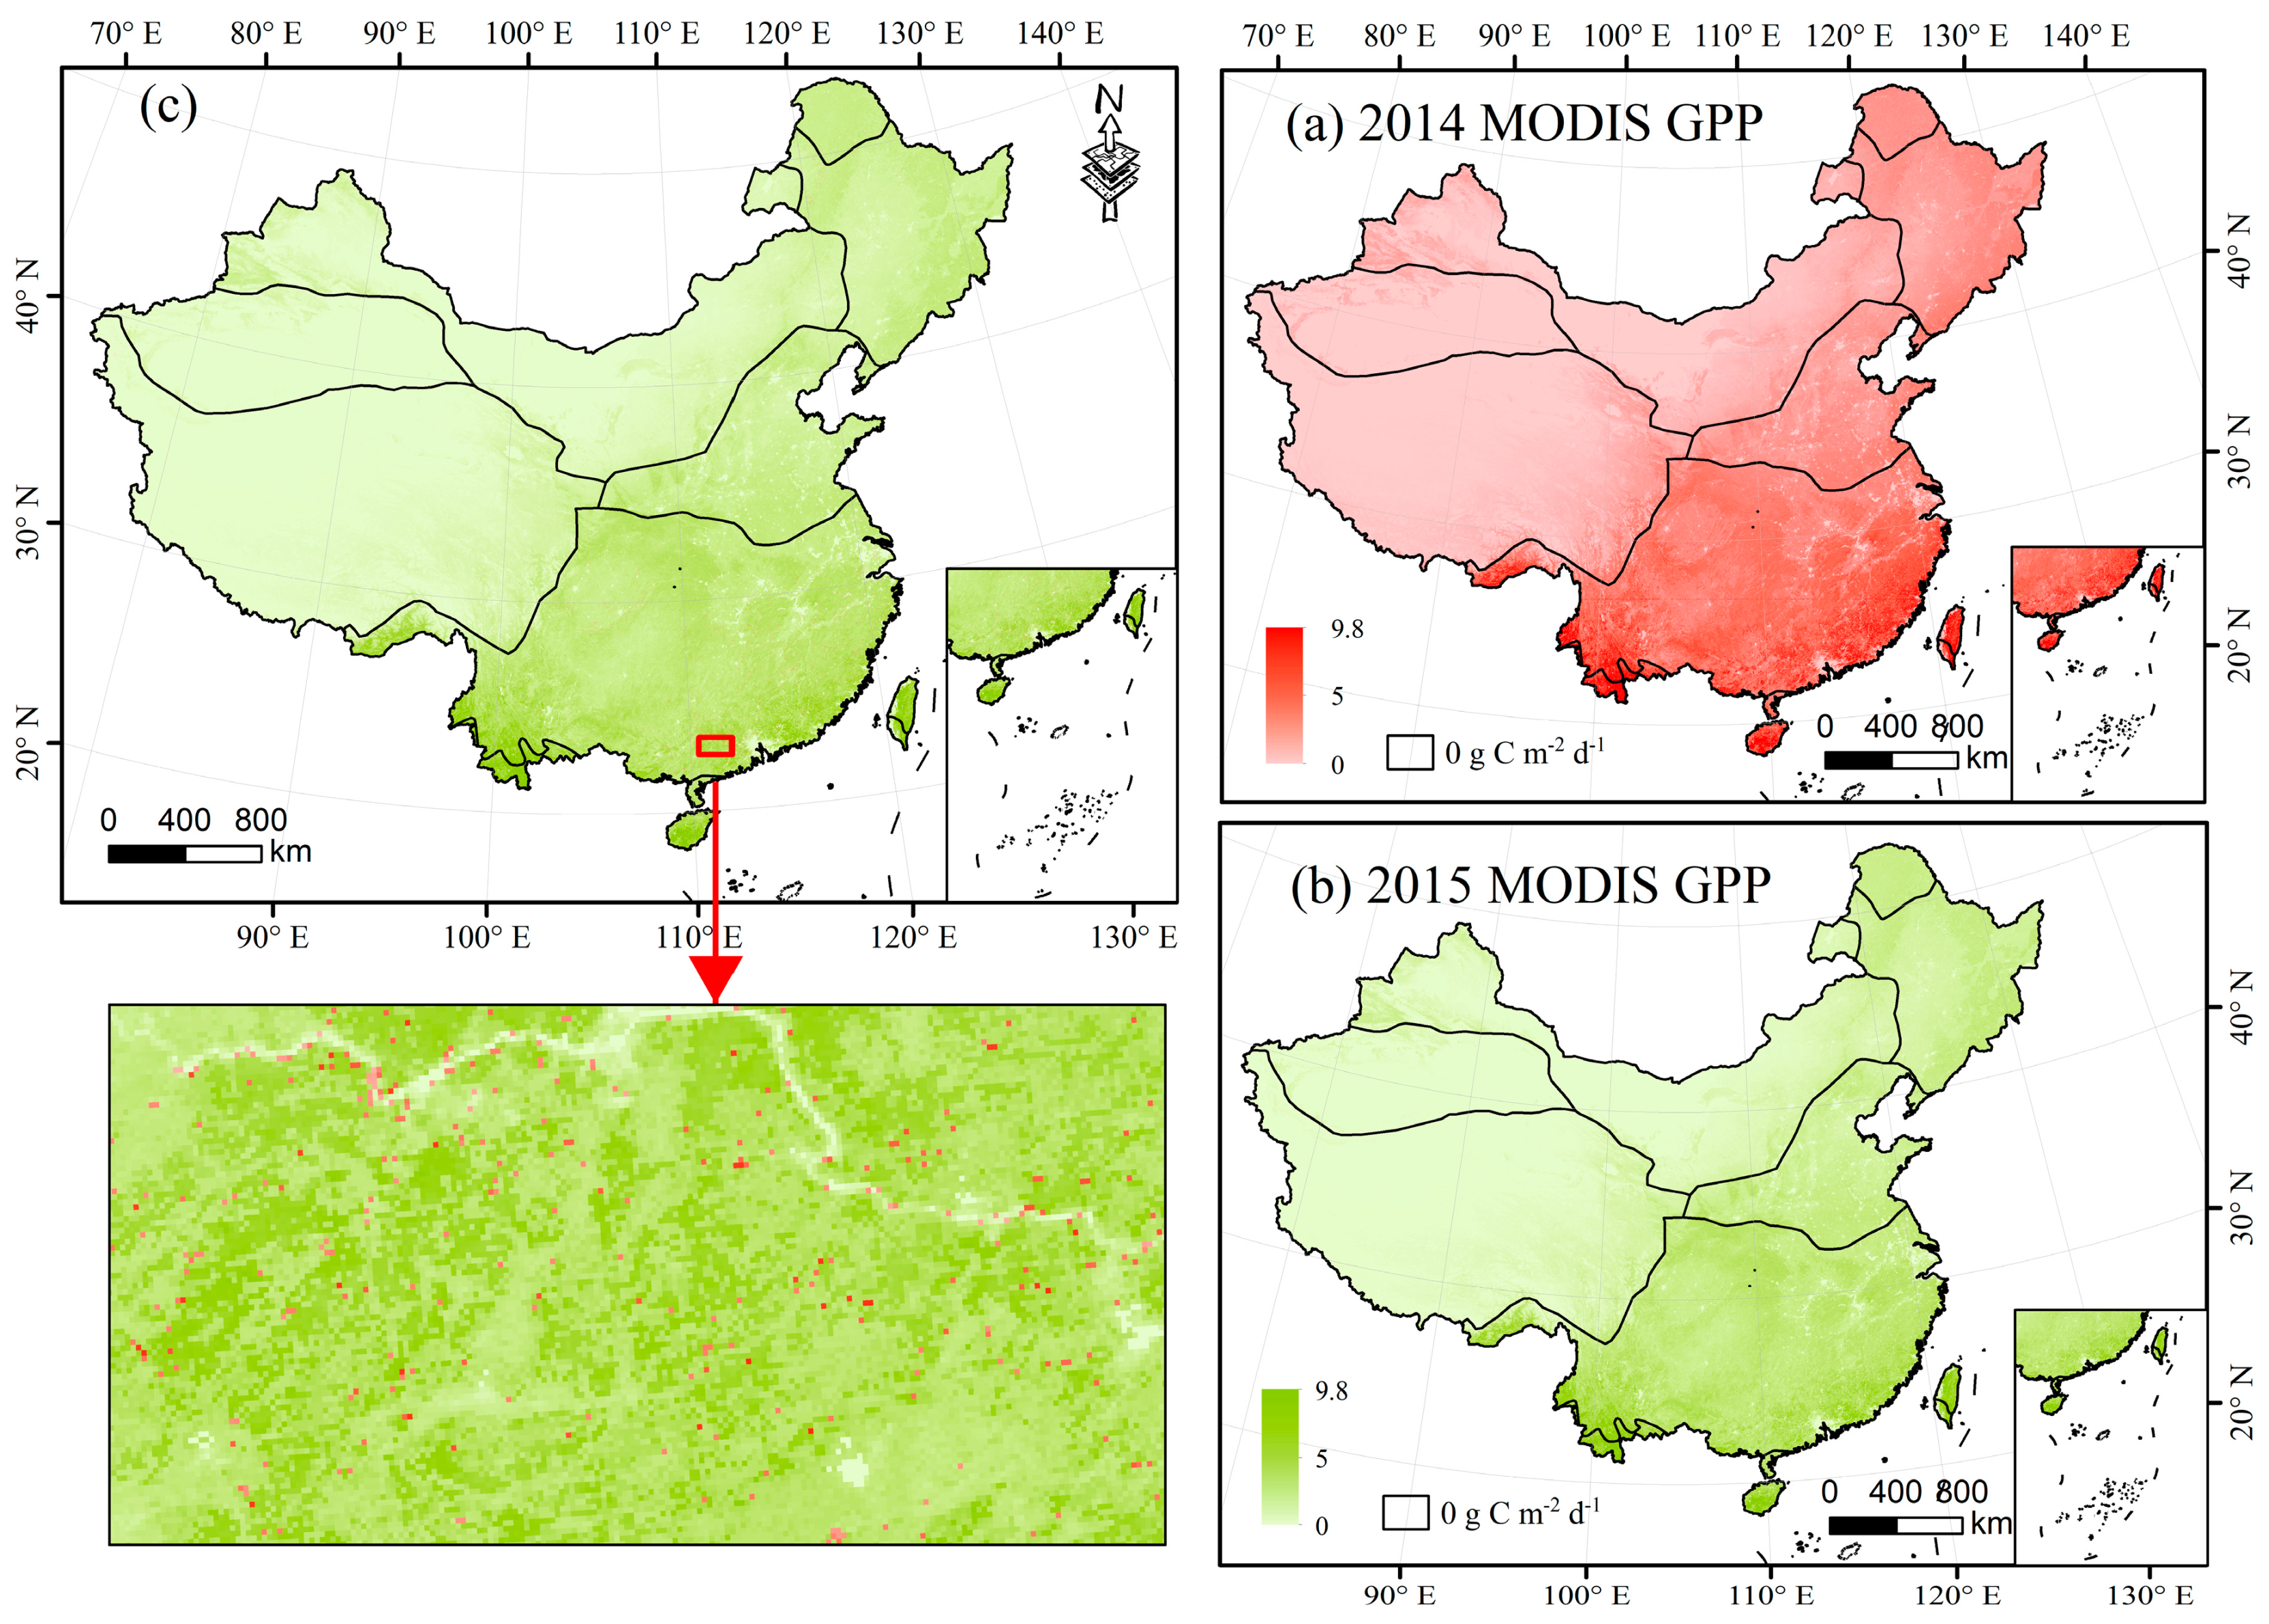
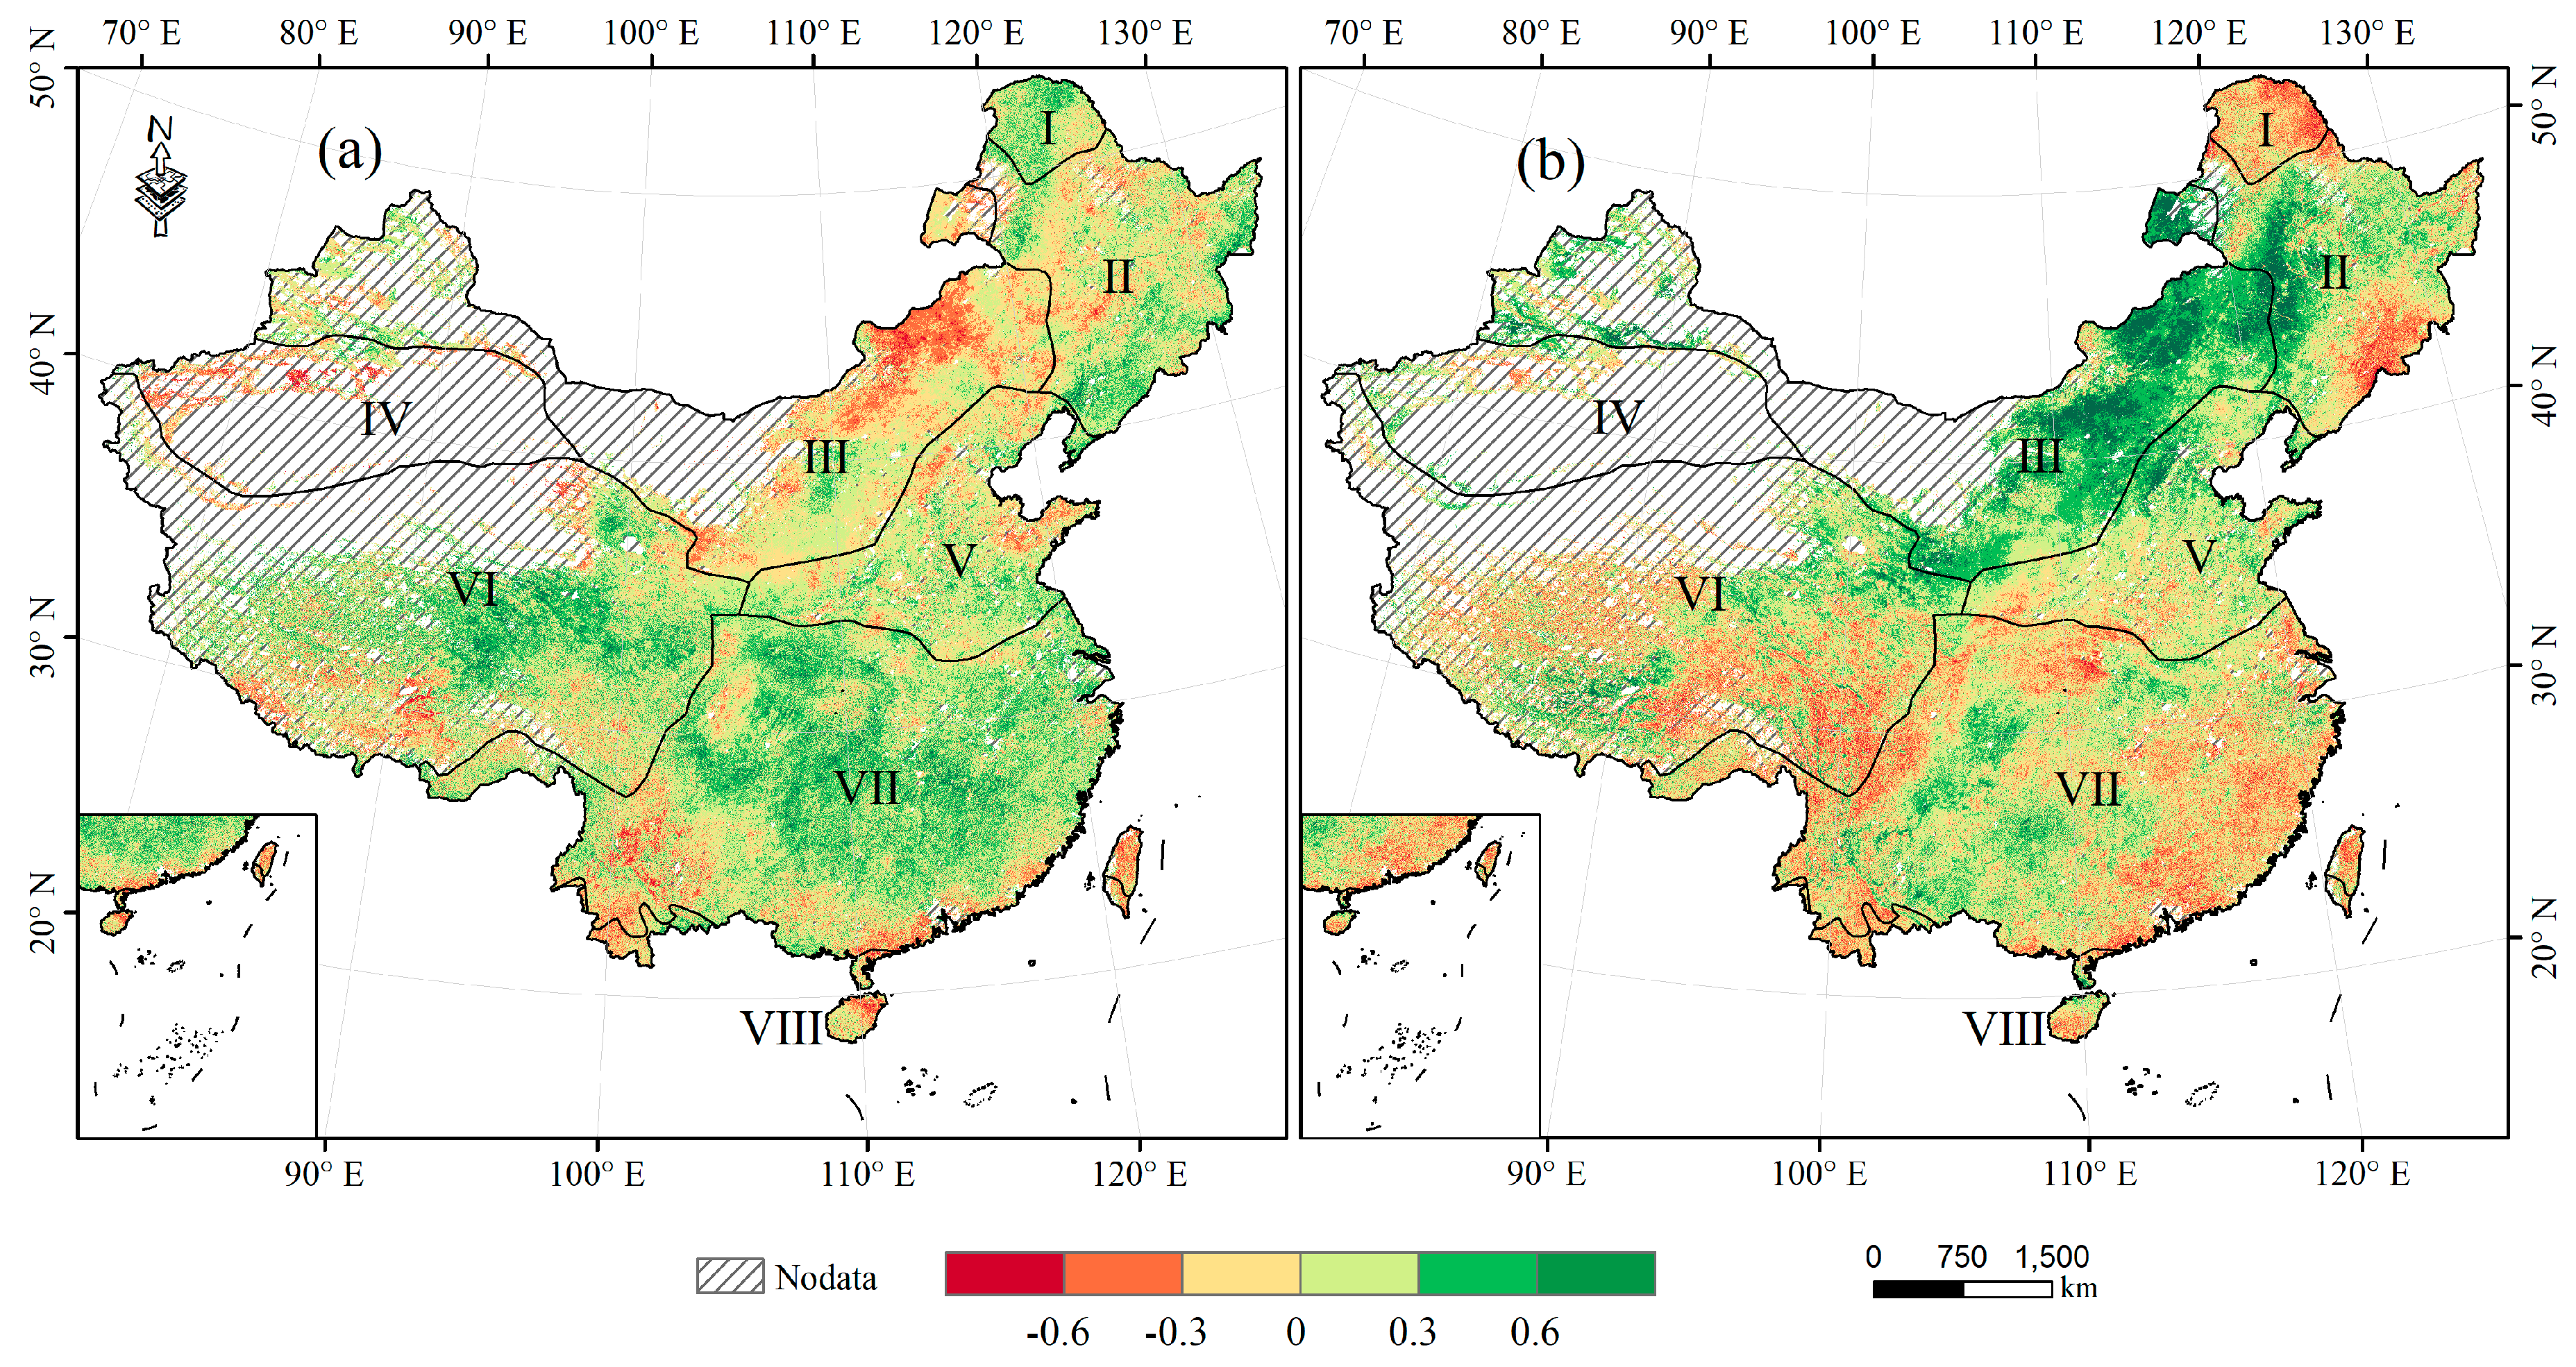
3.1. Spatial Pattern

Using the 1 km resolution 8-day composite MODIS and BESS GPP data from 2001 to 2015, this study calculated the spatial distribution of multiyear mean GPP across China. Figure 2 showed that both GPP products exhibited substantial spatial heterogeneity with a decreasing trend from the southeast coast to the northwest inland area. This can be attributed to the dry climate with sparse vegetation cover in the northwest region, while the climate of the eastern area is relatively humid with good thermal conditions appropriate for the growth of vegetation all year round. In addition, the GPP of Southern China was apparently larger than that of Northern China because of differences in vegetation phenology. Nevertheless, the study implied that both MODIS and BESS GPP products had a great number of missing values in the arid and semiarid Northwest China including the midtemperate semiarid region (III), the warm temperate arid region (IV), and the plateau zone (Ⅵ), which meant that these approaches reduced the ability to estimate GPP in these areas.
In view of the eight climate zones across China (Figure 3), terrestrial GPP of both MODIS and BESS models exhibited the largest value in the tropical humid region (VIII) with approximately 5.28 g C m−2 d−1, followed by the subtropical humid region (VII: approximately 3.55 g C m−2 d−1). Then, the GPP values over the warm temperate subhumid region (V), cold temperate humid region (I), and midtemperate humid region (II) were quite close. The GPP of the midtemperate semiarid region (III) was about 0.91 g C m−2 d−1, and the lowest GPP values were found in the warm temperate arid region (IV) and plateau zone (VI) below 0.7 g C m−2 d−1. However, obvious differences existed between the MODIS and BESS GPP values over these climate zones with the biases ranging from 0.028 g C m−2 d−1 to 0.185 g C m−2 d−1. Generally, BESS GPP is relatively higher than MODIS GPP due to a separate treatment towards C3/C4 photosynthesis pathways, except for the tropical humid region (VIII). Most areas of cropland in the North China Plain and Northeast China planted the C4 maize, and 60% of C4 species were grasses, distributed in the grassland ecosystems of Northwest China and the Tibet Plateau.

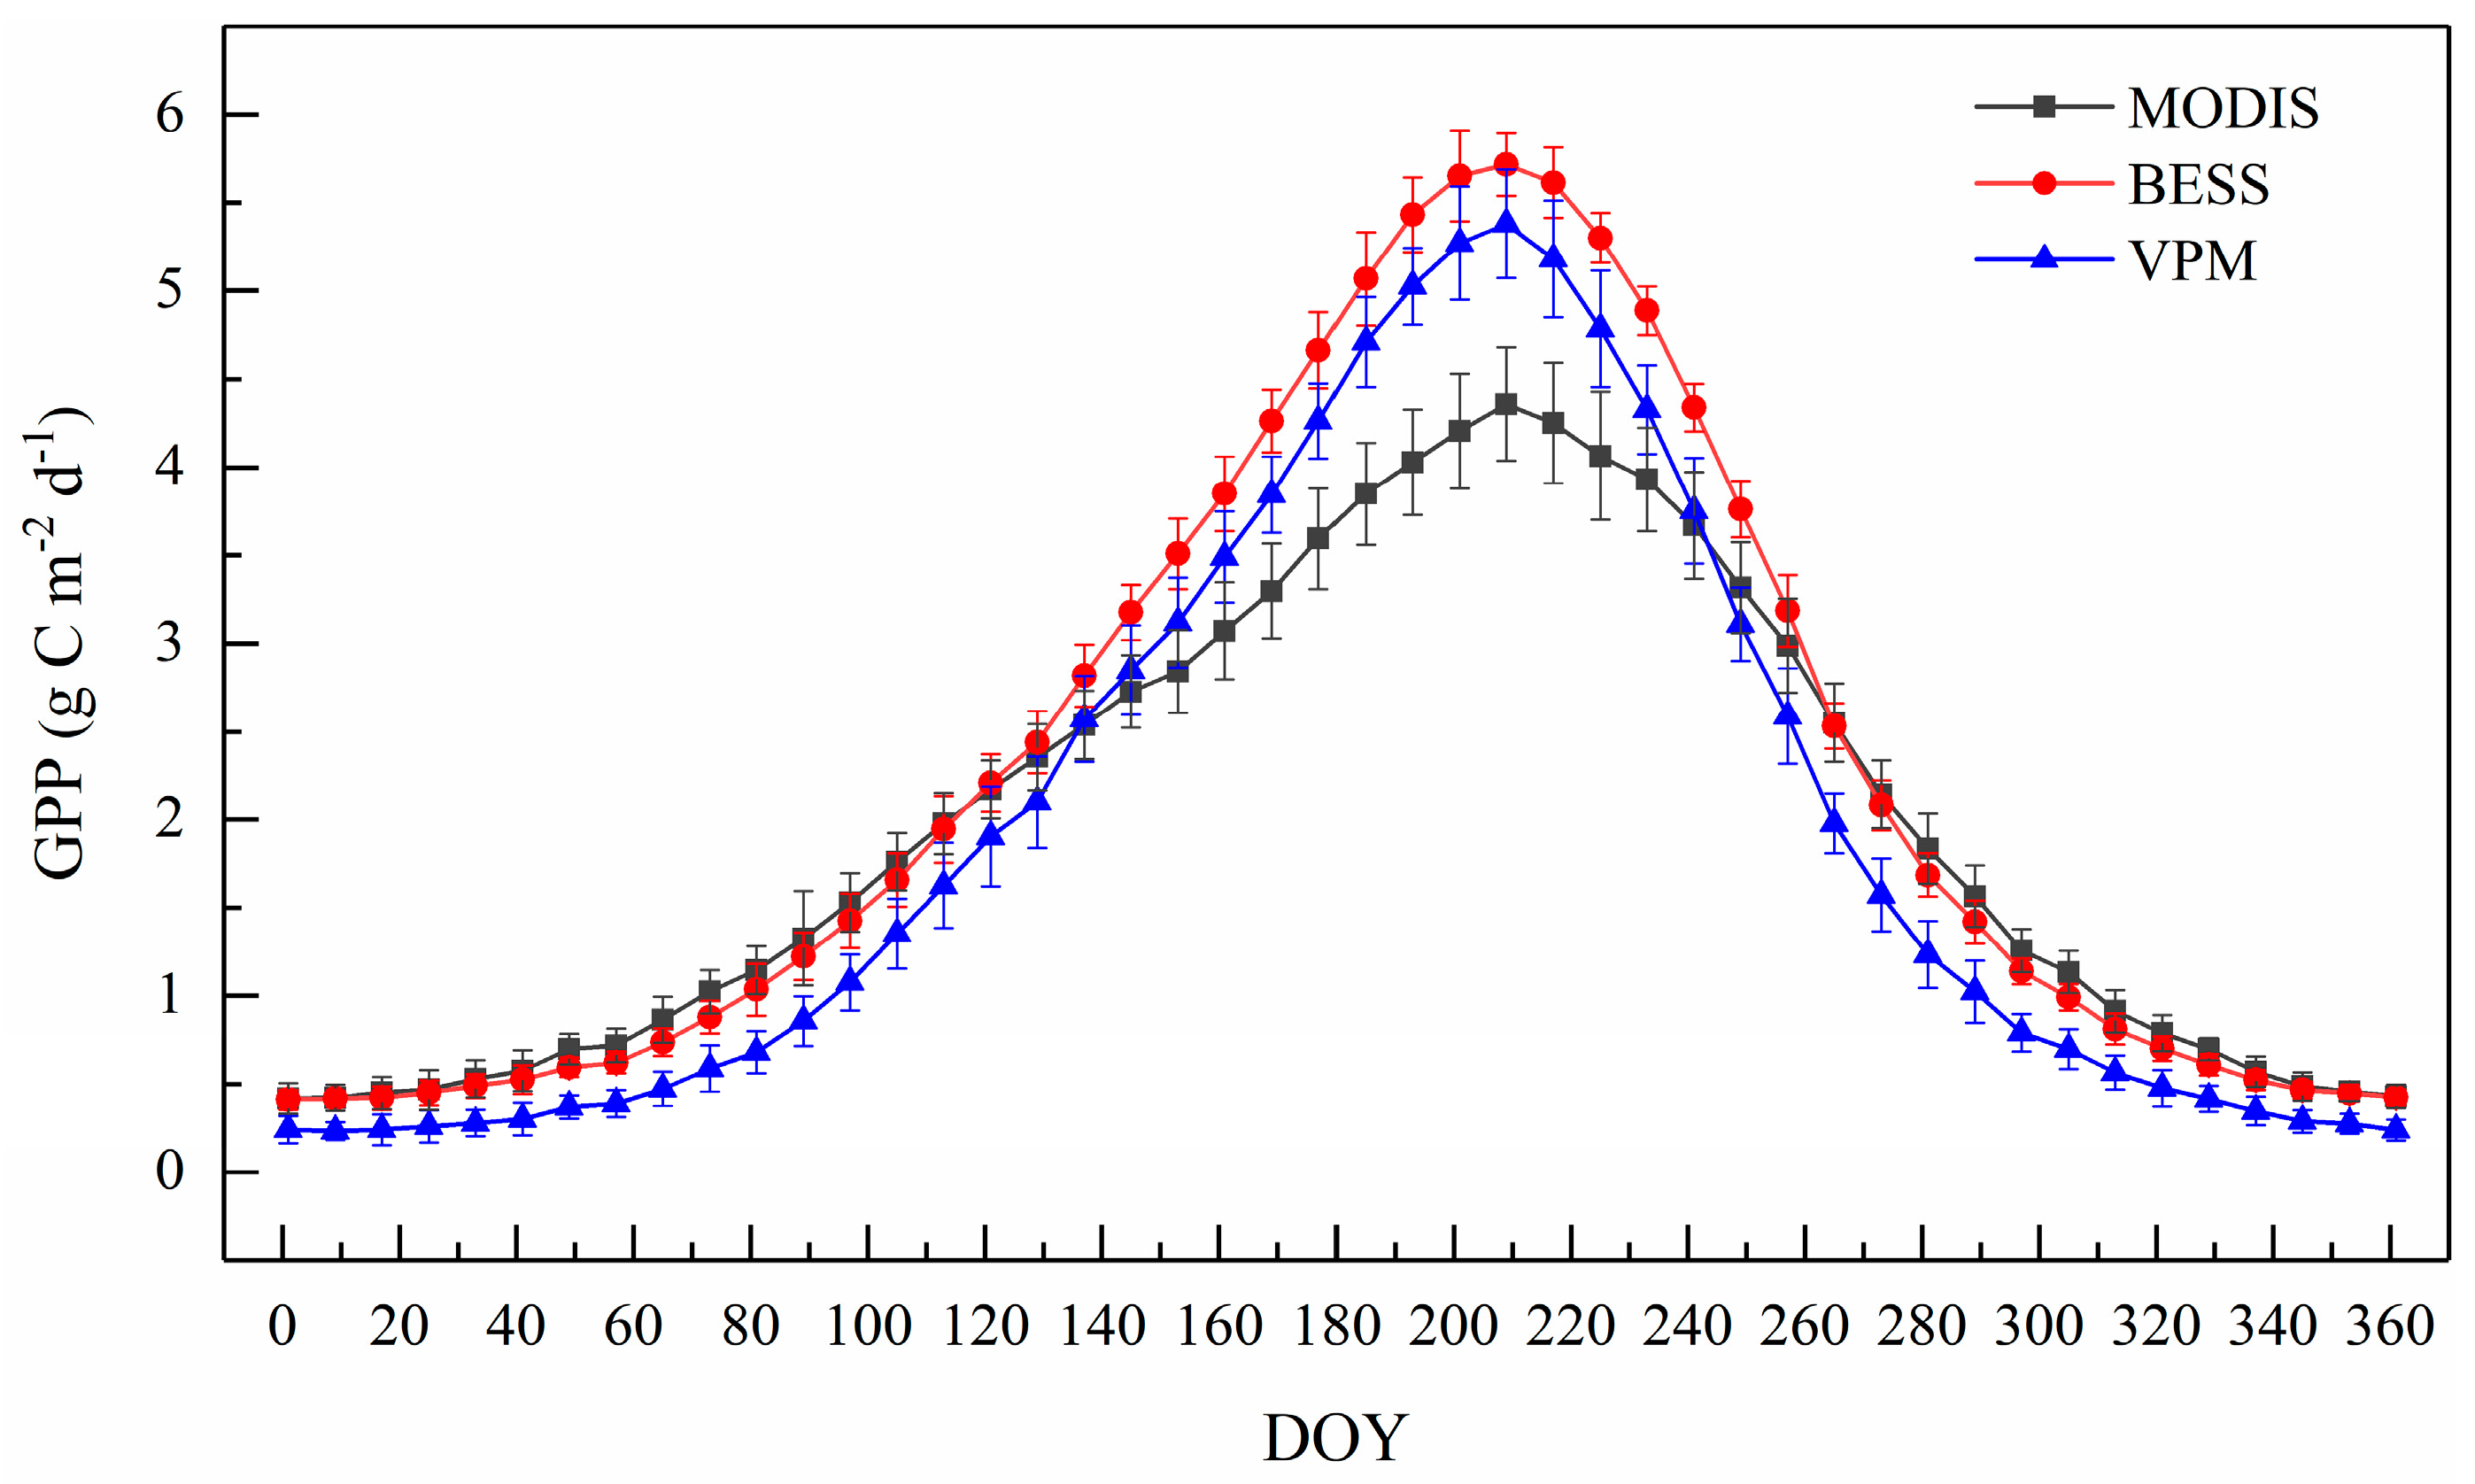
3.2. Seasonal Variations

The variability in multiyear mean MODIS, BESS, and VPM GPP in China exhibited a clear seasonal pattern for 8-day periods (Figure 4). The changing trends throughout the year were quite consistent, despite different magnitudes among these products. Specifically, during the wintertime, GPP was quite low because of lack of active photosynthetic activity for the deciduous forests and grasslands in most areas of China. However, GPP started to rise rapidly with vegetation growth in the springtime, reached peak values in mid-to-late July of the year, and then gradually fell with leaf withering in autumn. From the end of a plant growing season to the next growth cycle in early spring, almost no difference existed between the MODIS and BESS GPP products, whereas the VPM GPP estimates were a bit lower. However, during the summertime, both BESS and VPM GPP products were apparently higher than MODIS GPP. This can be explained by the algorithms of both BESS and VPM models considering the differences of C3/C4 plants, while the MODIS model neglected this point. This resulted in MODIS overestimates for small values and underestimates for high values. Thus, treating photosynthesis pathways of C3/C4 vegetation separately is crucial for the accurate estimates of regional GPP. Meanwhile, the scatterplots in Figure 5 showed that compared with VPM GPP, both MODIS and BESS GPP have strong correlations. Particularly, a strong linear relationship was found between BESS GPP and VPM GPP, with R2 and RMSE attaining to 0.997 and 0.35 g C m−2 d−1. Therefore, this study indicated that by comparison with MODIS GPP, the BESS product provided a more reliable GPP estimate of terrestrial ecosystems over 8-day periods.

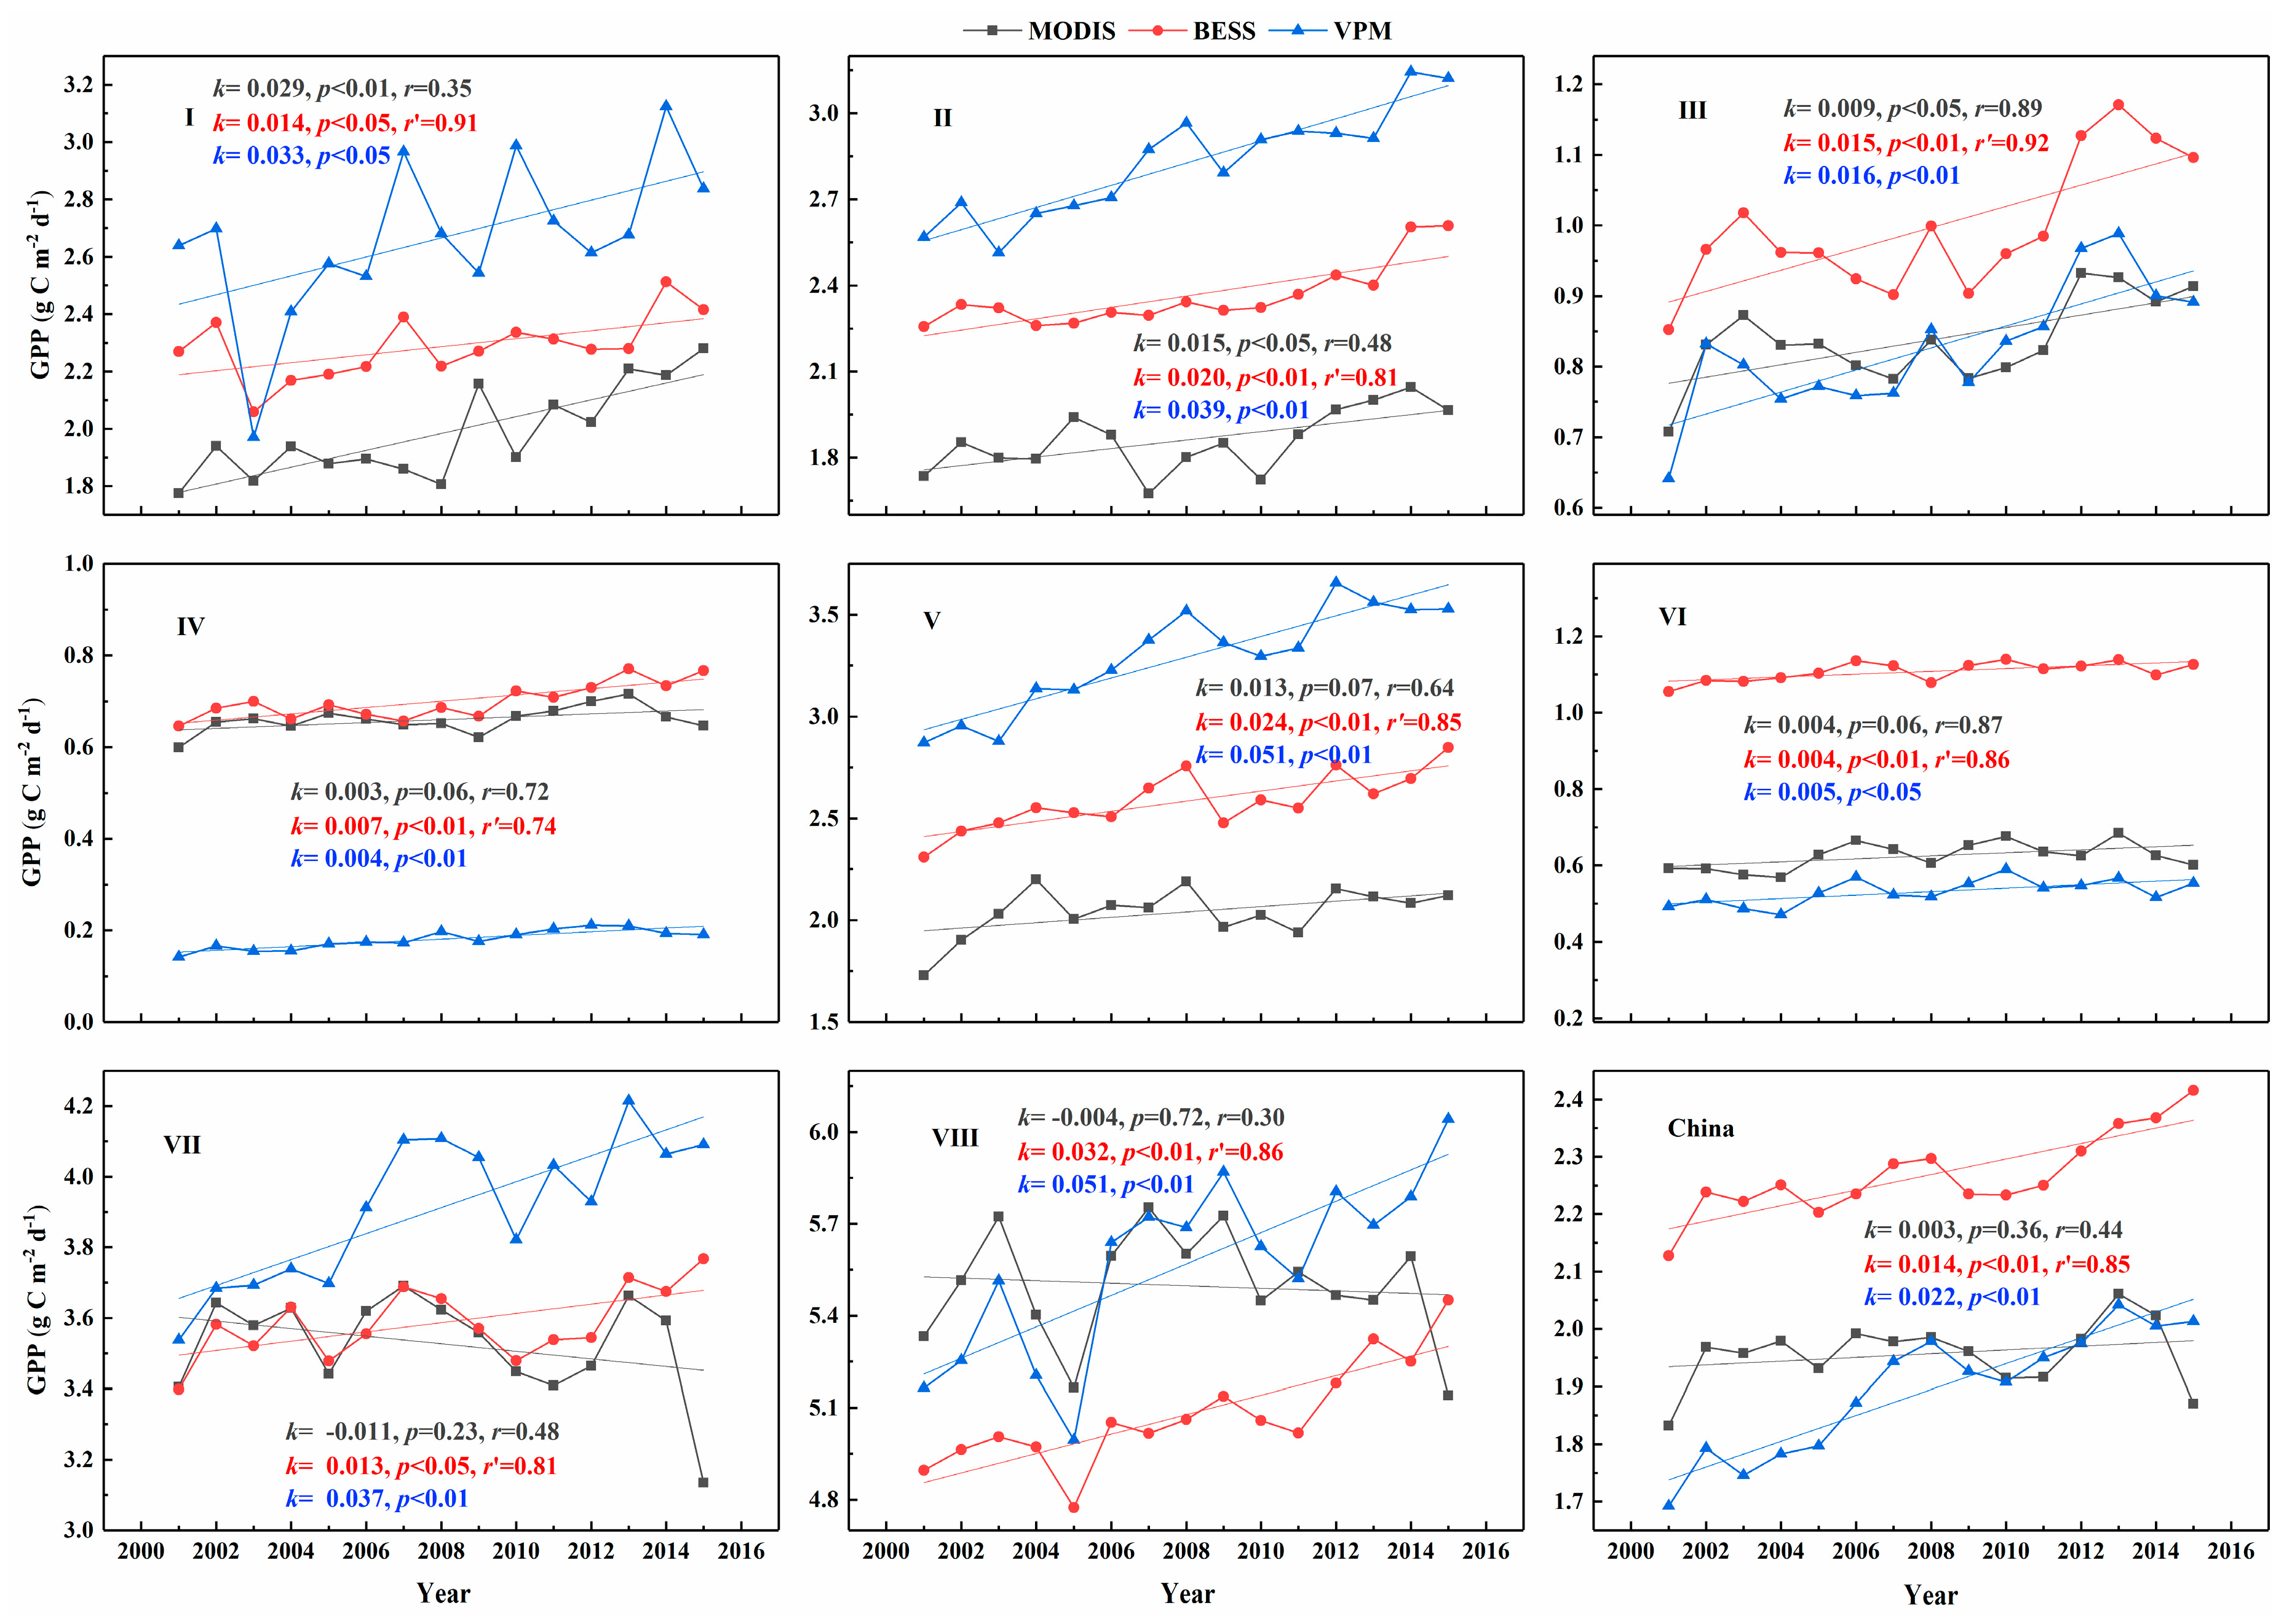
3.3. Interannual Dynamics

The long-term trends of MODIS, BESS, and VPM GPP products in China over the eight climate zones from 2001 to 2015 are shown in Figure 6. From the perspective of the whole country of China, both BESS and VPM GPP data exhibited an increasing tendency in the past 15 years compared to the MODIS GPP. The correlation between BESS and VPM GPP attained an r = 0.85. Especially, GPP of all these products increased significantly with time in the Northeast China regions (Ⅰ and Ⅱ) and in the northwestern area (Ⅲ). Meanwhile, the correlations between BESS and VPM GPP were apparently higher, ranging from 0.81 to 0.92, compared to correlations between MODIS and VPM GPP, of r = 0.35 to 0.89. In addition, Figure 6 shows that MODIS GPP did not capture the interannual variations over half of China’s area, including the Northeast China region (I and II) and the Southern China area (VII and VIII). However, the rising trends had strong correlations between BESS and VPM products values (r = 0.74~0.86). Overall, BESS GPP is more consistent with VPM GPP than MODIS GPP on the annual time scale.

4. Discussion

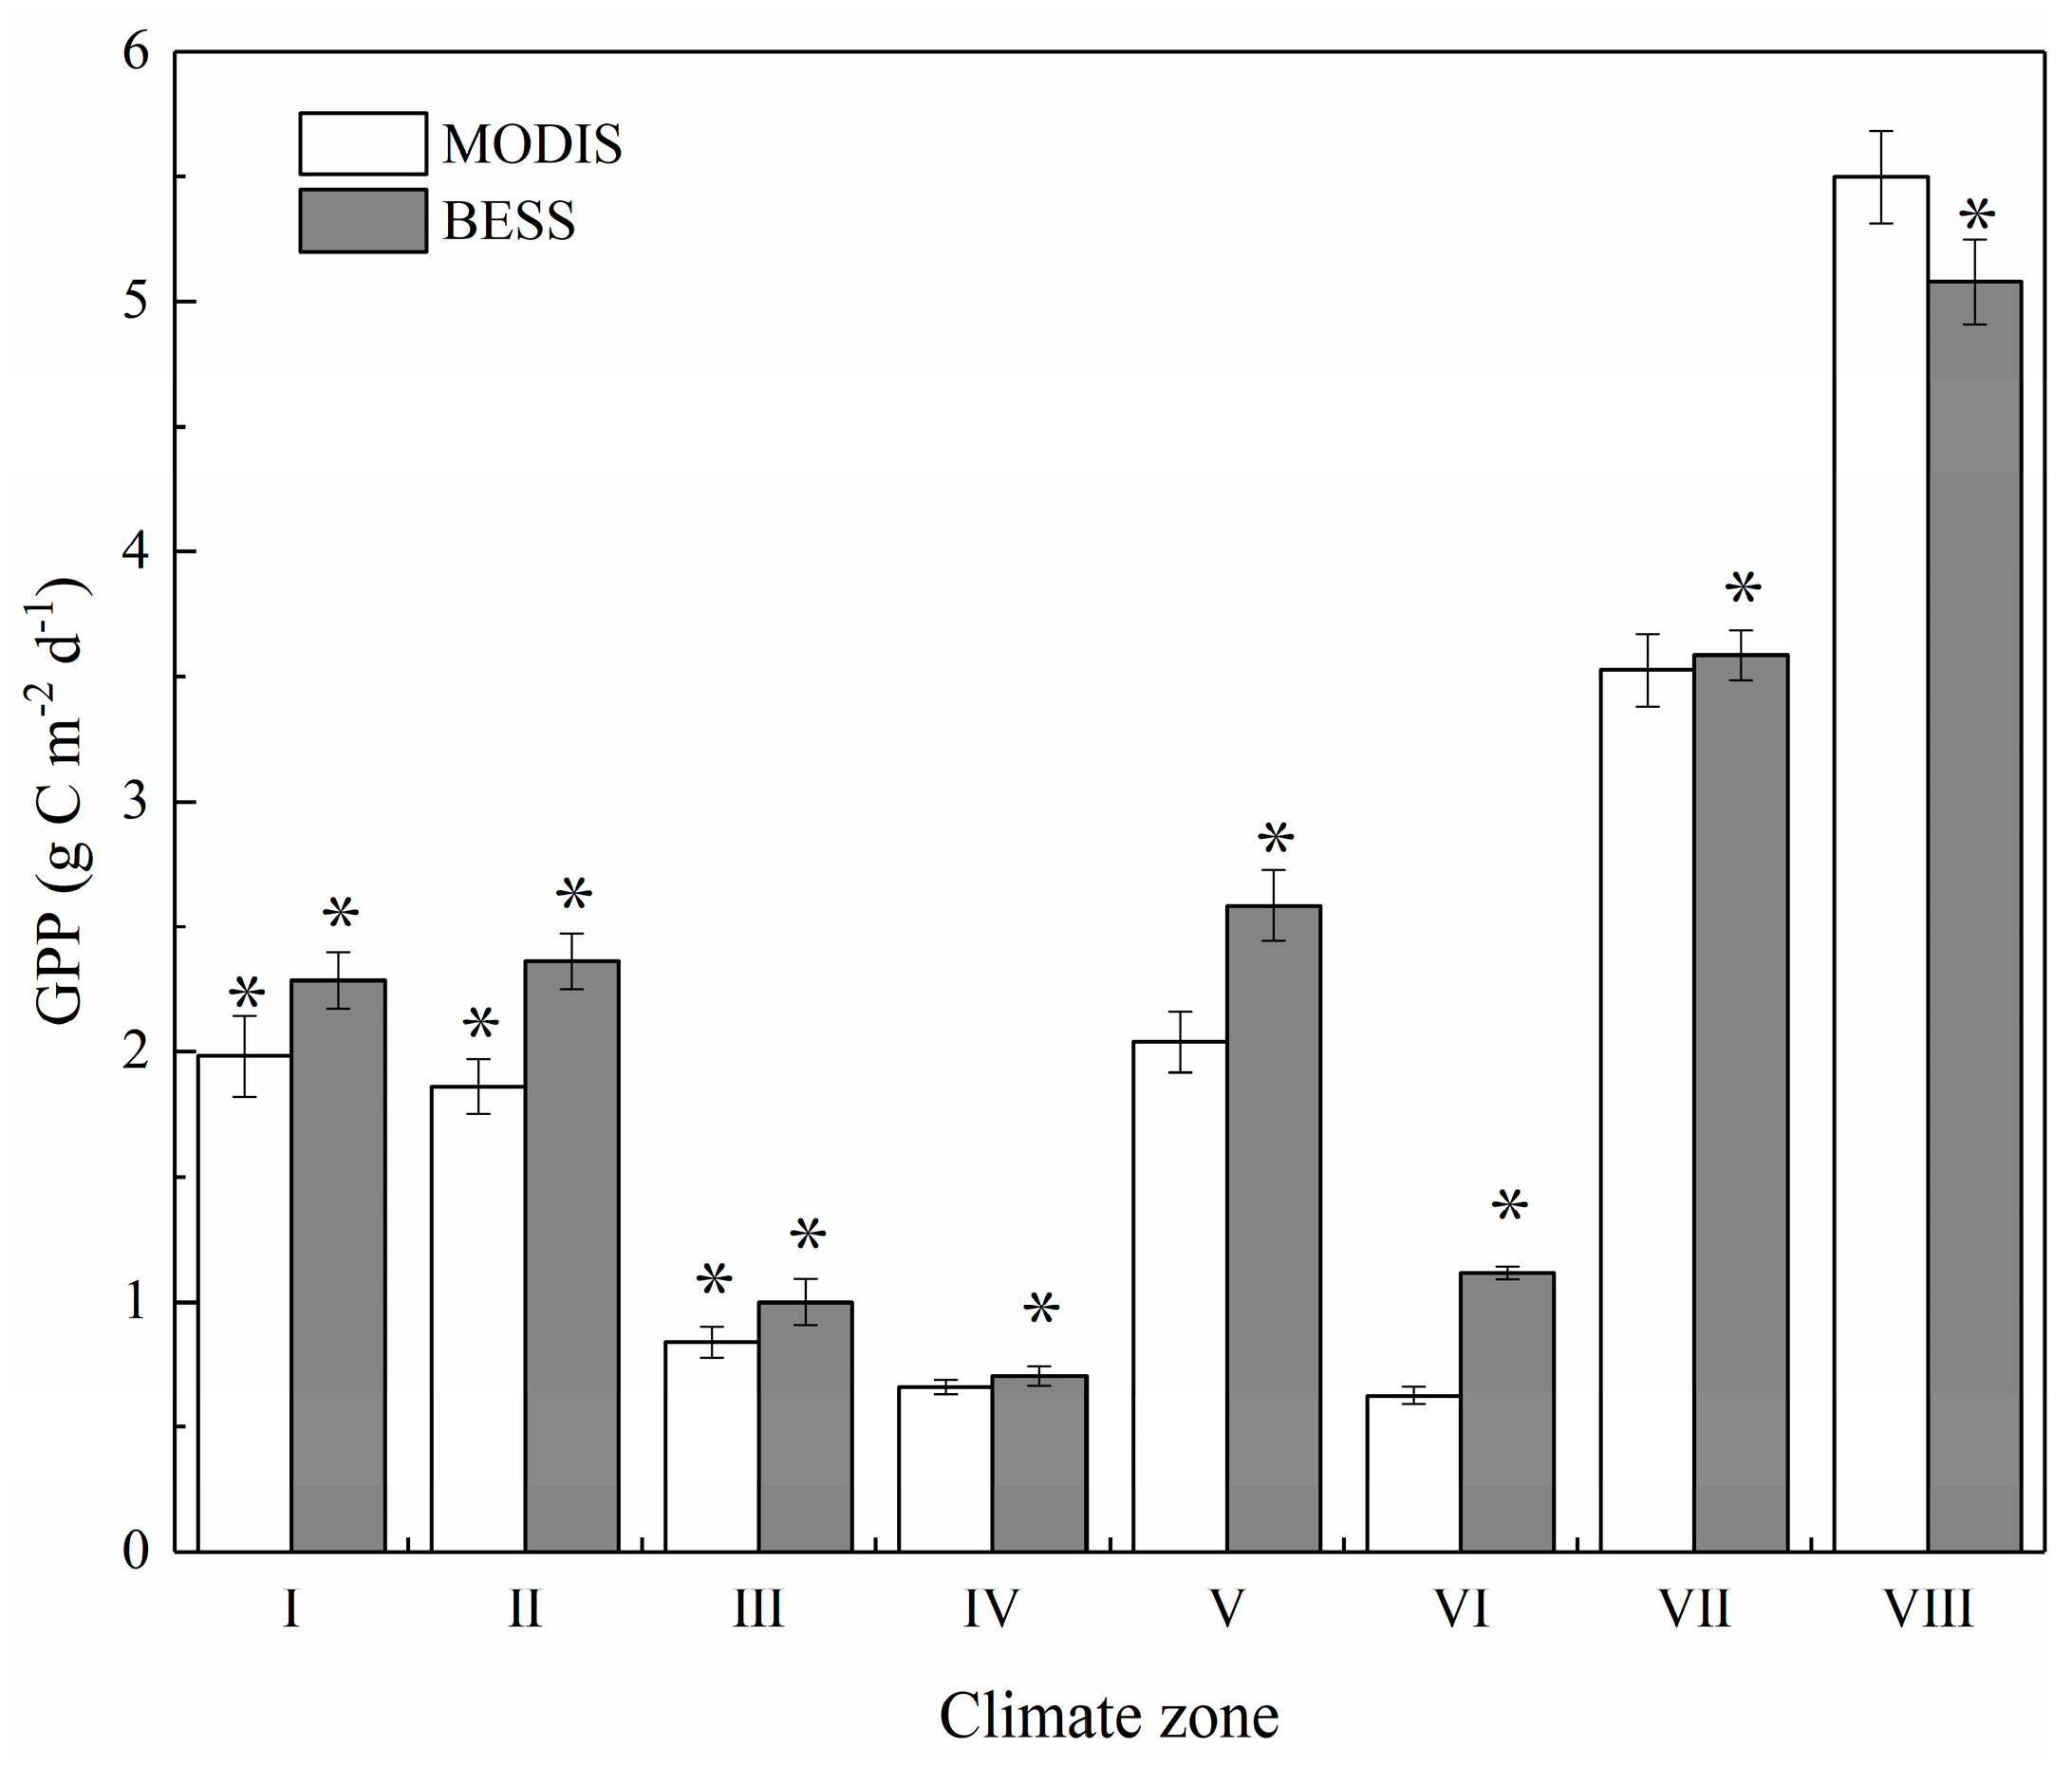
4.1. Regional Differences in the GPP Products

All the three GPP products use the MODIS land cover type product (MCD12Q1) as input data to depict the different underlying surfaces of terrestrial ecosystems. The MODIS land cover data identify fourteen classes in total, including ten natural vegetation classes, two human-altered classes, and two nonvegetated classes [54]. In the ecologically-fragile Northwestern China region, the nonvegetated classes, which included perennial salt, inland fresh water, perennial snow and ice, and gobi with sparse vegetation, are widely distributed. This caused large-area GPP values to be lost for both MODIS and BESS products in Figure 2. However, both GPP products exhibited high coefficients of determination (up to 0.997) with VPM GPP data, even though the GPP values varied substantially (Figure 6). Zhao et al. [16] mentioned that the LUE should take into account spatial differences in the application of the MODIS GPP algorithm. Because the land surface is heterogeneous, most of the pixels are mixed in the medium and low resolution GPP remote sensing products [55], which will increase the MODIS GPP estimation error when computed using a constant LUEmax. In the humid tropical and subtropical regions, Nakaji et al. [56] have shown that LUE has a strong negative correlation with water vapor pressure. Zhang et al. [57] proposed that the LUE is higher in the case of a small amount of clouds than with no clouds, which was helpful to the vegetation photosynthetic activity. Consistent with previous findings, MODIS GPP in the tropical region was notably higher than BESS GPP products, which can be partly ascribed to the effects of cloud cover and water vapor pressure [58]. Furthermore, through analyzing the interannual variations of the three GPP products over varied climate zones (Figure 6), the study found that the MODIS GPP in the subtropical humid region (Ⅶ), the tropical humid region (Ⅷ), and for all of China decreased sharply in 2015, which contrasted with the positive directions obtained from the BESS and VPM GPP products. Interestingly, few studies have ever used the MODIS GPP products from 2015 for analysis. Figure 7 revealed that in the terrestrial ecosystems of Southern China displaying large annual carbon sequestration, the MODIS GPP products had the zero values in 2015 more than in 2014.. Overall, the annual MODIS GPP trends still retained large uncertainties across climate zones, whereas multiple GPP simulations from different models can help to make the long-term changes clearer. It is normal that these satellite-based GPP products exhibited contrasting performances across the different climate zones. On the one hand, terrestrial ecosystems are strongly affected by the local climate characteristics. On the other hand, these GPP models, including MODIS, BESS, and VPM, have different algorithms when estimating the variability in GPP. Generally, C4 plant have higher LUEmax than C3 plants due to different physiological pathways [59,60,61]. The MODIS algorithm simulated GPP across complex surface vegetation types with the same LUEmax regardless of C3/C4 plant [17], but BESS and VPM models considered this photosynthetic pathway difference. The use of different assumptions and input values is main reason which led to MODIS GPP values that were apparently lower than those obtained with BESS or VPM GPP products in the northern area of China.

4.2. Environmental Controlling Factors of Different Climate Zones

With the increasing impact exerted by global climate change, the response of terrestrial ecosystems is receiving more and more attention from the international community about the potential carbon sink capacity [62]. The climatic variables are considered to be the main causes of land surface vegetation changes, whereas the dominant environmental factor controlling the interannual changes of GPP would be distinctly different across various climate zones [40,63]. From the correlation analysis of annual mean BESS GPP products in terrestrial ecosystems across China along the 2001–2015 period (Figure 8, Table 2), GPP and temperature in most regions had a significant positive correlation over 59% of the study area, which indicated that the increase of temperature mainly stimulated the growth of vegetation, particularly in the southern area (VII) and the Tibet Plateau region (VI). However, the correlation analysis showed that GPP in Inner Mongolia and tropical humid region were negatively correlated with temperature (Figure 8a). Generally, high temperature occurs during a period of little precipitation, and so, the GPP is being limited by the lack of rainfall. Meanwhile, heat-induced damage to vegetation is often accompanied by water stress, and thus, VPD and water stress are drivers of GPP declines. Recently, many studies also found that the annual and seasonal maximum and minimum temperatures in China have amplified in the last few decades [62,63,64,65,66,67], especially in North China with extreme heat wave events, which exerted a significant impact on economic activities, consumption of electricity and water, forest fires, and a reduction in grain yield. In addition, the correlation analysis between terrestrial GPP and precipitation in entire China indicated that the area with positive correlation (55.85%) was higher than that with negative correlation (44.15%). Consistent with the findings of Wang et al. [20], for South China, with abundant precipitation, water is not a limiting factor for vegetation growth. However, arid and semiarid areas such as the Inner Mongolia region in Northern China are mainly controlled by yearly precipitation (Figure 8b), which agreed well with the finding that water availability is a dominant factor in drylands across China, while climate warming will greatly exacerbate the severity of drought [68]. Overall, contrasting mechanisms affect the variability of GPP over China. In the northern regions, terrestrial GPP is more sensitive to precipitation, while the thermal condition in the southern regions plays a critical role on vegetation GPP.

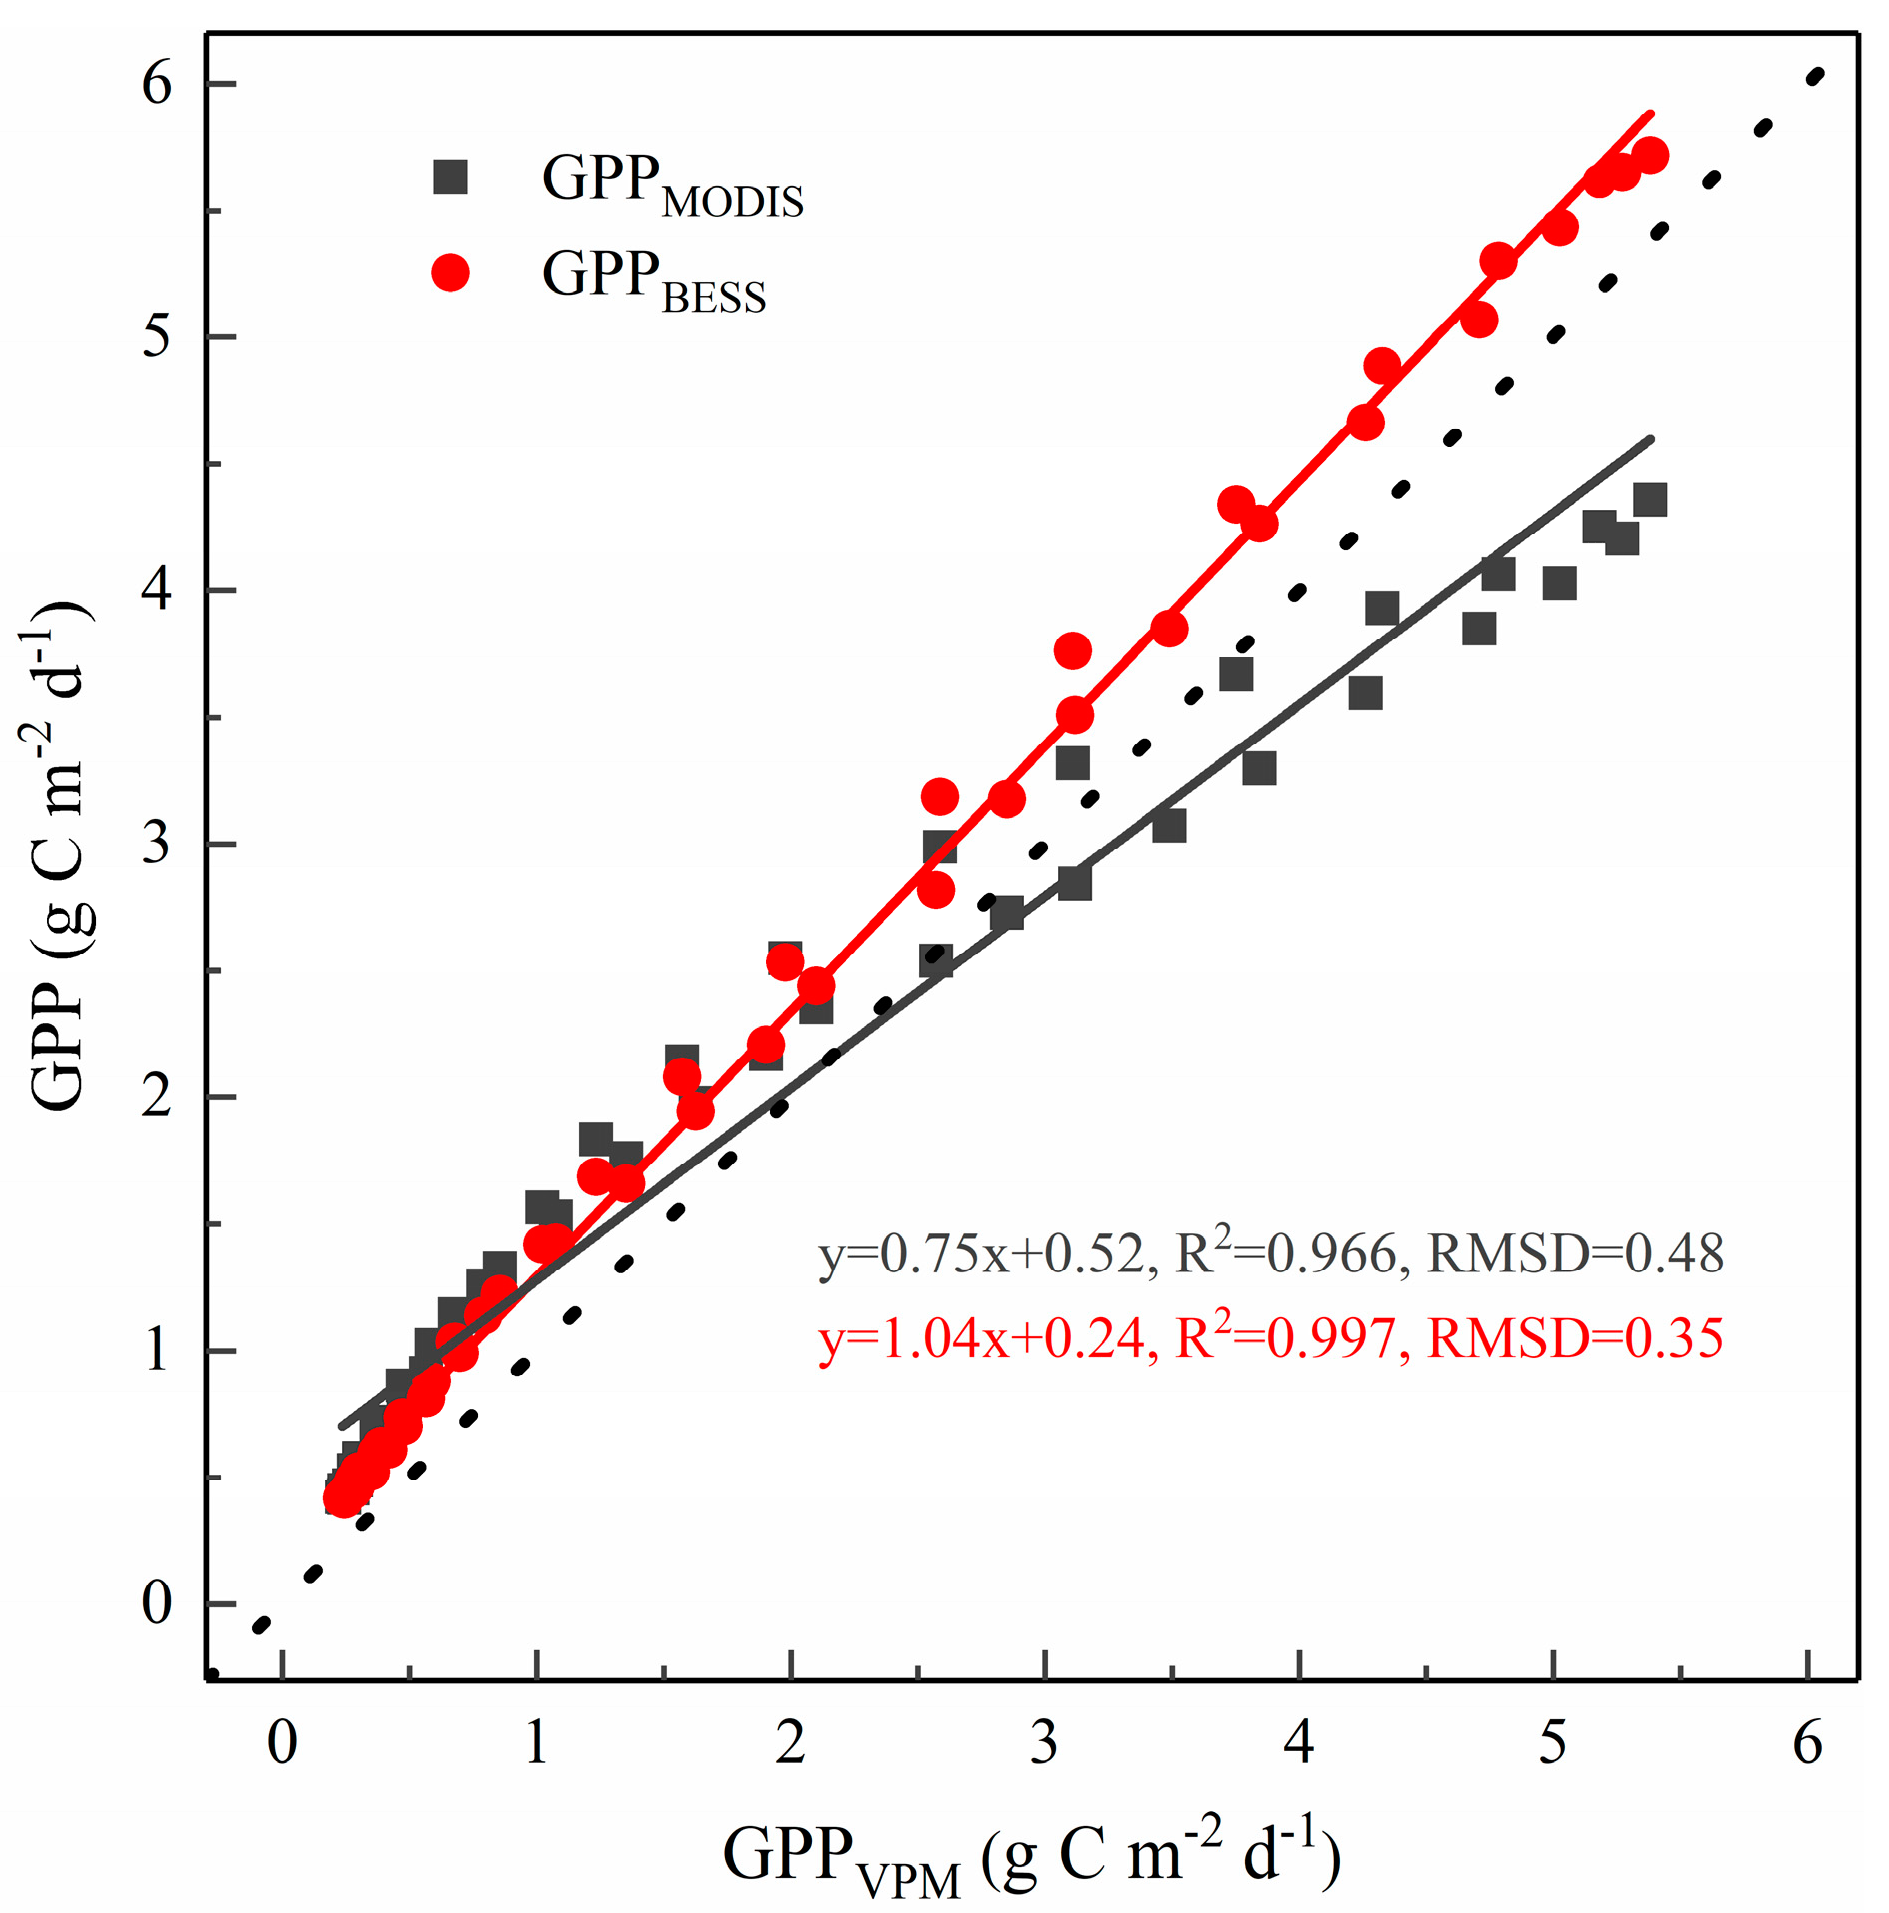
4.3. Associated Performance of the VPM GPP Products

Accurate estimation of GPP of terrestrial vegetation is vital for understanding the global carbon cycles in the face of a changing climate. Multiple GPP products are currently available based on different algorithms, but their performances vary substantially when validated against GPP estimates from eddy covariance data. Recently, many studies indicated that FPARchl can capture well the seasonal variation of vegetation photosynthetic capacity, which greatly improved the seasonal representation of GPP variability [69,70]. Based on the tower-based flux measurements, these VPM products showed superior performance with regard to site-level validations across a wide range of biome types [23,29,71,72]. The developed VPM GPP dataset has been validated against 113 eddy covariance-based flux towers across the globe, with the relatively high accuracy of the VPM GPP V20 [25]. For most biome types, the VPM GPP did not show a systematic bias across different terrestrial ecosystems in a large area. Particularly in the temperate steppe, VPM is an optimal model among eight satellite-based GPP models due to their representation of the effect of water stress on vegetation productivity [73]. Except for the evergreen forests, the VPM GPP dataset underestimated GPP to a certain extent [25]. Overall, VPM GPP offers a reliable GPP estimation in nonforested natural vegetation and cropland by distinguishing the C3/C4 plants [74]. All these improvements aim to solve several critical problems existing in current GPP products. With a satisfactory performance when validated against in situ GPP estimates, this dataset offers an alternative GPP proxy for regional to global carbon cycle studies.

5. Conclusions

Satellite remote sensing observes the land surface continuously, providing a spatial and temporal database for simulating terrestrial GPP from national to global scales. However, there are significant differences in the performance of different remotely-derived GPP products. Spatially, both MODIS and BESS GPP showed an increasing trend from northwest to southeast, which is closely related to the spatial distribution of vegetation cover across China. Temporally, all these GPP products, including BESS, MODIS, and VPM data, exhibited distinct seasonal patterns for an 8-day interval and reached peak values in the summertime. However, the three GPP products performed differently in monitoring the interannual dynamics of vegetation GPP over the eight climate zones across China throughout the years from 2001 to 2015. Particularly, the MODIS GPP products were generally lower than the BESS GPP data due to the influence of C3/C4 plants, except in the humid tropical region (Ⅷ). Further analysis based on the VPM GPP product found that BESS GPP had better consistency than MODIS GPP at the annual and seasonal time scales. In addition, the spatial correlation analysis was applied to investigate the impacts of climate factors (precipitation and temperature) on the variability in GPP over these climate zones. The rising trend of GPP in Northern China can be explained by more precipitation in recent years because natural rainfall was the dominant driver of GPP changes in these areas. However, the uptrend of GPP in Southern China and the Tibet Plateau resulted partially from higher temperatures in these regions as temperature exhibited a positive correlation with GPP. Therefore, our analyses have important implications for evaluating the performance of these satellite-based GPP products across different climate regions. Meanwhile, a multimodel comparison revealed the uncertainties in algorithms and subsequent improvements. With the development of ChinaFLUX and the data sharing policy, it will be feasible to quantitatively assess the reliability of these remotely-derived GPP products in future.

Author Contributions

Conceptualization, Y.C. and X.T.; methodology, Y.C. and X.T.; validation, H.G., M.W. and Q.G.; formal analysis, M.W., Z.D.; data curation, H.G. and M.M.; writing—review and editing, Y.C and X.T.

Funding

This research was funded by the National Key R&D Program of China (2017YFB0503903-3), Chongqing Basic and Frontier Research Program (cstc2018jcyjAX0056), and the Fundamental Research Funds for the Central Universities in China (SWU117035).

Acknowledgments

The meteorological dataset is provided by the Data Center for Resources and Environmental Sciences, Chinese Academy of Sciences (RESDC). We thank the scientists who have made the BESS, MODIS and VPM GPP products available.

Conflicts of Interest

The authors declare no conflict of interest.

References

  1. Liu, Z.; Wang, L.; Wang, S. Comparison of Different GPP Models in China Using MODIS Image and ChinaFLUX Data. Remote Sens. 2014, 6, 10215–10231. [Google Scholar] [CrossRef] [Green Version]
  2. Yu, G.R.; Zhu, X.J.; Fu, Y.L.; He, H.L.; Wang, Q.F.; Wen, X.F.; Li, X.R.; Zhang, L.M.; Zhang, L.; Su, W.; et al. Spatial patterns and climate drivers of carbon fluxes in terrestrial ecosystems of China. Glob. Chang. Biol. 2013, 19, 798–810. [Google Scholar] [CrossRef] [PubMed]
  3. Yuan, W.P.; Cai, W.W.; Liu, D.; DONG, W.J. Satellitebased vegetation production models of terrestrial ecosystem: An overview. Adv. Earth Sci. 2014, 29, 541–550. [Google Scholar]
  4. Cao, M.; Woodward, F.I. Dynamic responses of terrestrial ecosystem carbon cycling to global climate change. Nature 1998, 393, 249–252. [Google Scholar] [CrossRef]
  5. Cramer, W.; Kicklighter, D.W.; Bondeau, A.; Iii, B.M.; Churkina, G.; Nemry, B.; Ruimy, A.; Schloss, A.L.; Intercomparison, T.P. Comparing global models of terrestrial net primary productivity (NPP): Overview and key results. Glob. Chang. Biol. 1999, 5, 1–15. [Google Scholar] [CrossRef]
  6. Scurlock, J.M.O.; Hall, D.O. The global carbon sink: A grassland perspective. Glob. Chang. Biol. 1998, 4, 229–233. [Google Scholar] [CrossRef]
  7. Gao, Y.N.; Yu, G.R.; Zhang, L.; Liu, M.; Huang, M.; Wang, Q.F. The Changes of Net Primary Productivity in Chinese Terrestrial Ecosystem: Based on Process and Parameter Models. Prog. Geogr. 2012, 31, 109–117. [Google Scholar]
  8. Lees, K.J.; Quaife, T.; Artz, R.R.E.; Khomik, M.; Clark, J.M. Potential for using remote sensing to estimate carbon fluxes across northern peatlands—A review. Sci. Total Environ. 2018, 615, 857–874. [Google Scholar] [CrossRef]
  9. Farquhar, G.D.; Caemmerer, S.V.; Berry, J.A. A Biochemical-Model of Photosynthetic CO2 Assimilation in Leaves of C3 Species. Planta 1980, 149, 78–90. [Google Scholar] [CrossRef]
  10. Pury, D.D.; Farquhar, G. Simple scaling of photosynthesis from leaves to canopies without the errors of big-leaf models. Plant Cell Environ. 1997, 20, 537–557. [Google Scholar] [CrossRef]
  11. Xiao, J.; Zhuang, Q.; Baldocchi, D.D.; Law, B.E.; Richardson, A.D.; Chen, J.; Oren, R.; Starr, G.; Noormets, A.; Ma, S.; et al. Estimation of net ecosystem carbon exchange for the conterminous United States by combining MODIS and AmeriFlux data. Agric. For. Meteorol. 2008, 148, 1827–1847. [Google Scholar] [CrossRef] [Green Version]
  12. Tramontana, G.; Jung, M.; Schwalm, C.R.; Ichii, K.; Camps-Valls, G.; Ráduly, B.; Reichstein, M.; Arain, M.A.; Cescatti, A.; Kiely, G.; et al. Predicting carbon dioxide and energy fluxes across global FLUXNET sites with regression algorithms. Biogeosciences 2016, 13, 4291–4313. [Google Scholar] [CrossRef] [Green Version]
  13. Guanter, L.; Zhang, Y.; Jung, M.; Joiner, J.; Voigt, M.; Berry, J.A.; Frankenberg, C.; Huete, A.R.; Zarco-Tejada, P.; Lee, J.E.; et al. Global and time-resolved monitoring of crop photosynthesis with chlorophyll fluorescence. Proc. Natl. Acad. Sci. USA 2014, 111, E1327–E1333. [Google Scholar] [CrossRef] [PubMed] [Green Version]
  14. Running, S.W.; Nemani, R.R.; Heinsch, F.A.; Zhao, M.; Reeves, M.; Hashimoto, H. A continuous satellite-derived measure of global terrestrial primary production. Bioscience 2004, 54, 547–560. [Google Scholar] [CrossRef]
  15. Zhao, M.; Heinsch, F.A.; Nemani, R.R.; Running, S.W. Improvements of the MODIS terrestrial gross and net primary production global data set. Remote Sens. Environ. 2005, 95, 164–176. [Google Scholar] [CrossRef]
  16. Zhao, M.; Running, S.W. Drought-Induced Reduction in Global Terrestrial Net Primary Production from 2000 through 2009. Science 2010, 329, 940–943. [Google Scholar] [CrossRef] [PubMed]
  17. Running, S.; Mu, Q.; Zhao, M. MOD17A2H MODIS/Terra Gross Primary Productivity 8-Day L4 Global 500 m SIN Grid V006; NASA LP DAAC: Washington, DC, USA, 2015. [Google Scholar]
  18. Li, X.; Liang, S.; Yu, G.; Yuan, W.; Cheng, X.; Xia, J.; Zhao, T.; Feng, J.; Ma, Z.; Ma, M.; et al. Estimation of gross primary production over the terrestrial ecosystems in China. Ecol. Model. 2013, 261–262, 80–92. [Google Scholar] [CrossRef]
  19. Liu, Y.; Ju, W.M.; He, H.L.; Wang, S.Q.; Sun, R.; Zhang, Y.D. Changes of net primary productivity in China during recent 11 years detected using an ecological model driven by MODIS data. Front. Earth Sci. 2013, 7, 112–127. [Google Scholar] [CrossRef]
  20. Wang, J.; Dong, J.; Yi, Y.; Lu, G.; Oyler, J.; Smith, W.K.; Zhao, M.; Liu, J.; Running, S. Decreasing net primary production due to drought and slight decreases in solar radiation in China from 2000 to 2012. J. Geophys. Res. 2017, 122, 261–278. [Google Scholar] [CrossRef] [Green Version]
  21. Wei, J.; Chen, Y.; Gu, Q.; Jiang, C.; Ma, M.; Song, L.; Tang, X. Potential of the remotely-derived products in monitoring ecosystem water use efficiency across grasslands in Northern China. Int. J. Remote Sens. 2019, 40, 6203–6223. [Google Scholar] [CrossRef]
  22. Lyapustin, A.; Wang, Y.; Xiong, X.; Meister, G.; Platnick, S.; Levy, R.; Franz, B.; Korkin, S.; Hilker, T.; Tucker, J.; et al. Scientific impact of MODIS C5 calibration degradation and C6+ improvements. Atmos. Meas. Tech. 2014, 7, 4353–4365. [Google Scholar] [CrossRef] [Green Version]
  23. Xiao, X.; Zhang, Q.; Braswell, B.; Urbanski, S.; Boles, S.; Wofsy, S.; Moore, B.; Ojima, D. Modeling gross primary production of temperate deciduous broadleaf forest using satellite images and climate data. Remote Sens. Environ. 2004, 91, 256–270. [Google Scholar] [CrossRef]
  24. Du, L.; Mikle, N.; Zou, Z.; Huang, Y.; Shi, Z.; Jiang, L.; McCarthy, H.R.; Liang, J.; Luo, Y. Global patterns of extreme drought-induced loss in land primary production: Identifying ecological extremes from rain-use efficiency. Sci. Total Environ. 2018, 628–629, 611–620. [Google Scholar] [CrossRef] [PubMed]
  25. Zhang, Y.; Xiao, X.; Wu, X.; Zhou, S.; Zhang, G.; Qin, Y.; Dong, J. A global moderate resolution dataset of gross primary production of vegetation for 2000–2016. Sci. Data 2017, 4, 170165. [Google Scholar] [CrossRef] [PubMed]
  26. Jiang, C.; Ryu, Y. Multi-scale evaluation of global gross primary productivity and evapotranspiration products derived from Breathing Earth System Simulator (BESS). Remote Sens. Environ. 2016, 186, 528–547. [Google Scholar] [CrossRef]
  27. Ryu, Y.; Baldocchi, D.D.; Kobayashi, H.; Van Ingen, C.; Li, J.; Black, T.A.; Beringer, J.; Van Gorsel, E.; Knohl, A.; Law, B.E.; et al. Integration of MODIS land and atmosphere products with a coupled-process model to estimate gross primary productivity and evapotranspiration from 1 km to global scales. Glob. Biogeochem. Cycles 2011, 25. [Google Scholar] [CrossRef] [Green Version]
  28. Zhang, Y.; Xiao, X.; Jin, C.; Dong, J.; Zhou, S.; Wagle, P.; Joiner, J.; Guanter, L.; Zhang, Y.; Zhang, G.; et al. Consistency between sun-induced chlorophyll fluorescence and gross primary production of vegetation in North America. Remote Sens. Environ. 2016, 183, 154–169. [Google Scholar] [CrossRef] [Green Version]
  29. Xiao, X.; Hollinger, D.; Aber, J.; Goltz, M.; Davidson, E.A.; Zhang, Q.; Moore, B. Satellite-based modeling of gross primary production in an evergreen needleleaf forest. Remote Sens. Environ. 2004, 89, 519–534. [Google Scholar] [CrossRef]
  30. Wang, Z.; Xiao, X.; Yan, X. Modeling gross primary production of maize cropland and degraded grassland in northeastern China. Agric. For. Meteorol. 2010, 150, 1160–1167. [Google Scholar] [CrossRef]
  31. Zhou, S.; Zhang, Y.; Ciais, P.; Xiao, X.; Luo, Y.; Caylor, K.K.; Huang, Y.; Wang, G. Dominant role of plant physiology in trend and variability of gross primary productivity in North America. Sci. Rep. 2017, 7, 41366. [Google Scholar] [CrossRef] [Green Version]
  32. Yan, H.; Fu, Y.L.; Xiao, X.M.; Huang, H.Q.; He, H.L.; Ediger, L. Modeling gross primary productivity for winter wheat–maize double cropping system using MODIS time series and CO2 eddy flux tower data. Agric. Ecosyst. Environ. 2009, 129, 391–400. [Google Scholar] [CrossRef]
  33. Zhu, P.; Zhuang, Q.; Ciais, P.; Welp, L.; Li, W.; Xin, Q. Elevated atmospheric CO2 negatively impacts photosynthesis through radiative forcing and physiology-mediated climate feedback. Geophys. Res. Lett. 2017, 44, 1956–1963. [Google Scholar] [CrossRef]
  34. Piao, S.; Sitch, S.; Ciais, P.; Friedlingstein, P.; Peylin, P.; Wang, X.; Ahlstrom, A.; Anav, A.; Canadell, J.G.; Cong, N.; et al. Evaluation of terrestrial carbon cycle models for their response to climate variability and to CO2 trends. Glob. Chang. Biol. 2013, 19, 2117–2132. [Google Scholar] [CrossRef] [PubMed]
  35. Beer, C.; Reichstein, M.; Tomelleri, E.; Ciais, P.; Jung, M.; Carvalhais, N.; Rödenbeck, C.; Arain, M.A.; Baldocchi, D.; Bonan, G.B.; et al. Terrestrial gross carbon dioxide uptake: Global distribution and covariation with climate. Science 2010, 329, 834–838. [Google Scholar] [CrossRef] [PubMed]
  36. Grubb, M.; Sha, F.; Spencer, T.; Hughes, N.; Zhang, Z.X.; Agnolucci, P. A review of Chinese CO2 emission projections to 2030: The role of economic structure and policy. Clim. Pol. 2015, 15, S7–S39. [Google Scholar] [CrossRef]
  37. IPCC. Climate Change 2007: The Physical Science Basis: Contribution of Working Group I to the Fourth Assessment Report of the Intergovernmental Panel on Climate Change; Cambridge University Press: Cambridge, UK, 2007; pp. 1–996. [Google Scholar]
  38. Zhao, D.; Wu, S. Responses of vegetation distribution to climate change in China. Theor. Appl. Climatol. 2013, 117, 15–28. [Google Scholar] [CrossRef]
  39. TCNARCC (Taskforce on China’s National Assessment Report on Climate Change). China’s National Assessment Report on Climate Change; TCNARCC: Beijing, China, 2011. [Google Scholar]
  40. Yao, Y.; Wang, X.; Li, Y.; Wang, T.; Shen, M.; Du, M.; He, H.; Li, Y.; Luo, W.; Ma, M.; et al. Spatiotemporal pattern of gross primary productivity and its covariation with climate in China over the last thirty years. Glob. Chang. Biol. 2018, 24, 184–196. [Google Scholar] [CrossRef]
  41. Piao, S.; Ciais, P.; Lomas, M.; Beer, C.; Liu, H.Y.; Fang, J.Y.; Friedlingstein, P.; Huang, Y.; Muraoka, H.; Son, Y.H.; et al. Contribution of climate change and rising CO2 to terrestrial carbon balance in East Asia: A multi-model analysis. Glob. Planet. Chang. 2011, 75, 133–142. [Google Scholar] [CrossRef]
  42. Zhao, D.S.; Wu, S.H.; Yin, Y.H.; Yin, Z.Y. Vegetation distribution on Tibetan Plateau under climate change scenario. Reg. Environ. Chang. 2011, 11, 905–915. [Google Scholar] [CrossRef]
  43. Chen, H.; Sun, J. Drought Response to Air Temperature Change over China on the Centennial Scale. Atmos. Ocean. Sci. Lett. 2015, 8, 113–119. [Google Scholar]
  44. Xu, L.; Wen, D.; Zhu, J.; He, N. Regional variation in carbon sequestration potential of forest ecosystems in China. Chin. Geogr. Sci. 2017, 27, 337–350. [Google Scholar] [CrossRef] [Green Version]
  45. Liu, Z.; Shao, Q.; Liu, J. The Performances of MODIS-GPP and -ET Products in China and Their Sensitivity to Input Data (FPAR/LAI). Remote Sens. 2014, 7, 135–152. [Google Scholar] [CrossRef]
  46. Tang, X.; Li, H.; Huang, N.; Li, X.; Xu, X.; Ding, Z.; Xie, J. A comprehensive assessment of MODIS-derived GPP for forest ecosystems using the site-level FLUXNET database. Environ Earth Sci. 2015, 74, 5907–5918. [Google Scholar] [CrossRef]
  47. Monteith, J.L. Solar Radiation and Productivity in Tropical Ecosystems. J. Appl. Ecol. 1972, 9, 747–766. [Google Scholar] [CrossRef]
  48. Collatz, G.J.; Ribas-Carbo, M.; Berry, J.A. Coupled photosynthesis-stomatal conductance model for leaves of C4 plants. Aust. J. Plant Physiol. 1992, 19, 519–539. [Google Scholar] [CrossRef]
  49. Paw, T.P. Mathematical analysis of the operative temperature and energy budget. J. Therm. Biol. 1987, 12, 227–233. [Google Scholar]
  50. Gao, W. Applications of solutions to non-linear energy budget equations. Agric. For. Meteorol. 1988, 43, 121–145. [Google Scholar]
  51. Huete, A.; Didan, K.; Miura, T.; Rodriguez, E.P.; Gao, X.; Ferreira, L.G. Overview of the radiometric and biophysical performance of the MODIS vegetation indices. Remote Sens. Environ. 2002, 83, 195–213. [Google Scholar] [CrossRef]
  52. Xiao, X.; Boles, S.; Frolking, S.; Salas, W.; Moore, B., III; Li, C.; He, L.; Zhao, R. Observation of flooding and rice transplanting of paddy rice fields at the site to landscape scales in China using VEGETATION sensor data. Int. J. Remote Sens. 2002, 23, 3009–3022. [Google Scholar] [CrossRef]
  53. Xiao, X.; Zhang, Q.; Hollinger, D.; Aber, J.; MooreIii, B. Modeling gross primary production of an evergreen needeleleaf forest using MODIS and climate data. Ecol. Appl. 2005, 15, 954–969. [Google Scholar] [CrossRef]
  54. Friedl, M.A.; SullaMenashe, D.; Tan, B.; Schneider, A.; Ramankutty, N.; Sibley, A.; Huang, X.M. MODIS Collection 5 global land cover: Algorithm refinements and characterization of new datasets. Remote Sens. Environ. 2010, 114, 168–182. [Google Scholar] [CrossRef]
  55. Yu, W.; Liu, Q.; Li, J.; Zeng, Y.L.; Yin, G.F.; Zhao, J.; Xu, B.D. Extraction and analysis of land cover heterogeneity over China. Adv. Earth Sci. 2016, 31, 1067–1077. [Google Scholar]
  56. Nakaji, T.; Kosugi, Y.; Takanashi, S.; Niiyama, K.; Noguchi, S.; Tani, M.; Oguma, H.; Nik, A.R.; Kassim, A.R. Estimation of light-use efficiency through a combinational use of the photochemical reflectance index and vapor pressure deficit in an evergreen tropical rainforest at Pasoh, Peninsular Malaysia. Remote Sens. Environ. 2014, 150, 82–92. [Google Scholar] [CrossRef] [Green Version]
  57. Zhang, M.; Yu, G.R.; Zhuang, J.; Gentry, R.; Fu, Y.L.; Sun, X.M.; Zhang, L.M.; Wen, X.F.; Wang, Q.F.; Han, S.J.; et al. Effects of cloudiness change on net ecosystem exchange, light use efficiency, and water use efficiency in typical ecosystems of China. Agric. For. Meteorol. 2011, 151, 803–816. [Google Scholar] [CrossRef]
  58. Propastin, P.; Ibrom, A.; Knohl, A.; Erasmi, S. Effects of canopy photosynthesis saturation on the estimation of gross primary productivity from MODIS data in a tropical forest. Remote Sens. Environ. 2012, 121, 252–260. [Google Scholar] [CrossRef]
  59. Tang, X.; Li, H.; Desai, A.R.; Nagy, Z.; Luo, J.; Kolb, T.E.; Olioso, A.; Xu, X.; Yao, L.; Kutsch, W.; et al. How is water-use efficiency of terrestrial ecosystems distributed and changing on Earth? Sci. Rep. 2014, 4, 7483. [Google Scholar] [CrossRef]
  60. Yan, H.; Wang, S.-Q.; Billesbach, D.; Oechel, W.; Bohrer, G.; Meyers, T.; Martin, T.A.; Matamala, R.; Phillips, R.P.; Rahman, F.; et al. Improved global simulations of gross primary product based on a new definition of water stress factor and a separate treatment of C3 and C4 plants. Ecol. Model. 2015, 297, 42–59. [Google Scholar] [CrossRef]
  61. Tang, X.; Li, H.P.; Griffis, J.T.; Xu, X.B.; Ding, Z.; Liu, G.H. Tracking ecosystem water use efficiency of cropland by exclusive use of MODIS EVI data. Remote Sens. 2015, 7, 11016–11035. [Google Scholar] [CrossRef]
  62. Brown, S. Measuring carbon in forests: Current status and future challenges. Environ. Pollut. 2002, 116, 363–372. [Google Scholar] [CrossRef]
  63. Barman, R.; Jain, A.K.; Liang, M. Climate-driven uncertainties in modeling terrestrial gross primary production: A site level to global-scale analysis. Glob. Chang. Biol. 2014, 20, 1394–1411. [Google Scholar] [CrossRef]
  64. Dong, W.; Jiang, Y.; Yang, S. Response of the starting dates and the lengths of seasons in Mainland China to global warming. Clim. Chang. 2009, 99, 81–91. [Google Scholar] [CrossRef]
  65. Zhai, P.; Pan, X. Trends in temperature extremes during 1951–1999 in China. Geophys. Res. Lett. 2003, 30, 1913. [Google Scholar] [CrossRef]
  66. Wang, H.-J.; Sun, J.-Q.; Chen, H.-P.; Zhu, Y.-L.; Zhang, Y.; Jiang, D.-B.; Lang, X.-M.; Fan, K.; Yu, E.-T.; Yang, S. Extreme climate in China: Facts, simulation and projection. Meteorol. Z. 2012, 21, 279–304. [Google Scholar] [CrossRef]
  67. Lu, R.-Y.; Chen, R.-D. A review of recent studies on extreme heat in China. Atmos. Ocean. Sci. Lett. 2016, 9, 114–121. [Google Scholar] [CrossRef]
  68. Yan, H.; Wang, S.-Q.; Wang, J.-B.; Lu, H.-Q.; Guo, A.-H.; Zhu, Z.-C.; Myneni, R.B.; Shugart, H.H. Assessing spatiotemporal variation of drought in China and its impact on agriculture during 1982–2011 by using PDSI indices and agriculture drought survey data. J. Geophys. Res. Atmos. 2016, 121, 2283–2298. [Google Scholar] [CrossRef]
  69. Zhang, Q.; Middleton, E.M.; Margolis, H.A.; Drolet, G.; Barr, A.G.; Black, T.A. Can a satellite-derived estimate of the fraction of PAR absorbed by chlorophyll (FAPARchl) improve predictions of light-use efficiency and ecosystem photosynthesis for a boreal aspen forest? Remote Sens. Environ. 2009, 113, 880–888. [Google Scholar] [CrossRef]
  70. Zhang, Q.; Cheng, Y.-B.; Lyapustin, A.I.; Wang, Y.; Gao, F.; Suyker, A.; Verma, S.; Middleton, E.M. Estimation of crop gross primary production (GPP): fAPARchl versus MOD15A2 FPAR. Remote Sens. Environ. 2014, 153, 1–6. [Google Scholar] [CrossRef] [Green Version]
  71. Jin, C.; Xiao, X.; Merbold, L.; Arneth, A.; Veenendaal, E.; Kutsch, W.L. Phenology and gross primary production of two dominant savanna woodland ecosystems in Southern Africa. Remote Sens. Environ. 2013, 135, 189–201. [Google Scholar] [CrossRef]
  72. Wang, J.; Xiao, X.; Wagle, P.; Ma, S.; Baldocchi, D.; Carrara, A.; Zhang, Y.; Dong, J.; Qin, Y. Canopy and climate controls of gross primary production of Mediterranean-type deciduous and evergreen oak savannas. Agric. For. Meteorol. 2016, 226–227, 132–147. [Google Scholar] [CrossRef]
  73. Zhang, L.; Zhou, D.; Fan, J.; Guo, Q.; Chen, S.; Wang, R.; Li, Y. Contrasting the Performance of Eight Satellite-Based GPP Models in Water-Limited and Temperature-Limited Grassland Ecosystems. Remote Sens. 2019, 11, 1333. [Google Scholar] [CrossRef]
  74. Yuan, W.; Cai, W.; Nguy-Robertson, A.; Fang, H.; Suyker, A.; Chen, Y.; Dong, W.; Liu, S.; Zhang, H. Uncertainty in simulating gross primary production of cropland ecosystem from satellite-based models. Agric. For. Meteorol. 2015, 207, 48–57. [Google Scholar] [CrossRef] [Green Version]
Figure 1. Climate zones and vegetation types in China. The base map is derived from moderate resolution imaging spectroradiometer (MODIS) product MCD12Q1 C5.5 (500 m spatial resolution) based on the University of Maryland (UMD) global vegetation classification scheme in 2010. (Ⅰ) Cold temperate humid region, (Ⅱ) midtemperate humid region, (Ⅲ) midtemperate semiarid region, (Ⅳ) warm temperate arid region, (Ⅴ) warm temperate subhumid region, (Ⅵ) plateau zone, (Ⅶ) subtropical humid region, and (Ⅷ) tropical humid region.
Remotesensing 11 01855 g001
Figure 2. Spatial distribution of multiyear mean GPP across China from 2001 to 2015. (a) and (b) represent MODIS and breathing Earth system simulator (BESS) GPP, respectively. The black line delineates the boundary of eight climate zones. The insert shows the full southern extent of China’s islands.
Remotesensing 11 01855 g002
Figure 3. Comparison of multiyear mean MODIS and BESS GPP over the eight climate zones in China from 2001 to 2015. Error bars represent ±1 standard error. The asterisks mean significantly different for GPP values in 2001–2015 (p < 0.05).
Remotesensing 11 01855 g003
Figure 4. Seasonal dynamics of multiyear average MODIS GPP, BESS GPP, and vegetation photosynthesis model (VPM) GPP at an 8-day interval from 2001 to 2015 across China. DOY represents “day of the year”. The error bars mean the standard error.
Remotesensing 11 01855 g004
Figure 5. Gray rectangles and red dots show the intercomparison between the MODIS and BESS GPP products against the VPM GPP estimates at an 8-day period, respectively. The dashed line represents the 1:1 line, and the red and gray lines represent the linear fits.
Remotesensing 11 01855 g005
Figure 6. Interannual dynamics of the average MODIS GPP, BESS GPP, and VPM GPP over the eight climatic zones from 2001 to 2015 with linear trend k and significance levels (p < 0.01 is highly significant, and p < 0.05 is significant); r and r’ represented the correlations between the auxiliary VPM GPP with the MODIS and BESS GPP, respectively.
Remotesensing 11 01855 g006
Figure 7. (a) and (b) represent the spatial patterns of MODIS GPP in 2014 and 2015, respectively. (c) provides an overlay of (a) and (b), with the red box encompassing an area where numerous zero values for GPP were obtained in 2015.
Remotesensing 11 01855 g007
Figure 8. Spatial correlations between annual mean BESS GPP and the corresponding temperature (a) and precipitation (b) across different climate zones in China from 2001 to 2015.
Remotesensing 11 01855 g008
Table 1. Datasets of the satellite-based gross primary production (GPP) used in this study.
ProductDescriptionSpatial ResolutionTemporal ResolutionRelease Time
MODISMODIS GPP product derived from satellite observations (MOD17A2H.006)500 mday10/2015
BESSBESS GPP product derived from a process-based model1 km8-day9/2016
VPMVPM GPP product derived from MODIS observations and NCEP Reanalysis II climate data0.05°8-day10/2017
Table 2. Area statistic of the correlations between annual mean BESS GPP and the corresponding temperature and precipitation in China from 2001 to 2015.
LevelRangeProportion of Area (GPP–Temperature)Proportion of Area (GPP–Precipitation)
Highly negative correlation<–0.60.84%1.60%
Moderate negative correlation−0.6~−0.39.77%13.64%
Low negative correlation−0.3~030.28%28.92%
Low positive correlation0~0.337.37%30.66%
Moderate positive correlation0.3~0.619.47%19.99%
Highly positive correlation>0.62.27%5.19%

