Article

Intelligent GPS L1 LOS/Multipath/NLOS Classifiers Based on Correlator-, RINEX- and NMEA-Level Measurements

1
Interdisciplinary Division of Aeronautical and Aviation Engineering, The Hong Kong Polytechnic University, Kowloon, Hong Kong, China
2
Tianjin Key Lab for Advanced Signal Processing, Civil Aviation University of China, Tianjin 300300, China
3
Radar Research Lab, School of Information and Electronics, Beijing Institute of Technology, Beijing 100081, China
4
Department of Geomatics Engineering, University of Calgary, Calgary, AB T2N 1N4, Canada
*
Author to whom correspondence should be addressed.
Remote Sens. 2019, 11(16), 1851; https://doi.org/10.3390/rs11161851
Submission received: 24 June 2019 / Revised: 22 July 2019 / Accepted: 6 August 2019 / Published: 8 August 2019
(This article belongs to the Special Issue Global Navigation Satellite Systems for Earth Observing System)

Abstract

:
This paper proposes to use a correlator-level global positioning system (GPS) line-of-sight/multipath/non-line-of-sight (LOS/MP/NLOS) signal reception classifier to improve positioning performance in an urban environment. Conventional LOS/MP/NLOS classifiers, referred to as national marine electronics association (NMEA)-level and receiver independent exchange format (RINEX)-level classifiers, are usually performed using attributes extracted from basic observables or measurements such as received signal strength, satellite elevation angle, code pseudorange, etc. The NMEA/RINEX-level classification rate is limited because the complex signal propagation in urban environment is not fully manifested in these end attributes. In this paper, LOS/MP/NLOS features were extracted at the baseband signal processing stage. Multicorrelator is implemented in a GPS software-defined receiver (SDR) and exploited to generate features from the autocorrelation function (ACF). A robust LOS/MP/NLOS classifier using a supervised machine learning algorithm, support vector machine (SVM), is then trained. It is also proposed that the Skymask and code pseudorange double difference observable are used to label the real signal type. Raw GPS intermediate frequency data were collected in urban areas in Hong Kong and were postprocessed using a self-developed SDR, which can easily output correlator-level LOS/MP/NLOS features. The SDR measurements were saved in the file with the format of NMEA and RINEX. A fair comparison among NMEA-, RINEX-, and correlator-level classifiers was then carried out on a common ground. Results show that the correlator-level classifier improves the metric of F1 score by about 25% over the conventional NMEA- and RINEX-level classifiers for testing data collected at different places to that of training data. In addition to this finding, correlator-level classifier is found to be more feasible in practical applications due to its less dependency on surrounding scenarios compared with the NMEA/RINEX-level classifiers.

Graphical Abstract

1. Introduction

In recent years, there has been significant research conducted to improve global navigation satellite system (GNSS) performance in urban environments [1,2,3,4]. One of the most noticeable techniques is three-dimensional mapping-aided (3DMA) GNSS positioning, which uses three-dimensional (3D) mapping data to improve positioning accuracy in dense urban areas. The 3DMA technique can be broadly divided into two groups, i.e., ranging-based 3DMA positioning and shadow matching. The former, like the conventional GNSS positioning algorithm, still makes use of pseudorange measurements, meanwhile it is aided with the information of satellite visibility or additional path delay of reflected signals obtained using 3D city models. For shadow matching, the basic idea is to compare the measured signal availability and strength with predictions obtained using 3D city models over a range of candidate positions. For detailed implementation of 3DMA GNSS positioning, readers are referred to [5,6,7,8,9,10]. For the 3DMA GNSS positioning, the accuracy of line-of-sight/non-line-of-sight (LOS/NLOS) signal reception classification directly affects its performance [5]. In addition to the 3DMA GNSS positioning, conventional ranging-based least-squares GNSS positioning can also benefit from an accurate signal classification by excluding or down-weighting the identified multipath (MP)/NLOS measurements [11].
Various approaches to classifying LOS/NLOS signal have been proposed. As mentioned above, the 3D city model can predict the satellite visibility, but with a prerequisite of accurate user location. Another straightforward method is the usage of additional hardware sensors, e.g., dual-polarization antenna [12], array antenna [13], panoramic sky-pointing camera [14,15], 3D light detection and ranging (LiDAR) [16], inertial navigation system (INS) [17], etc. The effectiveness of these additional aiding-based techniques has been verified. However, the issue of large physical size and high cost needs to be addressed before being applied to low-cost receivers, which occupy a large portion of mass-market GNSS capable devices.
Machine learning algorithms with nonlinear kernel functions can classify nonlinearly separable data instances by projecting the data features into a higher-dimensional space and maximizing the geometric distance between the decision boundary and the nearest data on each side of the decision boundary [18]. It has been used extensively in classification applications, e.g., the GNSS receiver context and channel classification [18,19] and GNSS signal type classification [20]. This method requires no additional aiding, making it more feasible in practice. The key element of the machine learning technique is the selection of features for recognition. Conventional machine learning-based GNSS signal classifier usually uses features extracted from the basic observables and measurements, like signal strength or carrier-to-noise-ratio ( C / N 0 ), satellite elevation angle, code pseudorange measurement, etc. In this paper, these kinds of features were referred to as national marine electronics association (NMEA)-level or receiver independent exchange format (RINEX)-level features as they can be obtained from the commonly used NMEA/RINEX files. Our previous study achieved a 75% of LOS/MP/NLOS classification rate using a support vector machine (SVM) classifier based on signal strength and the difference between delta pseudorange and pseudorange rate [21]. Note that, in [21], data collected at the same location were used as both training and testing data, and a ten-fold classification was carried out. The trained SVM model was not applied to test data collected at different places. An accuracy of 91.8% was reported in [20] for both training data and testing data collected at the same place. However, the accuracy was degraded to less than 75.0% for testing data collected at a different location, indicating the sensitivity issue of NMEA/RINEX-level classifiers, which will limit its application in practice. Other than the classification rate, as introduced in [22], a confidence value of the classification is also provided using the robust decision tree-based LOS/NLOS classifier. This method, however, should make a trade-off between high accuracy and low computational load. Besides, this method only deals with the LOS/NLOS classification. In fact, the identification of MP will be helpful for improving GNSS positioning in urban canyons.
NMEA/RINEX-level classification rate is limited because the complex signal propagation in urban environment is not fully manifested in these end attributes. With the availability of GNSS raw measurements in mass-market devices, e.g., tablets and smartphones with Android 7 operating system [23], deeper-level GNSS measurements are accessible, such as carrier phase, code pseudorange, navigation message bits, correlation result of each channel [24]. This opens the door to develop a more advanced GNSS positioning algorithm, including signal type classification at a deeper level. In fact, correlator-level parameters have drawn much attention for better GNSS performance. In [
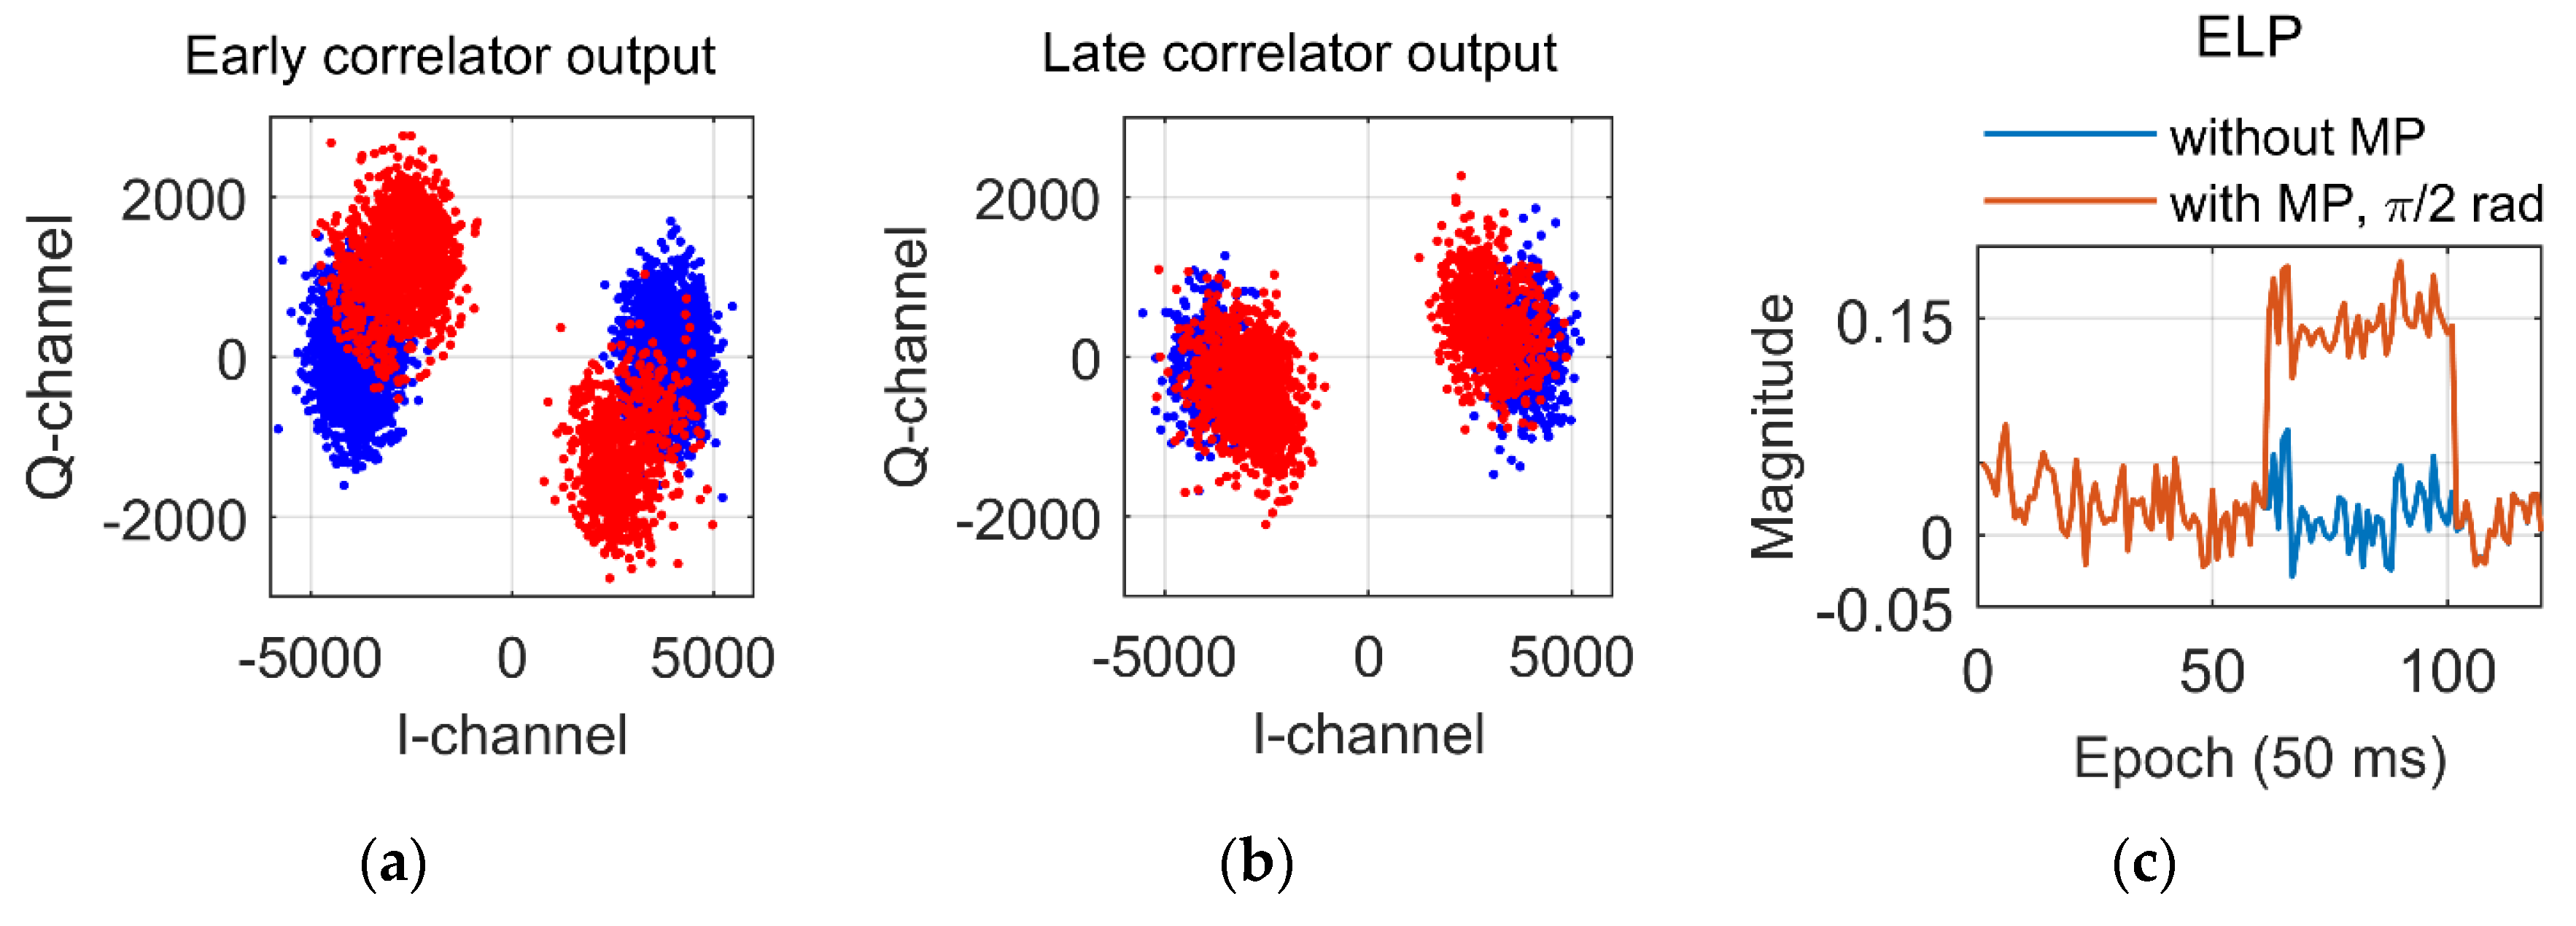
25], the carrier phase delay between the LOS and reflected signals is considered to develop a new variable referred to as early late phase (ELP) for MP detection. In [26], the author proposed to identify the NLOS reception by constructing a classifier using features extracted from multiple autocorrelation functions (MACF) in a software-defined receiver (SDR) [27]. The basic principle behind this is that the NLOS reception distorts the autocorrelation function (ACF) of the direct LOS signal. Features for multipath classification were also extracted from the correlation sequences in [18]. Authors in [28] used the code discriminator output and the mean and variance of the slope of the correlation curve to monitor the signal quality. In a more recent paper [
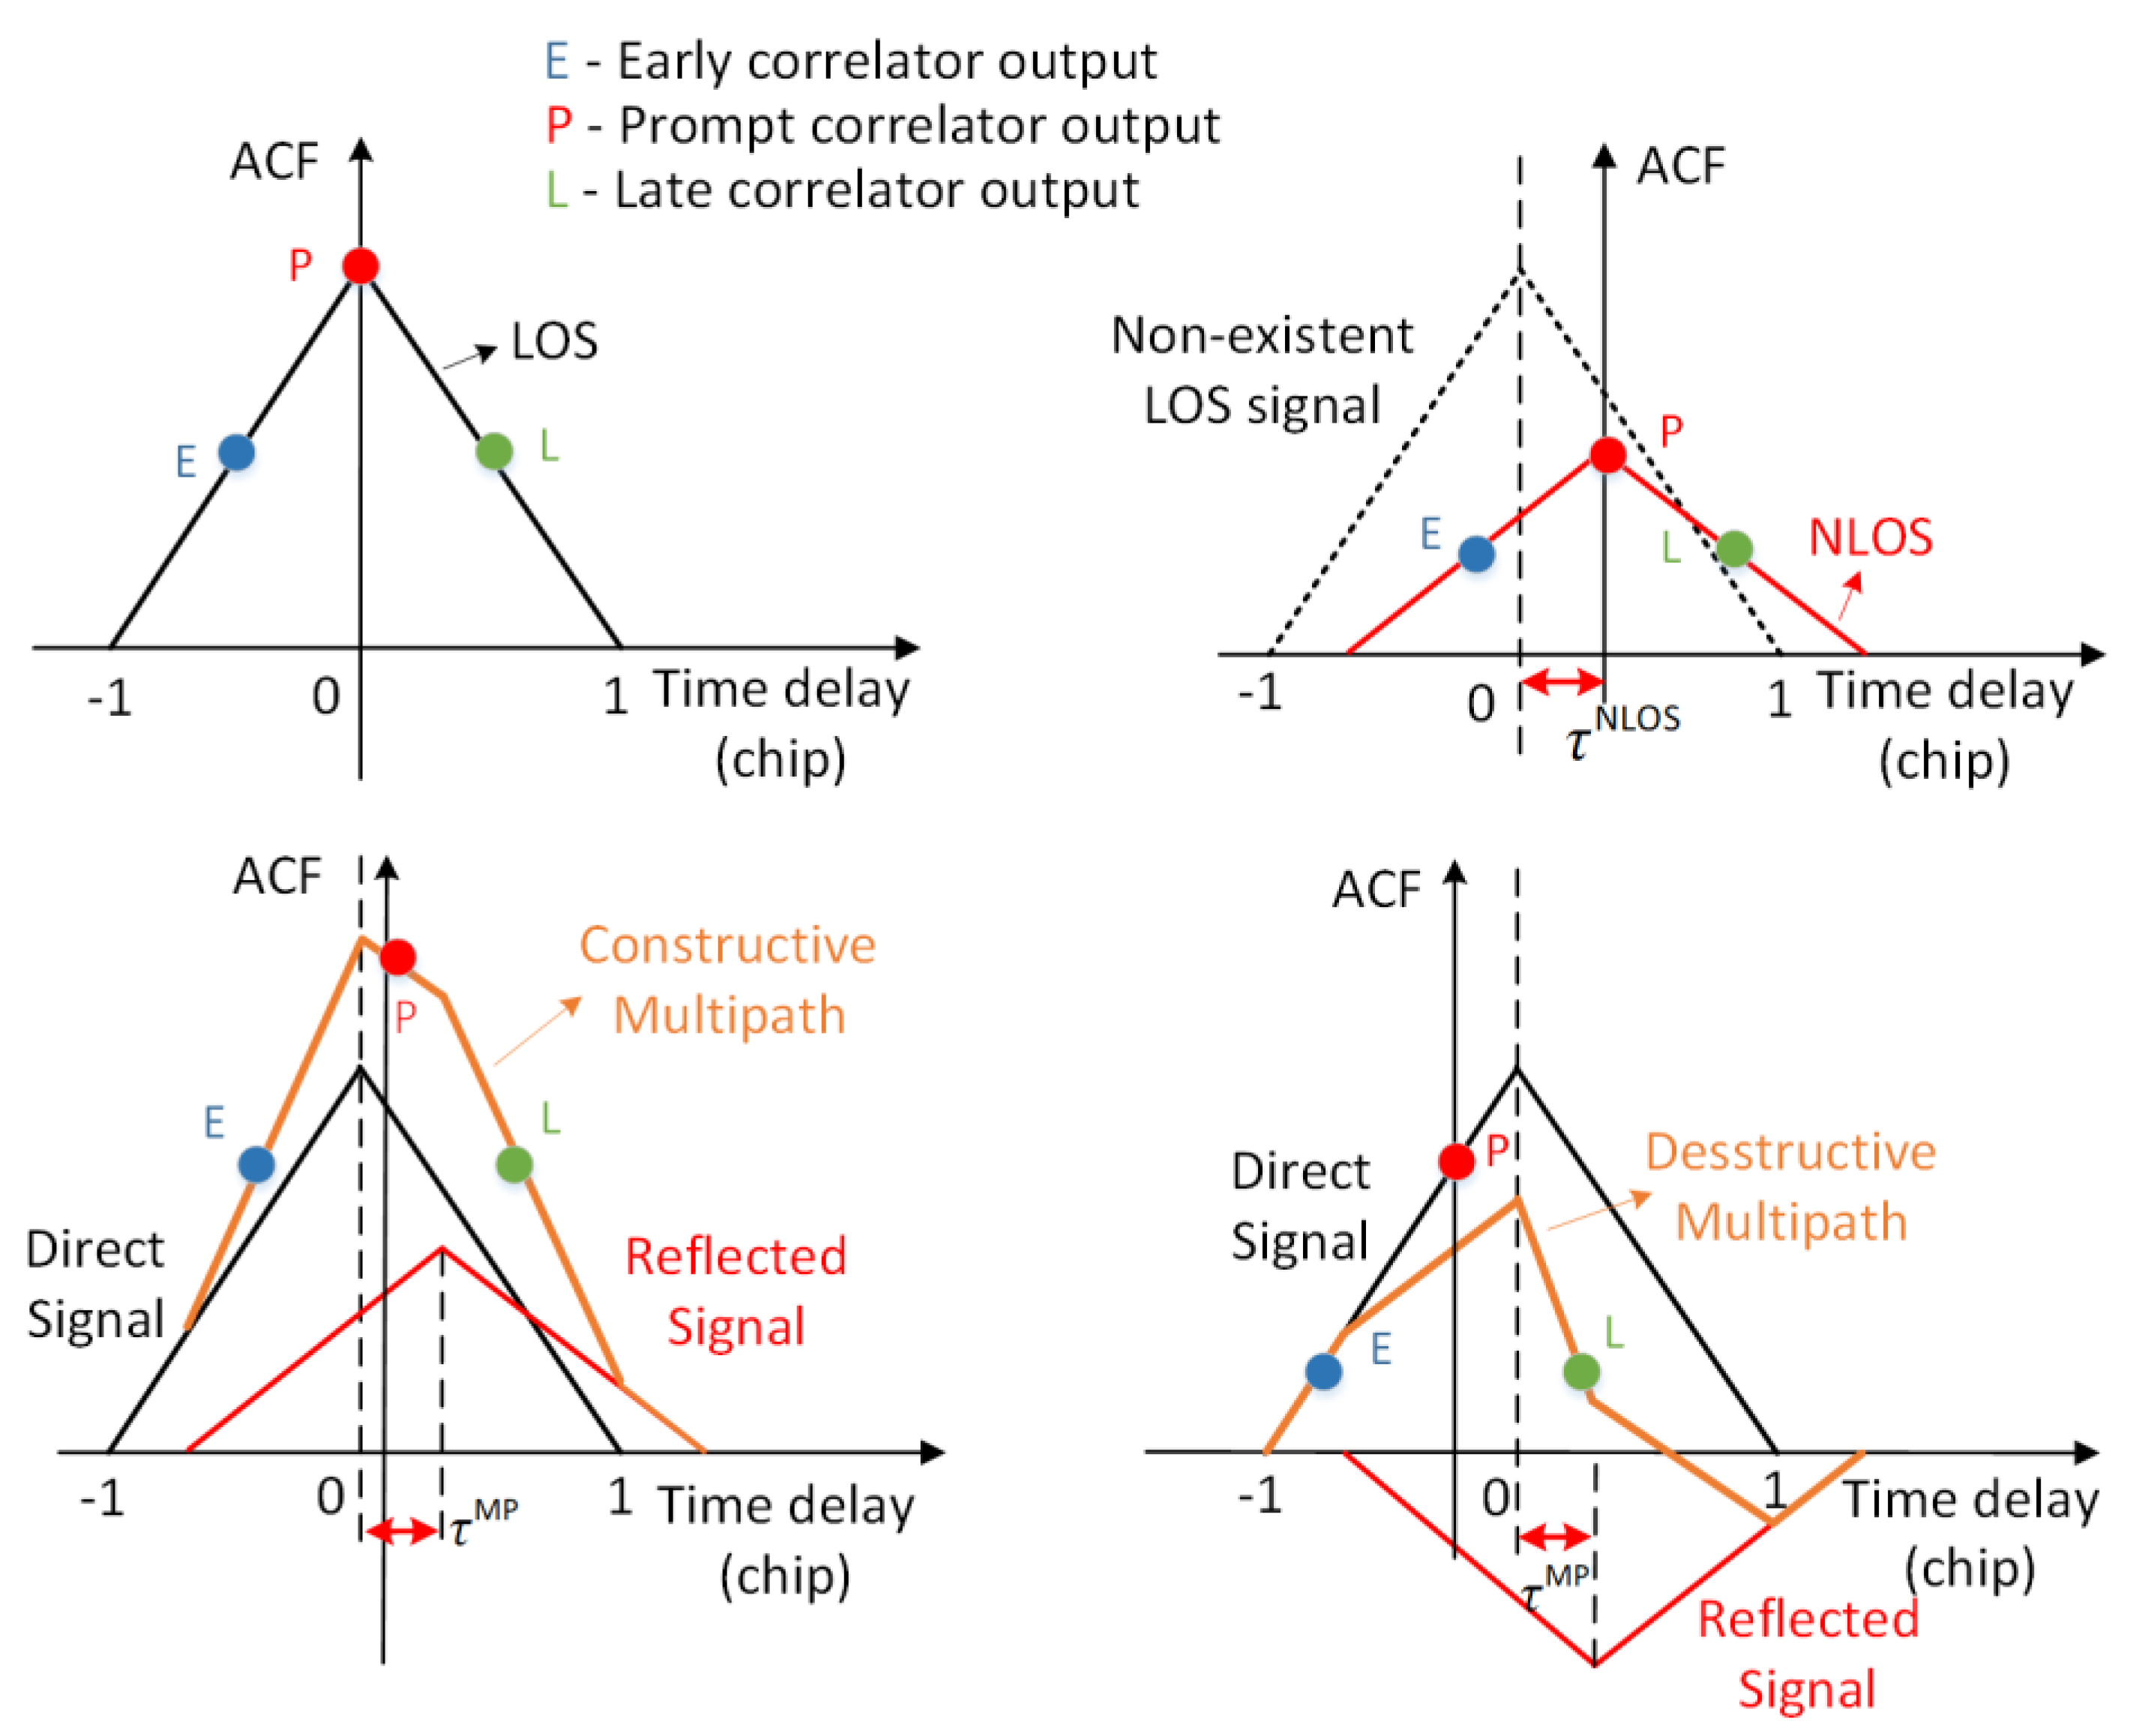
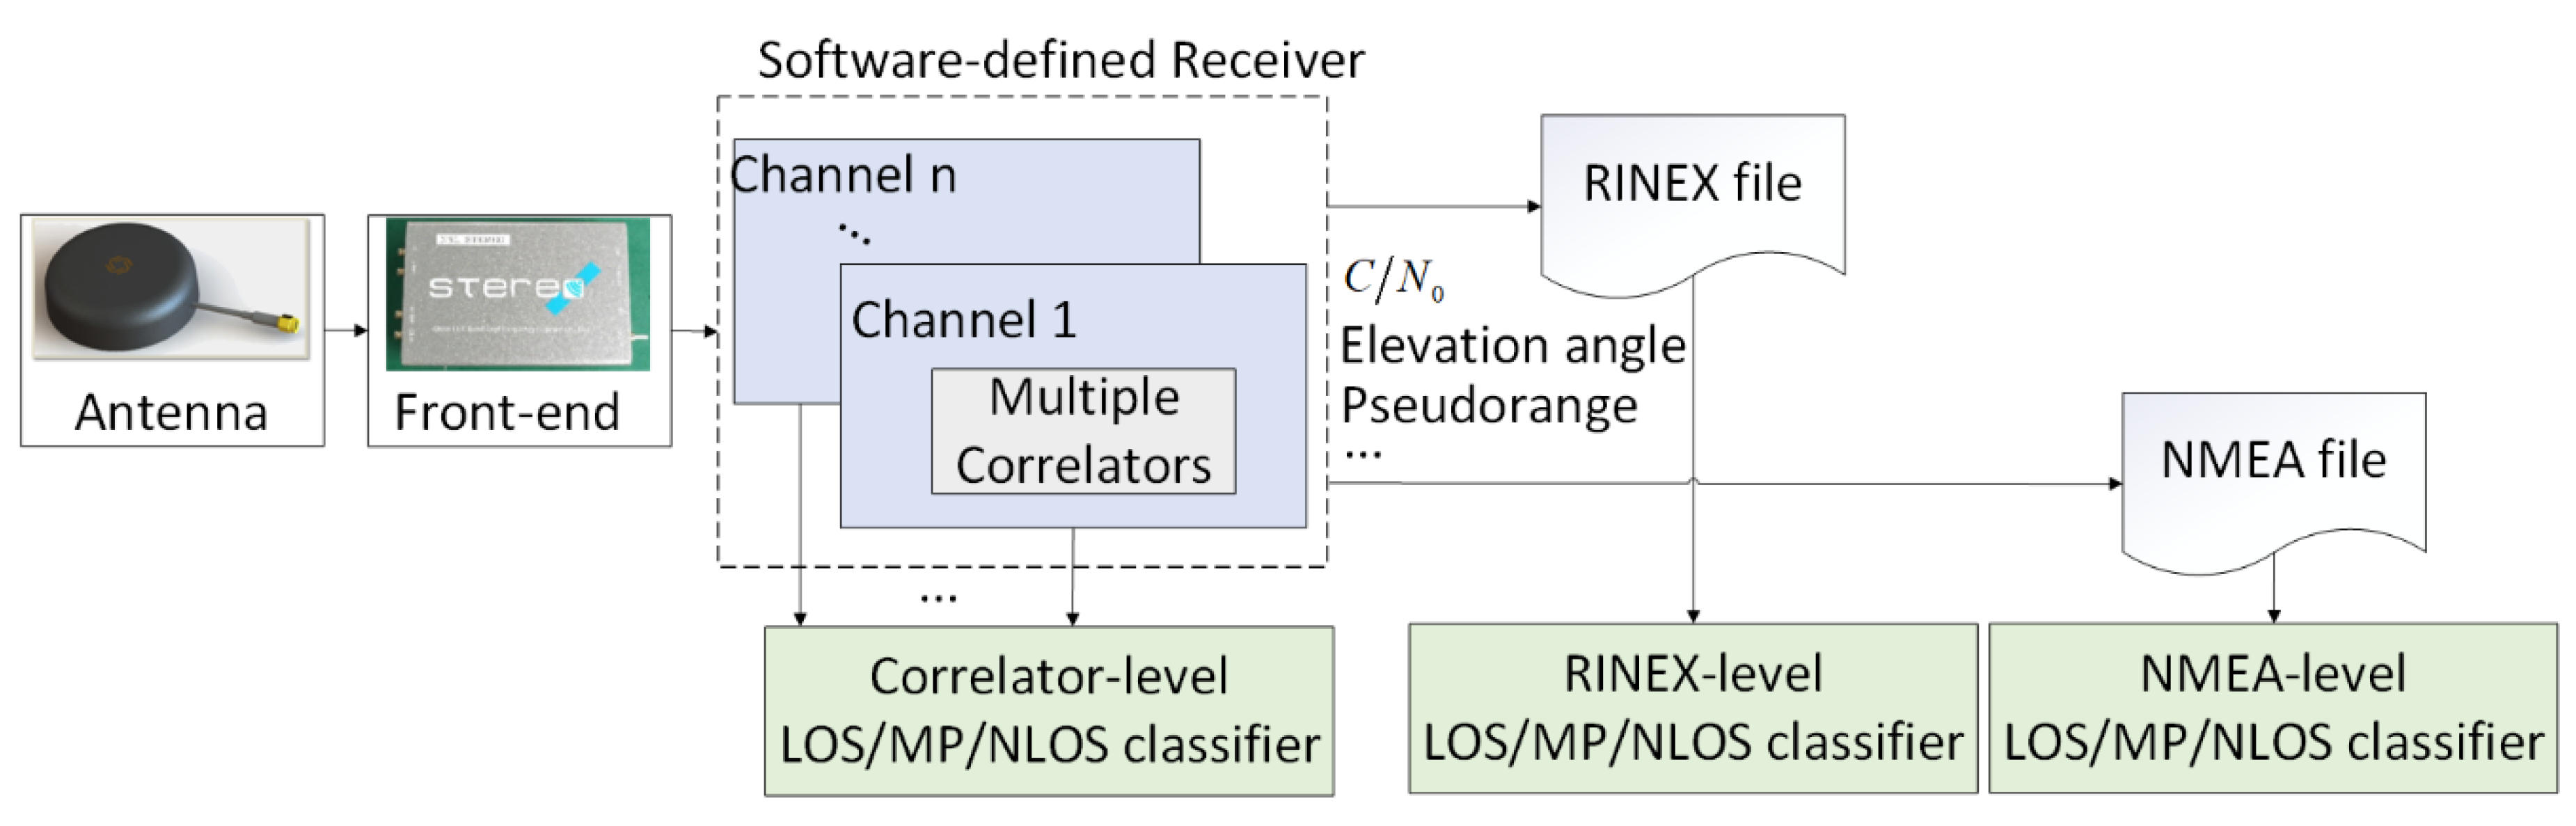
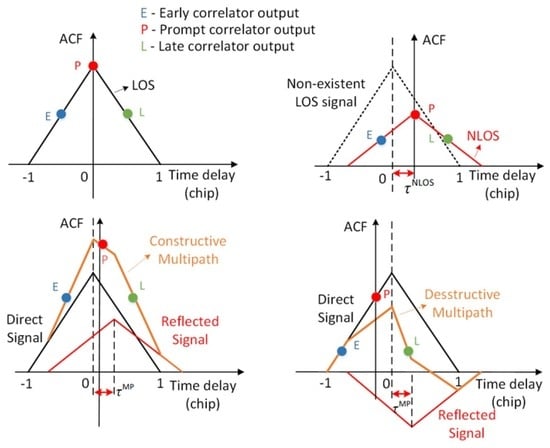
29], the authors reported the indoor LOS/MP signal classification performance using a deep leaning approach based on the tracking outputs of a pseudolite signal. In this paper, the signal type classifier using tracking loop parameters is referred to as correlator-level classifier for simplicity. Despite these efforts, there is a lack of performance assessment of correlator-level classifier in urban areas for LOS/MP/NLOS classification and its comparison with the commonly used NMEA- and RINEX-level classifiers, which is the main objective of this paper. To accomplish this objective, LOS/MP/NLOS effects on code autocorrelation function will be analyzed, based on which correlator-level features will be extracted, and a fair comparison of the performance of NMEA-, RINEX-, and correlator-level classifiers will be carried out. Correlator-level measurements like multicorrelator outputs, and NMEA/RINEX-level observables such as signal strength, satellite elevation angle, code pseudorange, etc., will be outputted from the same receiver. In this way, a fair comparison based on a common ground is guaranteed, which is one of the contributions of this paper.
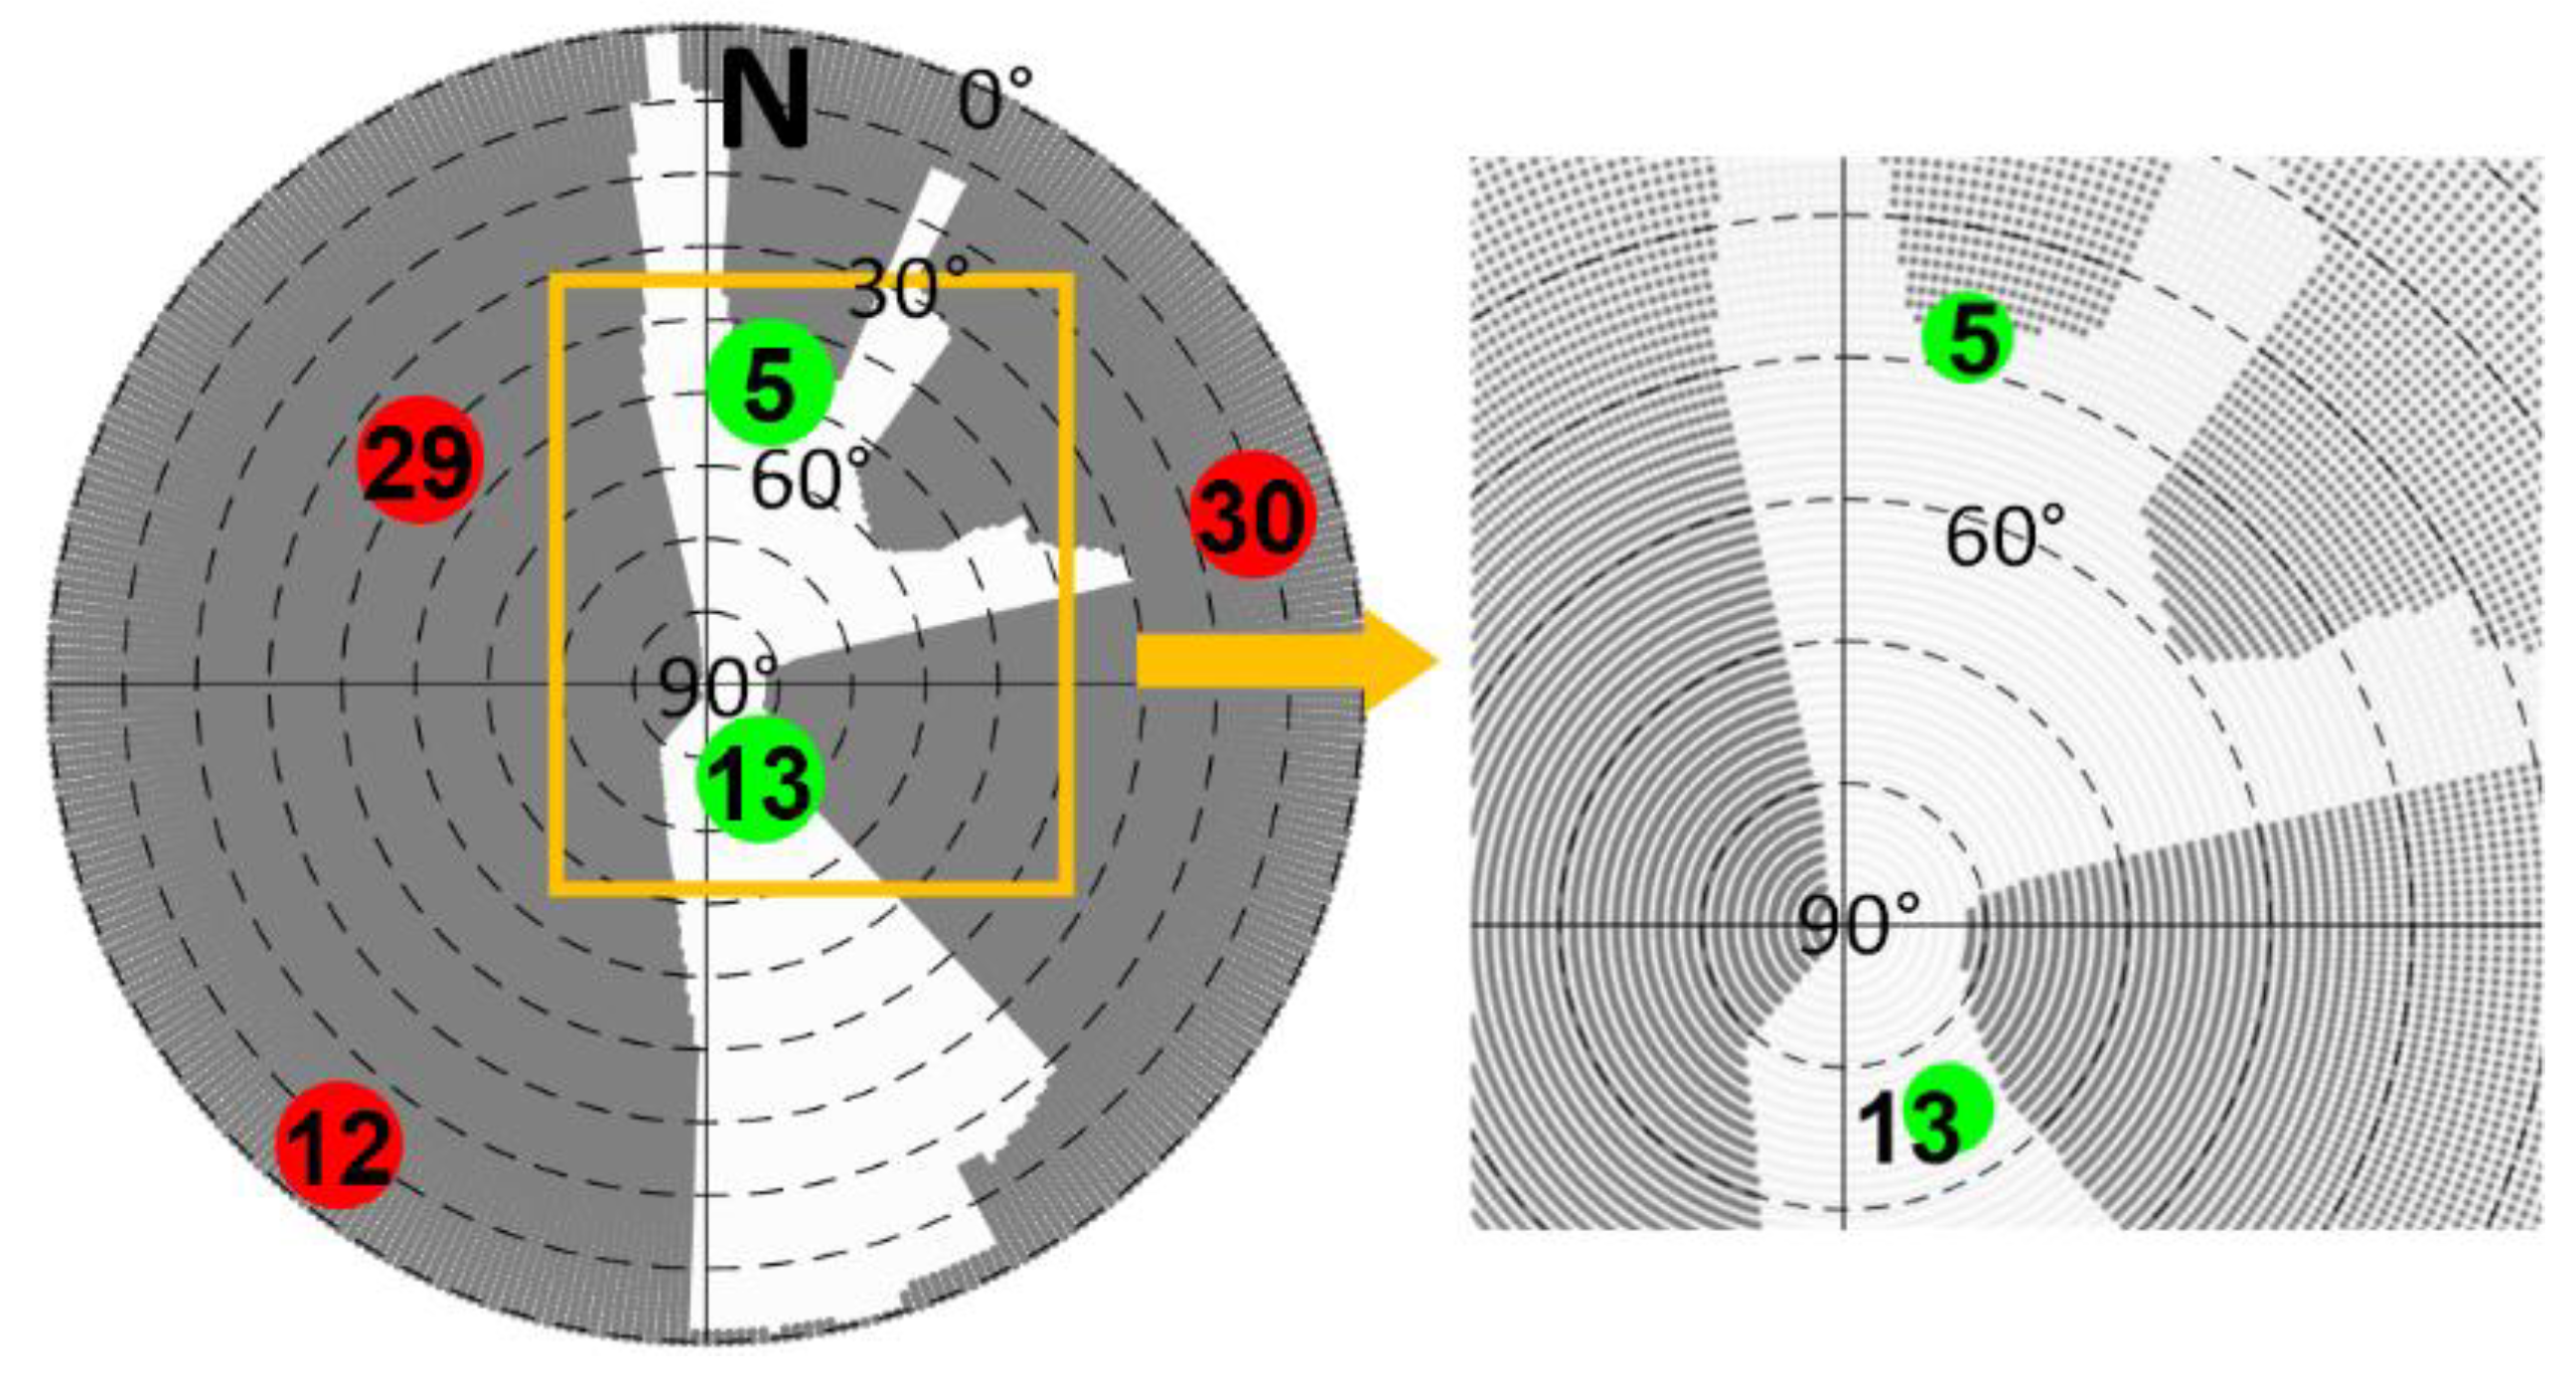
Performance of supervised classifiers is related to the labelling accuracy of training data. Conventional methods of signal type labelling can be divided into two groups. The first group is the usage of sky-pointing camera or the 3D building model. This method is straightforward. For example, based on the satellite ephemeris, the sky-pointing camera method projects the satellites onto the captured image directly, with the satellite in the building area labelled as NLOS, and the one in the open area labelled as LOS [26]. Similarly, the 3D building model method compares the elevation angle of the satellite and the building boundary at the same azimuth angle. If the satellite elevation angle is lower than the building elevation angle, the satellite is labelled as NLOS, otherwise it is labelled as LOS. In [30], the authors also defined a three-degree diffraction zone taking into account the diffraction effect. Both methods can only determine the visibility of satellites, i.e., LOS or NLOS, whereas the MP signal cannot be identified. In addition, the 3D building model method is also dependent on the user ground truth. Based on the 3D building model, the ray-tracing technique can also be used to find all possible propagation paths [31], thereby determining the signal type, including the MP. However, the ray-tracing technique has a high computational load and relies on the building model accuracy and the material of building surface. The second group is to control the type of the received signal. For example, by using a GNSS simulator such as the Spirent SimGEN + SE-NAV product [32], one can control the signal type. In [
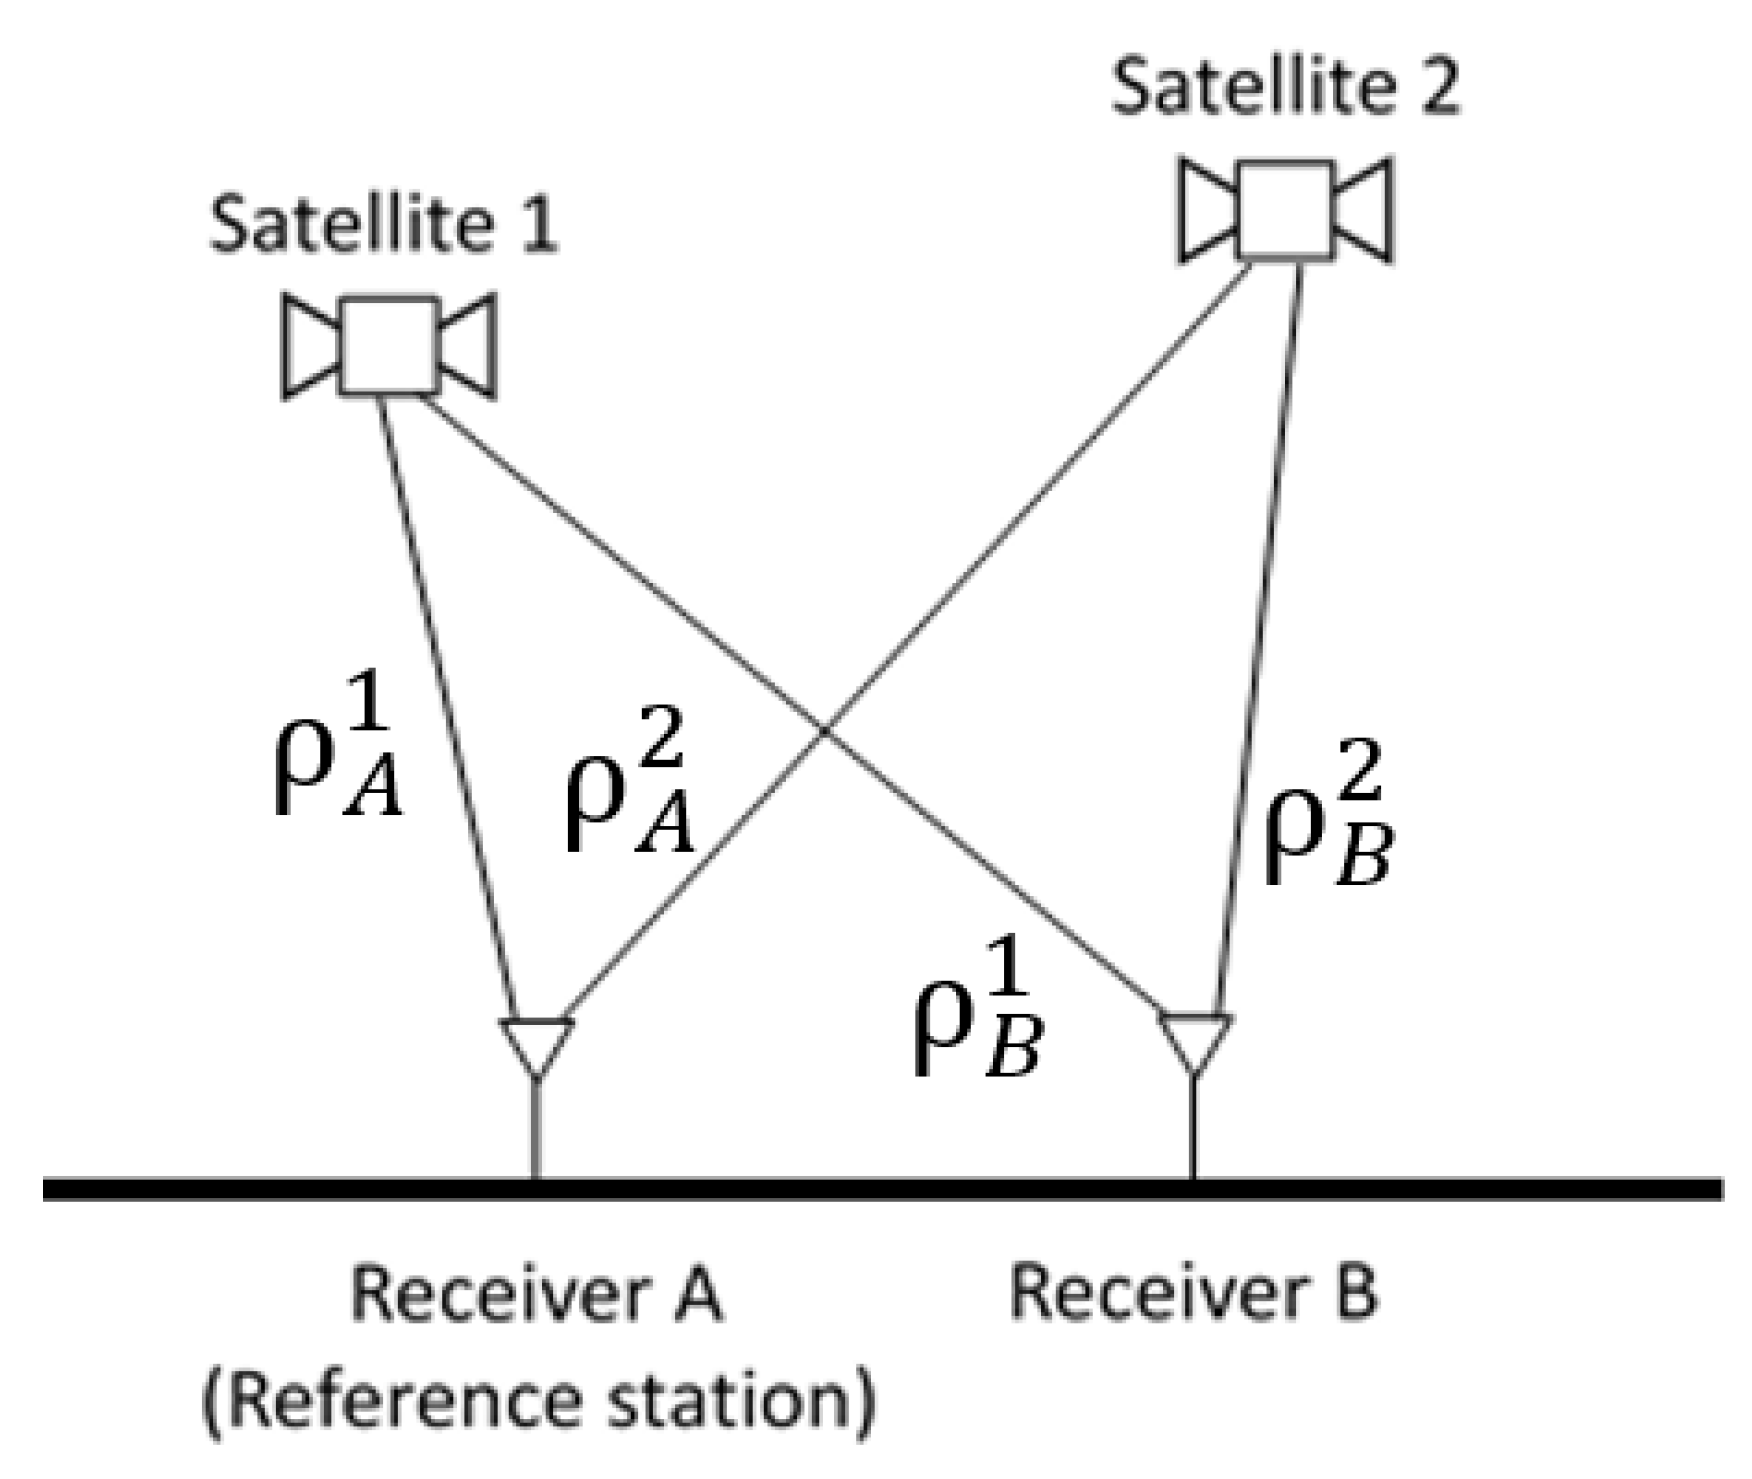
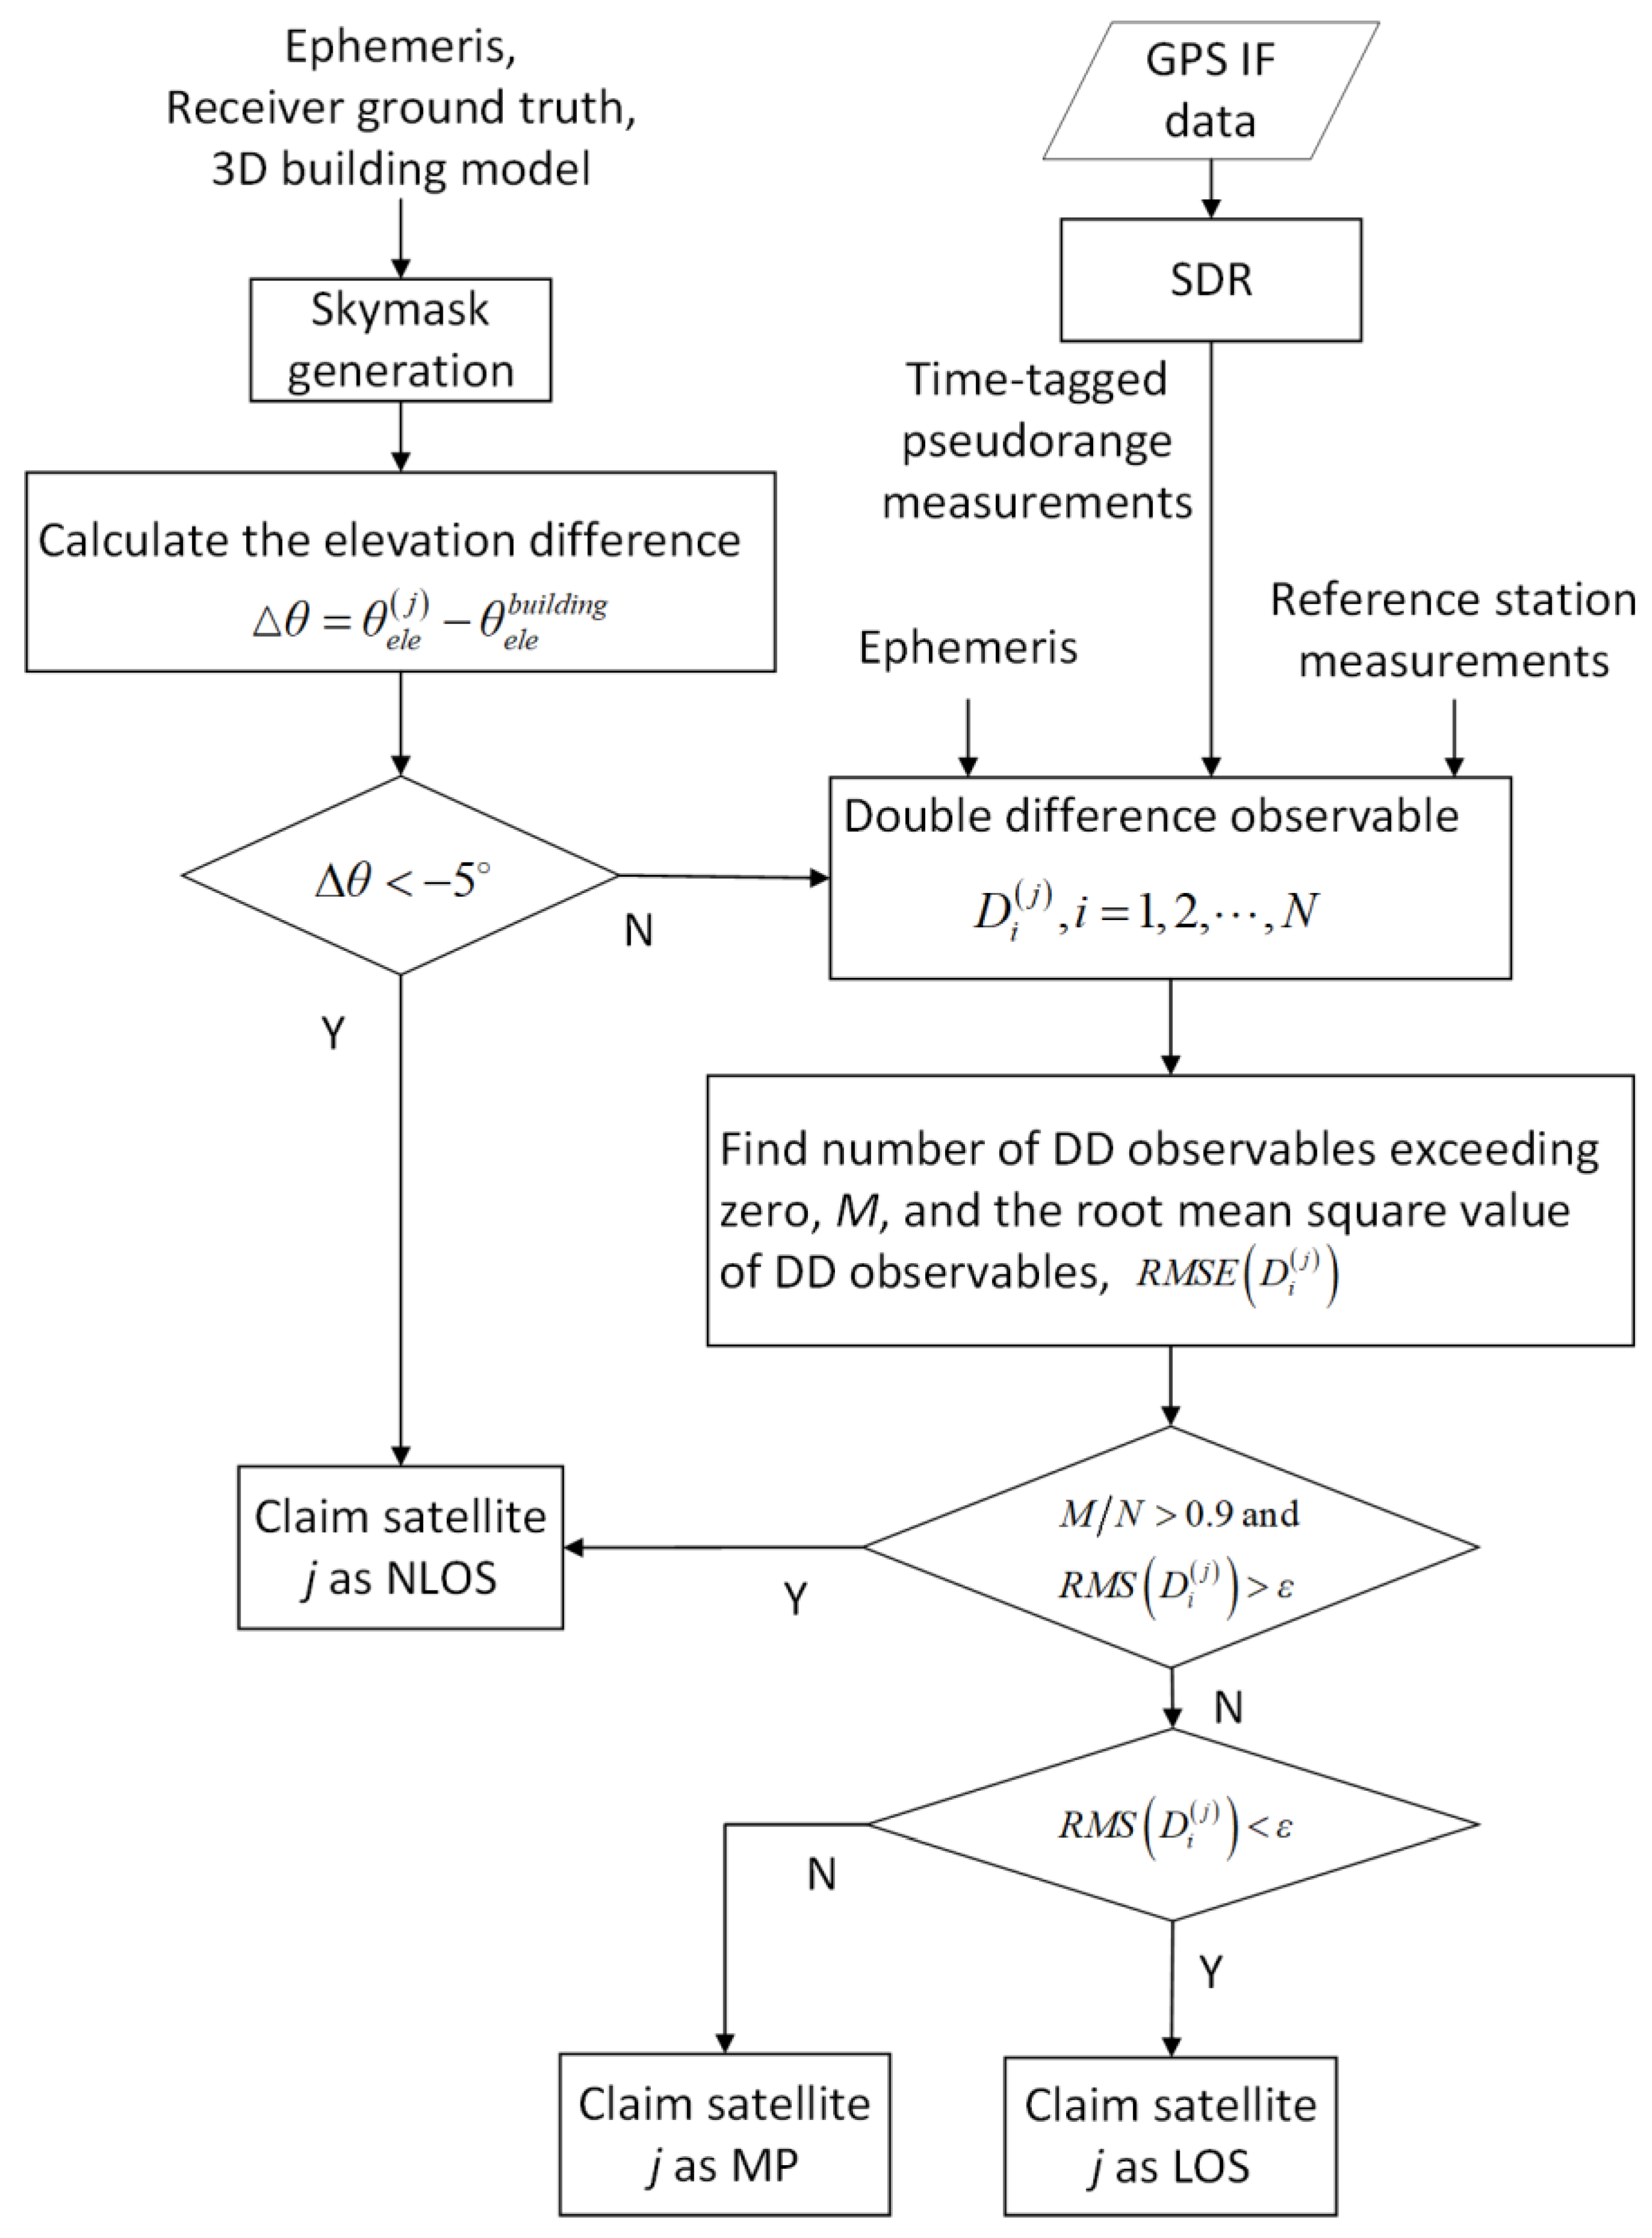
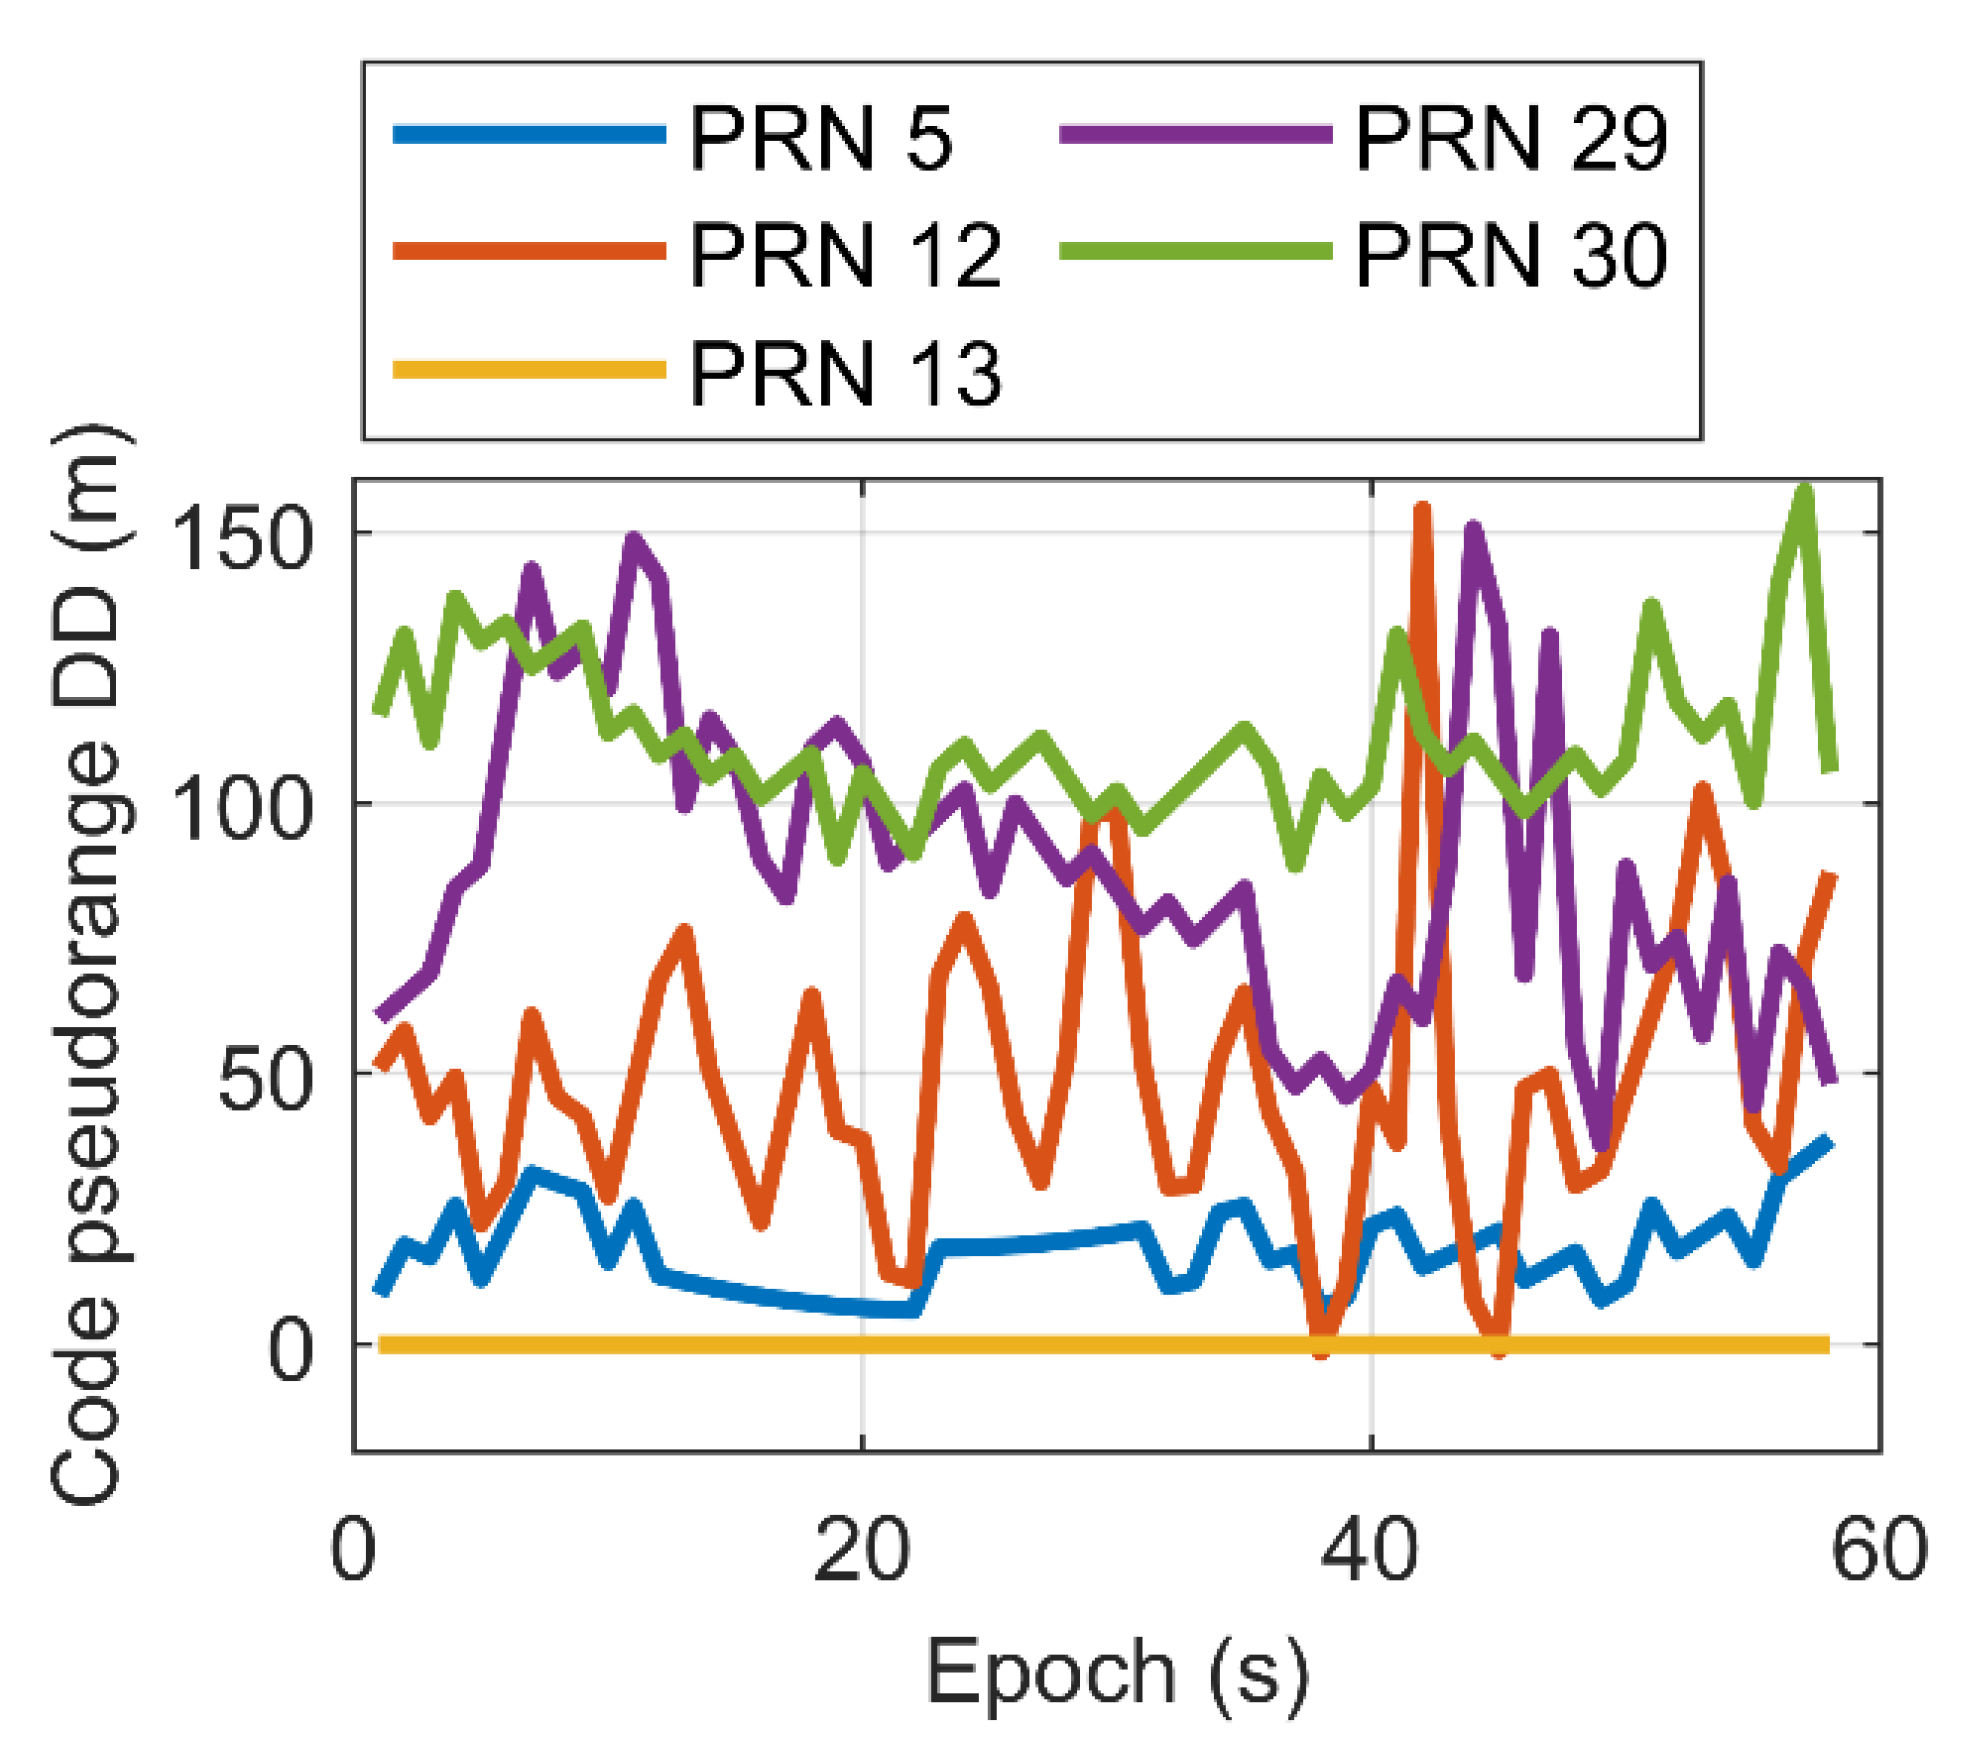
29], multipath and NLOS signals were generated by controlling the experimental setup, e.g., the movement of obstructer and reflector. However, these methods are not feasible to real GNSS signals labelling. This paper will solve the signal type labelling issue using the Skymask and the code pseudorange double difference observable, which represents the second contribution of this paper.
The following section describes the methods used in this paper, including modelling of GPS L1 LOS/MP/NLOS signal and their effects on code autocorrelation function, feature extraction, and the proposed signal type labelling method using the combination of Skymask and code pseudorange double difference observable. This is followed by the experimental results for GPS L1 C/A signal, where detailed experimental setup, data collection, and classification results are presented and analyzed. In the next section, a discussion of the findings in this paper and their relationship with previous works will be given, as well as potential extensions of this work. Finally, conclusions are drawn.

2. Methods

2.1. Signal Model

2.1.1. LOS/MP/NLOS Signal Model

Two assumptions are made in terms of the GPS L1 C/A signal in this paper: (1) there is no navigation data bit transition during one coherent integration time interval; (2) there is only one MP signal or one NLOS signal. The intermediate frequency (IF) signal for LOS, MP, NLOS reception, denoted as y 0 ( n T s ) , y MP ( n T s ) , and y NLOS ( n T s ) , respectively, at the output of the radio frequency (RF) front-end for one satellite can be written as [33]:
y 0 ( n T s ) = A C ( n T s τ 0 ) cos ( ( ω I F + ω D ) n T s + φ 0 ) + η ( n T s )
y MP ( n T s ) = A C ( n T s τ 0 ) cos ( ( ω I F + ω D ) n T s + φ 0 ) + α MP A C ( n T s τ 0 τ MP ) c o s ( ( ω I F + ω D ) n T s + φ 0 + Δ φ MP + Δ ω MP n T s ) + η ( n T s )
y NLOS ( n T s ) = α NLOS A C ( n T s τ 0 τ NLOS ) cos ( ( ω I F + ω D ) n T s + φ 0 + Δ φ NLOS + Δ ω NLOS n T s ) + η ( n T s )
where n is the index of a discrete-time sequence obtained by sampling a continuous-time signal at a sampling rate f s = 1 / T s , T s is the sampling interval; A is the amplitude of the direct LOS signal; C ( ) is the pseudo-random noise (PRN) code; ω I F and ω D are the angular nominal IF frequency and Doppler shift, respectively; α MP and α NLOS are coefficients of reflection of the MP and NLOS signal, respectively; τ 0 is the code delay of the LOS signal, τ MP and τ NLOS the additional code delay of the reflected signal; φ 0 denotes the initial carrier phase of the direct signal, Δ φ MP and Δ φ NLOS the relative phase of MP and NLOS, respectively; Δ ω denotes the Doppler difference between the direct and the reflected signal; η ( n T s ) is assumed to be a band-limited additive white gaussian noise.

2.1.2. MP/NLOS Effects on Code Autocorrelation Function

In this paper, the MP/NLOS effect on GPS performance is analyzed at the baseband signal processing level, i.e., specifically, the code autocorrelation function. The local carrier replica is assumed to be perfectly aligned with that of the incoming signal. The reason for this assumption is that the MP/NLOS effect on the code is much severer than that on the carrier, especially for low-dynamic receivers. The code ACF, R τ ( δ τ ) , for binary phase shift keying (BPSK) modulation with T c as the chip duration is defined as
R τ ( δ τ ) = { 1 | δ τ | T c , for | δ τ | T c 0 , for | δ τ | > T c
where δ τ is the code offset between the locally generated and the incoming code.
In a typical GPS receiver, three code replicas, referred to as the early (E), prompt (P), and late (L) codes, with a spacing of 0.5 chip are created to correlate with the incoming code. The correlator outputs are integrated and dumped over one coherent integration time interval. The final correlator outputs will be generated as
{ E = A R ( δ τ + d / 2 ) P = A R ( δ τ ) L = A R ( δ τ d / 2 )
The delay lock loop (DLL) always tries to keep equivalent outputs of the E and L correlators, as illustrated in Figure 1. For the LOS signal, the ACF is ideally a symmetric triangle, with the prompt correlator output located at the correlation peak. For the NLOS signal, although the ACF shape is similar to that of LOS signal, two differences should be noted. One is the lower magnitude of NLOS signal due to the attenuation of reflection; the other is that there is a time offset of the whole ACF, as the dashed line denotes. This time offset is exactly the additional code delay of the NLOS signal, τ NLOS [34]. As a result, the estimated propagation time delay of the LOS and NLOS signal is
τ ^ = { τ 0 for LOS τ 0 + τ NLOS for NLOS
For the MP, however, the estimated propagation time delay is dependent on multiple parameters such as the relative phase, Δ Φ = Δ φ MP + Δ ω MP n T s , between the direct and the reflected signal, the coefficient of reflection, α MP , and the additional code delay of the reflected signal, τ MP . The mathematical expression can be found in [35] for both coherent and noncoherent code discriminators. Figure 1 also shows cases of constructive ( Δ Φ = 0 rad ) MP and destructive ( Δ Φ = π rad ) MP. Compared with the LOS/NLOS signal, the ACF shape of the MP signal is distorted due to the superposition of the direct and reflected signal. The prompt correlator output is no longer at the correlation peak, which provides an opportunity for detecting MP. Two conclusions can be drawn based on the above analysis: (1) The ACF shape of MP is asymmetric, with the correlation peak on either left or right side of the prompt correlator. For the NLOS, however, the ACF is still symmetric, with the correlation peak exactly in the prompt correlator. The only difference between the LOS and NLOS ACFs is the magnitude of correlation peak, considering the reflection attenuation. (2) The estimated propagation time delay of NLOS is always bigger than that of the direct LOS signal, whereas it can be either greater or smaller for the MP signal depending on the relative phase between the direct and the reflected signal. As a result, the pseudorange measurement error for the NLOS signal is always positive, but it can be negative for the MP signal.

2.2. Feature Extraction

2.2.1. Correlator-Level Features

Based on the analysis in Section 2.1, from the MACF [36], four correlator-level features are extracted: ratio between the measured maximum correlation value and the standard value, the mean and variance of the correlation peak delay, and the early late phase (ELP), which are described as follows:
● Feature 1: Ratio between the measured maximum correlation value and the standard value
In general, the strength of reflected or diffracted signal is weaker than that of the direct signal. However, the compound signal of multiple paths is not necessarily weaker than the direct signal, depending on the phase difference between multiple reflections and the direct signal. For example, in Figure 1, the compound signal has a higher correlation peak than the direct signal. Feature 1 is calculated as the ratio between the measured maximum correlation value and the standard value. The standard value is the maximum correlation value measured in open-sky areas at various satellite elevation angles, as shown in Figure 2.
A third-order polynomial is used to fit the measurements with the expression as
C o r r ( θ e l e ) = i = 0 3 c i θ e l e i
where θ e l e is the satellite elevation; the coefficients c i are estimated using the least-squares method, with the result shown in Table 1. Feature 1 is then calculated using [26]
F 1 = C o r r m e a s u r e d / C o r r ( θ e l e )
where C o r r m e a s u r e d is the measured maximum correlation value at satellite elevation θ e l e .
● Features 2 and 3: Mean and variance of the correlation peak delay
Figure 3 presents real-world ACFs overlapped for 20 ms for constructive and destructive MP and NLOS signals. It can be seen that for both constructive and destructive MP, a non-zero time delay of correlation peak exists, whereas for NLOS, the correlation peaks are distributed around zero time delay. Due to the reflection attenuation, NLOS signal usually has a lower signal strength. The introduced noise will decrease the tracking performance. As a result, the variance of delay of NLOS correlation peaks is bigger than that of the direct LOS signal [26]. In this paper, the statistics of mean and variance of the correlation peak delay for N ACFs are calculated as features 2 and 3
F 2 = t ¯ d e l a y = 1 N i = 1 N t d e l a y , i
F 3 = 1 N i = 1 N ( t d e l a y , i t ¯ d e l a y ) 2
where t d e l a y , i is the correlation peak delay of the i-th ACF.
● Feature 4: Early late phase
The carrier phase difference between the direct and reflected signals has not been fully explored to detect MP signal. In [25], the phase difference between the E and L correlator outputs, called the ELP, was proposed to detect MP. ELP is used as the fourth correlator-level feature, which is calculated using [25]
F 4 = tan 1 ( Q L / I L Q E / I E )
where the subscripts E and L denote the early and late correlators, respectively; Q and I refer to the quadrature and in-phase channels, respectively. Figure 4 illustrates this feature using the simulated MP signal with a fixed phase difference of π / 2 rad to the direct signal. When the simulated MP occurs, there is a fixed carrier phase error in the early and late correlator channels, respectively. The ELP then shows a non-zero offset during the MP reception.

2.2.2. RINEX/NMEA-Level Features

The RINEX- and NMEA-level features are listed in Table 2, where the feature pseudorange rate consistency is the difference between delta pseudorange and pseudorange rate, derived using Doppler frequency, as [20]
ζ = | Δ ρ ( j ) ρ ˙ ( j ) Δ t |
where Δ ρ ( j ) and Δ t are the delta pseudorange and the time interval between two consecutive epochs; ρ ˙ ( j ) = ( c f D o p p l e r ( j ) ) / f L 1 is the Doppler-derived pseudorange rate with c the speed of light, f D o p p l e r ( j ) the Doppler measurement, and f L 1 the carrier nominal frequency.

2.3. Signal Type Labelling

The performance of supervised classifiers is related to the labelling accuracy of training data. This section deals with the signal type labelling issue by using the Skymask and the code pseudorange double difference observable.

2.3.1. Skymask and Its Limitation

Skymask is defined as the Skyplot with building boundary information, as shown in Figure 5. The gray area denotes the building blockage. If the elevation angle of satellite is lower than that of the building boundary at the same azimuth angle, it is labelled as NLOS, e.g., PRN 29 in red. Otherwise, it is labelled as LOS in green, e.g., PRN 13 in green.
This Skymask method is easy and straightforward, but it has two drawbacks. On the one hand, it can only determine the satellite visibility, namely LOS or NLOS, thereby MP cannot be identified; On the other hand, it is not accurate for satellites near the building edges, such as PRN 5 in Figure 5, due to the inaccuracy of receiver location and 3D building model [22]. To solve this problem, the code pseudorange double difference observable is used to help determine the signal type, which cannot be done by the sole Skymask method.

2.3.2. Code Pseudorange Double Difference

In GPS field, double difference (DD) of carrier phase measurements is one of the standard methods to determine the relative position between two receivers. In this paper, the DD observable of code pseudorange measurements is used to find the MP- or NLOS-induced pseudorange measurement error, thereby labelling the signal type. The code pseudorange between receiver k and satellite j can be modeled as [37]
ρ k j = r k j + c ( δ t k δ t j ) + γ i o n o + γ t r o p + γ k , M P j + γ k , N L O S j + e k j
with r k j the geometric range, δ t k and δ t j the clock bias of receiver k and satellite j, γ i o n o and γ t r o p the ionospheric and tropospheric errors, γ k , M P j and γ k , N L O S j the error induced by MP and NLOS, respectively, and e k j the other unmodelled errors.
As shown in Figure 6, Receiver A is the reference station in the open-sky area, e.g., the HKSC reference station, used in this paper. Receiver B is the rover station in the urban area. For the reference station, it is assumed to be free of multipath and NLOS effects, i.e., γ A , M P 1 = γ A , N L O S 1 = γ A , M P 2 = γ A , N L O S 2 = 0 . To form the DD observable, the single difference (SD) is first created by differencing ρ A 1 and ρ B 1
S D A B 1 = Δ r A B 1 + c ( δ t A δ t B ) γ B , M P 1 γ B , N L O S 1 + Δ e A B 1
S D A B 2 = Δ r A B 2 + c ( δ t A δ t B ) γ B , M P 2 γ B , N L O S 2 + Δ e A B 2
where Δ r A B j = r A j r B j , Δ e A B j = e A j e B j . The DD is then obtained by differencing S D A B 1 and S D A B 2
D D A B 12 = Δ r A B 12 + γ B , M P 2 γ B , M P 1 + γ B , N L O S 2 γ B , N L O S 1 + Δ e A B 12
where Δ r A B 12 = Δ r A B 1 Δ r A B 2 , Δ e A B 12 = Δ e A B 1 Δ e A B 2 .
After the DD computation, clock biases of both the receiver and satellite are eliminated, as well as the correlated errors such as ionospheric and tropospheric errors. According to Equation (16), to label the signal, one of the satellites is assumed to be free of the MP and NLOS effect, called master satellite, which is in general selected to be the satellite with the highest elevation angle, e.g., Satellite 2 in Figure 6. With this assumption, Equation (16) is simplified to
D D A B 12 = Δ r A B 12 γ B , M P 1 γ B , N L O S 1 + Δ e A B 12
where Δ r A B 12 is a known parameter.

2.3.3. Proposed Signal Type Labelling Method

To address the issue with Skymask for labelling signal type, this paper proposes to integrate the Skymask method and the code pseudorange DD observable to help determine the MP signal and the satellites near the building edges, with the flowchart shown in Figure 7. This method consists of two major parts; one is using Skymask to determine NLOS satellites that are at least 5 degrees lower than the building boundary at the same azimuth, the other using code pseudorange double difference observable to distinguish among the three signal types for other satellites.
The steps of the proposed method are described as follows:
Step 1: Generate Skymask using ephemeris, receiver ground truth, and 3D building model. In this paper, the receiver ground truth is obtained from the Google Earth.
Step 2: Calculate the elevation difference between the satellite and the building boundary at the same azimuth.
Step 3: If the satellite elevation angle is at least 5 degrees lower than the building boundary elevation at the same azimuth, satellite j is claimed to be NLOS. Otherwise, go to Step 4.
Step 4: Process GPS IF data using the SDR, which outputs the time-tagged code pseudorange measurements.
Step 5: On the basis of the ephemeris and reference station measurements, calculate the code pseudorange double difference observable, D D i ( j ) , i = 1 , 2 , , N where N is the amount of epochs tested, using Equation (17).
Step 6: Find the amount of DD observables, M , that exceed zero, and the root mean square (RMS) value of the DD observables, R M S ( D D i ( j ) ) , with the true value of zero.
Step 7: If the DD observable exceeds zero for more than 90% of the epochs test, i.e., M / N > 0.9 and the RMS value exceeds a preset threshold, satellite j is claimed to be NLOS. The first condition is due to the fact that the NLOS-induced pseudorange error is always positive. The threshold of M / N is set as 0.9, considering the measurement outliers. The RMS threshold ε = 10.50 meters is set as the RMS value of DD observables for LOS satellites. Otherwise, go to next step.
Step 8: If the RMS value is lower than ε , satellite j is claimed to be LOS; otherwise it is claimed to be MP.

2.3.4. Case Study

As shown in Figure 5, PRN 13 was selected as the master satellite. The reference station was the HKSC station of SatRef, which is established by the Hong Kong land department for providing differential corrections. The distance between the HKSC station and the receiver location in Figure 5 is less than 5 km, which ensures that the atmospheric errors are eliminated. Figure 8 shows the DD observables in 1 min for each satellite in Figure 5. The statistics are listed in Table 3. As concluded in Section 2, the NLOS-induced pseudorange is always positive. This conclusion is consistent between the DD observable and the Skymask for PRNs 12, 29, and 30. For PRN 5, it is labelled as LOS by Skymask, whereas it should be NLOS according to the DD observable.

3. Results

This section presents experimental results, including the experimental setup, GPS L1 raw data collection and signal type labelling, metrics for evaluation, and the signal type classification results using correlator-, RINEX- and NMEA-level classifiers. A comparison of these three kinds of classifiers is also provided.

3.1. Experimental Setup

Figure 9 shows the experimental setup. The NSL Stereo front-end with an active antenna, Allystar AGR6303, was used to collect the raw GPS IF data for postprocessing. An open-sourced GPS L1 SDR that is able to output pseudorange measurements was used in this paper [38], which was modified with the implementation of multiple correlators. The multicorrelator outputs were used for correlator-level LOS/MP/NLOS classification. The SDR outputs such as pseudorange, Doppler, C/N0, etc., were converted to generate the SDR RINEX and NMEA files, which were then used in the RINEX- and NMEA-level classifiers. Details of the configuration of the experimental setup are listed in Table 4.

3.2. Data Collection and Signal Type Labelling Results

GPS L1 raw IF data were collected at three different locations in Hong Kong, as shown in Figure 10. It can be seen that the locations selected show very low sky visibility. All datasets were collected in static environment. Each dataset was composed of several sub-datasets, collected at different times on different days, due to the large size of raw IF data file. The length of the experimental data is listed in Table 5. The Skymask and code pseudorange DD observables method proposed in Section 2 was used for labelling the signal type. Table 5 summarizes the labelling results.
Figure 11 shows the point cloud of labelled data, from which several conclusions can be drawn for the experimental data. Firstly, in general, signal with low C / N 0 is likely to be NLOS, while high- C / N 0 signal can be either LOS or MP. MP can also have low C / N 0 depending on both the satellite elevation and phase difference between the direct and reflected paths. This also poses a challenge to the MP identification. Secondly, satellites with very high elevation can be NLOS in deep urban areas. Thirdly, MP and NLOS signals produce larger pseudorange rate consistency, due to the Doppler frequency difference between the direct and reflected signal.

3.3. Metrics for Evaluation

To assess the performance of the three different level classifiers, a multiclass confusion matrix was formed, as shown in Table 6. Based on the multiclass confusion matrix, metrics of precision, recall, overall accuracy, and F1 score are defined as follows [40,41]:
Precision = i = 1 l T P i T P i + F P i l
Recall = i = 1 l T P i T P i + F N i l
Overall   accuracy = i = 1 l T P i + T N i T P i + F N i + F P i + T N i l
F 1   score = 2 × Precision × Recall Precision + Recall
where T P i = c i i denotes the number of correctly recognized samples as class c i , F P i = j = 1 l c j i T P i the number of incorrectly recognized samples as class c i , F N i = j = 1 l c i j T P i the number of samples that were not classified as class c i , T N i = j = 1 l k = 1 l c j k T P i F P i F N i the number of correctly recognized samples that does not belong to class c i .

3.4. Classification Results

3.4.1. Test I

In this test, Datasets A and B were combined as the training data, while Dataset C was used as the testing data. The multiclass confusion matrix of different level classifiers is listed in Table 7, which also lists the F1 score and overall accuracy. According to the results, the following remarks can be drawn.
On the one hand, in this case where testing data was collected at different places to that of training data, correlator-level classifier is the best among the three levels of classifiers in terms of F1 score and overall accuracy. Specifically, the correlator-level classifier achieved an F1 score of 72.91%, while the F1 scores of the NMEA- and RINEX-level classifiers were only 58.02% and 57.35%, respectively.
On the other hand, in this experiment, the SVM training accuracies for NMEA- and RINEX-level classifiers were 91.89% and 92.35%, respectively. The high inconsistency between the SVM training accuracy and the testing accuracy for NMEA- and RINEX-level classifiers indicated that the performance of these two kinds of classifiers is sensitive to scenarios. Both NMEA- and RINEX-level features were not robust enough to classify the LOS and MP. Specifically, the training model with high accuracy may not be suitable for testing data collected at different places. For the correlator-level classifier, however, the testing accuracy was consistent with training accuracy, which makes it more feasible in practice.
The recall value for each signal type is shown in Figure 12. It is observed that the MP recall value of NMEA- and RINEX -level classifiers was much higher than the LOS recall. As a result, the values of F1 score were only 58.02% and 57.35% for NMEA- and RINEX-level classifiers, respectively. This also indicates that MP and LOS signal are difficult to distinguish between each other using NMEA- and RINEX-level classifiers. For the correlator-level classifier, recall values for the three types of signal were comparative to each other. In other words, correlator-level classifier can better distinguish different types of signal. The explanation to the superiority of correlator-level classifier is that, as analyzed in Section 2, the LOS/MP/NLOS signal has different effects on the autocorrelation function. Deeper-level features extracted from the ACF, therefore, can better reflect the characteristic of different types of signal.
In some applications, such as the standard shadow-matching-based positioning [5], it is enough to distinguish between LOS and NLOS, i.e., the satellite visibility. As such, a comparison of LOS/NLOS classification using the three different level classifiers was also conducted. To do this, MP was put into the LOS group because the MP contains the direct signal. The LOS/NLOS classification results are shown in Table 8. The recall value for each class is shown in Figure 13. As can be seen, the LOS accuracy was significantly improved for all three kinds of classifiers. As expected, the correlator-level classifier still outperformed the other two kinds of classifiers. In specific, the F1 score of correlator-level classifier was more than 90%, and its LOS and NLOS recall values were up to 98.69% and 77.96%, respectively.

3.4.2. Test II

To confirm the scenario sensitivity issue, Test II was conducted, where all datasets were mixed up, half of which was randomly selected as the training data, while the remaining half was the testing data. The confusion matrixes for LOS/MP/NLOS and LOS/NLOS classifications are in Appendix A. Figure 14 shows the comparison of training and testing accuracy. In this case, the three kinds of classifiers showed comparative performances for both the LOS/MP/NLOS and LOS/NLOS classifications. In specific, the classification accuracy was improved for NMEA- and RINEX-level classifiers, and there was a high consistency between the SVM training and testing performance. For the correlator-level classifier, its accuracy consistency was still guaranteed although there was a slight decrease of classification rate compared with that in Figure 13, which was probably due to the decreased amount of training data.

4. Discussion

The results in this paper are encouraging, with the opening of deeper-level measurements on more and more GNSS-capable devices [42]. GNSS performance in urban areas is expected to improve by using these measurements. Increasing signal type classification rate is useful for both the popular 3DMA positioning and conventional ranging-based least square positioning. Hence, this paper proposes to improve signal type classification rate by using correlator-level classifier, and compares it with conventional NMEA/RINEX-level classifiers. To make a fair comparison between different level classifiers, it is important to make sure that all features come from the same receiver, which has been rarely explored in existing researches, although some researches have explored the deeper-level features in different applications [18,26,29]. The two findings in this paper and the interpretation in perspective of previous studies are described as follows.
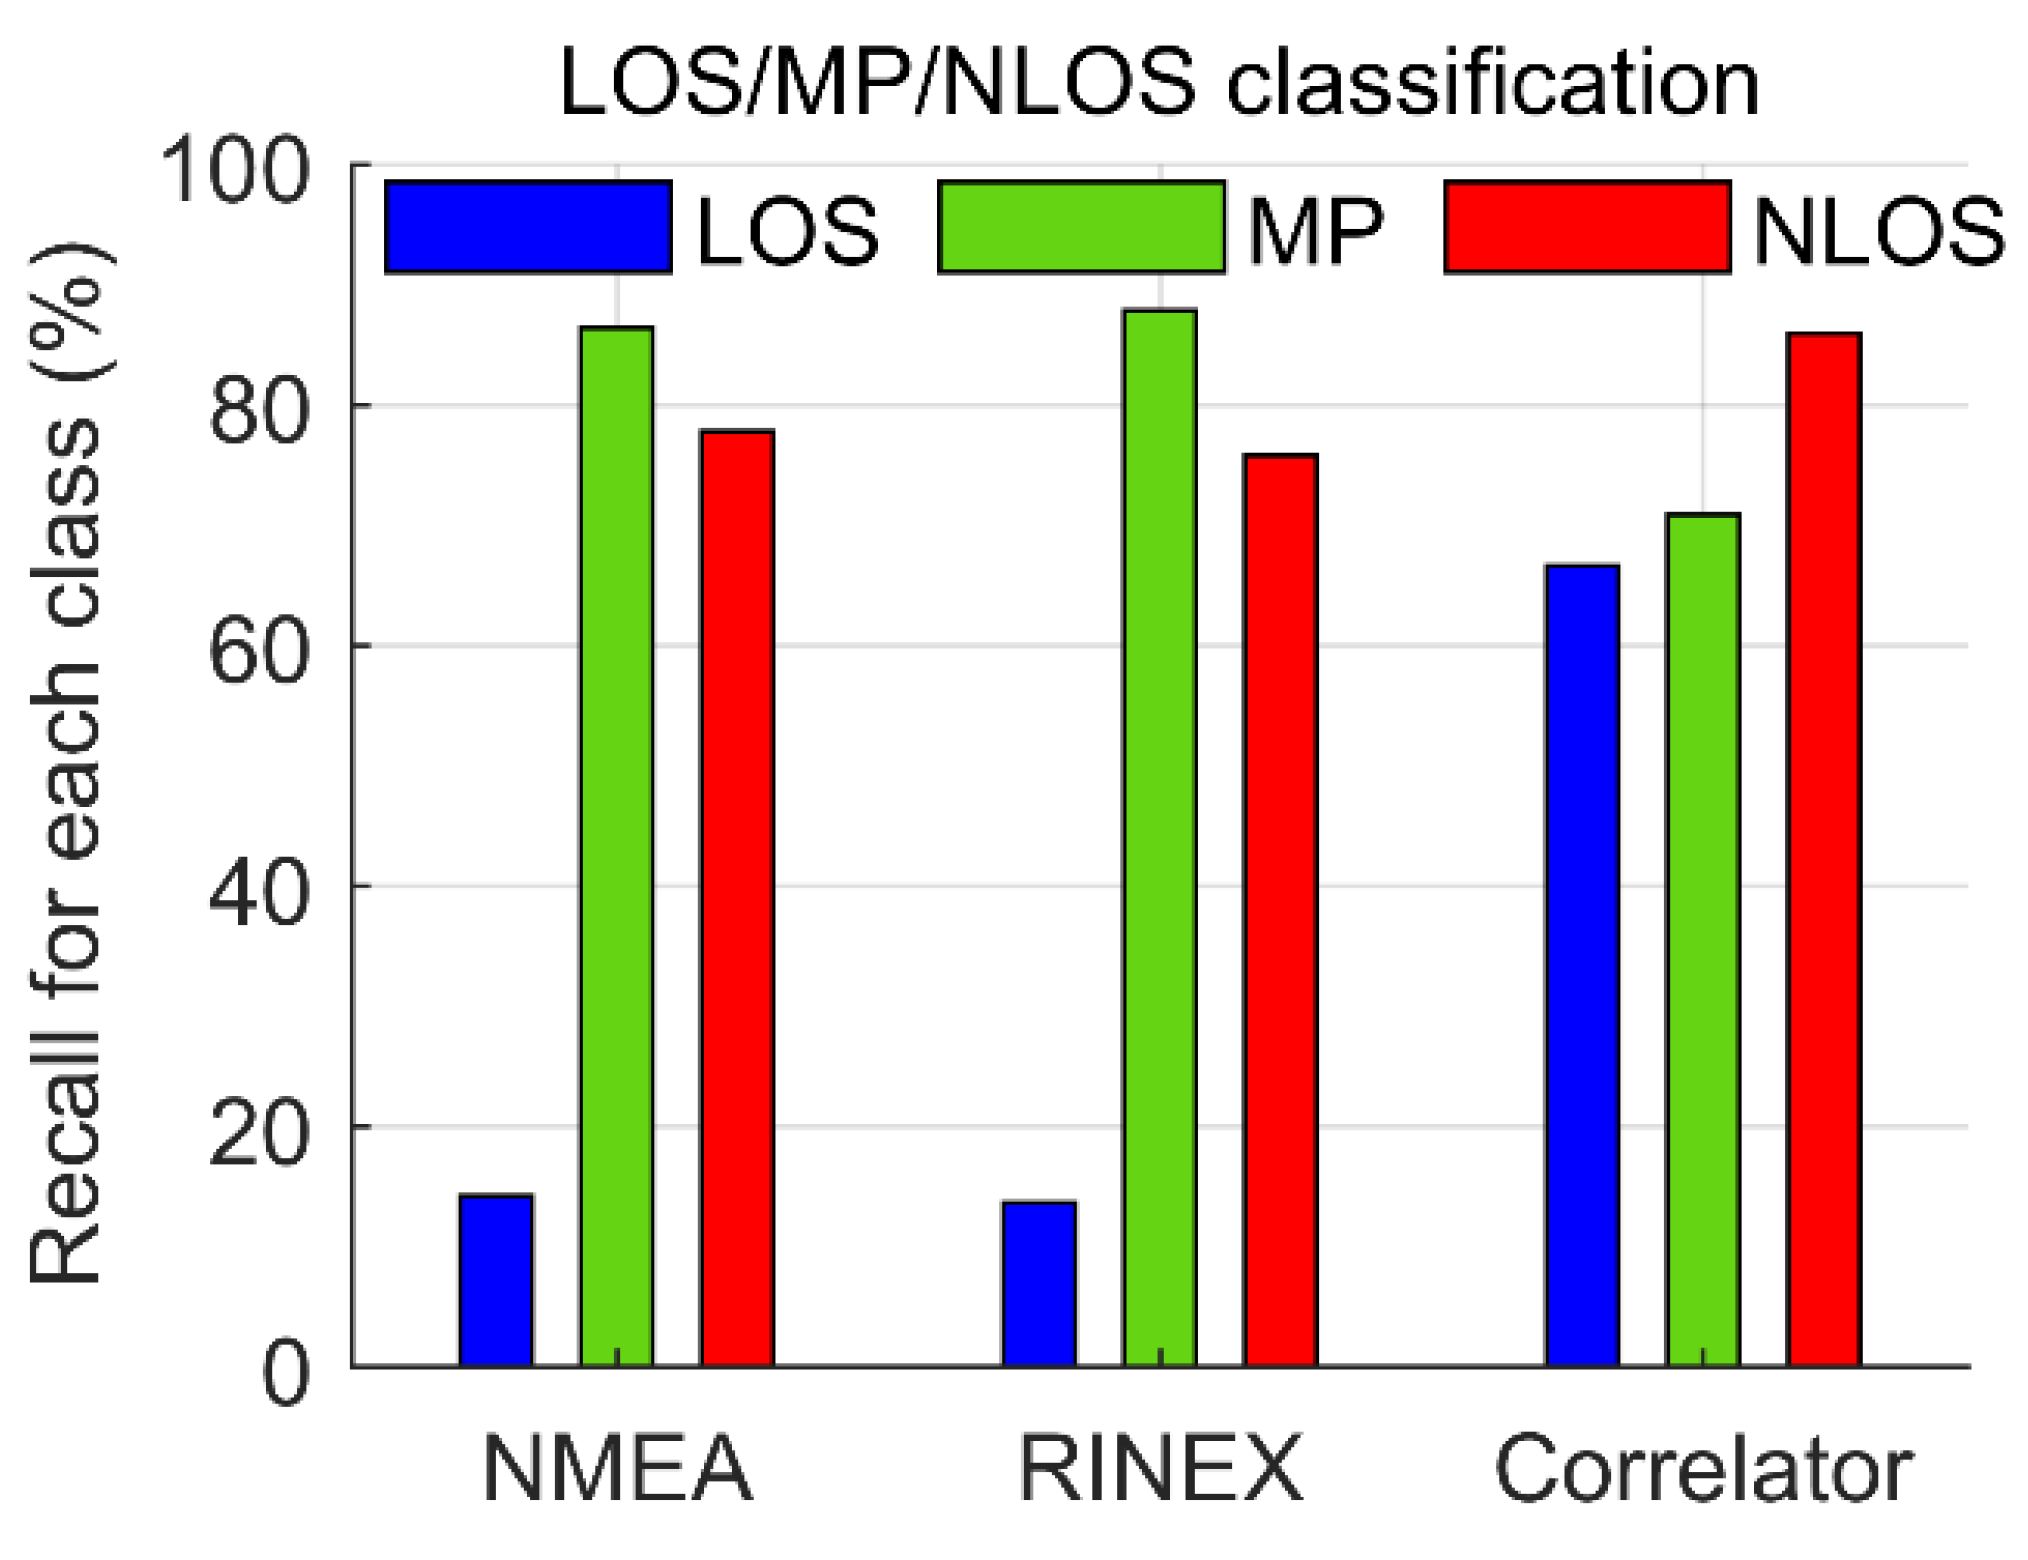
On the one hand, the correlator-level classifier had the best performance among the three different level classifiers for training data and testing data that were collected in different places, improving the F1 score by 25.7% and 27.1% compared with NMEA- and RINEX-level classifiers, respectively (Table 7). In terms of the accuracy of each class, the correlator-level classifier also outperformed the other two methods, especially for distinguishing between LOS and MP (Figure 12). This finding shows the effectiveness of signal classification, including MP, at the correlator level, and can been seen as an extension of the work in [26,43], where correlator-level features were used to do LOS/NLOS classification. On the other hand, of particular importance is that the correlator-level classifier has been shown to be more robust to scenarios. In specific, for testing data that was collected at different places as the training data, the performance of NMEA/RINEX-level classifiers showed significant decrease, while the correlator-level classifier could retain the high performance. This finding, i.e., sensitivity issue of NMEA/RINEX-level classifiers, is consistent with that reported in [20], where the accuracy for testing data collected at different locations as the training data was degraded by more than 20%. This issue is probably due to that the NMEA/RINEX-level features were highly relied on in the scenario. For example, the signal strength was directly related to the street width and building height and materials. The robustness of correlator-level classifier makes it more feasible in practical applications.
Due to the limited size of experimental datasets, this paper does not focus on improving the absolute signal classification rate, instead it is intended for the illustration of advantages of correlator-level classifier against the commonly used NMEA- and RINEX-level classifiers. One of the extensions of this paper is to do a large-scale data test to improve the correlator-level classifier by using more advanced techniques. For example, the previous work of the authors has proven that vector tracking loop (VTL) has a different response to the MP/NLOS signal compared with the scalar tracking loop (STL) used in this paper [36]. This difference provides an opportunity to detect MP/NLOS more efficiently [38,44]. Therefore, correlator-level features extracted from VTL may further improve the signal classification rate. Other techniques include replacing SVM with other deep learning approaches, e.g., neural networks as used in [29,43]. In this way, feature extraction can be automatically finished instead of the manual selection, thereby avoiding the information loss [41]. Another extension of this paper is to test smartphone data at the correlator-level and evaluate the positioning performance with the proper exploitation of the identified signal type.

5. Conclusions

In this paper, correlator-level features were extracted to classify GPS L1 signal using a supervised machine learning algorithm. A fair comparison with respect to the NMEA-, RINEX- and correlator-level classifiers was carried out on a common ground, by guaranteeing that all measurements come from the same GPS receiver (the self-developed SDR). To do this, LOS/MP/NLOS effects on autocorrelation function were analyzed first. Subsequently, four correlator-level features were extracted and illustrated. The method of combining Skymask and code pseudorange double difference observable was proposed to do signal type labelling for the supervised machine leaning algorithm. To assess the performance of these different level classifiers, GPS raw IF data were collected at different places in deep urban canyons in Hong Kong. The conclusions are twofold according to the experimental results.
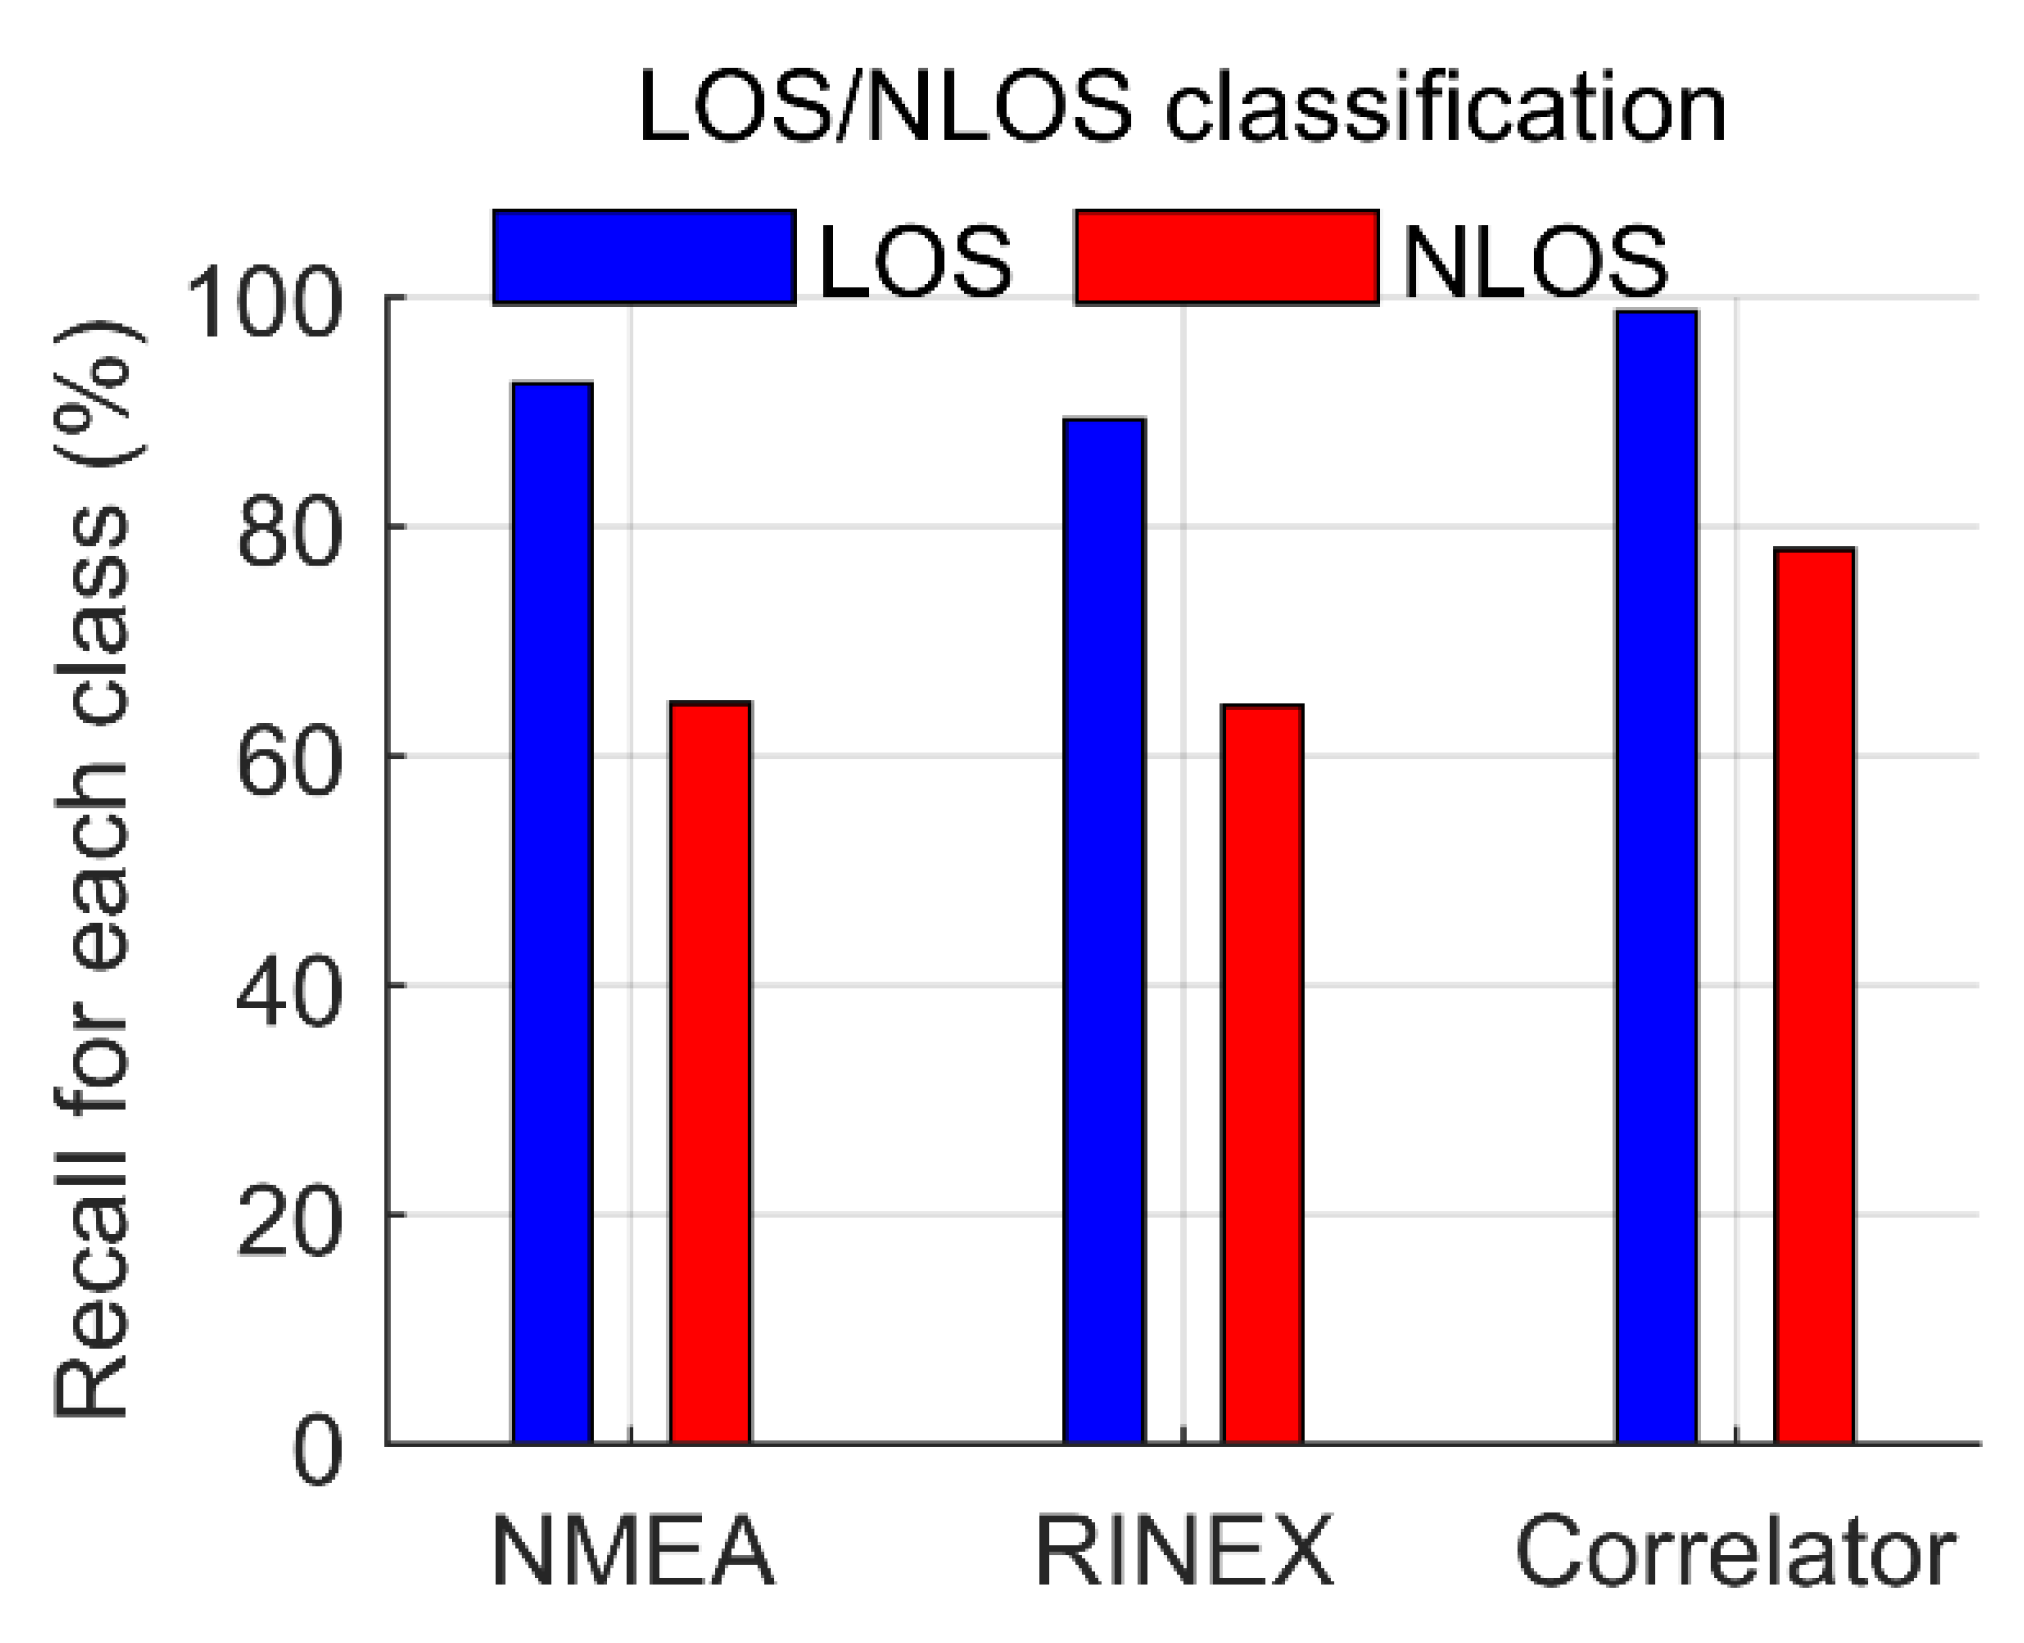
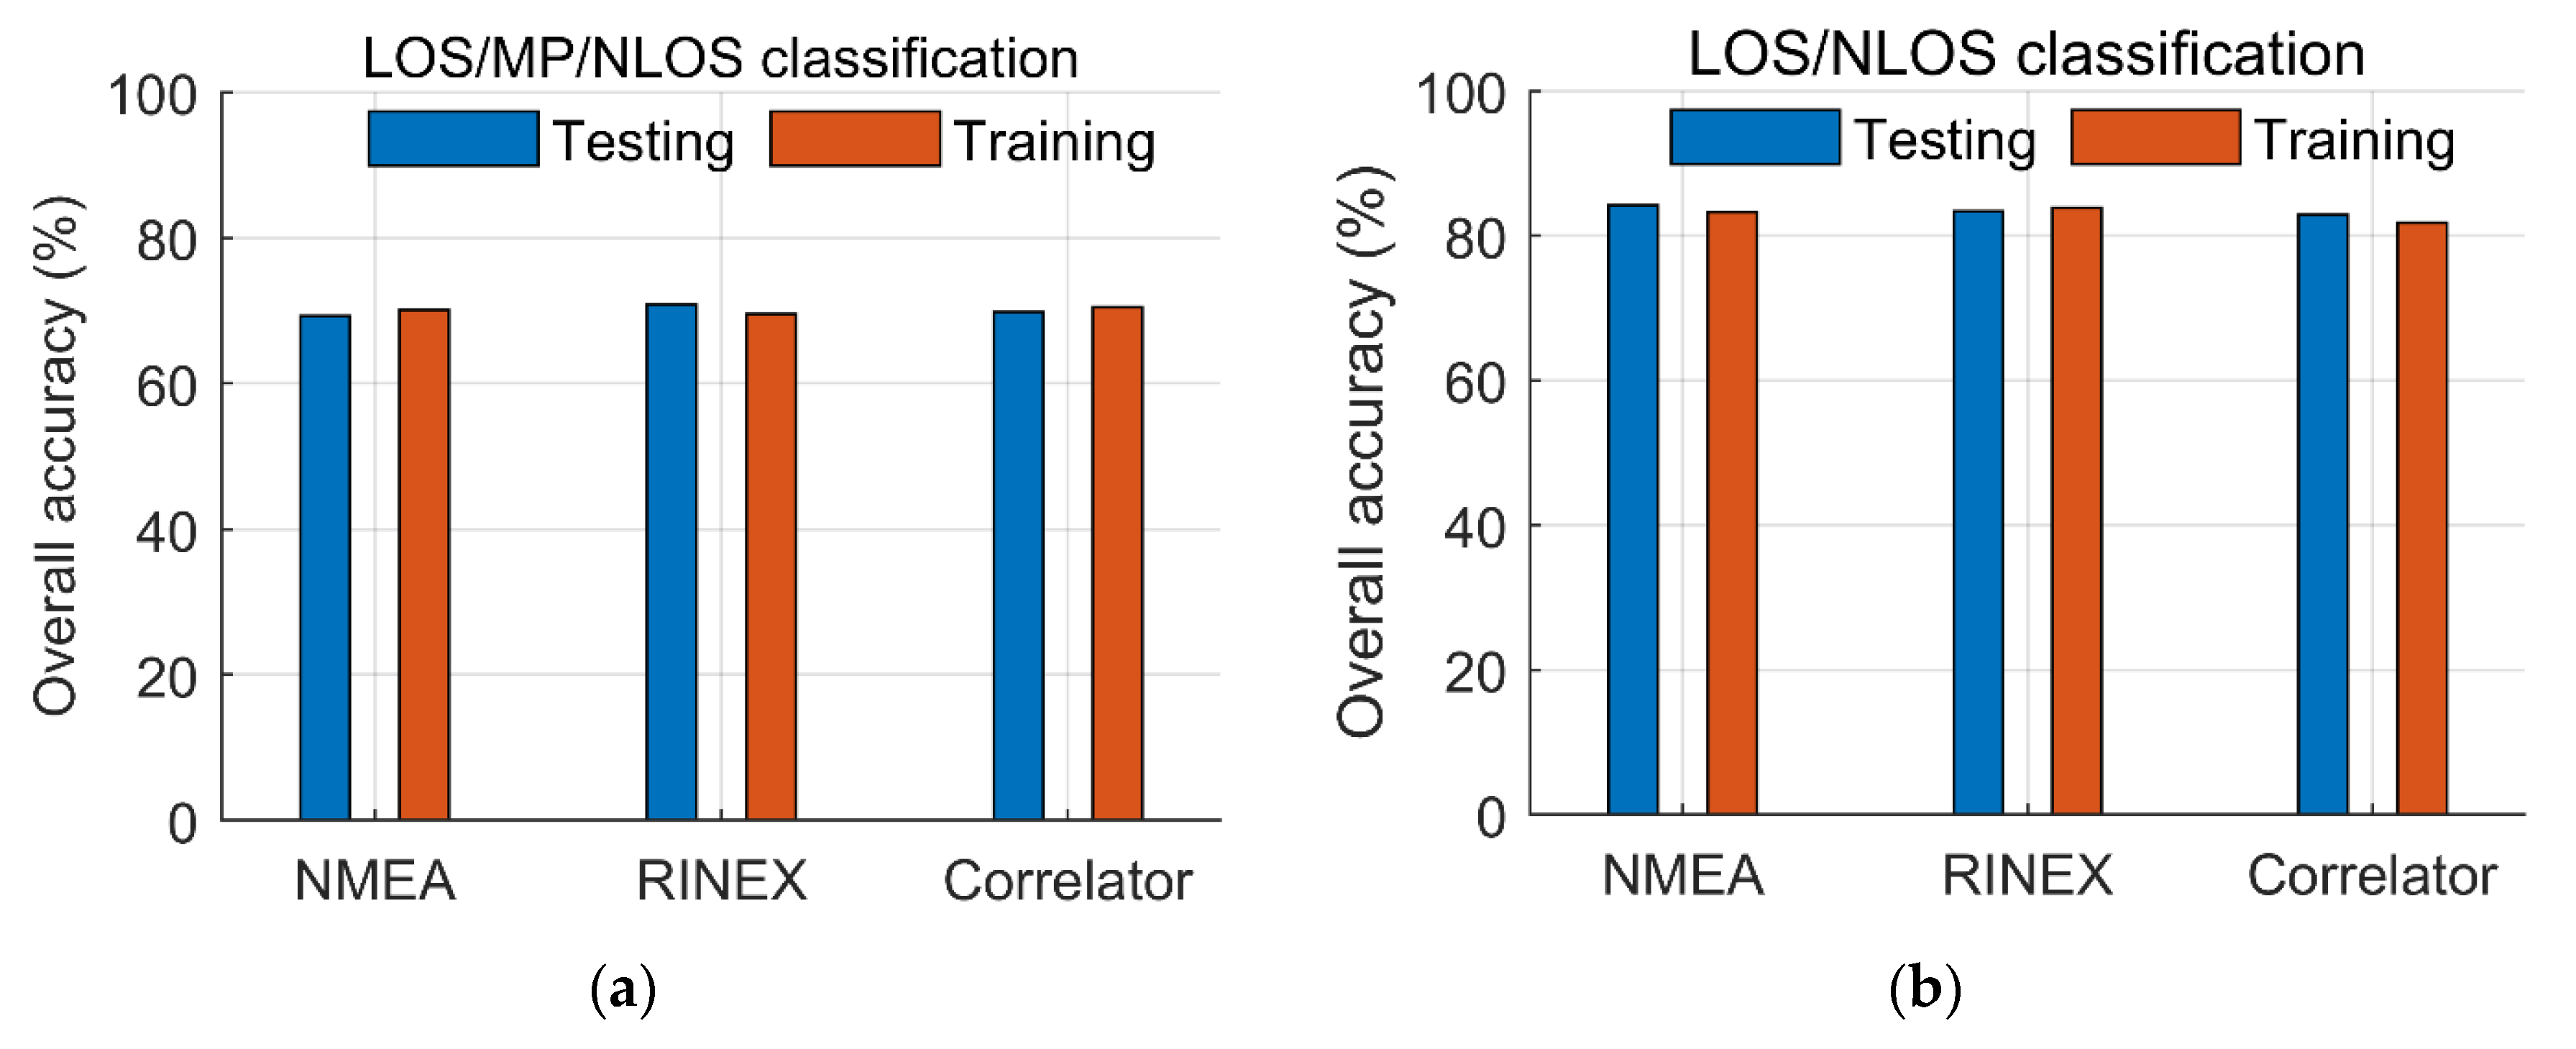
On the one hand, correlator-level classifier outperforms the NMEA- and RINEX-level classifiers in terms of four metrics, i.e., precision, recall, F1 score, and overall accuracy. In specific, for training data and testing data collected at different places, the correlator-level classifier improved F1 score for LOS/MP/NLOS classification by about 25% compared with NMEA and RINEX-level classifiers. Besides, the correlator-level classification rate for each class was higher than that using NMEA/RINEX-level classifiers, especially for the identification between LOS and MP. For LOS/NLOS classification, the overall accuracy was greatly improved for all three kinds of classifiers, with the F1 scores of 80.42%, 78.11%, and 90.39% for NMEA-, RINEX-, and correlator-level classifiers, respectively.
On the other hand, by further checking the SVM training accuracy, NMEA- and RINEX-level classifiers were found to have the sensitivity issue, i.e., for testing data collected at different locations to the training data, NMEA/RINEX-level classifiers showed degraded performances. The correlator-level classifier is more robust against the scenarios due to that deeper-level features can better reflect the characteristics of different types of signal. This benefit of correlator-level classifier is of particular importance to practical applications.

Author Contributions

Conceptualization, B.X. and L.-T.H.; methodology, B.X.; software, B.X.; formal analysis, B.X., Q.J. and Y.L.; data collection, B.X. and Q.J.; writing—original draft preparation, B.X.; writing—review and editing, B.X., Q.J., Y.L. and L.-T.H.; supervision, L.-T.H.

Funding

This research is funded by Fundamental Research on Free Exploration Category of Shenzhen Municipal Science and Technology Innovation Committee (Project No. JCYJ20170818103653507).

Acknowledgments

The authors are grateful to Haosheng Xu, Hoi-Fung Ng, Guohao Zhang and Jiang Yue for their valuable suggestion and to reviewers of this paper for their comments and remarks.

Conflicts of Interest

The authors declare no conflict of interest.

Appendix A. Confusion matrix in Test II

Table A1 and Table A2 list the confusion matrixes for LOS/MP/NLOS and LOS/NLOS classifications in Test II where all datasets are mixed up to form a whole dataset. Then, half of the whole dataset was randomly selected as the training data, while the remaining half was used as the testing data.
Table A1. LOS/MP/NLOS classification results using different-level classifiers in Test II.
NMEA-Level Classification ResultsRINEX-Level Classification ResultsCorrelator-Level Classification Results
LOSMPNLOSLOSMPNLOSLOSMPNLOS
Labelled ResultsLOS80410557832112689414316
MP338442257302457241472336218
NLOS2078011111848511201631301131
F1 Score68.9070.0069.14
Overall Accuracy (%)69.3070.8369.80
Table A2. LOS/NLOS classification results using different-level classifiers in Test II.
NMEA-Level Classification ResultsRINEX-Level Classification ResultsCorrelator-Level Classification Results
LOSNLOSLOSNLOSLOSNLOS
Labelled ResultsLOS175521817842141891131
NLOS32011083521051460968
F1 Score83.6782.7082.42
Overall Accuracy (%)84.1883.3682.87

References

  1. Ziedan, N.I. Improved multipath and NLOS signals identification in urban environments. Navigation 2018, 65, 449–462. [Google Scholar] [CrossRef]
  2. Li, T.; Zhang, H.; Gao, Z.; Chen, Q.; Niu, X. High-accuracy positioning in urban environments using single-frequency multi-GNSS RTK/MEMS-IMU Integration. Remote Sens. 2018, 10, 205. [Google Scholar] [CrossRef]
  3. Zhang, Z.; Li, B.; Gao, Y.; Shen, Y. Real-time carrier phase multipath detection based on dual-frequency C/N0 data. GPS Solut. 2018, 23, 7. [Google Scholar] [CrossRef]
  4. Zhang, Z.; Li, B.; Shen, Y.; Gao, Y.; Wang, M. Site-specific unmodeled error mitigation for GNSS positioning in urban environments using a real-time adaptive weighting model. Remote Sens. 2018, 10, 1157. [Google Scholar]
  5. Groves, P.D. Shadow matching: A new gnss positioning technique for urban canyons. J. Navig. 2011, 64, 417–430. [Google Scholar] [CrossRef]
  6. Kumar, R.; Petovello, M.G. A novel GNSS positioning technique for improved accuracy in urban canyon scenarios using 3D city model. In Proceedings of the 27th International Technical Meeting of the Satellite Division of The Institute of Navigation (ION GNSS+ 2014), Tampa, FL, USA, 8–12 September 2014; pp. 2139–2148. [Google Scholar]
  7. Hsu, L.-T.; Gu, Y.; Kamijo, S. 3D Building model-based pedestrian positioning method using GPS/GLONASS/QZSS and its reliability calculation. GPS Solut. 2015, 20, 413–428. [Google Scholar] [CrossRef]
  8. Wang, L.; Groves, P.D.; Ziebart, M.K. Smartphone shadow matching for better cross-street GNSS positioning in urban environments. J. Navig. 2015, 68, 411–433. [Google Scholar] [CrossRef]
  9. Adjrad, M.; Groves, P.D.; Quick, J.C.; Ellul, C. Performance assessment of 3D-mapping-aided GNSS Part 2: Environment and mapping. Navigation 2019, 66, 363–383. [Google Scholar] [CrossRef]
  10. Groves, P.D.; Adjrad, M. Performance assessment of 3D-mapping-aided GNSS Part 1: Algorithms, user equipment, and review. Navigation 2019, 66, 341–362. [Google Scholar] [CrossRef]
  11. Obst, M.; Bauer, S.; Wanielik, G. Urban multipath detection and mitigation with dynamic 3D maps for reliable land vehicle localization. In Proceedings of the 2012 IEEE/ION Position, Location and Navigation Symposium, Myrtle Beach, SC, USA, 23–26 April 2012; pp. 685–691. [Google Scholar]
  12. Jiang, Z.; Groves, P.D. NLOS GPS signal detection using a dual-polarisation antenna. GPS Solut. 2014, 18, 15–26. [Google Scholar] [CrossRef]
  13. Keshvadi, M.H.; Broumandan, A.; Lachapelle, G. Analysis of GNSS beamforming and angle of arrival estimation in multipath environments. In Proceedings of the 2011 International Technical Meeting of The Institute of Navigation, San Diego, CA, USA, 24–26 January 2011; pp. 427–435. [Google Scholar]
  14. Suzuki, T.; Kubo, N. N-LOS GNSS signal detection using fish-eye camera for vehicle navigation. in urban environments. In Proceedings of the 27th International Technical Meeting of the Satellite Division of The Institute of Navigation (ION GNSS+ 2014), Tampa, FL, USA, 8–12 September 2014; pp. 1897–1906. [Google Scholar]
  15. Sánchez, J.S.; Gerhmann, A.; Thevenon, P.; Brocard, P.; Afia, A.B.; Julien, O. Use of a fisheye camera for GNSS NLOS exclusion and characterization in urban environments. In Proceedings of the 2016 International Technical Meeting of The Institute of Navigation, Monterey, CA, USA, 25–28 January 2016; pp. 283–292. [Google Scholar]
  16. Wen, W.; Zhang, G.; Hsu, L.-T. Correcting GNSS NLOS by 3D lidar and building height. In Proceedings of the 31st International Technical Meeting of the Satellite Division of The Institute of Navigation (ION GNSS+ 2018), Miami, FL, USA, 24–28 September 2018; pp. 3156–3168. [Google Scholar]
  17. Soloviev, A.; Van Graas, F. Use of deeply integrated GPS/INS architecture and laser scanners for the identification of multipath reflections in urban environments. IEEE J. Sel. Top. Signal Process. 2009, 3, 786–797. [Google Scholar] [CrossRef]
  18. Sokhandan, N.; Ziedan, N.; Broumandan, A.; Lachapelle, G. Context-aware adaptive multipath compensation based on channel pattern recognition for GNSS receivers. J. Navig. 2017, 70, 944–962. [Google Scholar] [CrossRef]
  19. Ren, T.; Petovello, M.G. A stand-alone approach for high-sensitivity GNSS receivers in signal-challenged environment. IEEE Trans. Aerosp. Electron. Syst. 2017, 53, 2438–2448. [Google Scholar] [CrossRef]
  20. Sun, R.; Hsu, L.-T.; Xue, D.; Zhang, G.; Ochieng, W.Y. GPS signal reception classification using adaptive neuro-fuzzy inference system. J. Navig. 2019, 72, 685–701. [Google Scholar] [CrossRef]
  21. Hsu, L.-T. GNSS multipath detection using a machine learning approach. In Proceedings of the 2017 IEEE 20th International Conference on Intelligent Transportation Systems (ITSC), Yokohama, Japan, 16–19 October 2017; pp. 1–6. [Google Scholar]
  22. Yozevitch, R.; Moshe, B.B.; Weissman, A. A robust GNSS LOS NLOS signal classifier. Navigation 2016, 63, 429–442. [Google Scholar]
  23. Malkos, S. Google to provide raw GNSS measurements. GPS World 2016, 27, 36. [Google Scholar]
  24. Jau, P.-H.; Chen, H.-W.; Chen, P.-Y.; Chen, H.; Tsai, M.-H.; Weng, C.-T.; Chou, D. Adopting machine learning to GNSS positioning on MediaTek P60 platform. In Proceedings of the 31st International Technical Meeting of the Satellite Division of The Institute of Navigation (ION GNSS+ 2018), Miami, FL, USA, 24–28 September 2018; pp. 538–553. [Google Scholar]
  25. Mubarak, O.M.; Dempster, A.G. Analysis of early late phase in single-and dual-frequency gps receivers for multipath detection. GPS Solut. 2010, 14, 381–388. [Google Scholar] [CrossRef]
  26. Suzuki, T.; Nakano, Y.; Amano, Y. NLOS multipath detection by using machine learning in urban environments. In Proceedings of the 30th International Technical Meeting of the Satellite Division of The Institute of Navigation (ION GNSS+ 2017), Portland, Oregon, 25–29 September 2017; pp. 3958–3967. [Google Scholar]
  27. Suzuki, T.; Kubo, N. GNSS-SDRLIB: An open-source and real-time GNSS software defined radio library. In Proceedings of the 27th International Technical Meeting of the Satellite Division of The Institute of Navigation (ION GNSS+ 2014), Tampa, FL, USA, 8–12 September 2014; pp. 1364–1375. [Google Scholar]
  28. Egea-Roca, D.; López-Salcedo, J.; Seco-Granados, G.; Vincent Poor, H. Performance bounds for finite moving average tests in transient change detection. IEEE Trans. Signal Process. 2018, 66, 1594–1606. [Google Scholar] [CrossRef]
  29. Liu, Q.; Huang, Z.; Wang, J. Indoor non-line-of-sight and multipath detection using deep learning approach. GPS Solut. 2019, 23, 75. [Google Scholar] [CrossRef]
  30. Wang, L.; Groves, P.D.; Ziebart, M.K. GNSS shadow matching: Improving urban positioning accuracy using a 3D city model with optimized visibility scoring scheme. Navigation 2013, 60, 195–207. [Google Scholar] [CrossRef]
  31. Lau, L.; Cross, P. Development and testing of a new ray-tracing approach to GNSS carrier-phase multipath modelling. J. Geod. 2007, 81, 713–732. [Google Scholar] [CrossRef]
  32. Panicciari, T.; Soliman, M.A.; Moura, G. Evaluation of a GNSS receiver performance in different multipath environments with a novel real-time multipath simulation system. In Proceedings of the 30th International Technical Meeting of the Satellite Division of The Institute of Navigation (ION GNSS+ 2017), Portland, Oregon, 25–29 September 2017; pp. 427–435. [Google Scholar]
  33. Irsigler, M. Characterization of multipath phase rates in different multipath environments. GPS Solut. 2010, 14, 305–317. [Google Scholar] [CrossRef]
  34. Seco-Granados, G.; López-Salcedo, J.; Jiménez-Baños, D.; López-Risueño, G. Challenges in indoor global navigation satellite systems: Unveiling its core features in signal processing. IEEE Signal Process. Mag. 2012, 29, 108–131. [Google Scholar] [CrossRef]
  35. Liu, L.; Amin, M.G. Tracking performance and average error analysis of GPS discriminators in multipath. Signal Process. 2009, 89, 1224–1239. [Google Scholar] [CrossRef]
  36. Xu, B.; Hsu, L.-T. NLOS Detection and compensation using a vector tracking-based GPS software receiver. In Proceedings of the ION 2019 Pacific PNT Meeting, Honolulu, HI, USA, 8–11 April 2019; pp. 702–712. [Google Scholar]
  37. Dautermann, T.; Korn, B.; de Haag, M.U. Using code based GNSS double differences as beacon landing system. In Proceedings of the 2017 IEEE/AIAA 36th Digital Avionics Systems Conference (DASC), St. Petersburg, FL, USA, 17–21 September 2017. [Google Scholar]
  38. Xu, B.; Hsu, L.-T. Open source MATLAB code for GPS vector tracking on a software-defined receiver. GPS Solut. 2019, 23, 1–9. [Google Scholar] [CrossRef]
  39. Chang, C.-C.; Lin, C.-J. Libsvm: A library for support vector machines. ACM Trans. Intell. Syst. Technol. 2011, 2, 1–27. [Google Scholar] [CrossRef]
  40. Sokolova, M.; Lapalme, G. A systematic analysis of performance measures for classification tasks. Inf. Process. Manag. 2009, 45, 427–437. [Google Scholar] [CrossRef]
  41. He, T.; Xie, C.; Liu, Q.; Guan, S.; Liu, G. Evaluation and comparison of random forest and A-LSTM networks for large-scale winter wheat identification. Remote Sens. 2019, 11, 1665. [Google Scholar] [CrossRef]
  42. Li, G.; Geng, J. Characteristics of raw multi-GNSS measurement error from Google Android smart devices. GPS Solut. 2019, 23, 90. [Google Scholar] [CrossRef]
  43. Nakano, Y.; Suzuki, T.; Amano, Y. NLOS multipath detection using neural networks. In Proceedings of the 16th IAIN World Congress 2018, Chiba, Japan, 28 November–1 December 2018. [Google Scholar]
  44. Hsu, L.-T.; Jan, S.-S.; Groves, P.D.; Kubo, N. Multipath mitigation and NLOS detection using vector tracking in urban environments. GPS Solut. 2015, 19, 249–262. [Google Scholar] [CrossRef]
Figure 1. Autocorrelation function (ACF) for different types of signal, including LOS, NLOS, constructive MP and destructive MP. LOS: line-of-sight, NLOS: non-line-of-sight, MP: multipath.
Remotesensing 11 01851 g001
Figure 2. Maximum correlation values with regards to satellite elevation angle for data collected in open-sky areas.
Remotesensing 11 01851 g002
Figure 3. Real-world MP/NLOS autocorrelation functions overlapped for 20 ms: (a) Constructive MP (Elevation angle: 33.8°); (b) Destructive MP (Elevation angle: 33.8°); (c) NLOS (Elevation angle: 24.8°).
Remotesensing 11 01851 g003
Figure 4. Demonstration of early late phase feature using the simulated MP signal with a fixed carrier phase difference ( π / 2 rad) to the direct LOS signal: (a) Early correlator outputs. Red dots denote the simulated MP. Blue dots denote the direct LOS signal; (b) Late correlator outputs; (c) Early late phase values. ELP: early late phase
Remotesensing 11 01851 g004
Figure 5. Signal type labelling using Skymask. The green denotes the LOS satellite, and the red represents the NLOS satellite.
Remotesensing 11 01851 g005
Figure 6. Illustration of code pseudorange double difference.
Remotesensing 11 01851 g006
Figure 7. Flowchart of the proposed Skymask plus code pseudorange double difference observable for labelling signal type. 3D: 3 dimensional, GPS: global positioning system, IF: intermediate frequency, SDR: software defined receiver, DD: double difference, RMS: root mean square
Remotesensing 11 01851 g007
Figure 8. Code pseudorange double difference observable for satellites in Figure 5.
Remotesensing 11 01851 g008
Figure 9. Experimental setup. RINEX: receiver independent exchange format, NMEA: national marine electronics association.
Remotesensing 11 01851 g009
Figure 10. Data collection locations: (a) Dataset A; (b) Dataset B; (c) Dataset C. Skymask in the red frame indicates the sky visibility, where the gray area represents the sky blocked by surrounding buildings.
Remotesensing 11 01851 g010
Figure 11. Point cloud of labelled data. (a) Labelled data in three-dimensional (3D) space; (b) Labelled data regarding C / N 0 and satellite elevation; (c) Labelled data regarding C / N 0 and pseudorange rate consistency.
Remotesensing 11 01851 g011
Figure 12. Recall value for LOS/MP/NLOS in Test I for different level classifiers.
Remotesensing 11 01851 g012
Figure 13. Recall value for LOS and NLOS signal in Test I for different level classifiers.
Remotesensing 11 01851 g013
Figure 14. Comparison of the training and testing accuracy. All datasets were mixed to form a whole dataset, from which half was randomly selected as the training data, while the remaining half as the testing data: (a) LOS/MP/NLOS classification accuracy; (b) LOS/NLOS classification accuracy.
Remotesensing 11 01851 g014
Table 1. Coefficients in Equation (7), estimated using least-squares method.
Coefficients c 0 c 1 c 2 c 3
Values4092.97340.42−2.990.03
Table 2. RINEX- and NMEA-level features.
Features C / N 0 Satellite ElevationPseudorange Rate Consistency
NMEA-level
RINEX-level
Table 3. Statistics of code pseudorange double difference observables.
PRN Number5122930
Mean (m)17.2948.8087.61111.34
RMS (m)18.8555.8192.02112.16
Table 4. Parameter settings. E and L are the early and late correlator outputs defined in Equation (5). Q P and I P are prompt correlation values of quadrature and in-phase channels, respectively. RHCP: right-handed circular polarization, GNSS: global navigation satellite system, SVM: support vector machine.
ItemParameterValueUnit
AntennaPolarizationRHCP-
Low noise amplifier gain27dB
Noise figure≤2dB
Front-endGNSS signalGPS L1 C/A-
Sampling rate26MHz
Intermediate frequency0MHz
Double sided bandwidth8MHz
Noise figure8dB
RF gain10dB
SDR [38]Correlator numbers25-
Correlator spacing0.05chip
Coherent integration time1ms
Code phase discriminator 1 2 E L E + L -
Delay lock loop bandwidth2Hz
Carrier phase discriminator tan 1 ( Q P / I P ) -
Phase lock loop bandwidth20Hz
SVMSoftwareLIBSVM [39]-
Kernel functionRadial basis function (RBF)-
Table 5. Labelling results in terms of numbers of different signal types.
DatasetABC
IF data length (min)13.37.29.9
LOS419 (418) 1504 (480)1083 (1079)
MP1139 (1131)692 (679)213 (213)
NLOS1402 (1367)695 (686)753 (749)
Total2960 (2916)1891 (1845)2049 (2041)
1 Values outside the bracket denote numbers of different signal types used for correlator-level classifiers; Values in the bracket denote numbers of different signal types used for RINEX- and NMEA-level classifiers.
Table 6. Multiclass confusion matrix. l denotes the number of classes. n k j , 1 k , j l represents the number of examples classified as c j , while its actual class is c k .
Classified   Class   c 1 Classified   Class   c i Classified   Class   c l
Labelled Class c 1 n 11 n 1 i n 1 l
Labelled Class c i n i 1 n i i n i l
Labelled Class c l n l 1 n l i n l l
Table 7. LOS/MP/NLOS classification results using different-level classifiers.
NMEA-Level Classification ResultsRINEX-Level Classification ResultsCorrelator-Level Classification Results
LOSMPNLOSLOSMPNLOSLOSMPNLOS
Labelled ResultsLOS15457535014856436772234714
MP2118482118754715115
NLOS016658321795685101647
F1 Score58.0257.3572.91
Overall Accuracy (%)45.1244.2474.18
Table 8. LOS/NLOS classification results using different level classifiers.
NMEA-Level Classification ResultsRINEX-Level Classification ResultsCorrelator-Level Classification Results
LOSNLOSLOSNLOSLOSNLOS
Labelled ResultsLOS1194981153139127917
NLOS286522288520179633
F1 Score80.4278.1190.39
Overall Accuracy (%)81.7179.6790.70

