Article

A New Method for Characterizing NOAA-20/S-NPP VIIRS Thermal Emissive Bands Response Versus Scan Using On-Orbit Pitch Maneuver Data

1
Global Science and Technology (GST), Inc., Greenbelt, MD 20770, USA
2
NOAA/Center for Satellite Applications and Research, College Park, MD 20740, USA
*
Author to whom correspondence should be addressed.
Remote Sens. 2019, 11(13), 1624; https://doi.org/10.3390/rs11131624
Submission received: 30 May 2019 / Revised: 5 July 2019 / Accepted: 7 July 2019 / Published: 9 July 2019
(This article belongs to the Collection Visible Infrared Imaging Radiometers and Applications)

Abstract

:
The on-orbit calibration of Visible Infrared Imaging Radiometer Suite (VIIRS) Thermal Emissive Bands (TEB), onboard the National Oceanic and Atmospheric Administration-20 (NOAA-20) and the Suomi National Polar-orbiting Partnership (S-NPP) satellites, have been stable during nominal operations. However, larger than expected scan angle/scene temperature dependent biases, relative to the co-located Cross-track Infrared Sounder (CrIS) observations, were observed in the NOAA-20 longwave infrared (LWIR) bands. The Response Versus Scan (RVS) effect—the variation of instrument reflectance of source radiance with scan angle, is a significant contributor to VIIRS calibration. TEB RVS is characterized using prelaunch test data and verified on-orbit using pitch maneuver data. This study presents a new method that characterizes VIIRS on-orbit TEB RVS at both Earth View (EV) and Space View (SV) scan angles simultaneously. This method was compared with an existing on-orbit RVS method (the Wu et al. method), which derives RVS at EV scan angles using pitch maneuver data and extrapolates SV RVS from EV. The new method derived on-orbit RVS differ from prelaunch values up to 1.0% at the beginning of scan in the NOAA-20 LWIR bands, and ~0.5% in S-NPP M15. VIIRS–CrIS inter-comparison results indicates that the new method derived on-orbit RVS can effectively minimize LWIR scan angle/scene temperature dependent biases, with scan averaged biases reduced from 0.40K to 0.15K for NOAA-20 LWIR bands, and from 0.24K to 0.08K for S-NPP M15. The Wu et al. method can also reduce the scan angle dependent biases, but at the expense of increasing the scene temperature dependent biases.

Graphical Abstract

1. Introduction

The second Visible Infrared Imaging Radiometer Suite (VIIRS) instrument, onboard the National Oceanic and Atmospheric Administration-20 (NOAA-20) satellite, was launched on November 18, 2017, following six years of successful operation by its predecessor on the Suomi National Polar-orbiting Partnership (S-NPP) satellite. VIIRS has 22 spectral bands, including 14 Reflective Solar Bands (RSB), 7 Thermal Emissive Bands (TEB), and 1 Day-Night-Band (DNB). NOAA-20 and S-NPP VIIRS Sensor Data Records (SDR) achieved validated maturity status in April 2018 and December 2013, respectively. Among the 7 TEBs, there are 3 mid-wave infrared bands (MWIR, M12–M13 and I4) on the short and mid-wave infrared (S/MWIR) cold Focal Plane Assembly (FPA) and 4 long-wave infrared bands (LWIR, M14–M16 and I5) on the LWIR cold FPA. Table 1 summarizes spectral, spatial, and radiometric characteristics of NOAA-20 and S-NPP VIIRS TEBs. With heritage from the Moderate Resolution Imaging Spectroradiometer (MODIS) and the Advanced Very High-Resolution Radiometer (AVHRR), VIIRS TEB SDRs are widely used for monitoring severe weather events and deriving a variety of environmental data records (EDR), such as sea/land/ice surface temperature, active fires, and cloud and aerosol properties [1,2].
VIIRS is a scanning radiometer with a Rotating Telescope Assembly (RTA) that rotates 360° to collect signals from the Earth View (EV) port and the onboard calibrators including Solar Diffuser (SD), blackbody (OBCBB), and Space View (SV) port. VIIRS EV has a nominal scan range of ±56.063°. A two-sided Half Angle Mirror (HAM) is used to direct source radiance exiting from the RTA into the aft-optics. The reflectance of the HAM varies with the scan angle due to the change of angle of incidences (AOI) of the radiance on the HAM. In the VIIRS calibration algorithm, Response Versus Scan (RVS) is used to account for the change of reflectance with AOI on the HAM across a scan [3,4,5]. It is used for both on-orbit degradation factor estimation and EV radiance calculation. Up to date, prelaunch characterized RVS look-up-tables (LUT) have been used in the NOAA-20 and S-NPP operational VIIRS SDR processing [6]. Details of the NOAA-20 and S-NPP prelaunch VIIRS RVS characterization is available in Moyer et al. [4].
The on-orbit calibrations of NOAA-20 and S-NPP VIIRS TEB are monitored routinely at the NOAA Center for Satellite Applications and Research (STAR) to ensure quality SDR products. S-NPP TEB on-orbit degradations are very limited. NOAA-20 VIIRS TEB had a LWIR degradation issue during the Post-Launch Testing (PLT), or extensive Cal/Val period, but the issue was successfully resolved after the Mid-Mission Outgassing on March 12, 2018, with LWIR responsivity back to the levels similar to the beginning of the mission [7,8]. After the outgassing, NOAA-20 TEB calibration has remained stable and similar to S-NPP. Note all degradations in S-NPP and NOAA-20 have been accounted for by the on-orbit calibration. Overall, during nominal operations, NOAA-20 and S-NPP VIIRS TEBs agree with co-located Cross-track Infrared Sounder (CrIS) observations to about 0.1K at near nadir locations. However, persistent larger than expected scan angle and scene temperature dependent biases, relative to CrIS, have been observed in the NOAA-20 LWIR bands, especially in M15 (up to ~1.0K at the beginning of scan). On the other hand, the scan angle and scene temperature dependent biases in S-NPP are much smaller (within ~0.3K).
VIIRS TEB on-orbit calibration is performed scan by scan. RVS is the only known calibration parameter that varies with the scan angle. Moreover, errors in RVS also introduce scene temperature dependent biases due to the nonlinear relationship between radiance and brightness temperature (BT) at the MWIR and LWIR wavelengths. Moyer et al. [9] empirically modified the prelaunch RVS to reduce the scan angle/scene temperature dependent biases in NOAA-20 M15. However, other NOAA-20 VIIRS TEBs have not been studied, and the root cause of the observed NOAA-20 LWIR scan angle/scene temperature dependent biases remains uncertain.
Fortunately, VIIRS TEB RVS can also be estimated post-launch using observations from on-orbit spacecraft pitch maneuvers, which were performed during NOAA-20 and S-NPP PLT periods. During a spacecraft pitch maneuver, VIIRS observes deep space and provides an opportunity to characterize on-orbit TEB RVS (as well as DNB dark offset). Wu et al. [5,10,11] developed a method for verifying prelaunch TEB RVS at the EV scan angle range using pitch maneuver data. This method will be referred to as the Wu et al. method in the rest of the text for convenience. Results show that the prelaunch and on-orbit pitch maneuver based RVS (on-orbit RVS) agree within 0.3% for NOAA-20 [11] and within 0.4% for S-NPP [5]. Despite that, no study has been performed yet to investigate if the on-orbit RVS can be implemented operationally to reduce the scan angle and/or scene temperature dependent biases. NOAA operational processing requires EV RVS to be normalized to SV. The Wu et al. method estimates the shapes of RVS at the EV scan angle range only using pitch maneuver data; SV RVS needs to be extrapolated from EV RVS. There is a need to investigate if on-orbit RVS at both EV and SV scan angles can be derived simultaneously. Moreover, it is valuable to re-assess the NOAA-20 TEB RVS using pitch maneuver data independently.
This study presents a new method for estimating VIIRS TEB RVS using on-orbit pitch maneuver data at both EV and SV scan angles simultaneously. The new method will be referred to as the Wang et al. method in the rest of the text for convenience. Prelaunch RVS was assessed using the on-orbit RVS derived using both the Wang et al. method and the existing Wu et al. method. The impacts of on-orbit RVS on the scan angle/scene temperature dependent biases were analyzed using reprocessed VIIRS SDRs and co-located CrIS observations. Three more Joint Polar Satellite System satellites (JPSS), J2–J4, will be launched in the coming years. The methodology developed in this study may also be applied to the VIIRS onboard the future J2–J4 satellites. This paper is organized as follows. Section 2 gives an overview of VIIRS TEB calibration algorithm and the VIIRS scan angle/scene temperature dependent biases. Section 3 presents the two on-orbit RVS methods: (1) the Wu et al. method, and (2) the Wang et al. method. Section 4 compares the prelaunch and on-orbit RVS. The impacts of the on-orbit RVS on NOAA-20 and S-NPP TEB SDRs are assessed and discussed in Section 5. Section 6 summarizes this study.

2. VIIRS TEB On-Orbit Calibration Algorithm and Scan Angle/ Scene Temperature Dependent Biases

2.1. VIIRS TEB On-Orbit Calibration Algorithm

VIIRS S/MWIR and LWIR FPAs are cooled down to nominal operating temperatures (NOAA-20: 80.5K; S-NPP: 80.0K) with a passive radiative cooler [2]. The temperature controlled OBCBB is the primary TEB calibration source. It provides absolute calibration traceable to the National Institute of Standards and Technology (NIST). SV provides the dark background reference. VIIRS TEBs are calibrated on a scan-by-scan basis. On-orbit detector response degradation factors (F-factor) are derived using the on-orbit OBCBB and SV measurements, as well as prelaunch calibration coefficients (C-coefficients) and other parameters. Effects of instrument self-emission and RVS are accounted for during calibration. Prelaunch characterized RVS is currently used in the NOAA-20 and S-NPP operational processing. All TEB calibration terms remain the same within one scan, except for RVS that varies with the scan angle. Details of the VIIRS TEB calibration algorithm and procedures are described in previous publications [3,12,13,14]. Equations (1) and (2) show how the VIIRS TEB EV radiance is calculated:
L e v = F · ( c 0 + c 1 · d n e v + c 2 · d n e v 2 ) ( R V S e v R V S s v ) · L m i r r o r R V S e v
L m i r r o r = ( 1 ρ R T A ) · L R T A L H A M ρ R T A
where L e v is EV spectral radiance entering the instrument aperture; c 0 , c 1 , and c 2 are calibration coefficients (C-coefficients) derived from prelaunch test data; d n e v is the EV digital count with the SV count subtracted; R V S e v is RVS at EV AOI on the HAM; R V S s v is RVS at SV AOI on the HAM ( all RVS values are normalized to SV in the NOAA operational processing, therefore R V S s v = 1 ) ; L m i r r o r is instrument background emission; ρ R T A is the RTA reflectivity; L R T A is RTA emitted radiance; L H A M is HAM emitted radiance. F is detector and HAM-side dependent on-orbit degradation factor (F-factor), which is calculated scan-by-scan using Equation (3):
F = R V S b b · L b b _ e m i t t e d + r e f l e c t e d + ( R V S b b R V S s v ) · L m i r r o r ( c 0 + c 1 · d n b b + c 2 · d n b b 2 )
where R V S b b is RVS at OBCBB AOI on the HAM; L b b _ e m i t t e d + r e f l e c t e d is OBCBB emitted radiance according to Planck’s function and OBCBB shield, cavity, and telescope originated radiance reflected off the OBCBB; d n b b is the OBCBB digital count with the SV count subtracted.

2.2. VIIRS Scan Angle and Angle of Incidence (AOI) on the HAM

VIIRS uses a 4-mirror RTA that rotates 360° to collect source radiance from the EV port, the SD, the OBCBB, and the SV. SD, OBCBB, and SV are located at fixed scan angles, while EV has a nominal scan angle range of ±56.063°. A two-sided HAM, which rotates at half speed of RTA, is used to direct source radiance exiting from the RTA into the aft-optics. Both sides of HAM (HAM-A and HAM-B) are used to ensure that all collected radiances are directed to the detector arrays. The AOIs of source radiance on the RTA mirror and the aft-optics are fixed during a scan. However, AOIs of source radiance on the HAM depend on the scan angle. In the VIIRS calibration algorithm, RVS is used to characterize the effect of the change of source radiance with AOI on the HAM. The relationship between AOI on the HAM and scan angle is given in Equation (4) [4,15]:
A O I = cos 1 [ cos ( A O I m i n ) · cos ( θ 46.0 2 ) ]
where A O I m i n is the minimum reflection angle off the HAM ( A O I m i n = 28.6°, occurs at +46° scan angle), and θ is the scan angle. Figure 1 shows a diagram of VIIRS scan pattern [3]. Scan angles and AOIs at the beginning of EV scan (EVBOS), nadir, the end of EV scan (EVEOS), SV, OBCBB, and A O I m i n , which are relevant to TEB calibration, are also given. The VIIRS calibration algorithm assumes that the RVS is symmetric about +46° scan angle. Therefore, RVS at OBCBB AOI (scan angle +100°) is the same as the RVS at −8° EV scan angle based on the assumption, but the SV AOI is outside of the EV scan angle range [3].

2.3. VIIRS Prelaunch TEB RVS

During the prelaunch test; band, detector, and HAM-side dependent RVS functions are measured using the Laboratory Ambient Blackbody, which is placed at various VIIRS scan angles to ensure a good characterization of RVS at the entire EV and SV scan angle range. The 2nd order polynomial fit is used to model RVS variations to predict RVS at all AOIs [4,15]. In the NOAA operational processing, RVS LUT (VIIRS-SDR-RVF-LUT, where RVF stands for response versus frame, i.e., pixel index along the scan) is used to provide band, detector, and HAM-side dependent RVS values for all EV frames (pixels), SV, and OBCBB. In an operational RVS LUT, all RVS values are normalized to SV, i.e., RVS at SV AOI equals to 1. NOAA-20 and S-NPP operational VIIRS SDRs have been processed using the prelaunch RVS LUTs up-to-date.
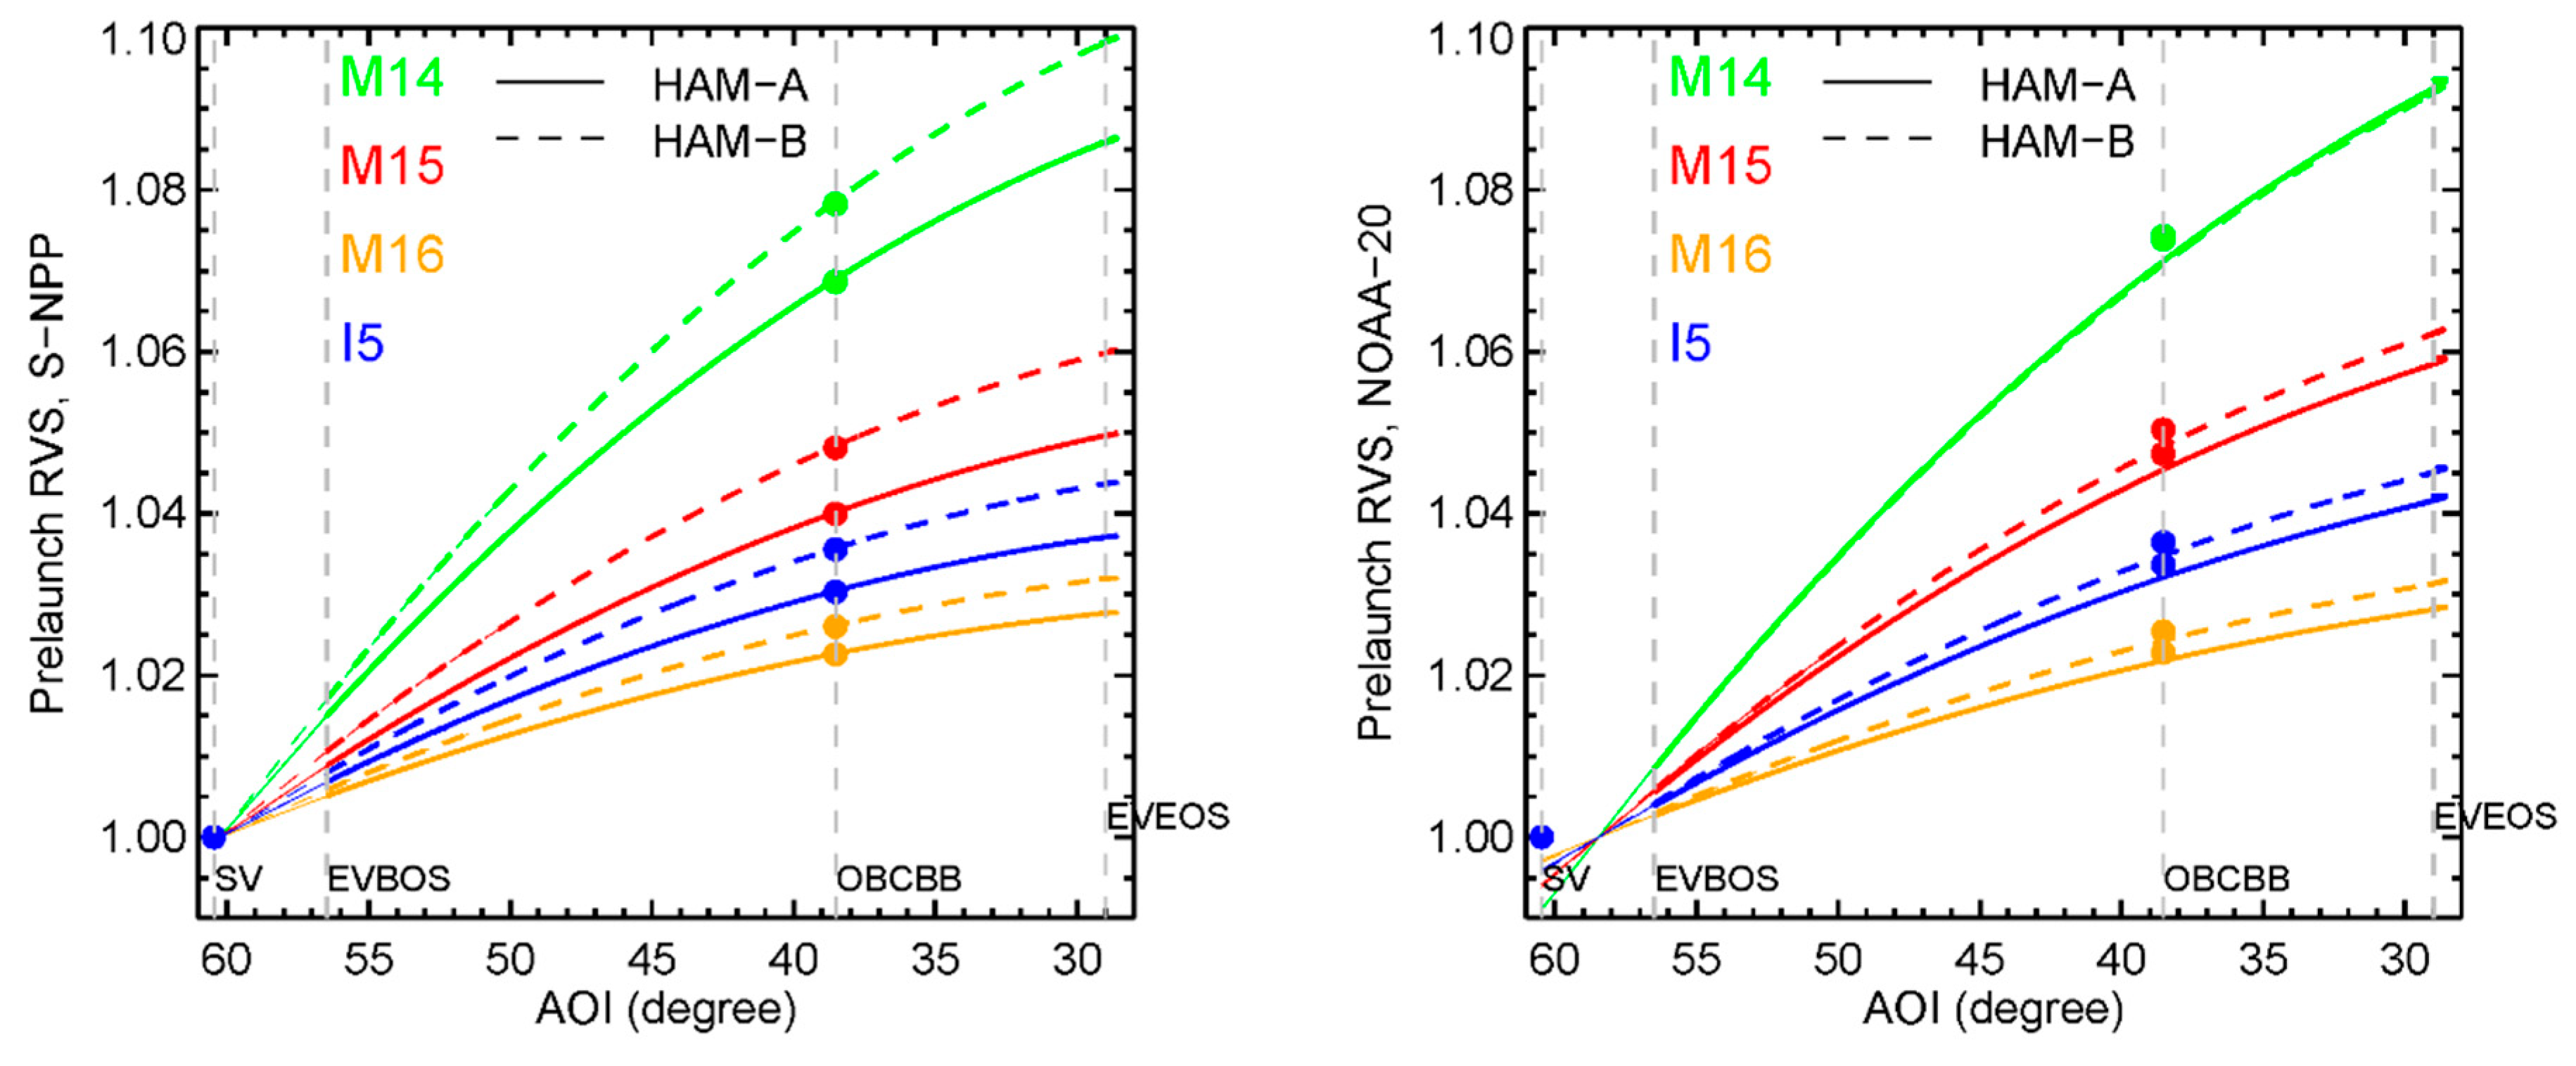
Figure 2 compares S-NPP and NOAA-20 band averaged RVS for the 4 LWIR bands. Prelaunch values from the NOAA operational RVS LUTs were used. The RVS at SV, OBCBB, EVBOS, and EVEOS are also marked. For S-NPP, the values in the operational RVS LUT are consistent with those presented in Moyer et al. [4]. EV RVS at –8° scan angle (AOI = 38.53°) agrees well with OBCBB RVS stored in the LUT. The 2nd order polynomial curves fitted using EV RVS values converge nicely at SV AOI. For NOAA-20, the magnitudes of RVS values at different AOIs are also generally consistent with those reported by Moyer et al. [4]. However, there are three discrepancies in the NOAA-20 prelaunch RVS LUT (similar issues were also observed in the NOAA-20 MWIR and RSB bands):
  • Inconsistent RVS values exist near AOImin (28.60°). In other words, different RVS values occur when the AOIs are the same.
  • In a prelaunch RVS LUT, all values are modeled using 2nd order polynomials as functions of AOIs and normalized to SV [4]. However, in the NOAA-20 operational RVS LUT, 2nd order polynomial curves fitted using EV RVS converge ~2° earlier than SV AOI, consistent with the −2° AOI error in the prelaunch M15 RVS found in Moyer et al. [9].
  • OBCBB RVS values do not match EV RVS at −8° scan angle.

2.4. VIIRS TEB Scan Angle and Scene Temperature Dependent Biases

The on-orbit calibrations of NOAA-20 and S-NPP VIIRS have been monitored closely to ensure quality TEB SDRs. OBCBB temperature uniformity, S/MWIR and LWIR FPA temperatures, instrument temperatures, and on-orbit calibration factors (F-factor) are trended routinely. VIIRS TEB calibrations have been stable during nominal operations after achieving validated maturity status since April 2018 and December 2013 for NOAA-20 and S-NPP, respectively. VIIRS TEB SDR performance is monitored using co-located CrIS observations. Our long-term monitoring results show that VIIRS agrees with CrIS on the order of 0.1K at nadir locations for both NOAA-20 and S-NPP.
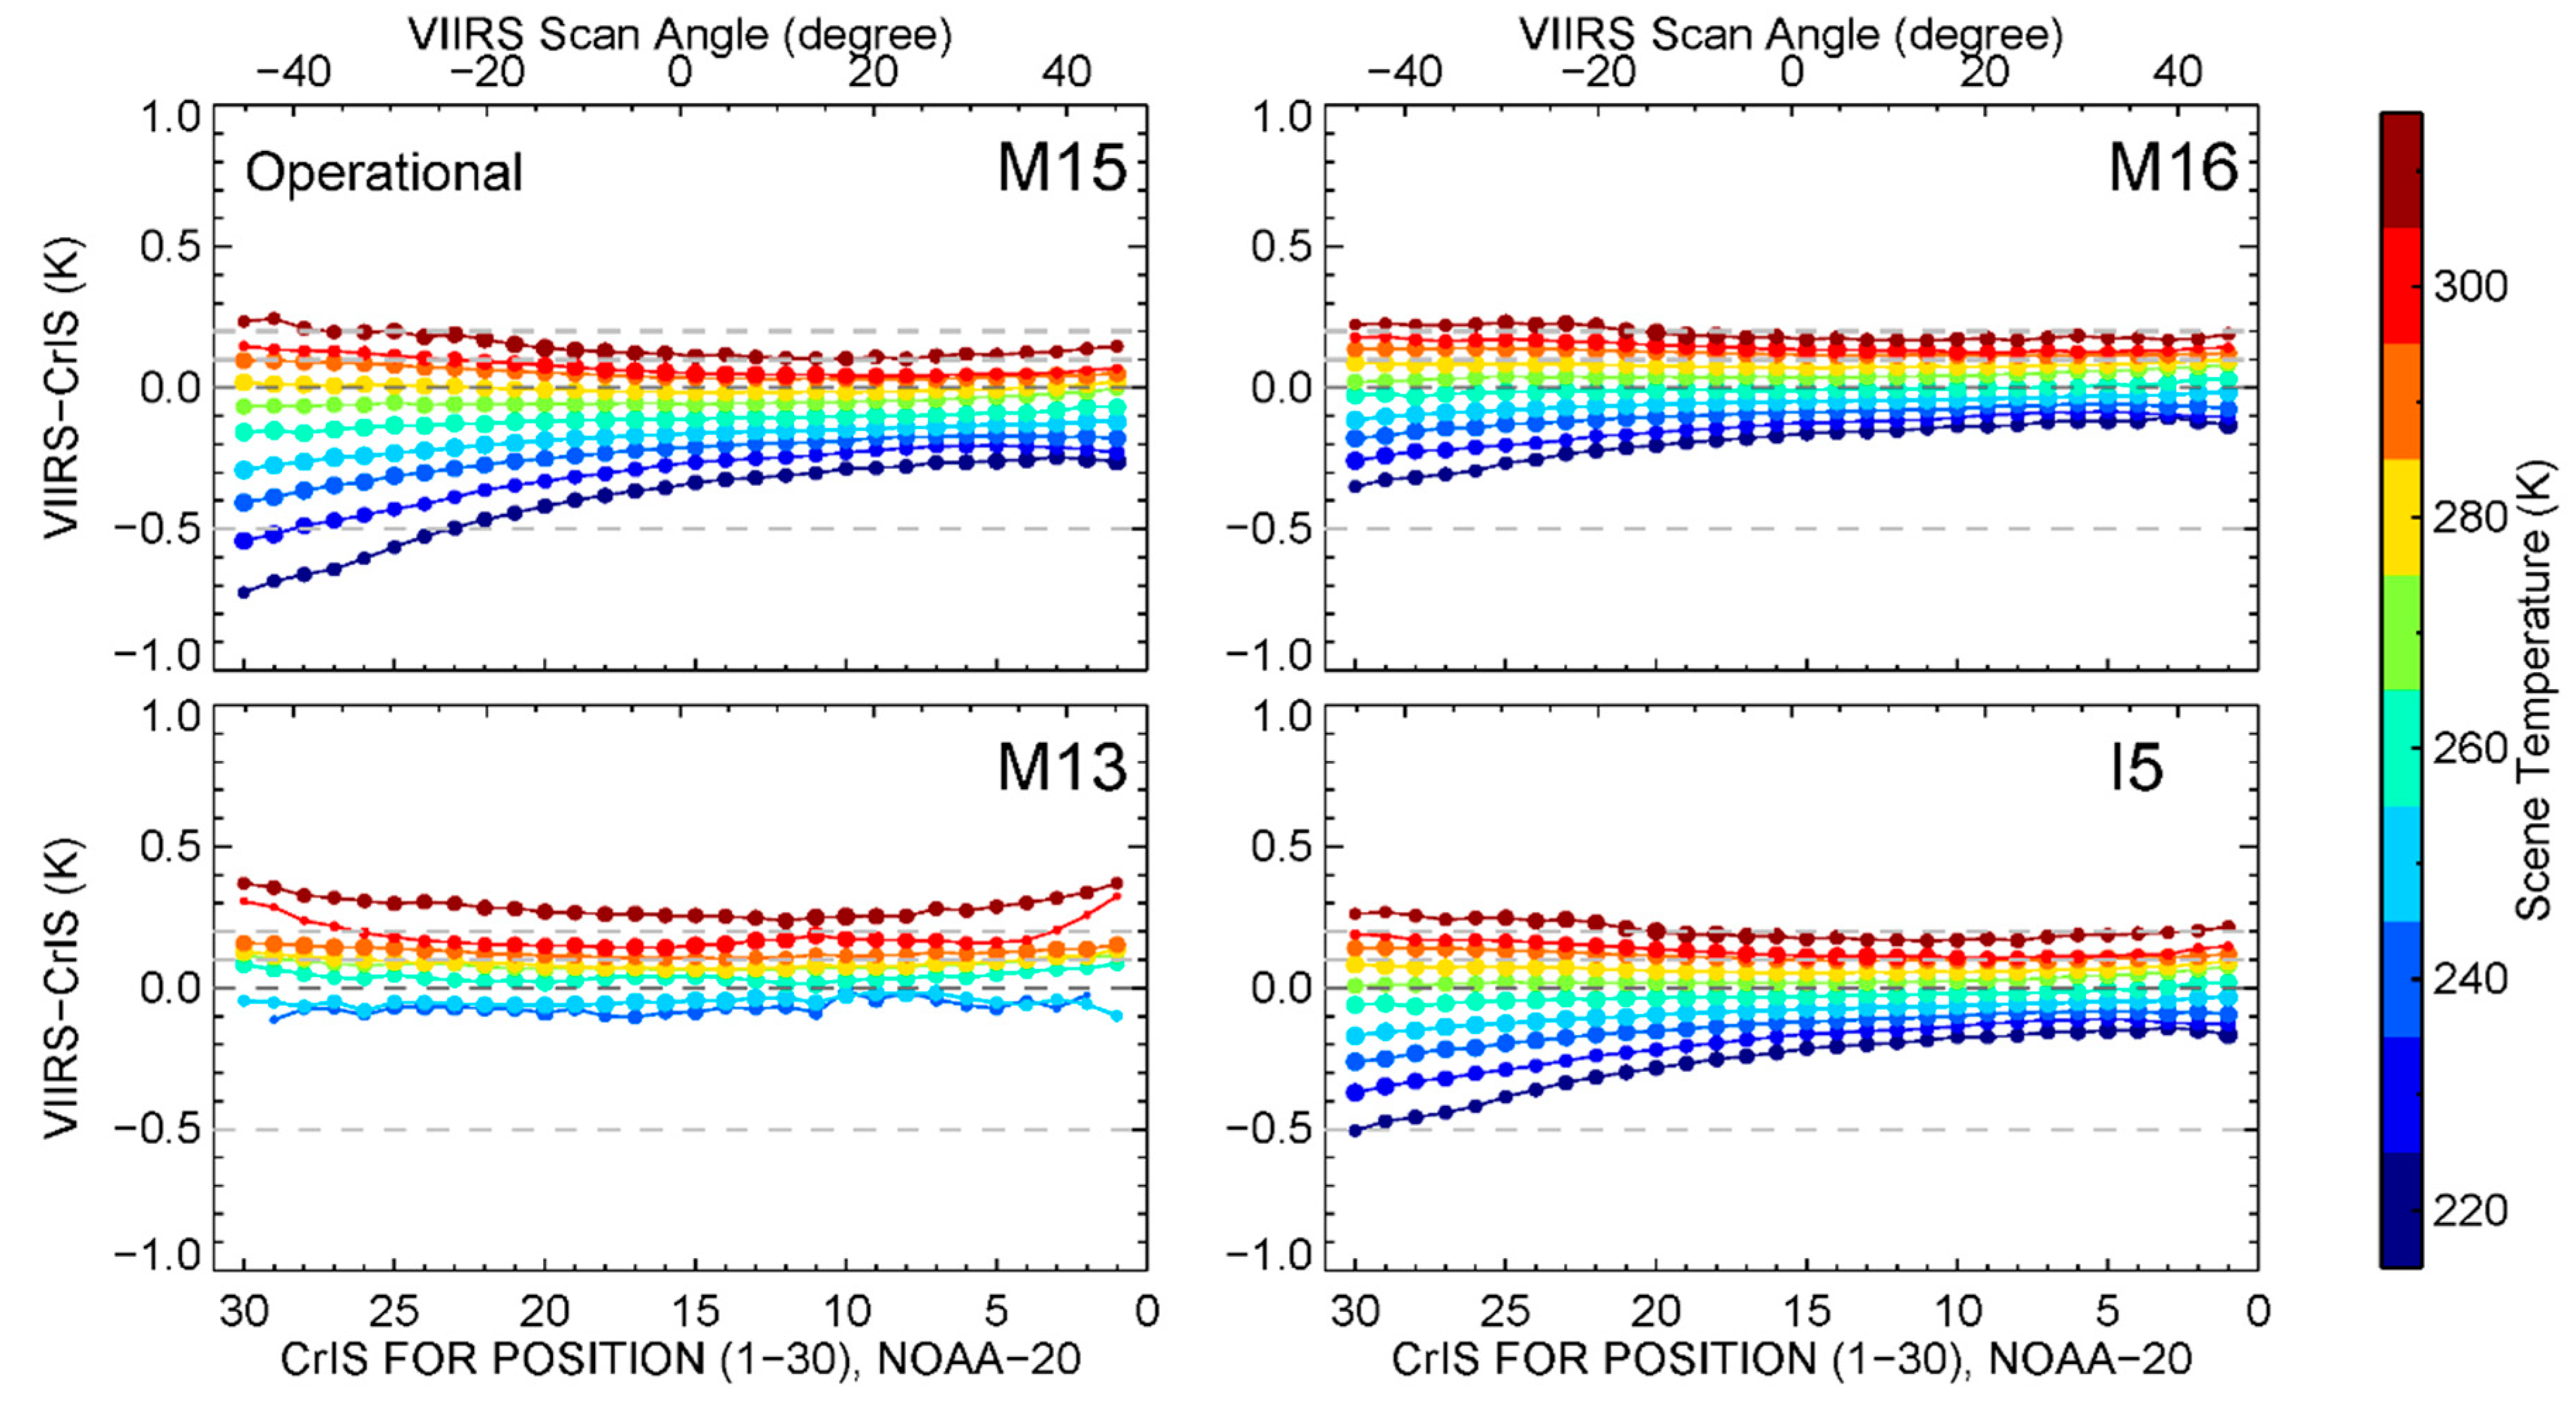
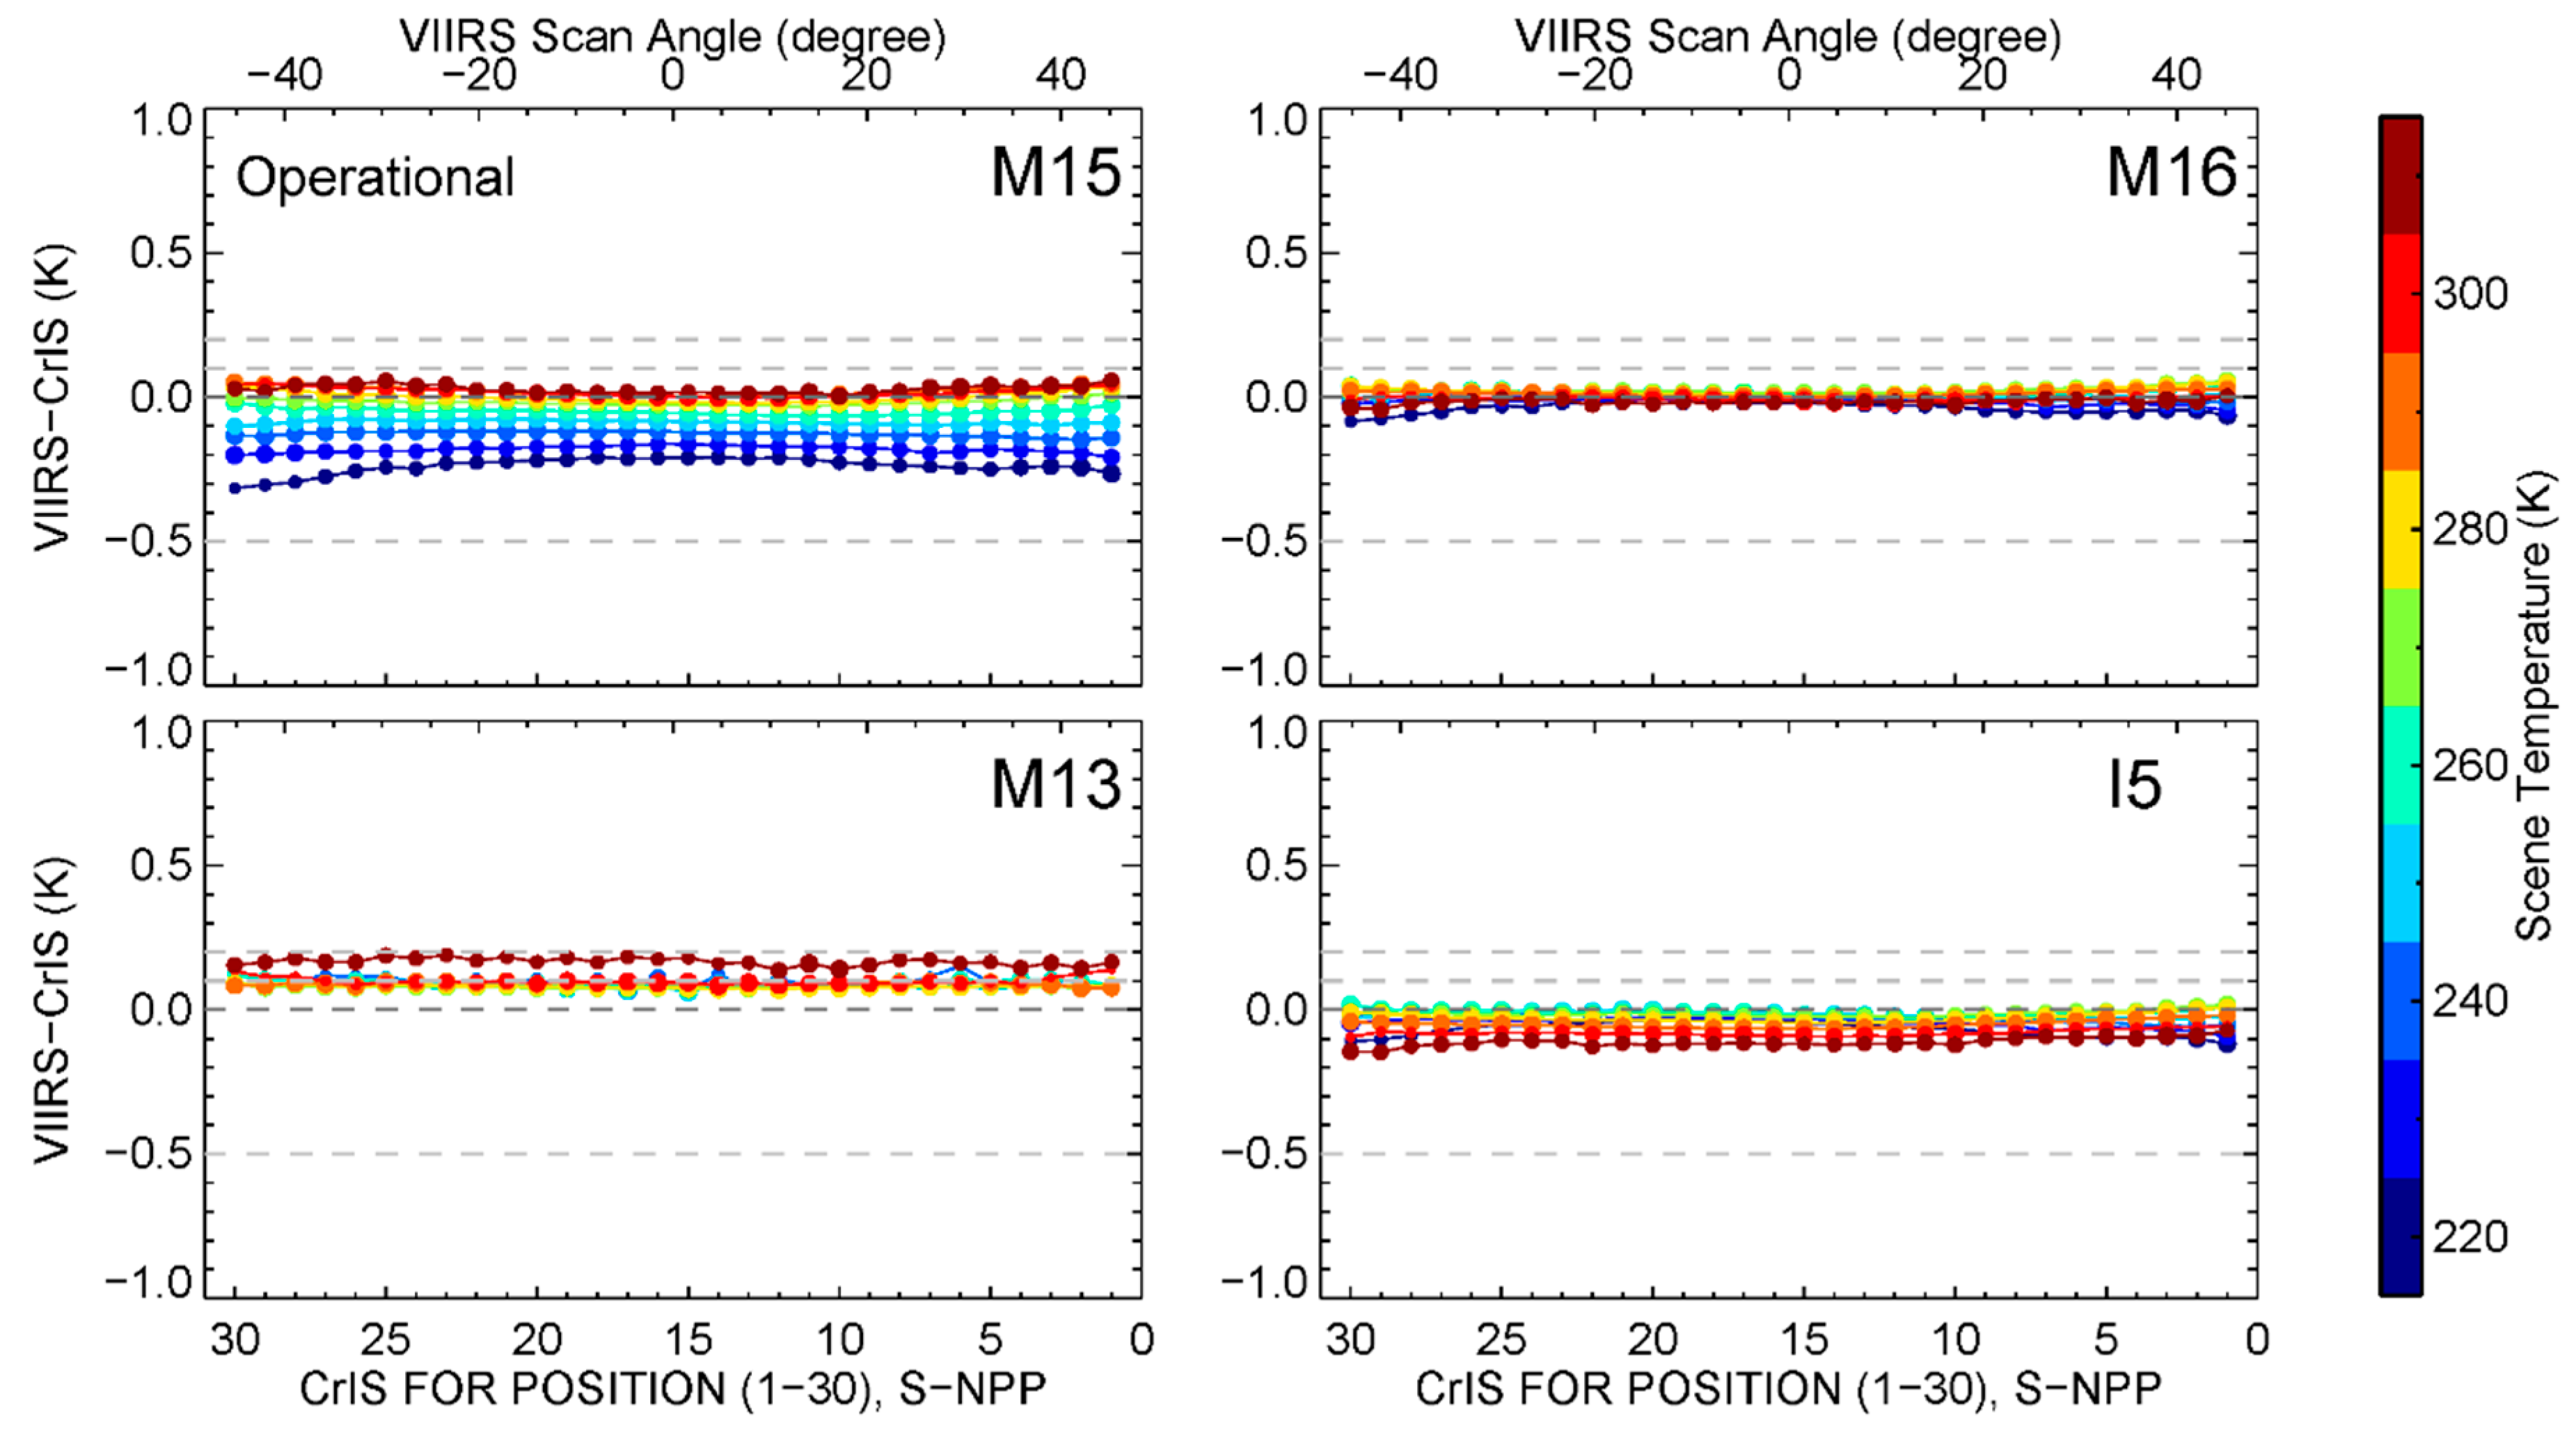
However, persistent larger than expected scan angle and scene temperature dependent biases, relative to co-located CrIS observations, have been observed in the NOAA-20 LWIR bands since the beginning of the mission [9,16]. Figure 3 and Figure 4 compare NOAA-20 and S-NPP VIIRS–CrIS BT differences at 10 scene temperatures and as a function of CrIS field of regard (FOR) position and VIIRS scan angle. One day (March 18, 2019, randomly selected, both VIIRS and CrIS were under nominal operation) of NOAA operational VIIRS TEB SDRs were used. We also checked data during other dates. Results show that the patterns in NOAA-20 scan angle and scene temperature dependent biases do not vary significantly over time; S-NPP TEB bias patterns are also consistent in recent years. A brief description of CrIS observations and VIIRS and CrIS inter-comparison methodology used in this study is given in Section 5.1.
NOAA-20 (see Figure 3) TEBs exhibit obvious scan angle/scene temperature dependent biases. M15 shows the worst case of scan angle/scene temperature dependent biases near EVBOS (up to ~1K), much larger than those near EVEOS (CrIS FOR 1, ~0.4K). Similar biases in M15 were reported in Moyer et al. [9], using data from February 2018. M16 and I5 show similar bias patterns, but their magnitudes are smaller. M13 show little scan angle dependent biases, though scene temperature dependent biases were observed.
The scan angle/scene temperature dependent biases in S-NPP (see Figure 4) are much smaller than those in NOAA-20. Moreover, the biases are nearly constant across scan in all cases. M15 shows slightly larger scan angle/scene temperature dependent biases (~0.3K) compared to M16 and I5, but much smaller than its NOAA-20 counterpart. Similar S-NPP M15 bias patterns were reported by Moyer et al. [9].
Wu et al. [5,11] verified the NOAA-20 and S-NPP prelaunch TEB RVS at the EV scan angle range using pitch maneuver data. Results show that NOAA-20 prelaunch and on-orbit RVS agree within 0.3%, similar to S-NPP (within 0.4%). Though other VIIRS calibration parameters may contribute to the observed scan angle/scene temperature dependent biases, the discrepancies in the NOAA-20 prelaunch RVS LUT (see Figure 2) indicate that it will be useful to re-assess the quality of NOAA-20 prelaunch RVS independently. A re-analysis of the NOAA-20 prelaunch RVS test data and the LUT creation process may also help to address the issues, but the prelaunch RVS LUTs were generated using test data measured under ambient temperature conditions. The thermal environment of the prelaunch test and on-orbit are different. The on-orbit pitch maneuver data may provide a unique insight about the uncertainty of prelaunch TEB RVS. This study focuses on characterizing TEB RVS using on-orbit pitch maneuver data and studying the impacts of on-orbit RVS on TEB calibration.

3. Methods for Characterizing VIIRS TEB RVS Using On-Orbit Pitch Maneuver Data

3.1. Selection of On-orbit Pitch Maneuver Data for TEB RVS Characterization

During NOAA-20 and S-NPP VIIRS PLT, spacecraft pitch maneuvers were performed to characterize DNB calibration offsets and TEB RVS [5,10,11]. During a pitch maneuver, VIIRS has a complete view of deep space for about 25 min, with detectors observing deep space over the entire EV scan angle range, SV, and OBCBB. The thermal emission of deep space is negligible in the infrared spectrum; therefore, radiance received by the TEB detectors is due to the thermal emission of the VIIRS instrument only, including RTA and HAM. The shape of TEB RVS can be determined by measuring the relative change in emissive radiation across the scan. Band, HAM-side, and detector-dependent TEB EV RVS can be derived using data selected based on the following two criteria [5,10,11]:
  • A complete view of the deep space, and away from Earth radiation contamination.
  • S/MWIR and LWIR cold FPAs are stably controlled at nominal operating temperatures.
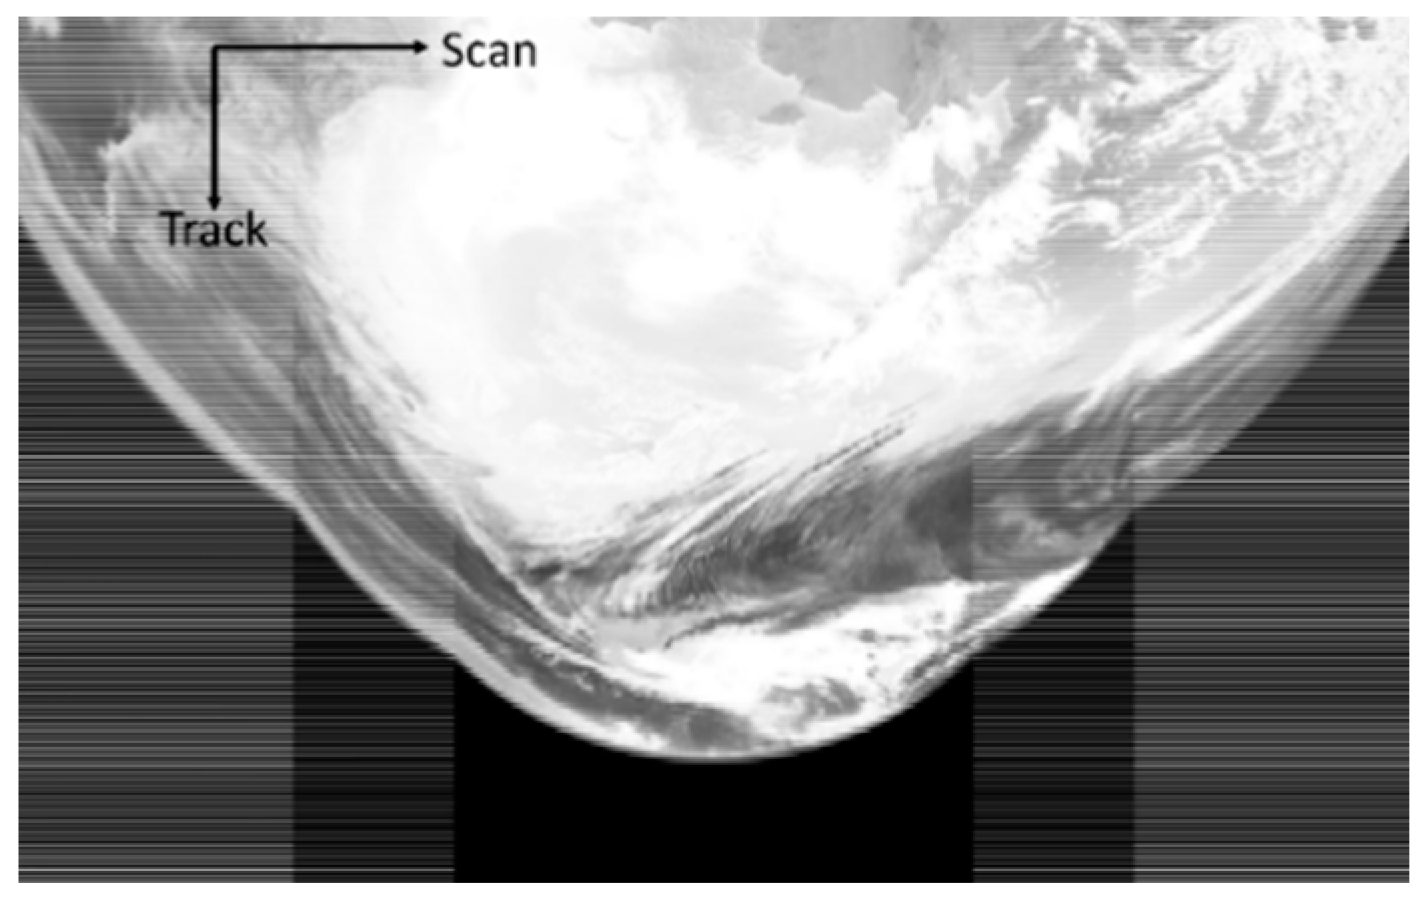
VIIRS pitch maneuver data are available through the NOAA Comprehensive Large Array-data Stewardship System (CLASS) [17]. S-NPP pitch maneuver data is open to the public, while NOAA-20 data require special permission to access. Figure 5 shows an example of VIIRS pitch maneuver data. The image was generated using NOAA-20 M15 EV counts. Three granules (January 31, 2018, 13:42:23–13:48:04 UTC) of Raw Data Records (RDR) during the beginning of the pitch maneuver were used. Details of pitch maneuver data used in this study are summarized in Table 2. Note bowtie deletion [18] is enabled during a pitch maneuver. Detectors 1–2 and 15–16 of M-bands and detectors 1–4 and 29-32 of I-bands cover near nadir frames only, instead of the entire range of EV scan angles. Fortunately, EV RVS at bowtie deletion regions are not required in the TEB calibration.

3.2. The Wu et al. Method

Wu et al. [5] proposed an equation for characterizing band, HAM-side, and detector dependent VIIRS TEB RVS at EV scan angle range (RVSev) using on-orbit pitch maneuver data:
R V S e v = 1.0 + L b b _ e m i t t e d + r e f l e c t e d L m i r r o r · ( D N e v D N e v = b b D N b b D N e v = b b )
where L b b _ e m i t t e d + r e f l e c t e d is OBCBB emitted and reflected radiance; D N e v is EV counts (without SV count subtraction); D N e v = b b is EV counts at OBCBB AOI (38.53°, scan angle = −8°, see Figure 1); D N b b is OBCBB counts (without SV count subtraction); L m i r r o r is instrument self-emission. The equation was derived based on the TEB calibration equations after ignoring the zero offset ( c 0 ) and the nonlinear coefficient ( c 2 ). Details about this method are available in the literature [5]. The R V S e v derived using this equation is normalized to OBCBB by default, which is different from the prelaunch RVS LUT used in the operational processing (normalized to SV).
In the Wu et al. method, 2nd order polynomial curves are fitted using EV on-orbit RVS as a function of AOI to predict RVS at any AOI [5,10,11]:
R V S = a 0 + a 1 · A O I + a 2 · A O I 2
where a 0 , a 1 , and a 2 are 2nd order polynomial coefficients.
To apply on-orbit RVS to operational processing, RVS at SV AOI (RVSsv) and OBCBB AOI (RVSbb) also need to be estimated, and all RVS are required to be normalized to RVSsv. Scan angles at SV, OBCBB, and EV are fully covered during prelaunch testing to ensure accurate RVS characterization. Using on-orbit pitch maneuver data, RVSbb can be interpolated using Equation (6) and OBCBB AOI (–8° EV scan angle). However, the Wu et al. method does not directly estimate RVSsv using pitch maneuver data. Instead, it needs to be extrapolated using Equation (6) and SV AOI. Extrapolation error exists for the on-orbit RVS characterized using this method, when it is applied for SDR processing. Moreover, on-orbit RVS for the detectors affected by bowtie deletion cover near nadir AOIs only, and the extrapolated RVSsv for these detectors suffers even larger uncertainties.

3.3. The Wang et al. Method

In this study, we propose a new method (Wang et al. method) for characterizing TEB RVS at both EV and SV scan angles using pitch maneuver data. The Wang et al. method is based on the TEB calibration equations directly. During a pitch maneuver, VIIRS looks at deep space, therefore, L e v in Equation (1) (see Section 2.1) equals zero. Consistent with the prelaunch RVS, here we also assign RVSsv to unity. Equation (1) can be simplified as:
F · ( c 0 + c 1 · d n e v + c 2 · d n e v 2 ) = ( R V S e v 1 ) · L m i r r o r
From Equation (7), RVSev can be resolved as:
R V S e v = 1 + F · ( c 0 + c 1 · d n e v + c 2 · d n e v 2 ) L m i r r o r
The Wang et al. method uses SV counts for background subtraction, consistent with operational processing. In this study, we examined the SV and OBCBB counts in the pitch maneuver data used for RVS retrieval. Results show that the quality of SV and OBCBB counts are similar to those during the nominal operations. C-coefficients are interpolated using prelaunch values based on electronic and opto-mechanical module temperatures. The Lmirror term, which is the same as those in the Equations (1), (3), and (5), is calculated based on RTA and HAM temperatures and prelaunch calibration LUTs.
The Wang et al. method assumes that C-coefficients are reasonably well characterized prelaunch, although small errors may exist in the prelaunch RVS. For NOAA-20, prelaunch C-coefficients used in this study were derived using measurements from an external NIST traceable blackbody calibration source, located inside the thermal vacuum chamber at a fixed scan angle (~ +41°) [19]. As a result, prelaunch RVS at this scan angle was used for characterizing the prelaunch C-coefficients. A similar arrangement was used to derive the prelaunch C-coefficients for S-NPP. Therefore, the impact of errors in the prelaunch RVS needs to be analyzed in this study.
On-orbit RVS may be affected by errors in the prelaunch zero offset values. Note zero offset is a calibration coefficient that attempts to account for unexplained residual radiances in the TEB calibration equations, including but not limited to the residual radiance due to the inaccurate prelaunch RVS. Since the zero offset and the RTA/HAM temperatures are mostly constant in the scans used for on-orbit RVS retrieval, errors in the prelaunch zero offset are expected to introduce nearly constant biases across scan in the derived on-orbit RVS. On the other hand, on-orbit RVS may also compensate for the errors in prelaunch zero offset. NOAA-20 and S-NPP TEB on-orbit degradations are less than 1% by the time of pitch maneuvers. The errors in the prelaunch calibration slope ( c 1 ) can be mostly compensated for by the on-orbit calibration factor (F-factor, see discussions in next paragraph). The radiances observed by the TEB detectors during a pitch maneuver are very low, with the magnitudes of the SV subtracted EV counts ranging from a few counts (for MWIR) and up to ~90 counts (for LWIR) only. Our analysis shows that the impact of the nonlinear coefficient on the on-orbit RVS is negligible.
The F-factor (F) in Equation (8) is calculated using Equation (3) (see Section 2.1). RVSbb is required to calculate the F-factor. After carefully analyzing the magnitudes of different terms in Equation (8), we found that on-orbit RVS is insensitive to errors in the F-factor. A 0.1% error in the F-factor only results in a 0.01% of error in the on-orbit RVS. Therefore, prelaunch RVSbb can be used to calculate the F-factor without introducing significant errors. In case there exist large errors in the prelaunch RVSbb, on-orbit RVS can be solved iteratively, with prelaunch RVSbb as first guess.
The two methods also differ in how the RVSsv is derived for operational implementation. The Wu et al. method extrapolates RVSsv using 2nd order polynomials fitted using the on-orbit RVS at EV scan angles. The Wang et al. method is computationally more complex than the Wu et al. method, but it estimates on-orbit RVS that is normalized to RVSsv by default. In other words, the Wang et al. method derives the shapes of RVS curves that cover both EV and SV scan angles. For the Wang et al. method, 2nd order polynomial fit (Equation (6)) is used to smooth the EV RVS data only. Therefore, the RVSsv extrapolation error can be prevented.

4. Comparisons of Prelaunch and On-Orbit RVS

4.1. Deriving On-Orbit RVS Using the Wang et al. Method

NOAA-20 and S-NPP VIIRS TEB raw on-orbit RVS data (pixel level, before applying 2nd order polynomial smoothing) were derived using the Wang et al. method (see Equation (8)). All terms required by Equation (8) were calculated following the same methods used in the NOAA operational processing software [20] and input parameters [6]. Prelaunch C-coefficients and RVSbb values were used to calculate F-factors, hence on-orbit RVS. By the time of pitch maneuvers, the NOAA-20 LWIR degradations are within 1% and MWIR degradations are negligible; S-NPP TEB degradations are within 0.5%. The impact of using prelaunch RVSbb on the on-orbit RVS is negligible for both NOAA-20 and S-NPP (see Section 3.3). Our results show that the RVSbb derived and used as input for F-factor calculation converge only after one run in all cases, with difference less than 0.01%.
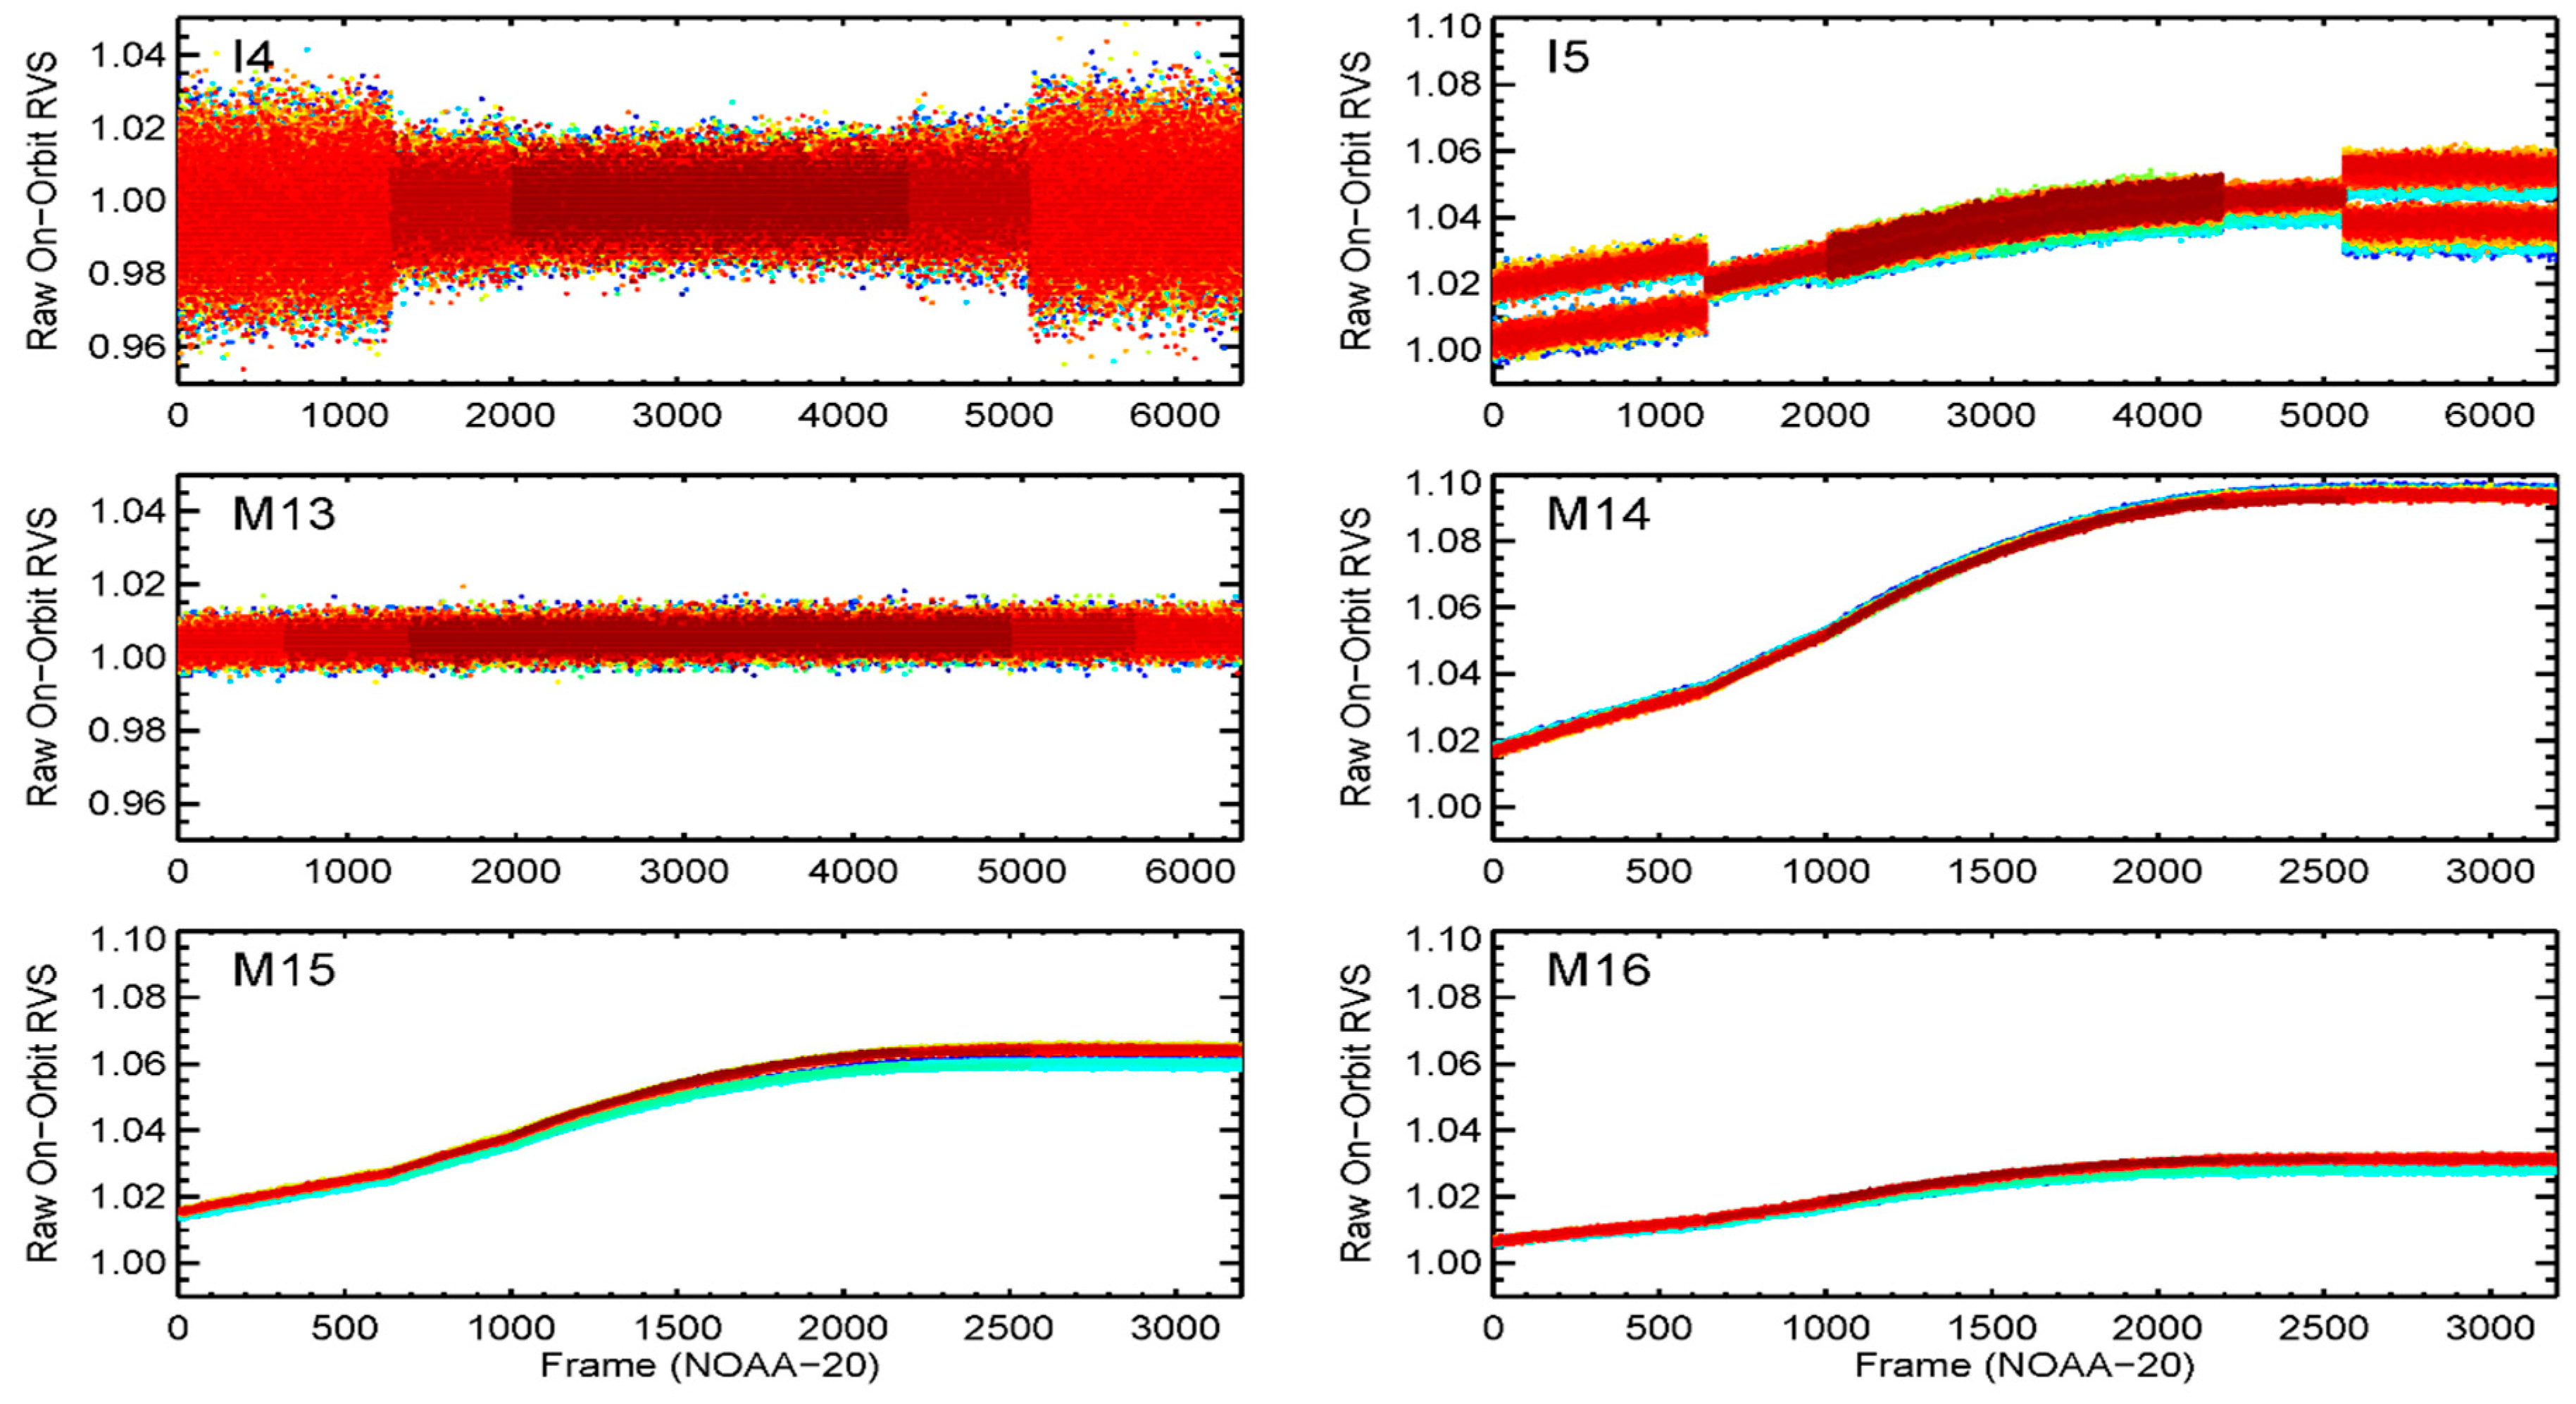
Figure 6 shows NOAA-20 bands I4-I5 and M13-M16 HAM-side, and detector dependent raw on-orbit RVS derived using the Wang et al. method. Band M12 raw on-orbit RVS data is similar to M13. Overall, the magnitudes of on-orbit RVS derived using this method are similar to the prelaunch values reported by Moyer et al. [4], with mean magnitudes of on-orbit RVS varying within ±0.5% for the MWIR bands, and up to 10% for the LWIR bands. The MWIR pitch maneuver data are noisy, because the F · ( c 0 + c 1 · d n e v + c 2 · d n e v 2 ) term in Equation (8) (RVS effect) is within the on-orbit characterized noise equivalent differential radiances (NEdL). The LWIR pitch maneuver data are much cleaner, at least more than 30 times above the on-orbit NEdL. The fork-like features in band I5 near the beginning and end of scan are due to differences in even and odd frames of SV subtracted EV counts, which were averaged out in the 2-sample and 3-sample aggregation zones toward scan center. Similar patterns were observed in the raw on-orbit RVS data for S-NPP.
The Wang et al. method derived raw on-orbit RVS at EV scan angles were further smoothed using 2nd order polynomial fit, with uncertainties (1 sigma) of 0.7%, 0.5%, 0.2%, 0.2%, 0.05%, 0.03%, 0.03% for I4-I5 and M12-M16, respectively. Note that the on-orbit RVSsv remains unchanged (equals to 1). RVSbb was estimated using on-orbit RVS at −8° EV scan angle. The uncertainties for MWIR bands are higher, consistent with the noises observed in the raw RVS data. The uncertainty for I5 is relatively larger than other LWIR bands, mostly due to the even and odd frame effect. Our analysis shows that this effect has little impact on the detector level on-orbit RVS after the data were smoothed.
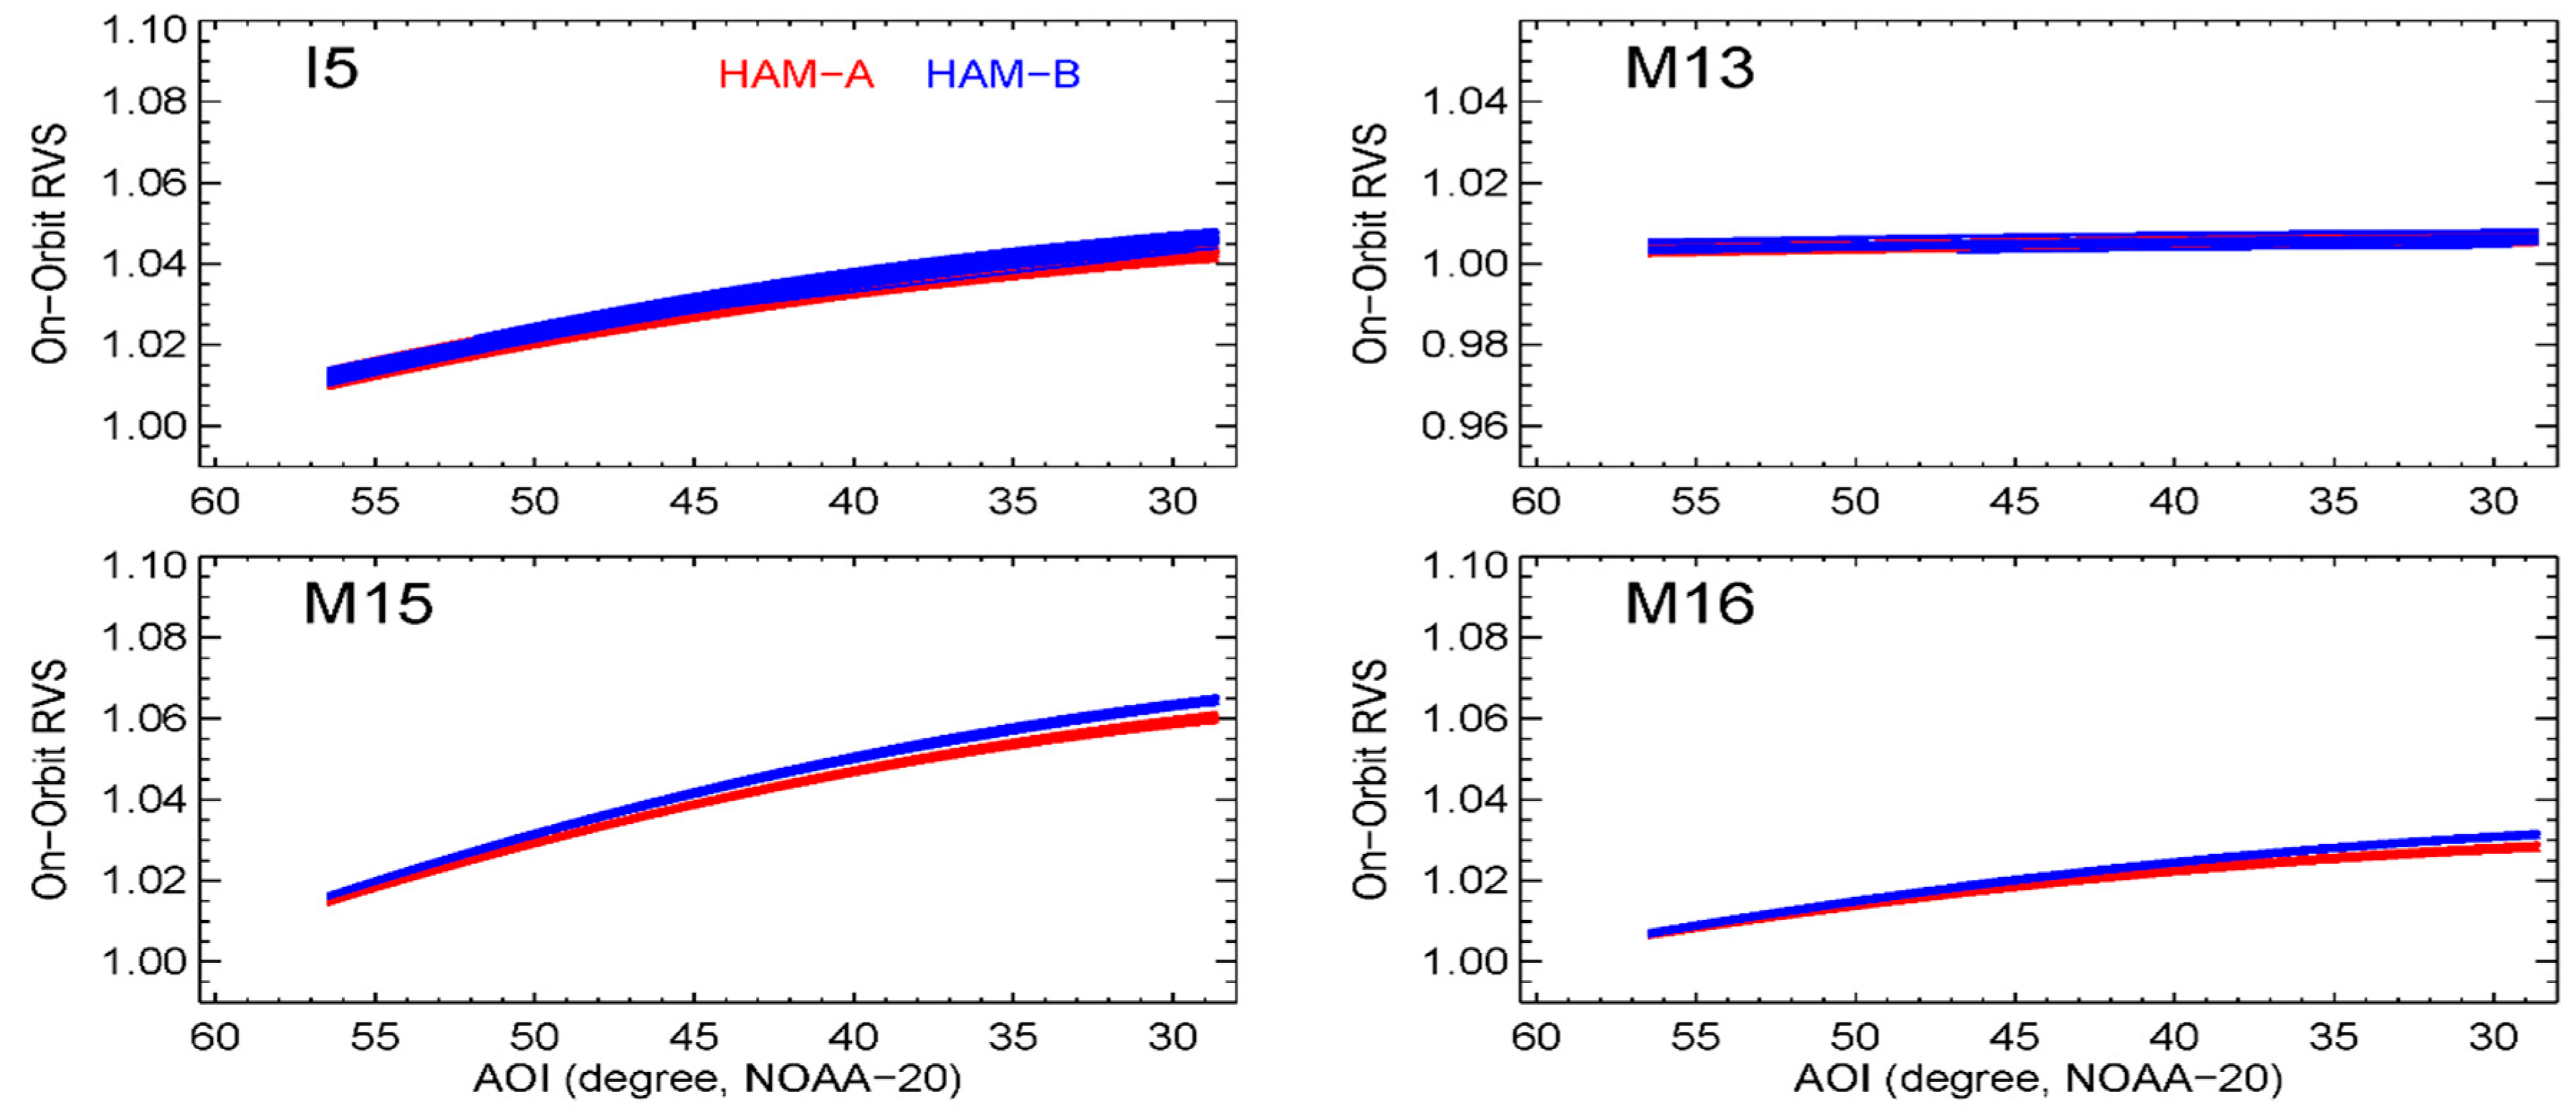
Figure 7 plots NOAA-20 bands I5, M13, and M15–M16 detector level on-orbit RVS as function of AOI (after smoothed using 2nd order polynomials). I4 and M12 detector level RVS patterns are similar to M13, except that the detector level differences are slightly larger; M14 is similar to M15. Obvious HAM-side dependencies were observed in the RVS curves for LWIR bands; while the MWIR RVS curves show little HAM-side dependency. The detector level on-orbit RVS for S-NPP are similar to NOAA-20, except that S-NPP show larger HAM-side dependence (within ±0.8%) in the LWIR bands compared to NOAA-20 (within ±0.3%). The observed HAM-side dependent differences in NOAA-20 and S-NPP on-orbit RVS are generally consistent with prelaunch results [4]. In addition, on-orbit RVS for the detectors affected by bowtie deletion are not significantly different from other detectors.

4.2. Deriving On-orbit RVS Using the Wu et al. Method

In this study, NOAA-20 and S-NPP VIIRS band, HAM-side, and detector dependent on-orbit RVS were also derived using the Wu et al. method. First, raw RVS at the EV scan angle range was estimated using Equation (5). The noise patterns in raw RVS data derived using this method are similar to those derived using the Wang et al. method. Then, 2nd order polynomials were fitted using Equation (6) and the raw RVS to predict RVS at all AOIs, including RVSsv. The fitting uncertainties of the Wu et al. method derived on-orbit RVS are also similar to the Wang et al. method. RVSsv and RVSbb were calculated using the fitted 2nd order polynomial curves. Finally, all on-orbit RVS values were re-normalized to RVSsv to be consistent with the RVS used in the NOAA operational processing. Compared to the Wang et al. method derived on-orbit RVS, the Wu et al. method derived on-orbit RVS exhibits smaller HAM-side dependency. Moreover larger differences were observed between detectors not affected by bowtie deletion and those affected.
We compared the two sets of on-orbit RVS derived in this study, by the Wang et al. method and the Wu et al. method. Both on-orbit RVS were normalized to OBCBB before they were compared. Interestingly, our results indicate that the shapes of the two sets of on-orbit RVS are very close to each other at the EV scan angle range, with differences within ±0.1% for NOAA-20. For S-NPP, the two on-orbit RVS also agree within ±0.1% at all scan angles, except for M14-M15 (up to 0.3% at HAM-B near EVBOS). This study confirms that the simplification of VIIRS TEB calibration equation used by the Wu et al. method is sound for estimating RVS curves at EV scan angle range. Therefore, the two methods are expected to perform similarly for assessing the shape of prelaunch RVS at EV scan angle range in most cases.
It is worth noting that two versions of the on-orbit RVS derived using the Wu et al. method exist: (1) calculated in this study, and (2) reported by Wu et al. [5,11]. These two sets of on-orbit RVS do not agree in all cases. The differences between the on-orbit RVS derived in this study and Wu et al. [5,11] will be discussed in Section 4.4.

4.3. Comparison of Prelaunch RVS and the Wang et al. Method Derived On-Orbit RVS

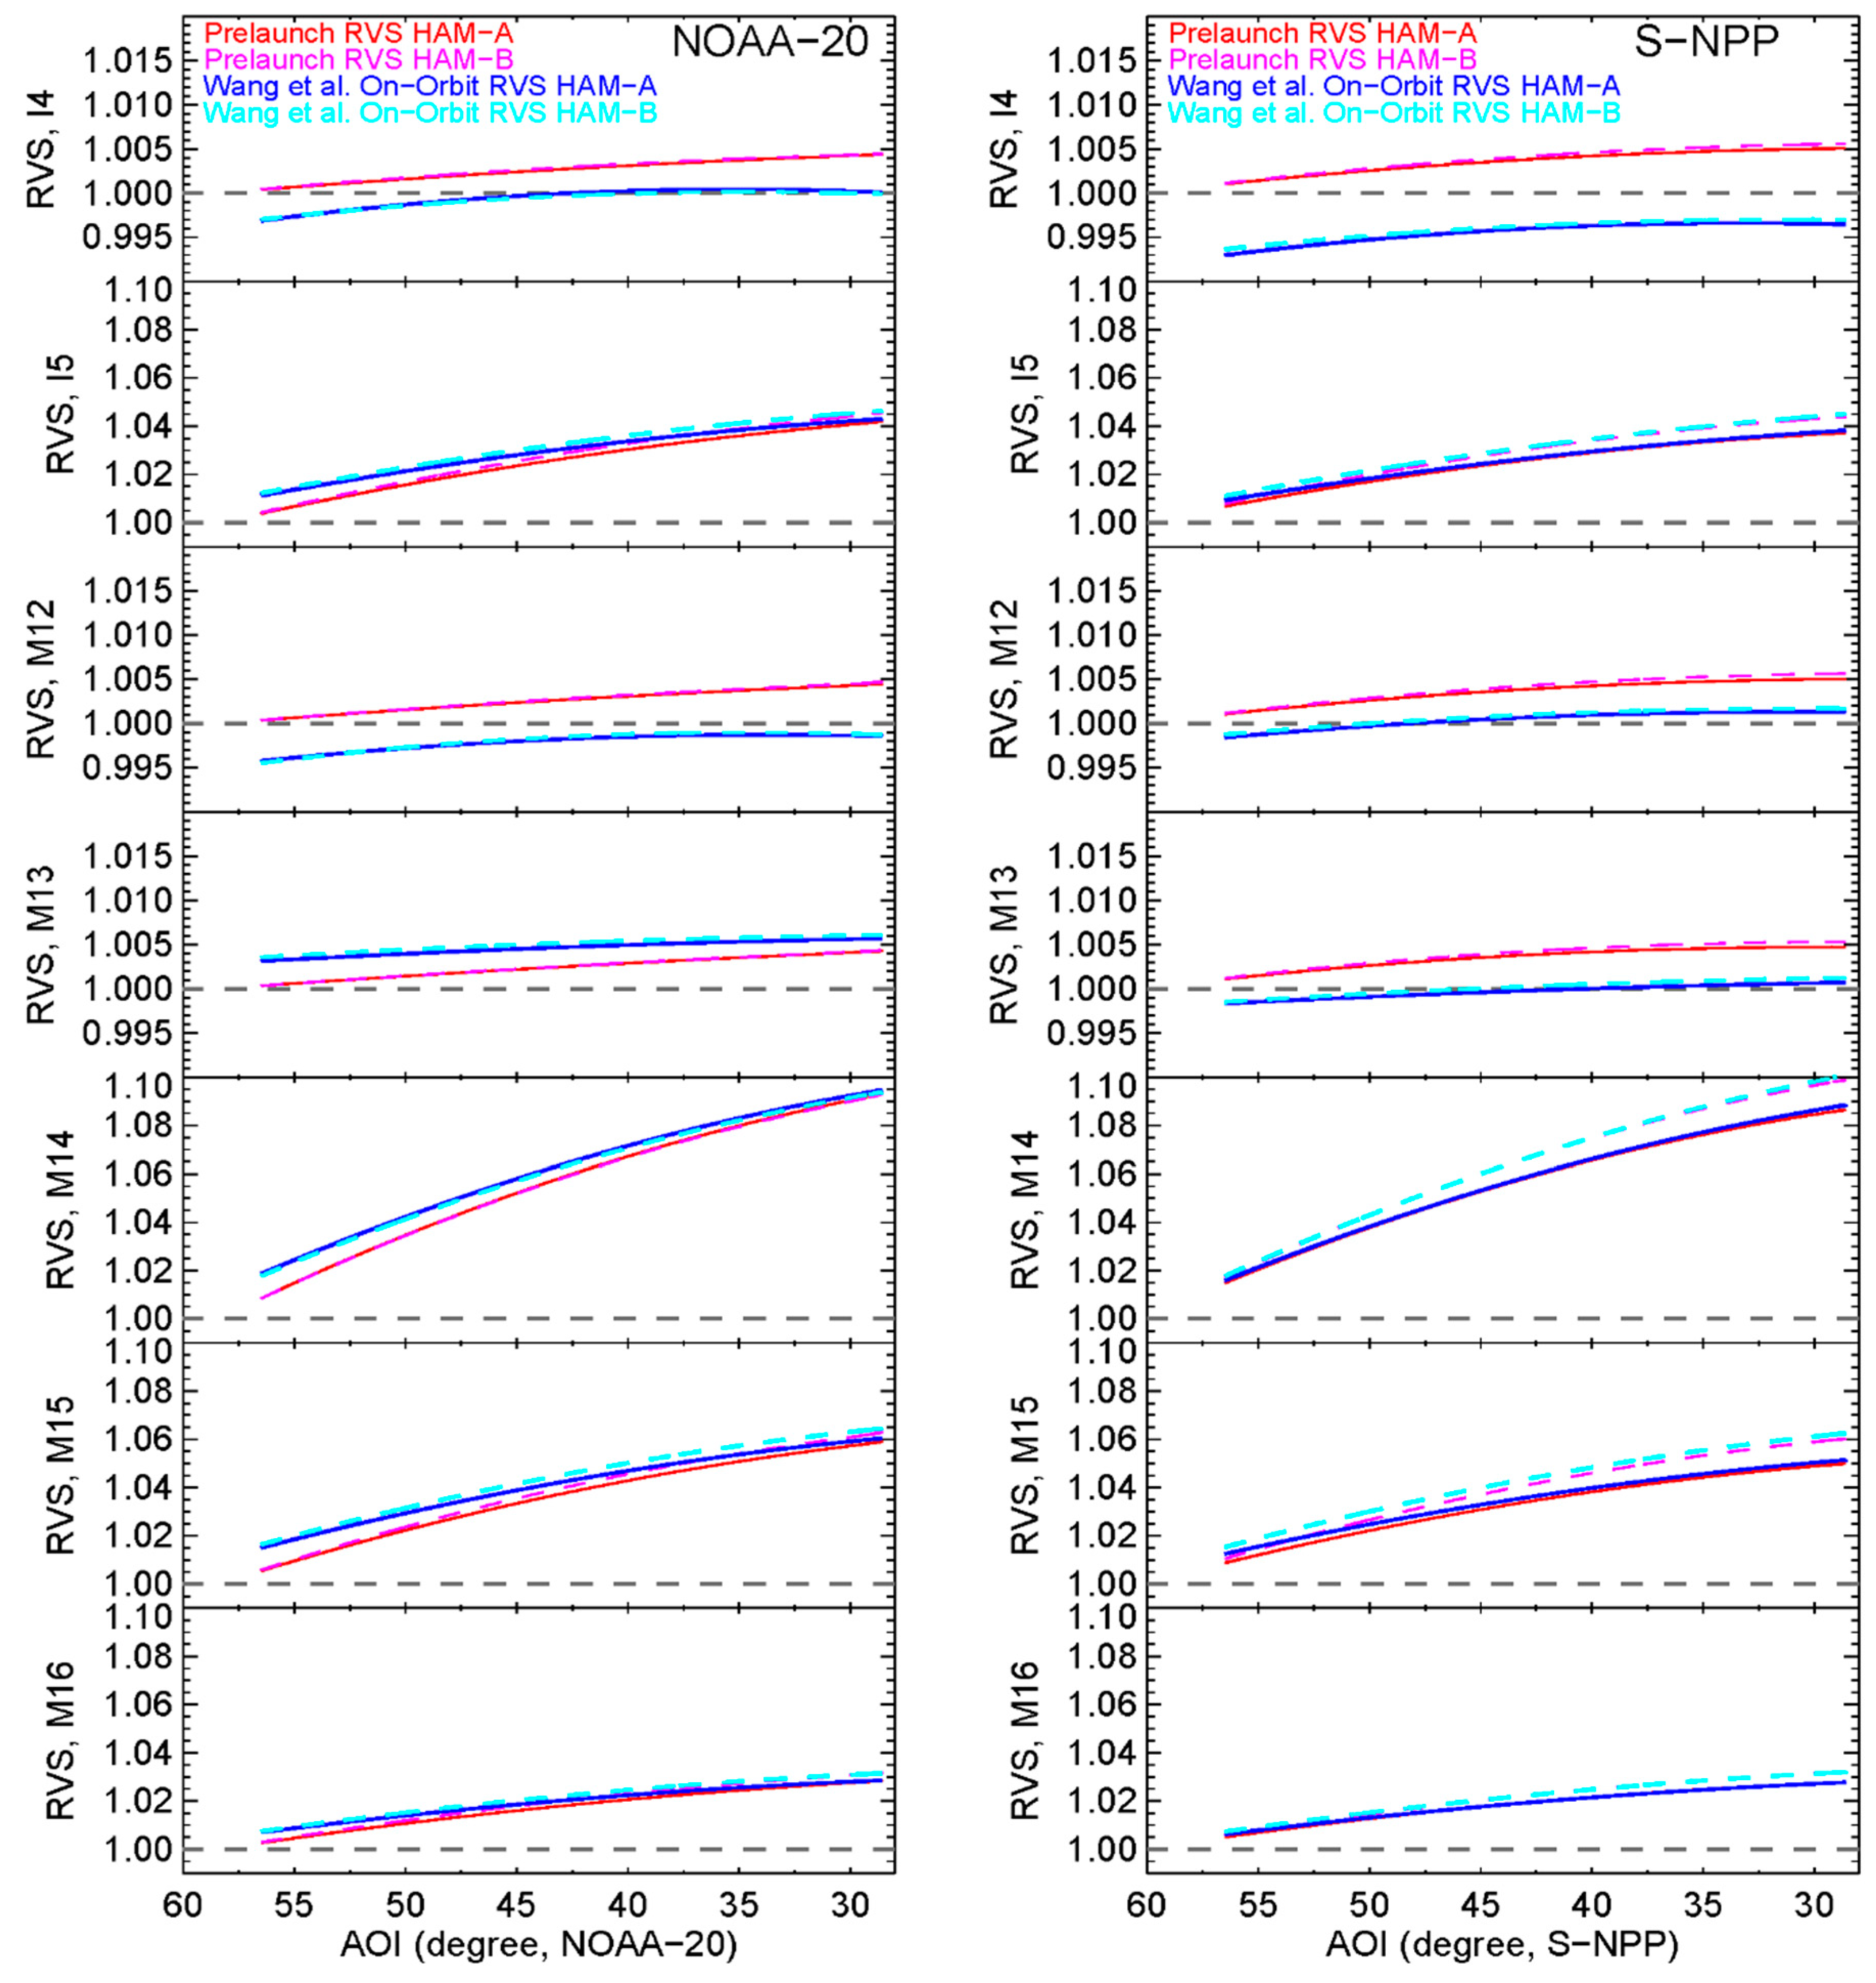
Figure 8 compares NOAA-20 (left panel) and S-NPP (right panel) band-averaged prelaunch and the on-orbit RVS derived using the Wang et al. method. Table 3 summarizes the scan averaged differences over the entire EV scan range and the differences over representative scan angles. For NOAA-20, the scan averaged differences are within ~±0.5% for all bands. However, on-orbit RVS show large disagreements compared to the prelaunch values in the LWIR bands at EVBOS, with band averaged differences about 0.8%, 1.0%, 1.0%, and 0.45% for I5, and M14–M16, respectively. However, the two sets of RVS agree well at EVEOS (within ±0.1%). The differences at +41° scan angle, RVS at which were used for prelaunch C-coefficients characterization, are ~0.1% for LWIR bands, supporting the Wang et al. method’s assumption that the impact of errors in prelaunch RVS on the prelaunch C-coefficients is small. For NOAA-20 MWIR bands, nearly constant differences between the on-orbit and prelaunch RVS were observed, about −0.4%, −0.5%, and 0.2% for I4 and M12–M13, respectively.
On-orbit OBCBB warm-up/cool-down (WUCD) events have been performed to characterize TEB zero offset and nonlinearity changes over time [21]. Compared to the prelaunch C-coefficients, WUCD derived C-coefficients may better represent on-orbit instrument environment, though they may also be subject to the errors in the prelaunch RVS at OBCBB AOI [21]. We derived on-orbit WUCD C-coefficients for NOAA-20. Results show that MWIR WUCD zero offset values differ significantly from prelaunch values. The constant differences between MWIR prelaunch and on-orbit RVS can be reduced to ~0.0% (I4), −0.25% (M12), and 0.0% (M13) if WUCD derived zero offset values are used for on-orbit RVS estimation. By contrast, no significant differences between prelaunch and WUCD zero offset values exist in the NOAA-20 LWIR bands, therefore, the impacts of errors in prelaunch zero offsets are expected to be small.
For S-NPP, the Wang et al. method derived on-orbit RVS also agree with prelaunch values within ~±0.5% in all bands and at all scan angles, except for I4. The differences averaged over all EV scan angles are about −0.8% (I4), 0.1% (I5), −0.3% (M12), −0.4% (M13), 0.1% (M14), 0.3% (M15), and 0.0% (M16). M15 shows relatively larger differences than the other S-NPP LWIR bands. Moreover, though the M15 scan averaged difference is ~0.3%, but its difference at EVBOS is up to ~0.5% for HAM-B. Similar to NOAA-20, the differences at +41° scan angle are small for LWIR bands, ~0.2% for M14–M15 and less than 0.1% for M16 and I5. The disagreements between S-NPP prelaunch and on-orbit RVS in MWIR bands are almost constant, similar to NOAA-20 MWIR bands.
Wang et al. [21] analyzed WUCD C-coefficients for S-NPP. On-orbit WUCD derived MWIR and M15 zero offset values differ significantly from prelaunch values, co-incident with the larger differences between prelaunch and on-orbit RVS in these bands. No significant disagreement was observed in the prelaunch and WUCD zero offset values for I5, M14, and M16. Meanwhile, the differences between prelaunch and on-orbit RVS in these three bands are also small. Results from this study indicates that errors in the prelaunch zero offset contribute to the constant differences between prelaunch and on-orbit RVS derived using the Wang et al. method, at least partially. More discussions about the relationship between prelaunch zero offset and on-orbit RVS will be given in Section 5.

4.4. Comparison of Prelaunch RVS and the Wu et al. Method Derived On-Orbit RVS

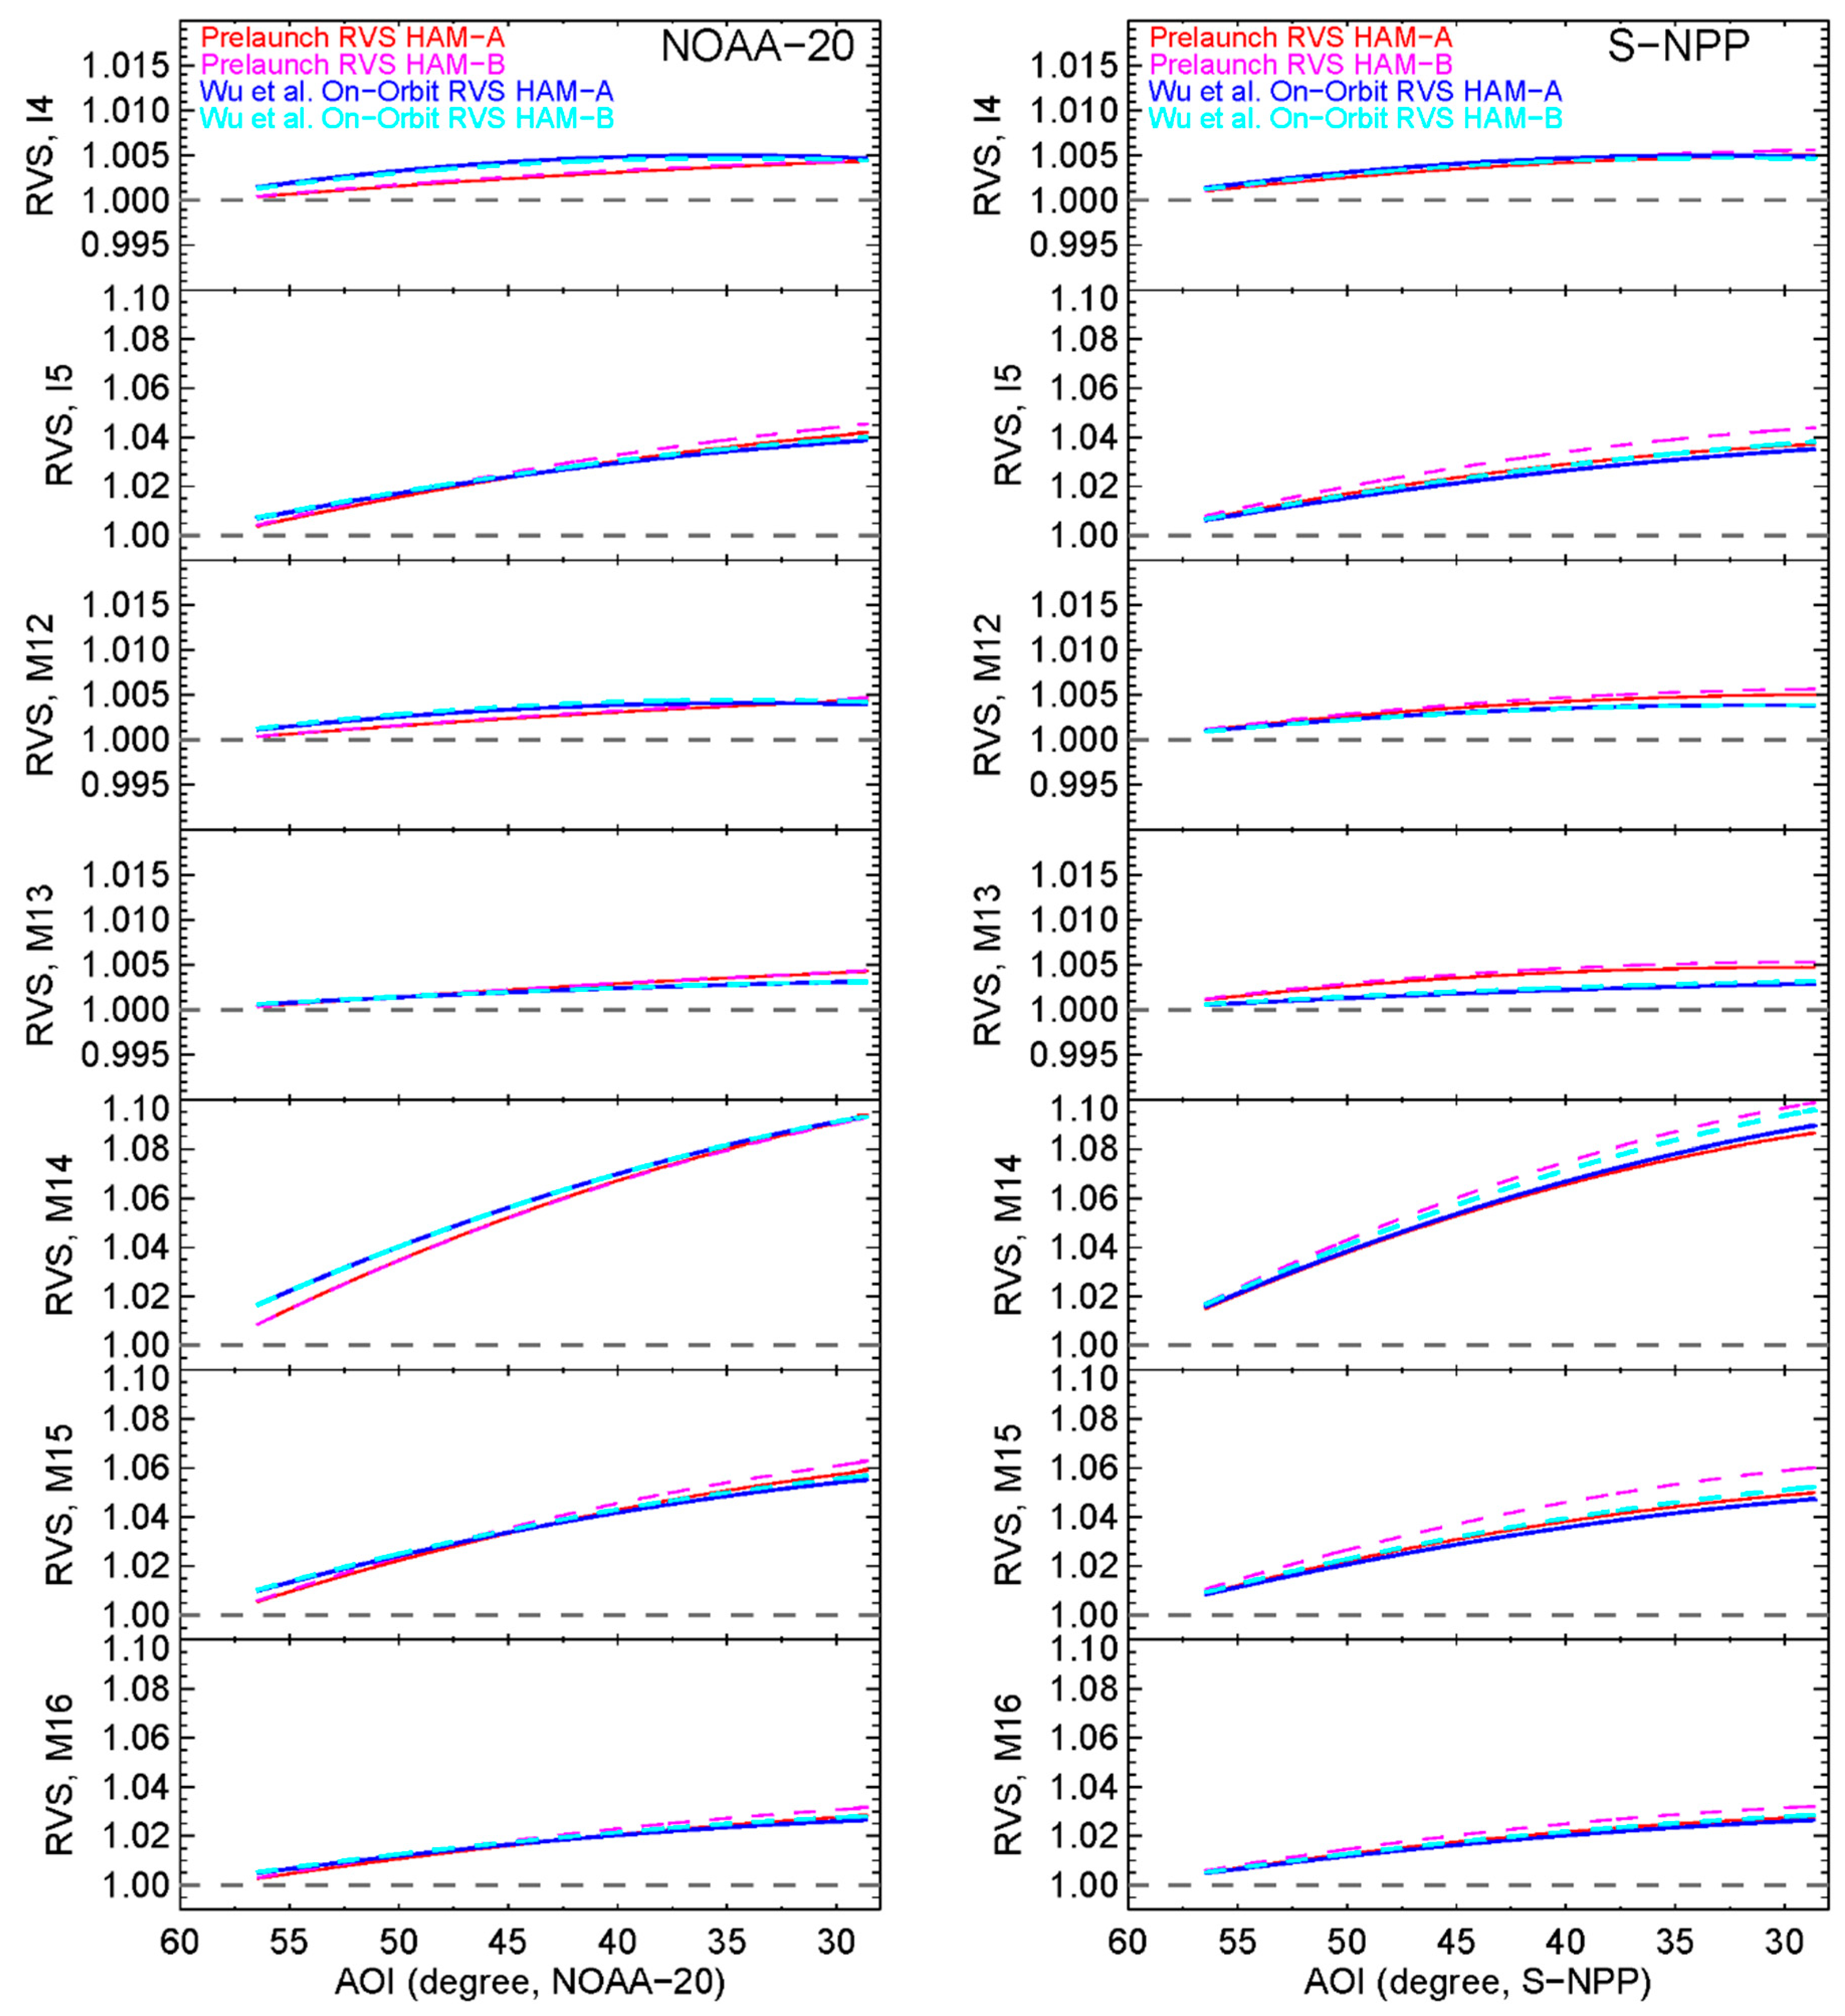
Figure 9 compares NOAA-20 (left panel) and S-NPP (right panel) band-averaged prelaunch and the Wu et al. method derived on-orbit RVS. Table 4 summarizes the scan averaged differences over the entire EV scan range and the differences over representative scan angles. For NOAA-20, the scan-averaged differences are ~ 0.1% (I4), −0.2% (I5), 0.0% (M12), −0.1% (M13), 0.3% (M14), −0.2% (M15), and −0.1% (M16), generally consistent with the results reported by Wu et al. [11]. That said, large differences were observed in LWIR bands I5 at EVEOS (up to −0.6%), M14 at EVBOS (~0.8%) and M15 at EVBOS (~0.4%) and EVEOS (up to −0.6%).
For S-NPP, the scan averaged differences between the Wu et al. method derived on-orbit RVS and prelaunch RVS are about 0.0% (I4), −0.3% (I5), −0.1% (M12), −0.2% (M13), 0.0% (M14), −0.4% (M15), −0.2% (M16), consistent with Wu et al. [5]. However, large differences were observed at scan angles from near nadir to EVEOS in bands I5 HAM-B (up to −0.5%) and M15 HAM-B (up to −0.7%). Moreover, Wu et al. [5] reported relatively large disagreements in bands I4 (0.4%) and M13 HAM-B (0.5%). The I4 and M13 RVS differences estimated in this study are within ±0.2%, for both HAM sides. The disagreements in the Wu et al. method derived on-orbit RVS calculated in this and previous studies [5,11] may be due to RTA temperatures. The Wu et al. [5,11] studies used slightly different RTA temperature offsets as those used in the NOAA operational processing and this study [6].
Generally speaking, the Wang et al. method derived on-orbit RVS show larger differences from the prelaunch values compared to those derived by the Wu et al. method. However, the differences match better with the LWIR scan angle and scene temperature dependent biases observed in the operational products (see Figure 3 and Figure 4). The two on-orbit RVS methods estimate RVSsv differently, and the differences in RVSsv propagate to the RVS at EV scan angle range during the normalization process. For the MWIR bands, including (the Wang et al. method) and ignoring (the Wu et al. method) of prelaunch zero offset also affect the on-orbit RVS derived. The impacts of on-orbit RVS on TEB SDRs will be further evaluated in Section 5 using independent co-located CrIS observations.

5. Impacts of On-Orbit RVS on TEB SDR Products

To evaluate the impacts of on-orbit RVS on VIIRS TEB SDRs, NOAA-20 and S-NPP VIIRS TEB SDRs from March 18, 2019, consistent with the time period of the data used in Figure 3 and Figure 4, were reprocessed in this study. Three on-orbit RVS LUTs were created. The first RVS LUT was created, for NOAA-20, using the Wu et al. method derived on-orbit RVS. Two RVS LUTs, for NOAA-20 and S-NPP, were created using the Wang et al. method derived on-orbit RVS. All other calibration parameters used in the reprocessing are the same as those used in the NOAA operational processing [6]. VIIRS orbits the Earth 14 times each day, and provides sufficient data samples under majority of scene temperature conditions at all scan angles. Our analysis shows that VIIRS scene temperature and scan angle dependent bias patterns do not change significantly over time.

5.1. VIIRS–CrIS Inter-Comparison

CrIS, onboard the same satellites as VIIRS, is a Fourier transform spectrometer that provides hyperspectral observations at 9.14–15.38 µm, 5.71–8.26 µm, and 3.92–4.64 µm. CrIS scan the Earth step by step, with 30 field of regards (FOR) and a scan angle range of ±48.3°. Each FOR has 3 by 3 field of views (FOV), with size angle of 0.963° and separated by 1.1°. The scan direction of CrIS is opposite to that of VIIRS. CrIS FOR positions 1 and 30 correspond to VIIRS scan angles +48.3° and −48.3°, respectively. CrIS observations are geolocated using VIIRS as reference, with uncertainty less than 300 m [22]. S-NPP CrIS radiometric calibration uncertainty is ~0.3K [23]; NOAA-20 and S-NPP CrIS agree within 0.1K [16]. More importantly, the CrIS radiometric calibration algorithm is independent of scan angle, different from VIIRS. Therefore, CrIS can provide plenty of high quality and co-located observations to independently evaluate the VIIRS scan angle/scene temperature dependent biases, at the scan angle range of ±48.3°, under nearly all scene temperature conditions, and at any time during VIIRS and CrIS nominal operations.
In this study, VIIRS and CrIS observations were co-located using a fast and accurate method developed by Wang et al. [24], which co-locates VIIRS measurements with CrIS FOV based on line-of-sight vectors. VIIRS and CrIS latitudes and longitudes were first converted to line-of-sight vectors based on sensor view geometry and satellite range information. Then co-located observations were identified based on the angle between VIIRS and CrIS line-of-sight vectors. A threshold of half CrIS FOV size angle (0.4815°) was used. VIIRS bands M15–M16, M13, and I5 are covered by CrIS hyperspectral measurements. CrIS spectra do not cover the entire spectral range of bands M15–M16 and M13. The out of band (OOB) effects were characterized and corrected using the Infrared Atmospheric Sounding Interferometer (IASI) spectra. Band and scene temperature dependent OOB corrections were applied before computing differences between VIIRS and CrIS co-located radiances. Observations from all CrIS FORs and FOVs were used in this study. The details of VIIRS–CrIS inter-comparison method are available in literature [21,24].
To evaluate the VIIRS scan angle/scene temperature dependent biases, averaged biases were calculated for 10 by 30 bins, at 10 scene temperatures (from 220K to 310K, with a step of 10K) and the 30 CrIS FOR positions. Absolute VIIRS–CrIS BT differences were used to calculate the averaged biases for individual bins, so BT differences with opposite signs would not cancel out each other. Moreover, scan averaged biases were computed at the 10 scene temperatures using biases from all CrIS FOR positions. In addition, under each scene temperature, the sizes of the filled circles in the figures are proportional to the number of data samples used, so a potential under-sampling issue at individual CrIS FOR position bins can be revealed.

5.2. Evaluation of the Wu et al. Method Derived On-Orbit RVS for NOAA-20

Figure 10 shows VIIRS–CrIS BT differences for NOAA-20 M15–M16, M13, and I5 SDRs reprocessed using the Wu et al. method derived on-orbit RVS. The scan angle/scene temperature dependent biases for the NOAA operational SDRs is given in Figure 3. For LWIR bands, the Wu et al. method derived on-orbit RVS can effectively reduce the scan angle dependent biases, but it also increases scene temperature dependent biases near EVEOS. It can be observed that the VIIRS–CrIS BT differences for M15–M16 and I5 are almost constant at various scan angles in the reprocessed SDRs. In the meantime, the overall scene temperature dependent biases near EVBOS (VIIRS scan angle −48.3° or CrIS FOR 30) are also reduced, from ~1.0K (operational) to ~0.6K in M15, from ~0.6K to ~0.4K in M16, and from ~0.75K to ~0.5K in I5. However, the scene temperature dependent biases near EVEOS (VIIRS scan angle +48.3° or CrIS FOR 1) increased significantly, from ~0.45K to ~0.8K in M15, from ~0.3K to ~0.5K in M16, and from ~0.4K to ~0.8K in I5. Overall, the maximum scan averaged VIIRS–CrIS biases in the LWIR bands increased compared to the operational processing. The Wu et al. method derived on-orbit RVS values are higher than the prelaunch values near EVBOS, but lower than the prelaunch values near EVEOS in all three LWIR bands. The changes in the VIIRS–CrIS bias patterns are consistent with the differences between prelaunch and the on-orbit RVS. For the MWIR band M13, the operational and reprocessed SDRs show similar VIIRS–CrIS biases patterns, also consistent with smaller difference between the prelaunch and on-orbit RVS (~0.1%, see Section 4.4).

5.3. Evaluation of the Wang et al. Method Derived On-Orbit RVS for NOAA-20 and S-NPP

5.3.1. VIIRS–CrIS BT Differences for Reprocessed NOAA-20 TEB SDRs

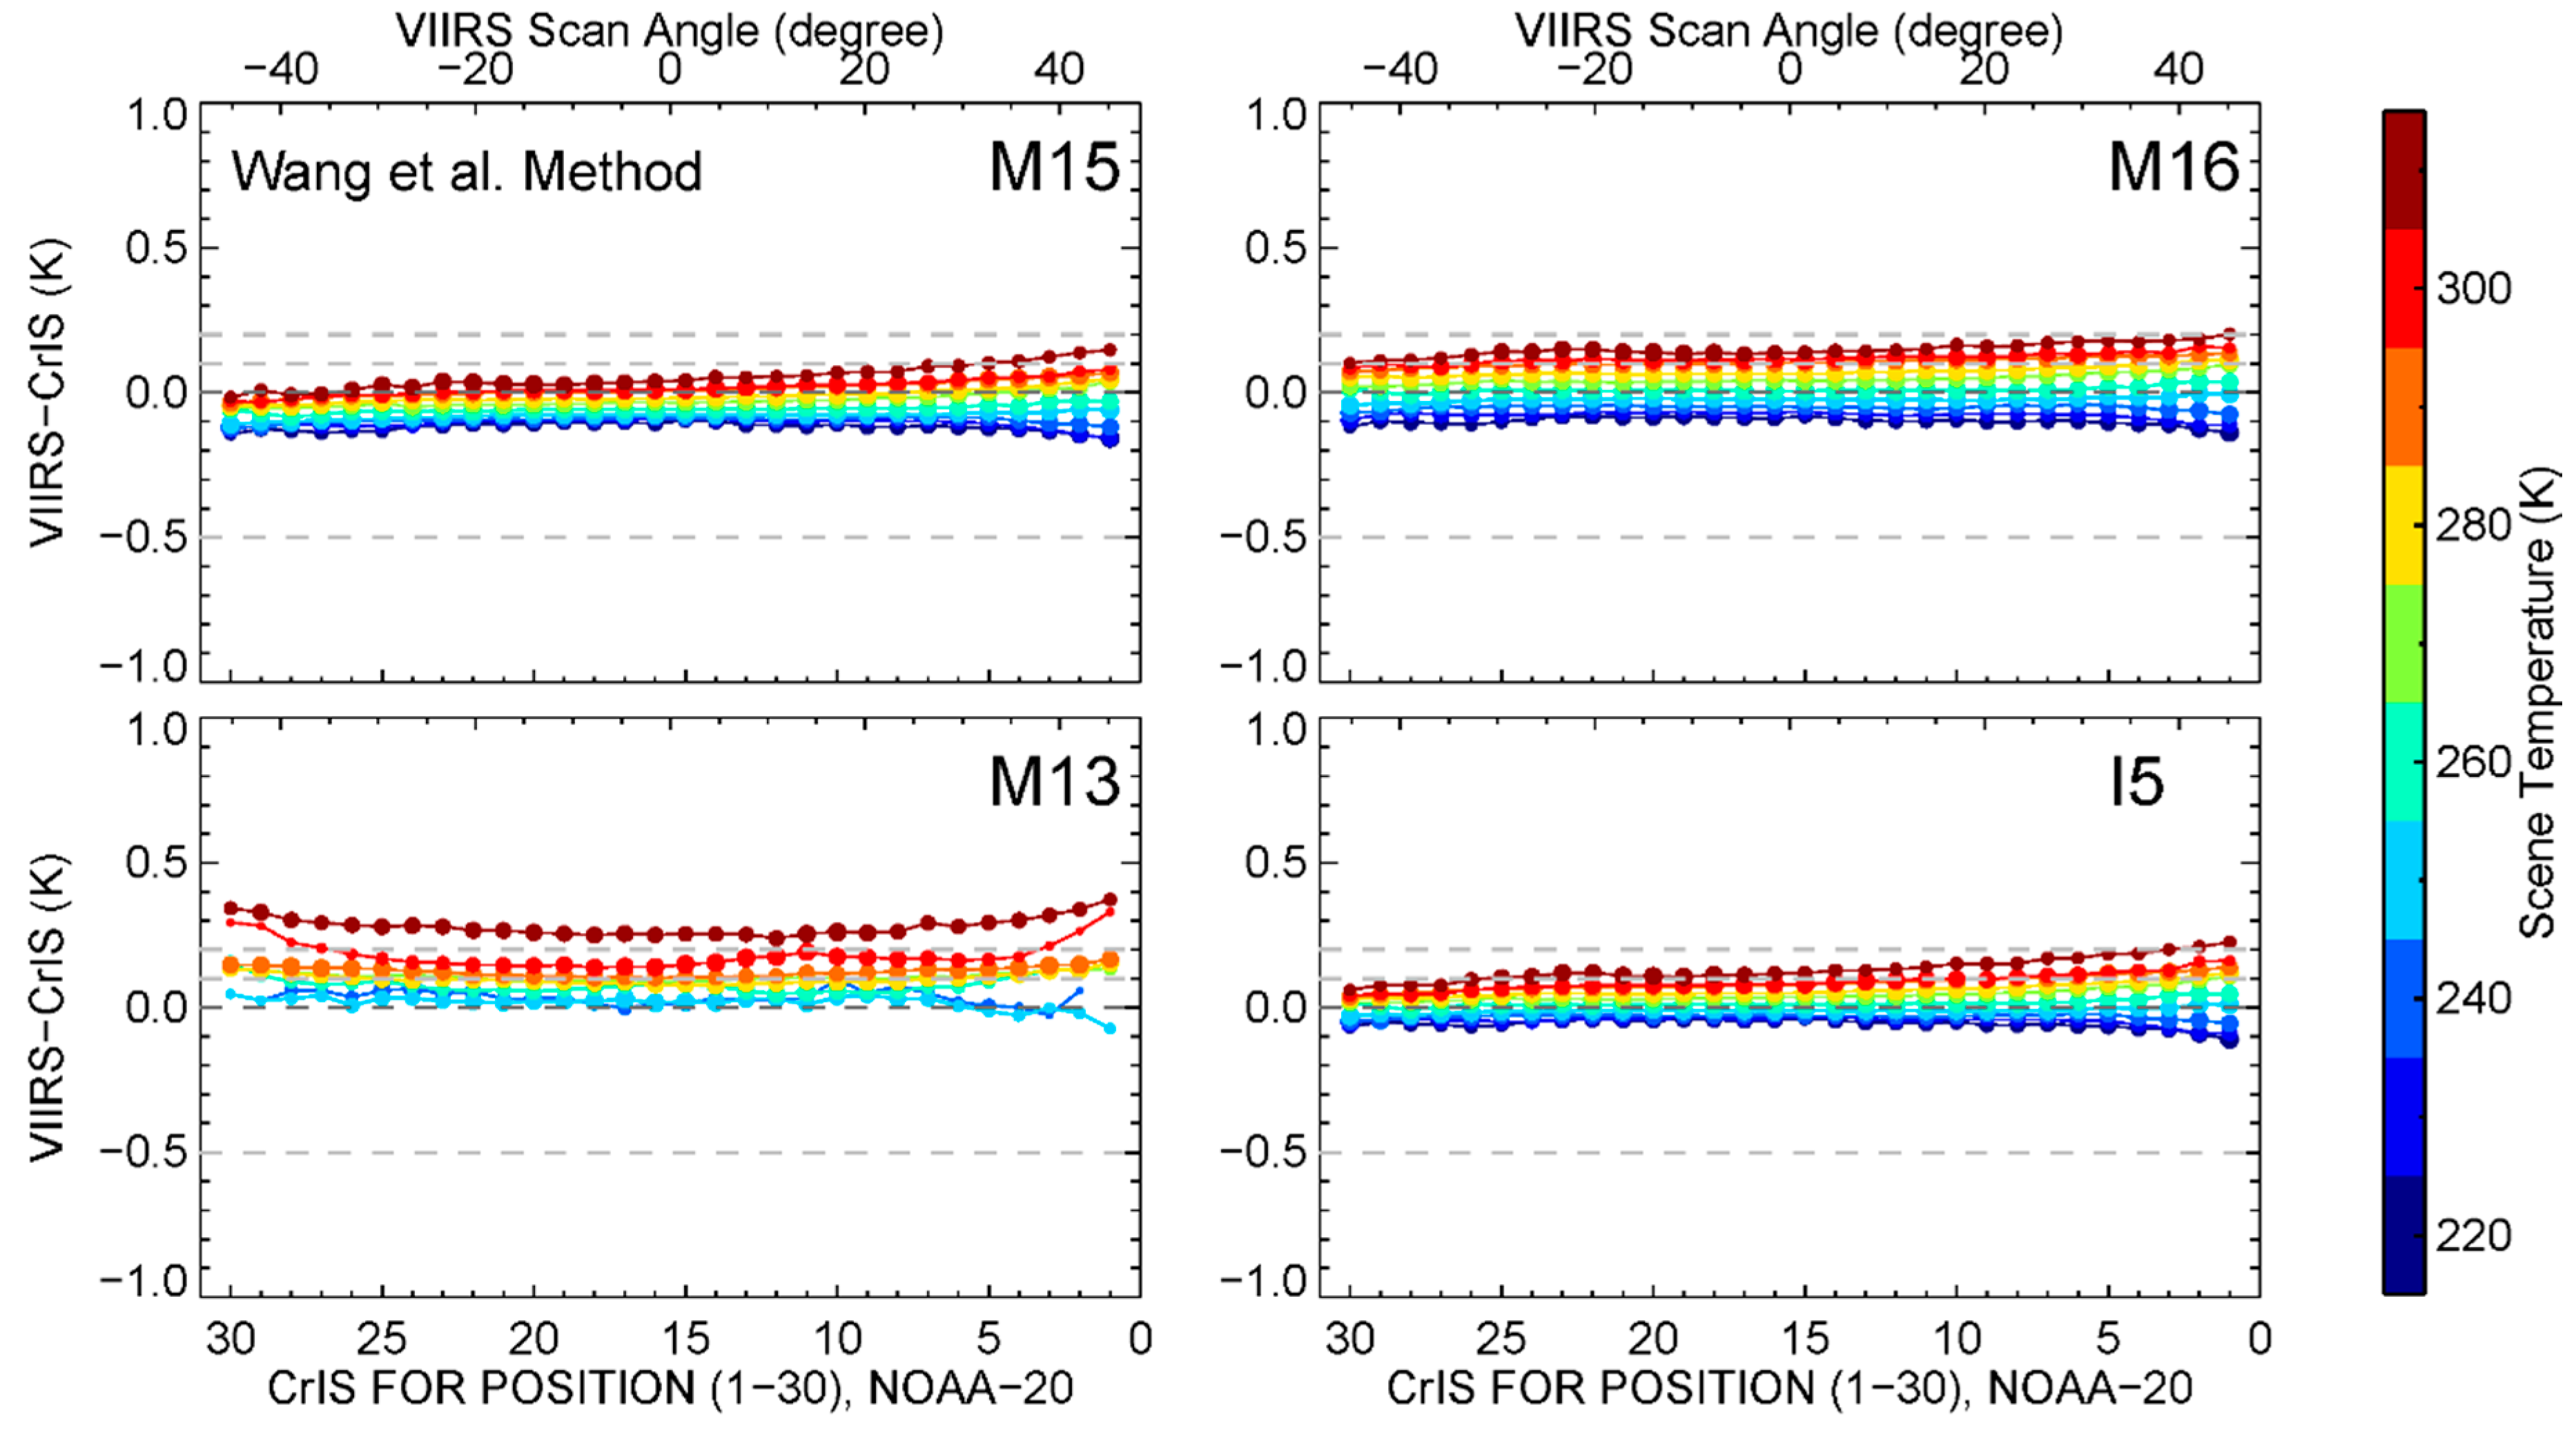
Figure 11 shows VIIRS–CrIS BT differences for NOAA-20 M15–M16, M13, and I5 SDRs, reprocessed using the Wang et al. method derived on-orbit RVS. Scan averaged biases at 10 scene temperatures for the operational and reprocessed SDRs are summarized in Table 5. Results show that the Wang et al. method derived on-orbit RVS can effectively minimize scan angle/scene temperature dependent biases in M15–M16 and I5, with maximum scan averaged biases reduced from 0.40K (operational) to within 0.15K, under all scene temperatures. The most significant improvements are observed near EVBOS, while the biases near EVEOS are almost unchanged. The results are consistent with the observed differences between the prelaunch and the Wang et al. method derived on-orbit RVS in these bands: up to 1% near EVBOS and ~0.1% near EVEOS (see Section 4.3). For M13, the VIIRS–CrIS biases show little change, generally consistent with the small difference between the prelaunch and the Wang et al. method derived on-orbit RVS.
NOAA-20 M15–M16 and I5 SDRs reprocessed using the on-orbit RVS show relative larger residual biases near EVEOS compared to those near EVBOS. Moreover, some residual biases at warmer scene temperatures were observed in these three bands. Similar residual biases were also observed in the reprocessed LWIR SDRs using the Wu et al. method derived on-orbit RVS (see Figure 10). The residual biases may be due to uncertainty in the VIIRS thermal model, VIIRS–CrIS co-location error, CrIS calibration issue, and/or on-orbit RVS. Errors in the prelaunch nonlinear coefficients may introduce scene temperature dependent biases at warmer scenes, but not scan angle dependent biases. In addition, the number of data samples varies with scan angle at some scene temperature/CrIS FOR position bins (see the sizes of filled circles in Figure 3, Figure 10 and Figure 11), which may also contribute to the observed residual scan angle dependent biases. Averaged scene temperatures at CrIS FOR 1 and 30 may differ up to 0.5K. These factors will be studied in the future.

5.3.2. VIIRS–CrIS BT Differences for Reprocessed S-NPP TEB SDRs

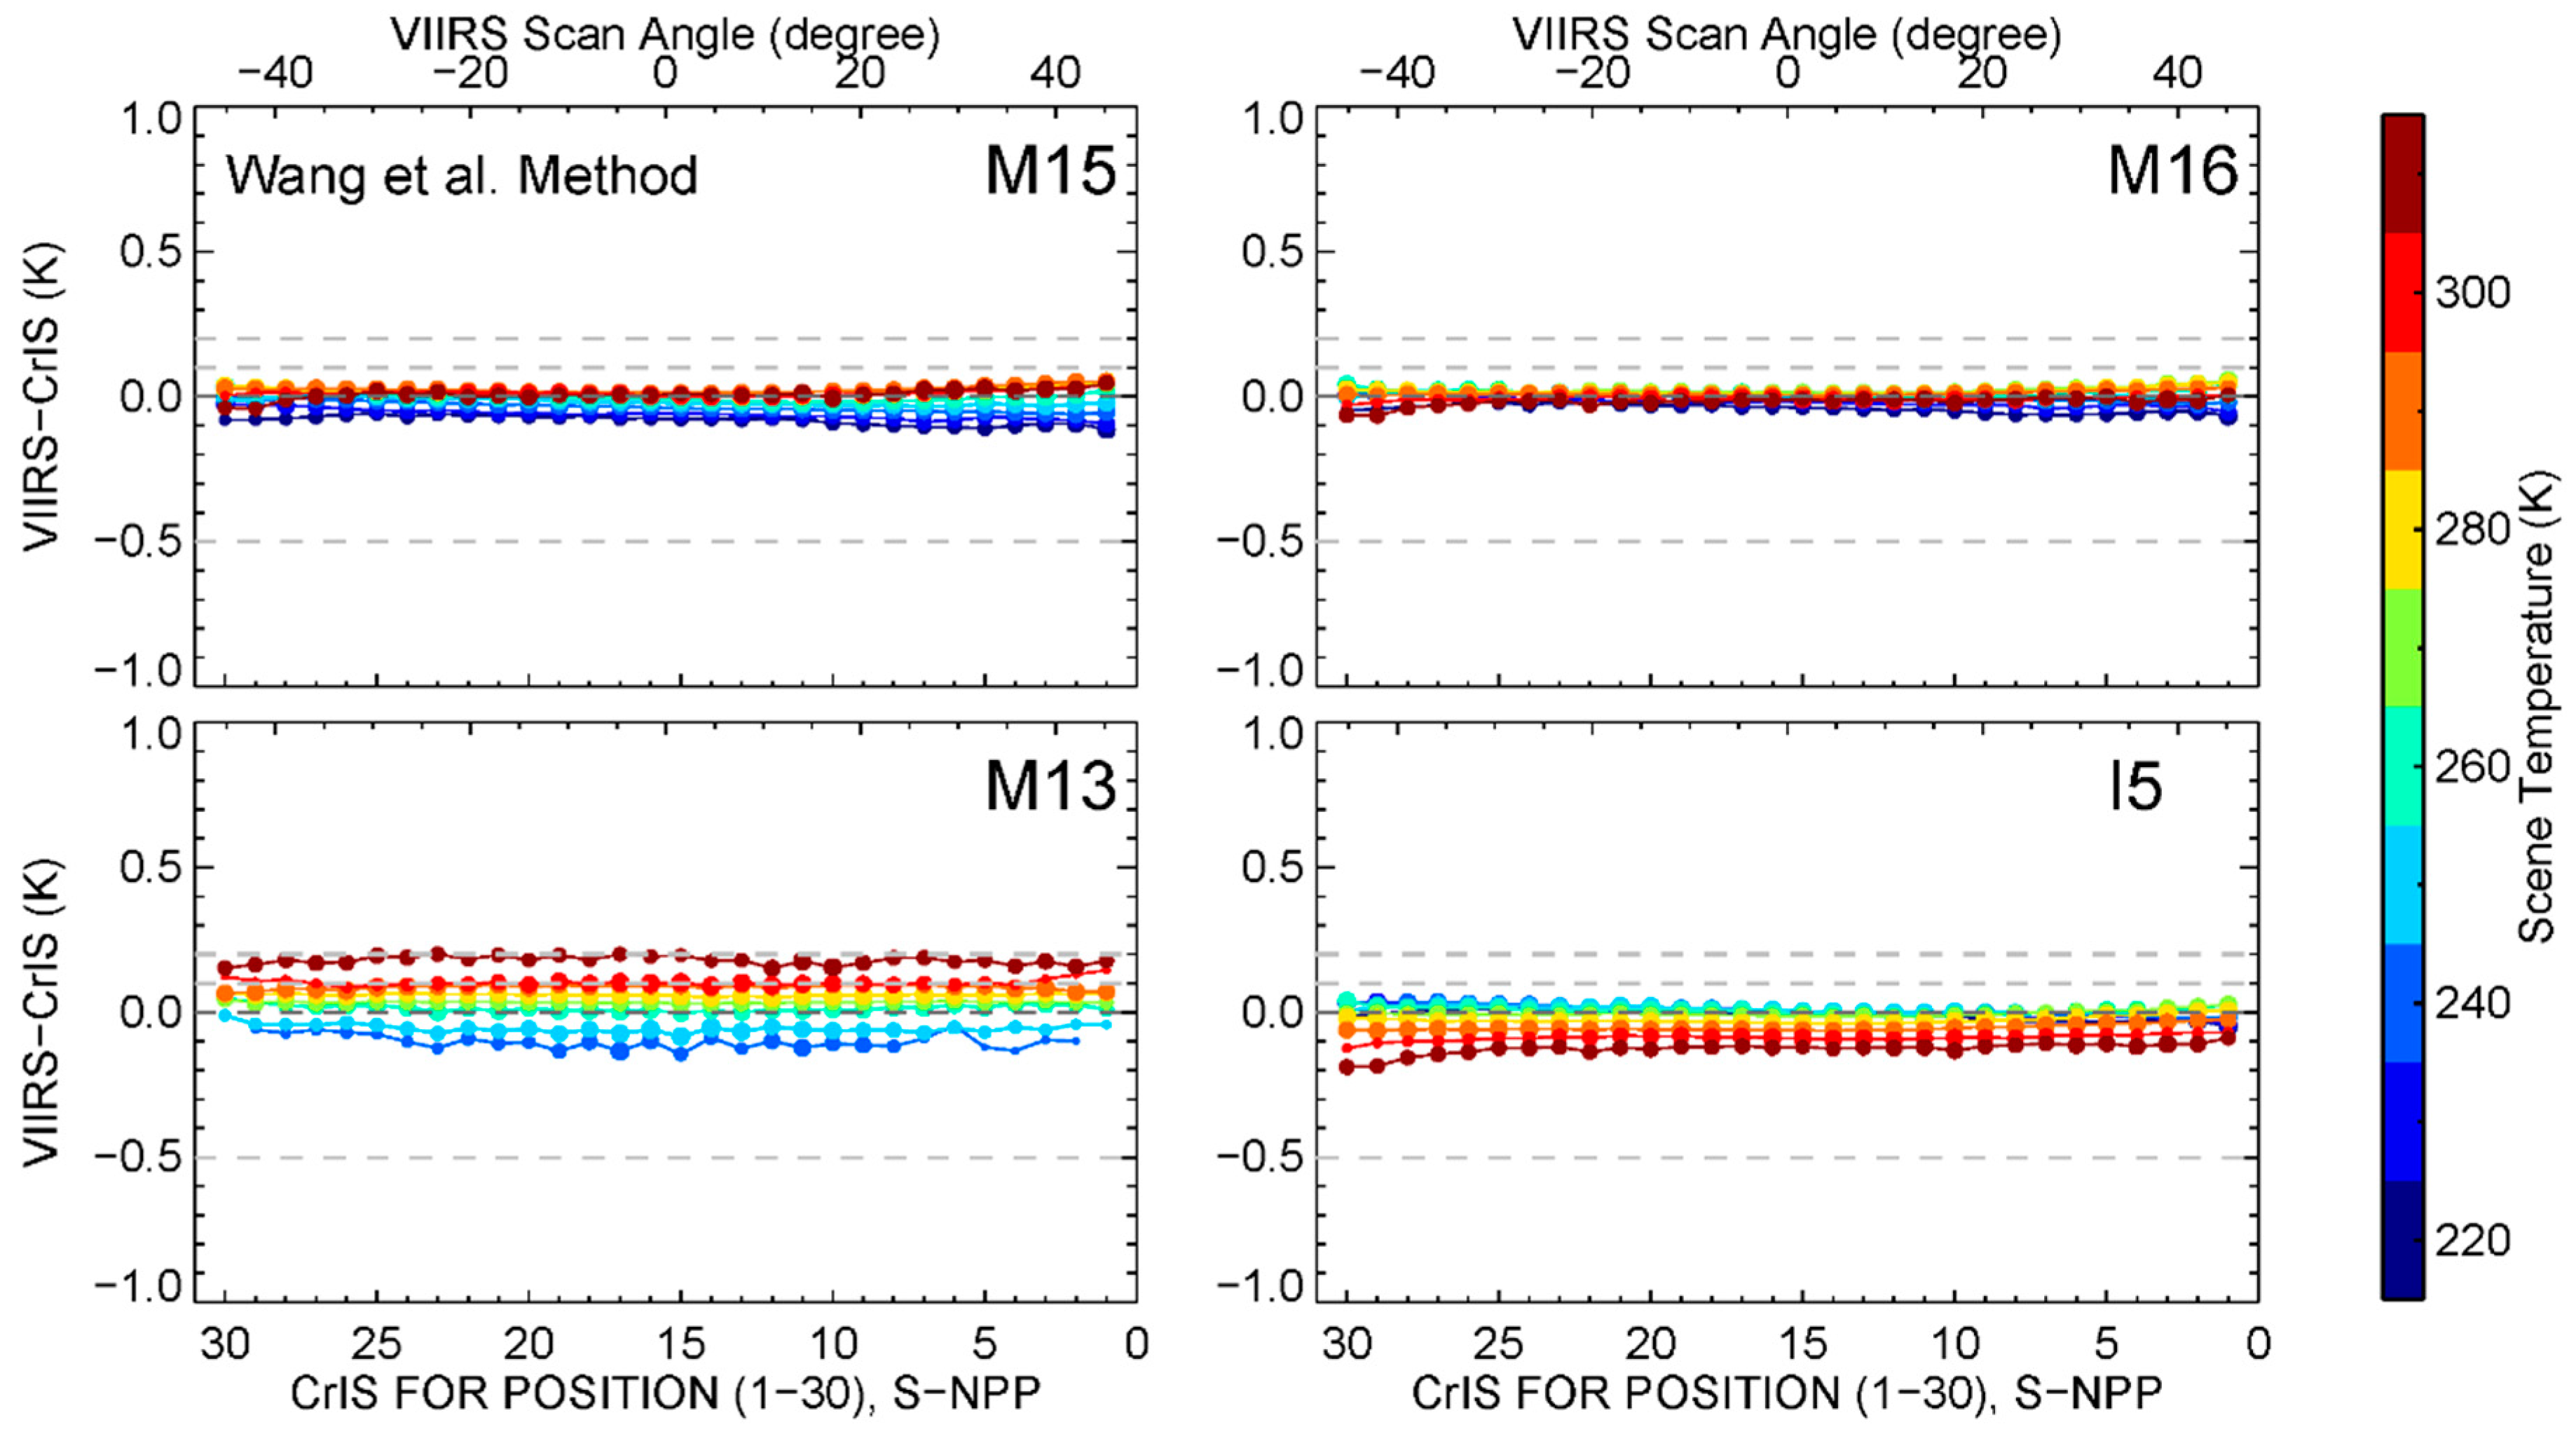
We also investigated the feasibility of using the Wang et al. method derived on-orbit RVS to reduce scene temperature/scan angle dependent biases in S-NPP. Note S-NPP TEB scan angle/scene temperature dependent biases are much smaller than those in NOAA-20 in the NOAA operational processing. However, scene temperature dependent biases of ~0.3K were observed in M15, which are much larger than those in M16 and I5 (within 0.1K). Figure 12 shows VIIRS - CrIS BT differences for S-NPP M15–M16, M13, and I5 SDRs, reprocessed using on-orbit RVS. Scan averaged biases at 10 scene temperatures for the operational and reprocessed SDRs are summarized in Table 6.
Our results show that the Wang et al. method also works well for S-NPP M15, with a maximum scan averaged scan angle/scene temperature dependent biases reduced from 0.24K (prelaunch RVS) to 0.08K (on-orbit RVS). Larger improvements were observed at colder scenes. Moreover, no significant residual biases were observed at warmer scenes. Since the same method was used to derive on-orbit RVS for NOAA-20 and S-NPP, the S-NPP results indicate that the residual biases observed in NOAA-20 LWIR bands at warmer scene temperatures (see Figure 11) may be caused by factors other than the uncertainties in the on-orbit RVS. Larger differences between prelaunch and on-orbit WUCD derived zero offset values were observed in M15 in our previous study [21]. Moreover, WUCD C-coefficients derived using data during the cool-down phase can reduce scene temperature dependent biases in M15. VIIRS–CrIS comparison results indicate that S-NPP M15 prelaunch RVS is likely to have larger errors than for the other LWIR bands, or on-orbit RVS derived using the Wang et al. method can compensate, at least partially, for the errors in the prelaunch zero offsets.
The Wang et al. method derived on-orbit RVS also works reasonably well for S-NPP M16, I5, and M13. For M16, the performance of the on-orbit RVS is at least comparable to the prelaunch RVS, with residual maximum scan averaged biases within 0.04K. The impacts of on-orbit RVS on band I5 are mixed, with slightly reduced scan angle/scene temperature dependent biases at cold scene temperatures (220–250K), but slightly increased biases at warmer scene temperatures (300–310K). Nevertheless, the bias differences between the operational and reprocessed data are smaller than 0.02K at all scene temperatures. The impacts of on-orbit RVS on band M13 are similar to I5, with reduced biases at colder scene temperatures (250–270K), but slightly increased biases at 310K. In the meantime, the on-orbit RVS does alter M13 SDR at colder scenes. VIIRS–CrIS BT differences changed from +0.08K to −0.06K at 250K scene temperature. Nevertheless, all differences observed in S-NPP M16, I5, and M13 are small, consistent with the small differences between prelaunch and on-orbit RVS presented in Section 4.3. The evaluation results for the S-NPP provide another evidence that the on-orbit RVS derived using the Wang et al. method may be implemented operationally to improve VIIRS TEB calibration.
Figure 13 illustrates NOAA-20 (left) and S-NPP (right) scene temperature dependent biases, relative to co-located CrIS observations, for the NOAA operational and reprocessed SDRs. Data from all CrIS FOR positions were averaged for 10 scene temperature bins (from 220 to 310K). The impacts of the Wang et al. method derived on-orbit RVS on scene temperature dependent biases are clearly revealed. The on-orbit RVS significantly reduces scene temperature dependent biases in NOAA-20 M15–M16, and I5, and S-NPP M15, with cold biases reduced from up to 0.4K to ~0.1K or less. The biases at warmer scenes are also slightly reduced in these cases. The performance of prelaunch and on-orbit RVS are comparable for S-NPP M16 and I5. For NOAA-20 and S-NPP M13, the on-orbit RVS changes the signs of biases at colder scene temperatures, while it has little impact on warmer scenes.
VIIRS–CrIS inter-comparison results cover bands M15–M16, M13, and I5 at scan angles within ±48.3° only. We also studied the impacts of the Wang et al. method derived on-orbit RVS on all TEBs and over the entire EV scan angle range, by computing BT differences between the NOAA operational and reprocessed SDR. The largest differences occur at EVBOS in the NOAA-20 LWIR bands. On-orbit RVS has a large impact on M14, up to ~0.6K at 220K scene temperature and similar to M15. For S-NPP, the impacts of on-orbit RVS are much smaller. M14 shows no correction near EVBOS and ~0.2K correction near EVEOS. The M14 results are consistent with the observed differences in the prelaunch and on-orbit RVS (see Section 4.3).
For MWIR bands, the on-orbit RVS decreases NOAA-20 I4 and M12 scene temperatures by ~1.0K at 220K scene temperature. For S-NPP I4, the change of scene temperature can be as larger as ~2.0K, due to the ~0.8% differences between prelaunch and on-orbit RVS. On-orbit WUCD derived and prelaunch zero offset values show consistent differences in the NOAA-20 and S-NPP MWIR bands. Previous sections indicate that the Wang et al. method derived on-orbit RVS may compensate for the errors in prelaunch zero offset. More study will be conducted to better understand the relationship between RVS and zero offset in the future.

6. Summary

This study presents the Wang et al. method that characterizes VIIRS TEB RVS at both EV and SV scan angles simultaneously using on-orbit pitch maneuver data. NOAA-20 and S-NPP VIIRS TEB on-orbit RVS derived using this method were compared to those derived using the previously developed Wu et al. method. Our results indicate that the shapes of on-orbit RVS curves derived using the two methods agree within ±0.1% for NOAA-20 and ±0.3% for S-NPP at EV scan angles for all TEBs. However, the two methods estimate RVSsv differently. The Wang et al. method derived on-orbit RVS at SV and EV scan angles simultaneously, while the Wu et al. method extrapolates RVSsv from EV.
We compared the NOAA-20 and S-NPP on-orbit RVS and the prelaunch RVS, which are currently used in the NOAA operational processing. For NOAA-20, the Wang et al. method derived on-orbit RVS show larger differences compared to the prelaunch values in the LWIR bands at EVBOS, with band averaged differences at EVBOS about 0.8%, 1.0%, 1.0%, and 0.45% for I5 and M14-M16, respectively. But the differences at EVEOS are small, within ±0.1%. The differences in MWIR bands are up to −0.5% and mostly constant across the EV scan. S-NPP on-orbit RVS agree better with prelaunch values, within ±0.5% in all bands, except for I4 (~0.8%). Relatively larger difference was observed in M15 HAM-B (up to 0.5%). The Wu et al. method derived on-orbit RVS also exhibit large differences in NOAA-20 M14 (~0.8% at EVBOS) and M15 (~0.4% at EVBOS and ~ −0.6% at EVEOS), as well as in S-NPP I5 HAM-B (up to −0.5%) and M15 HAM-B (up to −0.7%) from near nadir to EVEOS. The differences in other bands are within ±0.3%.
The on-orbit RVS derived in this study were evaluated using one-day of reprocessed VIIRS SDRs and independent CrIS observations. VIIRS–CrIS comparison results indicate that the Wang et al. method derived on-orbit RVS can effectively minimize scan angle/scene temperature dependent biases from up to 0.40K to 0.15K or less for NOAA-20 LWIR bands, and from 0.24K to 0.08K for S-NPP M15. The Wu et al. method also works in terms of reducing the scan angle dependent biases, but at the expense of increasing the scene temperature dependent biases. Moreover, the Wang et al. method derived on-orbit RVS may compensate, at least partially, for the errors in the prelaunch zero offsets, which requires further studies. The methodology developed in this study may also be applied to the VIIRS onboard the future J2–J4 satellites.

Author Contributions

Conceptualization, W.W.; methodology, W.W.; software, W.W..; validation, W.W.; formal analysis, W.W.; investigation, W.W. and S.B.; resources, C.C.; data curation, W.W.; writing—original draft preparation, W.W.; writing—review and editing, C.C. and S.B.; visualization, W.W.; supervision, C.C.; project administration, W.W.; funding acquisition, C.C.

Funding

This research received no external funding.

Acknowledgments

This work is conducted at NOAA STAR under the Joint Polar Satellite System (JPSS) Program. The views, opinions, and findings contained in this report are those of the authors and should not be construed as an official NOAA or U.S. Government position, policy, or decision.

Conflicts of Interest

The authors declare no conflict of interest.

References

  1. Cao, C.; Xiong, J.; Blonski, S.; Liu, Q.; Uprety, S.; Shao, X.; Bai, Y.; Weng, F. Suomi NPP VIIRS sensor data record verification, validation, and long-term performance monitoring. J. Geophys. Res. Atmos. 2013, 118, 11664–11678. [Google Scholar] [CrossRef]
  2. Cao, C.; De Luccia, F.J.; Xiong, X.; Wolfe, R.; Weng, F. Early on-orbit performance of the Visible Infrared Imaging Radiometer Suite onboard the Suomi National Polar-Orbiting Partnership (S-NPP) satellite. IEEE Trans. Geosci. Remote Sens. 2014, 52, 1142–1156. [Google Scholar] [CrossRef]
  3. VIIRS Radiometric Calibration ATBD. Joint Polar Satellite System (JPSS) VIIRS Radiometric Calibration Algorithm Theoretical Basis Document (ATBD). In NOAA/NESDIS/STAR: 2013; National Oceanic and Atmospheric Administration: College Park, MD, USA, 2013. [Google Scholar]
  4. Moyer, D.; McIntire, J.; Oudrari, H.; McCarthy, J.; Xiong, X.; De Luccia, F. JPSS-1 VIIRS Pre-Launch Response Versus Scan Angle Testing and Performance. Remote Sens. 2016, 8, 141. [Google Scholar] [CrossRef]
  5. Wu, A.; Xiong, X.; Chiang, K. Postlaunch assessment of the response versus scan angle for the thermal emissive bands of visible infrared imaging radiometer suite on-board the Suomi national polar-orbiting partnership satellite. J. Appl. Remote Sens. 2017, 11, 10. [Google Scholar] [CrossRef]
  6. NOAA STAR. NOAA VIIRS SDR Operational Processing Look-Up-Tables. Available online: ftp://ftp.star.nesdis.noaa.gov/pub/smcd/VIIRS_SDR/ (accessed on 19 June 2019).
  7. Cao, C.; Blonski, S.; Wang, W.; Uprety, S.; Shao, X.; Choi, J.; Lynch, E.; Kalluri, S. NOAA-20 VIIRS on-orbit performance, data quality, and operational Cal/Val support. In Proceedings of the SPIE Asia-Pacific Remote Sensing, Honolulu, HI, USA, 24–26 September 2018; Volume 107810K. [Google Scholar]
  8. Johnson, E.H.; Lovelace, A.; Montoya, J.H.; Yee, J.K. JPSS-1 VIIRS emissive band radiometric performance trending. In Proceedings of the SPIE Remote Sensing (SPIE), Berlin, Germany, 25 September 2018; Volume 10785. [Google Scholar]
  9. Moyer, D.; Moeller, C.; Luccia, F.D. NOAA-20 VIIRS thermal emissive band calibration error comparison with heritage VIIRS sensors. In Proceedings of the SPIE Remote Sensing (SPIE), Berlin, Germany, 25 September 2018; Volume 10785. [Google Scholar]
  10. Wu, A.; Xiong, X.; Chiang, K.; Sun, C. Assessment of the NPP VIIRS RVS for the thermal emissive bands using the first pitch maneuver observations. In Proceedings of the SPIE Optical Engineering+Applications (SPIE), San Diego, CA, USA, 15 October 2012; Volume 8510. [Google Scholar]
  11. Wu, A.; Xiong, X.; Chiang, V. Determination of the NOAA-20 VIIRS TEB RVS from emissive radiation measurements during the pitch maneuver. In Proceedings of the SPIE Asia-Pacific Remote Sensing, Honolulu, HI, USA, 23 October 2018; Volume 10781. [Google Scholar]
  12. Cao, C.; Wang, W.; Blonski, S.; Zhang, B. Radiometric traceability diagnosis and bias correction for the Suomi NPP VIIRS long-wave infrared channels during blackbody unsteady states. J. Geophys. Res. Atmos. 2017, 122, 5286–5297. [Google Scholar] [CrossRef]
  13. Datla, R.; Shao, X.; Cao, C.; Wu, X. Comparison of the Calibration Algorithms and SI Traceability of MODIS, VIIRS, GOES, and GOES-R ABI Sensors. Remote Sens. 2016, 8, 126. [Google Scholar] [CrossRef]
  14. Efremova, B.; McIntire, J.; Moyer, D.; Wu, A.; Xiong, X. S-NPP VIIRS thermal emissive bands on-orbit calibration and performance. J. Geophys. Res. Atmos. 2014, 119, 10,859–10,875. [Google Scholar] [CrossRef] [Green Version]
  15. McIntire, J.; Moyer, D.; Chang, T.; Oudrari, H.; Xiong, X. Pre-Launch JPSS-2 VIIRS Response versus Scan Angle Characterization. Remote Sens. 2017, 9, 1300. [Google Scholar] [CrossRef]
  16. Wang, L.; Chen, Y. Inter-Comparing SNPP and NOAA-20 CrIS Toward Measurement Consistency and Climate Data Records. IEEE J. Sel. Top. Appl. Earth Obs. Remote Sens. 2019, in press. [Google Scholar] [CrossRef]
  17. NOAA CLASS. The Comprehensive Large Array-Data Stewardship System (CLASS). Available online: https://www.avl.class.noaa.gov/ (accessed on 1 July 2019).
  18. Cao, C.; Xiong, X.J.; Wolfe, R.; DeLuccia, F.; Liu, Q.M.; Blonski, S.; Lin, G.G.; Nishihama, M.; Pogorzala, D.; Oudrari, H.; et al. Visible Infrared Imaging Radiometer Suite (VIIRS) Sensor Data Record (SDR) User’s Guide, Version 1.2; NOAA Technical Report NESDIS 142; NOAA: College Park, MD, USA, 2013.
  19. McIntire, J.; Moyer, D.; Oudrari, H.; Xiong, X. Pre-Launch Radiometric Characterization of JPSS-1 VIIRS Thermal Emissive Bands. Remote Sens. 2016, 8, 47. [Google Scholar] [CrossRef]
  20. VIIRS SDR OAD. Joint Polar Satellite System (JPSS) Operational Algorithm Description (OAD) Document for VIIRS Geolocation (GEO) Sensor Data Record (SDR) and Calibration (CAL) SDR Software; NOAA/NESDIS/STAR: 2015; NOAA: College Park, MD, USA, 2015.
  21. Wang, W.; Cao, C.; Ignatov, A.; Liang, X.; Li, Z.; Wang, L.; Zhang, B.; Blonski, S.; Li, J. Improving the Calibration of Suomi NPP VIIRS Thermal Emissive Bands during Blackbody Warm-Up/Cool-Down. IEEE Trans. Geosci. Remote Sens. 2019, 57, 1977–1994. [Google Scholar] [CrossRef]
  22. Wang, L.; Wu, X.; Weng, F.; Goldberg, M.D. Effects of Ice Decontamination on GOES-12 Imager Calibration. IEEE Trans. Geosci. Remote Sens. 2013, 51, 1224–1230. [Google Scholar] [CrossRef]
  23. Tobin, D.; Revercomb, H.; Knuteson, B.; Best, F.; Taylor, J.; Deslover, D.; Borg, L.; Moeller, C.; Martin, G.; Kuehn, R.; et al. Suomi NPP/JPSS Cross-Track Infrared Sounder (CrIS): Intercalibration with AIRS, IASI, and VIIRS. In Proceedings of the 93rd AMS Annual Conference, Austin, TX, USA, 6–10 January 2013. [Google Scholar]
  24. Wang, L.; Tremblay, D.; Zhang, B.; Han, Y. Fast and Accurate Collocation of the Visible Infrared Imaging Radiometer Suite Measurements with Cross-Track Infrared Sounder. Remote Sens. 2016, 8, 76. [Google Scholar] [CrossRef]
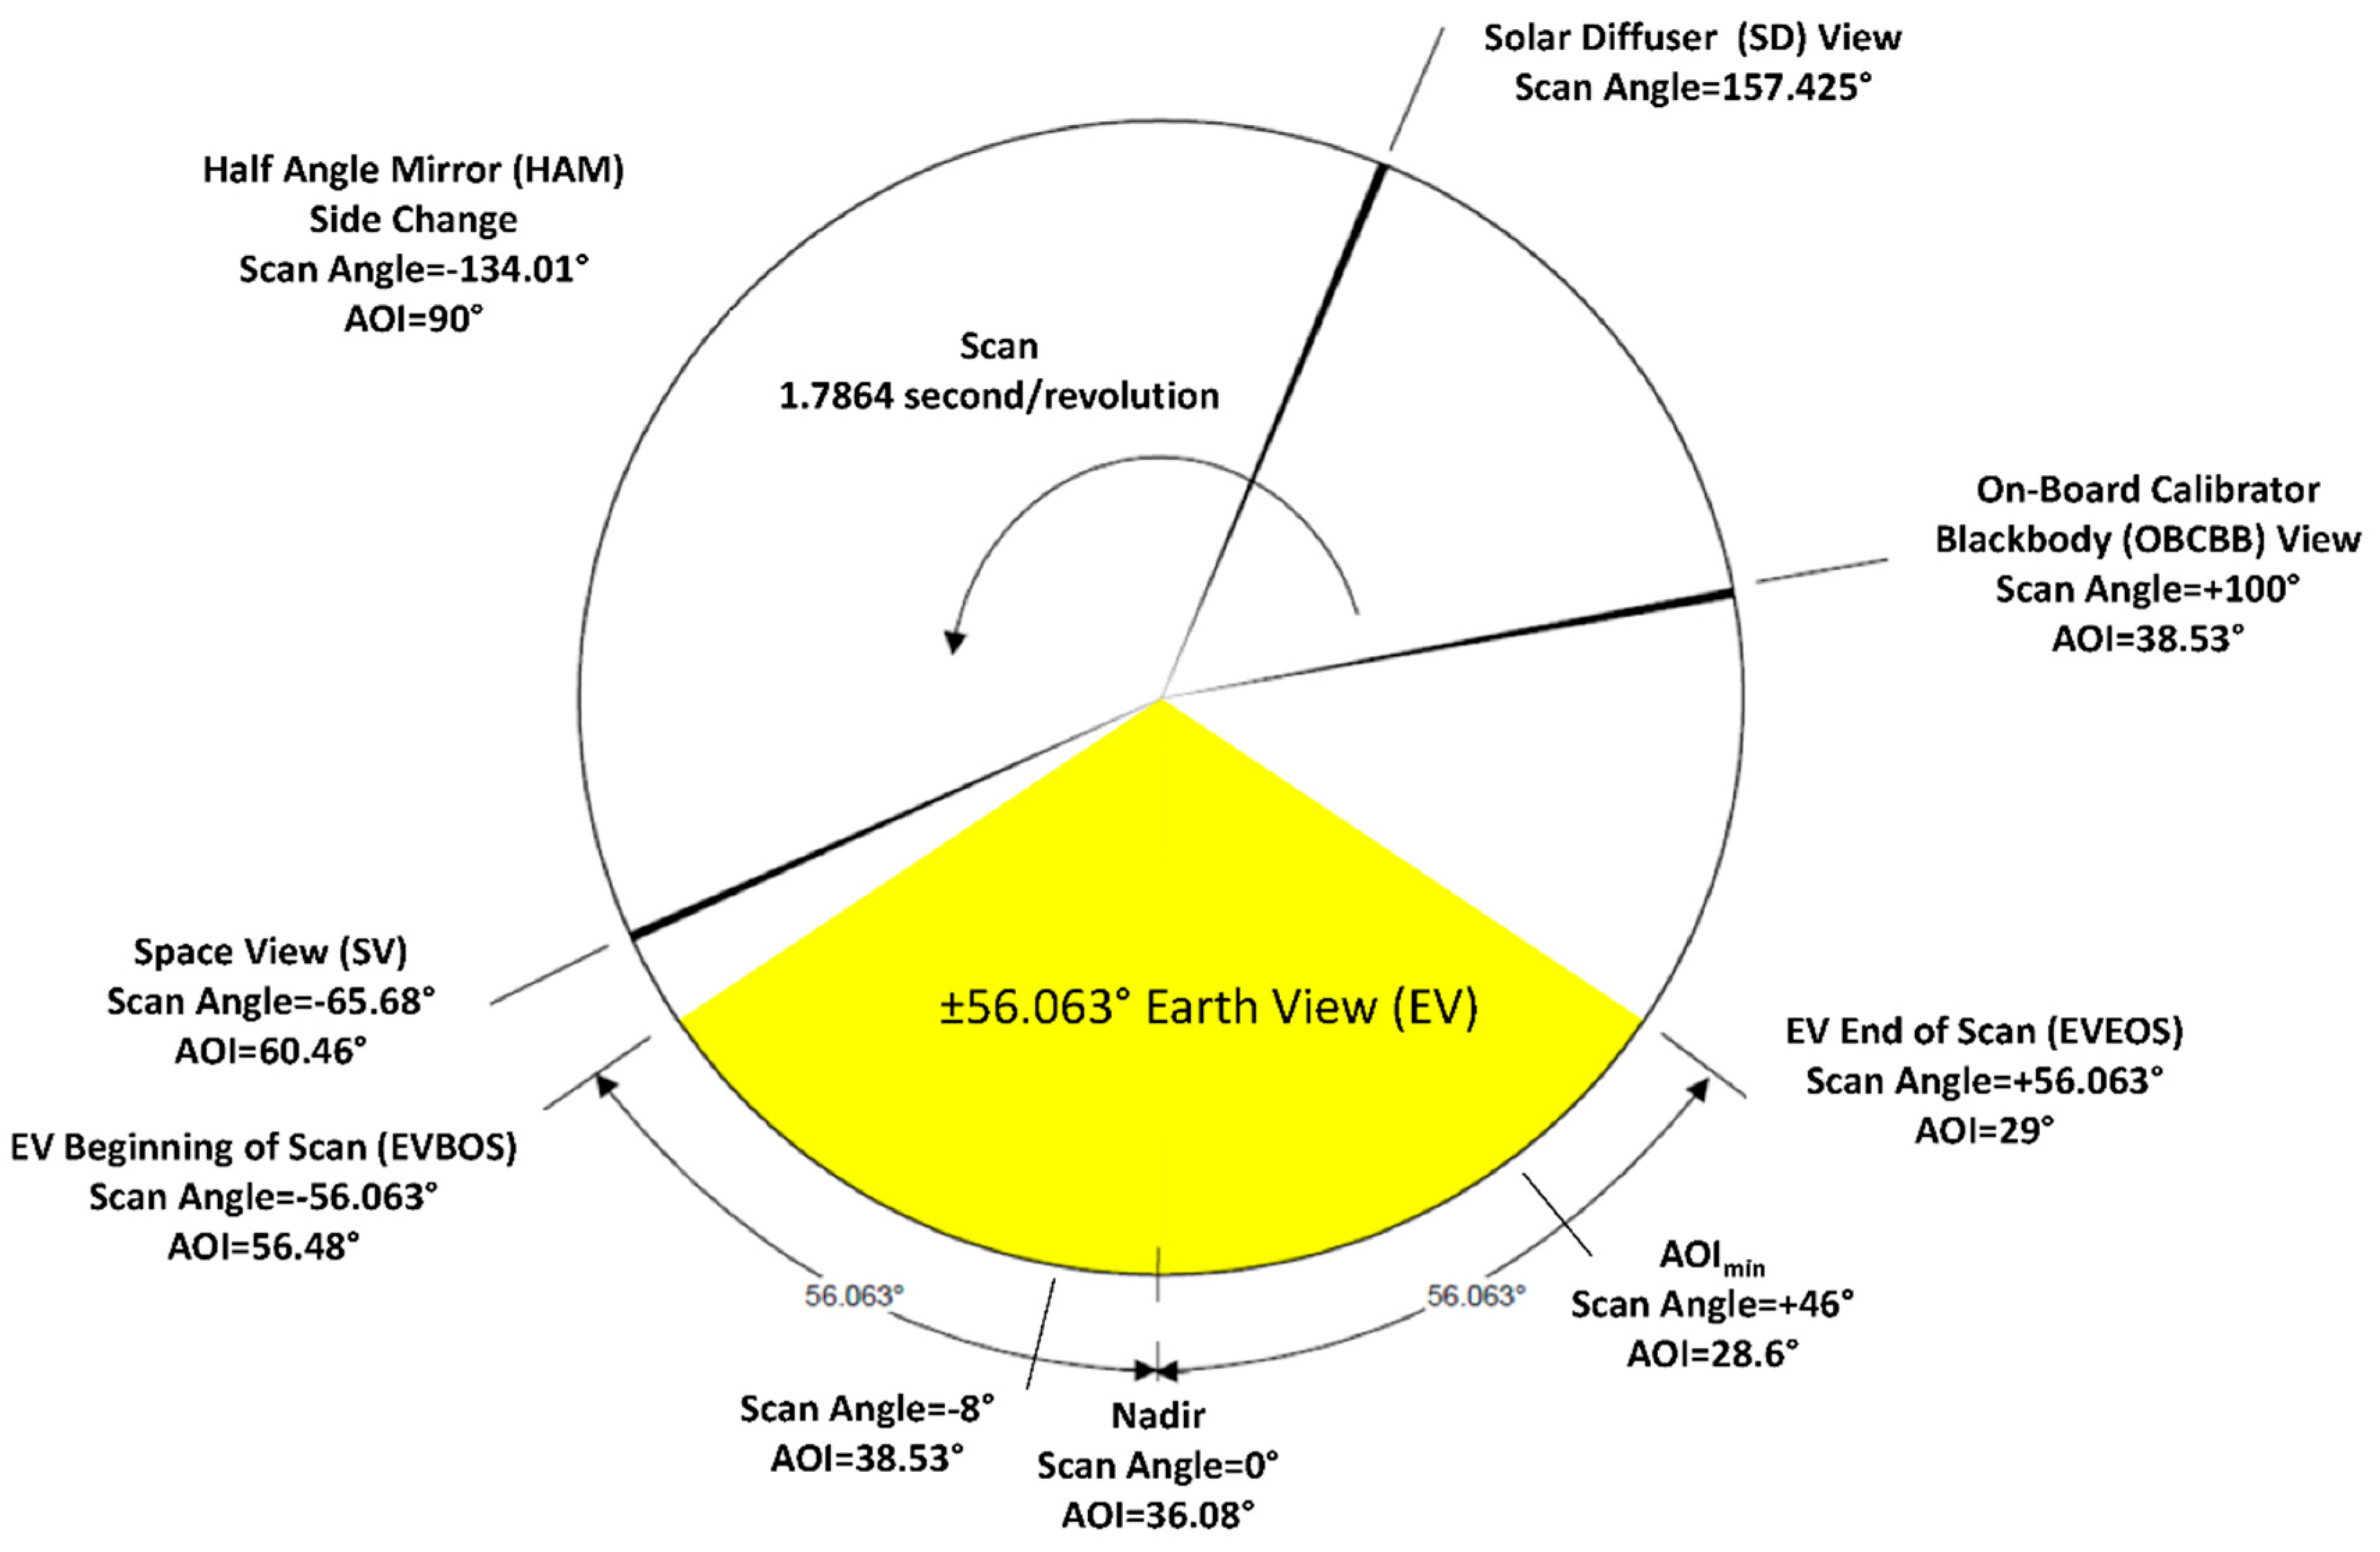
Figure 1. Diagram of Visible Infrared Imaging Radiometer Suite (VIIRS) scan pattern. Scan angles and angle of incidences (AOIs) at space view (SV), blackbody (OBCBB), the beginning of Earth View (EV) scan (EVBOS), nadir, the end of EV scan (EVEOS), and AOImin are also given.
Remotesensing 11 01624 g001
Figure 2. S-NPP and NOAA-20 band averaged Response Versus Scan (RVS) as functions of AOI for half angle mirror (HAM)-A (solid lines) and HAM-B (dash lines). The SV, EVBOS, EVEOS, and OBCBB AOIs are also marked.
Remotesensing 11 01624 g002
Figure 3. NOAA-20 VIIRS–CrIS BT differences at 10 scene temperatures and as function of CrIS FOR position and VIIRS scan angle. Under each scene temperature, the sizes of the filled circles are proportional to the number of data samples used.
Remotesensing 11 01624 g003
Figure 4. S-NPP VIIRS–CrIS BT differences at 10 scene temperatures and as function of CrIS FOR position and VIIRS scan angle. Under each scene temperature, the sizes of the filled circles are proportional to the number of data samples used.
Remotesensing 11 01624 g004
Figure 5. An image of NOAA-20 M15 EV counts during the beginning of pitch maneuverer (January 31, 2018, 13:42:23–13:48:04 UTC). The bright feature that occupies most of the image is the Earth. The dark portion of the image in the bottom shows the deep space data for on-orbit RVS characterization. The striping at the beginning and the end of scan are fill values due to bowtie deletion.
Remotesensing 11 01624 g005
Figure 6. The Wang et al. method derived NOAA-20 raw (pixel level) on-orbit RVS data as function of frame. For each band, detector level raw RVS are illustrated by different colors ranging from blue (HAM-A, first detector) to dark red (HAM-B, last detector).
Remotesensing 11 01624 g006
Figure 7. NOAA-20 bands I5, M13, and M15–M16 detector level on-orbit RVS derived using the Wang et al. method, after smoothed using 2nd order polynomials.
Remotesensing 11 01624 g007
Figure 8. Comparison of band-averaged NOAA-20 (left panel) and S-NPP (right panel) prelaunch and the Wang et al. method derived on-orbit RVS for HAM-A (solid lines) and HAM-B (dash lines).
Remotesensing 11 01624 g008
Figure 9. Comparison of band-averaged NOAA-20 (left panel) and S-NPP (right panel) prelaunch and the Wu et al. method derived on-orbit RVS for HAM-A (solid lines) and HAM-B (dash lines). .
Remotesensing 11 01624 g009
Figure 10. NOAA-20 VIIRS–CrIS BT differences at 10 scene temperatures and as functions of CrIS FOR position and VIIRS scan angle. VIIRS M15–M16, M13, and I5 SDRs from March 18, 2019 were reprocessed using the Wu et al. method derived on-orbit RVS. Under each scene temperature, the sizes of the filled circles are proportional to the number of data samples used.
Remotesensing 11 01624 g010
Figure 11. NOAA-20 VIIRS–CrIS BT differences at 10 scene temperatures and as function of CrIS FOR position and VIIRS scan angle. VIIRS M15–M16, M13, and I5 SDRs from March 18, 2019 were reprocessed using the Wang et al. method derived on-orbit RVS. Under each scene temperature, the sizes of the filled circles are proportional to the number of data samples used.
Remotesensing 11 01624 g011
Figure 12. S-NPP VIIRS–CrIS BT differences at 10 scene temperatures and as function of CrIS FOR position and VIIRS scan angle. VIIRS M15–M16, M13, and I5 SDRs from March 18, 2019 were reprocessed using the Wang et al. method derived on-orbit RVS. Under each scene temperature, the sizes of the filled circles are proportional to the number of data samples used.
Remotesensing 11 01624 g012
Figure 13. NOAA-20 VIIRS–CrIS BT differences as function of CrIS scene temperature. Scene temperature dependent biases for the reprocessed VIIRS SDRs (the Wang et al. method derived on-orbit RVS) were plotted in the foreground in solid lines; biases for the NOAA operational processing (prelaunch RVS) were plotted in the background using dash lines and pale colors.
Remotesensing 11 01624 g013
Table 1. Spectral, spatial, and radiometric characteristics of NOAA-20 and S-NPP VIIRS TEBs. I4-I5, M12, M14-M16 are single gain (S) bands. M13 is a dual gain band (H: high gain; L: low gain). Ttyp stands for typical scene temperature; NEdT stands for noise equivalent differential temperature.
VIIRS TEBsSpatial Resolution (m)Center Wavelength (µm)GainTtyp (K)NEdT Spec (K)NEdT On-Orbit (K)
NOAA-20S-NPPNOAA-20S-NPP
MWIRM127503.7003.697S2700.3960.120.12
I43753.7533.753S2702.50.420.40
M137504.0704.067H3000.1070.040.04
L3800.423
--
LWIRM147508.5838.578S2700.0910.050.06
M1575010.70310.729S3000.070.020.03
I537511.45011.469S2101.50.420.40
M1675011.86911.845S3000.0720.030.03
Table 2. NOAA-20 and S-NPP pitch maneuver data used for on-orbit Response Versus Scan (RVS) characterization.
NOAA-20S-NPP
Granule UsedJanuary 31, 2018February 20, 2012
13:46:40–13:48:04 UTC18:26:29–18:27:44 UTC
Start Scan Number111
Number of scans used10 (5 scans for each HAM-side)10 (5 scans for each HAM-side)
S/MWIR FPA Temp.80.29K79.86K
LWIR FPA Temp.80.48K79.95K
Table 3. NOAA-20 and S-NPP band-averaged differences between the Wang et al. method derived on-orbit RVS and prelaunch RVS over scan angles at −56.063° (EVBOS), −8° (OBCBB AOI), +41°, +56.063° (EVEOS), and averaged over the entire EV scan angles (Scan Avg.), for HAM-A and HAM-B. Cases with differences exceeding ±0.3% are highlighted.
Unit: %On-Orbit RVS (the Wang et al. Method)—Prelaunch RVS
−56.063°−8°+41°+56.063°Scan Avg.
NOAA-20I4−0.35/−0.34−0.30/−0.340.43/0.450.43/0.450.35/0.38
I50.73/0.800.30/0.290.10/0.080.07/0.040.32/0.32
M12−0.46/−0.480.47/0.450.58/0.590.59/0.590.51/0.51
M130.28/0.320.20/0.240.14/0.170.14/0.170.19/0.23
M141.01/0.930.37/0.330.12/0.080.04/0.010.41/0.36
M150.95/1.050.35/0.400.13/0.160.09/0.110.40/0.45
M160.44/0.450.16/0.130.02/-0.010.00/-0.030.17/0.15
S-NPPI40.80/0.750.79/0.800.85/0.860.85/0.860.81/0.81
I50.25/0.310.04/0.050.09/0.100.09/0.100.11/0.13
M12−0.26/−0.240.33/0.350.37/0.390.37/0.390.33/0.34
M13−0.28/−0.270.42/0.410.39/0.400.40/0.410.39/0.39
M140.09/0.070.06/0.030.18/0.170.18/0.170.11/0.09
M150.37/0.470.15/0.220.15/0.220.15/0.220.19/0.27
M160.11/0.14−0.02/−0.02−0.01/−0.01−0.01/−0.010.01/0.02
Table 4. NOAA-20 and S-NPP band-averaged differences between the Wu et al. method derived on-orbit RVS and prelaunch RVS over scan angles at −56.063° (EVBOS), −8° (OBCBB AOI), +56.063° (EVEOS), and averaged over the entire EV scan (Scan Avg.), for HAM-A and HAM-B. Cases with differences exceeding ±0.3% are highlighted.
Unit: %On-Orbit RVS (the Wu et al. Method)—Prelaunch RVS
−56.063°−8°+56.063°Scan Avg.
NOAA-20I40.11/0.090.16/0.110.03/0.000.10/0.07
I50.32/0.30−0.10/−0.270.34/0.55−0.09/−0.23
M120.08/0.090.07/0.09−0.05/−0.040.03/0.04
M130.02/0.02−0.06/−0.06−0.12/−0.12−0.06/−0.06
M140.78/0.790.22/0.25−0.09/−0.040.25/0.28
M150.44/0.43−0.14/−0.290.40/0.60−0.09/−0.23
M160.22/0.22−0.04/−0.17−0.20/−0.37−0.04/−0.15
S-NPPI40.03/0.010.04/−0.03−0.02/−0.090.02/−0.04
I5−0.06/−0.12−0.25/−0.54−0.20/−0.55−0.19/−0.45
M12−0.01/−0.02−0.08/−0.13−0.12/−0.18−0.08/−0.12
M13−0.06/−0.06−0.20/−0.22−0.18/−0.22−0.17/−0.20
M140.06/−0.040.13/−0.320.28/−0.270.17/−0.24
M15−0.04/−0.13−0.24/−0.65−0.24/−0.74−0.20/−0.57
M16−0.02/−0.07−0.14/−0.33−0.13/−0.35−0.11/−0.28
Table 5. NOAA-20 VIIRS–CrIS scan averaged biases at 10 scene temperatures for the NOAA operational (prelaunch RVS) and the reprocessed SDRs (the Wang et al. method derived on-orbit RVS). Unit for scene temperatures and biases: K.
Scene TemperaturePrelaunch RVSWang et al. On-Orbit RVS
M15M16M13I5M15M16M13I5
2200.400.19-0.260.120.10-0.06
2300.310.14-0.200.110.08-0.05
2400.240.10-0.140.100.05-0.03
2500.180.050.050.090.080.020.030.01
2600.110.010.040.030.060.010.080.02
2700.050.040.080.030.030.050.110.04
2800.010.080.090.070.020.070.100.06
2900.050.120.130.110.020.110.120.08
3000.070.150.190.130.020.120.180.09
3100.150.190.290.200.050.150.280.13
Table 6. S-NPP VIIRS–CrIS scan averaged biases at 10 scene temperatures for the NOAA operational (prelaunch RVS) and reprocessed (the Wang et al. method derived on-orbit RVS) SDRs. Unit for scene temperatures and biases: K.
Scene TemperaturePrelaunch RVSWang et al. On-Orbit RVS
M15M16M13I5M15M16M13I5
2200.240.04-0.070.080.04-0.01
2300.180.02-0.050.060.02-0.01
2400.130.01-0.030.030.01-0.01
2500.090.010.080.020.020.010.060.01
2600.050.020.090.010.010.010.010.01
2700.020.020.080.020.010.020.030.01
2800.010.020.080.030.020.020.060.03
2900.020.010.090.050.020.010.090.05
3000.020.010.100.080.010.010.100.09
3100.030.020.170.110.010.020.180.13