Article

Aligning Pixel Values of DMSP and VIIRS Nighttime Light Images to Evaluate Urban Dynamics

1
Beijing Key Laboratory of Megaregions Sustainable Development Modelling and School of Urban Economics and Public Administration, Capital University of Economics and Business, Beijing 100070, China
2
Beijing Key Laboratory of Megaregions Sustainable Development Modelling and Institute of Megalopolis Social-economic Development, Capital University of Economics and Business, Beijing 100070, China
*
Author to whom correspondence should be addressed.
The two authors contribute equally to the paper.
Remote Sens. 2019, 11(12), 1463; https://doi.org/10.3390/rs11121463
Submission received: 25 April 2019 / Revised: 12 June 2019 / Accepted: 18 June 2019 / Published: 20 June 2019
(This article belongs to the Special Issue Advances in Remote Sensing with Nighttime Lights)

Abstract

:
The brightness of pixels in nighttime light images (NTL) has been regarded as the proxy of the urban dynamics. However, the great difference between the pixel values of NTL from the Defense Meteorological Satellite Program’s Operational Linescan System (DMSP/OLS) and the Suomi National Polar-orbiting Partnership satellite’s Visible Infrared Imaging Radiometer Suite (Suomi NPP/VIIRS) poses obstacles to analyze economic and social development with NTL in a continuous temporal sequence. This research proposes a methodology to align the pixel values of both NTL by calibrating annual DMSP images between the years 1992–2013 with a robust regression algorithm with a quadratic polynomial regression model and simulating annual DMSP images with VIIRS images between years 2012 and 2018 with a model consisting of a power function and a Gaussian low pass filter. As a result, DMSP annual images between years 1992–2018 can be produced. Case study of Beijing and Yiwu are conducted and evaluated with local gross domestic product (GDP). Compared with the values of DMSP and VIIRS annual composites, the Pearson correlation coefficients of DMSP and simulated DMSP annual composites in 2012 and in 2013 increase significantly, while the root mean square error (RMSE) decrease evidently. In addition, the correlation of the sum of light of NTL and local GDP is enhanced with a simulation process. These results demonstrate the feasibility of the proposed method in narrowing the gap between DMSP and VIIRS NTL in pixel values.

Graphical Abstract

1. Introduction

Understanding the dynamics of urban expansion is very essential for better tackling the ongoing urban system changes and sustainability around the different scales [1]. Among all the numerous data and methods, traditionally, census and socioeconomic statistical data are widely applied to uncover the evolution of urban dynamics, such as urbanization patterns and spatial-temporal changes of population, economic performance and energy consumption [2,3,4,5,6,7]. However, there are issues of data accessibility and reliability due to the demanding collection of questionnaires, inconsistent survey scales and sampling errors. As a counterpart, in recent decades, nighttime light images (NTL) have been used to extract various indicators relevant to human activities [8], due to their wide coverage, short periodicity, availability and correlation with socioeconomic indicators such as an expansion of urban land [9,10], loss of natural habitat [11], urban zone partition [12], population evolution [13], gross domestic product (GDP) [14], electricity consumption [15], carbon dioxide emission [16] and poverty [17].
The Defense Meteorological Satellite Program’s Operational Linescan System Visible Near-Infrared Band (DMSP/OLS VNIB) and the Suomi National Polar-orbiting Partnership satellite’s Visible Infrared Imaging Radiometer Suite (Suomi NPP/VIIRS) Day/Night Band are two main sources of NTL. The former, referred to as DMSP in the following parts, provides NTL from the year 1992 to year 2013, while the latter, referred to as VIIRS, produces NTL from the year 2012 to the present. On the one hand, the use of NTL in multitemporal socioeconomic research attributes to the correlation between the sum of light (SOL) and socioeconomic variables, and it is of great advantage to combine NTL from DMSP and VIIRS in urban studies to keep the continuity of temporal sequence. However, on the other hand, DMSP and VIIRS NTL are different in various aspects, which hinders the combined use of both NTL.
As shown in Table 1, the spatial resolution of DMSP is 2.7 km, lower than that of VIIRS (742 m). VIIRS satellite also can detect weaker lights at night. The pixel values of DMSP NTL are relative integers in a range of 0–63, while those of VIIRS NTL are absolute radiation values. The overpass time of DMSP satellite is around 21 o’clock while that of VIIRS satellite is approximately 1:30 a.m. Besides, DMSP NTL have no on-board calibration, though VIIRS NTL has the calibration. As for data retrieval, National Oceanic and Atmospheric Administration’s National Centers for Environmental Information [18], formerly the National Geophysical Data Center (NGDC) of the USA, provides both kinds of NTL on its website. DMSP annual composites in years 1992–2013, VIIRS monthly composites in the years from 2012 to present and annual composites in the years 2015 and 2016 can be downloaded for free, but DMSP monthly composites from the year 1992 to the year 2014 need to be ordered from NOAA/NCEI.
Although the difference in spatial resolution between DMSP and VIIRS NTL can be dealt with resampling or spatial aggregation methods, the gap among them in pixel values poses obstacles to multitemporal socioeconomic research. Existing literature combining NTL from both sources is not much. Xu et al. [9] compared urban land data derived from DMSP NTL from the year 1992 to the year 2013 and VIIRS NTL in 2015 to assess urban land expansion of China from the year 1992 to the year 2015, but the study did not implement a combination of pixel values of both kinds of NTL. Shao et al. [19] converted digital numbers of DMSP NTL to radiation values of VIIRS NTL with a function of lunar phases, but the range of converted digital numbers of DMSP NTL is limited between 10 and 31. Li et al. [20] employed a power function and a Gaussian low pass filter to simulate DMSP monthly composites from VIIRS monthly composites and studied the loss of city light of Syria at the provincial level from March 2011 to January 2017. However, the model uses DMSP monthly composites that cannot be obtained free online, and the feasibility of the method has not been confirmed in other areas. Zheng et al. [21] used a residuals corrected geographically weighted regression (GWRc) model to generate DMSP-like NTL with VIIRS NTL after the removal of seasonal effect, noisy and unstable pixels by the Breaks For Additive Seasonal and Trend (BFAST) algorithm. The pixel-level consistency of the resulting DMSP and DMSP-like VIIRS NTL from 1996 to 2017 is significantly improved. However, the global radiance calibrated DMSP ( DMSP grc ) NTL employed in the research are available only in eight years between 1996 and 2011. As a result, the missing annual DMSP grc NTL between the year 1996 and year 2011, and even the DMSP grc NTL in overlapped years 2012 and 2013 have to be estimated by a logistic model.
Based on the existing study, this research attempts to calibrate DMSP annual composites in the years 1992–2013 with a robust regression algorithm with a quadratic polynomial regression model and to simulate DMSP annual composites in the years between 2012 and 2018 with VIIRS annual composites produced from VIIRS monthly composites by employing a model consisting of a power function and a Gaussian low pass filter, so that DMSP annual composites in the years 1992–2018 can be yielded. The consistency in pixel values between original DMSP annual composites and simulated ones is evaluated with statistical coefficients, and correlation between the SOL of NTL and local GDP in Beijing and Yiwu is also assessed to confirm the effectiveness of simulation.
In the following parts of this paper, Section 2 introduces the study area and data of this research. Section 3 presents methods of calibrating DMSP annual composites in the years between 1992 and 2013, producing VIIRS annual composites and simulating DMSP annual composites in the years between 2012 and 2018. Section 4 introduces experimental results of a case study in Beijing, while results of case study in Yiwu are provided in Supplementary Materials for simplicity. Finally, discussions and conclusions are conducted in Section 5 and Section 6.

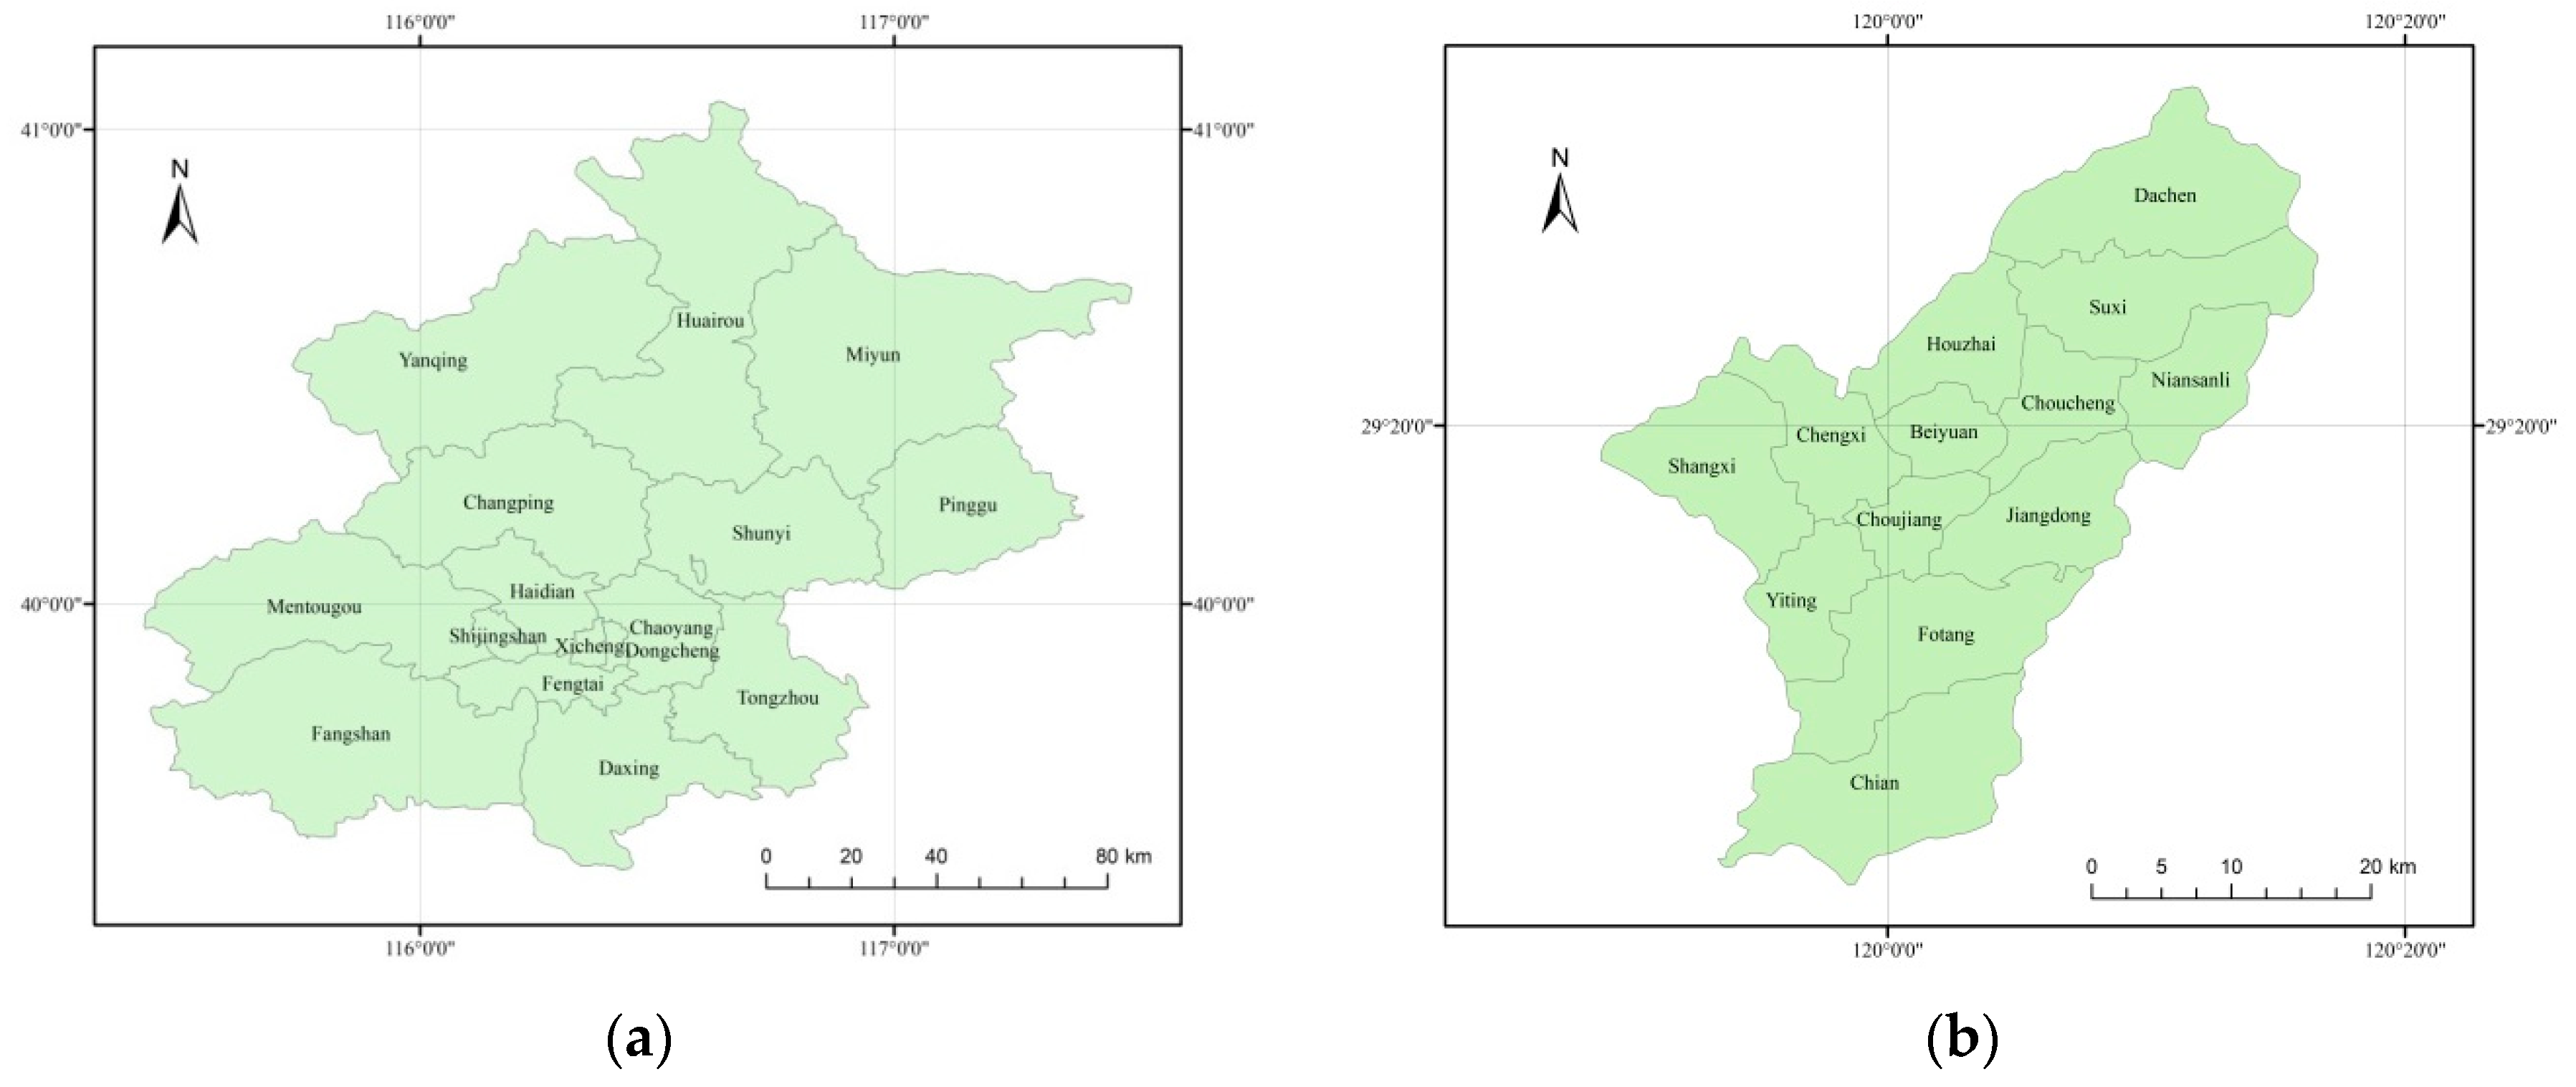
2. Study Area and Data
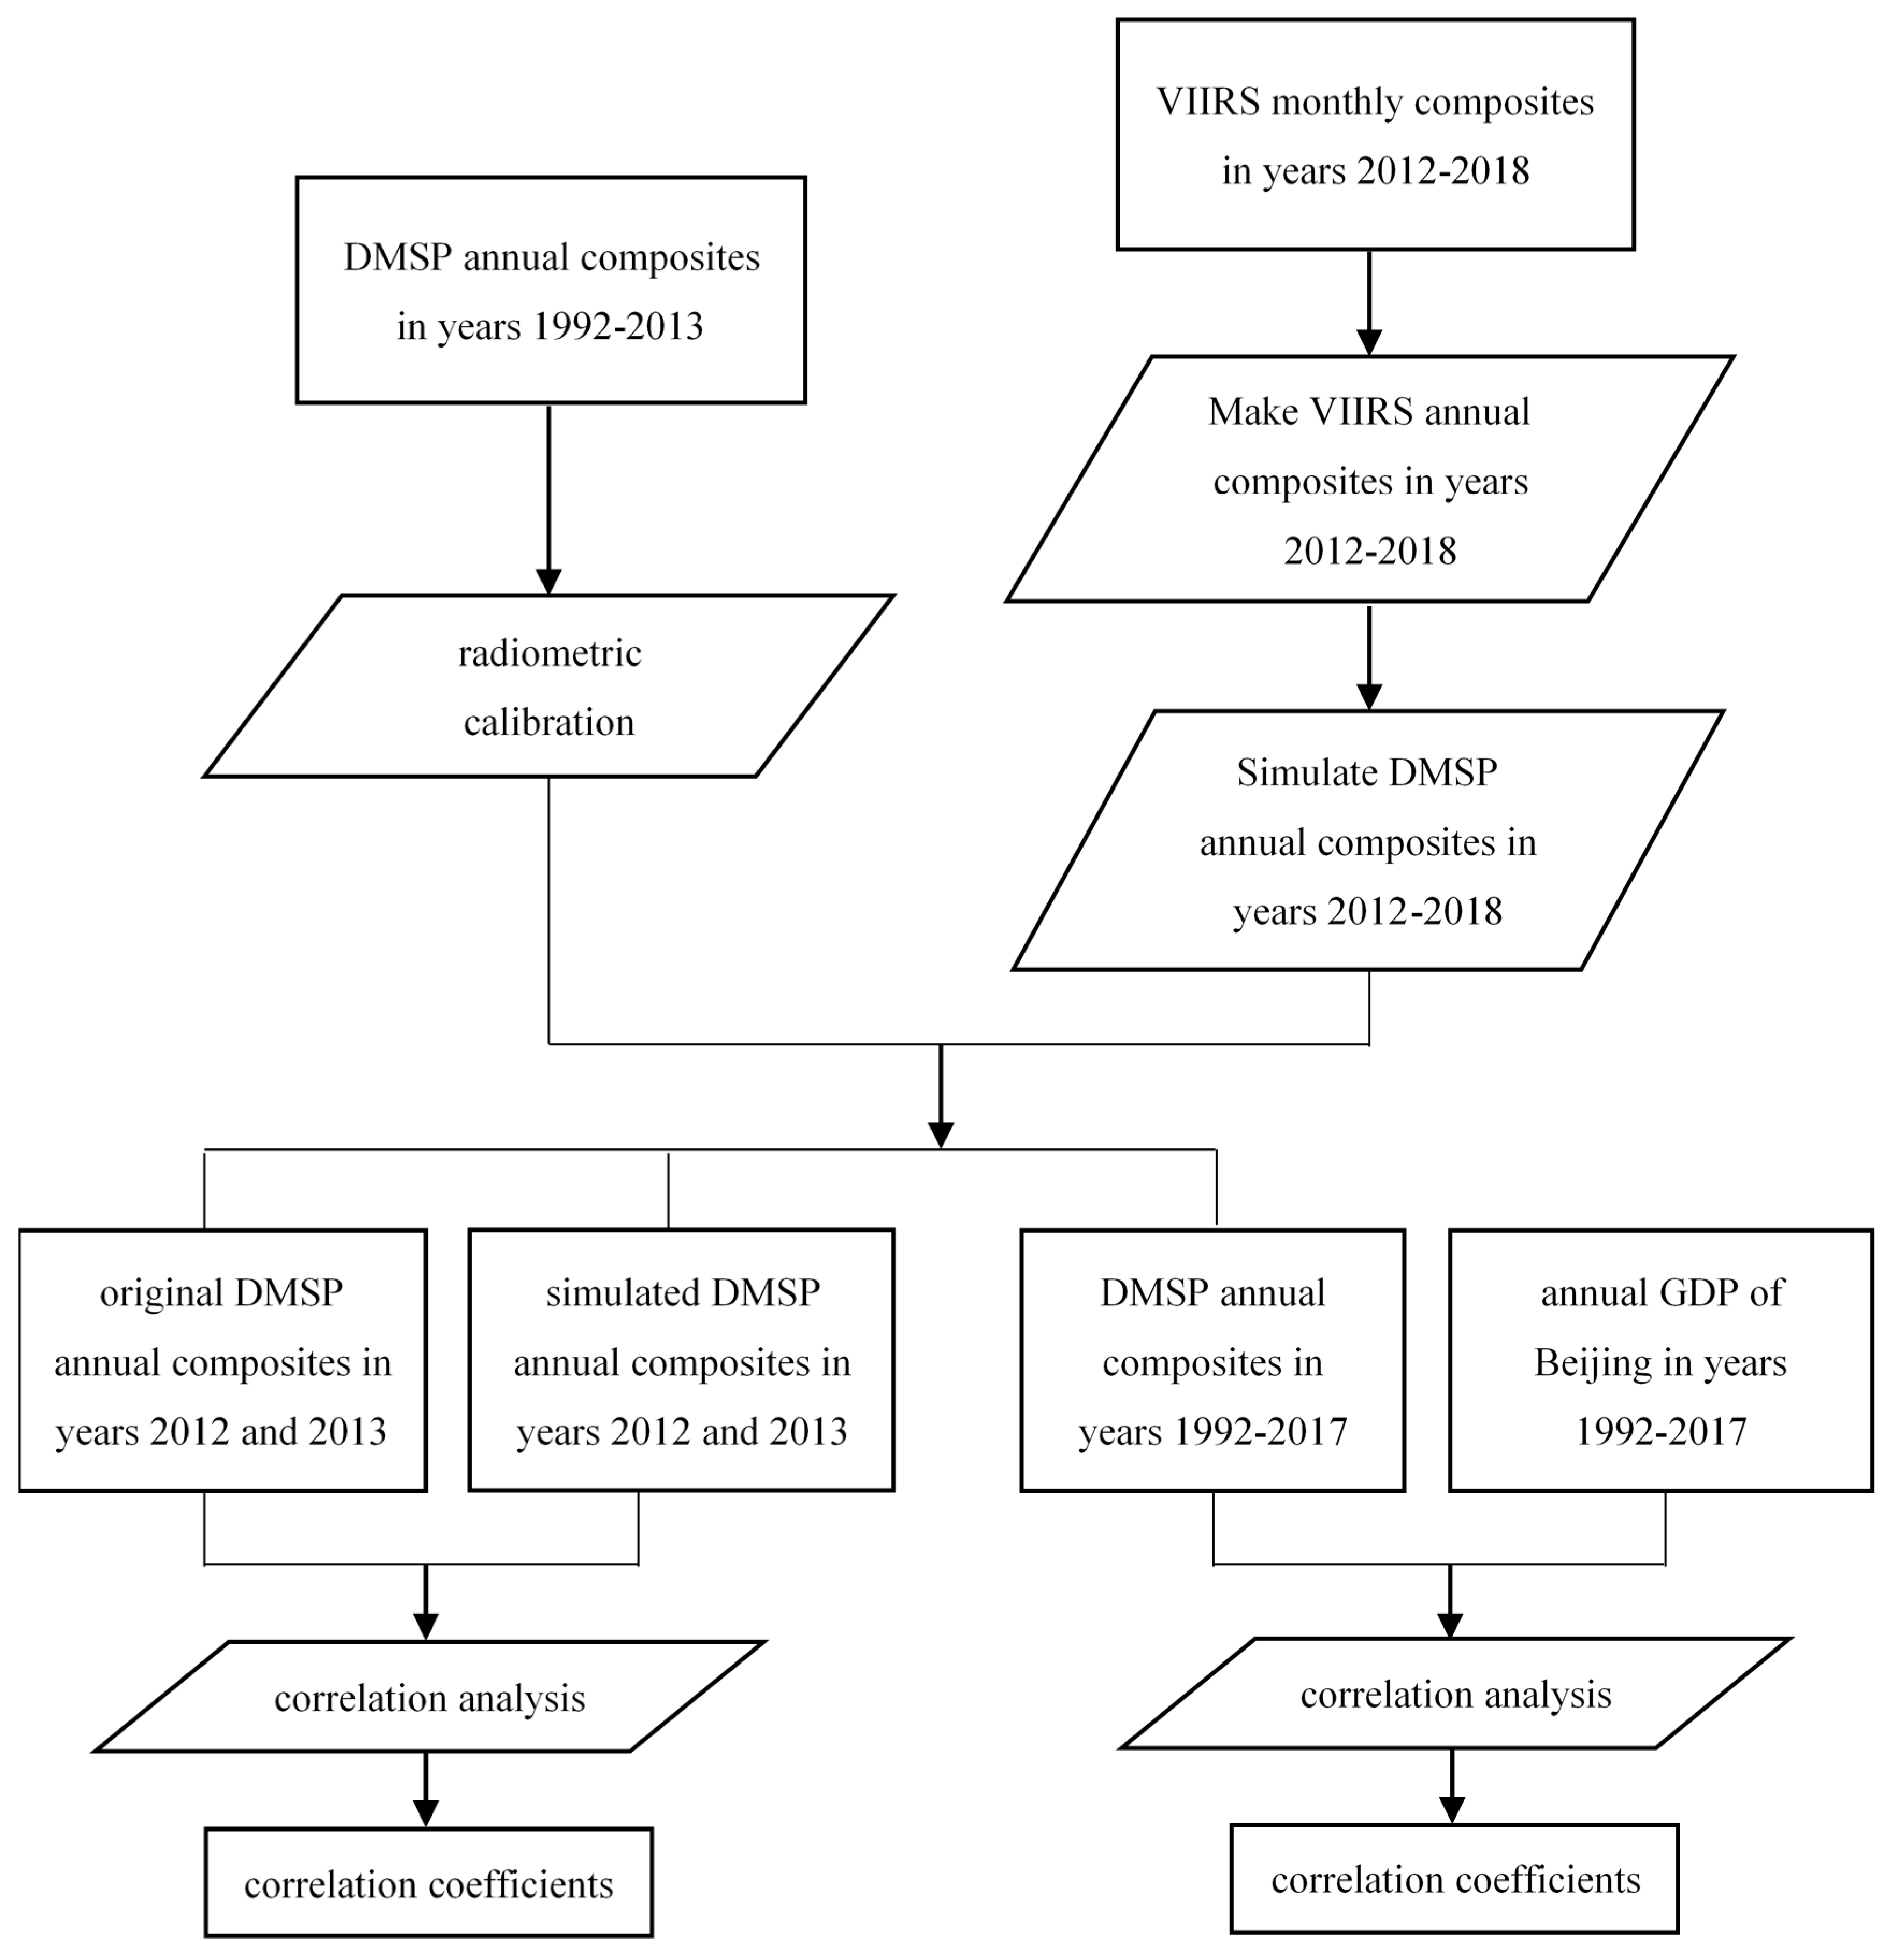
This research chose Beijing and Yiwu as the study area (Figure 1). Beijing is located in 39°26′–41°03′N, 115°25′–117°30′E, and Yiwu in 29°02′–29°34′N, 119°49′–120°17′E, both well within the coverage of DMSP and VIIRS NTL. As the capital city of China, Beijing represents a high development level and urban prosperity in China. With an administrative area of around 16,410 square kilometers, since 1990s, Beijing has gone through rapid urban expansion and economic growth. Besides, according to the national development strategy and new urbanization design, Beijing has been in the progress of promoting a collaborative development Beijing-Tianjin-Hebei since 2014, with efforts to restructure both the industry function and city space. Yiwu is one of the richest county-level city in Zhejiang Province of China with an administrative area of around 1105 square kilometers and famous for a small commodity market. It has become one of the pioneered schemes for urban development by innovation and reform.
In this research, three types of data were used, namely, administrative boundaries, NTL and socioeconomic statistics. Annual composites of DMSP stable light images in the years between 1992 and 2013, and VIIRS monthly composites from April 2012 to August 2018 were downloaded from NOAA/NCEI. In the two versions of VIIRS monthly composites, the one excluding any data affected by stray light and denoted with vcm in the filenames was chosen, and DMSP stable lights products employed in this study were also discarded temporary lights such as fires and replaced background noise with zero values. In total, 22 DMSP annual composites and 76 VIIRS monthly composites were utilized. These NTL and the administrative division boundaries data of Beijing were in the World Geodetic System 1984 geographical projection. Additionally, city-level statistics of a local GDP of Beijing in the years from 1992 to 2017 and district-level GDP of Beijing in years from 2005 to 2017 were retrieved from the Beijing Macroeconomic and Social Development Database [22]. City-level statistics of local GDP of Yiwu in the years 1999–2017 were collected from the annual statistic reports on the website of People’s Government of Yiwu [23].
The following parts focused mainly on the study of Beijing, which consisted of parameter determination for aligning pixel values of DMSP and VIIRS NTL and correlation analysis between NTL and GDP on both the city level and district level, while the study of Yiwu was carried out by using parameters determined on the study of Beijing and evaluating the correlation between NTL and GDP on the city level to examine the validity of the proposed method and resulting parameters.

3. Methodology

This section presents methods of NTL processing and model evaluation. As shown in Figure 2, to combine DMSP and VIIRS NTL in pixel values, an adapted robust regression method was employed to calibrate DMSP annual composites in the years between 1992 and 2013 in the beginning. Meanwhile, VIIRS monthly composites were used to produce annual composites in the years from 2012 to 2018. Then, VIIRS annual composites were processed to simulate DMSP annual composites in the years 2012–2018. After getting simulated DMSP annual composites in the years from 2012 to 2018, Pearson correlation coefficient and root mean square error (RMSE) were calculated to evaluate the consistency between original and simulated DMSP NTL in pixel values. Besides, the correlation between DMSP NTL and GDP of Beijing in years from 1992 to 2017 was also assessed with Pearson correlation coefficient.

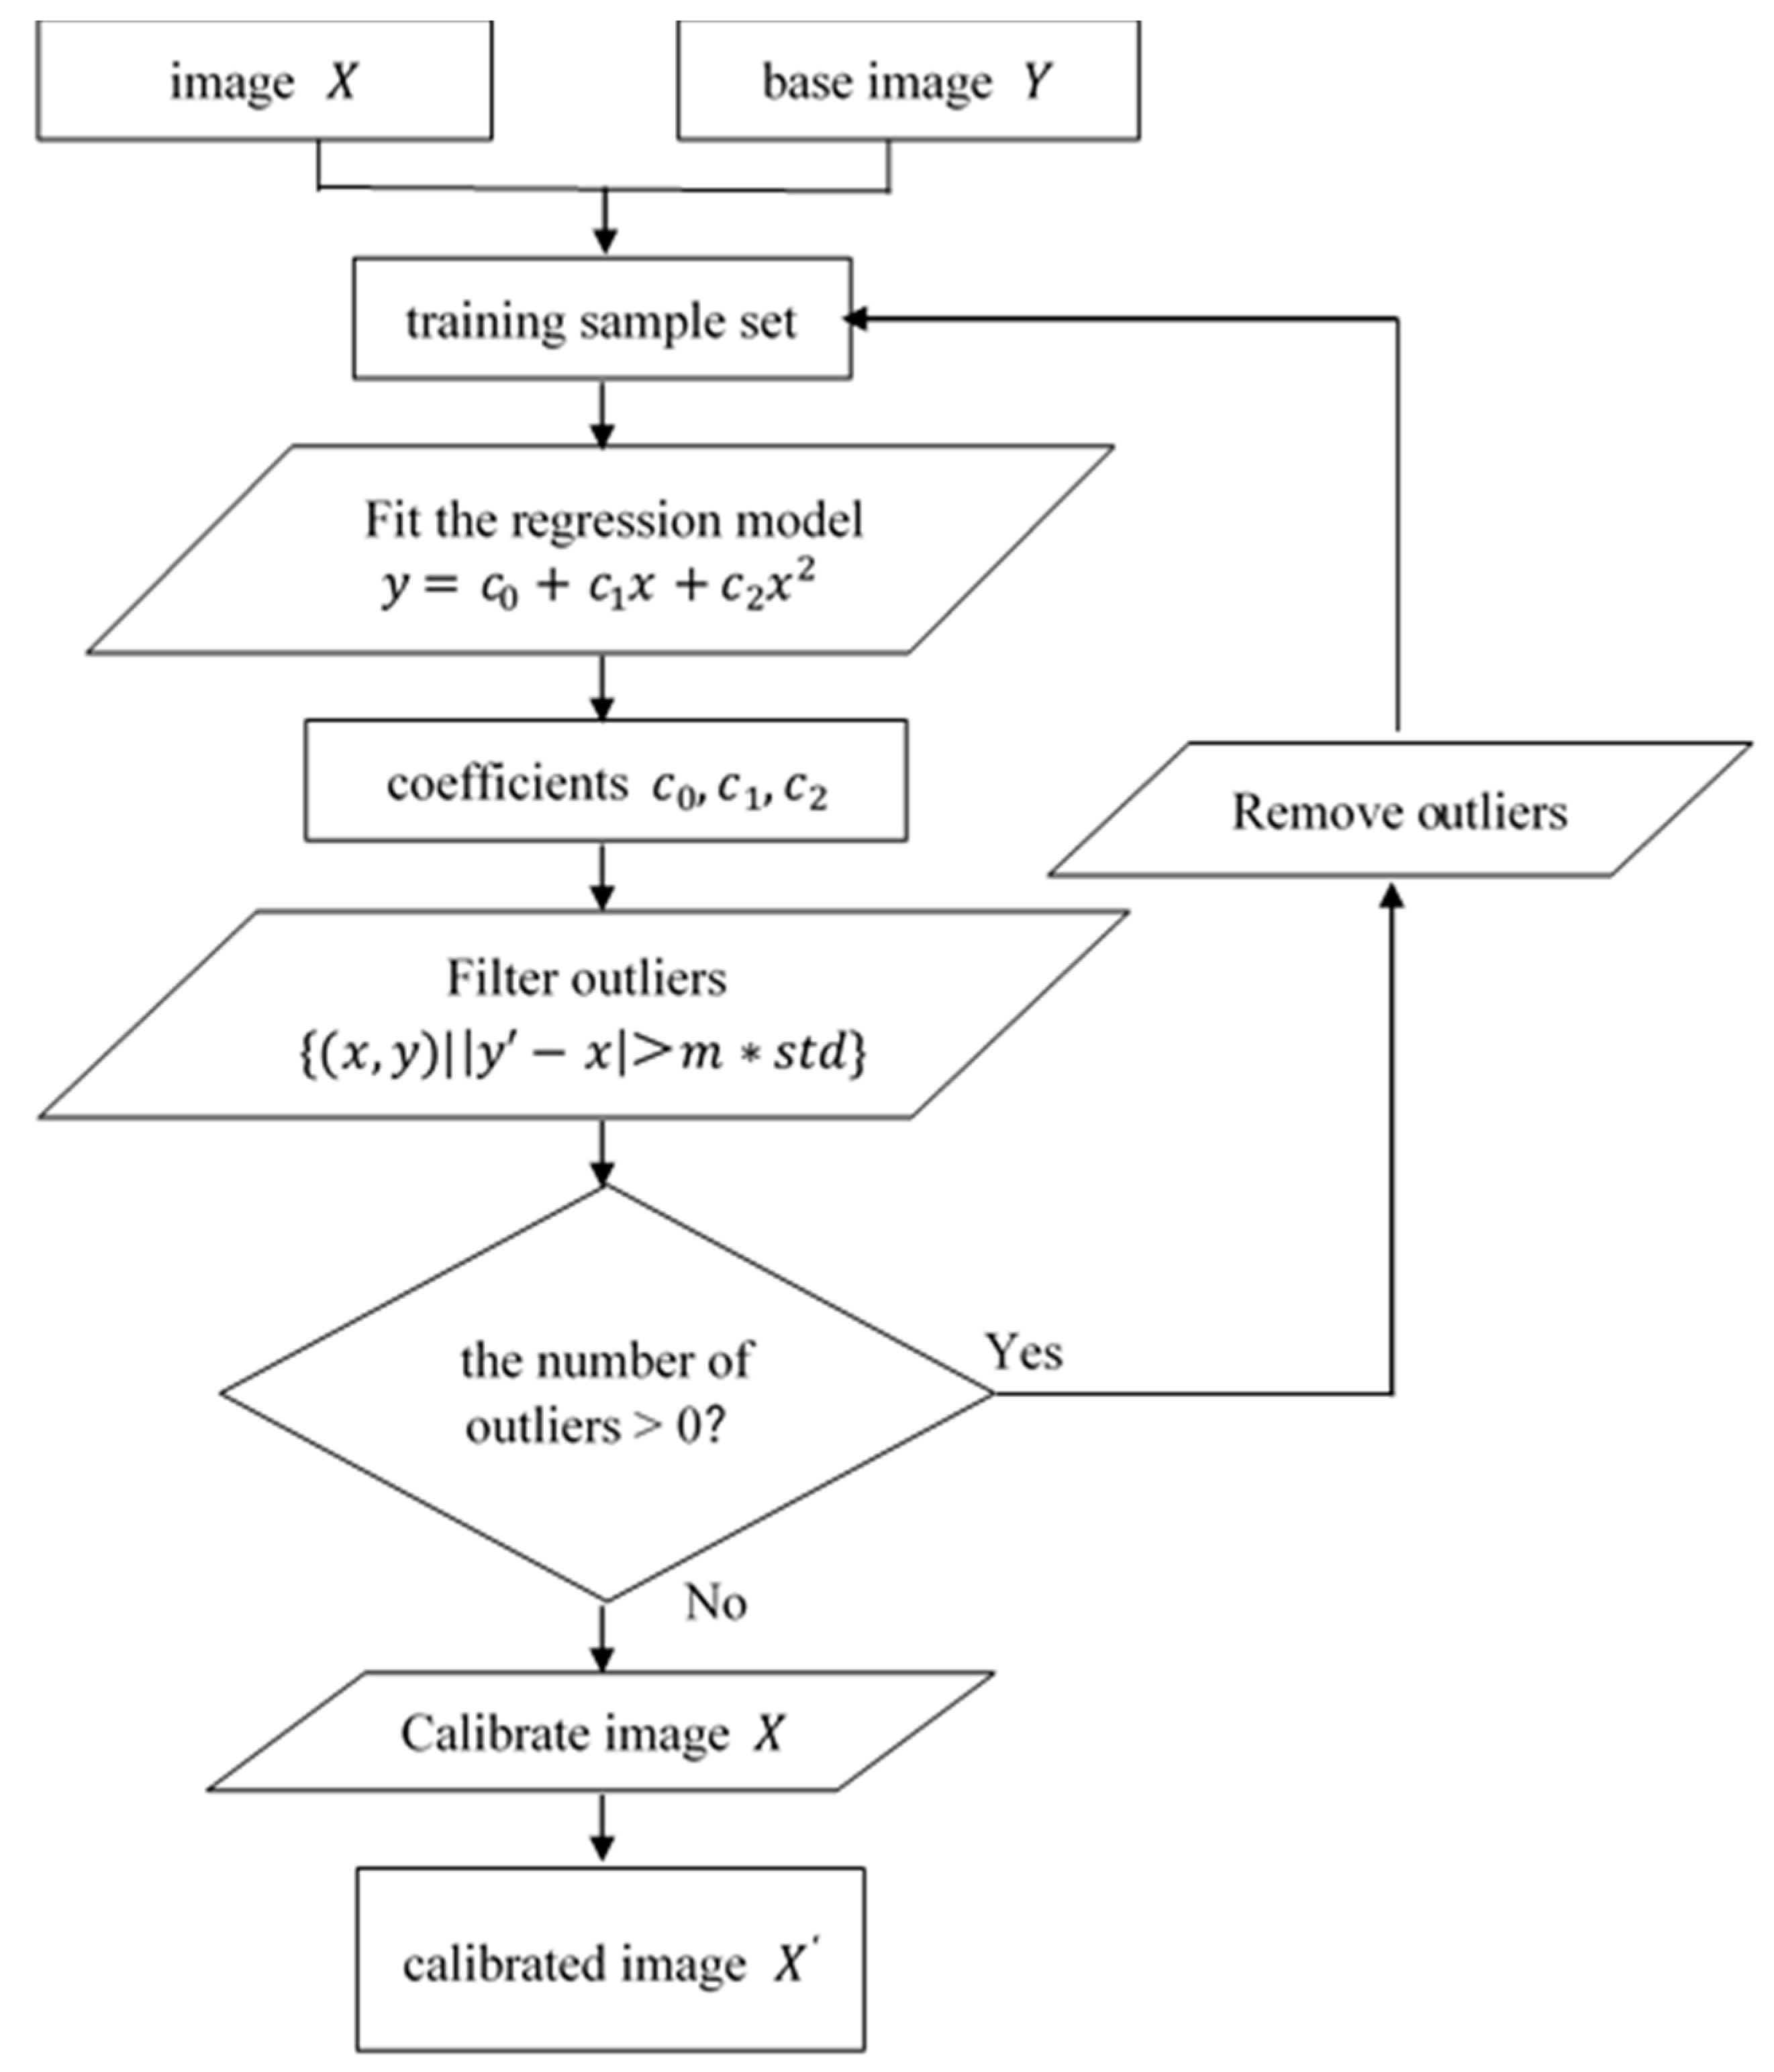
3.1. Calibrating DMSP Annual Composites

As DMSP NTL have no on-board calibration, pixel values captured by different sensors in different years should be calibrated to make them comparable. Generally, methods of calibrating DMSP annual composites rely on empirical knowledge [24] or reference data such as high resolution images [10] to choose stable light samples in certain areas. However, the calibration algorithm proposed by Li et al. [25] takes an iterative regression process to select reasonable pixel samples automatically and learns the calibration model without much prior knowledge of stable pixel sampling. This algorithm assumes that there are sufficient stable light pixels in images. As Beijing is large in area and followed an urban sprawl pattern to some degree in the last decades, this algorithm should be applicable to it. Therefore, in this section, the algorithm was applied to calibrating DMSP annual composites in Beijing in the years from 1992 to 2013 with an adaption of the regression model.
The procedure of the calibration of DMSP annual composites is shown in Figure 3. To calibrate an image X according to a base image Y , a regression model between their pixel values x and y was fitted on the training sample set. Instead of using a predefined training sample set by subjective choice, this method employed various sample sets by filtering outliers in the original ones recursively. At the start, all pixels in the research area were used as training samples. After getting the coefficients of the regression model, outliers in the training sample were filtered by calculating the difference between predicted pixel value y and real value x . If the difference is more than a threshold m * s t d where s t d is the standard difference of all training samples and m is an adjustable parameter, the corresponding pixel will be regarded as an outlier and removed from the training sample set. If the number of outliers in iteration is larger than zero and a new training sample set is created after outlier removal, a new regression model will be fitted. This iterative procedure will continue until there are no more outliers in the training sample set. Then, the coefficients of the regression model were employed to calibrate image X and a calibrated image X is produced.
This study used DMSP annual composite in the middle year 2003 as the base image to calibrate other composites in the years from 1992 to 2013. For years with NTL captured by more than one sensor, the NTL with the maximum observation counts in the research area were used to calibrate for that year. A quadratic polynomial regression model was employed in this study rather than a linear one in Li et al. [25], and the value of parameter m was set to 2.5 as in Li et al. [25].

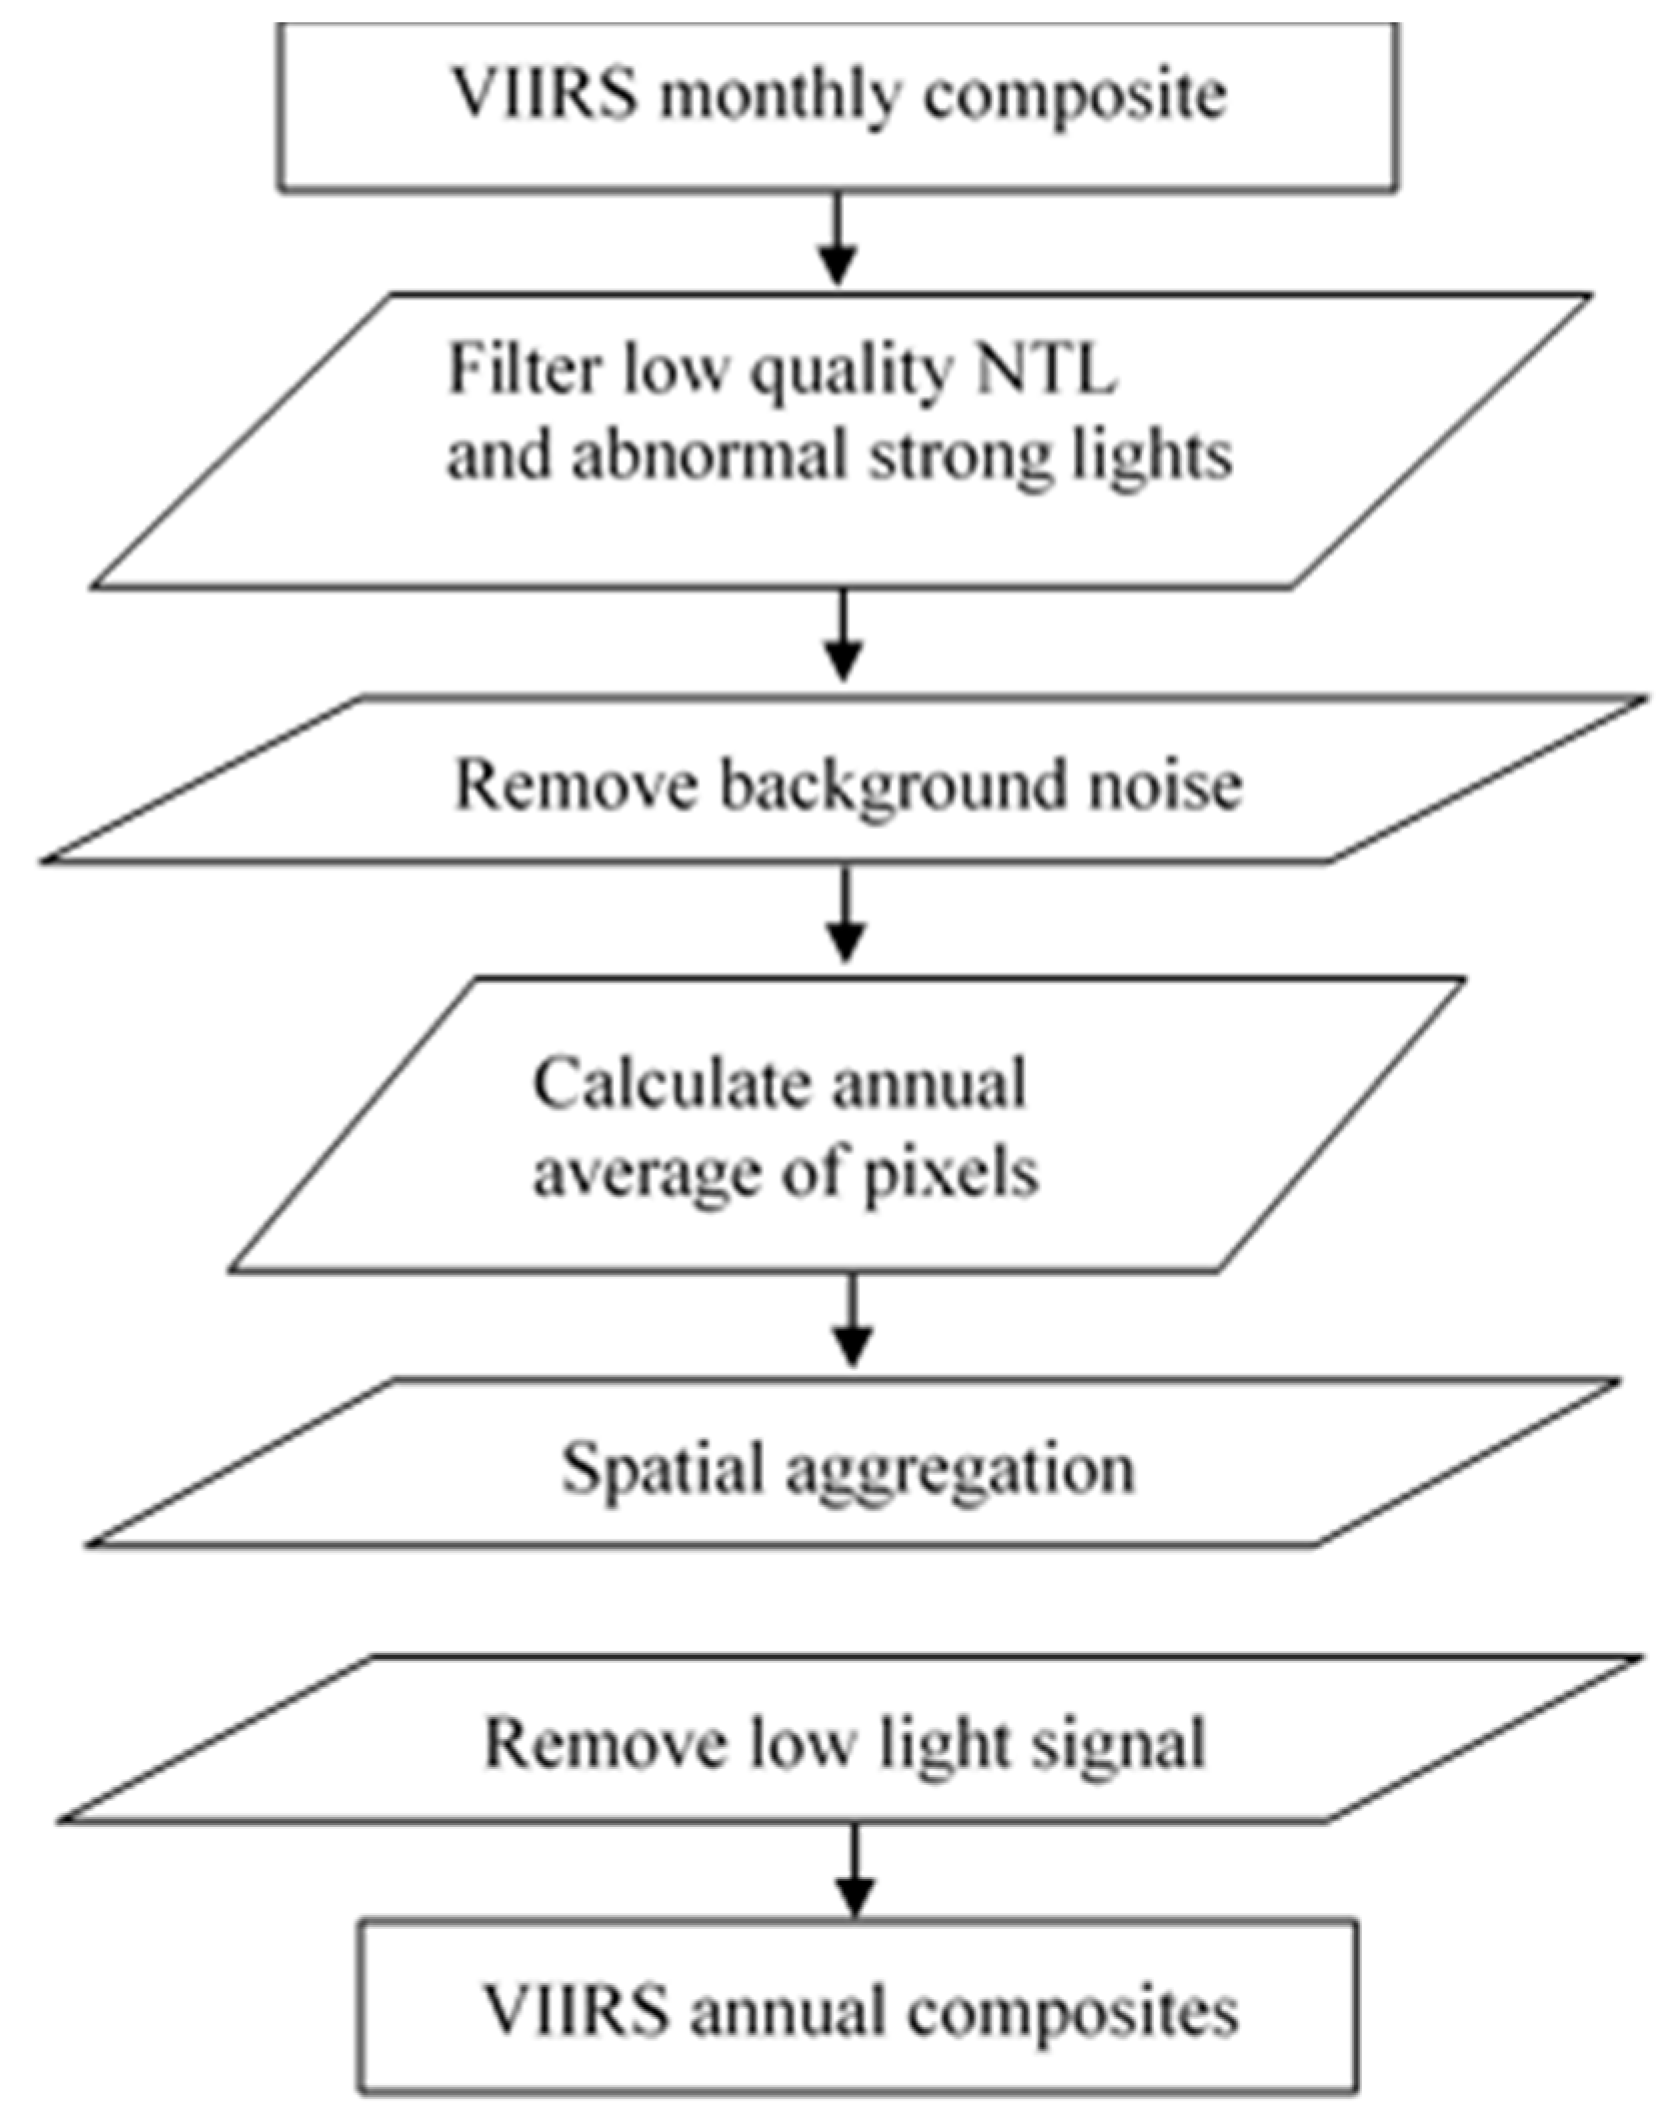
3.2. Producing VIIRS Annual Composites

As Figure 4 shows, there are five steps to produce VIIRS annual composites for DMSP annual composites simulation with VIIRS monthly composites. To begin with, VIIRS monthly composites with maximum observation counts below ten were assumed of low quality and discarded. Then, in order to determine a threshold for abnormal strong light removal, the maximum values of Shanghai, the most prosperous city in China, was referred to. Among the maximum values of VIIRS monthly composites in 2012–2018, eight numbers (up to 7980.05) were much higher than other normal values. After discarding those numbers, the maximum of other monthly maximum values was 435.28, which was close to the maximum of the monthly maximum values of Beijing 472.86. Therefore, 472.86 was set as the threshold of abnormal strong lights, and all pixel values of VIIRS monthly composites of Beijing no larger than 472.86 were regarded as normal lights. Besides, as pixel values of VIIRS monthly composites might be affected by temporal lights such as an aurora, background noise were removed in the second step. Specifically, pixel values lower than 0.5 [26] were regarded as background noise and set to zero.
Next, basing on the monthly averaged pixel values and monthly cloud-free observation counts, annual average of pixels could be calculated. Among others, in order to simulate DMSP annual composites in the next section, VIIRS annual composites were aggregated to the spatial resolution of DMSP NTL, that is, 0.008333°, and low light signal out of the detecting range of DMSP/OLS sensors was subtracted from VIIRS annual composites. The subtraction threshold was set to 0.3 nWcm 2 sr 1 and negative pixel values after the subtraction were assigned to zero [20].

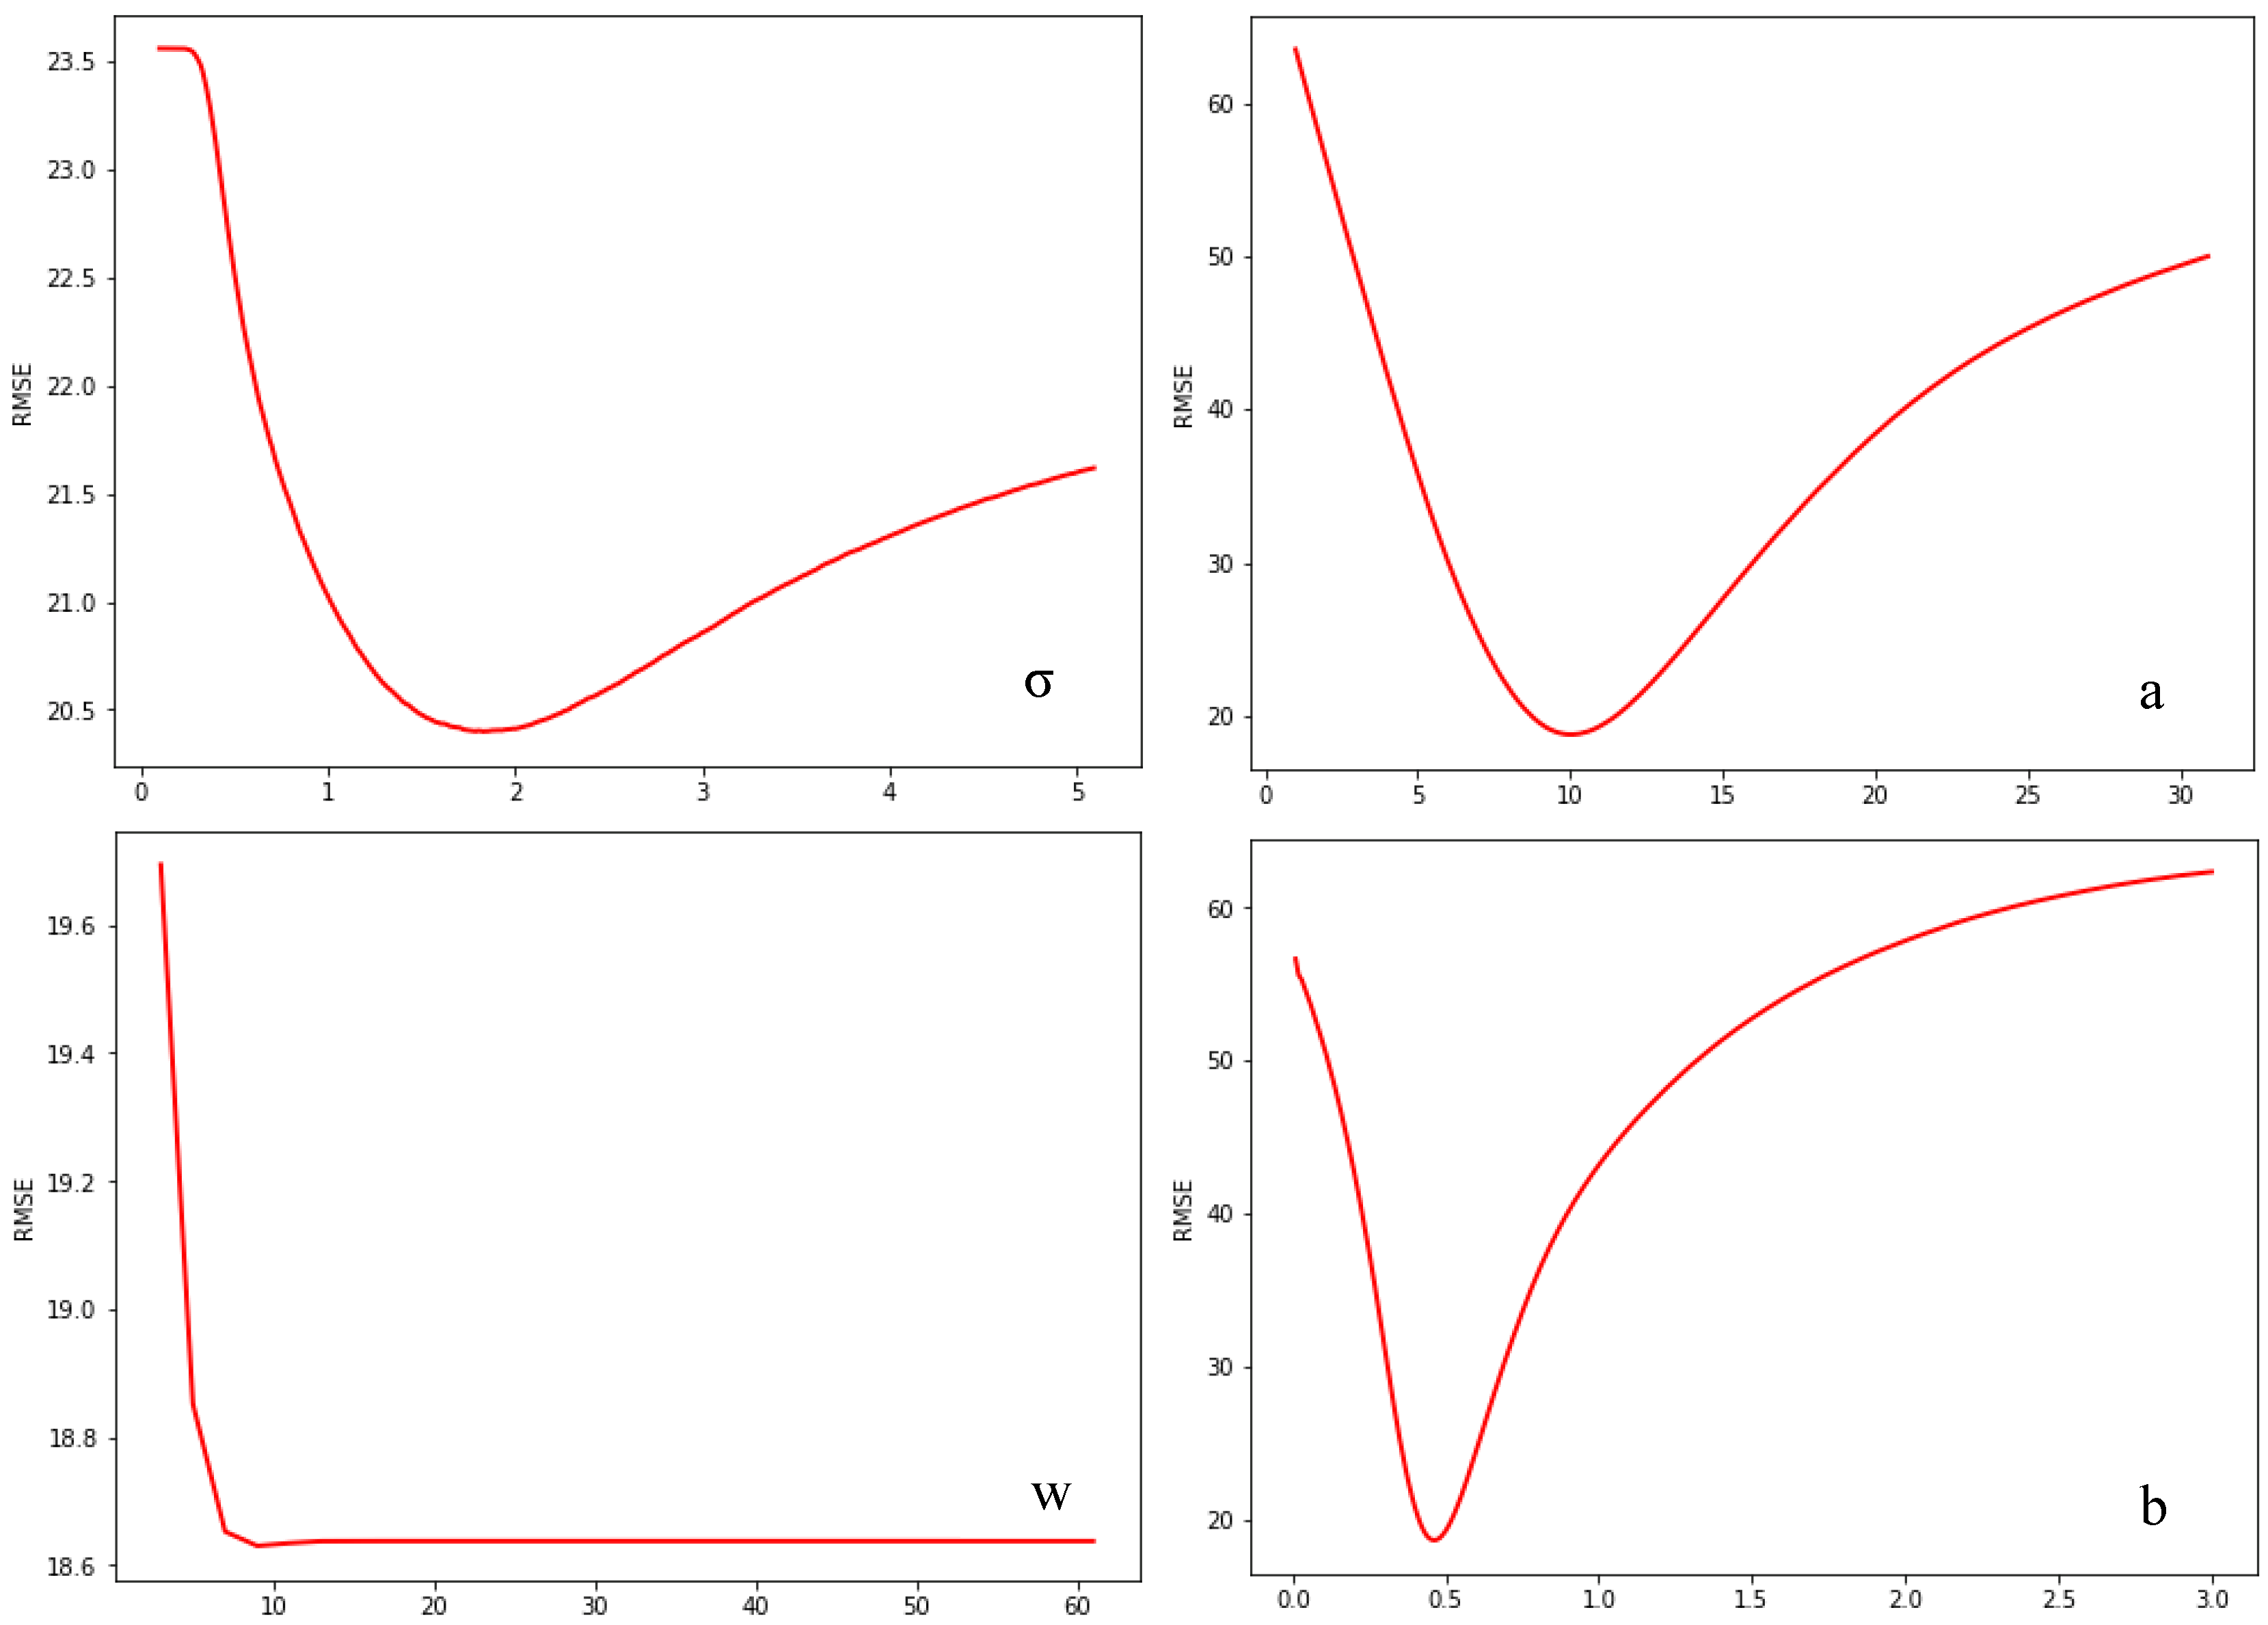
3.3. Simulating DMSP with VIIRS Annual Composites

The simulation of DMSP NTL with VIIRS annual composites refers to the method proposed by Li et al. [20]. This method combines a power function and a Gaussian low pass filter to implement the transformation from VIIRS NTL to DMSP NTL. Initially, a power function was employed to mapping the nonlinear relationship of pixel values between DMSP and VIIRS NTL. Then, a Gaussian low pass filter was applied to approximate the spatial degradation from VIIRS to DMSP NTL. Finally, a threshold was used to constrain the value range of simulated DMSP NTL.
To be more specific, for a VIIRS annual composite X , denote the value of the pixel on the i -th row and the j-th column as x i j . Firstly, X was processed according to Equation (1) and a new NTL X was produced. Then, a convolution operator with window size w using a 2-D Gaussian kernel (Equation (2)) with a standard deviation σ was performed on X , producing X . Lastly, for the pixel on the i -th row and the j-th column of X , value x i j was corrected to x i j according to Equation (3) and a threshold s , producing simulated NTL X .
X : x i j = a x i j b ,
G ( x , y ) = 1 2 π σ 2 e ( x 2 +   y 2 ) 2 σ 2 ,
X :   x i j = { s i f   x i j > s x i j o t h e r w i s e .
In this study, s was set to 50, as in Li et al. [20]. However, to determine optimal values for other adjustable parameters, i.e., a , b , σ and w , a stepwise sensitive analysis was carried out. In the initial stage, a , b and w were assigned values 11.7319, 0.4436 and 13, respectively, as in Li et al. [20] for good performance in evaluating urban dynamics of Syria, the optimal value for σ was determined by testing different values from 0.1 to 5.1 with an increment of 0.01, and the value yielding the minimum RMSE (Equation (4)) between the original and the simulated DMSP NTL in 2012 and 2013 was chosen. After that, the optimal value for a was determined by testing values from 1.0 to 30 with an increment of 0.1, with σ assigned the optimal value obtained in the last step, and b and w assigned the values in Li et al. [20]. Then, in the next step, the optimal value for b was found similarly by testing values from 0.01 to 3.0 with an increment of 0.01, with σ and a assigned the optimal values obtained in previous steps, and w assigned the values in Li et al. [20]. Finally, the optimal value for w was determined by testing values from 3 to 60 with an increment of 2, with a , b and σ assigned the optimal value obtained in previous steps.
R M S E = 1 n k = 1 n ( x k x k ) 2 ,
where x k and x k denote the values of the k-th pixel in the original VIIRS and the simulated DMSP NTL, and n is the number of pixels in a simulated DMSP annual composite.

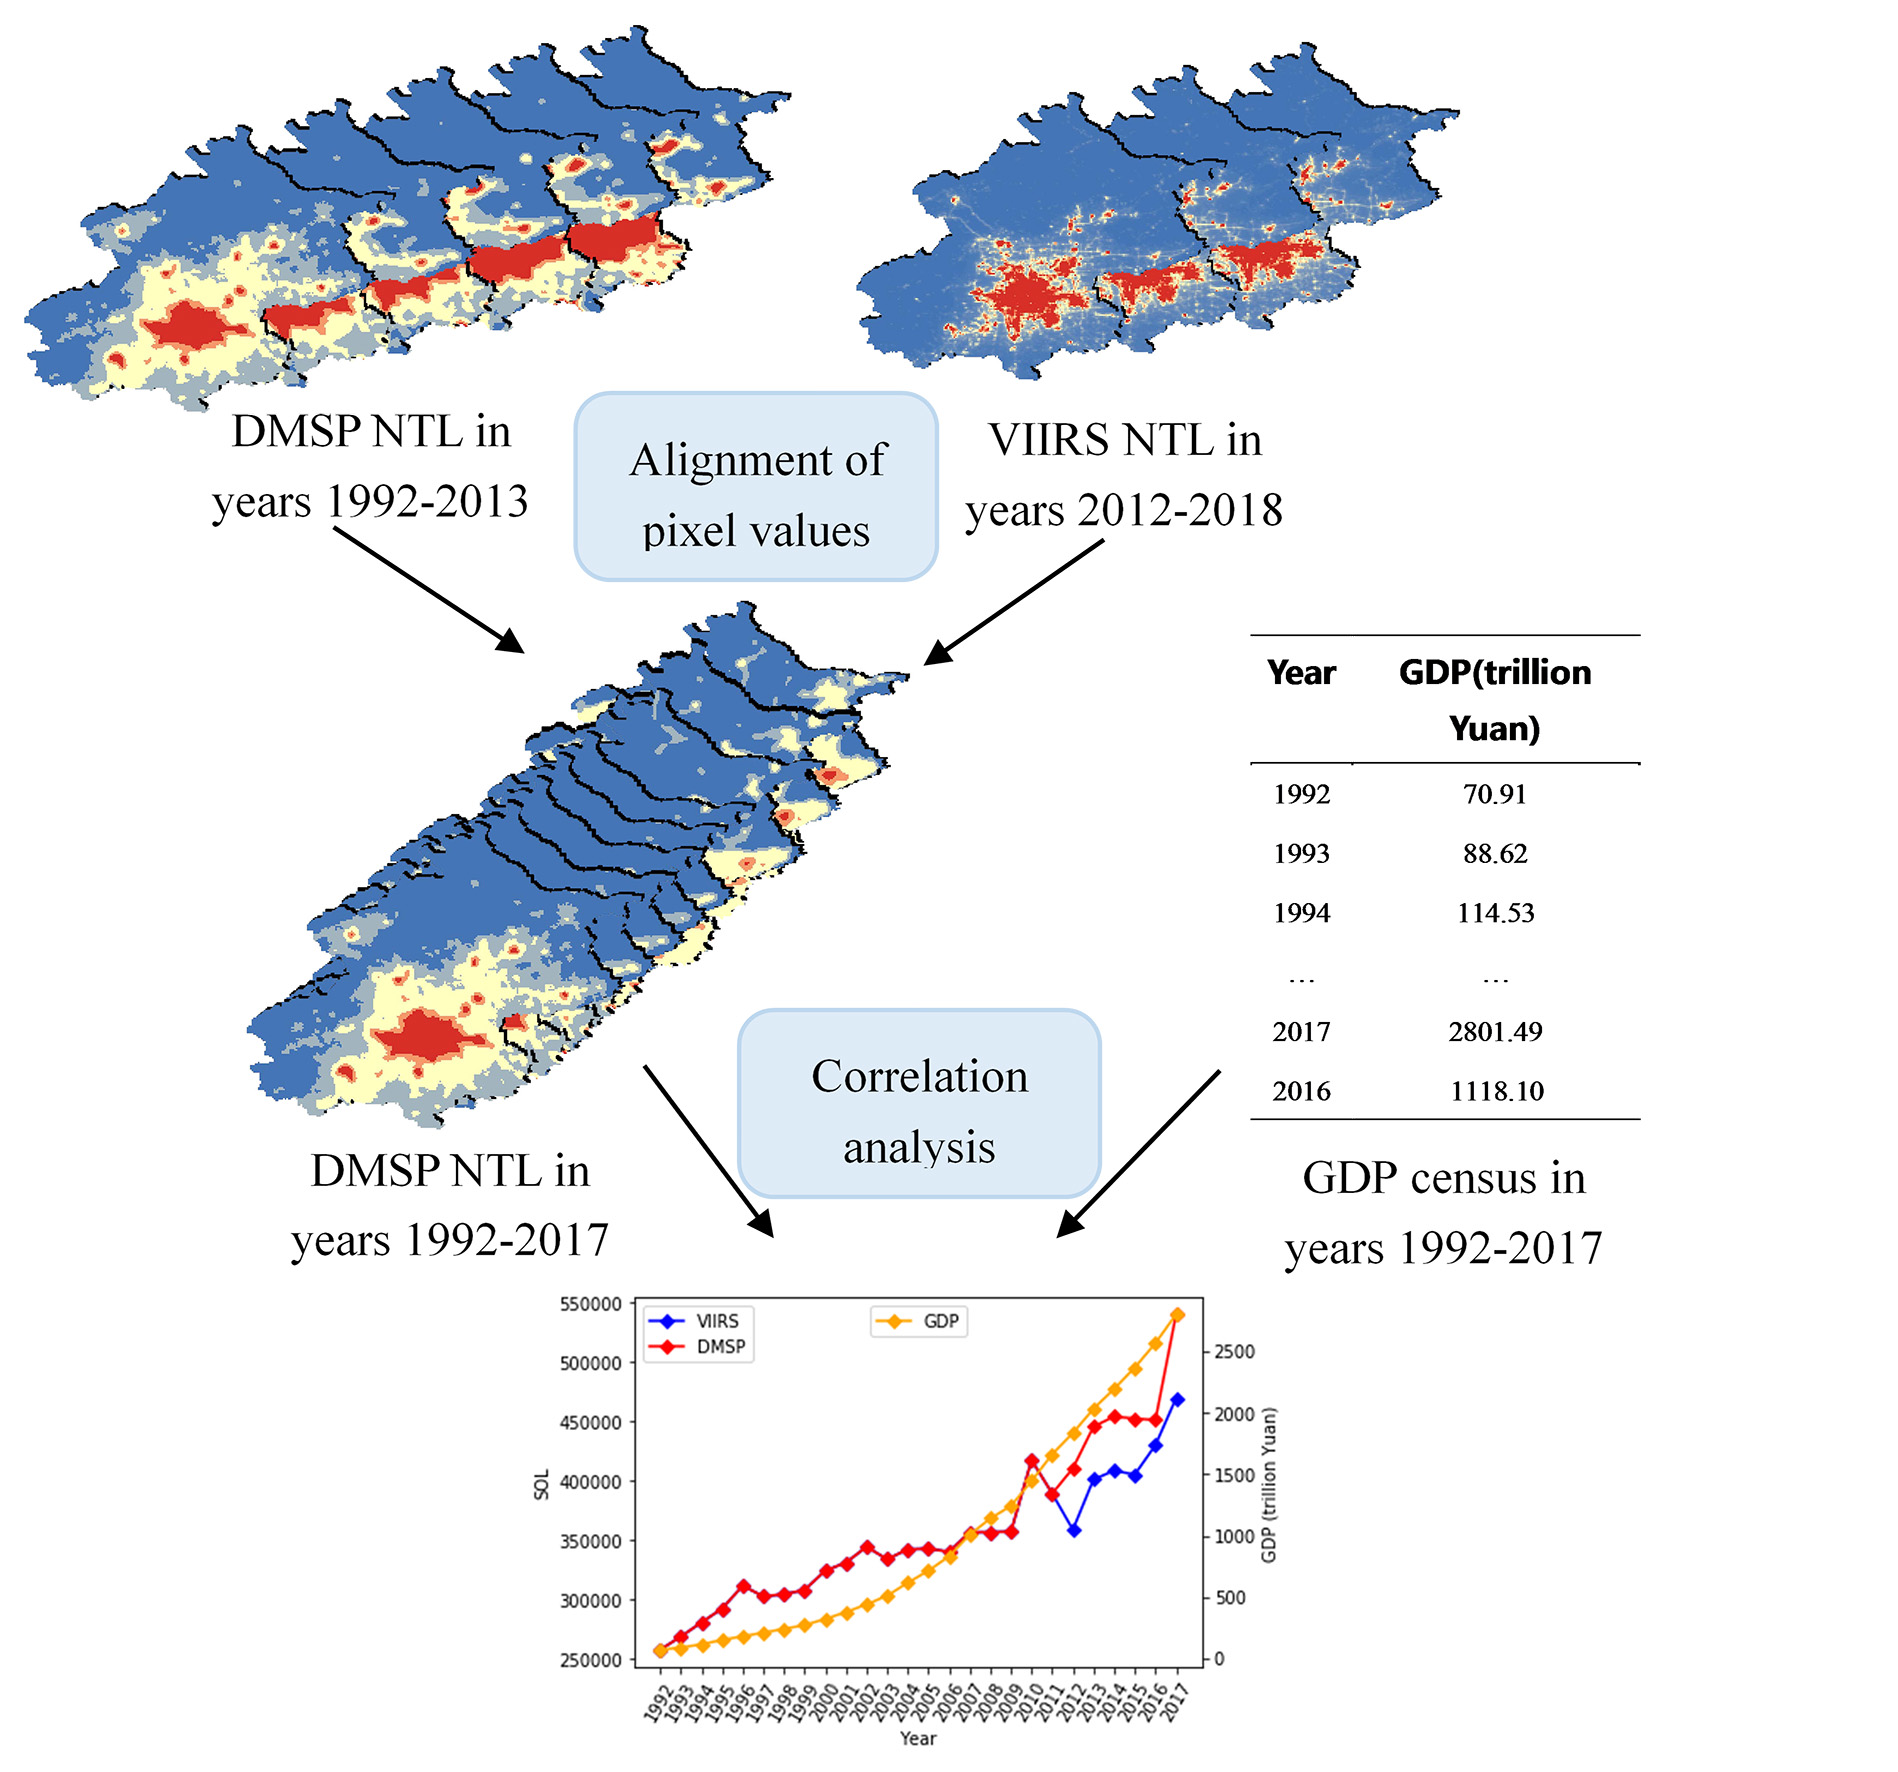
3.4. Evaluation of Consistency in Pixel Values and Correlation Between NTL and GDP

The calibration results of DMSP annual composites in 1992–2013 were assessed with a score s (Equations (5) and (6)).
x k _ c a l i b = c 0 + c 1 x k + c 2 x k 2 ,
s = 1 k = 1 n ( x k _ c a l i b x k ) 2 k = 1 n ( x k x ¯ ) 2 ,
where x k denotes the value of the k-th pixel in the final training set of the original DMSP, x k _ c a l i b denotes the corresponding calibrated DMSP NTL and x ¯ denote the average of pixels in the original DMSP NTL.
To evaluate the performance of simulating DMSP annual composites with VIIRS annual composites, RMSE (Equation (4)) and Pearson correlation coefficient r (Equation (7)) were calculated for NTL in the overlapped years 2012 and 2013.
r = k = 1 n ( x k x ¯ ) ( x k x ¯ ) k = 1 n ( x k x ¯ ) 2 k = 1 n ( x k x ¯ ) 2
where x ¯ and x ¯ denote the average of pixels in the original VIIRS and the simulated DMSP NTL, and x k , x k and n have the same meaning in Equation (4).
Besides, to confirm the effectiveness of simulating DMSP annual composites with VIIRS annual composites in combining NTL with socio-economic statistics, Pearson correlation coefficients between SOL of NTL and local GDP in Beijing was computed on the city level in 1992–2017 and on the administrative division level in 2005–2017. The first computation involved city-level GDP in Beijing in 1992–2017, DMSP annual composites in 1992–2011 and VIIRS annual composites in 2012–2017, while the second computation involved the same GDP statistics, DMSP annual composites in 1992–2011 and simulated DMSP annual composites in 2012–2017. The third computation involved district-level GDP of Beijing in 2005–2017, DMSP annual composites in 2005–2011 and VIIRS annual composites in 2012–2017, while the fourth computation involved the same GDP statistics, DMSP annual composites in 2005–2011 and simulated DMSP annual composites in 2012–2017.

4. Results

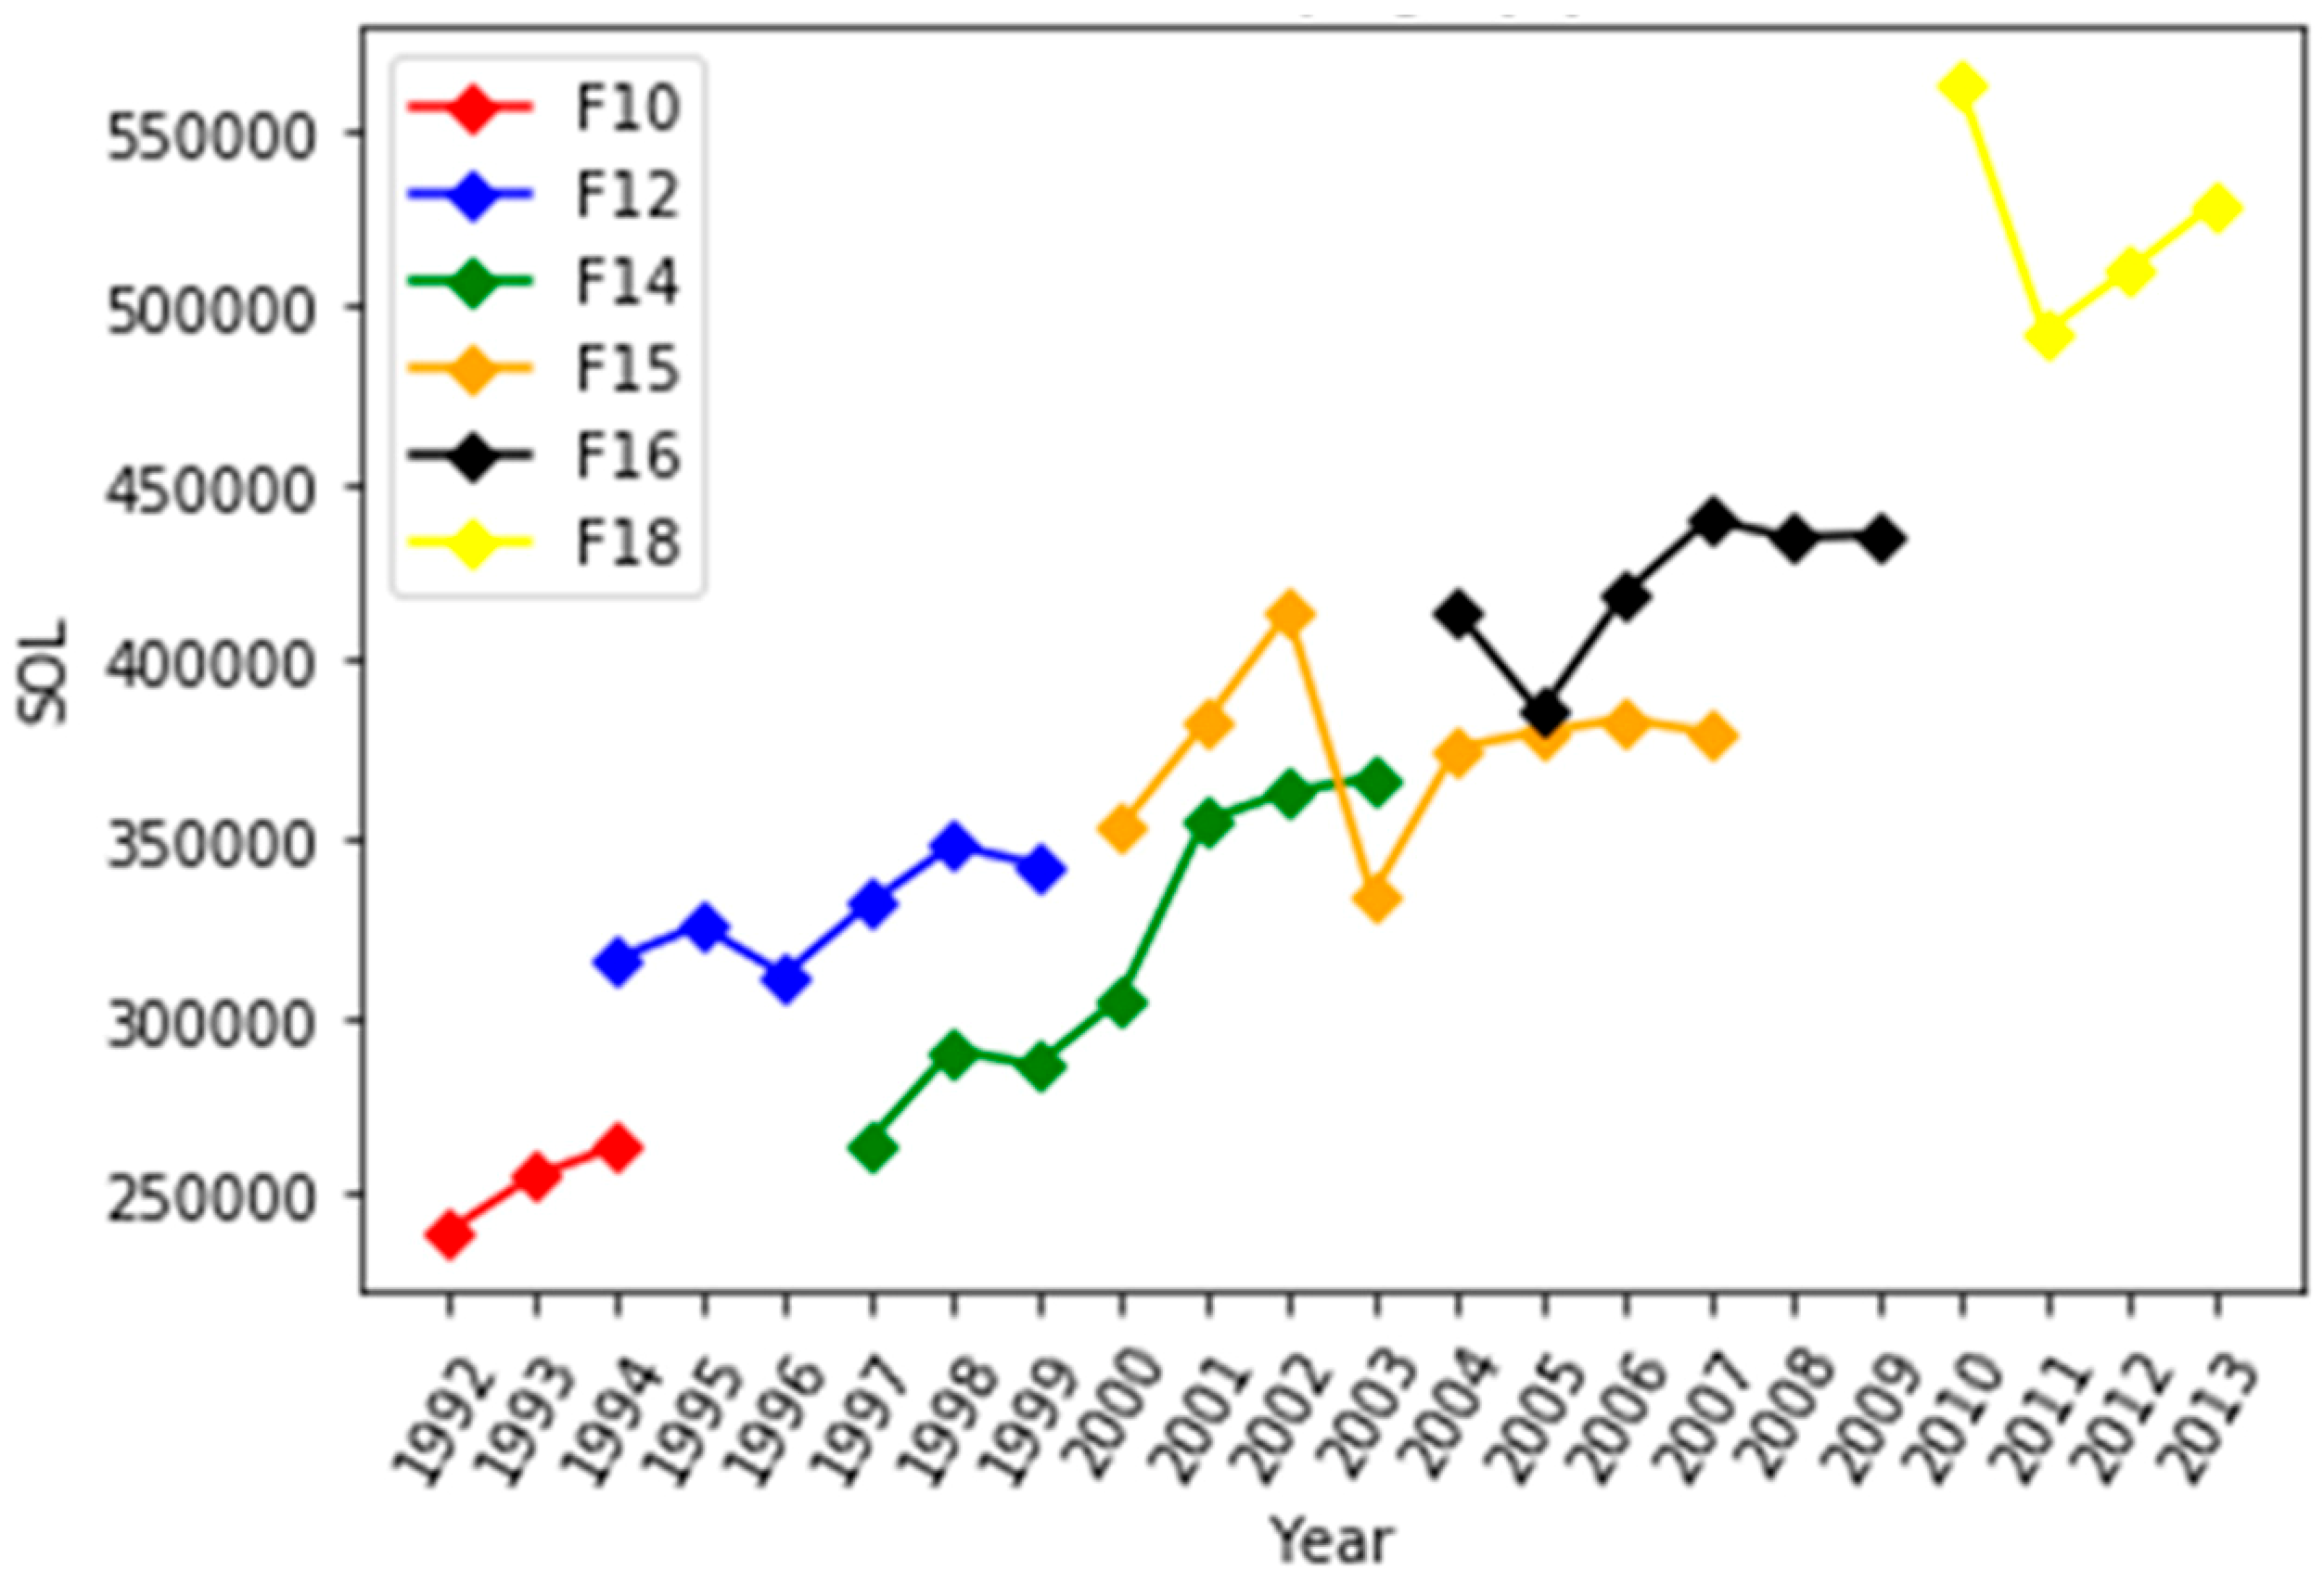
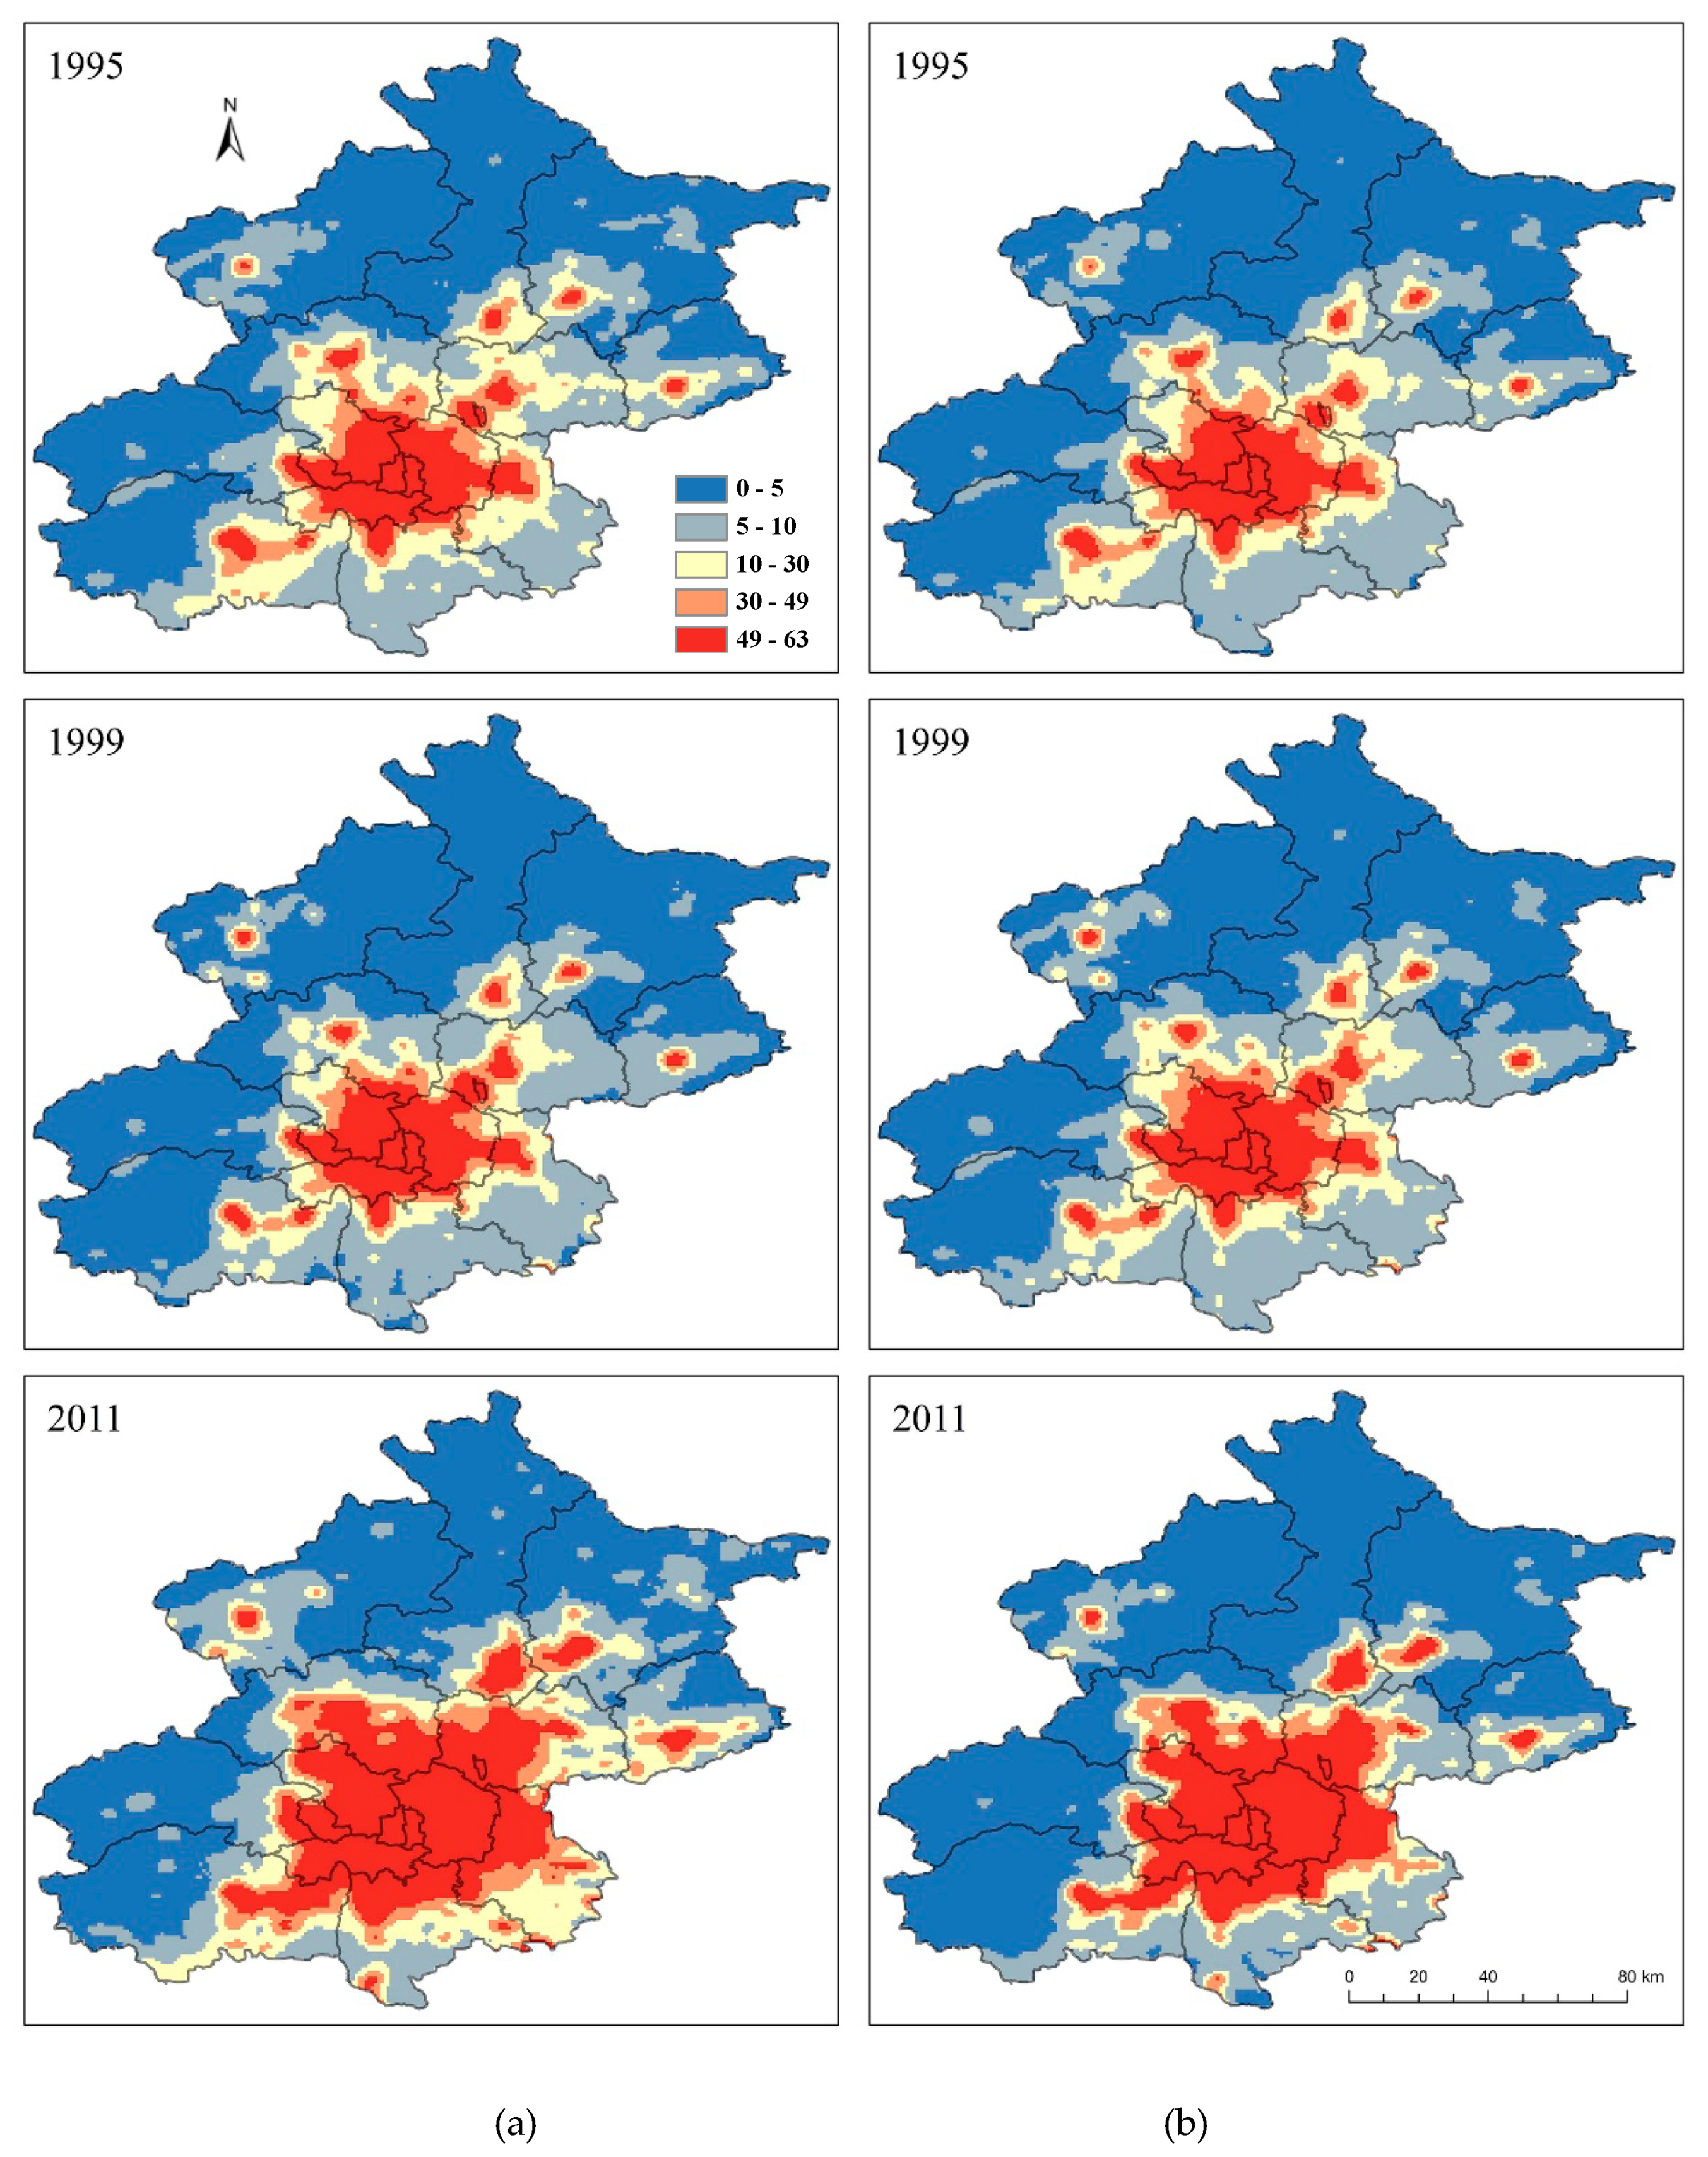
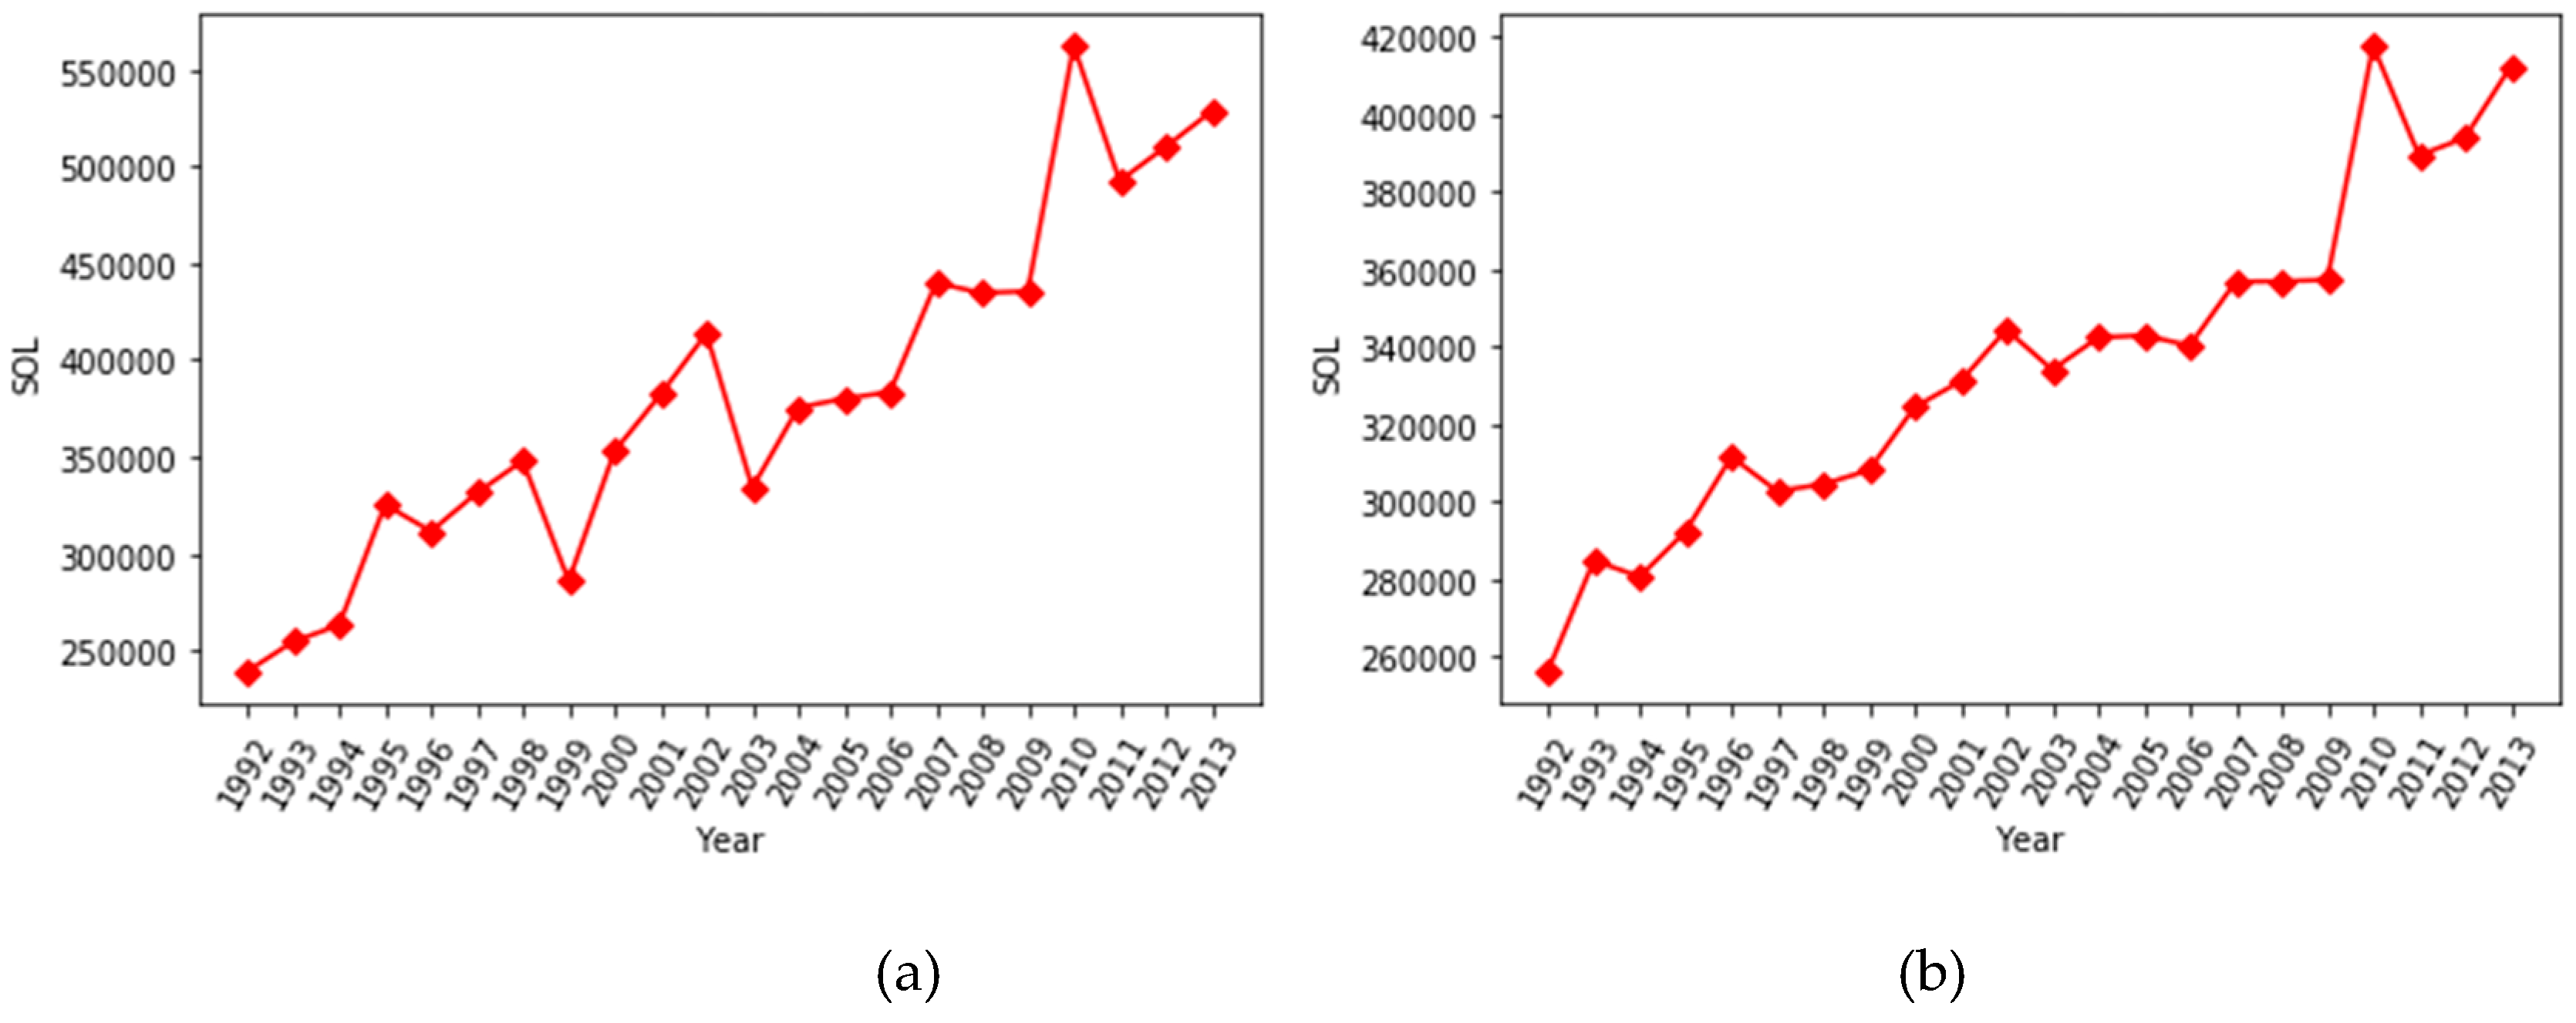
4.1. Intercalibration of DMSP Annual Composites

Figure 5 shows the SOL of DMSP annual composites captured by different sensors in Beijing from 1992 to 2013. For years with more than one NTL from multiple sensors, such as 1994 and 1997–2007, the differences among their SOL in one year varied unsteadily. For a continuous temporal sequence, such as 2001–2003 and 2004–2007, the tendency of SOL from different sensors was also different. Although in general, the SOL in Beijing were increasing in years 1992–2013, intercalibration of DMSP annual composites is needed to improve the continuity and consistency of those values.
According to the maximum observation counts, the DMSP annual composites used in calibration for 1992–2013 are listed in Table 2. The fitting coefficients and scores of regression models are also presented in Table 2. As DMSP NTL in 2003 was the base image for calibrating DMSP NTL in other years between 1992 and 2013, there were no coefficients or score for it. For other calibrated DMSP NTL in 1992–2013, the scores were all above 0.970, which demonstrated the good performance of the method applied to calibrating DMSP annual composites. A visual comparison of DMSP annual composites in Beijing before and after calibration is drawn in Figure 6. Due to the limitation of space, pictures of DMSP NTL in 1995, 1999 and 2011 are presented for illustration, while all the calibrated DMSP NTL in 1992–2013 can be found in the Supplementary Materials. As Figure 6 shows, consistency of DMSP NTL in different years was improved after calibration as the lights in the middle west part of Beijing increases gradually rather than fluctuates sharply in year 1995, 1999 and 2011, while differences between DMSP NTL before and after calibration in the same years were minor and manifest mainly in areas where pixel values are in range [5,30].
Besides visual comparison, the SOL of selected DMSP NTL in Beijing before and after the calibration is shown in Figure 7. The results show that the continuity of the SOL has also been improved after calibrating the selected DMSP NTL with the method specified in Section 3.1.

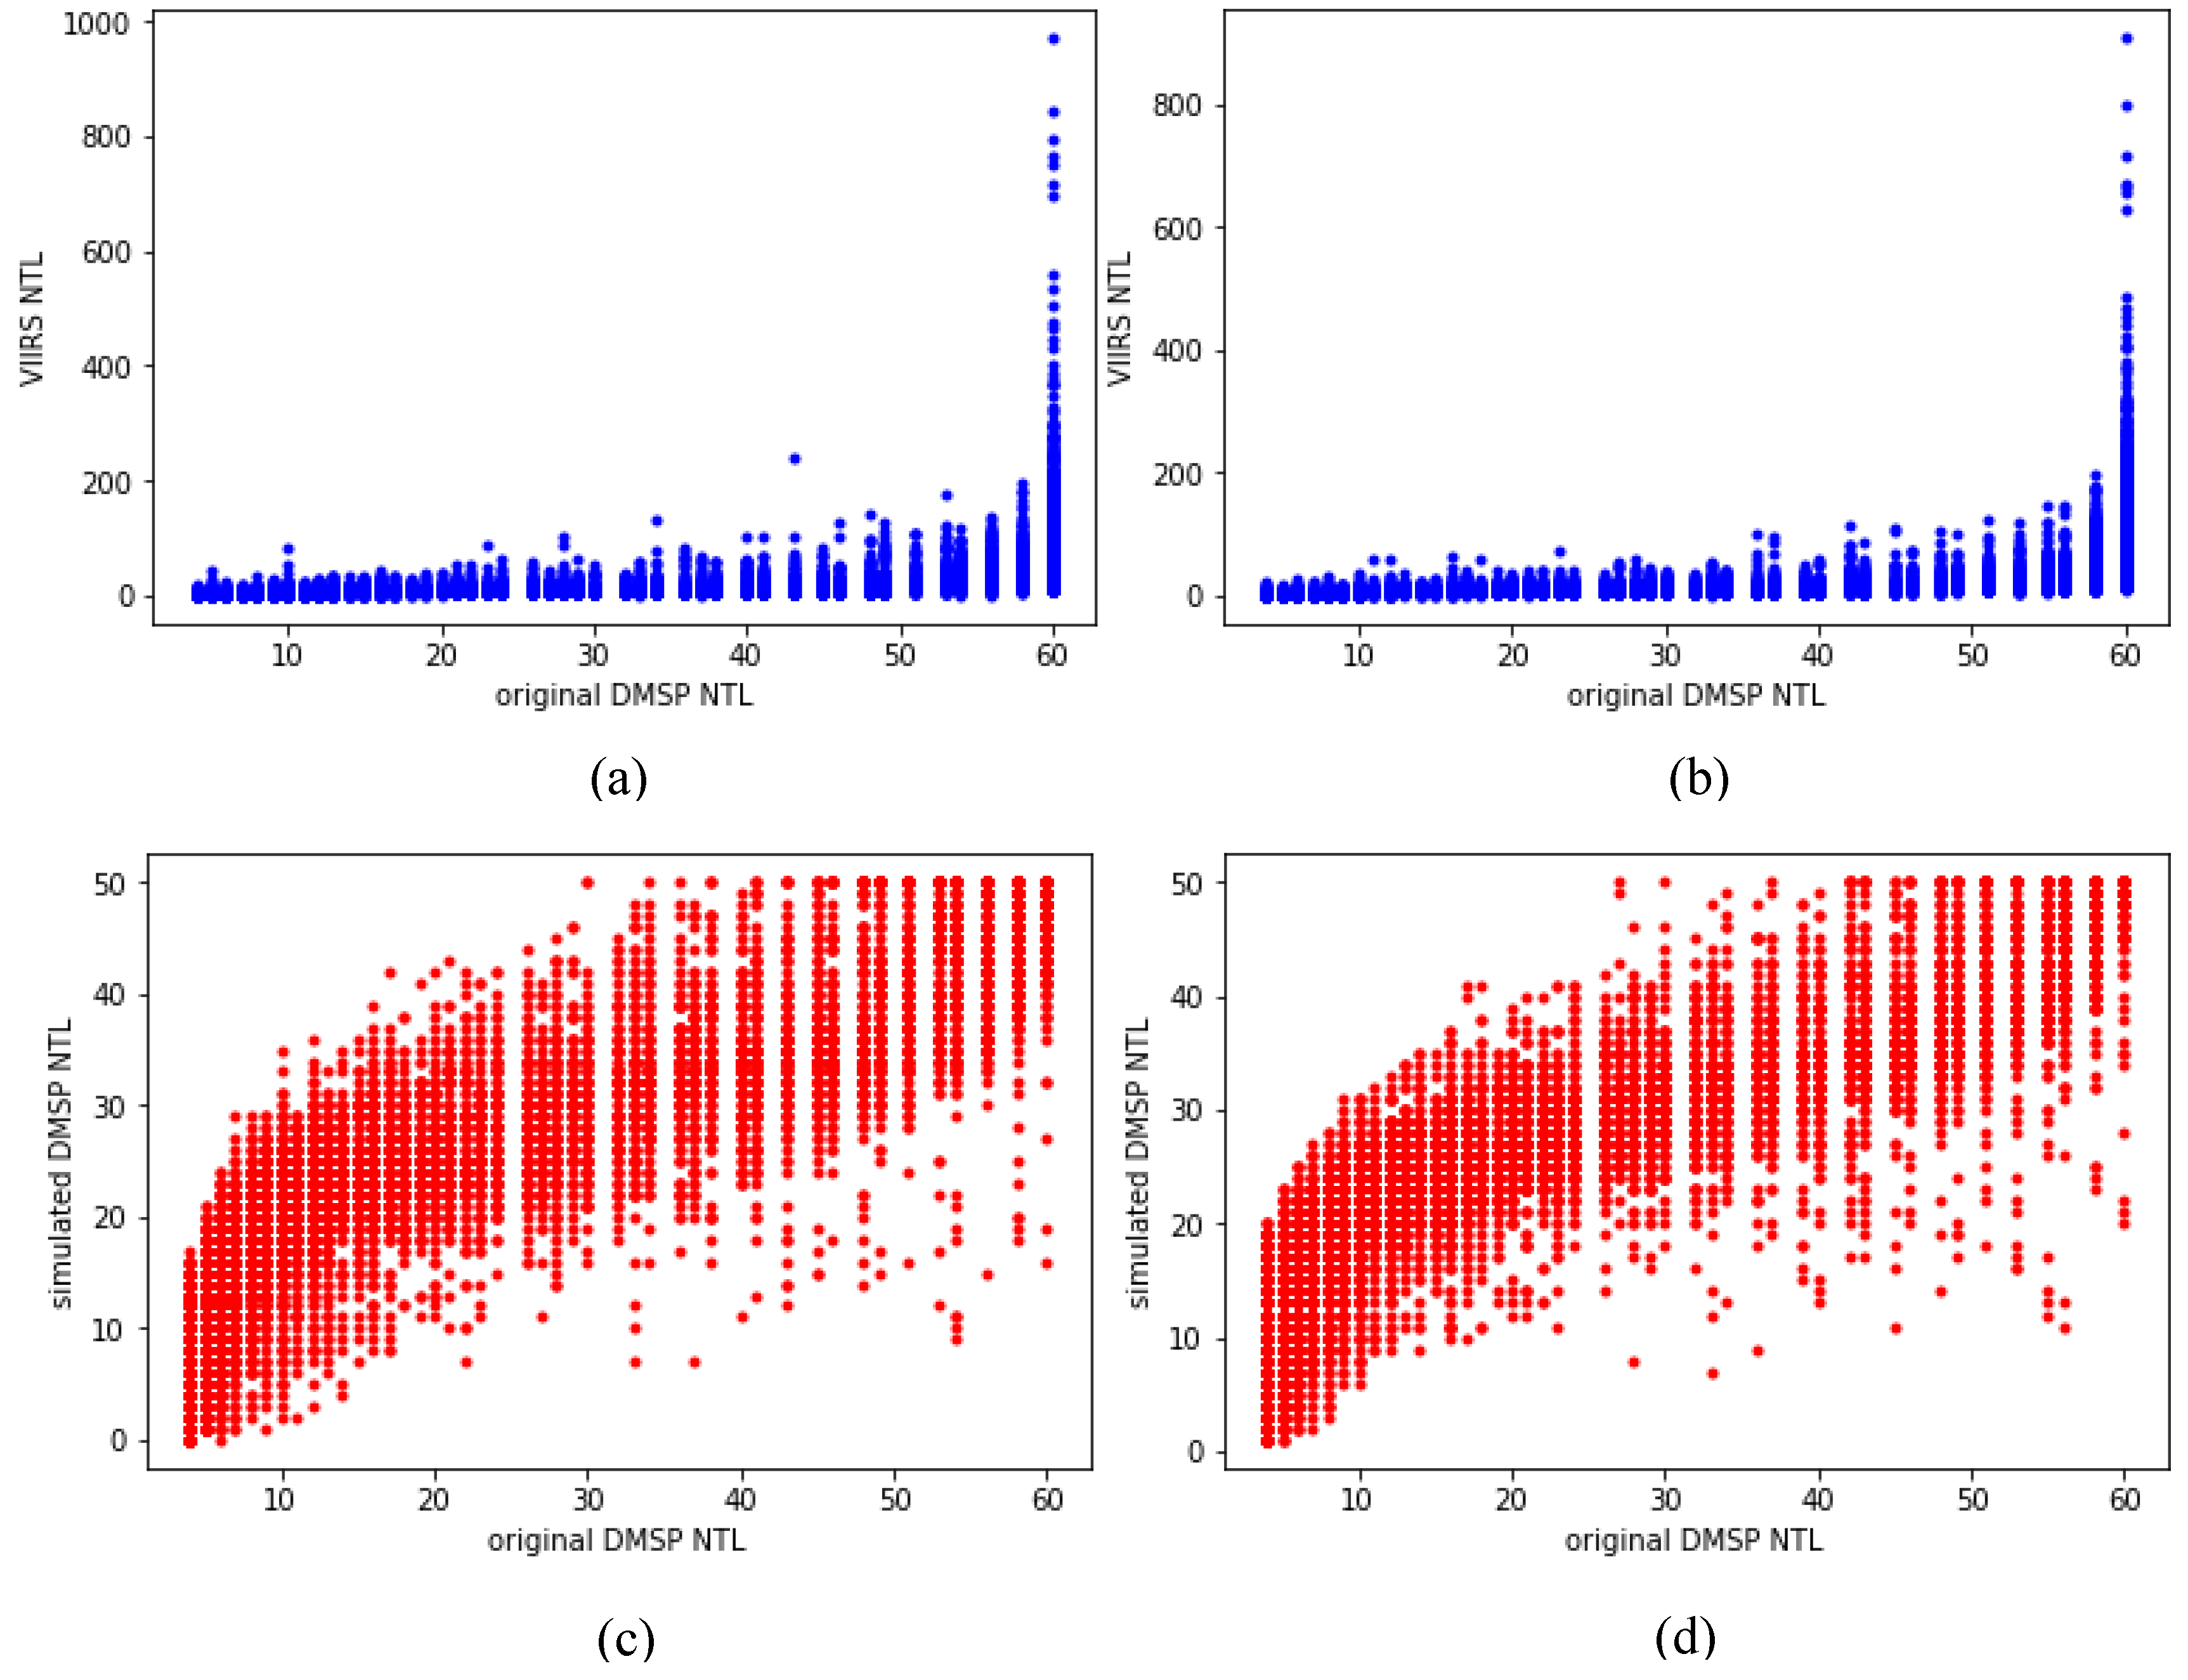
4.2. VIIRS and Simulated DMSP Annual Composites

The sensitive analysis results of determining optimal values of adjustable parameters a , b , σ and w are illustrated in Figure 8. As the minimum RMSE was reached when σ (left-top) was 1.83, a (right-top) was 10.0, w (left-bottom) was 9 and b (right-bottom) was 0.46, these values were assigned to corresponding parameters in the simulation of DMSP annual composites.
In Figure 9, the VIIRS annual composites in Beijing in 2012 and 2013 are presented in the first and the second column of the first row. In the second and the third row, the DMSP annual composites calibrated with the method illustrated in Section 3.1, and DMSP annual composites simulated with the method introduced in Section 3.3 in 2012 and 2013 are shown in the first and second column respectively. In the left bottom of Figure 9 is the simulated DMSP annual composites in 2018, while in the right bottom of Figure 9 is the VIIRS annual composites in 2018. By visual comparison, the simulated DMSP annual composites were quite different from the original VIIRS annual composites, but were similar to the calibrated DMSP annual composites. However, the simulated DMSP annual composites had a wider band of pixels in values 10–30. Combining DMSP NTL in Figure 9 with ones in Figure 6b, a slight expansion of area with intense light (pixel values no less than 49) and a considerable sprawling of area with moderate light (pixel values in 10–49) could be found. The generally increasing tendency of urban dynamics became obvious in these consecutive DMSP NTL.
Furthermore, the distribution of pixel values of VIIRS and DMSP annual composites in Beijing for the overlapped years 2012 and 2013 is illustrated in Figure 10. Figure 10a,b compares the distribution of pixel values of VIIRS and original DMSP annual composites in years 2012 and 2013 respectively, and Figure 10c,d compares the distribution of pixel values of original DMSP and simulated DMSP annual composites in the same years. The scatter plot shows that simulated DMSP annual composites were more correlated with original DMSP annual composites in pixel values than VIIRS annual composites.
In addition, as listed in Table 3, the Pearson correlation coefficients between VIIRS and original DMSP annual composites in Beijing in 2012 and 2013 were around 0.637 and 0.658, respectively, while ones between simulated DMSP and original DMSP annual composites increased to about 0.937 and 0.945, accordingly. As for RMSE, the results of VIIRS and original DMSP annual composites in Beijing in 2012 and 2013 were 34.804 and 35.526, respectively, while the results of simulated DMSP and original ones decreased to 9.244 and 9.387.

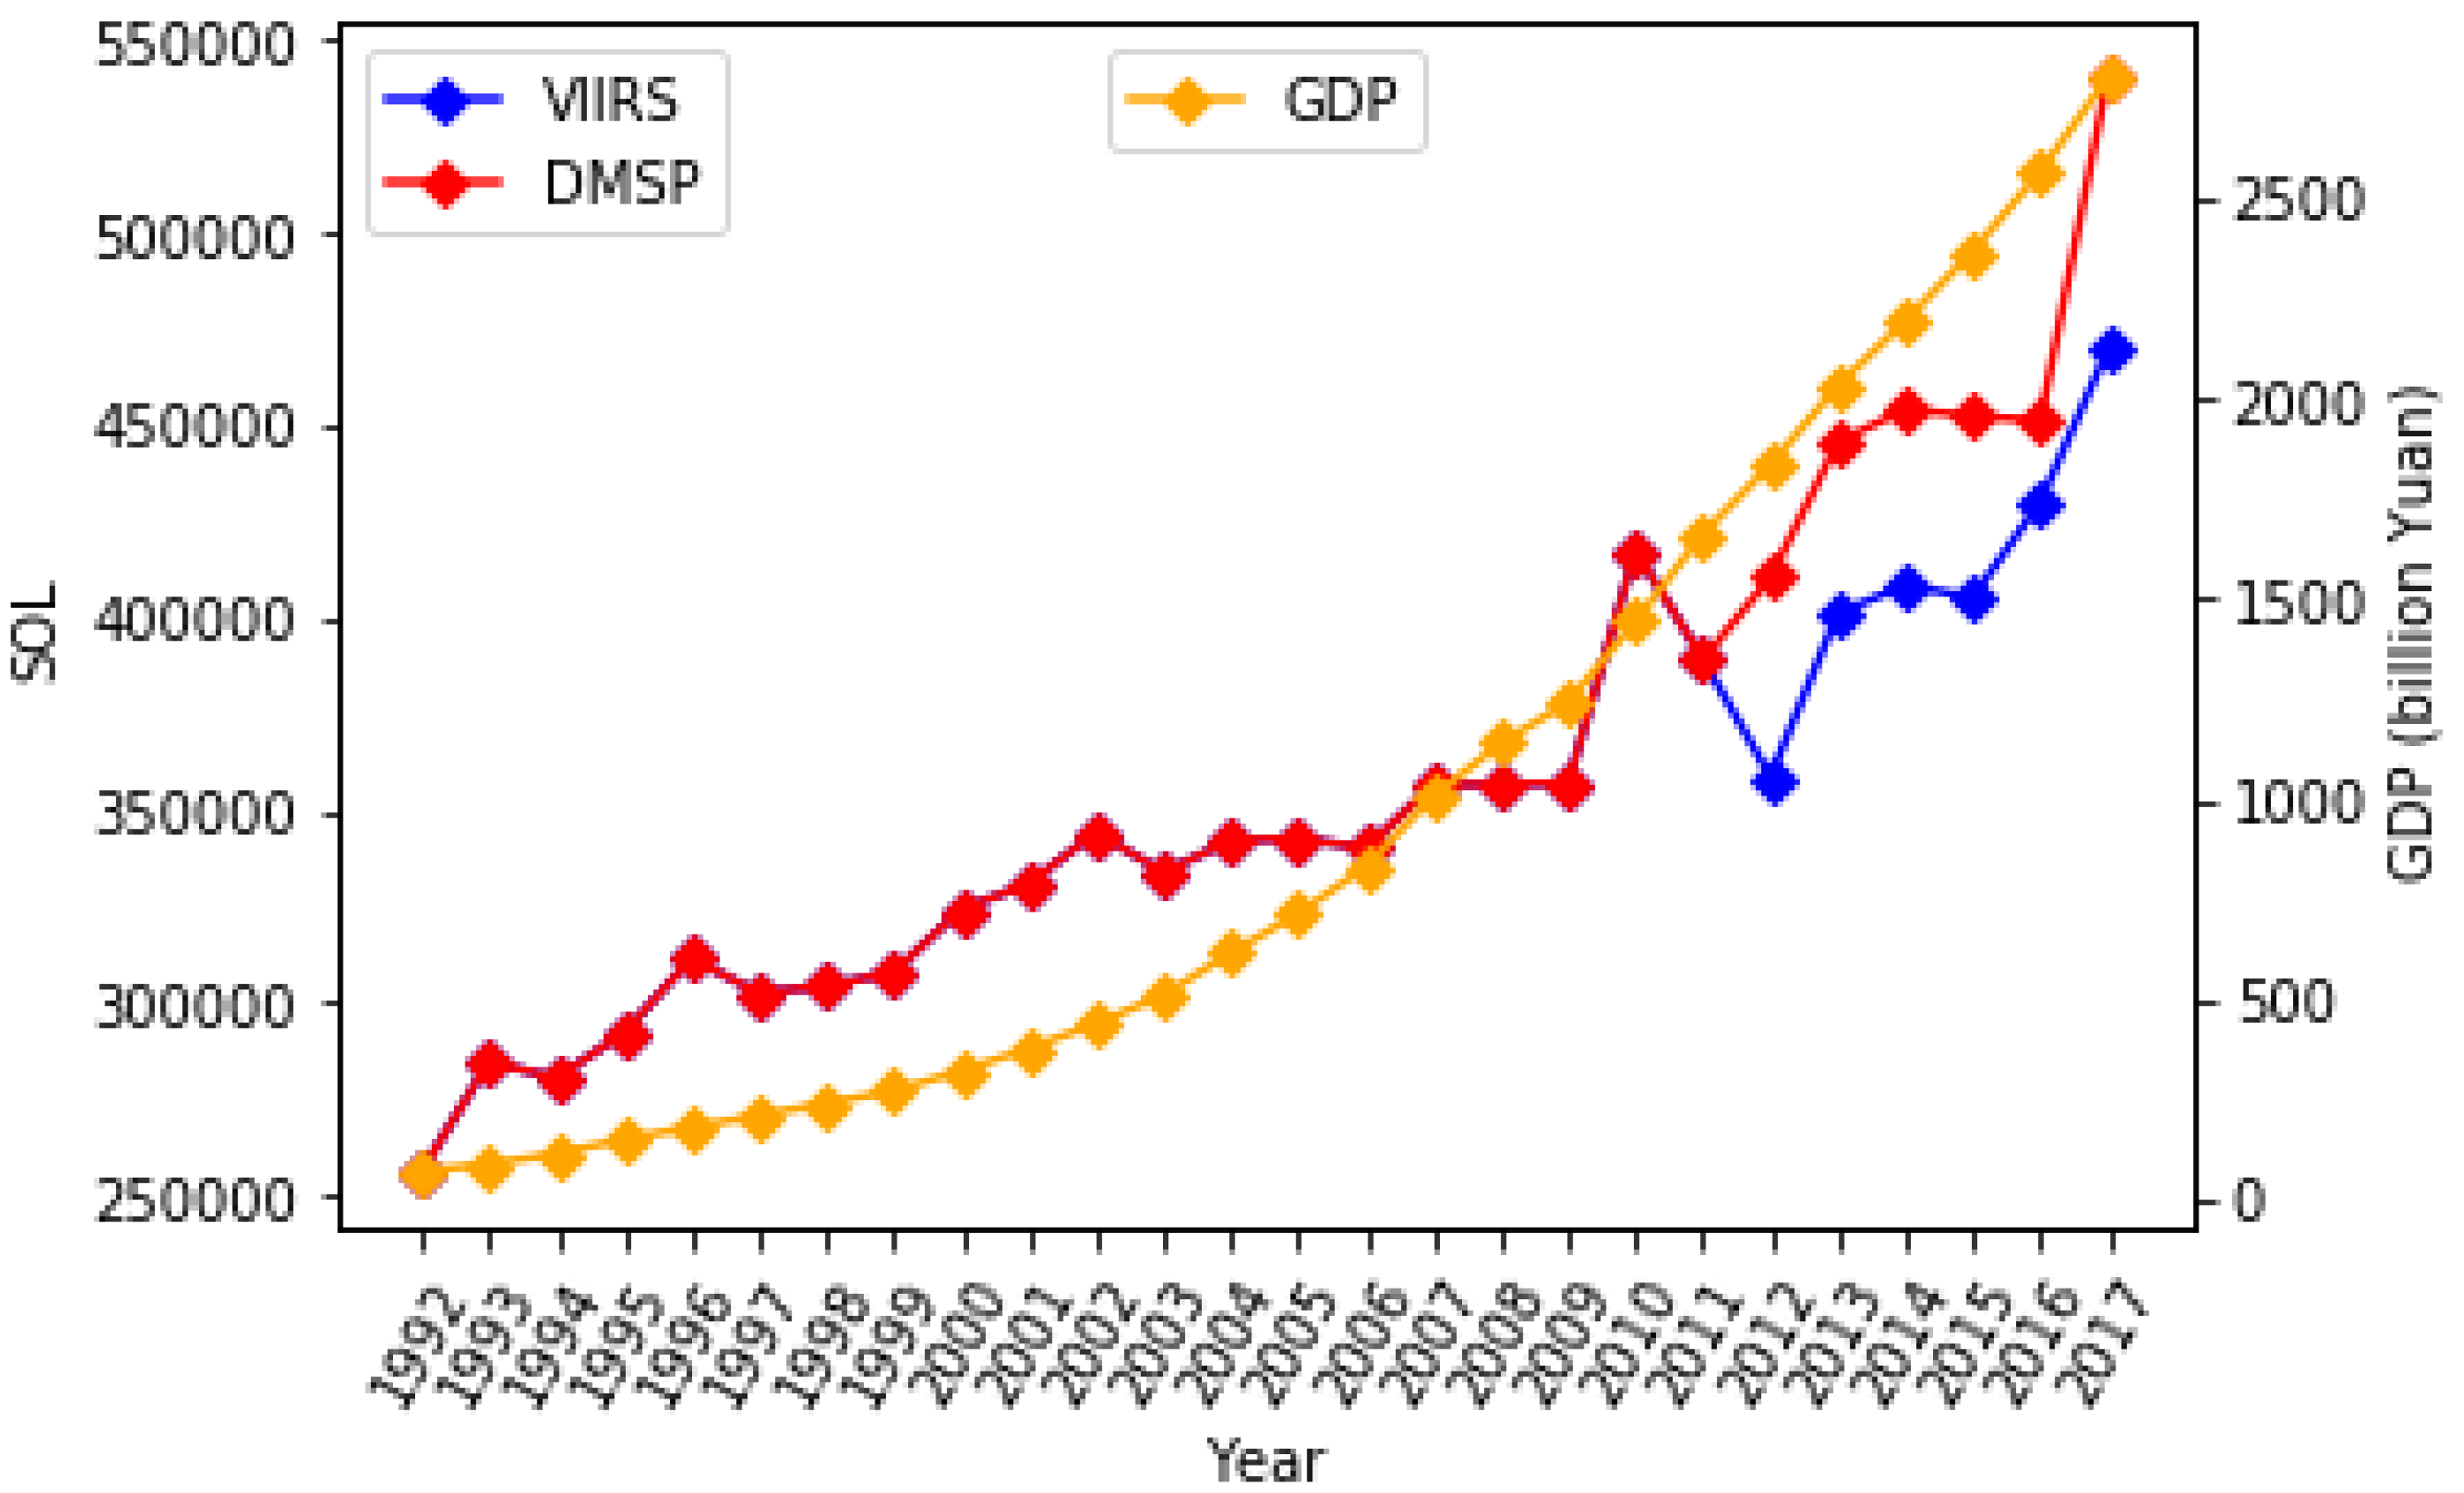
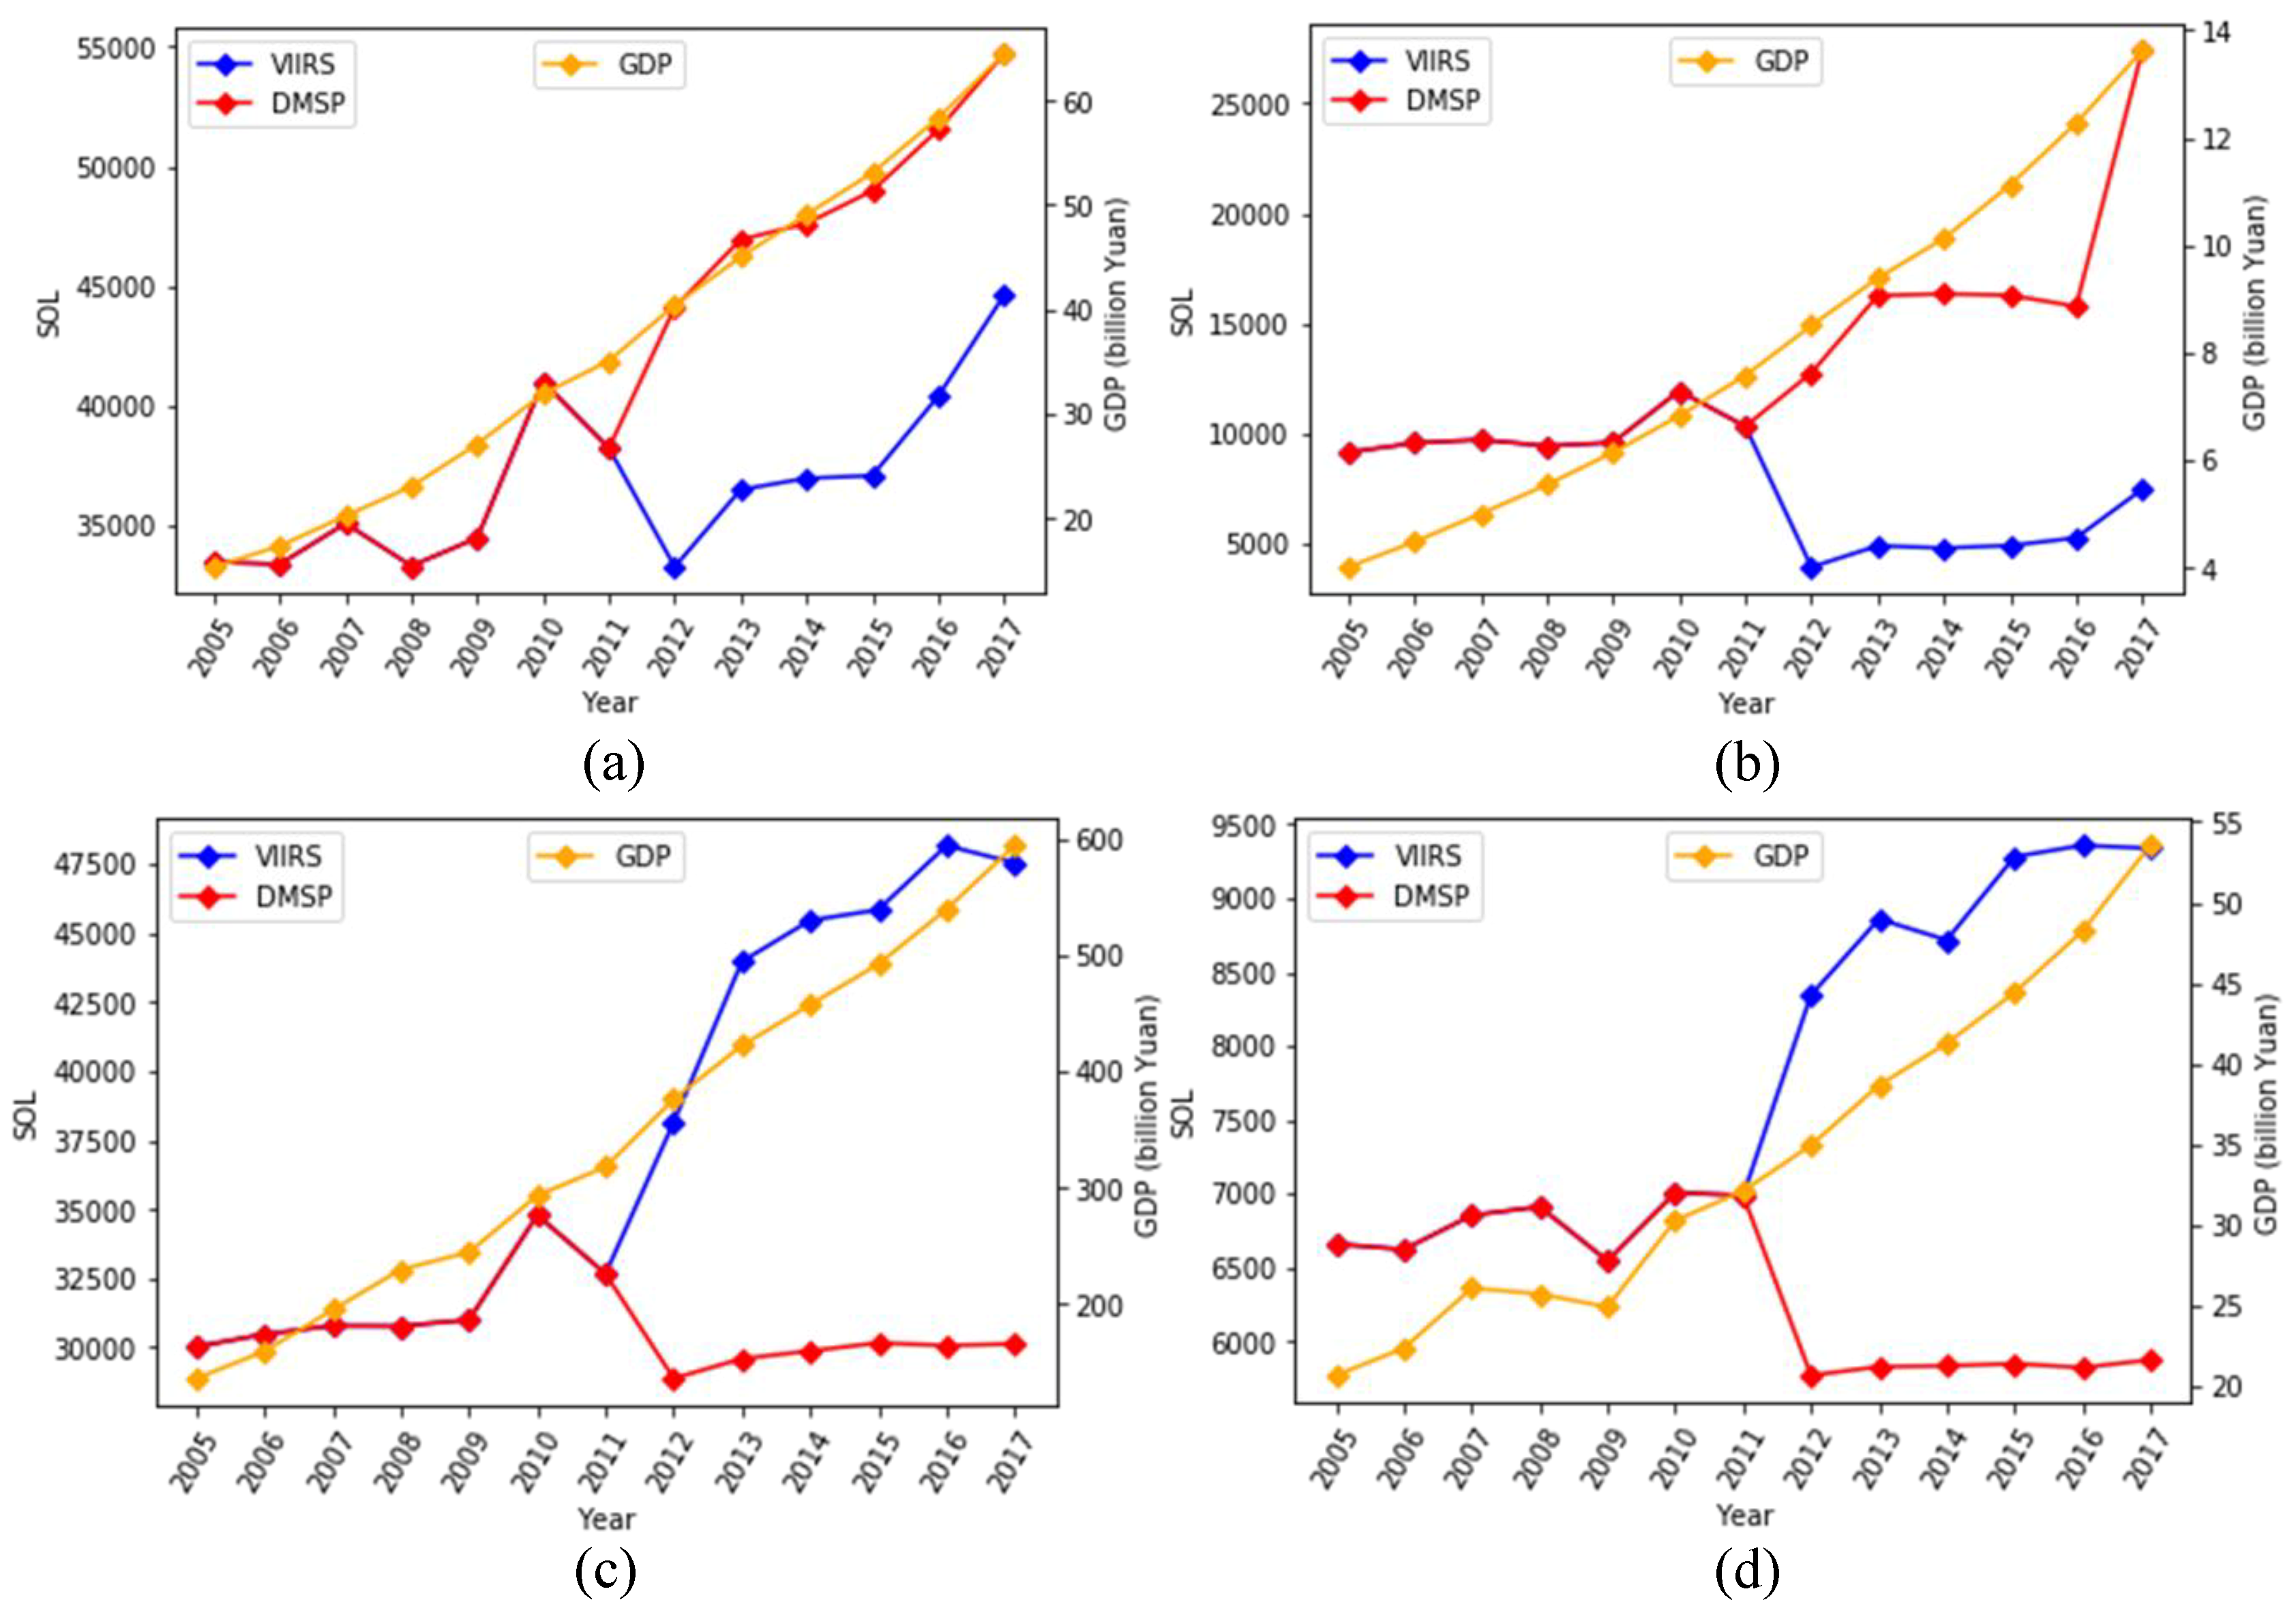
4.3. Correlation Between NTL and GDP

Figure 11 shows the city-level change of SOL of DMSP and VIIRS annual composites, and GDP of Beijing from 1992 to 2017. Among the DMSP annual composites of Beijing, original annual composites were used in 1992–2011, and simulated ones were applied in 2012–2017. By visual comparison, although the SOL of DMSP (denoted by red line) and VIIRS (denoted by blue line) NTL both increase alongside the GDP (denoted by yellow line) of Beijing, the SOL of DMSP NTL after 2011 were more close to GDP than the SOL of VIIRS NTL. When evaluating quantitatively, the Pearson correlation coefficient of the SOL of DMSP annual composites and GDP of Beijing was 0.965. By contrast, when combining original DMSP annual composites in 1992–2011 and VIIRS annual composites in 2012–2017 directly, the Pearson correlation coefficient of the SOL of both NTL and GDP of Beijing was 0.935. These results demonstrate the feasibility of the proposed methodology in combining DMSP and VIIRS NTL in pixel values and the high correlation between DMSP annual composites and GDP of Beijing in 1992–2017. As for the discrepancy between the SOL of DMSP annual composites and GDP, possible causes may be that the light intensity of DMSP NTL can not reflect all economic activities in cities, but only illuminated activities at the specific overpass time, that mapping relation between measures of night light and values of GDP is heterogeneous and dependent on various circumstances, and that the saturation of DMSP NTL handicaps the mapping between SOL of DMSP NTL and GDP. The following evaluation results on the district level demonstrate the variety of correlation between SOL of NTL and GDP.
Table 4 lists the Pearson correlation coefficients between SOL of NTL and GDP of every district in Beijing. Values in the column of Without simulation were computed using district-level GDP in 2005–2017, original DMSP annual composites in 2005–2011 and VIIRS annual composites in 2012–2017, and values in the column of With simulation were computed using the same GDP, original DMSP annual composites in 2005–2011 and simulated DMSP annual composites in 2012–2017. According to the results, correlation between SOL and GDP in 2005–2017 was enhanced in 11 out of the 16 districts in Beijing as the absolute value of Pearson correlation coefficients increased with simulation. The correlation was reversed for most districts when the simulated DMSP annual composites were applied.
Besides, Figure 12 is presented to show the district-level change of SOL and GDP in 2005–2017 for four representative districts, namely, Daxing (a), Yanqing (b), Haidian (c) and Shijingshan (d). Among the four districts, Daxing is the one whose Pearson correlation coefficient between the SOL of NTL and GDP increased from 0.727 to 0.980 after the simulation of DMSP NTL. As Figure 12a shows, the SOL of simulated DMSP NTL added more simultaneously alongside GDP than the SOL of VIIRS annual composites. Yanqing was the district whose Pearson correlation coefficient changed from −0.655 to 0.890 after the simulation of DMSP NTL. In Figure 12b, the SOL of simulated DMSP annual composites was also more approximate to annual GDP than that of VIIRS annual composites. Nevertheless, Pearson correlation coefficients for districts Haidian and Shijingshan decreased from 0.963 to −0.263 and from 0.948 to −0.768, respectively. As shown in Figure 12c,d, the SOL of simulated DMSP NTL in 2012–2017 was quite stable and had dropped from that in 2005–2011 to some extent, while the SOL of VIIRS annual composites in 2012–2017 grew substantially and clearly exceeded that in 2005–2011. This may result from the saturation problem of DMSP NTL and the limitation of the proposed method in producing pixel values above 50.

5. Discussion

This research contributed a new method to combine DMSP and VIIRS NTL in the pixel level and explored the correlation between the SOL of DMSP NTL and GDP of Beijing in 1992–2017. The differences between this research and previous study were as followed. Compared with Li et al. [20], this research employed annual composites rather than monthly composites in the combination of DMSP and VIIRS NTL. A quadratic polynomial regression model instead of a linear one was used to calibrate DMSP NTL in 1992–2013, and a stepwise sensitive analysis was applied to determine the optimal values of parameters in the power function and Gaussian low pass filter. In this way, the simulation of DMSP NTL after 2013 could be carried out with free annual composites and at places besides a specific area (e.g., Syria). While the GWRc model used in Zheng et al. [21] yielded assessment results better than the power function model in Li et al. [20] and produces saturation-free DMSP NTL in 1996–2017, due to the use of DMSP grc data rather than stable light images, estimation of DMSP grc for missing years from 1996 to 2011 and for the overlapped years 2012 and 2013 has to be carried out. Among others, the correlation between the SOL of resulting DMSP NTL in 1992–2017 and the GDP of Beijing, 0.965 in this research, surpasses the one for Beijing in 1996–2017, 0.838 in Zheng et al. [20]. By contrast with Xu et al. [9], which combines DMSP and VIIRS NTL in years from 1992 to 2015 in pixel counts, this research implements the combination of both in pixel values so that comparison and correlation analysis between light intensity and GDP of cities can be conducted at a pixel level instead of an integrated urban scale. In addition, this research differs from an existing study using a single type of multitemporal NTL in that longer temporal sequence can be adopted by combining both types.
However, there were some limitations of the research. One was that the range of pixel values of DMSP NTL simulated with the proposed method was 0–50 while the one of the original DMSP NTL was 0–63. Therefore, methods of quantifying light intensity in the range of 51–63 might be developed in the future to produce more precise simulating results. Another was that the SOL of calibrated DMSP NTL and combined NTL were not completely continuous across different years. Methods of correcting the discontinuous SOL across long temporal sequence may be explored to improve the continuity. Furthermore, the proposed method may be applied to studying other socio-economic problems such as carbon emission with auxiliary of other data such as NDVI.

6. Conclusions

To narrow the gap between the pixel values of DMSP and VIIRS NTL, this research proposes to simulate DMSP annual composites with VIIRS annual composites by using a model comprised of a power function and a Gaussian low pass filter. A case study of Beijing is carried out on the basis of DMSP annual composites in 1992–2013, VIIRS monthly composites in 2012–2018 and GDP values in 1992–2017. Results show that correlation between simulated DMSP and original DMSP annual composites (0.937 and 0.945) was much higher than that between original VIIRS and original DMSP annual composites (0.637 and 0.658) in 2012 and 2013, and correlation between SOL of combined NTL and GDP in 1992–2017 was high (0.965). The results demonstrated the feasibility and applicability of the proposed methodology in combining DMSP and VIIRS NTL in pixel values for urban dynamics evaluation in fast developing countries with an accurate and low-cost to implement.

Supplementary Materials

The following are available online at https://www.mdpi.com/2072-4292/11/12/1463/s1, Figure S1: SOL of DMSP annual composites in Yiwu in years 1992–2013, Figure S2: SOL of DMSP NTL in Yiwu before (a) and after (b) calibration, Figure S3: SOL of NTL and GDP of Yiwu in years 1999–2017, Table S1: Correlation between VIIRS and DMSP NTL in Yiwu in years 2012 and 2013.

Author Contributions

Conceptualization, K.W.; Methodology, X.W. and K.W.; Software, X.W.; Validation, X.W. and K.W.; Formal Analysis, X.W.; Investigation, X.W.; Resources, K.W.; Data Curation, K.W. and X.W.; Writing—Original Draft Preparation, X.W.; Writing—Review & Editing, K.W. and X.W.; Visualization, X.W.; Supervision, K.W.; Project Administration, K.W.; Funding Acquisition, K.W.

Funding

This research was funded by the Natural Science Foundation of China, grant number 41671161/71733001/41401178, and the Youth Talent Support Program of Beijing Municipal Education Commission, grant number CIT&TCD201804097.

Acknowledgments

The authors appreciate NOAA/NCEI for providing DMSP annual composites and VIIRS monthly composites.

Conflicts of Interest

The authors declare no conflict of interest.

References

  1. Guan, W.W.; Wu, K.; Carnes, F. Modeling spatiotemporal pattern of agriculture-feasible land in china. Trans. GIS 2016, 20, 426–447. [Google Scholar] [CrossRef]
  2. Riahi, K.; Van Vuuren, D.P.; Kriegler, E.; Edmonds, J.; O’neill, B.C.; Fujimori, S.; Bauer, N.; Calvin, K.; Dellink, R.; Fricko, O.; et al. The shared socioeconomic pathways and their energy, land use, and greenhouse gas emissions implications: An overview. Glob. Environ. Chang. 2017, 42, 153–168. [Google Scholar] [CrossRef]
  3. Jiang, L.; O’Neill, B.C. Global urbanization projections for the shared socioeconomic pathways. Glob. Environ. Chang. 2017, 42, 193–199. [Google Scholar]
  4. Samir, K.; Lutz, W. The human core of the shared socioeconomic pathways: Population scenarios by age, sex and level of education for all countries to 2100. Glob. Environ. Chang. 2017, 42, 181–192. [Google Scholar]
  5. Leimbach, M.; Kriegler, E.; Roming, N.; Schwanitz, J. Future growth patterns of world regions–a gdp scenario approach. Glob. Environ. Chang. 2017, 42, 215–225. [Google Scholar] [CrossRef]
  6. Bauer, N.; Calvin, K.; Emmerling, J.; Fricko, O.; Fujimori, S.; Hilaire, J.; Eom, J.; Krey, V.; Kriegler, E.; Mouratiadou, I.; et al. Shared socio-economic pathways of the energy sector–quantifying the narratives. Glob. Environ. Chang. 2017, 42, 316–330. [Google Scholar] [CrossRef]
  7. Park, J. Projection of Long-Term Total Factor Productivity Growth for 12 Asian Economies; Asian Development Bank ADB Economics Working Paper Series; The Asian Development Bank (ADB): Metro Manila, Philippines, 2010. [Google Scholar]
  8. Bennett, M.M.; Smith, L.C. Advances in using multitemporal night-time lights satellite imagery to detect, estimate, and monitor socioeconomic dynamics. Remote Sens. Environ. 2017, 192, 176–197. [Google Scholar] [CrossRef]
  9. Xu, M.; He, C.; Liu, Z.; Dou, Y. How did urban land expand in china between 1992 and 2015? A multi-scale landscape analysis. PLoS ONE 2016, 11, e0154839. [Google Scholar] [CrossRef]
  10. Wei, Y.; Liu, H.; Song, W.; Yu, B.; Xiu, C. Normalization of time series dmsp-ols nighttime light images for urban growth analysis with pseudo invariant features. Landsc. Urban Plan. 2014, 128, 1–13. [Google Scholar] [CrossRef]
  11. He, C.; Liu, Z.; Tian, J.; Ma, Q. Urban expansion dynamics and natural habitat loss in china: A multiscale landscape perspective. Glob. Chang. Biol. 2014, 20, 2886–2902. [Google Scholar] [CrossRef]
  12. Ma, T.; Zhou, Y.; Zhou, C.; Haynie, S.; Pei, T.; Xu, T. Night-time light derived estimation of spatio-temporal characteristics of urbanization dynamics using dmsp/ols satellite data. Remote Sens. Environ. 2015, 158, 453–464. [Google Scholar] [CrossRef]
  13. Yu, S.; Zhang, Z.; Liu, F. Monitoring population evolution in china using time-series dmsp/ols nightlight imagery. Remote Sens. 2018, 10, 194. [Google Scholar] [CrossRef]
  14. Ma, T.; Zhou, C.; Pei, T.; Haynie, S.; Fan, J. Quantitative estimation of urbanization dynamics using time series of dmsp/ols nighttime light data: A comparative case study from china’s cities. Remote Sens. Environ. 2012, 124, 99–107. [Google Scholar]
  15. Román, M.O.; Stokes, E.C. Holidays in lights: Tracking cultural patterns in demand for energy services. Earth’s Future 2015, 3, 182–205. [Google Scholar] [PubMed]
  16. Shi, K.; Chen, Y.; Yu, B.; Xu, T.; Chen, Z.; Liu, R.; Li, L.; Wu, J. Modeling spatiotemporal co2 (carbon dioxide) emission dynamics in china from dmsp-ols nighttime stable light data using panel data analysis. Appl. Energy 2016, 168, 523–533. [Google Scholar] [CrossRef]
  17. Yu, B.; Shi, K.; Hu, Y.; Huang, C.; Chen, Z.; Wu, J. Poverty evaluation using npp-viirs nighttime light composite data at the county level in china. IEEE J. Sel. Top. Appl. Earth Obs. Remote Sens. 2015, 8, 1217–1229. [Google Scholar]
  18. Noaa’s National Centers for Environmental Information. Available online: https://www.ngdc.noaa.gov/ (accessed on 20 September 2018).
  19. Shao, X.; Cao, C.; Zhang, B.; Qiu, S.; Elvidge, C.; Von Hendy, M. Radiometric calibration of dmsp-ols sensor using viirs day/night band. In Earth Observing Missions and Sensors: Development, Implementation, and Characterization III; International Society for Optics and Photonics: Beijing, China, 2014; p. 92640A. [Google Scholar]
  20. Li, X.; Li, D.; Xu, H.; Wu, C. Intercalibration between dmsp/ols and viirs night-time light images to evaluate city light dynamics of syria’s major human settlement during syrian civil war. Int. J. Remote Sens. 2017, 38, 5934–5951. [Google Scholar] [CrossRef]
  21. Zheng, Q.; Weng, Q.; Wang, K. Developing a new cross-sensor calibration model for dmsp-ols and suomi-npp viirs night-light imageries. ISPRS J. Photogramm. Remote Sens. 2019, 153, 36–47. [Google Scholar] [CrossRef]
  22. Beijing Macroeconomic and Social Development Database. Available online: http://43.254.24.2/ww/MenuItemAction!queryMenu (accessed on 5 December 2018).
  23. People’s Government of Yiwu. Available online: http://www.yw.gov.cn/11330782002609848G/a/07/03_1/2018/gb/index.html (accessed on 15 March 2019).
  24. Elvidge, C.; Ziskin, D.; Baugh, K.; Tuttle, B.; Ghosh, T.; Pack, D.; Erwin, E.; Zhizhin, M. A fifteen year record of global natural gas flaring derived from satellite data. Energies 2009, 2, 595–622. [Google Scholar] [CrossRef]
  25. Li, X.; Chen, X.; Zhao, Y.; Xu, J.; Chen, F.; Li, H. Automatic intercalibration of night-time light imagery using robust regression. Remote Sens. Lett. 2013, 4, 45–54. [Google Scholar] [CrossRef]
  26. Ma, W.; Li, P. An object similarity-based thresholding method for urban area mapping from visible infrared imaging radiometer suite day/night band (viirs dnb) data. Remote Sens. 2018, 10, 263. [Google Scholar] [CrossRef]
Figure 1. Division of Beijing (a) and Yiwu (b).
Remotesensing 11 01463 g001
Figure 2. NTL processing and model evaluation.
Remotesensing 11 01463 g002
Figure 3. Calibrating DMSP annual composites.
Remotesensing 11 01463 g003
Figure 4. Making VIIRS annual composites.
Remotesensing 11 01463 g004
Figure 5. Sum of light (SOL) of DMSP annual composites in Beijing in 1992–2013.
Remotesensing 11 01463 g005
Figure 6. DMSP NTL in Beijing before (a) and after (b) calibration.
Remotesensing 11 01463 g006
Figure 7. SOL of DMSP NTL in Beijing before (a) and after (b) calibration.
Remotesensing 11 01463 g007
Figure 8. Sensitive analysis of parameters.
Remotesensing 11 01463 g008
Figure 9. VIIRS, calibrated DMSP and simulated DMSP annual composites in Beijing. VIIRS annual composites in 2012 (a), 2013 (b) and 2018 (h); calibrated DMSP annual composites in 2012 (c) and 2013 (d) and simulated DMSP annual composites in 2012 (e), 2013 (f) and 2018 (g).
Remotesensing 11 01463 g009
Figure 10. Distribution of pixel values of NTL in 2012 and 2013. Distribution of pixel values of original DMSP and VIIRS annual composites in 2012 (a) and 2013 (b), and original DMSP and simulated DMSP annual composites in 2012 (c) and 2013 (d).
Remotesensing 11 01463 g010
Figure 11. SOL of NTL and gross domestic product (GDP) of Beijing in 1992–2017.
Remotesensing 11 01463 g011
Figure 12. SOL of NTL and GDP of Districts Daxing (a), Yanqing (b), Haidian (c) and Shijingshan (d) in 2005–2017.
Remotesensing 11 01463 g012
Table 1. Comparisons between the Defense Meteorological Satellite Program (DMSP) and Visible Infrared Imaging Radiometer Suite (VIIRS) nighttime light images (NTL).
NTL SourceDMSP/OLSSuomi NPP/VIIRS
Spatial resolution2.7 km742 m
Radiometric resolution6-bit12-or 14-bit
Wavelength range0.4–1.1 μm505–890 μm
On-board calibrationNoYes
Units of pixel valuesRelative (0–63 scale)Radiance ( nanoWatts / ( cm 2 sr ) )
Light range detected ( Wcm 2 sr 1 μ m 1 ) 1.54 × 10 9 3.17 × 10 7 3 × 10 9 0.02 (specified, actual detected noise floor is 5 × 10 11 )
Night overpass time20:30–21:301:30
Available temporal sequence1992–2013 annual composites (free)
1992–2014 monthly composites (charged)
2012–present monthly composites (free)
2015–2016 annual composites (free)
Table 2. Intercalibration of DMSP annual composites in 1992–2013.
YearSensor of NTL c 0 c 1 c 2 Score
1992F102.0970.9250.0010.970
1993F10−0.8051.319−0.0050.975
1994F100.2861.105−0.0020.983
1995F120.8930.6980.0040.991
1996F12−0.3911.02400.986
1997F120.1330.8090.0030.992
1998F120.6820.6660.0050.992
1999F140.1441.182−0.0030.990
2000F15−0.1310.8040.0030.992
2001F15−0.1230.7020.0040.996
2002F150.8600.5000.0070.997
2003F15----
2004F151.1650.6900.0040.997
2005F151.3600.6600.0040.996
2006F152.0540.5110.0070.996
2007F162.4080.2480.0110.996
2008F162.5150.2930.0100.993
2009F162.8690.2380.0110.994
2010F184.250−0.1850.0170.995
2011F183.5090.0350.0140.994
2012F183.721−0.0530.0150.995
2013F183.641−0.0510.0150.996
Table 3. Correlation between VIIRS and DMSP NTL in 2012 and 2013
r / R M S E Original DMSP NTL
Year 2012Year 2013
VIIRS NTLYear 20120.637/34.804-
Year 2013-0.658/35.526
Simulated DMSP NTLYear 20120.937/9.244-
Year 2013-0.945/9.387
Table 4. Correlation between SOL and GDP of districts in Beijing in 2005–2017.
DistrictWithout SimulationWith Simulation
Changping−0.4510.892
Chaoyang0.916−0.840
Daxing0.7270.980
Dongcheng0.876−0.876
Fangshan−0.3490.937
Fengtai0.951−0.635
Haidian0.963−0.263
Huairou−0.3840.897
Mentougou−0.5190.822
Miyun−0.6160.896
Pinggu−0.7100.888
Shijingshan0.948−0.768
Shunyi0.6750.968
Tongzhou0.6760.976
Xicheng0.881−0.887
Yanqing−0.6550.890

