Effects of Fire and Large Herbivores on Canopy Nitrogen in a Tallgrass Prairie


1
School of Civil and Transportation Engineering, Guangdong University of Technology, Guangzhou, Guangdong 510006, China
2
Rangeland Resources and Systems Research Unit, Agricultural Research Service, Fort Collins, CO 80526, USA
3
Department of Geography, Kansas State University, Manhattan, KS 66502, USA
4
Division of Biology, Kansas State University, Manhattan, KS 66502, USA
*
Author to whom correspondence should be addressed.
Remote Sens. 2019, 11(11), 1364; https://doi.org/10.3390/rs11111364
Submission received: 4 April 2019
/
Revised: 22 May 2019
/
Accepted: 3 June 2019
/
Published: 6 June 2019
Abstract
:This study analyzed the spatial heterogeneity of grassland canopy nitrogen in a tallgrass prairie with different treatments of fire and ungulate grazing (long-term bison grazing vs. recent cattle grazing). Variogram analysis was applied to continuous remotely sensed canopy nitrogen images to examine the spatial variability in grassland canopies. Heterogeneity metrics (e.g., the interspersion/juxtaposition index) were calculated from the categorical canopy nitrogen maps and compared among fire and grazing treatments. Results showed that watersheds burned within one year had higher canopy nitrogen content and lower interspersions of high-nitrogen content patches than watersheds with longer fire intervals, suggesting an immediate and transient fire effect on grassland vegetation. In watersheds burned within one year, high-intensity grazing reduced vegetation density, but promoted grassland heterogeneity, as indicated by lower canopy nitrogen concentrations and greater interspersions of high-nitrogen content patches at the grazed sites than at the ungrazed sites. Variogram analyses across watersheds with different grazing histories showed that long-term bison grazing created greater spatial variability of canopy nitrogen than recent grazing by cattle. This comparison between bison and cattle is novel, as few field experiments have evaluated the role of grazing history in driving grassland heterogeneity. Our analyses extend previous research of effects from pyric herbivory on grassland heterogeneity by highlighting the role of grazing history in modulating the spatial and temporal distribution of aboveground nitrogen content in tallgrass prairie vegetation using a remote sensing approach. The comparison of canopy nitrogen properties and the variogram analysis of canopy nitrogen distribution provided by our study are useful for further mapping grassland canopy features and modeling grassland dynamics involving interplays among fire, large grazers, and vegetation communities.
1. Introduction
Fire and large herbivores have historically played indispensable roles in determining and maintaining the canopy structure and species composition of vegetation communities in grassland and savanna ecosystems [1]. Effects of periodically recurring fires on grassland vegetation cover are complex, which involve multiple above- and below-ground processes [2,3,4]. In general, fire stimulates plant growth through removing the standing dead litter aboveground and increasing the light interception in the canopy [5,6,7], while simultaneously eliminating substantial sources of foliar nitrogen pools available to herbivores [8]. Increased soil temperature in recently burned areas enhances nutrition cycling belowground, and potentially improves plant productivity [9,10].
Fire effects on vegetation canopies vary with factors such as plant species, season of the ignition, and the time since the previous burn (fire intervals). Fire is effective for promoting the growth of herbaceous vegetation by suppressing woody plant invasion [11,12]. When prescribed fire coincides with spring plant growth, the effect of fire on the landscape is most evident [1]. Relative to non-growing season prescribed fire, spring fires often reduce the forb species that have initiated growth before the burn, and thus increase the dominance and production of the matrix grass species [13]. Moreover, spring fires tend to advance plant growth and speed up the vegetation phenological development [14]. The fire stimulus to grassland plants is dramatic but transitory. It is typically apparent for the first one or two years after the burn, and it then disappears as the community gradually reaches equilibrium [15]. Frequent prescribed fires therefore become a commonly used management tool to maintain palatable grassland vegetation and enhance the forage quality for large herbivore production [16].
Grazing by large ungulate herbivores is another critical component in grasslands [17,18,19]. Ungulate grazers can enhance plant abundance through reducing the standing dead materials in the canopy [20]. In addition, plants have the capability to overcompensate for low levels of herbivory, which often results in higher vegetation production in the grazed areas than the ungrazed ones [21,22]. With regard to grazing effects on plant species, ungulate herbivory reduces palatable grass species, allows forbs to flourish, and concomitantly increases plant species diversity [23]. Furthermore, large herbivores promote nutrition cycling through reducing the microbial nitrogen immobilization [24,25] and enhancing soil nitrogen sequestration [26,27,28].
Large ungulate herbivores naturally interact with fire in grassland systems. Fire influences the forage site selection by large herbivores. Large herbivores prefer grasslands burned by spring fires [29,30] in that the burned, new grassland is more palatable with higher forage quality than the unburned, old patches [31,32]. Grazing activities by large herbivores in turn influence the spread, severity, and intensity of fire through altering the fuel loading characteristics in the vegetation canopy [33,34]. This spatiotemporal interaction between fire and ungulate grazing is referred to as pyric herbivory, which results in a shifting mosaic of disturbance across the landscape [35,36]. Investigating grassland heterogeneity associated with pyric herbivory is important for grassland conservation and management [37,38,39]. Such insight could allow for a better understanding of how fire-grazing interactions can be used to modulate grassland heterogeneity in current management-intensive grazing systems, where herbivores no longer have opportunities to abandon expansive landscapes in search of new regions with better forage resources due to fencing and other barriers [40].
Effects of fire and large herbivores on grassland heterogeneity involving soil nutrition, plant productivity and species diversity have been studied substantially [35,41,42,43,44]. Most previous studies on grassland spatial heterogeneity are based on in-situ field sampling [45,46]. Traditional field measurements provide reliable and detailed ground references. However, confined study plots and limited sample size in field measurements may lead to an inappropriate representation of fire and grazing processes over large natural landscapes [1].
Use of remote sensing imagery to acquire the distribution of canopy features to a large spatial extent [47,48,49,50] may attenuate the concern about the limited sample size by field measurements. The canopy feature imagery derived from remote sensing data is typically a continuous numerical map. Spatial heterogeneity in the continuous map is featured by the scale and intensity of spatial autocorrelation in the canopy feature [51], which can be measured using geostatistical techniques, such as variogram analysis [52]. A variogram calculates the variance of difference between canopy features at each pair of locations over the vegetation cover. Through variogram analysis, the spatial autocorrelation distance and contrast in the canopy feature can be determined [53], which provide insight into the spatial structure and variability trends across the landscape. Numerical remote sensing imagery can also be converted into a categorical map by classifying the continuous canopy feature into discrete categorical levels, in which each level is considered a patch type. In the resulting categorical imagery, spatial heterogeneity of vegetation characteristics can be quantified by a variety of metrics, such as contagion, evenness, and patchiness [51]. The spatial heterogeneity metrics can be calculated either for a single specified patch type or for all the patch types as a whole, describing the composition and spatial configuration of patches from multiple aspects. In terms of grassland heterogeneity, the spatial distribution of patches with high levels of vegetation quality or quantity is of special interest [46]. The quality and quantity of vegetation resources are important factors that influence the foraging pattern by large herbivores at either a fine feeding-station scale or a coarse landscape scale [54,55].
American Plains Bison (Bison bison) and domestic cattle (Bos taurus) are two major ungulate grazer species in the Great Plains of North America [31,56]. Comparison between bison and cattle in the grazing effects on grassland evolution can provide conservation implications for ecosystem managers. The objectives of our study were to (i) evaluate the effects of pyric herbivory on the spatial heterogeneity of canopy nitrogen in tallgrass prairie and (ii) compare bison and cattle from the perspective of grazing history (long-term bison grazing since 1992 vs. recent cattle grazing since 2010). In our study, variogram analysis was applied to continuous remotely sensed canopy nitrogen images to examine the spatial structure and variability in grassland canopy nitrogen distribution. Spatial heterogeneity metrics were calculated from the categorical canopy nitrogen maps and compared across the different fire and ungulate grazing treatments. Investigating the spatial distribution of canopy nitrogen associated with fire and grazing activities throws light on critical questions concerning interactions between the forage nutrient pattern and resulting grazer behaviors [31,56]. In addition, comparison in canopy nitrogen distributions among experimental sites grazed by bison, grazed by cattle, and not grazed in several decades provides new information on the role of grazing history in modulating grassland resource heterogeneity.
2. Methods
2.1. Study Area
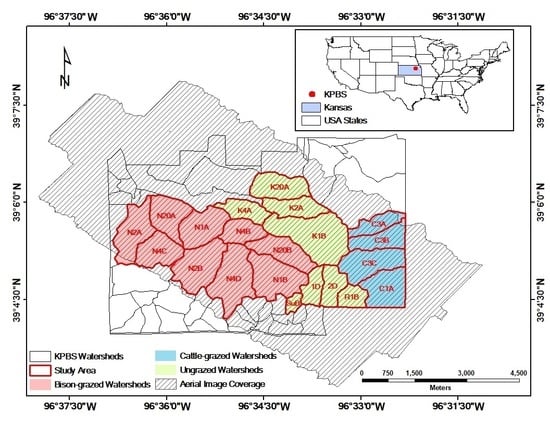
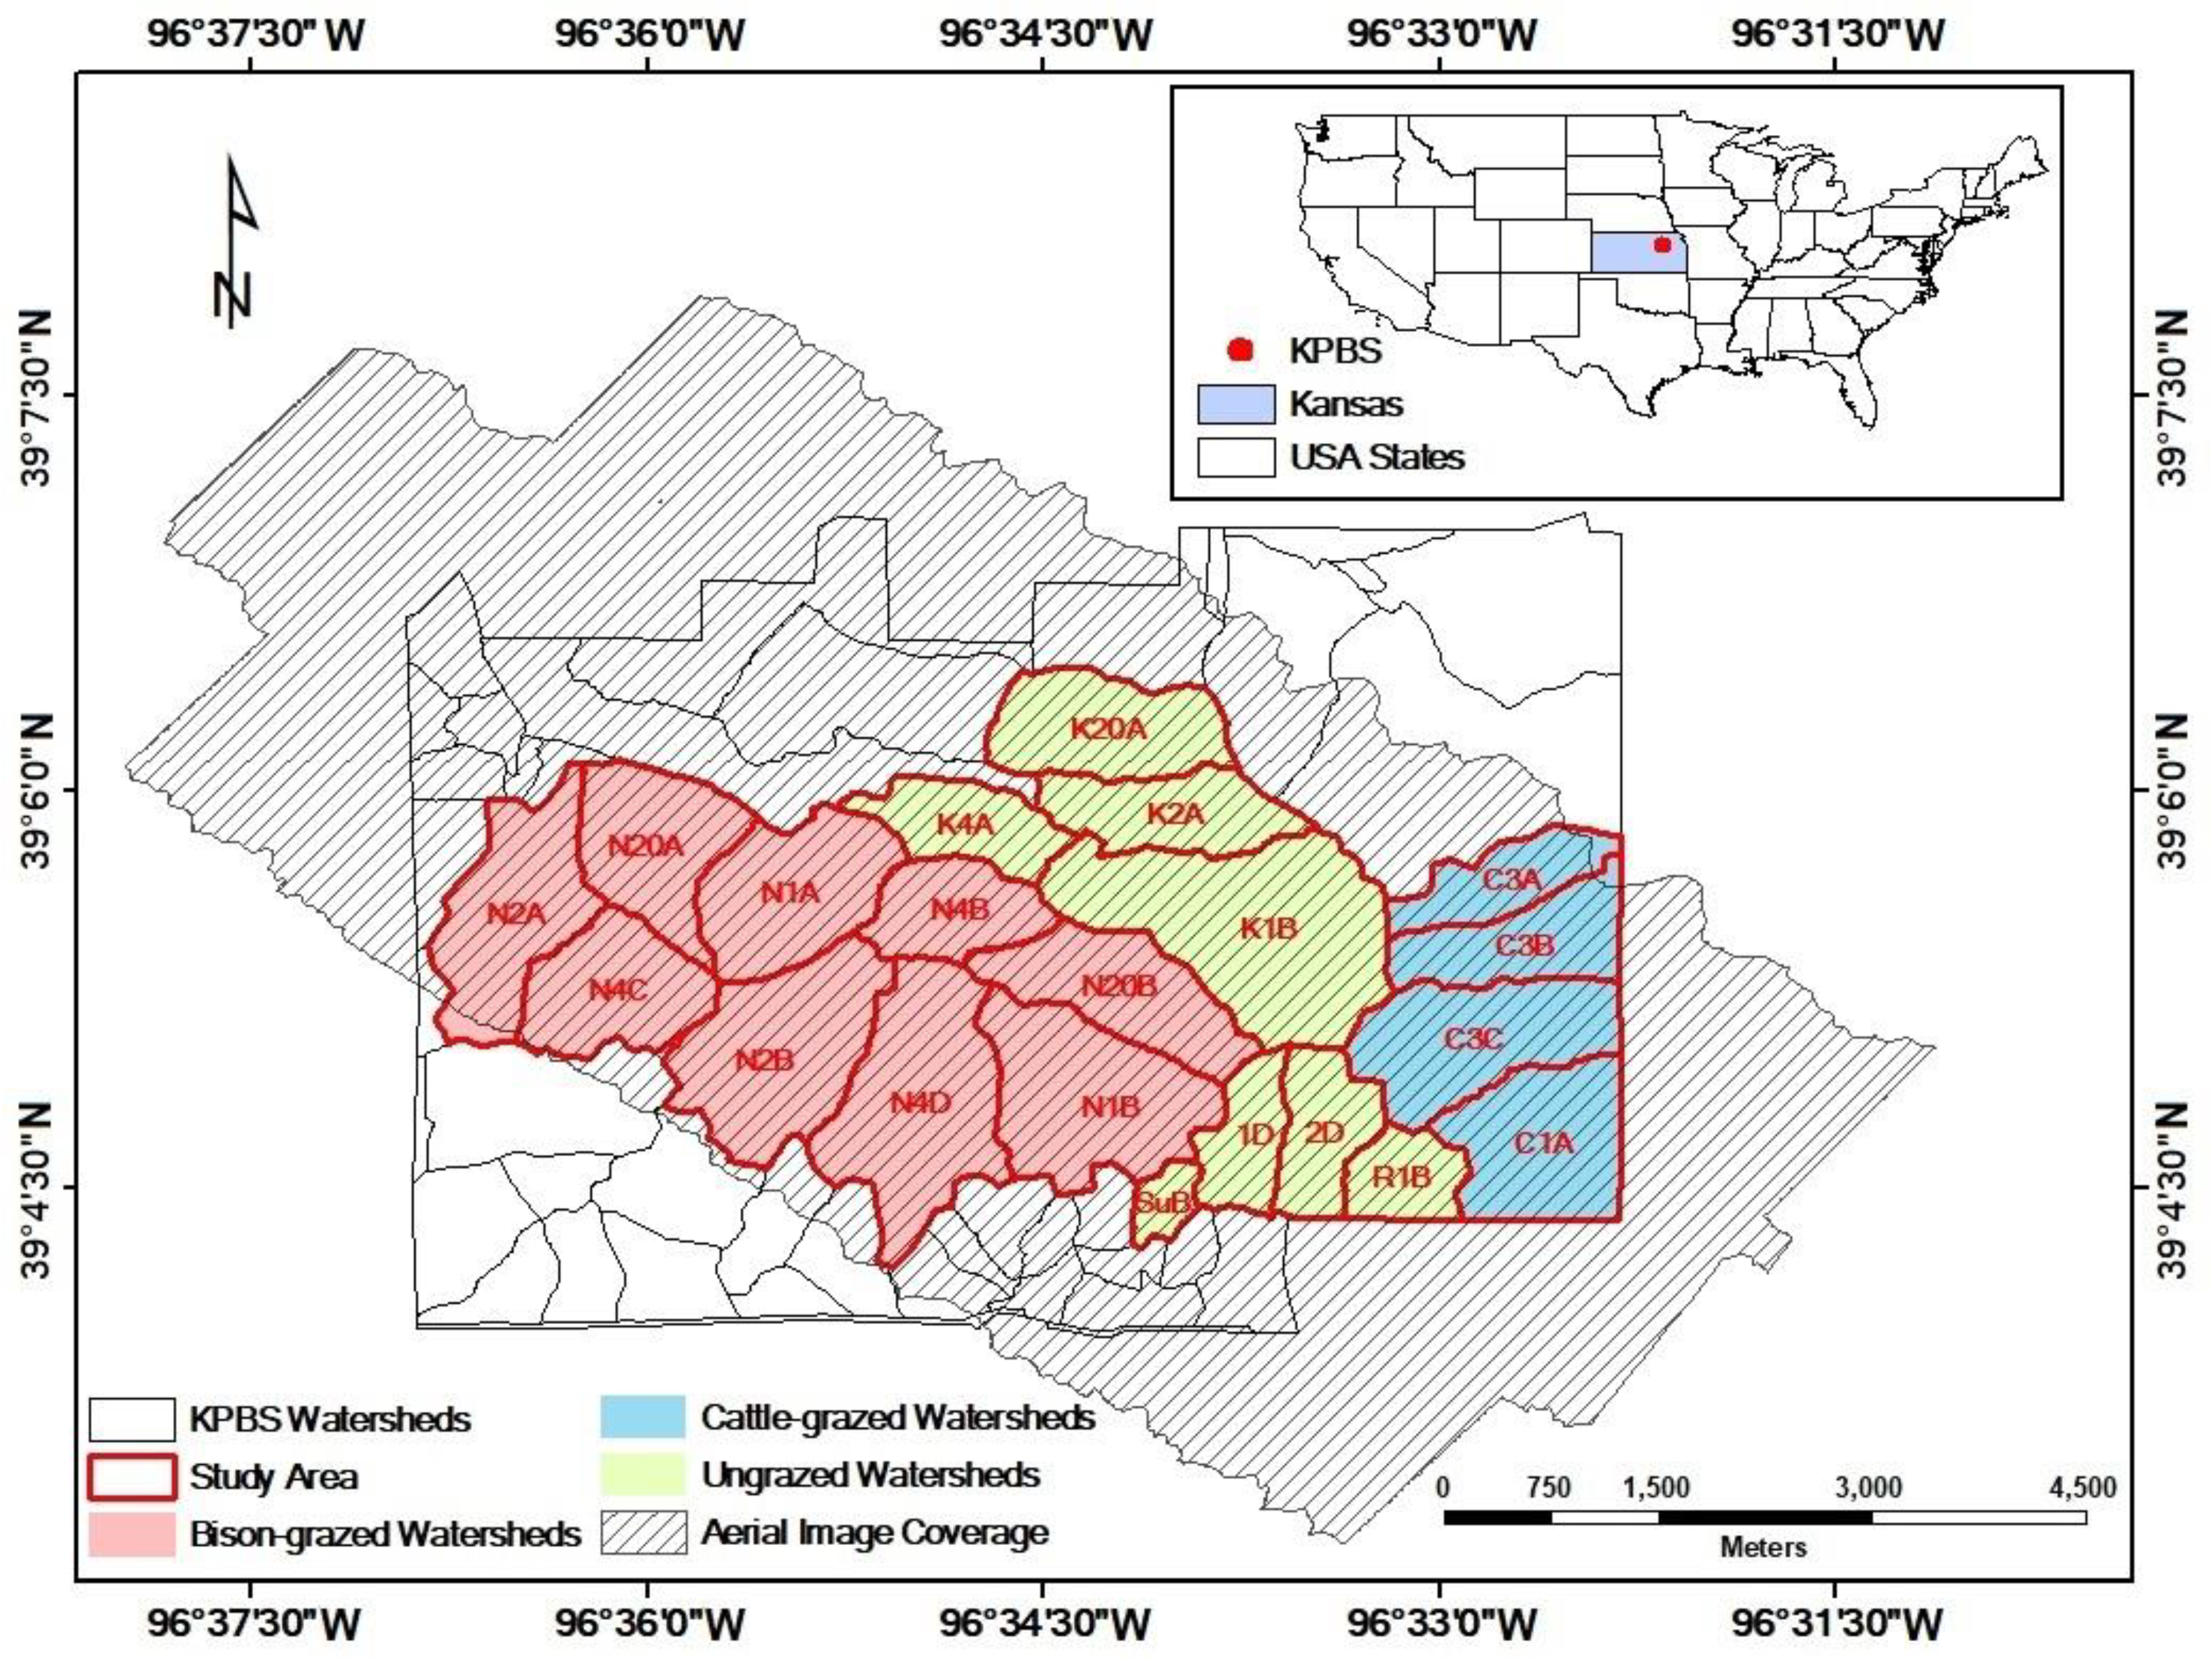
This study was conducted at Konza Prairie Biological Station (KPBS, Figure 1), a tallgrass prairie of 34.87 km2 in the Flint Hills near Manhattan, Kansas, USA (39°05′N, 96°35′W). The site is dominated by a continental climate with warm, wet springs, hot summers, and dry, cold winters. Average monthly temperature ranges from −2.7 °C in January to 26.6 °C in July. Average annual total precipitation is 835 mm with 75% falling during the seasons from April to September. The vegetation at the site is dominated by C4 perennial grasses, intermingled with a minor proportion of C3 forbs and a few C3 grasses [57]. The soil conditions vary with topographic positions. In general, the lowland soils are thick, silty clay loams. The upland and hillside soils are much shallower and rockier [58]. Topography influences the plant community structure at Konza Prairie. Lowland prairie has deeper, moister soil with higher productivity [59] compared to the shallow upland soil [60,61,62].
The KPBS is divided into more than 50 watersheds, each subjected to a treatment of either fire or ungulate grazing, or both [63]. Fire treatments vary with fire frequencies (1, 2, 4, 10, and 20 years). Grazing treatments include bison, cattle, and no grazing. At KPBS, a 970 ha enclosure (9 watersheds) is permanently stocked (year-round) with bison at a density of one individual per 4.5 ha. Bison have had full access to this enclosure since 1992 [41]. After a more than 30-year absence of grazing KPBS, a cattle grazing study was initiated in 2010. Cow-calf pairs at a density of one pair per 3.2 ha graze four watersheds for a 5-month grazing season from early May to early October each year [64,65]. Twenty-one watersheds (with an area of 17.13 km2) were selected for data analysis in this study given the coverage of the aerial images. All these watersheds had not been grazed since the late 1960s and had been subjected to their prescribed burning intervals since the mid-1970s [41]; therefore, we evaluated the spatial heterogeneity of 2011 canopy nitrogen maps for (i) ungrazed watersheds that have not been grazed for more than 30 years (n = 8 watersheds), (ii) bison-grazed watersheds that have been grazed year-round since 1992, after a ~30-year (1960s–1992) absence of grazing (n = 9 watersheds), and (iii) cattle-grazed watersheds that have been grazed during the growing season since 2010, after a more than 30-year (1960s–2010) absence of grazing (n = 4 watersheds).
2.2. Data Collection and Preprocessing
The fire history records and the digital elevation model (DEM) of the study area were provided by the National Science Foundation Long Term Ecological Research Program at KPBS [58]. Hyperspectral imagery covering the 21 watersheds was collected on four dates (26 May, 29 June, 2 August, and 26 September) spanning the 2011 growing season, using an AISA Eagle camera (Spectral Imaging Ltd., Teknologiantie 6D, Fin-90750 Oulu, Finland) mounted on a Piper Warrior aircraft operated by the Center for Advanced Land Management Information Technology (CALMIT) of the University of Nebraska-Lincoln. The spatial resolution of the aerial imagery is 2 m. The spectral resolution varied between ~3 nm for the May–August flights, and ~10 nm for the September flight, with a spectral range from 435 to 950 nm.
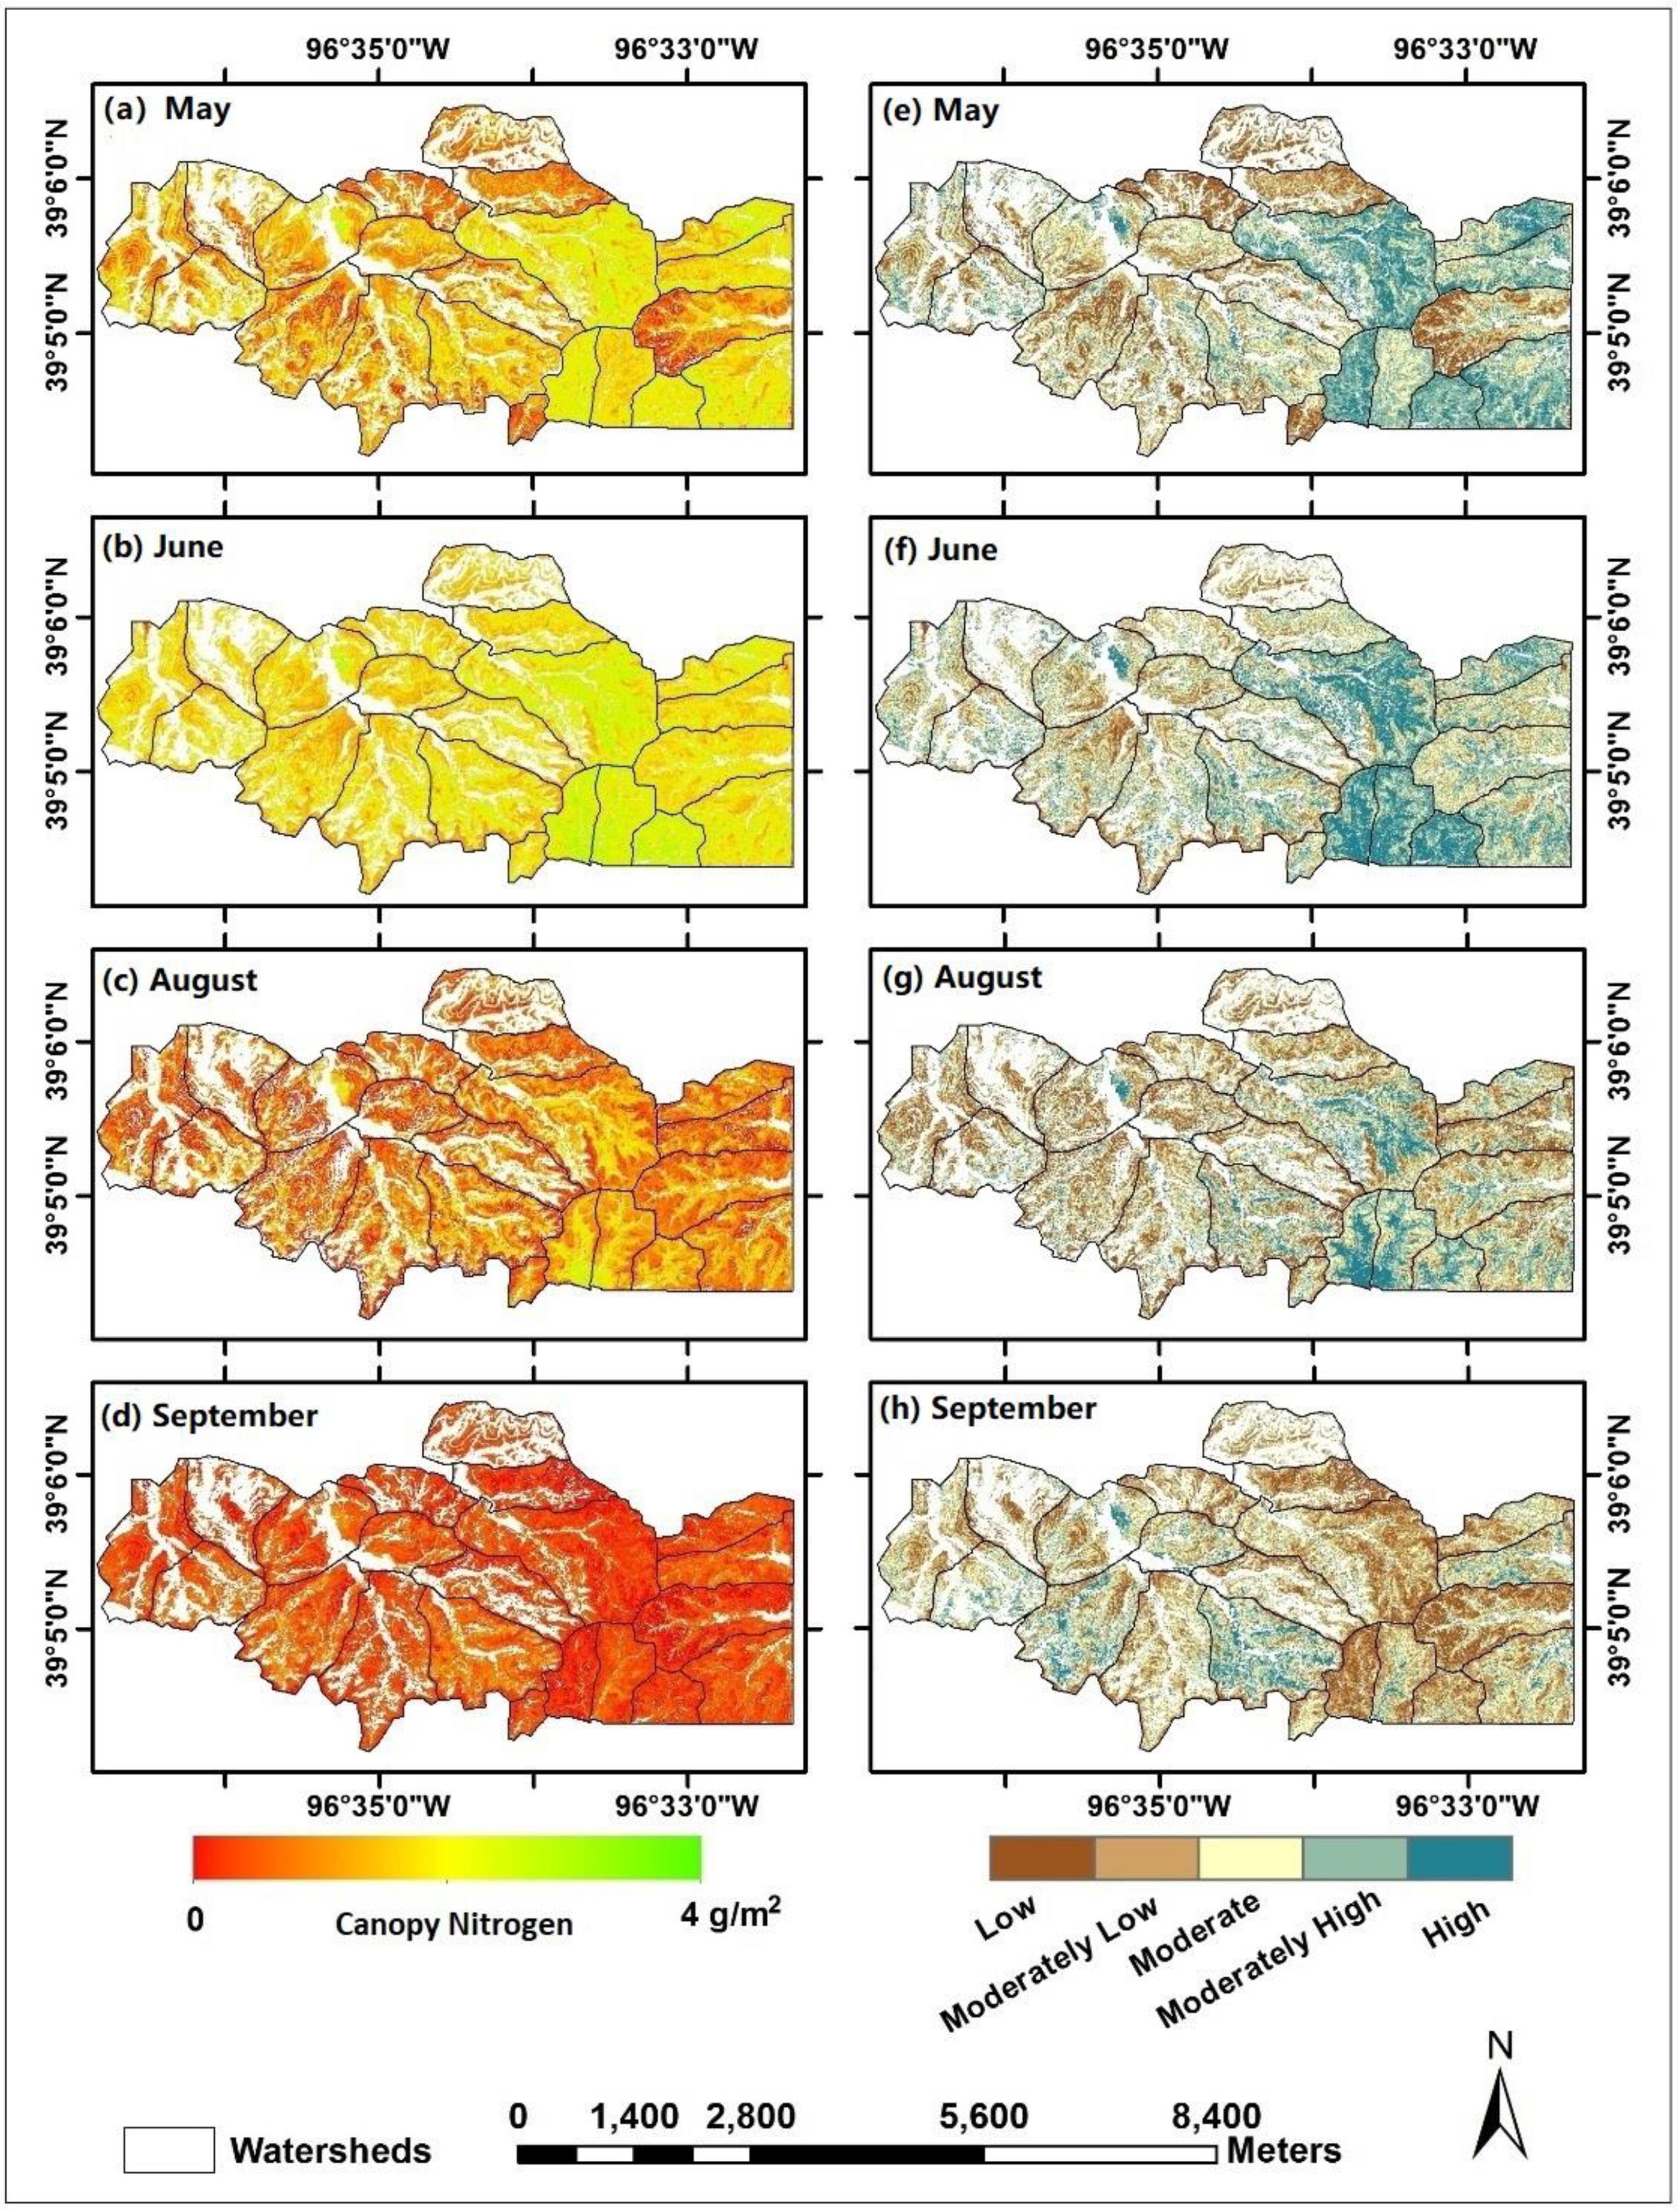
The fire interval for each watershed was calculated by the days between the dates of the previous burn and the image capture. Based on the DEM and the derived slope data, each watershed was divided into four topographic types, including drainage bottoms, lowlands, uplands, and hillslopes. The hillslopes were defined as the transition zones between the lowlands and the uplands with the slope value >10° determined by a natural break [66]. The gallery forest pixels on imagery were removed before analysis (Figure 2). The continuous canopy nitrogen maps (Figure 3a–d) were retrieved from hyperspectral imaging statistically. The empirical models used for retrieving canopy nitrogen content were developed (n = 108, R2 = 0.86) and validated (n = 54, R2 = 0.92, RMSE = 0.24 g/m2) by 162 field sample measurements collected from May to September from three bison-grazed watersheds (N1B, N4D, and N20B) with different fire frequencies (1 year, 4 years, and 20 years). These field samples characterized a variety of canopy structures and plant species compositions affected by fire and grazing treatments over seasons. The estimated canopy nitrogen content reflected the combined information of the green vegetation amount (the leaf area index) and the leaf-level nitrogen concentration, while the nitrogen in the dead materials was not included in analysis [57]. The categorical canopy nitrogen maps (Figure 3e–h) were derived from the continuous maps by classifying the numerical canopy nitrogen values into five groups from low to high levels using natural breaks in ArcGIS (Environmental Systems Research Institute, Inc., Redlands, CA, USA).
2.3. Data Analysis
2.3.1. Watershed-Level Descriptive Statistics and Spatial Heterogeneity Metrics
Based on the continuous canopy nitrogen imagery, the mean and standard deviation of canopy nitrogen were calculated for the zones defined by the topographic types in each watershed. On the categorical canopy nitrogen maps, the spatial heterogeneity for each topographic type in a watershed was analyzed using the FRAGSTATS program [67], in which the spatial heterogeneity metrics including the contagion index, Simpson’s diversity index, and the interspersion/juxtaposition index (IJI) were calculated (Table 1). Contagion and Simpson’s diversity indices were calculated for all the patch types with five canopy nitrogen classes from low to high levels. The IJI was calculated for the high-nitrogen patches. The calculated canopy nitrogen properties were then compared among the fire and grazing treatments across topographic positions and seasons.
To study the effects of fire separately, the data for the ungrazed watersheds were gathered. The fire treatments were classified into two levels, including the fire intervals within one year (burned in spring) and those greater than one year (unburned in spring of the current year). The differences in the canopy nitrogen properties between the two fire interval levels were analyzed using the two-sample t-test. For the combined treatments of fire and grazing, the data for different topographic divisions were analyzed separately. Factorial analysis of variance (ANOVA) was used to examine the presence of interactions of fire and ungulate grazing effects on canopy nitrogen properties. If an interaction occurred, the two-sample t-test was used to compare the differences in canopy nitrogen properties between sites with grazing and non-grazing treatments for each of the two fire interval levels in the post-hoc tests. In addition, within the watersheds burned in spring, the canopy nitrogen properties between sites with bison and cattle were compared using two-sample t-tests at a significance level of 0.05 to reveal differences in grassland spatial heterogeneity in watersheds with different grazing histories.
2.3.2. Variograms for Different Fire and Grazing Treatments
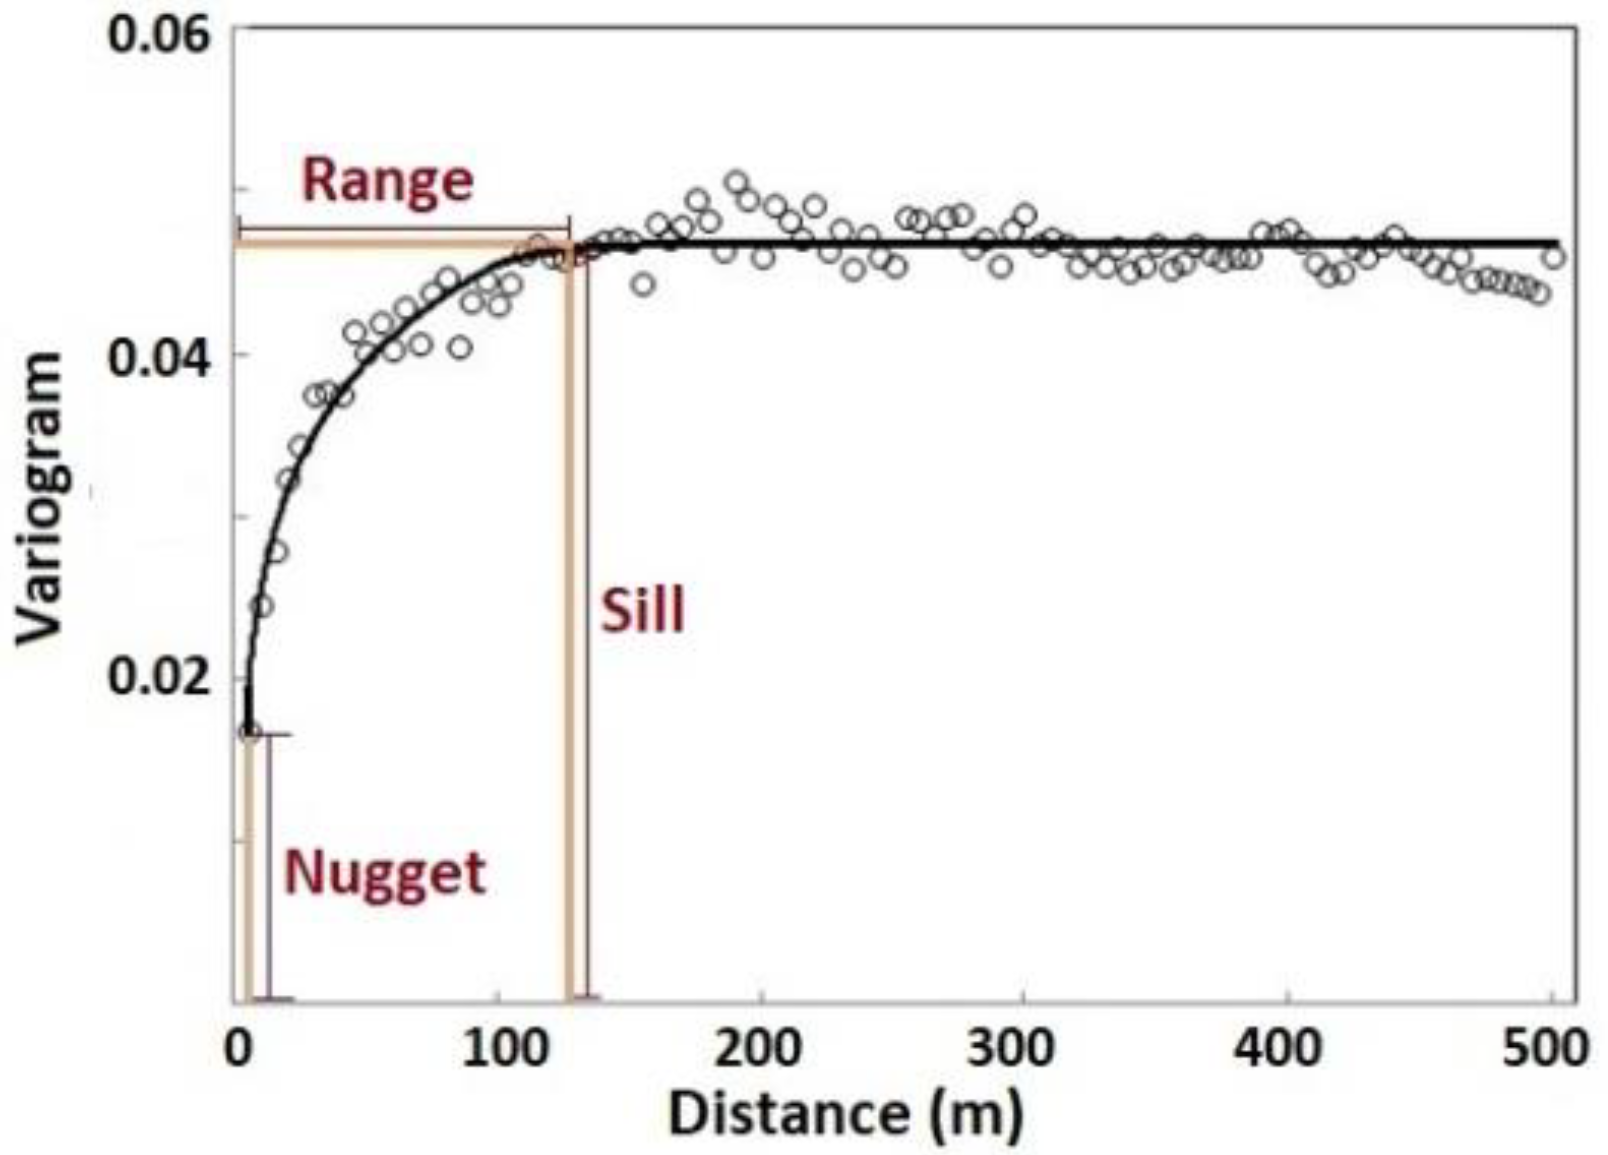
Variogram analysis was used to determine the spatial structure of the continuous canopy nitrogen data. Theoretically, a variogram levels off after a certain distance (Figure 4). This distance is called the range, within which the samples are spatially autocorrelated. The value of the variogram at the range is called the sill. The nugget is the height of the variogram at the zero separation distance, which represents the measurement errors or the variation at a distance smaller than the sampling interval. The combination of the sill and range indicates the separation distance in which the spatial variability of the characteristic is noted. The range provides insight into the spatial scale of the sampled characteristic; the sill and variance proportion (variance proportion = (sill − nugget) / sill) indicate the contrast of the characteristic [52,68]. In our study, the range reflected the vegetation patch size within which the canopy nitrogen was homogeneous and varied in a small range. The sill reflected the variance of the canopy nitrogen among vegetation patches that were not spatially autocorrelated.
Variogram analysis is sensitive to the direction, whereas the topographic divisions of this study manifested highly anisotropic patterns. To reduce the effects from the topographic complexity, zones with different topographic types were analyzed separately. For each topographic division in a watershed, three patches, each enveloped by a convex hull, were randomly selected. The patch size allowed a variogram analysis at a scale of 2–50 m. All the pixels in the selected patch were included in analysis. Results of the patches with the same treatment of fire and ungulate grazing were pooled and averaged. Ranges and sills of the variograms were examined and compared among different fire and grazing treatments [69].
3. Results
3.1. Fire Effects on Canopy Nitrogen in Ungrazed Watersheds
Canopy nitrogen concentrations were higher in the watersheds with shorter fire intervals (Figure 5). This indicated that the spring fires promoted plant productivity and forage quality; the fire stimulus to plant growth was most evident in the first year following the burn. Differences associated with the topographic positions were not evident in May, June, or September (Figure 5a,b,d), while in August, drainage bottoms supported more canopy nitrogen content than upland locations (Figure 5c). In September, there was no apparent tendency observed in the variation of canopy nitrogen related to the fire intervals or topography.
Factorial ANOVA showed that the interactive effects of fire intervals and topography were seldom present on the canopy nitrogen properties (Table 2). This result suggested the independence of the two factors, namely fire intervals and topography, in affecting the spatial heterogeneity of canopy nitrogen in most cases.
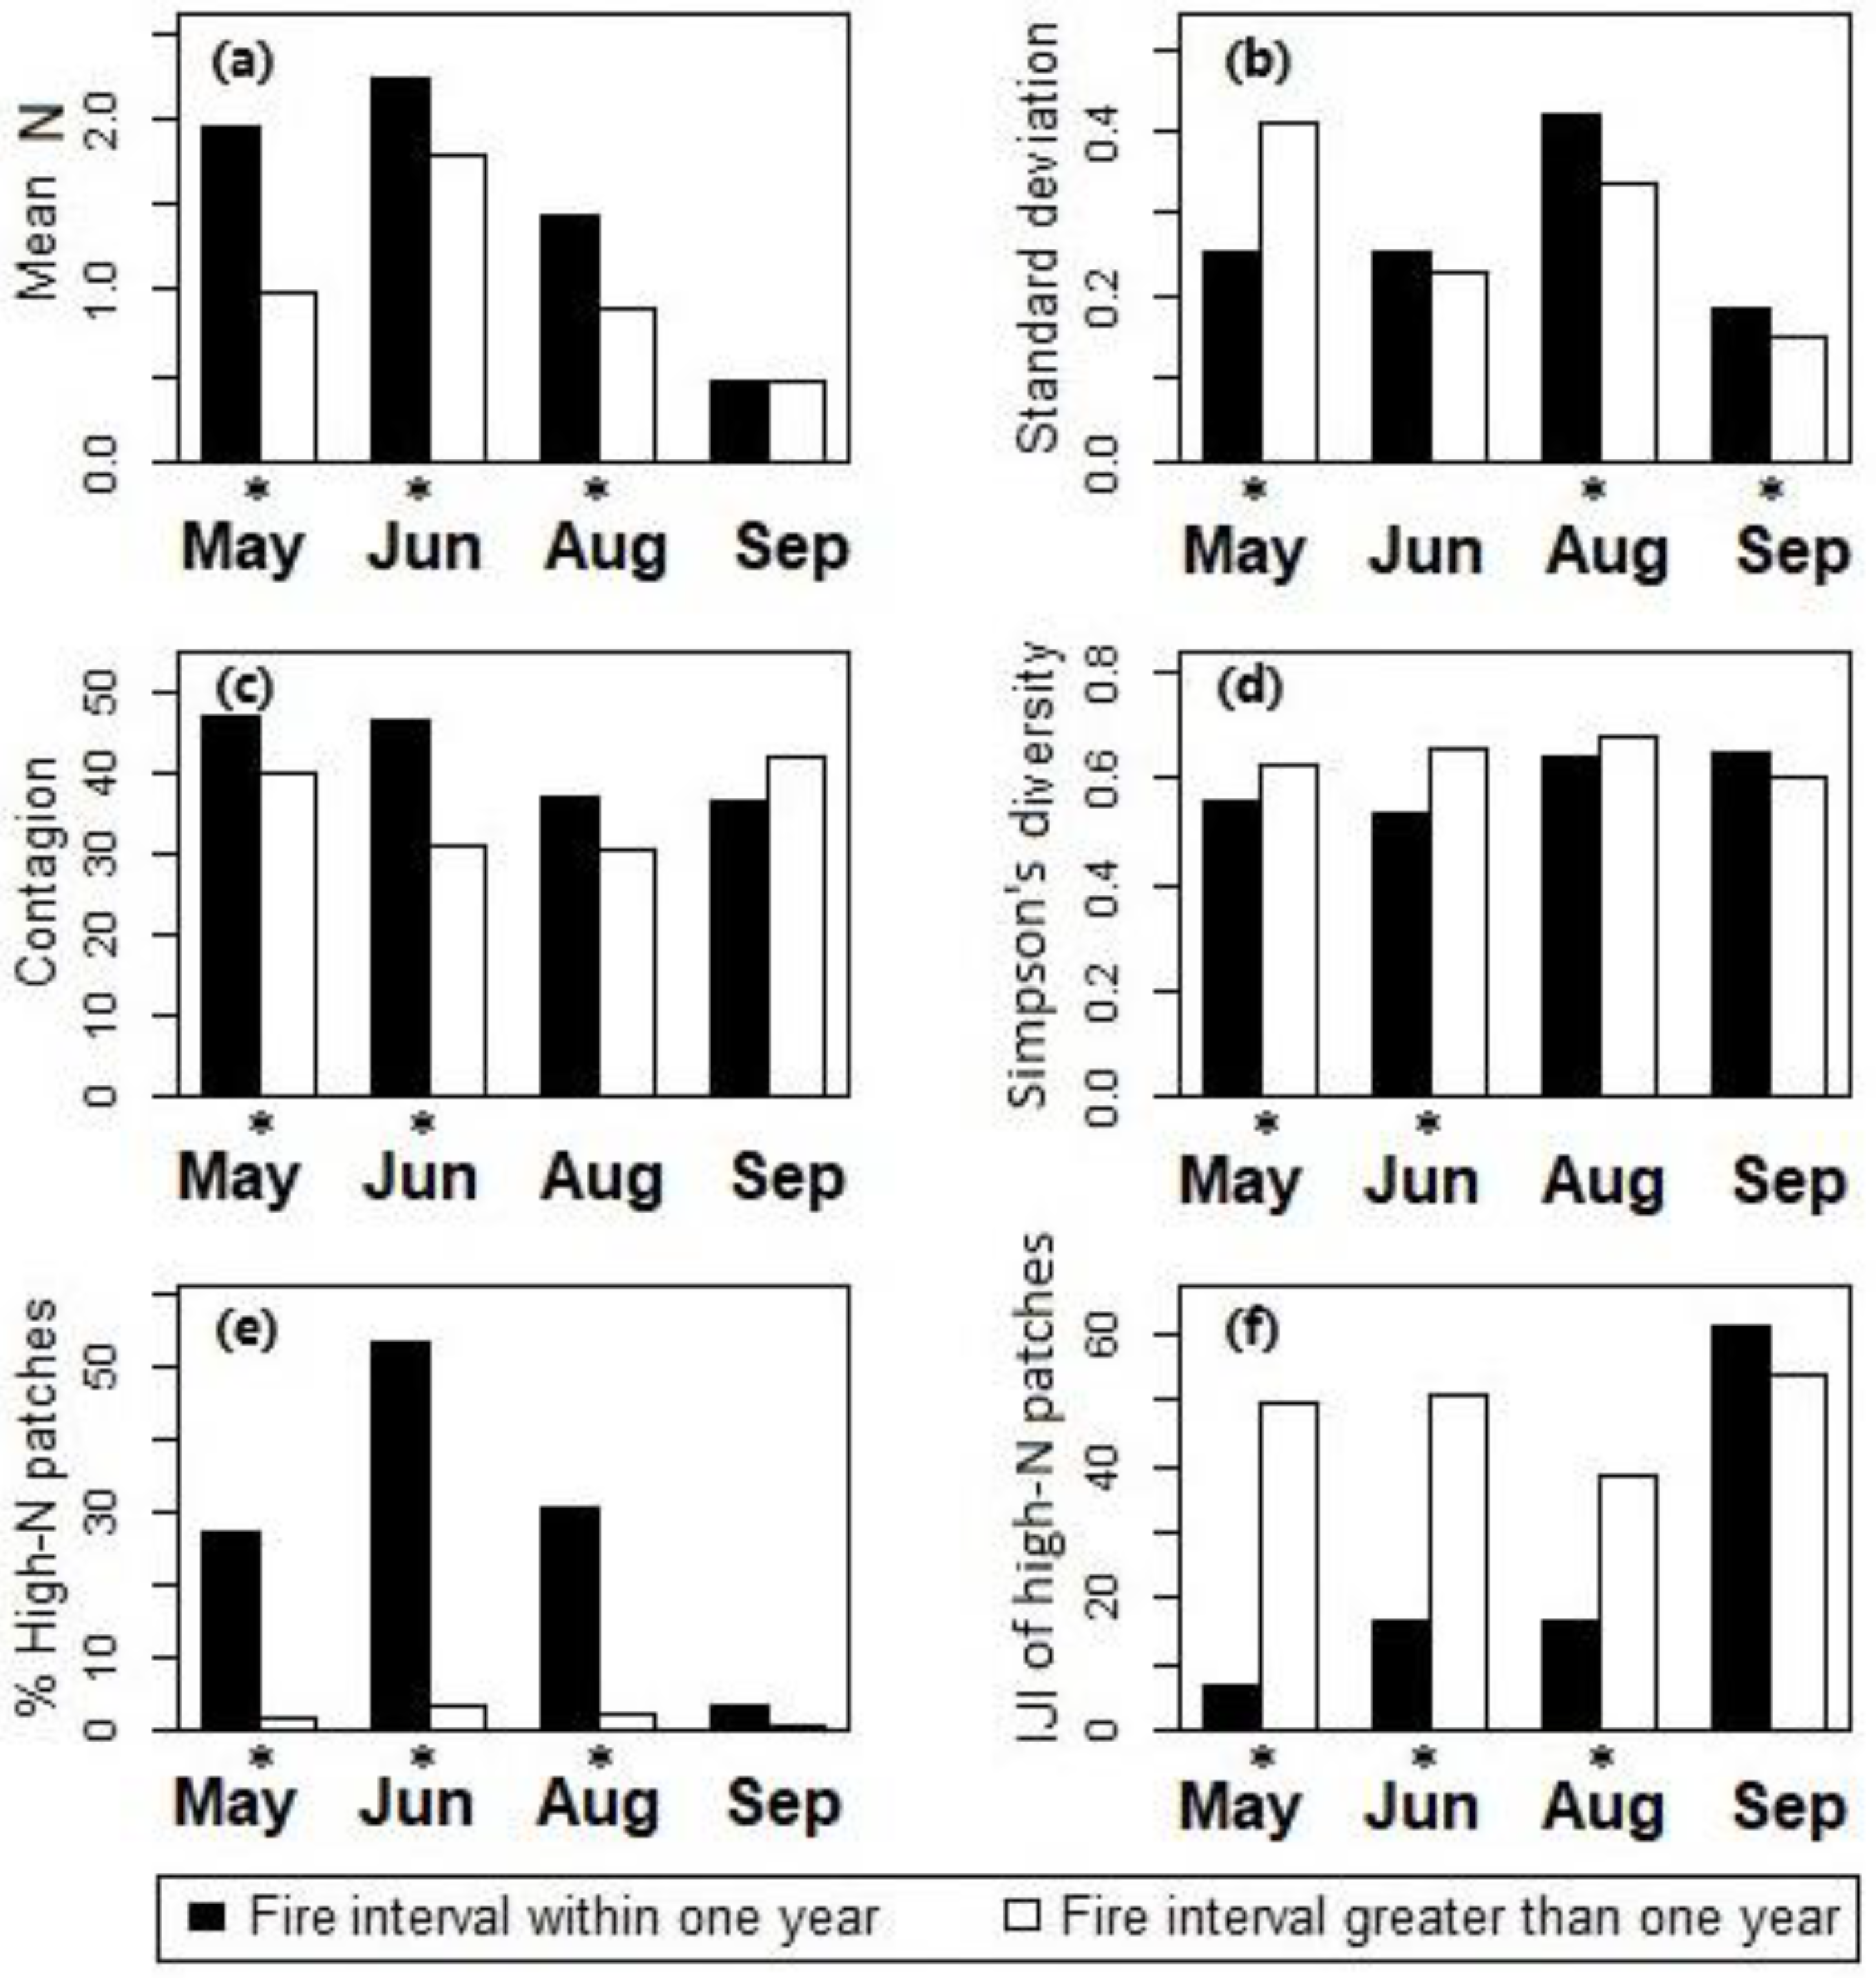
Effects of fire intervals on the canopy nitrogen properties were then examined using the two-sample t-tests for differences between sites with the two different fire interval levels (burned vs. not burned in spring of the current year). Results showed that during May–August the watersheds burned in spring (with fire intervals ≤ 1 yr) had higher canopy nitrogen concentrations than the unburned watersheds (with fire intervals > 1 yr, see Figure 6a); the high-nitrogen patches had higher proportions (Figure 6e) and lower levels of spatial interspersion (Figure 6f) in the burned watersheds than in the unburned watersheds. In September, differences between the burned and unburned watersheds were insignificant in the mean of canopy nitrogen concentrations (Figure 6a) and the distribution of the high-nitrogen patches (Figure 6f).
The standard deviation of canopy nitrogen content (Figure 6b) was significantly lower in the burned watersheds than the unburned watersheds in May, which indicated a relative uniformity of canopies shortly after the fire treatments. The difference in canopy nitrogen standard deviation between burned and unburned sites became insignificant as the canopy matured in June. Canopy nitrogen standard deviation in burned watersheds became significantly higher than in unburned watersheds in August–September. Differences in contagion (Figure 6c) and Simpson’s diversity (Figure 6d) between the burned and unburned sites were statistically significant in May–June. The burned sites had higher contagion and lower diversity among the patch types than the unburned sites.
One-way ANOVA across various topographic positions showed that differences in canopy nitrogen were not statistically significant during May–August, whereas differences in the mean of canopy nitrogen concentrations and the IJI of the high-nitrogen patches were present in September (Figure 7). Tukey’s honest significant difference (HSD) post-hoc test for the data in September showed that the mean of canopy nitrogen concentrations in the drainage bottoms was higher than that in the uplands (difference = 0.177, p-adj = 0.023); the IJI of the high-nitrogen patches in the drainage bottoms was significantly lower than that in the uplands and hillslopes (difference between drainage bottoms and uplands = −30.789, p-adj = 0.042; difference between drainage bottoms and hillslopes = −31.166, p-adj = 0.029).
3.2. Interactive Effects of Fire and Large Herbivores
Results from factorial ANOVA showed that the interactive effects of fire and ungulate grazing on the mean of canopy nitrogen concentrations and the IJI of the high-nitrogen patches were present in all of the three types of topographic positions (i.e., drainage bottoms, lowlands, and hillslopes) during May–August. In September, the interactive effects were seldom present (Table 3).
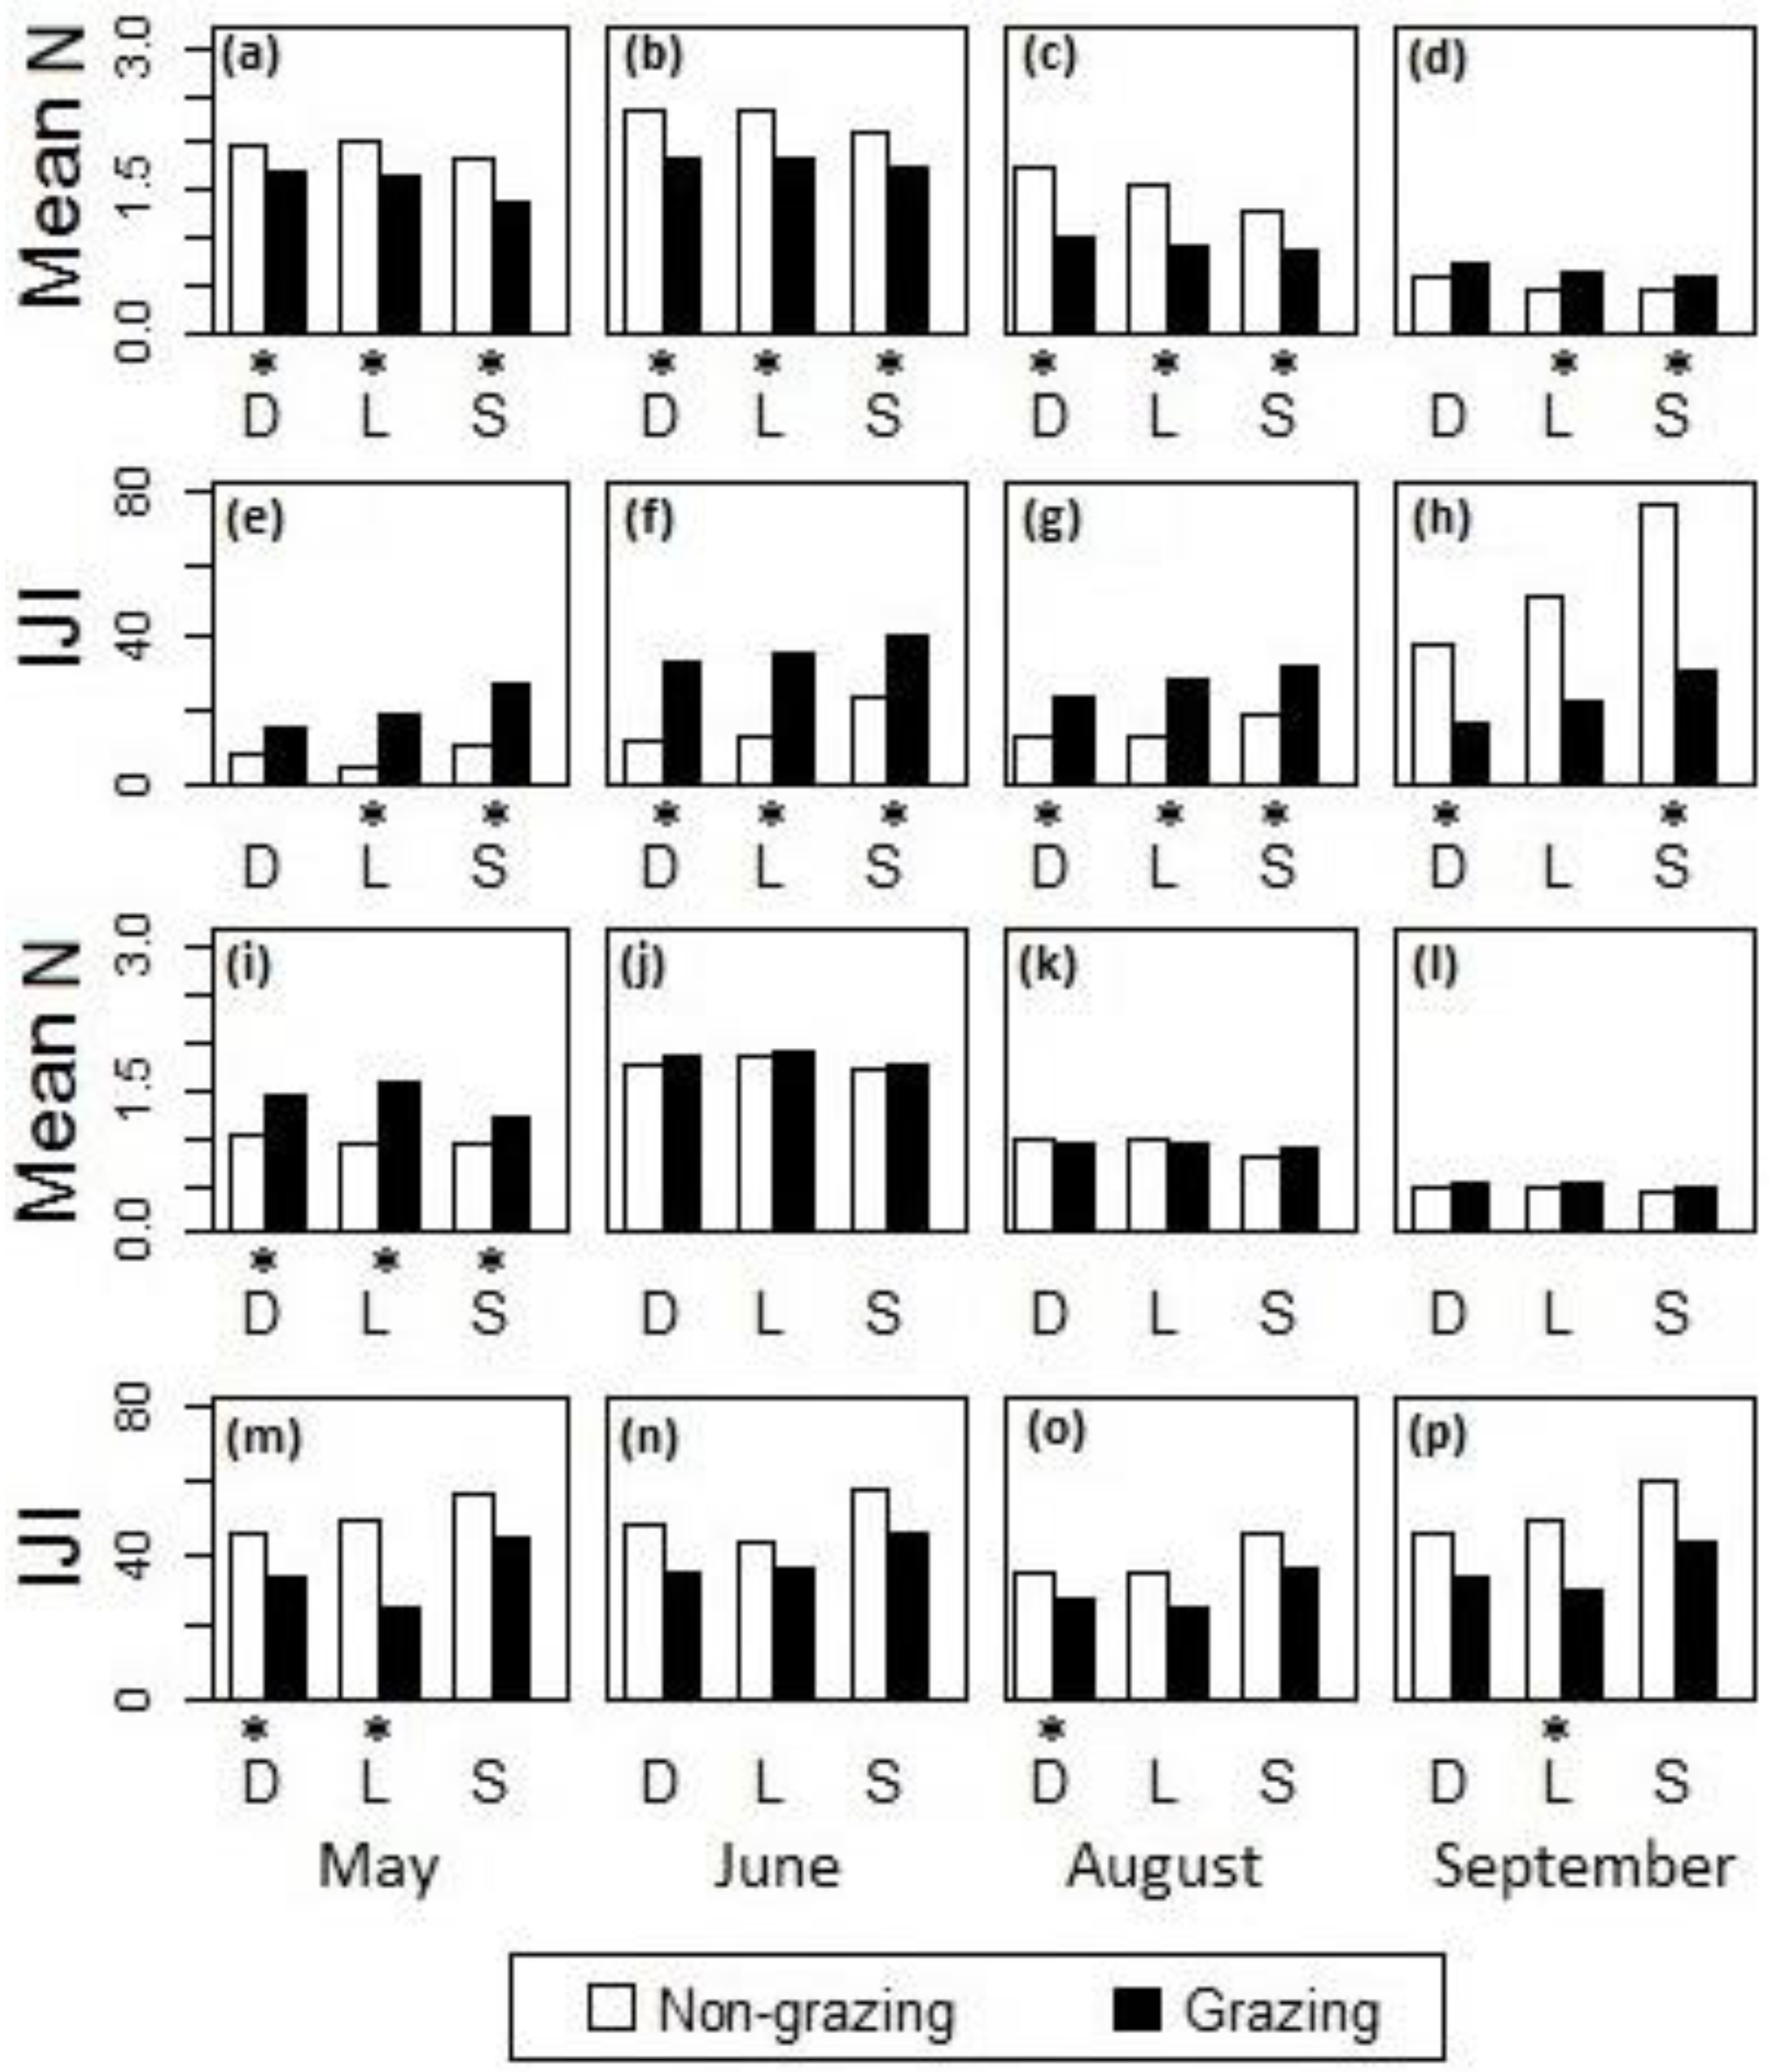
Post-hoc analysis showed that during May–August the grazed watersheds had generally lower canopy nitrogen concentrations (Figure 8a–c) and a higher IJI of the high-nitrogen patches (Figure 8e–g) than the ungrazed watersheds when the fire intervals were within one year; in September, however, lower nitrogen concentrations (Figure 8d) and a higher IJI of the high-nitrogen patches (Figure 8h) were observed in the ungrazed watersheds. When the fire intervals were greater than one year (Figure 8i–p), the differences between grazed and ungrazed watersheds were generally insignificant during June–September. However, at the beginning of the growing season in May, the grazed watersheds had generally higher nitrogen concentrations (Figure 8i) and a lower IJI of the high-nitrogen patches (Figure 8m) than the ungrazed watersheds. The lack of contrast in canopy nitrogen between grazed and ungrazed sites with fire intervals greater than one year suggested a less influential effect of the grazing disturbance.
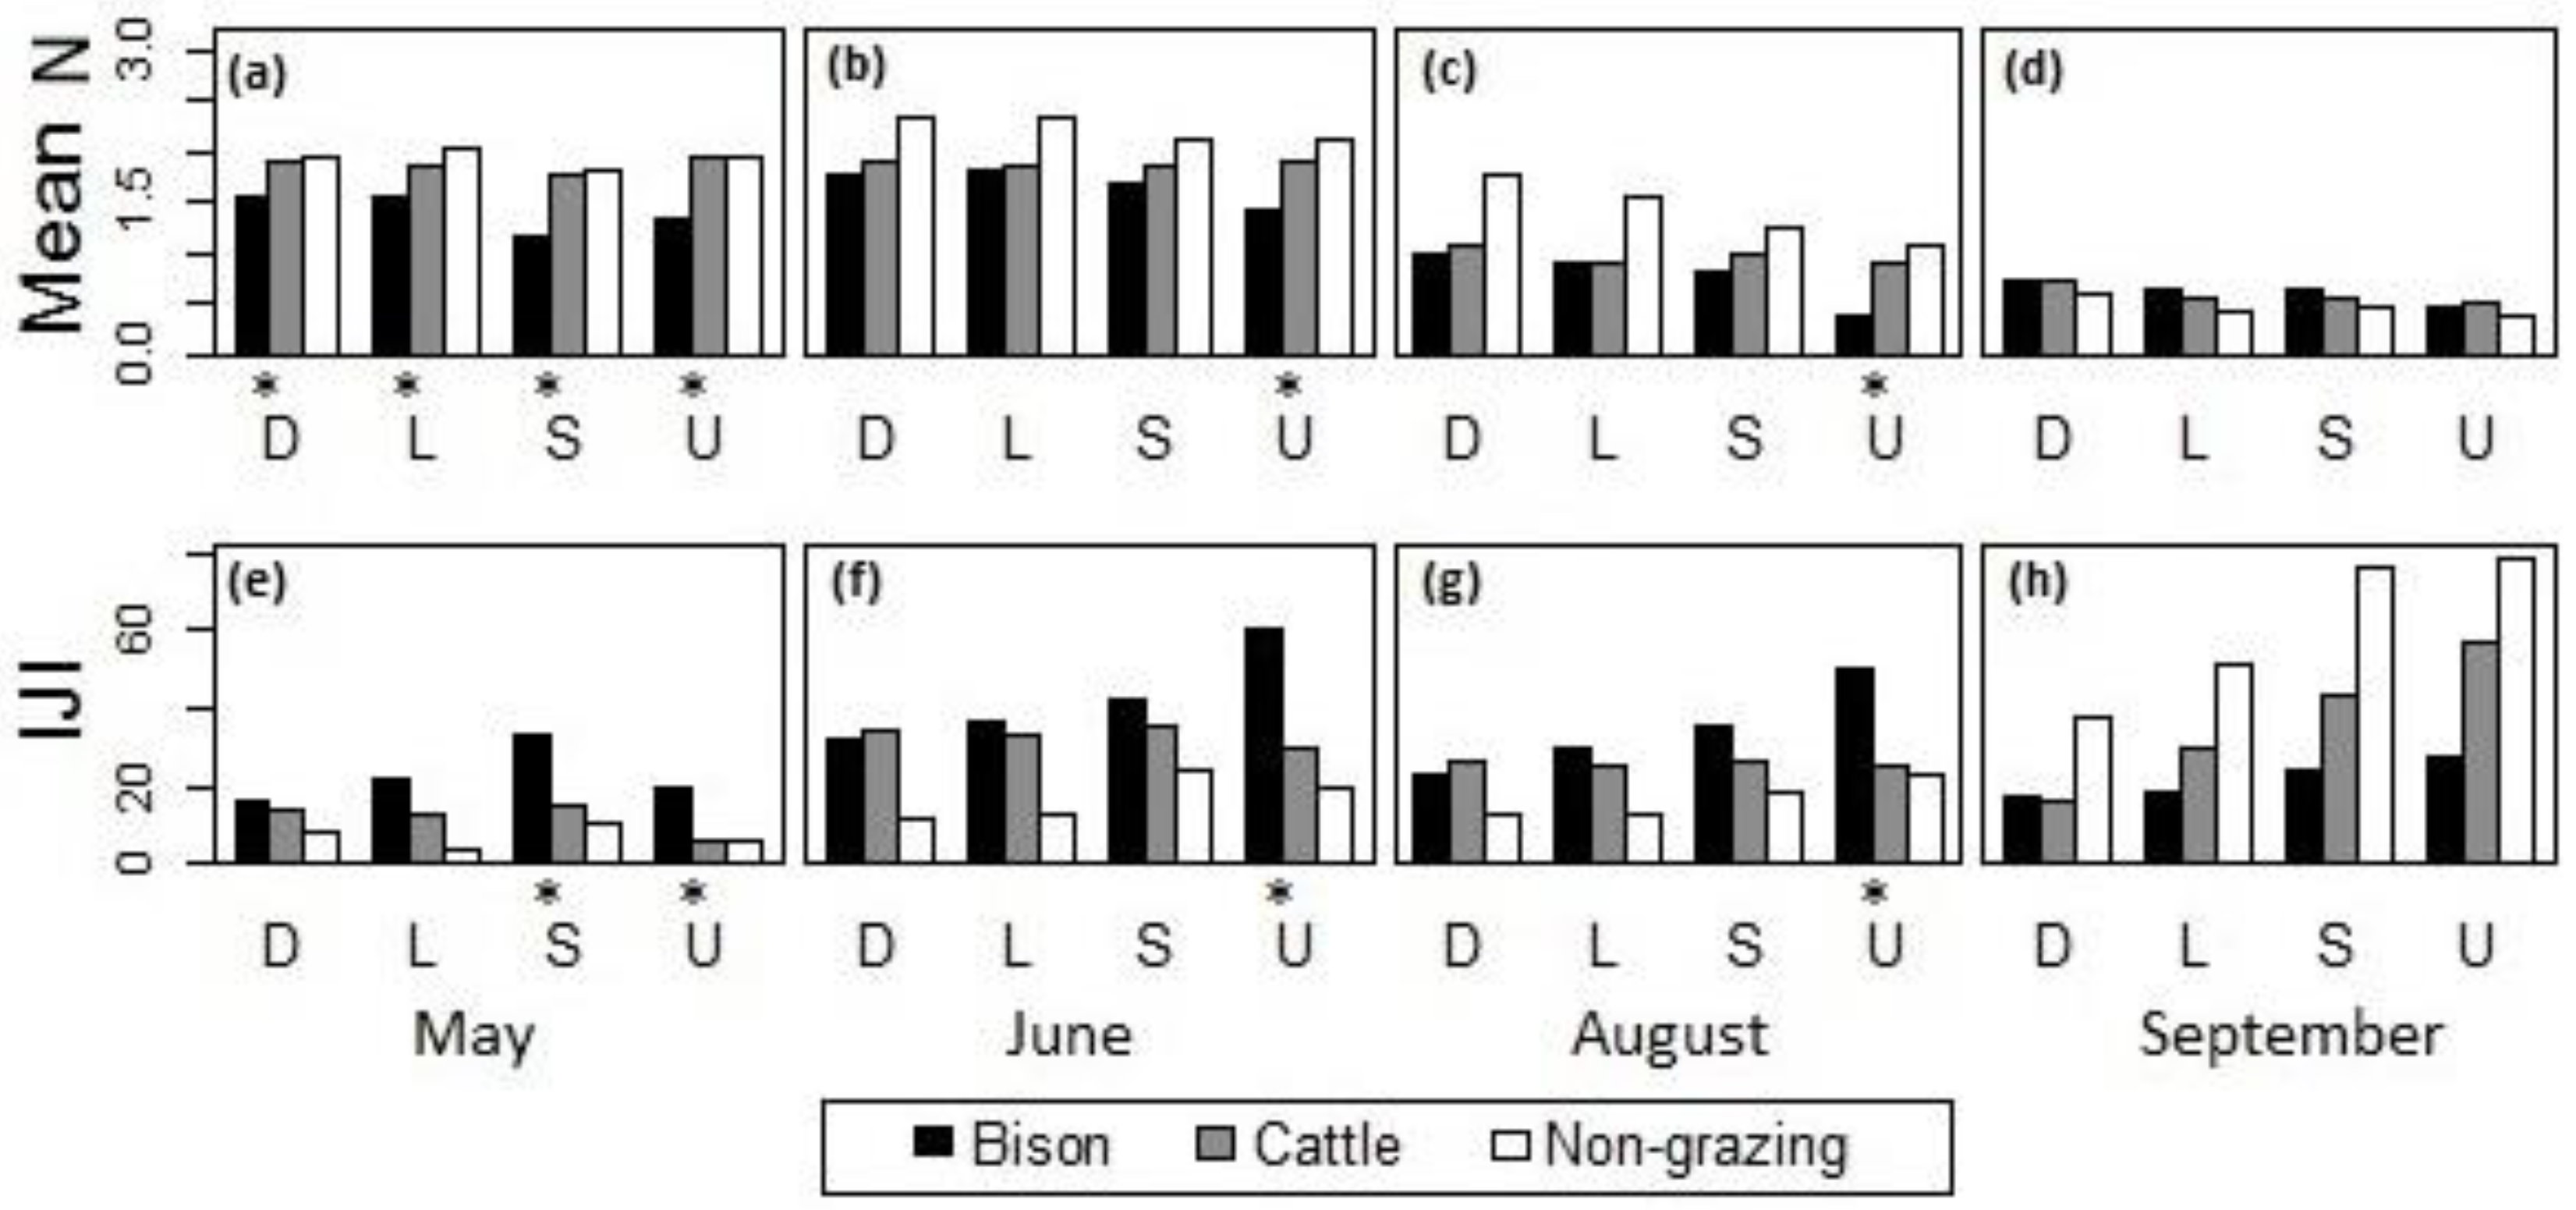
Within the burned watersheds, where the grassland canopies were evidently influenced by ungulate grazing disturbances, the canopy nitrogen properties with bison and cattle grazing were compared (Figure 9). In May, bison-grazed watersheds had significantly lower canopy nitrogen concentrations (Figure 9a) and more interspersed high-nitrogen patches (Figure 9e) than the cattle-grazed watersheds, whereas the cattle-grazed watersheds were not significantly different from the ungrazed watersheds. During June–August (Figure 9b,c,f,g), bison and cattle grazing did not differentially affect canopy nitrogen content or patchiness with the exception of the uplands, where cattle grazing had a less evident influence on the grassland canopy than year-long grazing by bison. In September, there was no significant difference detected across different topographic positions.
3.3. Spatial Structure of Canopy Nitrogen Distrubtion
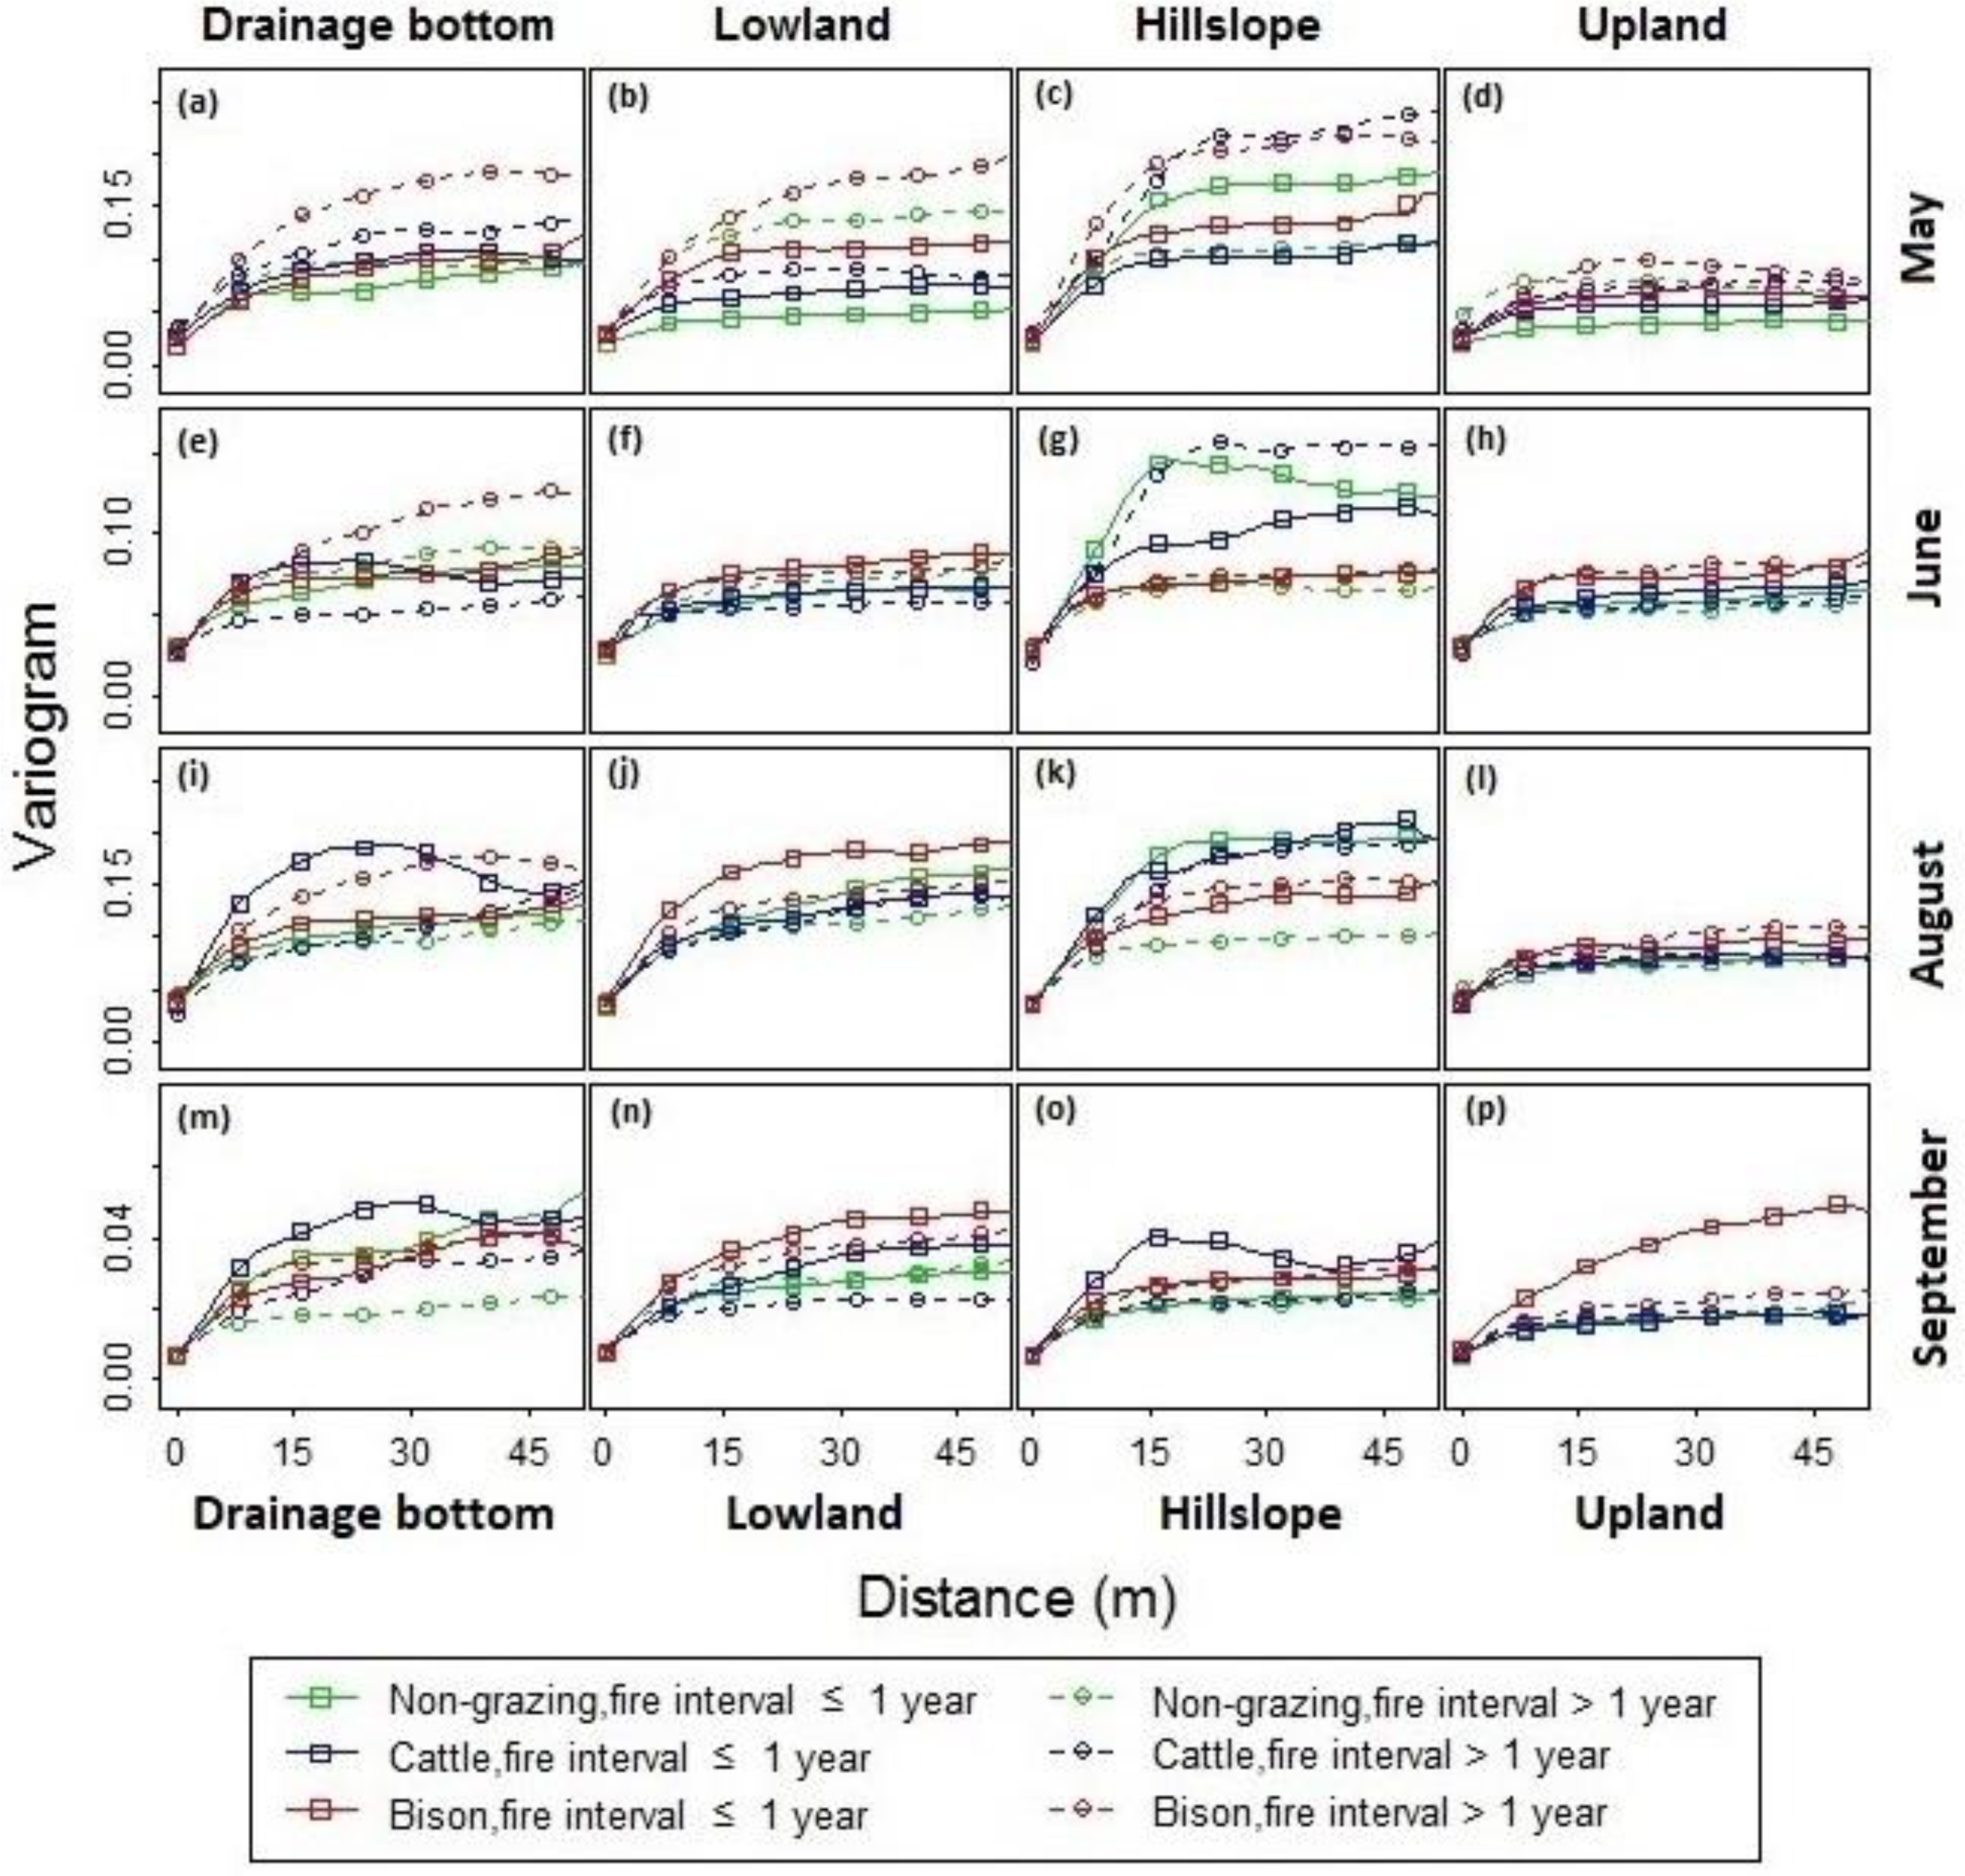
Results from the variogram analysis (Figure 10) revealed distinctive spatial structures of the canopy nitrogen across seasons. Generally, the sills were at higher levels in May (Figure 10a–d) and August (Figure 10i–l), and dropped to lower levels in June (Figure 10e–h) and September (Figure 10m–p). Differences in the variograms across topographic positions were evident. The sills were typically high in the hillslopes (Figure 10c,g,k,o) and low in the uplands (Figure 10d,h,l,p). The ranges were generally greater in the drainage bottoms (Figure 10a,e,i,m) and lowlands (Figure 10b,f,j,n) than in the hillslopes and uplands. There was a steeper, faster rising shape of the variograms for the hillslopes, whereas the variogram curves for the lowlands were gently rising at a longer distance before leveling off. This result suggested a greater contrast in the canopy nitrogen and a smaller patch size at the hillslope sites than at the lowland sites. The disparity in terms of different fire and ungulate grazing treatments was most evident at the lowland sites in May (Figure 10b), where the sill and range were relatively high in the unburned watersheds (with fire intervals >1 yr) compared to that in the burned watersheds (with fire intervals ≤ 1 yr).
For the lowlands (Figure 10b,f,j,n) and uplands (Figure 10d,h,l,p) burned within one year, the variograms were approximated using spherical models [68], through which the nugget, sill, and range were determined (Table 4). The sills and variance proportions were noticeably high for the bison-grazing treatments across seasons and topographic positions. This indicated that more heterogeneous canopy occurred in bison-grazed watersheds, leading to greater canopy nitrogen variance than the cattle-grazed and ungrazed watersheds.
The sills and variance proportions for the cattle-grazed sites were greater than that for the ungrazed sites in May (Figure 10b,d and Table 4). During June–August, the difference associated with topographic positions was observed. In the lowlands (Figure 10f,j and Table 4), the cattle-grazing sites had lower sills and variance proportions than the ungrazed sites, whereas in the uplands (Figure 10h,l and Table 4), the cattle-grazed sites had higher sills and variance proportions than the ungrazed sites. In September, the difference between cattle-grazing and non-grazing treatments was more evident in the lowland than in the uplands (Figure 10n,p and Table 4).
It was found that the ranges for the lowlands (Figure 10b,f,j and Table 4) were greater than those for the uplands (Figure 10d,h,l and Table 4) across different grazing treatments during May–August. The ranges for the grazed sites were generally lower than that for the ungrazed sites across topographic positions during June–August (Table 4).
4. Discussion
4.1. Fire, Ungulate Grazing, and Vegetation Canopy
In this study, we found that during the growing season from May to August, the watersheds burned in spring apparently had high canopy nitrogen concentrations of herbaceous vegetation and large proportions of high-nitrogen patches. At the start of the growing season, significantly higher contagion and lower diversity indices at the sites with shorter fire intervals suggested that the canopy nitrogen patches were more aggregated with uneven proportional distributions in the more recently burned watersheds. It can be implied that (i) the spring fires had an immediate effect on the plant species composition in the canopy, which decreased the plant species diversity dramatically and led to large uniform patches; (ii) the fire stimulus on the plant growth was most evident within the first year following the burn and in decay shortly thereafter as the plant species diversity increased and the system approached equilibrium [15,53]. As for the role of fire as a component in the nitrogen cycling of a grassland system, a large amount of nitrogen within grassland is in fact removed by fire and released in the atmosphere [70,71]. Although burning can volatilize nitrogen [72], no significant declines in total soil nitrogen stocks have been reported from annual burning at Konza Prairie [10]. The greater canopy nitrogen concentrations of herbaceous vegetation in recently burned watersheds than in unburned watersheds observed in our study are a reflection of the fire stimulus to plant growth, which is transient as the fire stimulus weakens.
In addition, our results from the ungrazed watersheds suggested that the influences of topography on the vegetation canopies were most evident in the senescent season and less so in the early growing season. The timing of senescence in the drainage bottoms was potentially later than that in the uplands due to the different conditions of soil moisture, depth, and temperature found in small-scale plot-based studies [73]. This landscape-level result extends our understanding of topographic heterogeneity in providing vegetation resources at key times of year when high-quality forage resources are limited [74,75].
Fire and grazing are historically important determinants of the structure and functioning of tallgrass prairie, and are widely used practices to manage grasslands [35]. For the first time, we highlight the role of pyric herbivory and seasonality in driving the landscape ecology of aboveground nitrogen distribution in tallgrass prairie vegetation. The interactive effects of fire and ungulate grazing on the canopy nitrogen were observed in May–August, suggesting that grazing effects on the vegetation canopy were dependent on the fire interval in the growing season. The ungulate grazing preference for the new, burned patches in the growing season, referred to as pyric herbivory, has been observed repeatedly in previous studies [29,36]. As the vegetation canopy was senescent overall in September, the interactive effects of fire and ungulate grazing were weakened. It can be implied that the ungulate forage was more evenly distributed and may shift to the unburned areas in the dormant season [75,76].
In the burned watersheds, the canopy nitrogen at the ungrazed sites was significantly higher in May–August but lower in September, compared with that at the grazed sites. The contrast between the growing season and the dormant season suggested that the effects of ungulate grazing on the vegetation canopy varied across seasons. In the watersheds with fire intervals greater than one year, the grazed sites had significantly higher canopy nitrogen than the ungrazed sites in May, contrary to the situation with shorter fire intervals. This result may be associated with grazing intensity. In the early growing season, the higher grazing intensity concentrated at the sites with shorter fire intervals reduced the canopy density, whereas the low level of grazing disturbances at the sites with longer fire intervals improved the vegetation production [22,25].
The role of fire and grazing at different intensities on aboveground canopy nitrogen distribution has not been illustrated through examination of experimental watersheds with long-term disturbance treatments [77]. Here, comparison between watersheds with recent grazing by cattle and watersheds with persistent, long-term grazing by bison showed that the sites with higher grazing pressure (year-round bison grazing from 1992 to 2011) had more interspersed high-nitrogen patches than the sites with more recent (since 2010) and short-term (May–October) cattle grazing in May across different topographic positions. This result was consistent with the variogram analysis, which indicated that the bison-grazed sites had greater grassland resource heterogeneity than the cattle-grazed sites across topographic positions and across the growing season. The differences in the vegetation canopies between sites with bison and cattle may be associated with differences in the time each ungulate species has been present at our study site. Year-round bison grazing for two decades has likely resulted in greater patchiness of high-quality vegetation on the landscape (particularly in upland portions) than the more recent growing-season cattle grazing, which had similar levels of high nitrogen patchiness to ungrazed watersheds (Figure 9e,f).
Variogram analysis and comparison in canopy nitrogen properties across the grazing treatments also showed evidence for the role of ungulate grazing history in relation to topography and grassland phenology. The variogram analysis of the canopy nitrogen distribution at the sites with recent cattle grazing indicated that the cattle preferentially selected the uplands in June–August and potentially shifted to the lowlands in September. Comparison in the canopy nitrogen content and interspersion of the high-nitrogen patches between sites with long-term bison grazing and recent cattle grazing indicated that greater grazing pressure by bison had an even more evident influence on the canopy nitrogen distribution. These findings extended the previous studies of interactions between large herbivores and grassland resource heterogeneity across topographic positions and seasons [45,56,78] from the perspective of the grazing histories. Theoretical work has identified grazing history as a driver of spatial heterogeneity in grassland vegetation [79], but few field experiments have been attempted [80,81]. Here, using a remote sensing approach, for the first time, we quantify canopy nitrogen heterogeneity at the landscape-scale. We feel this approach has much potential in elucidating ecological processes that underpin aboveground grassland structure and function including the interactive effects of fire and ungulate grazing, which have been shown to be driven by canopy nitrogen content [29]. Furthermore, like other grazed landscapes, where compositional shifts in plant communities from one state to another can take decades [82,83], our findings suggest that high landscape-level patchiness of high foliar quality may also require long-term sustained grazing to occur.
4.2. Use of Remote Sensing Imagery
Because collecting appropriate field data is so difficult, research on the development of grazing and vegetation patterns over time has previously relied on simulation models [84]. In this study, we demonstrate that remote sensing provides quantitative and continuous data of the landscape over an extensive area, which aid in our understanding of grassland pattern and process relationships. Results of the variogram analyses from numeric remote sensing imagery at a spatial scale of 2–50 m in our study were comparable with field measurements at a coarse scale of 5–30 m taken by Augustine and Frank [45], who concluded that the influences of ungulate grazers on plant communities were associated with a topographic gradient. The analysis of spatial heterogeneity in our study was limited by the 2 m spatial resolution of the remote sensor.
Analysis of spatial heterogeneity metrics from the categorical maps in our study suggested that the interspersion/juxtaposition index of high-nitrogen content patches can be used to reveal differences in the vegetation resource distribution affected by fire and ungulate grazing factors. Our findings extended the previous study from field measurements by Wallace, Turner, Romme, Oneill, and Wu [46], which compared the distributions of high biomass points at a scale of 2–30 m between burned and unburned sites.
5. Conclusions
Our study analyzed the spatial heterogeneity of grassland canopy nitrogen concentrations over the growing season in relation to the effects from fire, ungulate grazing, topography, and phenology at a coarse watershed scale from remote sensing imagery. Results showed an apparent and transient fire stimulus to grassland plant growth, which resulted in large uniform herbaceous vegetation patches across the growing season. The interactive effects of fire and ungulate herbivores were observed in the watersheds burned in spring, where fire-promoted herbivory reduced the canopy density and increased interspersions of high-nitrogen vegetation patches. Moreover, ungulate grazing effects on the grassland heterogeneity varied with topographic positions and site grazer history. The differences in the spatial distribution of canopy nitrogen concentrations observed across topographic positions and grazing treatments suggested preference for the uplands by the ungulate grazers in the growing season. The differences observed between sites with long-term bison grazing and recent cattle grazing indicated that high intensity bison grazing for decades apparently promoted the patchiness of grassland canopies, which revealed the role of grazer history in establishing grassland resource heterogeneity.
The results of remote sensing imagery in our study are comparable to some analyses from field measurements [45,46]. However, our approach extends previous research on the effects of fire [1,15] and large herbivores [45,56] on grassland heterogeneity across topographic positions [85] by highlighting the role of grazing history in modulating the landscape-level distribution of herbaceous plant quality. The comparison of canopy nitrogen properties and the variogram analysis of canopy nitrogen distribution provided by our study are useful for further mapping grassland canopy features and modeling grassland dynamics involving interplays among fire, large grazers, and vegetation communities.
Author Contributions
Conceptualization: B.L., E.J.R., and D.G.G.; methodology: B.L.; software: B.L.; writing—original draft preparation: B.L. and E.J.R.; writing—review and editing: B.L., D.G.G., E.J.R., and A.J.; supervision: D.G.G. and A.J.; funding acquisition: A.J., D.G.G., and B.L.
Funding
This research was funded by NSF award DEB1020485, NSF award DEB1440484, Kale fellowship and Geography Graduate Research Grant at Department of Geography, Kansas State University. Additional funding was provided by Guangdong University of Technology.
Acknowledgments
Data for Konza Elevation Model and fire records were supported by the NSF Long Term Ecological Research Program at Konza Prairie Biological Station.
Conflicts of Interest
The authors declare no conflict of interest.
References
- Collins, S.L.; Wallace, L.L. Fire in North American Tallgrass Prairies; University of Oklahoma Press: Norman, OK, USA, 1990. [Google Scholar]
- Bowles, M.L.; Jones, M.D. Repeated burning of eastern tallgrass prairie increases richness and diversity, stabilizing late successional vegetation. Ecol. Appl. 2013, 23, 464–478. [Google Scholar] [CrossRef] [PubMed]
- Evans, E.W.; Briggs, J.M.; Finck, E.J.; Gibson, D.J.; James, S.W.; Kaufman, D.W.; Seastedt, T.R. Is fire a disturbance in grasslands? In Proceedings of the Eleventh North American Prairie Conference, Lincoln, NE, USA, 7–11 August 1988; pp. 159–161. [Google Scholar]
- Neary, D.G.; Klopatek, C.C.; DeBano, L.F.; Ffolliott, P.F. Fire effects on belowground sustainability: A review and synthesis. For. Ecol. Manag. 1999, 122, 51–71. [Google Scholar] [CrossRef]
- Abrams, M.D.; Knapp, A.K.; Hulbert, L.C. A ten-year record of aboveground biomass in a Kansas USA tallgrass prairie: Effects of fire and topographic position. Am. J. Bot. 1986, 73, 1509–1515. [Google Scholar] [CrossRef]
- Anderson, T.M.; Ritchie, M.E.; Mayemba, E.; Eby, S.; Grace, J.B.; McNaughton, S.J. Forage nutritive quality in the serengeti ecosystem: The roles of fire and herbivory. Am. Nat. 2007, 170, 343–357. [Google Scholar] [CrossRef] [PubMed]
- Seastedt, T.R.; Knapp, A.K. Consequences of nonequilibrium resource availability across multiple time scales: The transient maxima hypothesis. Am. Nat. 1993, 141, 621–633. [Google Scholar] [CrossRef]
- Hobbs, N.T.; Schimel, D.S.; Owensby, C.E.; Ojima, D.S. Fire and grazing in the tallgrass prairie: Contingent effects on nitrogen budgets. Ecology 1991, 72, 1374–1382. [Google Scholar] [CrossRef]
- Seastedt, T.R.; Ramundo, R.A. The influence of fire on belowground processes of tallgrass prairie. In Fire in North American Tallgrass Prairies; Collins, S.L., Wallace, L.L., Eds.; University of Oklahoma Press: Norman, OK, USA, 1990; pp. 99–117. [Google Scholar]
- Blair, J.M. Fire, N availability, and plant response in grasslands: A test of the transient maxima hypothesis. Ecology 1997, 78, 2359–2368. [Google Scholar] [CrossRef]
- Anderson, R.C. The historic role of fire in the North American grassland. In Fire in North American Tallgrass Prairies; Collins, S.L., Wallace, L.L., Eds.; University of Oklahoma Press: Norman, OK, USA, 1990; pp. 8–18. [Google Scholar]
- Bragg, T.B.; Hulbert, L.C. Woody plant invasion of unburned Kansas bluestem prairie. J. Range Manag. 1976, 29, 19–24. [Google Scholar] [CrossRef]
- Collins, S.L.; Gibson, D.J. Effects of fire on community structure in tallgrass and mixed-grass prairie. In Fire in North American Tallgrass Prairies; Collins, S.L., Wallace, L.L., Eds.; University of Oklahoma Press: Norman, OK, USA, 1990; pp. 81–98. [Google Scholar]
- Svejcar, T.J. Response of Andropogon gerardii to fire in the tallgrass prairie. In Fire in North American Tallgrass Prairies; Collins, S.L., Wallace, L.L., Eds.; University of Oklahoma Press: Norman, OK, USA, 1990; pp. 19–27. [Google Scholar]
- Loucks, O.L. Evolution of diversity, efficiency, and community stability. Am. Zool. 1970, 10, 17–25. [Google Scholar] [CrossRef]
- Anderson, K.L.; Smith, E.F.; Owensby, C. Burning bluestem range. J. Range Manag. 1970, 23, 81–92. [Google Scholar] [CrossRef]
- Archibald, S.; Bond, W.J.; Stock, W.D.; Fairbanks, D.H.K. Shaping the landscape: Fire-grazer interactions in an African savanna. Ecol. Appl. 2005, 15, 96–109. [Google Scholar] [CrossRef]
- Fuhlendorf, S.D.; Engle, D.M. Restoring heterogeneity on rangelands: Ecosystem management based on evolutionary grazing patterns. Bioscience 2001, 51, 625–632. [Google Scholar] [CrossRef]
- Hickman, K.R.; Hartnett, D.; Cochran, R.C.; Owensby, C. Grazing management effects on plant species diversity in tallgrass prairie. J. Range Manag. 2004, 57, 58–65. [Google Scholar] [CrossRef]
- Belsky, A.J. Does herbivory benefit plants? A review of the evidence. Am. Nat. 1986, 127, 870–892. [Google Scholar] [CrossRef]
- De Mazancourt, C.; Loreau, M.; Abbadie, L. Grazing optimization and nutrient cycling: When do herbivores enhance plant production? Ecology 1998, 79, 2242–2252. [Google Scholar] [CrossRef]
- McNaughton, S.J. Compensatory plant growth as a response to herbivory. Oikos 1983, 40, 329–336. [Google Scholar] [CrossRef]
- Collins, S.L.; Knapp, A.K.; Briggs, J.M.; Blair, J.M.; Steinauer, E.M. Modulation of diversity by grazing and mowing in native tallgrass prairie. Science 1998, 280, 745–747. [Google Scholar] [CrossRef]
- Frank, D.A.; Evans, R.D. Effects of native grazers on grassland N cycling in Yellowstone National Park. Ecology 1997, 78, 2238–2248. [Google Scholar] [CrossRef]
- McNaughton, S.J.; Banyikwa, F.F.; McNaughton, M.M. Promotion of the cycling of diet-enhancing nutrients by African grazers. Science 1997, 278, 1798–1800. [Google Scholar] [CrossRef]
- Wang, X.; Mcconkey, B.G.; Vandenbygaart, A.J.; Fan, J.; Iwaasa, A.; Schellenberg, M. Grazing improves C and N cycling in the Northern Great Plains: A meta-analysis. Sci. Rep. 2016, 6, 33190. [Google Scholar] [CrossRef]
- Derner, J.D.; Briske, D.D.; Boutton, T.W. Does grazing mediate soil carbon and nitrogen accumulation beneath C4, perennial grasses along an environmental gradient? Plant Soil 1997, 191, 147–156. [Google Scholar] [CrossRef]
- Frank, D.A.; Groffman, P.M.; Evans, R.D.; Tracy, B.F. Ungulate stimulation of nitrogen cycling and retention in Yellowstone Park grasslands. Oecologia 2000, 123, 116–121. [Google Scholar] [CrossRef] [PubMed]
- Allred, B.W.; Fuhlendorf, S.D.; Engle, D.M.; Elmore, R.D. Ungulate preference for burned patches reveals strength of fire-grazing interaction. Ecol. Evol. 2011, 1, 132–144. [Google Scholar] [CrossRef] [PubMed]
- Coppedge, B.R.; Shaw, J.H. Bison grazing patterns on seasonally burned tallgrass prairie. J. Range Manag. 1998, 51, 258–264. [Google Scholar] [CrossRef]
- Anderson, R.C. Evolution and origin of the Central Grassland of North America: Climate, fire, and mammalian grazers. J. Torrey Bot. Soc. 2006, 133, 626–647. [Google Scholar] [CrossRef]
- Raynor, E.J.; Joern, A.; Nippert, J.B.; Briggs, J.M. Foraging decisions underlying restricted space use: Effects of fire and forage maturation on large herbivore nutrient uptake. Ecol. Evol. 2016, 6, 5843–5853. [Google Scholar] [CrossRef] [PubMed]
- Strand, E.K.; Launchbaugh, K.L. Livestock grazing effects on fuel loads for wildland fire in sagebrush dominated ecosystems. J. Rangel. Appl. 2014, 1, 35–57. [Google Scholar]
- Starns, H.D.; Fuhlendorf, S.D.; Elmore, R.D.; Twidwell, D.; Thacker, E.T.; Hovick, T.J.; Luttbeg, B. Recoupling fire and grazing reduces wildland fuel loads on rangelands. Ecosphere 2019, 10, e02578. [Google Scholar] [CrossRef]
- Fuhlendorf, S.D.; Engle, D.M. Application of the fire-grazing interaction to restore a shifting mosaic on tallgrass prairie. J. Appl. Ecol. 2004, 41, 604–614. [Google Scholar] [CrossRef]
- Fuhlendorf, S.D.; Engle, D.M.; Kerby, J.; Hamilton, R. Pyric herbivory: Rewilding landscapes through the recoupling of fire and grazing. Conserv. Biol. 2009, 23, 588–598. [Google Scholar] [CrossRef]
- Kohl, M.T.; Krausman, P.R.; Kunkel, K.; Williams, D.M. Bison versus cattle: Are they ecologically synonymous? Rangel. Ecol. Manag. 2013, 66, 721–731. [Google Scholar] [CrossRef]
- Allred, B.W.; Fuhlendorf, S.D.; Hovick, T.J.; Elmore, R.D.; Engle, D.M.; Joern, A. Conservation implications of native and introduced ungulates in a changing climate. Glob. Chang. Biol. 2013, 19, 1875–1883. [Google Scholar] [CrossRef] [PubMed]
- Fuhlendorf, S.D.; Davis, C.A.; Elmore, R.D.; Goodman, L.E.; Hamilton, R.G. Perspectives on grassland conservation efforts: Should we rewild to the past or conserve for the future? Philos. Trans. R. Soc. Lond. B Biol. Sci. 2018, 373, 20170438. [Google Scholar] [CrossRef] [PubMed]
- Tucker, M.A.; Böhning-Gaese, K.; Fagan, W.F.; Fryxell, J.M.; Van Moorter, B.; Alberts, S.C.; Ali, A.H.; Allen, A.M.; Attias, N.; Avgar, T.; et al. Moving in the anthropocene: Global reductions in terrestrial mammalian movements. Science 2018, 359, 466–469. [Google Scholar] [CrossRef] [PubMed]
- Hartnett, D.C.; Hickman, K.R.; Walter, L.E.F. Effects of bison grazing, fire, and topography on floristic diversity in tallgrass prairie. J. Range Manag. 1996, 49, 413–420. [Google Scholar] [CrossRef]
- Fuhlendorf, S.D.; Townsend, D.E.; Elmore, R.D.; Engle, D.M. Pyric-herbivory to promote rangeland heterogeneity: Evidence from small mammal communities. Rangel. Ecol. Manag. 2010, 63, 670–678. [Google Scholar] [CrossRef]
- Collins, S.L.; Smith, M.D. Scale-dependent interaction of fire and grazing on community heterogeneity in tallgrass prairie. Ecology 2006, 87, 2058–2067. [Google Scholar] [CrossRef]
- Koerner, S.E.; Collins, S.L. Interactive effects of grazing, drought, and fire on grassland plant communities in North America and South Africa. Ecology 2014, 95, 98–109. [Google Scholar] [CrossRef] [Green Version]
- Augustine, D.J.; Frank, D.A. Effects of migratory grazers on spatial heterogeneity of soil nitrogen properties in a grassland ecosystem. Ecology 2001, 82, 3149–3162. [Google Scholar] [CrossRef]
- Wallace, L.L.; Turner, M.G.; Romme, W.H.; Oneill, R.V.; Wu, Y.G. Scale of heterogeneity of forage production and winter foraging by elk and bison. Landsc. Ecol. 1995, 10, 75–83. [Google Scholar] [CrossRef]
- Jago, R.A.; Cutler, M.E.J.; Curran, P.J. Estimating canopy chlorophyll concentration from field and airborne spectra. Remote Sens. Environ. 1999, 68, 217–224. [Google Scholar] [CrossRef]
- Kokaly, R.F.; Despain, D.G.; Clark, R.N.; Livo, K.E. Mapping vegetation in Yellowstone National Park using spectral feature analysis of AVIRIS data. Remote Sens. Environ. 2003, 84, 437–456. [Google Scholar] [CrossRef] [Green Version]
- Martin, M.E.; Aber, J.D. High spectral resolution remote sensing of forest canopy lignin, nitrogen, and ecosystem processes. Ecol. Appl. 1997, 7, 431–443. [Google Scholar] [CrossRef]
- Mutanga, O.; Skidmore, A.K.; Kumar, L.; Ferwerda, J. Estimating tropical pasture quality at canopy level using band depth analysis with continuum removal in the visible domain. Int. J. Remote Sens. 2005, 26, 1093–1108. [Google Scholar] [CrossRef]
- Li, H.B.; Reynolds, J.F. A simulation experiment to quantify spatial heterogeneity in categorical maps. Ecology 1994, 75, 2446–2455. [Google Scholar] [CrossRef]
- Curran, P.J. The semivariogram in remote sensing: An introduction. Remote Sens. Environ. 1988, 24, 493–507. [Google Scholar] [CrossRef]
- Koerner, S.E. Small-scale patch structure in North American and South African grasslands responds differently to fire and grazing. Landsc. Ecol. 2013, 28, 1293–1306. [Google Scholar] [CrossRef]
- Raynor, E.J.; Joern, A.; Briggs, J.M. Bison foraging responds to fire frequency in nutritionally heterogeneous grassland. Ecology 2015, 96, 1586–1597. [Google Scholar] [CrossRef] [Green Version]
- Raynor, E.J.; Beyer, H.L.; Briggs, J.M.; Joern, A. Complex variation in habitat selection strategies among individuals driven by extrinsic factors. Ecol. Evol. 2017, 7, 1802–1822. [Google Scholar] [CrossRef] [Green Version]
- Allred, B.W.; Fuhlendorf, S.D.; Hamilton, R.G. The role of herbivores in Great Plains conservation: Comparative ecology of bison and cattle. Ecosphere 2011, 2, 1–17. [Google Scholar] [CrossRef]
- Ling, B.; Goodin, D.G.; Mohler, R.L.; Laws, A.N.; Joern, A. Estimating canopy nitrogen content in a heterogeneous grassland with varying fire and grazing treatments: Konza prairie, Kansas, USA. Remote Sens. 2014, 6, 4430–4453. [Google Scholar] [CrossRef]
- Konza Prairie LTER. Available online: http://www2.konza.ksu.edu/ (accessed on 15 March 2019).
- Knapp, A.K.; Blair, J.M.; Briggs, J.M.; Collins, S.L.; Hartnett, D.C.; Johnson, L.C.; Towne, E.G. The keystone role of bison in North American tallgrass prairie. Bioscience 1999, 49, 39–50. [Google Scholar] [CrossRef]
- Briggs, J.M.; Knapp, A.K. Determinents of C3 forb growth and production in a C4 dominated grassland. Plant Ecol. 2001, 152, 93–100. [Google Scholar] [CrossRef]
- Gibson, D.J.; Hulbert, L.C. Effects of fire, topography and year-to-year climatic variation on species composition in tallgrass prairie. Vegetatio 1987, 72, 175–185. [Google Scholar] [CrossRef]
- Collins, S.L.; Calabrese, L.B. Effects of fire, grazing and topographic variation on vegetation structure in tallgrass prairie. J. Veg. Sci. 2012, 23, 563–575. [Google Scholar] [CrossRef]
- Briggs, J.M.; Blair, J.M.; Horne, E.A. Ecohydrological and climate change studies at the Konza Prairie Biological Station. Trans. Kans. Acad. Sci. 2016, 119, 5–11. [Google Scholar] [CrossRef]
- Grudzinski, B.P.; Daniels, M.D.; Anibas, K.; Spencer, D. Bison and cattle grazing management, bare ground coverage, and links to suspended sediment concentrations in grassland streams. JAWRA J. Am. Water Resour. Assoc. 2016, 52, 16–30. [Google Scholar] [CrossRef]
- Olson, K.C. PBG06 Cattle Grazing and Cattle Performance in the Patch-Burn Grazing Experiment at Konza Prairie. Available online: http://lter.konza.ksu.edu/content/pbg06-cattle-grazing-and-cattle-performance-patch-burn-grazing-experiment-konza-prairie (accessed on 15 March 2019).
- Evans, I.S. The selection of class intervals. Trans. Inst. Br. Geogr. 1977, 2, 98–124. [Google Scholar] [CrossRef]
- McGarigal, K.; Marks, B.J. FRAGSTATS: Spatial Pattern Analysis Program for Quantifying Landscape Structure; US Department of Agriculture, Forest Service, Pacific Northwest Research Station: Portland, OR, USA, 1995; Volume 351.
- Woodcock, C.E.; Strahler, A.H.; Jupp, D.L.B. The use of variograms in remote sensing: I. Scene models and simulated images. Remote Sens. Environ. 1988, 25, 323–348. [Google Scholar] [CrossRef]
- Harris, A.T.; Asner, G.P.; Miller, M.E. Changes in vegetation structure after long-term grazing in pinyon-juniper ecosystems: Integrating imaging spectroscopy and field studies. Ecosystems 2003, 6, 368–383. [Google Scholar] [CrossRef]
- Reich, P.B.; Peterson, D.W.; Wedin, D.A.; Wrage, K. Fire and vegetation effects on productivity and nitrogen cycling across a forest-grassland continuum. Ecology 2001, 82, 1703–1719. [Google Scholar]
- Ojima, D.S.; Schimel, D.S.; Parton, W.J.; Owensby, C.E. Long- and short-term effects of fire on nitrogen cycling in tallgrass prairie. Biogeochemistry 1994, 24, 67–84. [Google Scholar] [CrossRef]
- Manning, G.C.; Baer, S.G.; Blair, J.M. Effects of grazing and fire frequency on floristic quality and its relationship to indicators of soil quality in tallgrass prairie. Environ. Manag. 2017, 60, 1–14. [Google Scholar] [CrossRef] [PubMed]
- Nippert, J.B.; Ocheltree, T.W.; Skibbe, A.M.; Kangas, L.C.; Ham, J.M.; Arnold, K.B.S.; Brunsell, N.A. Linking plant growth responses across topographic gradients in tallgrass prairie. Oecologia 2011, 166, 1131–1142. [Google Scholar] [CrossRef] [PubMed]
- Nippert, J.B.; Culbertson, T.S.F.; Orozco, G.L.; Ocheltree, T.W.; Helliker, B.R. Identifying the water sources consumed by bison: Implications for large mammalian grazers worldwide. Ecosphere 2013, 4, 1–13. [Google Scholar] [CrossRef]
- Raynor, E.J.; Joern, A.; Skibbe, A.; Sowers, M.; Goodin, D. Temporal variability in large grazer space use in an experimental landscape. Ecosphere 2017, 8, e01674. [Google Scholar] [CrossRef]
- Raynor, E.J. Ecological Hierarchy of Foraging in a Large Herbivore: The Plains Bison Perspective in Tallgrass Prairie. Ph.D. Thesis, Kansas State University, Manhattan, KS, USA, 2015. [Google Scholar]
- Venter, Z.S.; Hawkins, H.; Cramer, M.D. Implications of historical interactions between herbivory and fire for rangeland management in African savannas. Ecosphere 2017, 8, e01946. [Google Scholar] [CrossRef]
- Afzal, M.; Adams, W.A. Heterogeneity of soil mineral nitrogen in pasture grazed by cattle. Soil Sci. Soc. Am. J. 1992, 56, 1160–1166. [Google Scholar] [CrossRef]
- Adler, P.B.; Raff, D.A.; Lauenroth, W.K. The effect of grazing on the spatial heterogeneity of vegetation. Oecologia 2001, 128, 465–479. [Google Scholar] [CrossRef] [PubMed]
- Cid, M.S.; Brizuela, M.A. Heterogeneity in tall fescue pastures created and sustained by cattle grazing. J. Range Manag. 1998, 51, 644–649. [Google Scholar] [CrossRef]
- Adler, P.B.; Lauenroth, W.K. Livestock exclusion increases the spatial heterogeneity of vegetation in Colorado shortgrass steppe. Appl. Veg. Sci. 2000, 3, 213–222. [Google Scholar] [CrossRef]
- Fynn, R.W.S.; O’Connor, T.G. Effect of stocking rate and rainfall on rangeland dynamics and cattle performance in a semi-arid savanna, South Africa. J. Appl. Ecol. 2000, 37, 491–507. [Google Scholar] [CrossRef]
- Porensky, L.M.; Derner, J.D.; Augustine, D.J.; Milchunas, D.G. Plant community composition after 75 yr of sustained grazing intensity treatments in shortgrass steppe. Rangel. Ecol. Manag. 2017, 70, 456–464. [Google Scholar] [CrossRef]
- Adler, P.B.; Hall, S.A. The development of forage production and utilization gradients around livestock watering points. Landsc. Ecol. 2005, 20, 319–333. [Google Scholar] [CrossRef]
- Abrams, M.D.; Hulbert, L.C. Effect of topographic position and fire on species composition in tallgrass prairie in northeast Kansas USA. Am. Midl. Nat. 1987, 117, 442–445. [Google Scholar] [CrossRef]
Figure 1.
Study area at Konza Prairie Biological Station (KPBS), Manhattan, Kansas. The site is subjected to a variety of fire-grazing treatments, resulting in spatially variable vegetation canopies. Twenty-one out of in total more than 50 KPBS watersheds (labeled by the watershed names) were selected for analysis in this study, including 8 watersheds without ungulate grazing, 9 watersheds with long-term bison grazing, and 4 watersheds with short-term cattle grazing. In the watershed names, “N” indicates bison grazing treatment, “C” denotes cattle grazing treatment, and all other watersheds are not grazed by large herbivores.

Figure 2.
Topographic divisions of the study area. The hillslopes (slope > 10°) are the transition zones between the flat lowlands and the flat uplands at Konza Prairie, Manhattan, Kansas.
Figure 2.
Topographic divisions of the study area. The hillslopes (slope > 10°) are the transition zones between the flat lowlands and the flat uplands at Konza Prairie, Manhattan, Kansas.
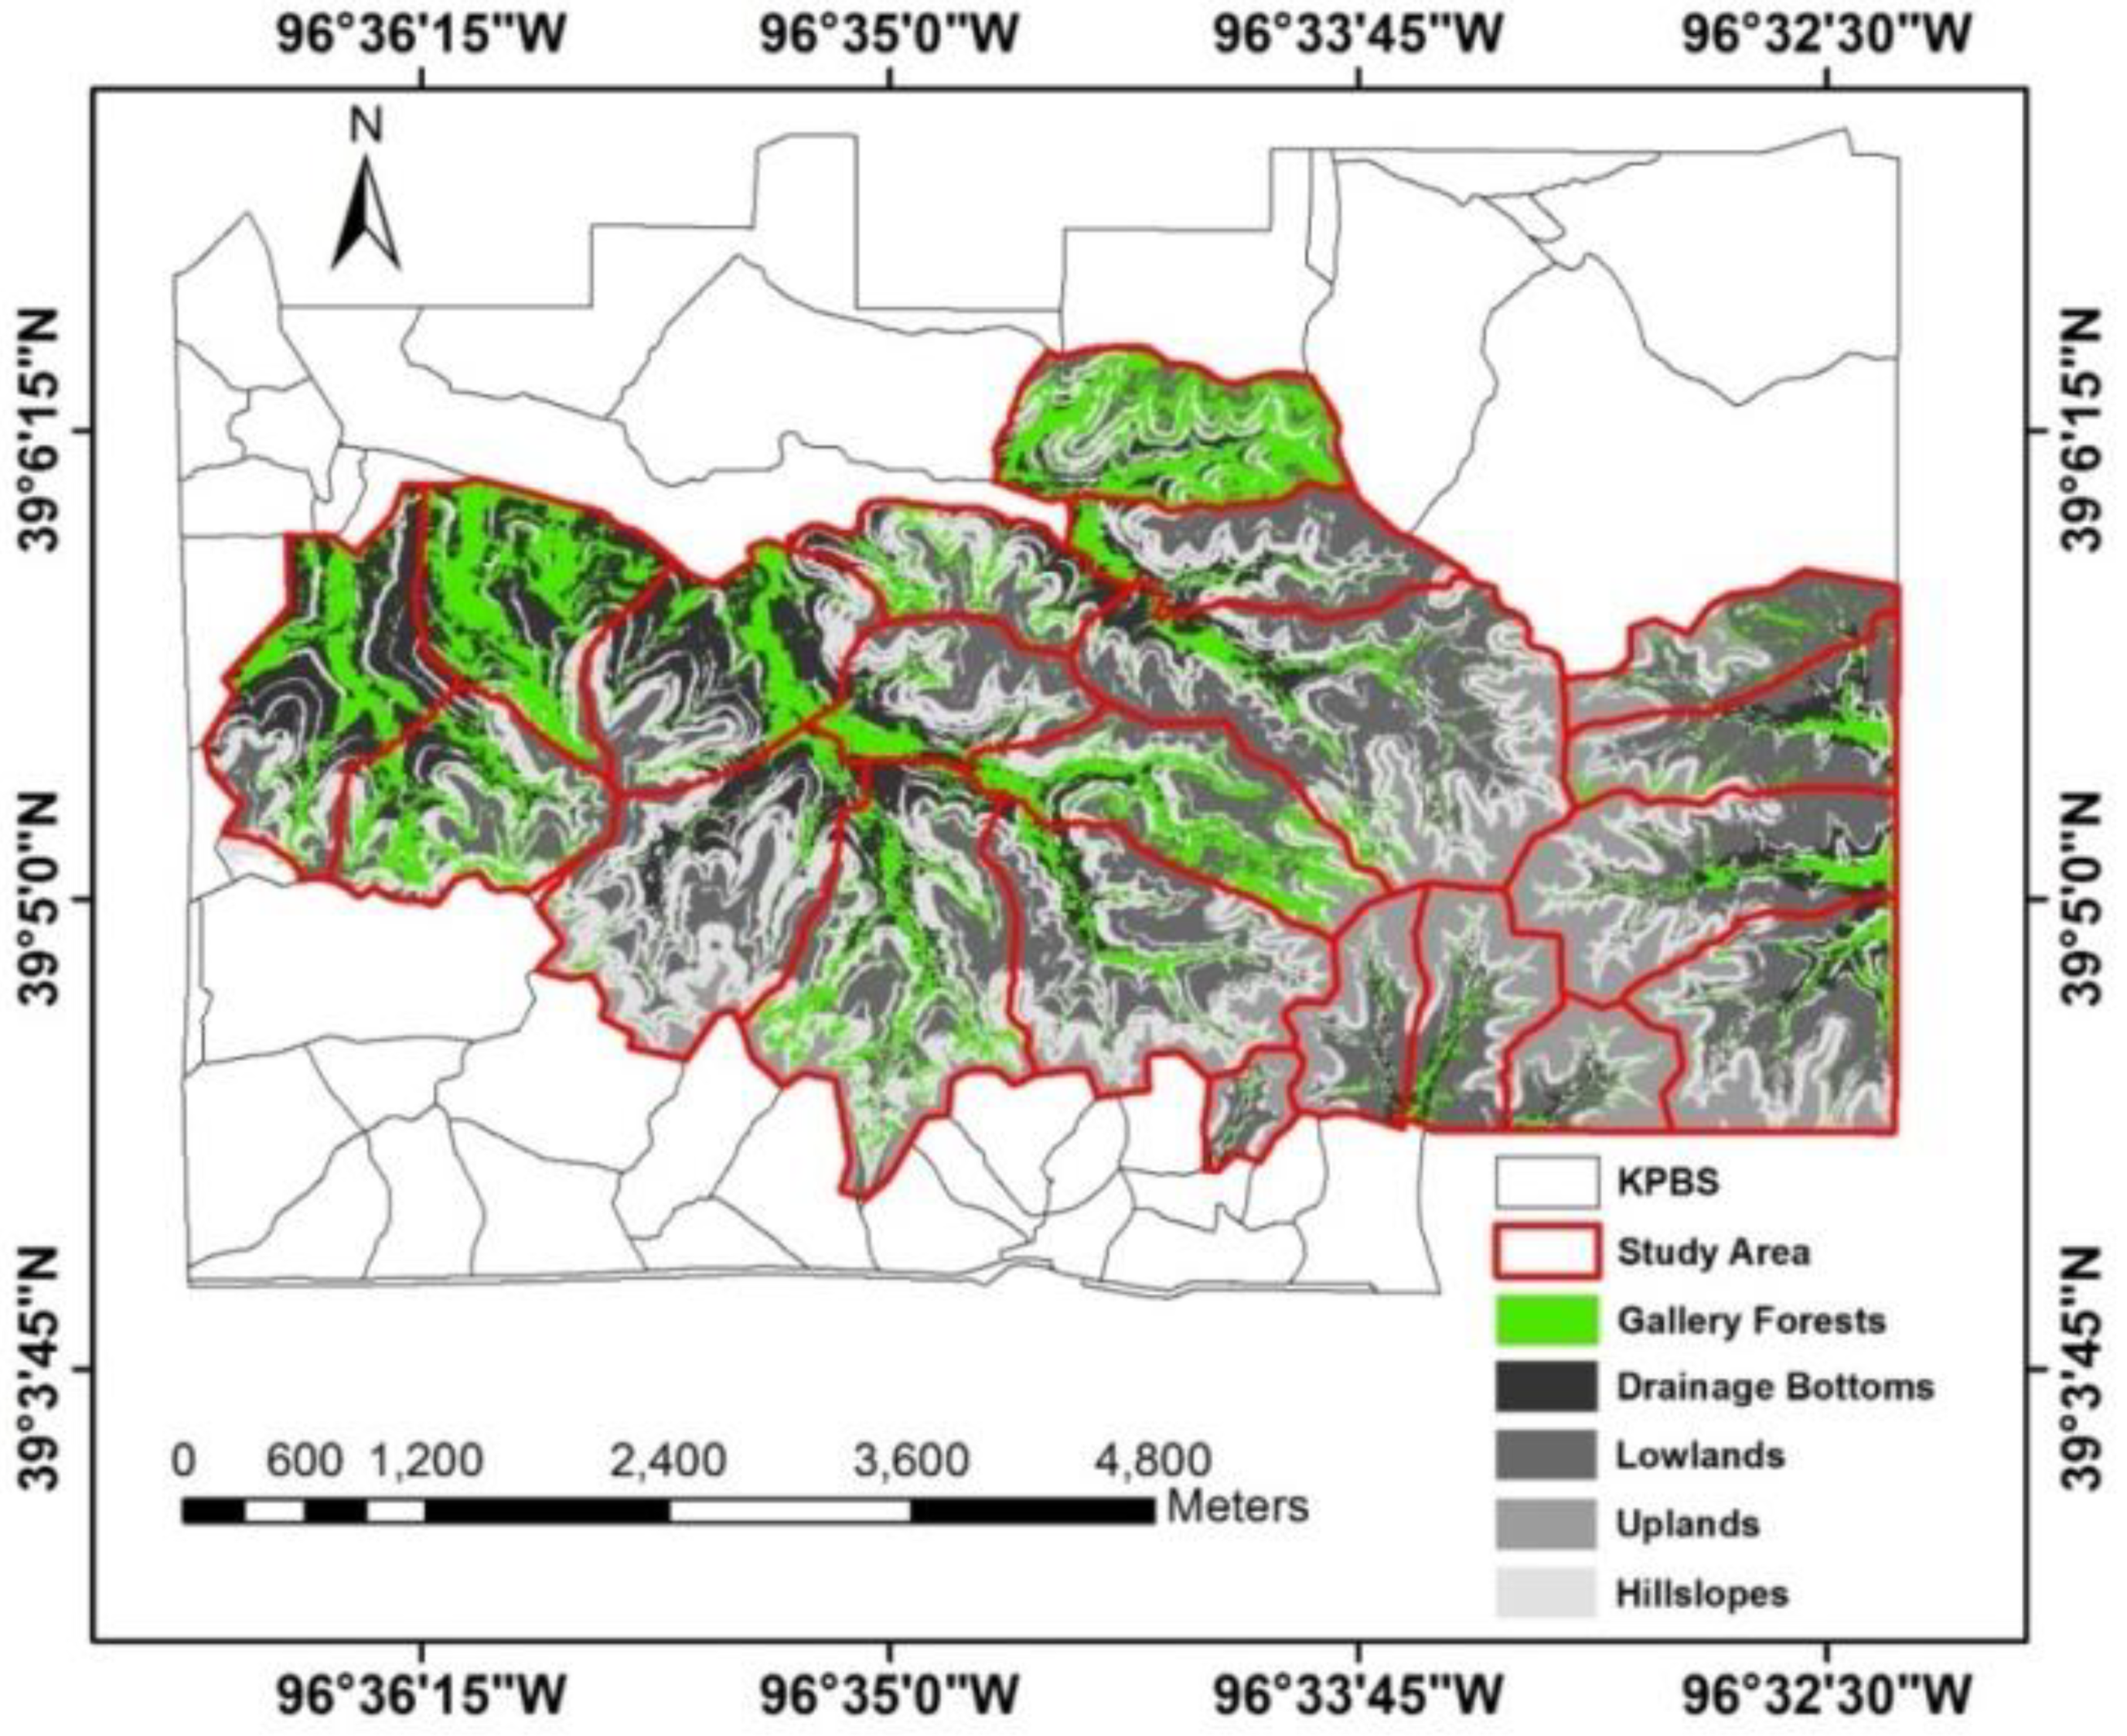
Figure 3.
Continuous canopy nitrogen content maps for (a) May, (b) June, (c) August, and (d) September, and categorical maps with five levels of canopy nitrogen from low to high for (e) May, (f) June, (g) August, and (h) September, 2011, at Konza Prairie, Manhattan, Kansas.
Figure 3.
Continuous canopy nitrogen content maps for (a) May, (b) June, (c) August, and (d) September, and categorical maps with five levels of canopy nitrogen from low to high for (e) May, (f) June, (g) August, and (h) September, 2011, at Konza Prairie, Manhattan, Kansas.

Figure 4.
Variogram analysis for spatial variability. In our research, the range reflected the vegetation patch size within which the canopy nitrogen was homogeneous and varied in a small range. The sill reflected the variance of the canopy nitrogen among vegetation patches that were not spatially autocorrelated.

Figure 5.
Canopy nitrogen content varying with fire intervals over the ungrazed watersheds in (a) May, (b) June, (c) August, and (d) September. Watersheds 1D, 2D, R1B, and K1B were burnt within one year; watersheds K2A, SuB, K4A, and K20A had fire intervals greater than one year. In September, watersheds K2A and K20A were not included in analysis, given that the two watersheds were burnt shortly before the flyover in a small wildfire, resulting in a fire interval of only one week.
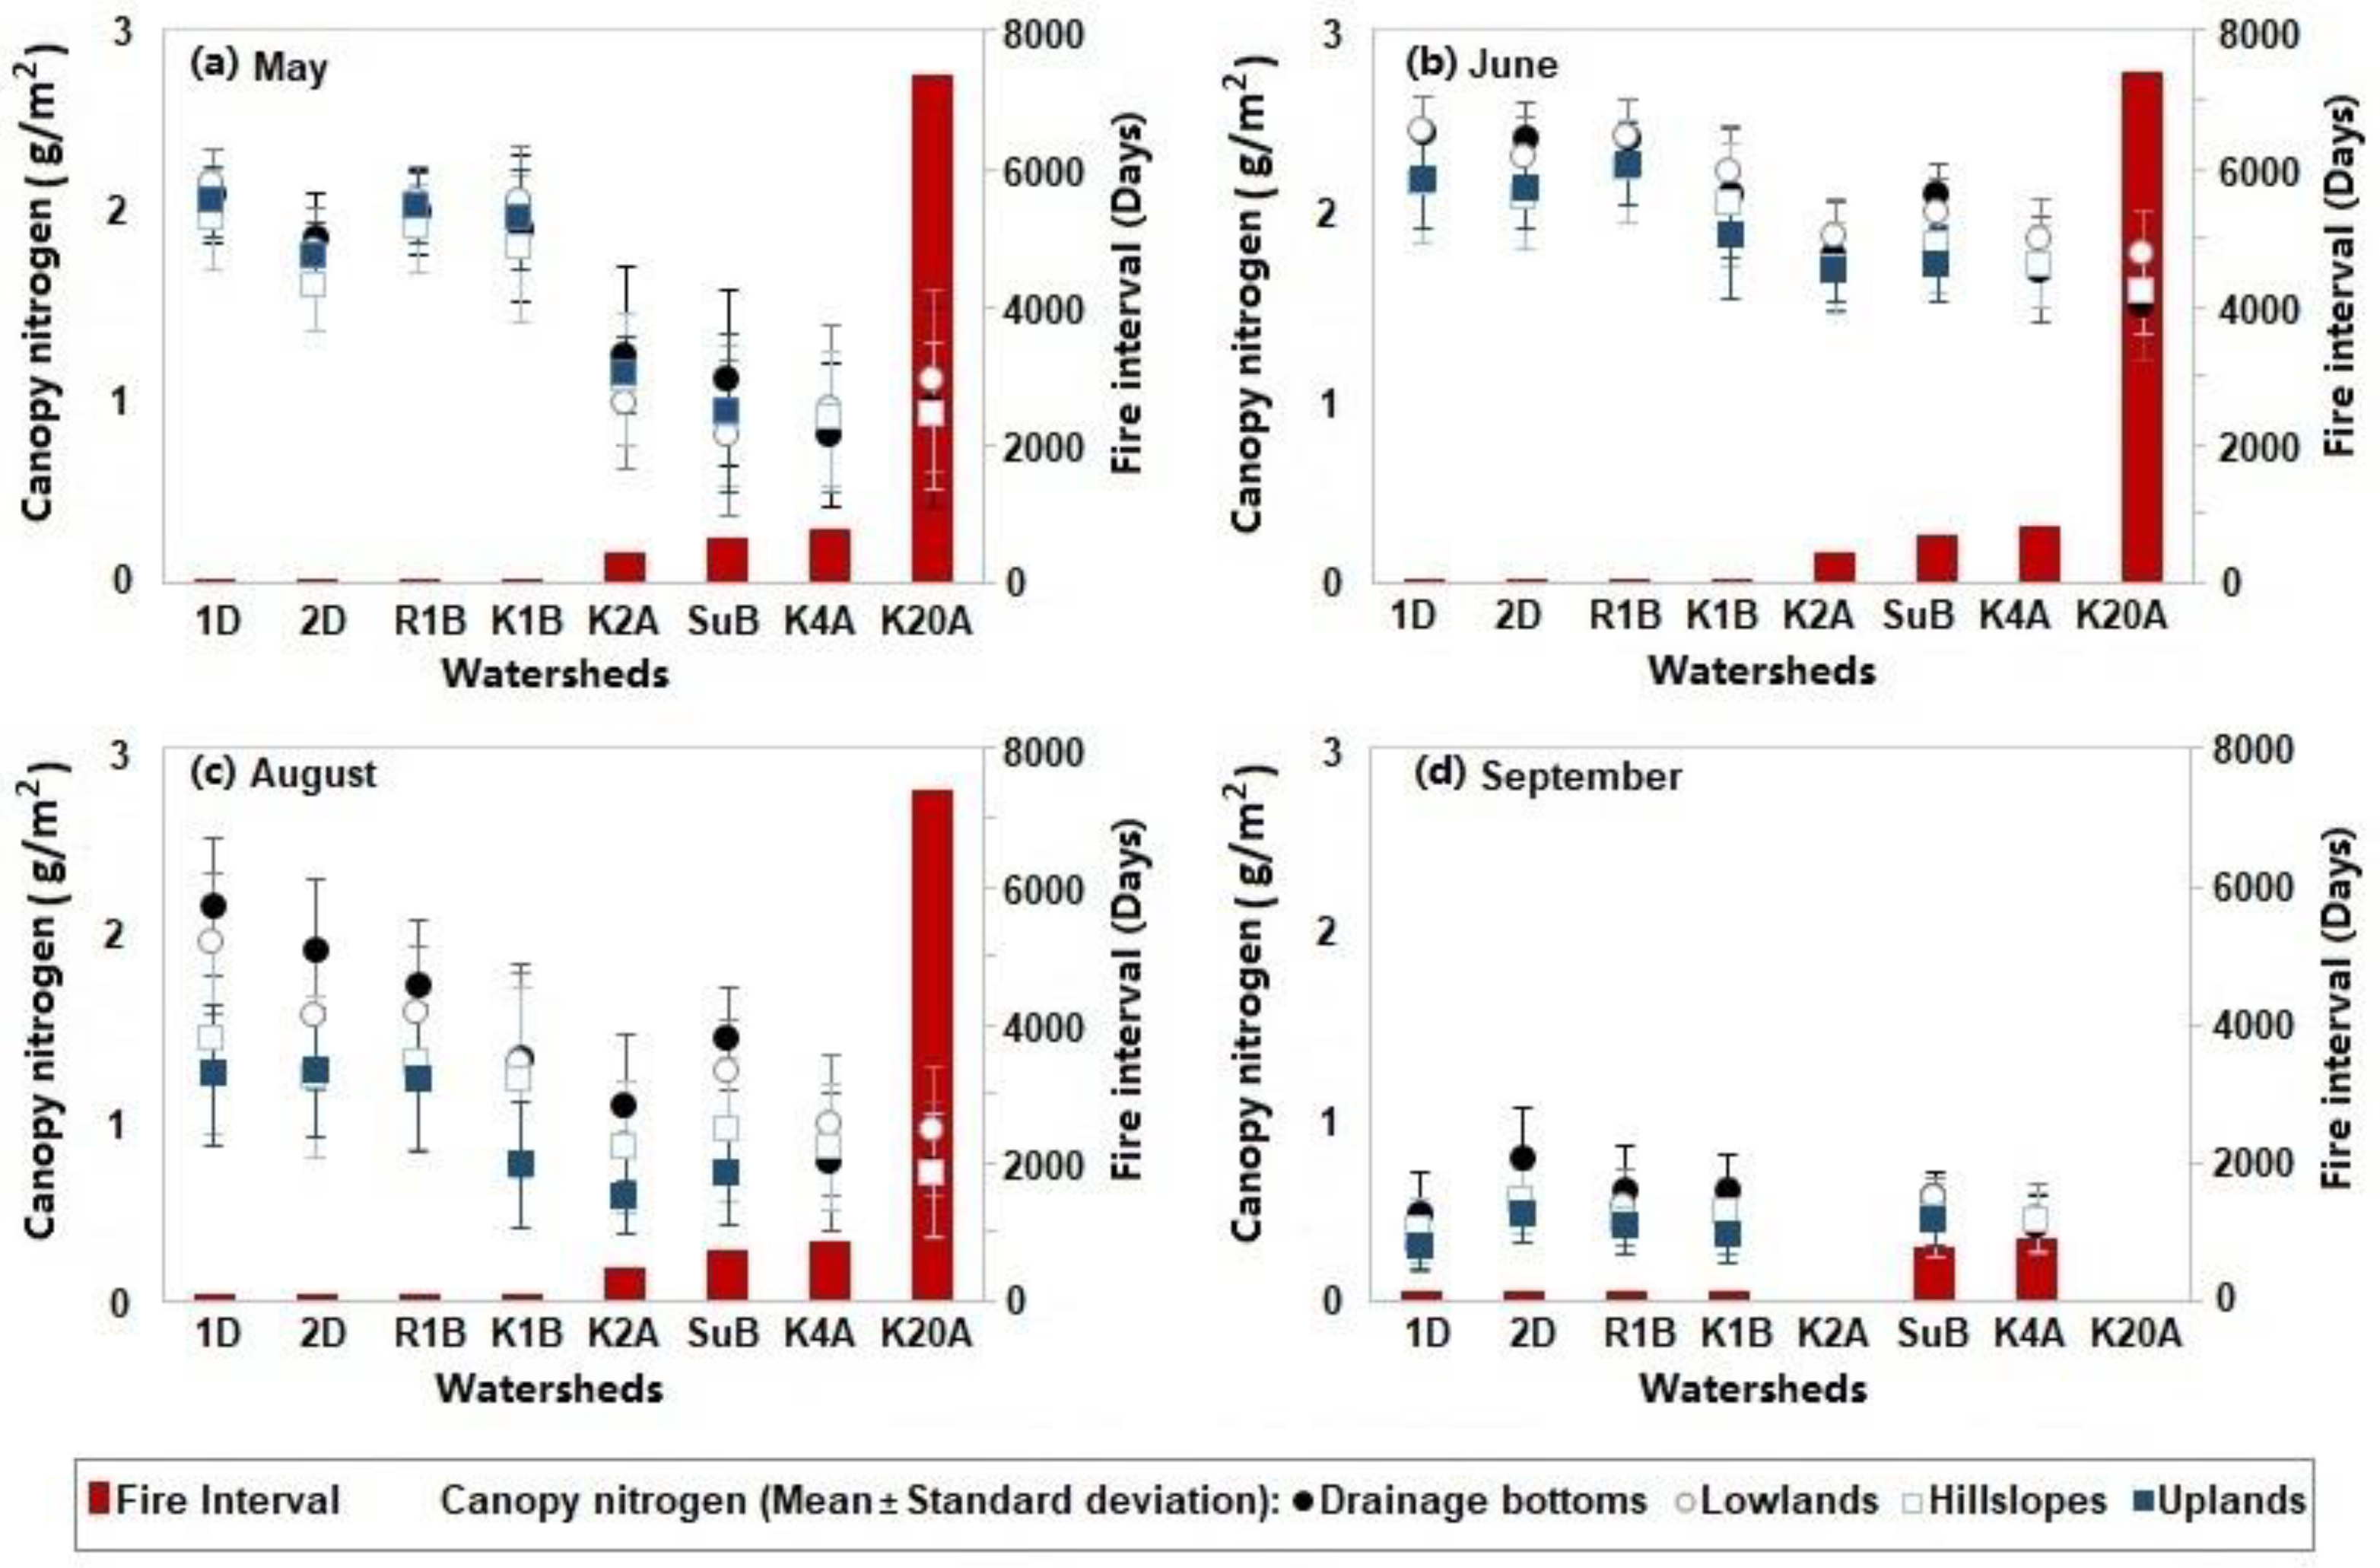
Figure 6.
Two-sample t-test for comparing differences between ungrazed sites with fire intervals within one year and greater than one year in canopy nitrogen properties including (a) the mean and (b) standard deviation of nitrogen concentrations, (c) contagion, and (d) Simpson’s diversity for all canopy nitrogen patch types, and (e) the percentage and (f) IJI of the high-nitrogen patches at Konza Prairie, Manhattan, Kansas. *The difference is statistically significant at the 95% confidence level.

Figure 7.
Statistically significant differences in (a) the mean of canopy nitrogen concentrations and (b) interspersion/juxtaposition indices of the high-nitrogen patches among various topographic positions in September for ungrazed watersheds at Konza Prairie, Manhattan, Kansas.
Figure 7.
Statistically significant differences in (a) the mean of canopy nitrogen concentrations and (b) interspersion/juxtaposition indices of the high-nitrogen patches among various topographic positions in September for ungrazed watersheds at Konza Prairie, Manhattan, Kansas.
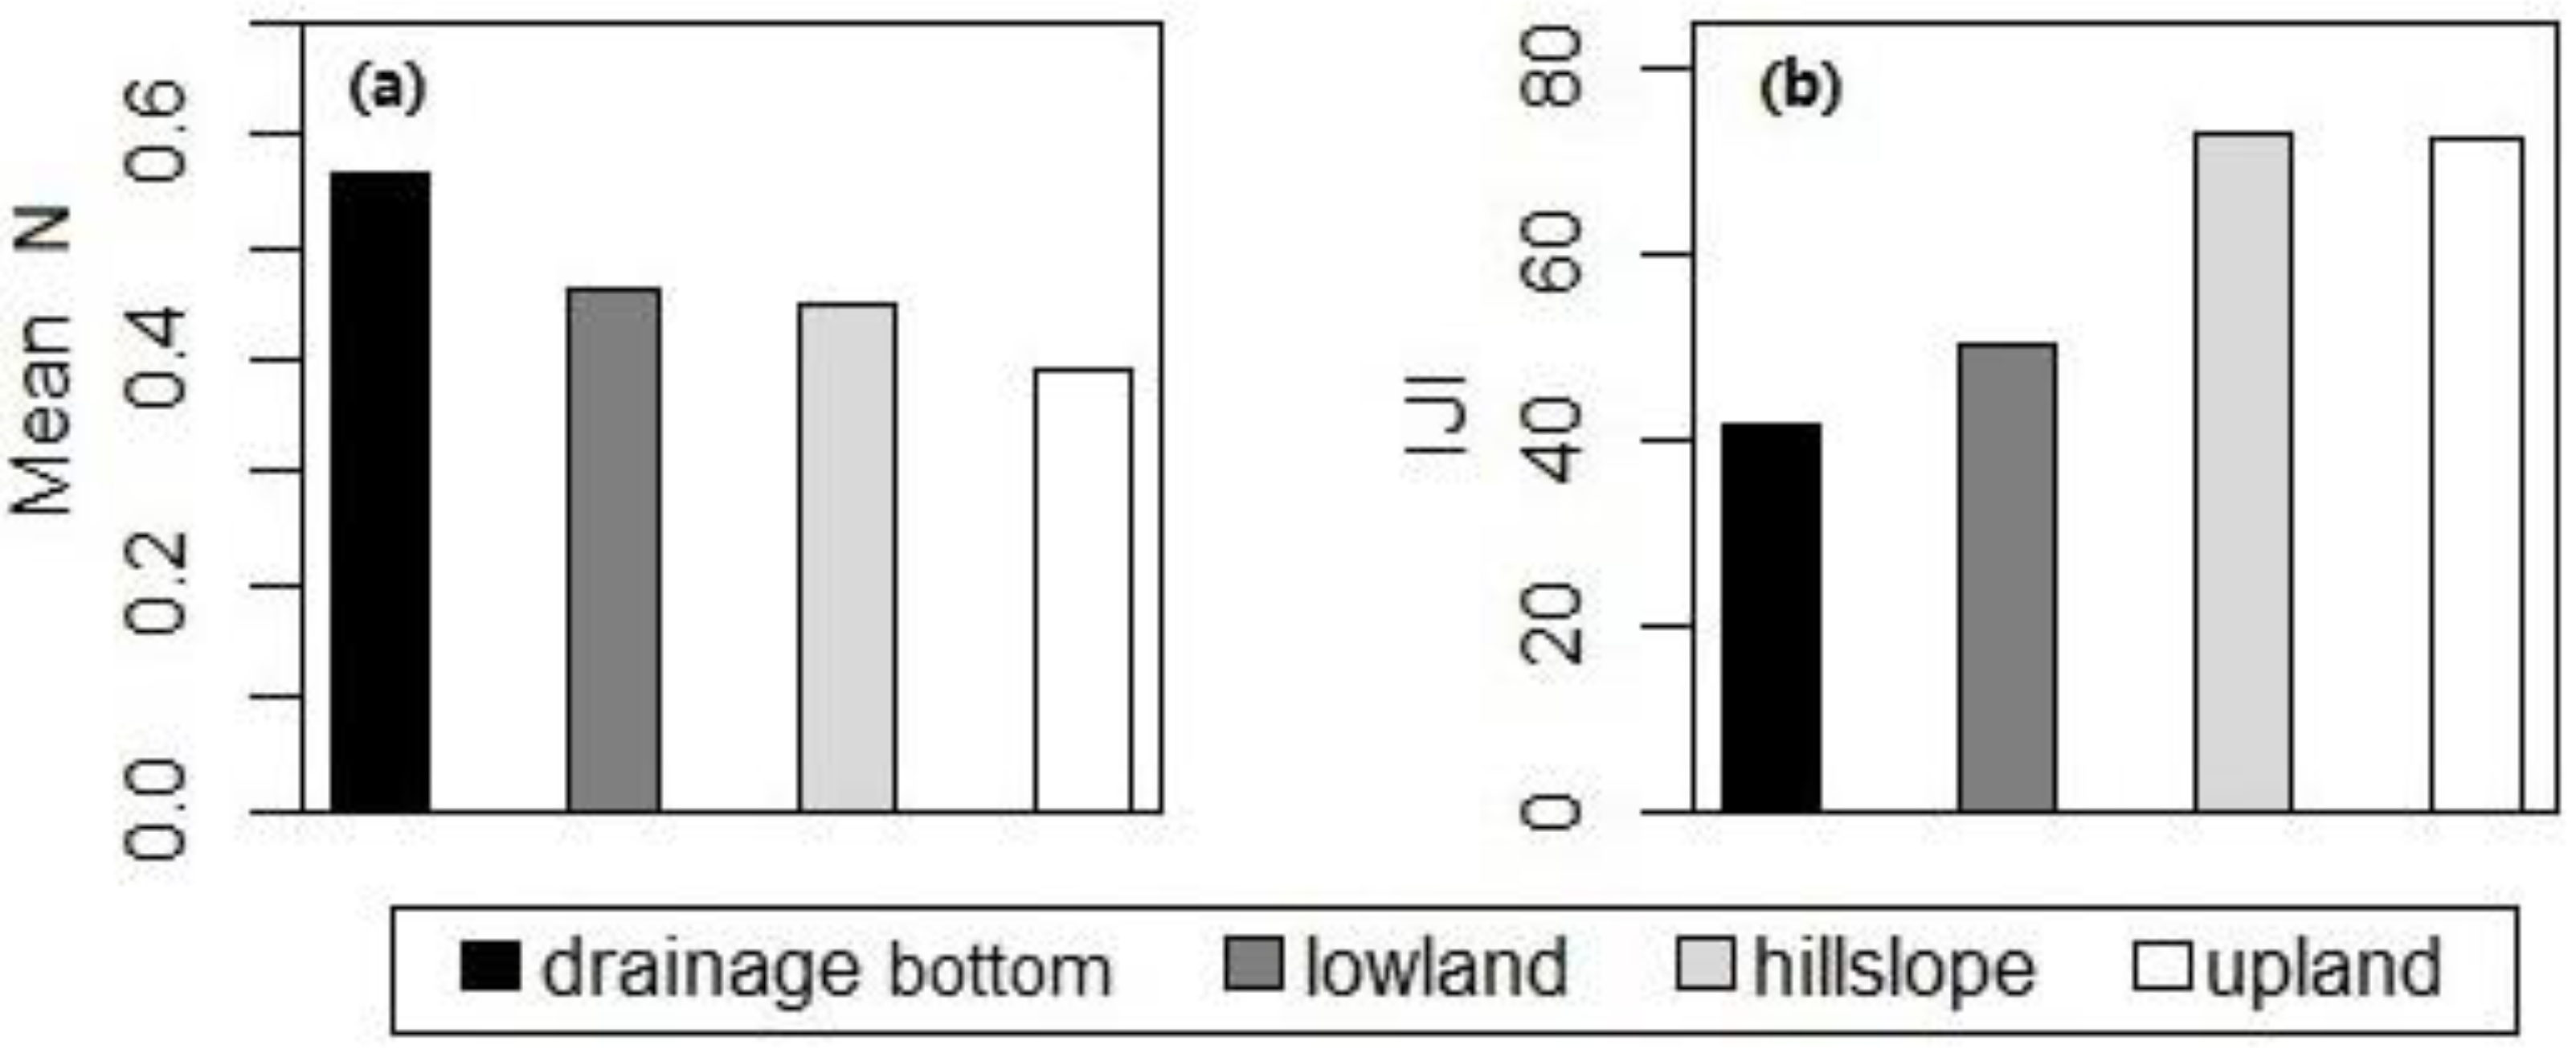
Figure 8.
Differences in (a–d,i–l) the mean of canopy nitrogen concentrations and (e–h,m–p) the IJI of the high-nitrogen patches between sites with non-grazing and grazing treatments in the cases of fire intervals (a–h) within one year and (i–p) greater than one year in (a,e,i,m) May, (b,f,j,n) June, (c,g,k,o) August, and (d,h,l,p) September, 2011, at Konza Prairie, Manhattan, Kansas. D = drainage bottom, L = lowland, S = hillslope. *The difference was statistically significant at the 95% confidence level.

Figure 9.
Comparison of grazing effects from bison and cattle on (a–d) the mean of canopy nitrogen concentrations and (e–h) the IJI of high-nitrogen patches across different topographic positions at the burned sites in (a,e) May, (b,f) June, (c,g) August, and (d,h) September, 2011, at Konza Prairie, Manhattan, Kansas. D = drainage bottom, L = lowland, S = hillslope, U = upland. *The difference between bison- and cattle-grazed areas was statistically significant at the 95% confidence level.

Figure 10.
Variogram analysis for the spatial structures of canopy nitrogen with a variety of fire-grazing treatments across (a,e,i,m) drainage bottoms, (b,f,j,n) lowlands, (c,g,k,o) hillslopes, and (d,h,l,p) uplands in (a–d) May, (e–h) June, (i–l) August, and (m–p) September, 2011, at Konza Prairie, Manhattan, Kansas.


Table 1.
FRAGSTATS metrics measuring spatial heterogeneity.
| FRAGSTATS Metric | Range | Description |
|---|---|---|
| contagion index | (0,100] | A measurement of aggregation; the value approaches 0 as the path types become more disaggregated and interspersed; a value of 100 indicates all patch types are maximally aggregated. |
| Simpson’s diversity index | [0,1) | A measurement of diversity; a value of 0 indicates no diversity; as the patch richness increases and the proportional distribution of area among patch types becomes more equitable, the value approaches 1. |
| interspersion/juxtaposition index (IJI) | (0,100] | A measurement of patch interspersion and juxtaposition; the value approaches 0 as the distribution of patch adjacencies becomes increasingly uneven; a value of 100 indicates all patch types are equally adjacent to all other patch types. |
Table 2.
Analysis of variance F statistics for the canopy nitrogen properties responding to the interaction of the fire interval and topography in ungrazed watersheds at Konza Prairie, Manhattan, Kansas.
Table 2.
Analysis of variance F statistics for the canopy nitrogen properties responding to the interaction of the fire interval and topography in ungrazed watersheds at Konza Prairie, Manhattan, Kansas.
| Canopy Nitrogen Properties | May | June | August | September |
|---|---|---|---|---|
| Mean | 0.9131 | 0.5701 | 0.8969 | 1.0099 |
| Standard deviation | 2.0911 | 1.6487 | 1.2974 | 3.0364 |
| Contagion | 1.2928 | 3.6203 †,* | - | 1.0384 |
| Simpson’s diversity | 1.4088 | 3.3470 | 2.5088 | 1.8052 |
| % High-nitrogen patches | 0.9942 | 0.5250 † | 0.6404 † | 1.0991 |
| IJI of high-nitrogen patches | 1.7855 | 0.2572 | 0.5801 | 0.5700 |
† The responsive variables were logarithmically transformed to correct the problem of non-normality or heteroscedasticity. * Significance level = 0.05. -The data violated the assumptions of normality or homoscedasticity.
Table 3.
Analysis of variance F statistics for the canopy nitrogen properties responding to the interaction of the fire interval and the ungulate grazing type across different topographic positions. The uplands were not included in analysis given the insufficient samples of non-grazing treatments with fire intervals greater than one year.
| Mean | Standard Deviation | Contagion | Simpson’s Diversity | % High-N | IJI of High-N | |
|---|---|---|---|---|---|---|
| May | ||||||
| Drainage bottom | 12.08 ** | 2.66 | 0.26 | 0.94 | 3.79 | 6.84 * |
| Lowland | 31.68 *** | 5.85 * | 0.51 | 0.56 | 10.13 ** | 37.69 *** |
| Hillslope | 13.14 ** | 0.05 | 1.61 | 0.93 | 5.67 * | 10.58 ** |
| June | ||||||
| Drainage bottom | 15.55 ** | 0.89 | 14.01 ** | 10.59 ** | 41.66 *** | 26.49 *** |
| Lowland | 32.23 *** | 1.22 | 29.01 †,** | - | 65.16 *** | 17.63 *** |
| Hillslope | 29.24 *** | 0.78 | 2.05 | 0.42 | 13.77 †,** | 19.59 *** |
| August | ||||||
| Drainage bottom | 9.98 ** | 0.66 | 0.03 | - | 3.11 | 28.15 *** |
| Lowland | 15.09 ** | 0.06 | 2.66 | 1.25 | 15.82 *** | 20.50 *** |
| Hillslope | 16.82 *** | 4.94 * | 2.60 | 2.62 | 10.65 ** | 13.70 ** |
| September | ||||||
| Drainage bottom | 0.49 | 0.95 † | 14.06 ** | 7.03 * | 1.85 | 0.83 † |
| Lowland | 2.28 | 0.26 | 0.00 | - | 1.43 | 0.40 |
| Hillslope | 1.19 | 5.93 †,* | 2.25 | 7.24 * | 1.78 | 1.75 |
† The responsive variables were logarithmically transformed to correct the problem of non-normality or heteroscedasticity. Significance level: *** = 0.001, ** = 0.01, * = 0.05. -The data violated the assumptions of normality or homoscedasticity.
Table 4.
Variogram analysis of the canopy nitrogen in lowlands and uplands burnt within one year, where the effects of non-grazing, cattle, and bison on the spatial structures of canopy nitrogen were compared.
Table 4.
Variogram analysis of the canopy nitrogen in lowlands and uplands burnt within one year, where the effects of non-grazing, cattle, and bison on the spatial structures of canopy nitrogen were compared.
| Topography | Treatment | Model | Nugget | Sill | Range | Proportion |
|---|---|---|---|---|---|---|
| May | ||||||
| Lowland | Non-grazing | 0.019 | 0.047 | 18 | 0.591 | |
| Cattle | 0.028 | 0.071 | 20 | 0.609 | ||
| Bison | 0.031 | 0.110 | 21 | 0.720 | ||
| Upland | Non-grazing | 0.020 | 0.039 | 16 | 0.472 | |
| Cattle | 0.024 | 0.058 | 16 | 0.583 | ||
| Bison | 0.026 | 0.064 | 16 | 0.592 | ||
| June | ||||||
| Lowland | Non-grazing | 0.026 | 0.066 | 22 | 0.611 | |
| Cattle | 0.028 | 0.064 | 20 | 0.567 | ||
| Bison | 0.028 | 0.079 | 16 | 0.642 | ||
| Upland | Non-grazing | 0.029 | 0.057 | 15 | 0.495 | |
| Cattle | 0.031 | 0.064 | 14 | 0.510 | ||
| Bison | 0.030 | 0.074 | 14 | 0.594 | ||
| August | ||||||
| Lowland | Non-grazing | 0.033 | 0.157 | 40 | 0.789 | |
| Cattle | 0.035 | 0.139 | 34 | 0.748 | ||
| Bison | 0.036 | 0.182 | 22 | 0.802 | ||
| Upland | Non-grazing | 0.038 | 0.077 | 18 | 0.499 | |
| Cattle | 0.035 | 0.081 | 14 | 0.569 | ||
| Bison | 0.037 | 0.091 | 14 | 0.592 | ||
| September | ||||||
| Lowland | Non-grazing | 0.008 | 0.030 | 22 | 0.733 | |
| Cattle | 0.007 | 0.037 | 32 | 0.802 | ||
| Bison | 0.007 | 0.046 | 28 | 0.841 | ||
| Upland | Non-grazing | 0.007 | 0.018 | 20 | 0.616 | |
| Cattle | 0.007 | 0.018 | 19 | 0.601 | ||
| Bison | 0.009 | 0.050 | 48 | 0.817 |
2γ(h) is the variogram; h is the separation distance; proportion = (sill − nugget)/sill.
© 2019 by the authors. Licensee MDPI, Basel, Switzerland. This article is an open access article distributed under the terms and conditions of the Creative Commons Attribution (CC BY) license (http://creativecommons.org/licenses/by/4.0/).
Share and Cite
MDPI and ACS Style
Ling, B.; Raynor, E.J.; Goodin, D.G.; Joern, A. Effects of Fire and Large Herbivores on Canopy Nitrogen in a Tallgrass Prairie. Remote Sens. 2019, 11, 1364. https://doi.org/10.3390/rs11111364
AMA Style
Ling B, Raynor EJ, Goodin DG, Joern A. Effects of Fire and Large Herbivores on Canopy Nitrogen in a Tallgrass Prairie. Remote Sensing. 2019; 11(11):1364. https://doi.org/10.3390/rs11111364
Chicago/Turabian StyleLing, Bohua, Edward J. Raynor, Douglas G. Goodin, and Anthony Joern. 2019. "Effects of Fire and Large Herbivores on Canopy Nitrogen in a Tallgrass Prairie" Remote Sensing 11, no. 11: 1364. https://doi.org/10.3390/rs11111364
Note that from the first issue of 2016, this journal uses article numbers instead of page numbers. See further details here.