Identifying a Slums’ Degree of Deprivation from VHR Images Using Convolutional Neural Networks


Abstract
:
1. Introduction
2. Materials and Methods
2.1. Conceptualizing Deprivation
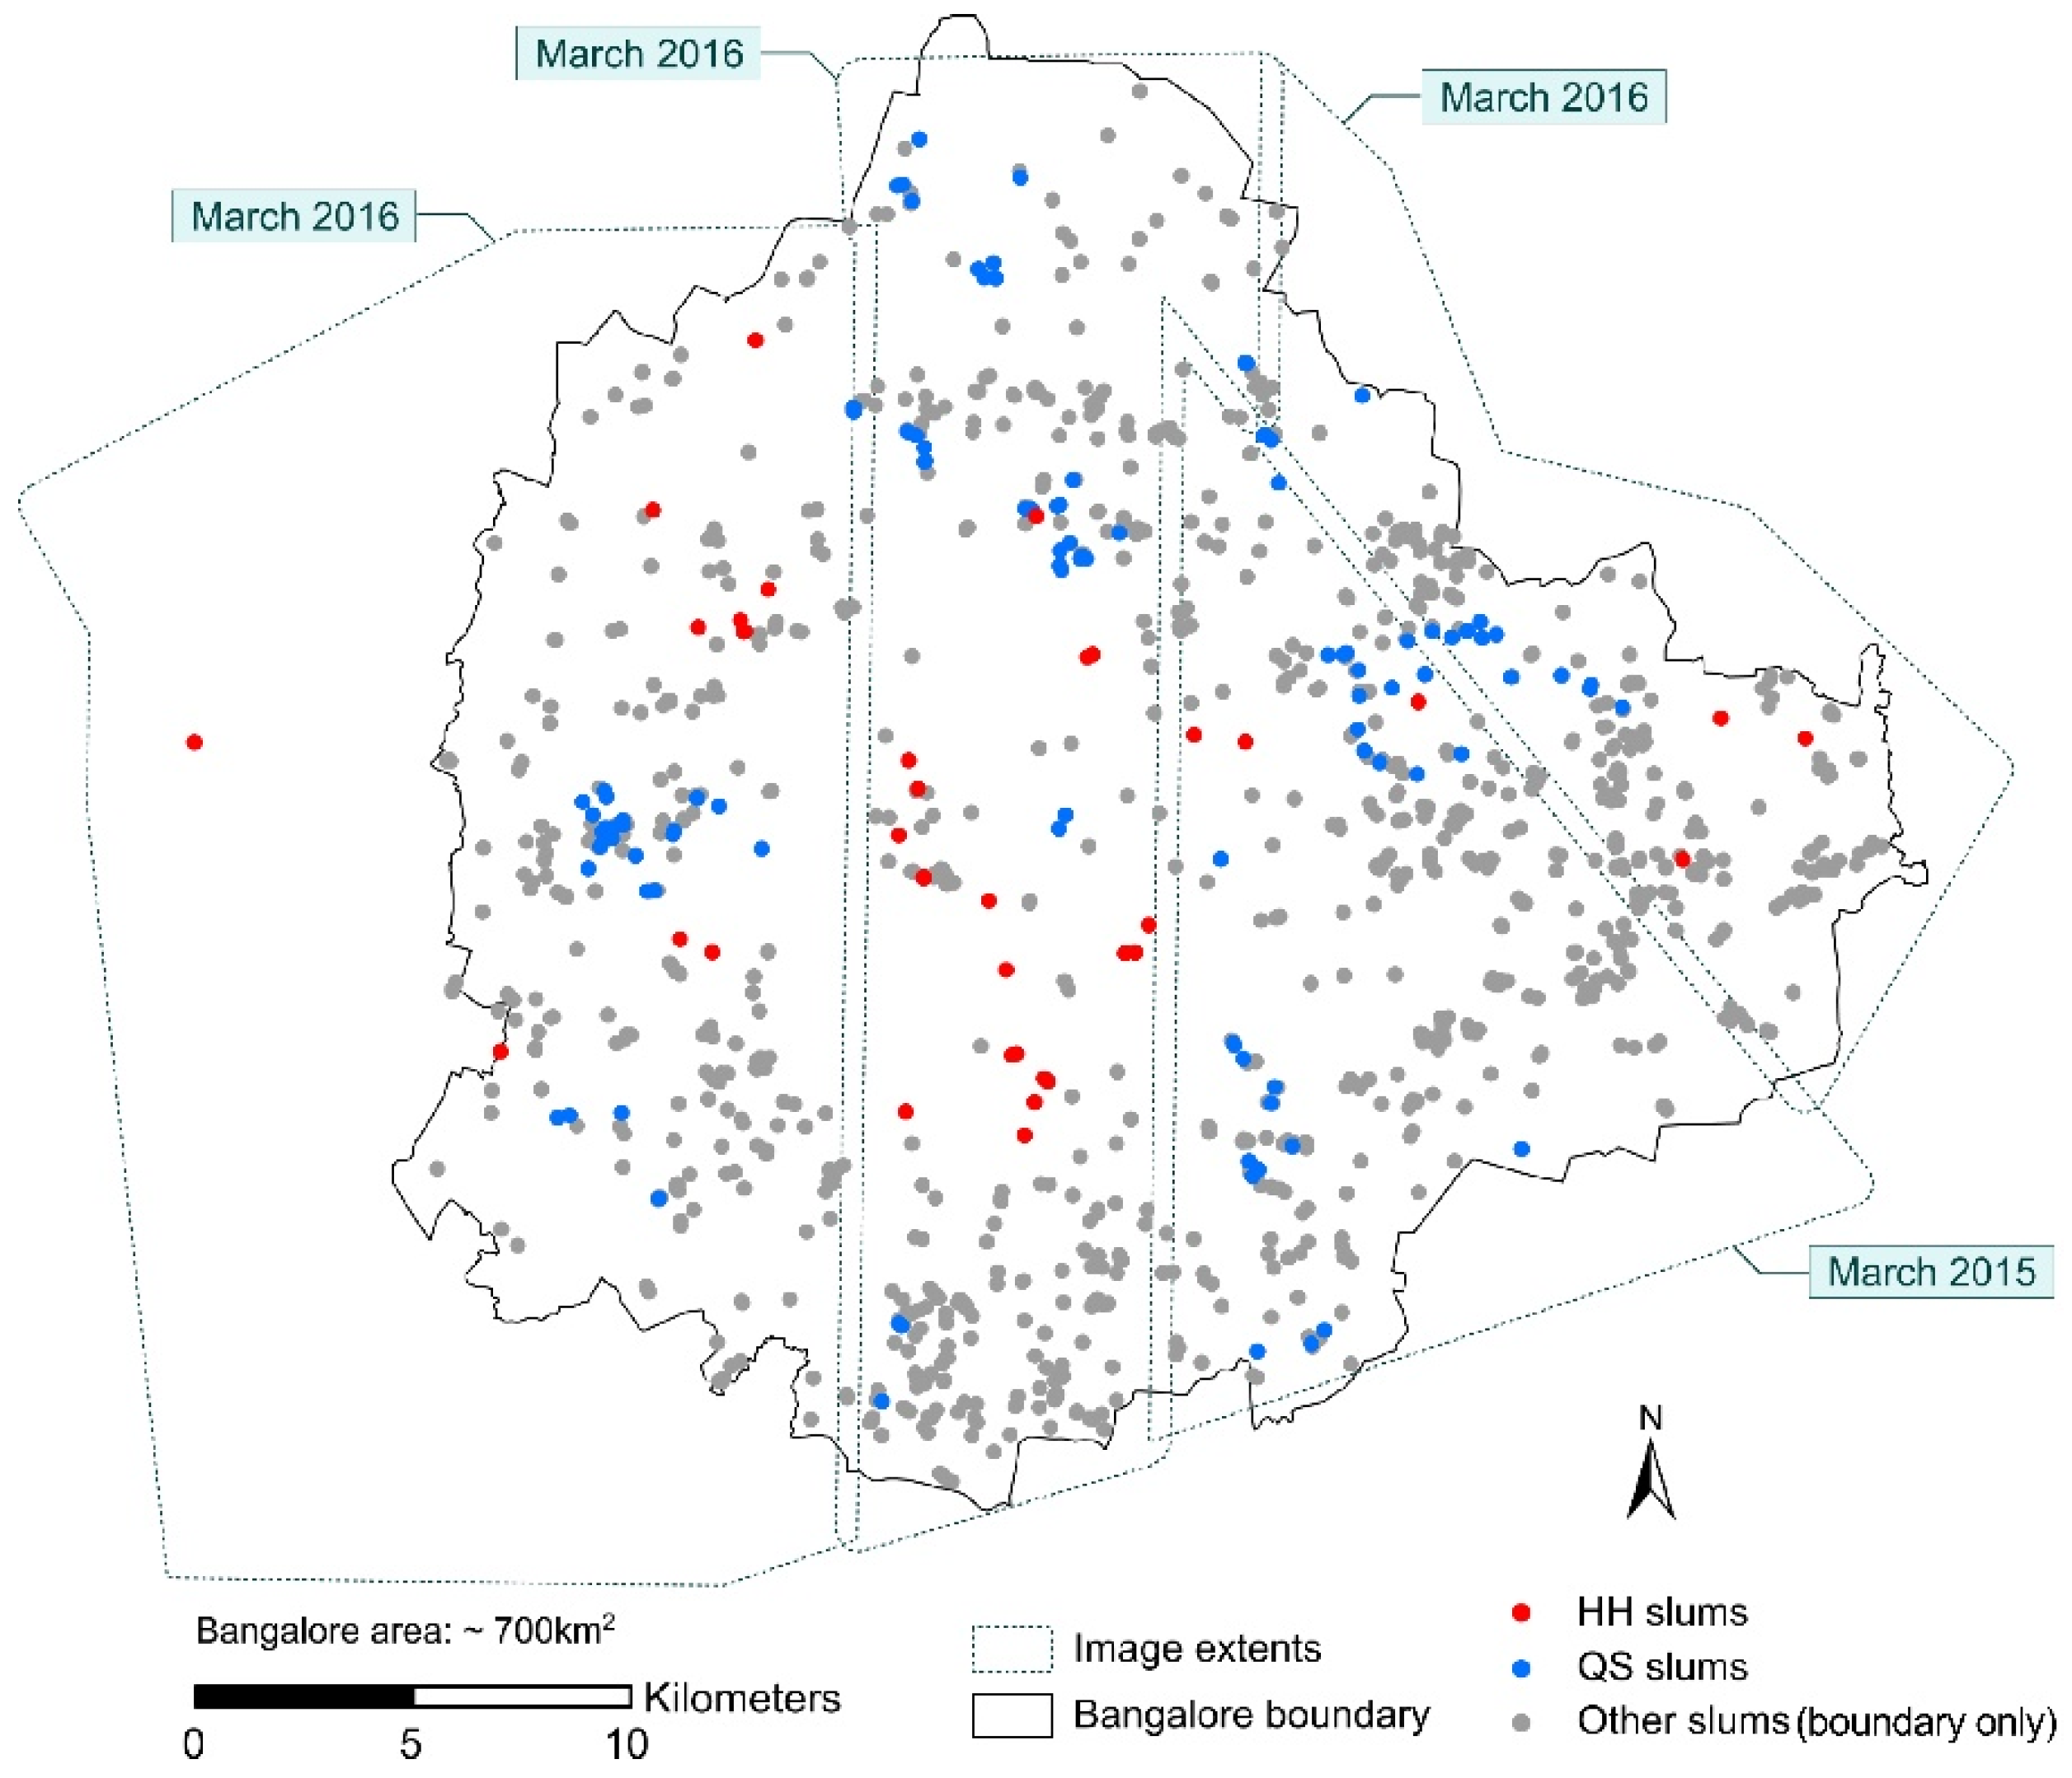
2.2. Available Data
2.3. Understanding Slums’ Socio-Economic Variations
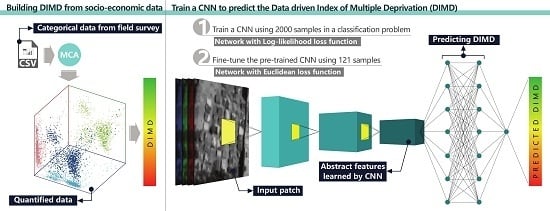
2.4. Building Image-Based Models to Predict the DIMD
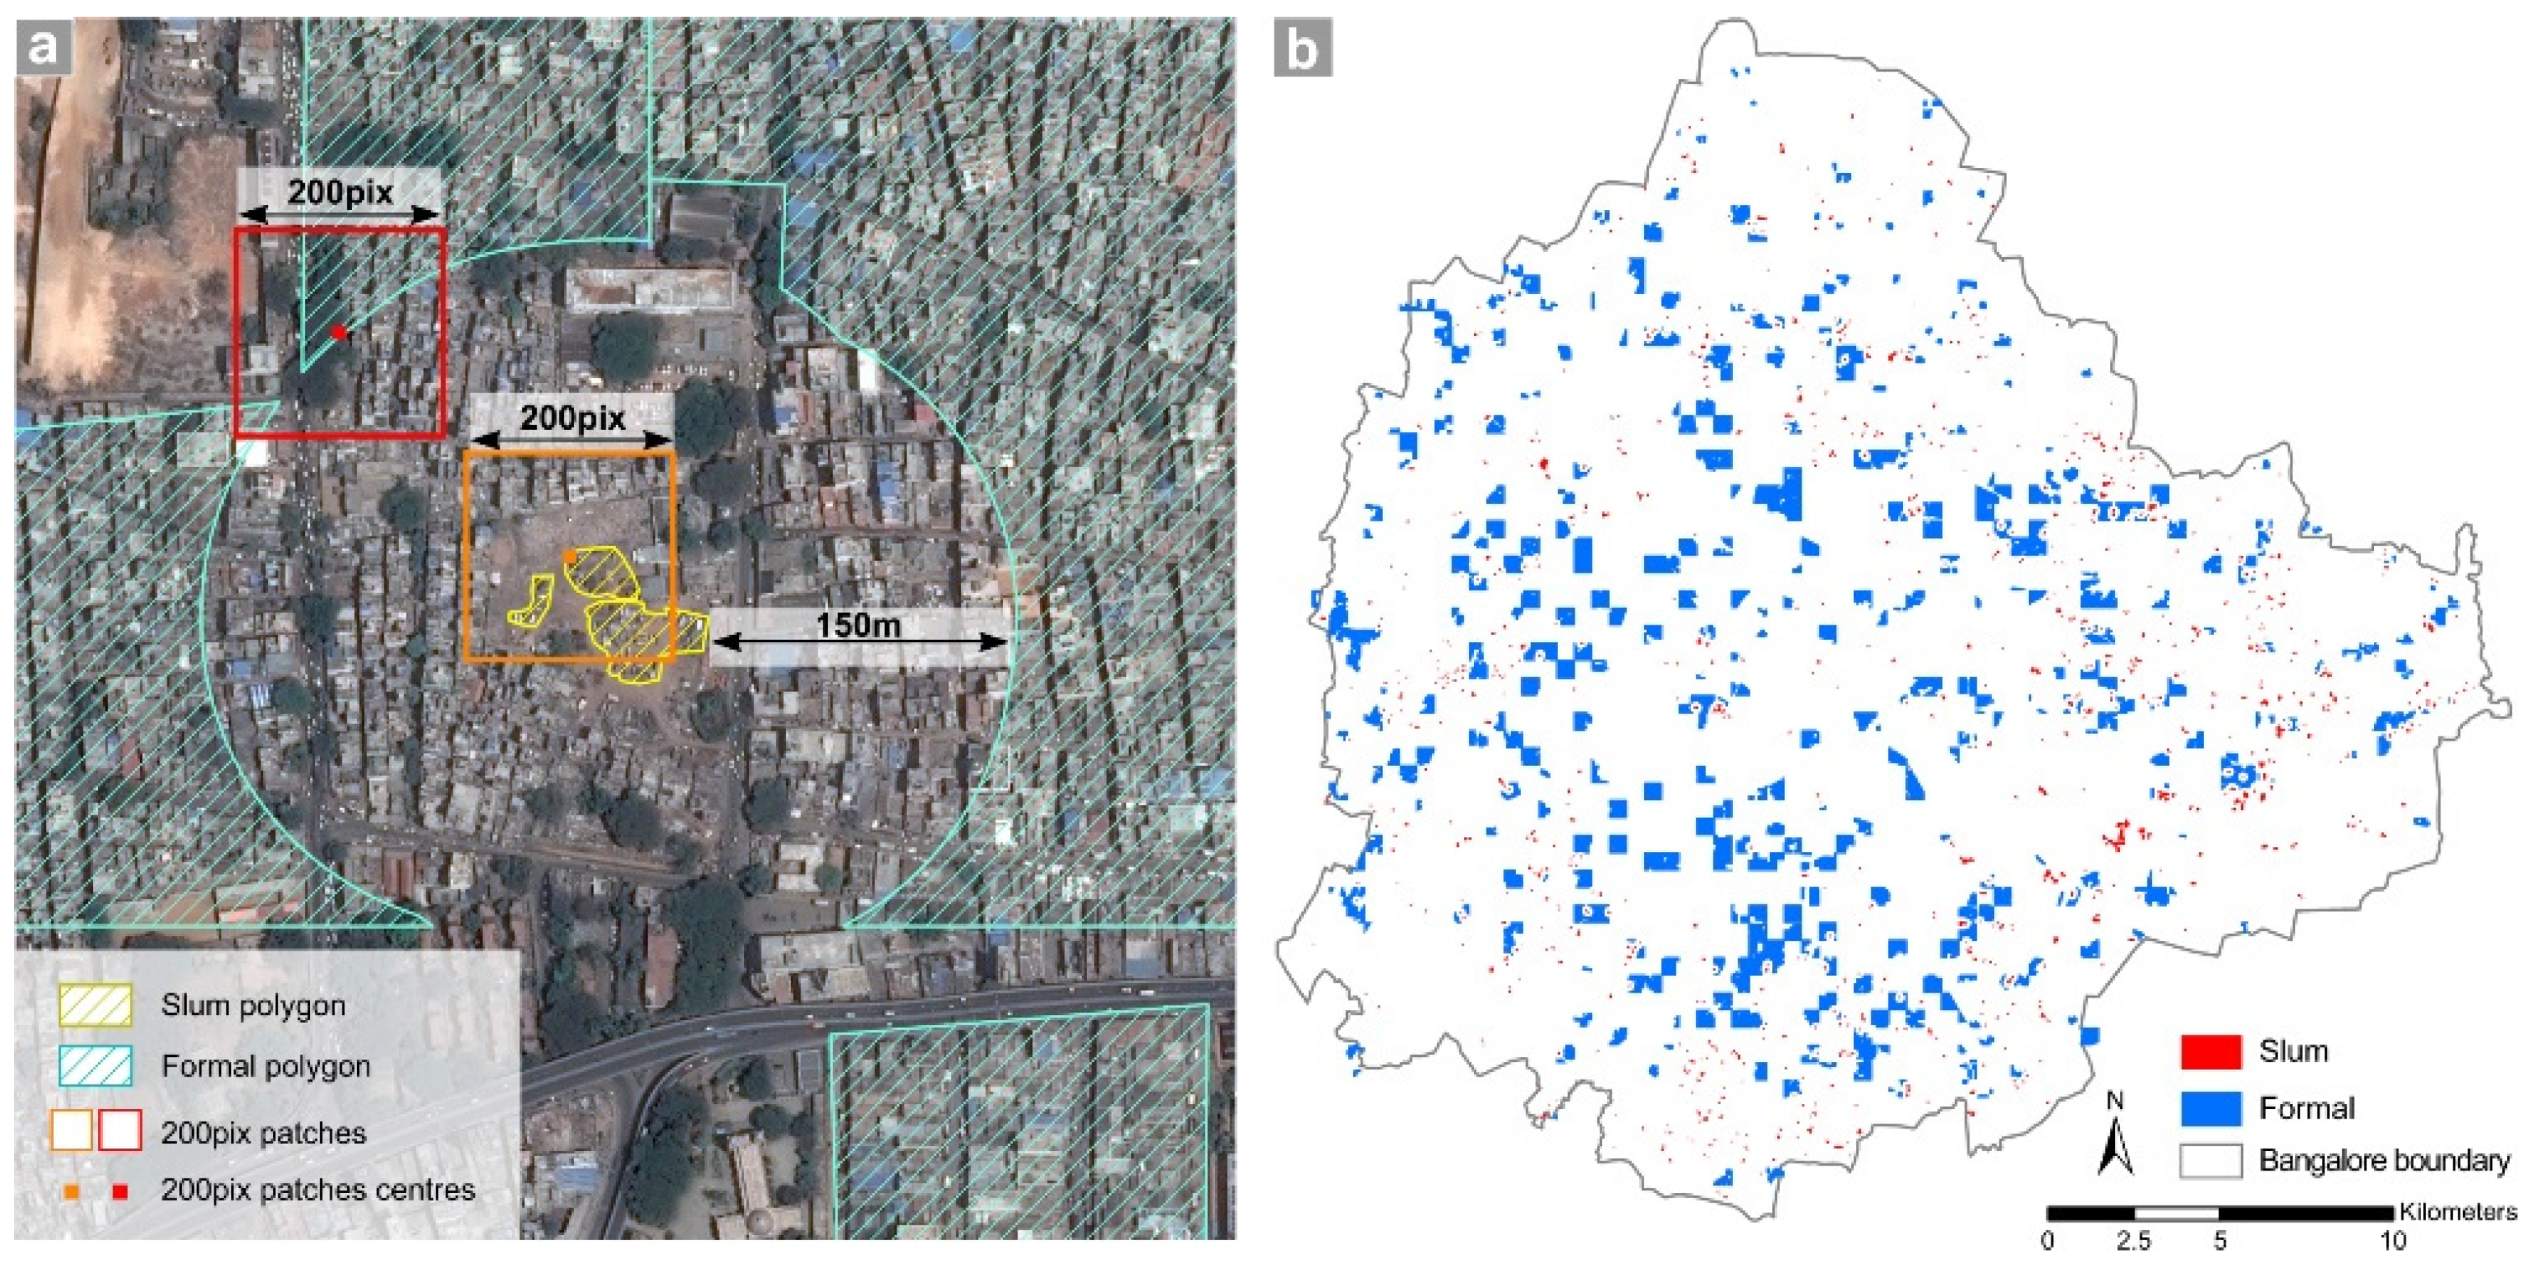
2.4.1. Sample and Image Preparation
2.4.2. CNN-Based Model to Predict the DIMD
Classification Problem
Transfer Learning: Regression Problem
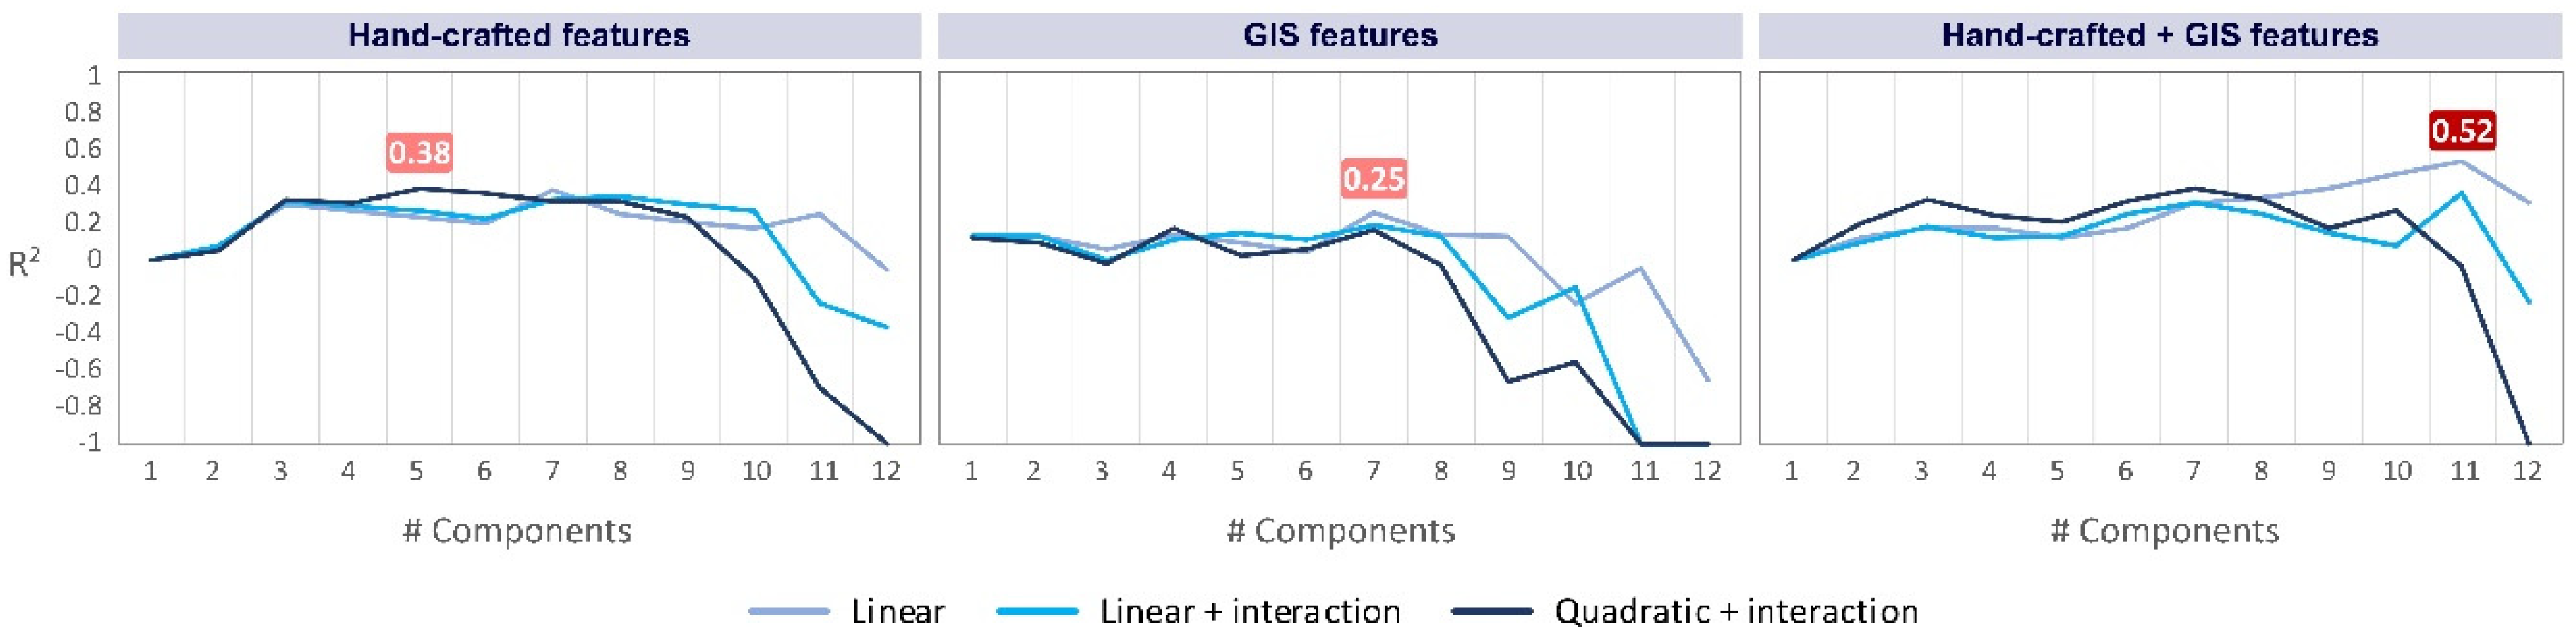
2.4.3. PCR Models Using Hand-Crafted and GIS Features
- Spectral information (Table 3; Spectral info.).
- Two sets of the most common texture features; grey level co-occurrence matrix (GLCM) and local binary pattern (LBP). We generate GLCM features in four directions and four lags (i.e., 1 to 4 pixels) and based on [17], we calculate three properties—entropy, variance, and contrast—on each feature. We calculate GLCM properties on each band of a patch and consider the mean value as the property value (Table 3; GLCM).
- To include LBP features in the model, we extract only uniform patterns (with a maximum of two transitions), which provide the most important textural information about an image [60]. Based on [18], we calculate (i.e., rotation invariant uniform patterns with a radius of 1, which considers eight neighbors), , and with linear interpolation. We average the extracted LBP of each band to obtain the value for a patch considering the whole patch as a cell (Table 3; LBP).
- GIS features; as road data are not consistent enough to perform network analysis, we calculate the minimum Euclidean distances from each of the public service/land use (Table 3; GIS) to a patch’s center points. Distance to different land uses and public services have been used to calculate the degree of deprivation of settlements especially in UK deprivation indices (e.g., [44]). We consider the town hall as the center of the city, which is very close to the geographic center of the city. Using the elevation layer, we calculate the mean elevation and mean slope within each patch.
2.4.4. Ensemble Regression Models
3. Results
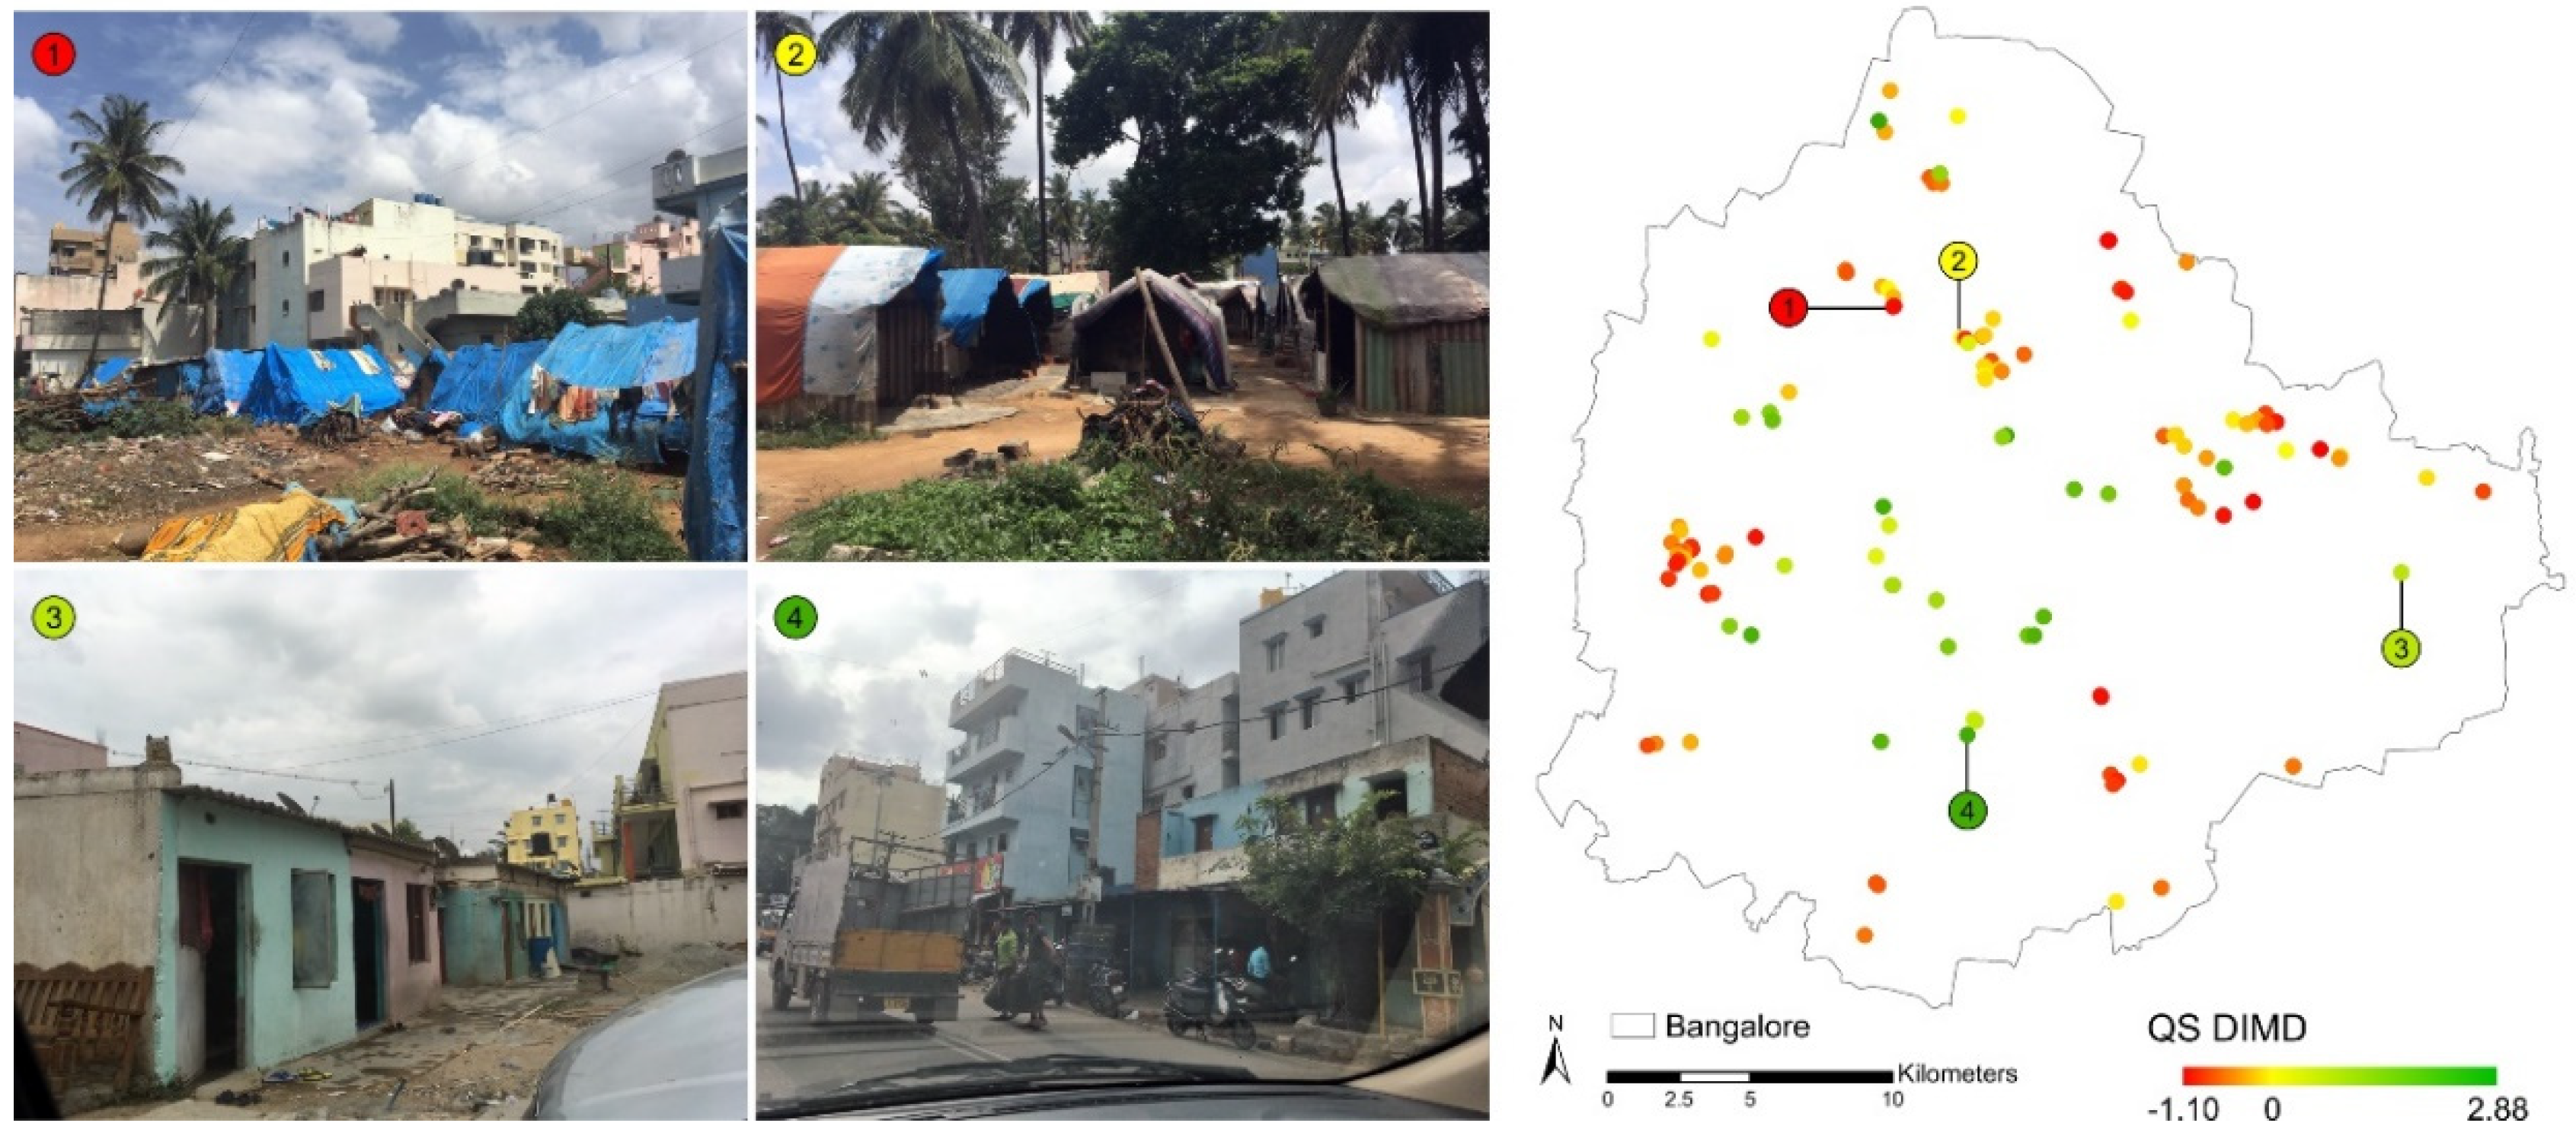
3.1. DIMDs
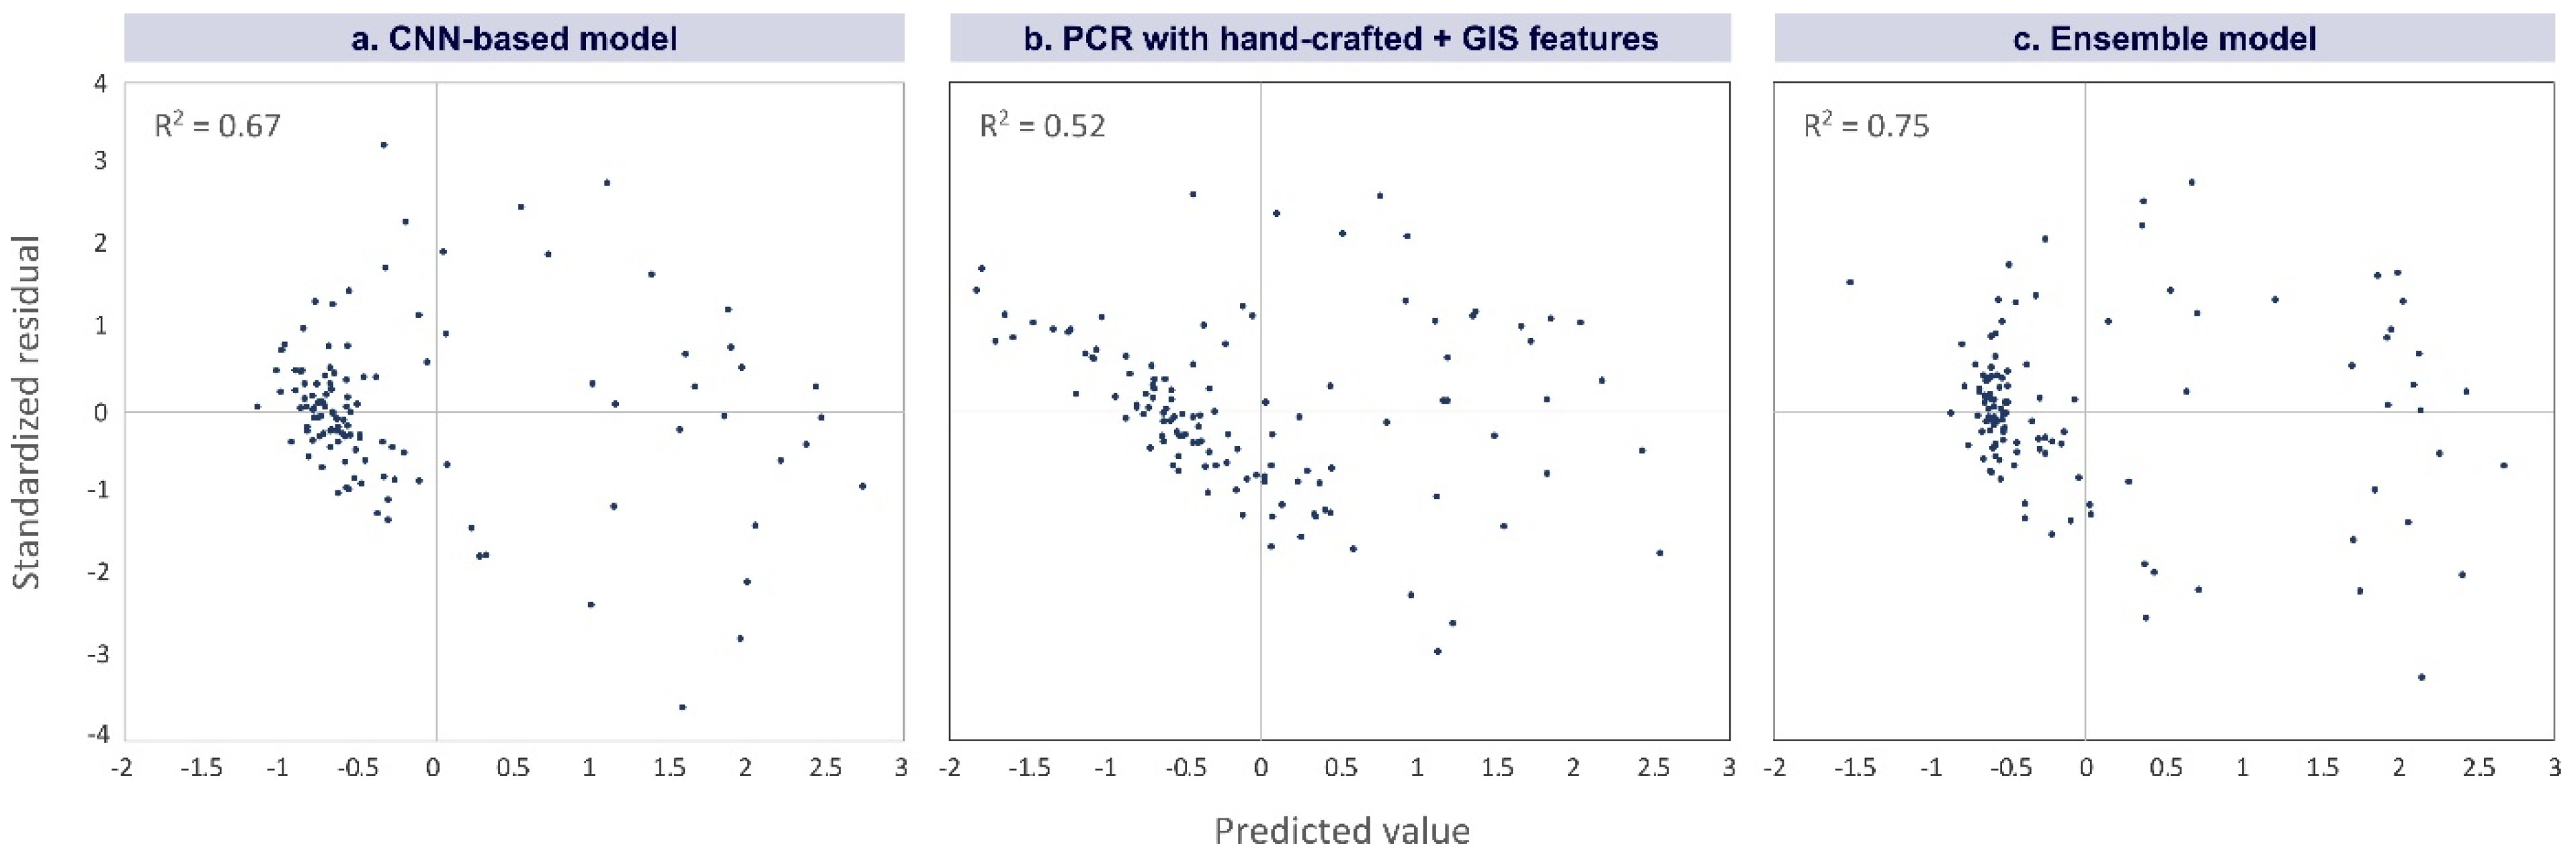
3.2. CNN-Based Model Performance
3.3. PCR Model Performance
3.4. Ensemble Models
4. Discussion
5. Conclusions
Supplementary Materials
Author Contributions
Funding
Acknowledgments
Conflicts of Interest
References
- United Nations. World Urbanization Prospects, The 2014 Revision; United Nation: New York, NY, USA, 2014. [Google Scholar]
- Kohli, D.; Sliuzas, R.; Kerle, N.; Stein, A. An ontology of slums for image-based classification. Comput. Environ. Urban Syst. 2012, 36, 154–163. [Google Scholar] [CrossRef]
- Mahabir, R.; Croitoru, A.; Crooks, A.; Agouris, P.; Stefanidis, A.; Mahabir, R.; Croitoru, A.; Crooks, A.T.; Agouris, P.; Stefanidis, A. A Critical Review of High and Very High-Resolution Remote Sensing Approaches for Detecting and Mapping Slums: Trends, Challenges and Emerging Opportunities. Urban Sci. 2018, 2, 8. [Google Scholar] [CrossRef]
- UN-Habitat. Informal Settlements; UN-Habitat: New York, NY, USA, 2015. [Google Scholar]
- UN-Habitat. The Challenge of Slums—Global Report on Human Settlements; Earthscan Publications Ltd.: London, UK, 2003. [Google Scholar]
- Arimah, B.C. The Face of Urban Poverty: Explaining the Prevalence of Slums in Developing Countries. In Urbanization and Development; Oxford University Press: Oxford, UK, 2010; pp. 143–164. [Google Scholar] [Green Version]
- Duque, J.C.; Patino, J.E.; Ruiz, L.A.; Pardo-Pascual, J.E. Measuring intra-urban poverty using land cover and texture metrics derived from remote sensing data. Landsc. Urban Plan. 2015, 135, 11–21. [Google Scholar] [CrossRef]
- Nijman, J. Against the odds: Slum rehabilitation in neoliberal Mumbai. Cities 2008, 25, 73–85. [Google Scholar] [CrossRef]
- Patel, S.; Baptist, C. Editorial: Documenting by the undocumented. Environ. Urban. 2012, 24, 3–12. [Google Scholar] [CrossRef]
- Kuffer, M.; Pfeffer, K.; Sliuzas, R.; Baud, I.; Maarseveen, M. Capturing the Diversity of Deprived Areas with Image-Based Features: The Case of Mumbai. Remote Sens. 2017, 9, 384. [Google Scholar] [CrossRef]
- Duque, J.C.; Royuela, V.; Noreña, M. A Stepwise Procedure to Determinate a Suitable Scale for the Spatial Delimitation of Urban Slums. In Defining the Spatial Scale in Modern Regional Analysis; Fernández Vázquez, E., Rubiera Morollón, F., Eds.; Springer: Berlin/Heidelberg, Germany, 2013; pp. 237–254. ISBN 978-3-642-31994-5. [Google Scholar]
- Olthuis, K.; Benni, J.; Eichwede, K.; Zevenbergen, C. Slum Upgrading: Assessing the importance of location and a plea for a spatial approach. Habitat Int. 2015, 50, 270–288. [Google Scholar] [CrossRef]
- Munyati, C.; Motholo, G.L. Inferring urban household socio-economic conditions in Mafikeng, South Africa, using high spatial resolution satellite imagery. Urban Plan. Transp. Res. 2014, 2, 57–71. [Google Scholar] [CrossRef]
- Thomson, C.N.; Hardin, P. Remote sensing/GIS integration to identify potential low-income housing sites. Cities 2000, 17, 97–109. [Google Scholar] [CrossRef]
- Weeks, J.R.; Hill, A.; Stow, D.; Getis, A.; Fugate, D. Can we spot a neighborhood from the air? Defining neighborhood structure in Accra, Ghana. GeoJournal 2007, 69, 9–22. [Google Scholar] [CrossRef] [Green Version]
- Williams, N.; Quincey, D.; Stillwell, J. Automatic Classification of Roof Objects from Aerial Imagery of Informal Settlements in Johannesburg. Appl. Spat. Anal. Policy 2016, 9, 269–281. [Google Scholar] [CrossRef]
- Kuffer, M.; Pfeffer, K.; Sliuzas, R.; Baud, I. Extraction of Slum Areas from VHR Imagery Using GLCM Variance. IEEE J. Sel. Top. Appl. Earth Obs. Remote Sens. 2016, 9, 1830–1840. [Google Scholar] [CrossRef]
- Ella, L.P.A.; van den Bergh, F.; van Wyk, B.J.; van Wyk, M.A. A Comparison of Texture Feature Algorithms for Urban Settlement Classification. In Proceedings of the IGARSS 2008—2008 IEEE International Geoscience and Remote Sensing Symposium, Boston, MA, USA, 7–11 July 2008; Volume 1, pp. III-1308–III-1311. [Google Scholar]
- Arribas-Bel, D.; Patino, J.E.; Duque, J.C. Remote sensing-based measurement of Living Environment Deprivation: Improving classical approaches with machine learning. PLoS ONE 2017, 12, 1–25. [Google Scholar] [CrossRef] [PubMed]
- Duque, J.C.; Patino, J.E.; Betancourt, A. Exploring the potential of machine learning for automatic slum identification from VHR imagery. Remote Sens. 2017, 9, 895. [Google Scholar] [CrossRef]
- Schug, F.; Okujeni, A.; Hauer, J.; Hostert, P.; Nielsen, J.Ø.; van der Linden, S. Mapping patterns of urban development in Ouagadougou, Burkina Faso, using machine learning regression modeling with bi-seasonal Landsat time series. Remote Sens. Environ. 2018, 210, 217–228. [Google Scholar] [CrossRef]
- Taubenböck, H.; Kraff, N.J.; Wurm, M. The morphology of the Arrival City—A global categorization based on literature surveys and remotely sensed data. Appl. Geogr. 2018, 92, 150–167. [Google Scholar] [CrossRef]
- Bergado, J.R.A.; Persello, C.; Gevaert, C. A Deep Learning Approach to the Classification of Sub-Decimetre Resolution Aerial Images. In Proceedings of the 2016 IEEE International Geoscience and Remote Sensing Symposium (IGARSS), Beijing, China, 10–15 July 2016; pp. 1516–1519. [Google Scholar]
- Bergado, J.R.; Persello, C.; Stein, A. Recurrent Multiresolution Convolutional Networks for VHR Image Classification. IEEE Trans. Geosci. Remote Sens. 2018, 56, 6361–6374. [Google Scholar] [CrossRef] [Green Version]
- Castelluccio, M.; Poggi, G.; Sansone, C.; Verdoliva, L. Training convolutional neural networks for semantic classification of remote sensing imagery. In Proceedings of the 2017 Joint Urban Remote Sensing Event, Dubai, UAE, 6–8 March 2017; pp. 1–4. [Google Scholar] [CrossRef]
- Scott, G.J.; England, M.R.; Starms, W.A.; Marcum, R.A.; Davis, C.H. Training Deep Convolutional Neural Networks for Land-Cover Classification of High-Resolution Imagery. IEEE Geosci. Remote Sens. Lett. 2017, 14, 549–553. [Google Scholar] [CrossRef]
- Huang, B.; Zhao, B.; Song, Y. Urban land-use mapping using a deep convolutional neural network with high spatial resolution multispectral remote sensing imagery. Remote Sens. Environ. 2018, 214, 73–86. [Google Scholar] [CrossRef]
- Zhang, C.; Sargent, I.; Pan, X.; Li, H.; Gardiner, A.; Hare, J.; Atkinson, P.M. An object-based convolutional neural network (OCNN) for urban land use classification. Remote Sens. Environ. 2018, 216, 57–70. [Google Scholar] [CrossRef] [Green Version]
- Mboga, N.; Persello, C.; Bergado, J.R.; Stein, A. Detection of informal settlements from VHR satellite images using convolutional neural networks. In Proceedings of the 2017 IEEE International Geoscience and Remote Sensing Symposium (IGARSS), Fort Worth, TX, USA, 23–28 July 2017; Volume 7, pp. 5169–5172. [Google Scholar]
- Persello, C.; Stein, A. Deep Fully Convolutional Networks for the Detection of Informal Settlements in VHR Images. IEEE Geosci. Remote Sens. Lett. 2017, 14, 2325–2329. [Google Scholar] [CrossRef] [Green Version]
- Engstrom, R.; Newhouse, D.; Haldavanekar, V.; Copenhaver, A.; Hersh, J. Evaluating the relationship between spatial and spectral features derived from high spatial resolution satellite data and urban poverty in Colombo, Sri Lanka. In Proceedings of the 2017 Joint Urban Remote Sensing Event (JURSE), Dubai, UAE, 6–8 March 2017; pp. 1–4. [Google Scholar]
- Jean, N.; Burke, M.; Xie, M.; Davis, W.M.; Lobell, D.B.; Ermon, S. Combining satellite imagery and machine learning to predict poverty. Science 2016, 353, 790–794. [Google Scholar] [CrossRef] [Green Version]
- Ministry of Housing Communities & Local Government English. Indices of Deprivation. Available online: https://www.gov.uk/government/statistics/english-indices-of-deprivation-2015 (accessed on 11 August 2017).
- Baud, I.; Sridharan, N.; Pfeffer, K. Mapping Urban Poverty for Local Governance in an Indian Mega-City: The Case of Delhi. Urban Stud. 2008, 45, 1385–1412. [Google Scholar] [CrossRef]
- Rains, E.; Krishna, A.; Wibbels, E. Combining satellite and survey data to study Indian slums: Evidence on the range of conditions and implications for urban policy. Environ. Urban 2018, 31, 267–292. [Google Scholar] [CrossRef]
- United Nations. The World’s Cities in 2016: Data Booklet; United Nations: New York, NY, USA, 2016; ISBN 978-92-1-151549-7. [Google Scholar]
- Jayatilaka, B.; Chatterji, M. Globalization and Regional Economic Development: A Note on Bangalore City. Stud. Reg. Sci. 2007, 37, 315–333. [Google Scholar] [CrossRef]
- Krishna, A.; Sriram, M.S.; Prakash, P. Slum types and adaptation strategies: Identifying policy-relevant differences in Bangalore. Environ. Urban 2014, 26, 568–585. [Google Scholar] [CrossRef]
- Martínez, J.; Pfeffer, K.; Baud, I. Factors shaping cartographic representations of inequalities. Maps as products and processes. Habitat Int. 2016, 51, 90–102. [Google Scholar] [CrossRef]
- Alkire, S.; Santos, M.E. Measuring Acute Poverty in the Developing World: Robustness and Scope of the Multidimensional Poverty Index. World Dev. 2014, 59, 251–274. [Google Scholar] [CrossRef] [Green Version]
- Pacione, M. Poverty and Deprivation in Western City. In Urban Geography: A Global Perspective; Routledge: New York, NY, USA, 2009; pp. 308–329. ISBN 1134043090. [Google Scholar]
- Rakodi, C.; Lloyd-Jones, T. Urban. Livelihoods: A People-Centerd Approach to Reducing Poverty; Earthscan Publications Ltd.: London, UK, 2002; ISBN 1853838608. [Google Scholar]
- Saharan, T.; Pfeffer, K.; Baud, I. Urban Livelihoods in Slums of Chennai: Developing a Relational Understanding. Eur. J. Dev. Res. 2017, 1–21. [Google Scholar] [CrossRef]
- Welsh Government. Welsh Index of Multiple Deprivation (WIMD) 2014; Welsh Government: Cardiff, Wales, 2014.
- Roy, D.; Palavalli, B.; Menon, N.; King, R.; Pfeffer, K.; Lees, M.; Sloot, P.M.A. Survey-based socio-economic data from slums in Bangalore, India. Sci. Data 2018, 5, 170200. [Google Scholar] [CrossRef] [Green Version]
- DynaSlum DynaSlum. Available online: http://www.dynaslum.com/ (accessed on 27 September 2018).
- Nagi, R. ESRI’s World Elevation Services. Available online: https://blogs.esri.com/esri/arcgis/2014/07/11/introducing-esris-world-elevation-services/ (accessed on 25 January 2018).
- ESRI Who We Are| About Esri. Available online: https://www.esri.com/en-us/about/about-esri/who-we-are (accessed on 1 October 2018).
- Le Roux, B.; Rouanet, H. Multiple Correspondence Analysis; SAGE Publications Inc.: Thousand Oaks, CA, USA, 2011; ISBN 9781412968973. [Google Scholar]
- Nielsen, M.A. Neural Networks and Deep Learning; Determination Press: New York, NY, USA, 2015. [Google Scholar]
- Chatfield, K.; Simonyan, K.; Vedaldi, A.; Zisserman, A. Return of the Devil in the Details: Delving Deep into Convolutional Nets. arXiv 2014, arXiv:1405.3531. [Google Scholar]
- Vermeiren, K.; Van Rompaey, A.; Loopmans, M.; Serwajja, E.; Mukwaya, P. Urban growth of Kampala, Uganda: Pattern analysis and scenario development. Landsc. Urban Plan. 2012, 106, 199–206. [Google Scholar] [CrossRef]
- Bottou, L. Stochastic Gradient Descent Tricks. In Neural Networks; Springer: Berlin/Heidelberg, Germany, 2012; pp. 421–436. [Google Scholar] [Green Version]
- Srivastava, N.; Hinton, G.; Krizhevsky, A.; Sutskever, I.; Salakhutdinov, R. Dropout: A Simple Way to Prevent Neural Networks from Overfitting. J. Mach. Learn. Res. 2014, 15, 1929–1958. [Google Scholar] [CrossRef]
- Krizhevsky, A.; Sutskever, I.; Hinton, G.E. ImageNet classification with deep convolutional neural networks. Commun. ACM 2017, 60, 84–90. [Google Scholar] [CrossRef]
- He, K.; Zhang, X.; Ren, S.; Sun, J. Delving deep into rectifiers: Surpassing human-level performance on imagenet classification. In Proceedings of the 2015 IEEE International Conference on Computer Vision, Las Condes, Chile, 11–18 December 2015; pp. 1026–1034. [Google Scholar]
- Vedaldi, A.; Lenc, K. MatConvNet. In Proceedings of the 23rd ACM International Conference on Multimedia; ACM: New York, NY, USA, 2015; pp. 689–692. [Google Scholar]
- Ioffe, S.; Szegedy, C. Batch Normalization: Accelerating Deep Network Training by Reducing Internal Covariate Shift. arXiv 2015, arXiv:1502.03167. [Google Scholar]
- Simard, P.; Steinkraus, D.; Platt, J.C. Best Practices for Convolutional Neural Networks Applied to Visual Document Analysis. In Seventh International Conference on Document Analysis and Recognition; IEEE: Piscataway, NJ, USA, 2003; pp. 958–963. [Google Scholar]
- Ojala, T.; Pietikäinen, M.; Mäenpää, T. Multiresolution gray-scale and rotation invariant texture classification with local binary patterns. IEEE Trans. Pattern Anal. Mach. Intell. 2002, 24, 971–987. [Google Scholar] [CrossRef]
- Field, A. Discovering Statistics Using IBM SPSS Statistics; Carmichael, M., Ed.; Sage: London, UK, 2013; Volume 53, ISBN 9788578110796. [Google Scholar]
- Ishizaka, A.; Labib, A. Analytic Hierarchy Process and Expert Choice: Benefits and limitations. OR Insight 2009, 22, 201–220. [Google Scholar] [CrossRef] [Green Version]
- Kohli, D.; Sliuzas, R.; Stein, A. Urban slum detection using texture and spatial metrics derived from satellite imagery. J. Spat. Sci. 2016, 61, 405–426. [Google Scholar] [CrossRef] [Green Version]


| Data Set | Indicators |
|---|---|
| HH (16 indicators 118 categories) | Caste, Highest educational level obtained, Dependency rate, Distance to healthcare, Income, Ration Card, Water source quality (summer and other seasons), Toilet facility, Access to electricity, Crowdedness, Dwelling age, Floor material, Wall material, Roof material, Travel time to services |
| QS (35 indicators 109 categories) | Dominant building type, Number of floors, Dominant building footprint size, Wall material, Roof material, Dominant shape of building, Overall state of buildings, Overall building appearance, Open spaces/green spaces, Appearance of open space, Presence of roads, Road pavement, Road material, Road width, Cables for electricity, Presence of footpaths, Footpath material, Streetlight, Pollution (smell, noise, waste), Open sewers, Presence of public toilet, Waterbody, Economic activities, Type of economic activities, Dominant land use around the slum, Feeling safe?, Are people interacting?, Are there vehicles visible?, Temple, Clothes of people, Having jewelry?, Hair of children, Children toys |
| Hyper-Parameter | Value |
|---|---|
| Batch size | 64 |
| Learning rate | Decreases logarithmically from 0.01 to 0.00001 |
| Weight decay | 0.0005 |
| Momentum | 0.9 |
| Feature Name | Specification | # of Features |
|---|---|---|
| Spectral info. | Band mean and standard deviation, NDVI mean and standard deviation | 8 + 2 |
| GLCM | 4 directions [i 0][i i][0 i][−i i]); i = 1,2,3,4; three properties | 16 + 16 + 16 |
| LBP | , , | 10 + 18 + 26 |
| GIS | Transportation: distance to (1) main road, (2) bus stop, (3) railway, (4) railway station; Healthcare: distance to (5) healthcare, (6) pharmacy; Other services: distance to (7) school, (8) leisure activities; Centrality: distance to (9) town hall; Environment: (10) distance to waterbody (11) elevation mean (12) slope mean. | 12 |
| Linear | Interactions | Quadratic + Interactions | 3rd Degree + Interactions | 4th Degree + Interactions | 5th Degree + Interactions | 6th Degree + Interactions | |
|---|---|---|---|---|---|---|---|
| CNN + hand-crafted + GIS | 0.73 | 0.73 | 0.73 | 0.75 | 0.74 | 0.74 | 0.41 |
| CNN + hand-crafted | 0.67 | 0.67 | 0.65 | 0.38 | 0.62 | −0.23 | <−1.00 |
| CNN + GIS | 0.71 | 0.71 | 0.71 | 0.65 | 0.49 | <−1.00 | <−1.00 |
© 2019 by the authors. Licensee MDPI, Basel, Switzerland. This article is an open access article distributed under the terms and conditions of the Creative Commons Attribution (CC BY) license (http://creativecommons.org/licenses/by/4.0/).
Share and Cite
Ajami, A.; Kuffer, M.; Persello, C.; Pfeffer, K. Identifying a Slums’ Degree of Deprivation from VHR Images Using Convolutional Neural Networks. Remote Sens. 2019, 11, 1282. https://doi.org/10.3390/rs11111282
Ajami A, Kuffer M, Persello C, Pfeffer K. Identifying a Slums’ Degree of Deprivation from VHR Images Using Convolutional Neural Networks. Remote Sensing. 2019; 11(11):1282. https://doi.org/10.3390/rs11111282
Chicago/Turabian StyleAjami, Alireza, Monika Kuffer, Claudio Persello, and Karin Pfeffer. 2019. "Identifying a Slums’ Degree of Deprivation from VHR Images Using Convolutional Neural Networks" Remote Sensing 11, no. 11: 1282. https://doi.org/10.3390/rs11111282