Article

Range-Doppler Based CFAR Ship Detection with Automatic Training Data Selection

by
Sushil Kumar Joshi
*,
Stefan V. Baumgartner
,
Andre B. C. da Silva
and
Gerhard Krieger
Microwaves and Radar Institute, German Aerospace Center (DLR), 82234 Wessling, Germany
*
Author to whom correspondence should be addressed.
Remote Sens. 2019, 11(11), 1270; https://doi.org/10.3390/rs11111270
Submission received: 9 April 2019 / Revised: 15 May 2019 / Accepted: 24 May 2019 / Published: 28 May 2019
(This article belongs to the Special Issue Remote Sensing of Target Detection in Marine Environment)

Abstract

:
Ship detection is an essential maritime security requirement. Current state-of-the-art synthetic aperture radar (SAR) based ship detection methods employ fully focused images. The time-consuming processing efforts required to generate these images make them generally unsuitable for real time applications. This paper proposes a novel real time oriented ship detection strategy applicable to range-compressed (RC) radar data acquired by an airborne radar sensor during linear, circular and arbitrary flight tracks. A constant false alarm rate (CFAR) detection threshold is computed in the range-Doppler domain using suitable distribution functions. Detection in range-Doppler has the advantage that principally even small ships with a low radar cross section (RCS) can be detected if they are moving fast enough so that the ship signals are shifted to the exo-clutter region. In order to determine a robust threshold, the ocean statistics have to be described accurately. Bright target peaks in the background ocean data bias the statistics and lead to an erroneous threshold. Therefore, an automatic ocean training data extraction procedure is proposed in the paper. It includes (1) a novel target pre-detection module that removes the bright peaks from the data already in time domain, (2) clutter normalization in the Doppler domain using the remaining samples, (3) ocean statistics estimation and (4) threshold computation. Various sea clutter models are investigated and analyzed in the paper for finding the most suitable models for the RC data. The robustness and applicability of the proposed method is validated using real linearly and circularly acquired radar data from DLR’s (Deutsches Zentrum für Luft- und Raumfahrt) airborne F-SAR system.

Graphical Abstract

1. Introduction

Target detection and monitoring in the maritime environment is an imperative measure to ensure safety and security on the open sea. The outputs of such activities are used by various agencies for the sustainable management of the ocean and its resources. One of the most popular maritime surveillance services is the automatic identification system (AIS) for the precise positioning of moving ships [1]. However, most of the vessels and small boats are not equipped with the AIS transceivers. Moreover, some vessels turn off their receivers to execute illegal activities which make it harder to detect them. Remotely sensed images acquired over the sea surface are able to provide wide area coverage and repetitive monitoring in such situations. Among the different imaging sensors, synthetic aperture radar (SAR) is considered to be one of the most effective due to its all-weather independent and day-night acquisition capabilities.
SAR sensors mounted either on spaceborne or airborne platforms illuminate the ground to record the backscattered signals. These signals are used to generate two-dimensional (2D) images with high resolution and wide swath coverage. In SAR images, ships generally appear as bright spots compared to its background, known as “sea clutter” due to their metallic structures and corners. Therefore, there exist a vast number of publications exploring the potential of fully focused SAR images to detect ships, e.g., based on ship wakes [2], generalized likelihood ratio test (GLRT) [3], as well as sublook decomposition and analysis [4]. Algorithms based on ship wake and polarimetric ship wake detection can provide additional information about the ship velocity and the moving direction [5,6,7] without using along-track interferometry. One of the widely used methods for detecting ships is to model the background ocean clutter by a stochastic clutter model to derive a detection threshold based on a constant false alarm rate (CFAR) [8].
The detections may be further used to generate high resolution images using, e.g., inverse SAR (ISAR) imaging techniques [9,10]. These images may be utilized for target recognition and identification purposes. For such applications, airborne platforms are very beneficial due to their flexibility to collect data with very high resolution and with short revisit and long observation times [11,12,13]. Furthermore, the use of multiple receiving channels offers additional advantages like clutter cancellation which leads to efficient target detection [14,15].
Additionally, keeping in mind the potential real time requirements of ship monitoring, the use of fully focused SAR images is not always the desirable choice. Extra processing efforts in terms of range cell migration correction and an additional azimuth compression using reference functions are necessary to generate these SAR images. Instead, using range-compressed data (RC) is very attractive, especially taking into account that no conventional computation time-consuming SAR processing has to be carried out. In [9,16], we have demonstrated the advantage of RC radar data to detect and image moving ships for different radar platforms.
The present paper proposes a novel processing chain for ship detection using RC radar data that is suitable for real time applications. More details on the use of RC data for target detection are given in Section 2. The target detection is carried out in the range-Doppler domain. The advantage of using the range-Doppler domain is that even ships with a low radar cross section (RCS) can be detected when they are moving with a certain line-of-sight velocity and are shifted to the exo-clutter region as discussed in detail in Section 2. Sea clutter models are used to derive a CFAR threshold. To get a valid threshold, such models need a careful selection of ocean training samples which correctly describe the background ocean statistics. Therefore, an automatic ocean training data selection approach is also proposed. Various CFAR-based sea clutter models are studied and compared to choose the best models for the RC data. To validate the proposed detection algorithm, experimental results from single-channel RC data acquired linearly and circularly with DLR’s (Deutsches Zentrum für Luft- und Raumfahrt) F-SAR airborne sensor are presented.
It has to be pointed out, although not further discussed in the paper, that the proposed method also can be used for ship detection in multi-channel RC data. Almost without modifications the proposed methodology can be applied on the sum-channel or on the clutter-suppressed channel obtained, e.g., after space-time adaptive processing (STAP) [17].
The remainder of this paper is organized as follows: Section 2 gives a brief description on the principle of the algorithm proposed in the paper. Details regarding the training data selection methodology are provided in Section 3. Various CFAR based sea clutter models implemented in this study are explained in Section 4. The clustering and tracking algorithms used in the paper are briefly explained and discussed in Section 5, followed by the experimental results, discussions and a final conclusion.

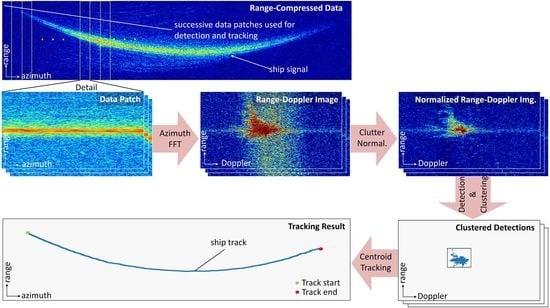
2. Principle of the Algorithm

Target detection is carried out in range-Doppler domain. If the ship moves with certain line-of-sight velocity v r 0 it will be shifted to a different Doppler frequency f DC . The relation between v r 0 and f DC is given as
f DC = 2 λ v r 0 ,
where λ is the radar wavelength. When this shift is larger than half the clutter bandwidth, i.e., | f DC | > B c / 2 where B c is the clutter bandwidth, then the target is shifted to the exo-clutter region. In this region generally a detection is possible.
For smaller line-of-sight velocities a detection may be prevented by the presence of strong clutter. Previous studies have shown that effective clutter suppression generally is only possible when multiple receiving channels are available [17,18]. For instance, techniques like post-Doppler space-time adaptive processing (STAP) [19] effectively suppress the clutter and normalize or whiten the Doppler spectrum so that directly a single CFAR threshold can be applied once the clutter statistics are estimated.
For normalizing or whitening single-channel data over Doppler, first the average Doppler spectrum has to be estimated. Once the Doppler spectrum is known, the data can be normalized to 0 dB before estimating the sea clutter statistics and computing the CFAR threshold.
The major processing steps of the proposed algorithm for ship detection in range-Doppler domain using RC data can be summarized as:
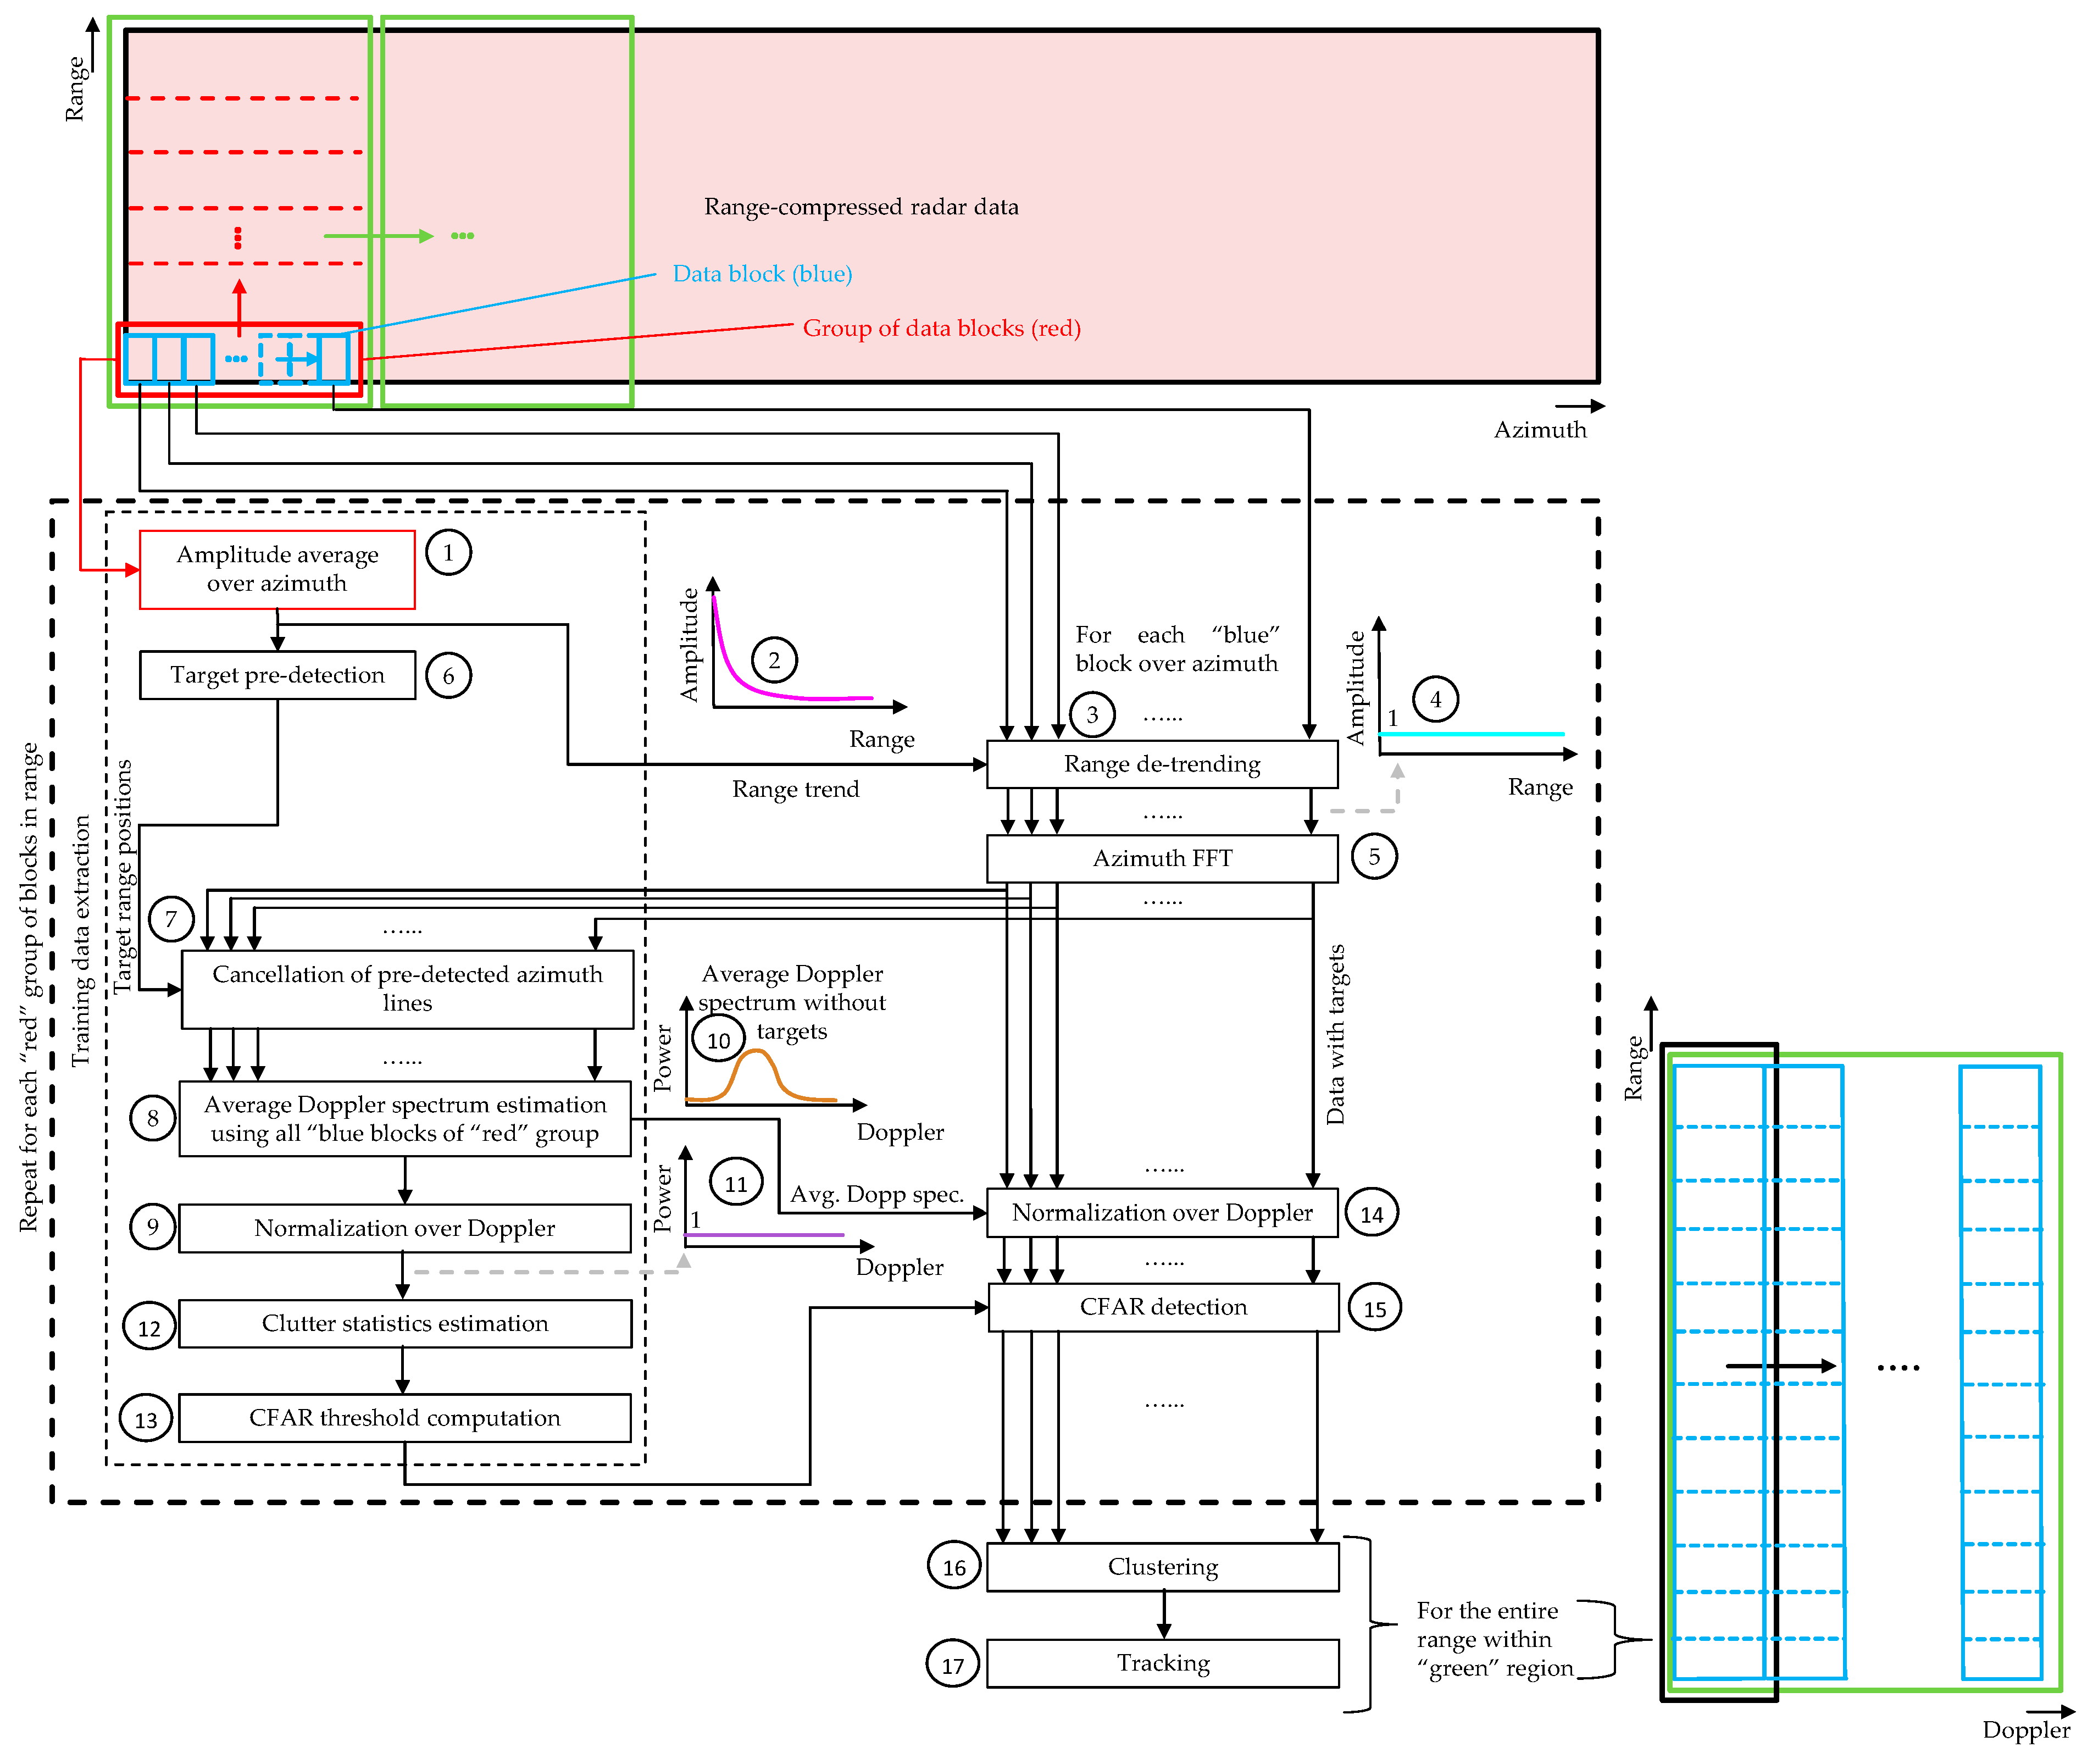
  • Extraction of a small data block from the RC radar data in time domain.
  • Transformation of the data block to range-Doppler domain via azimuth fast Fourier transform (FFT).
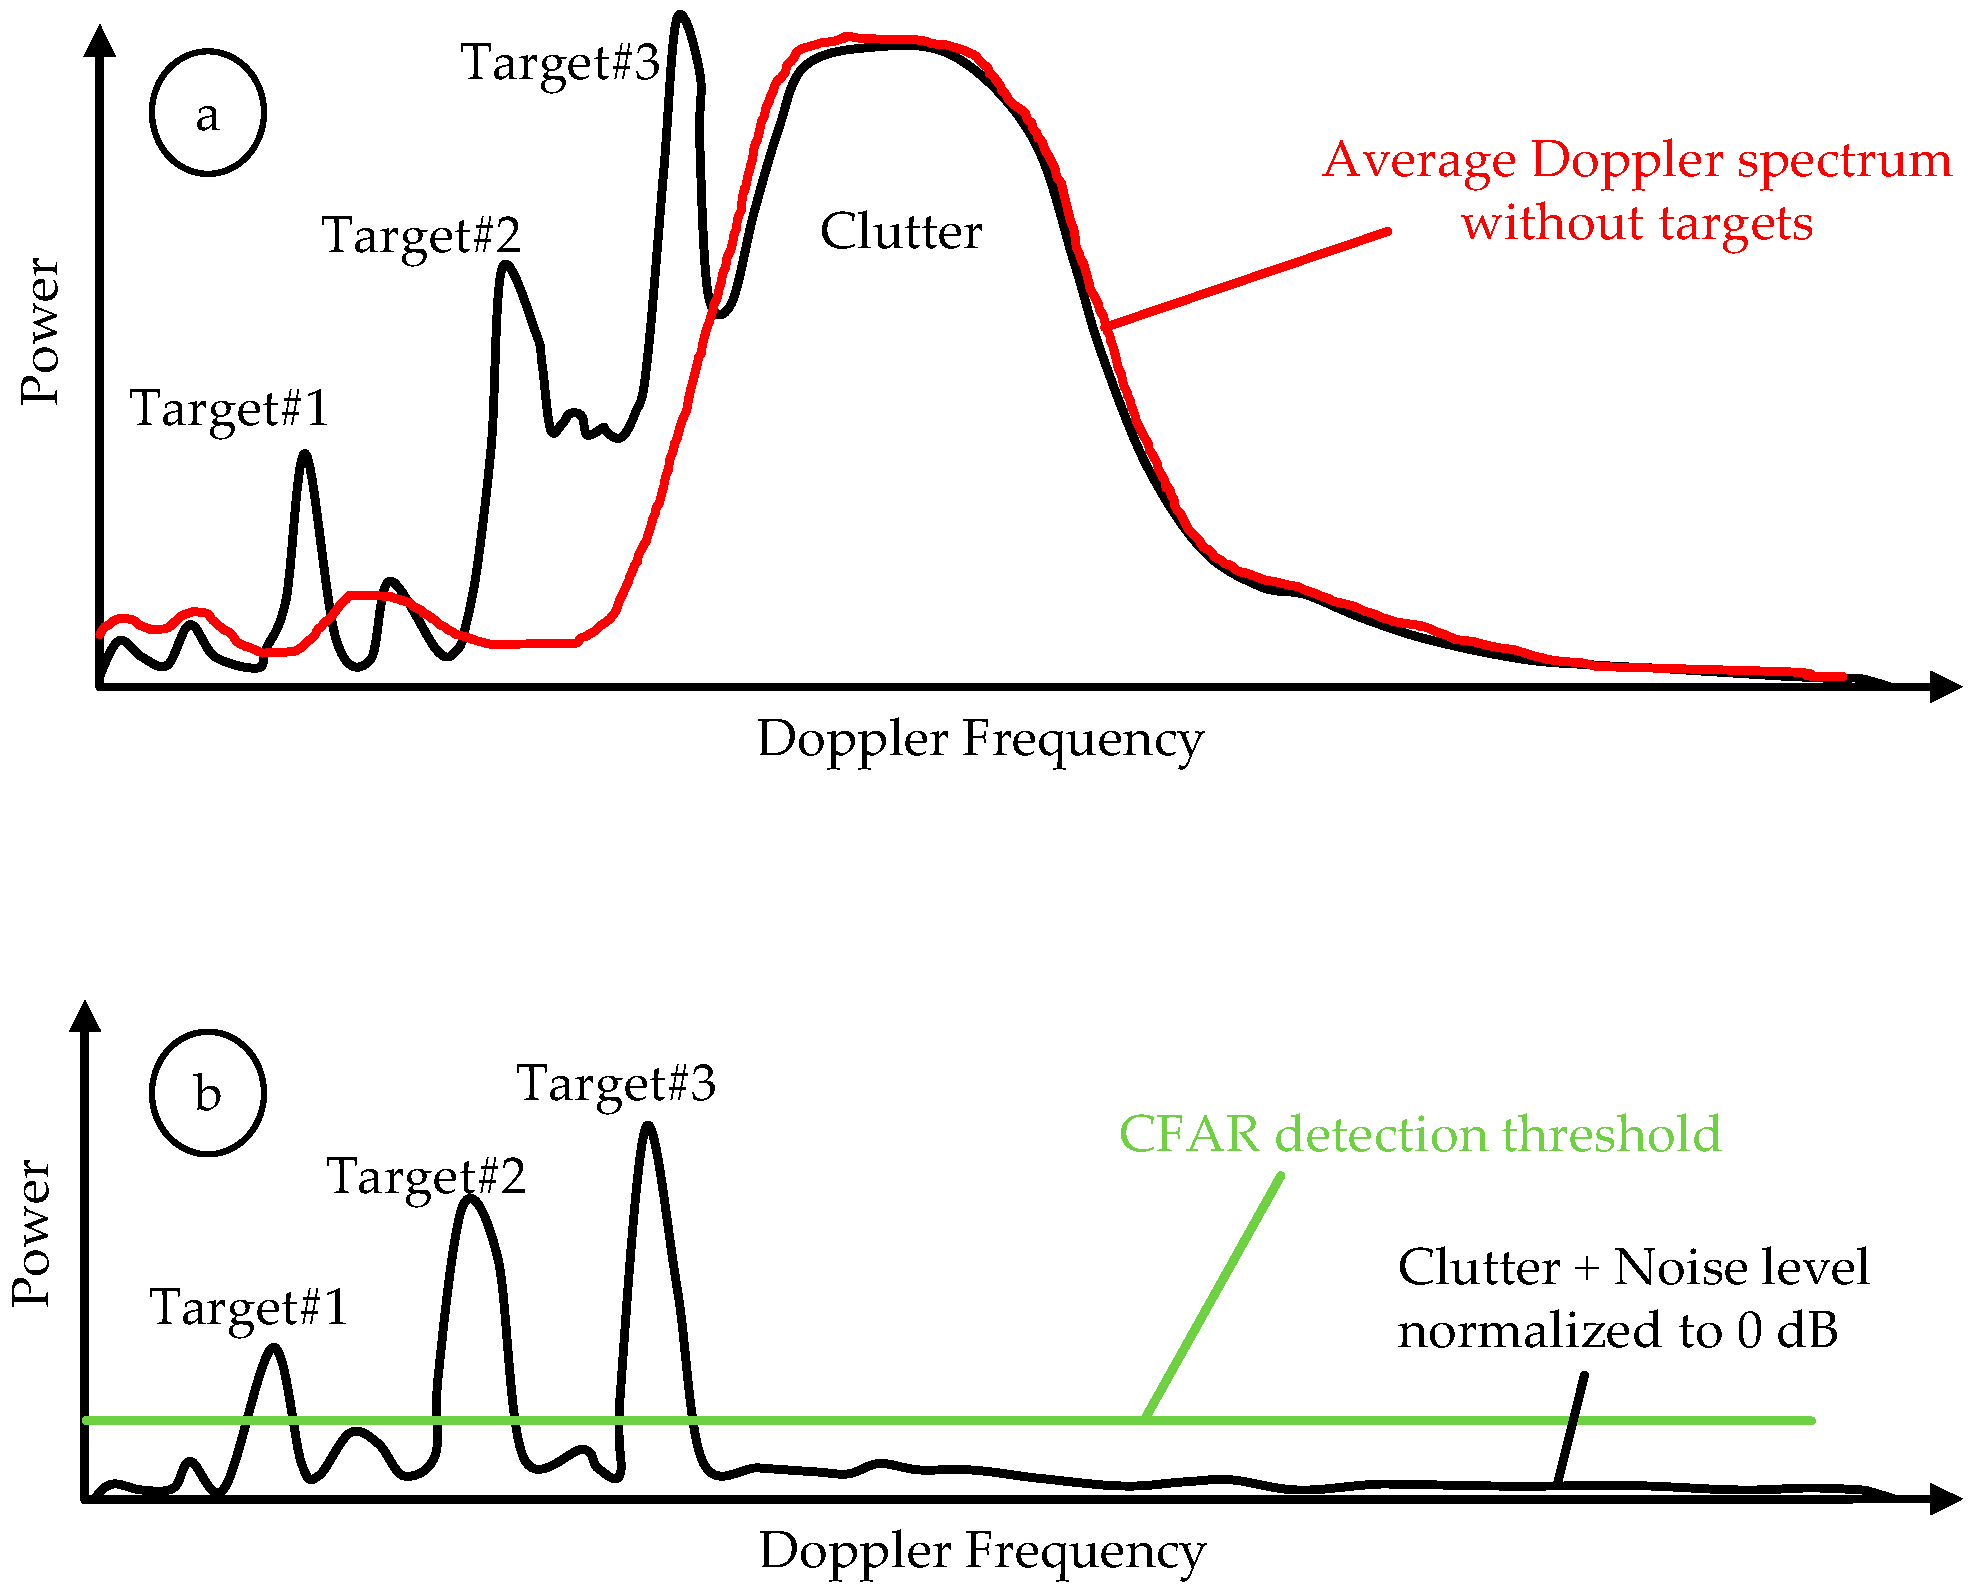
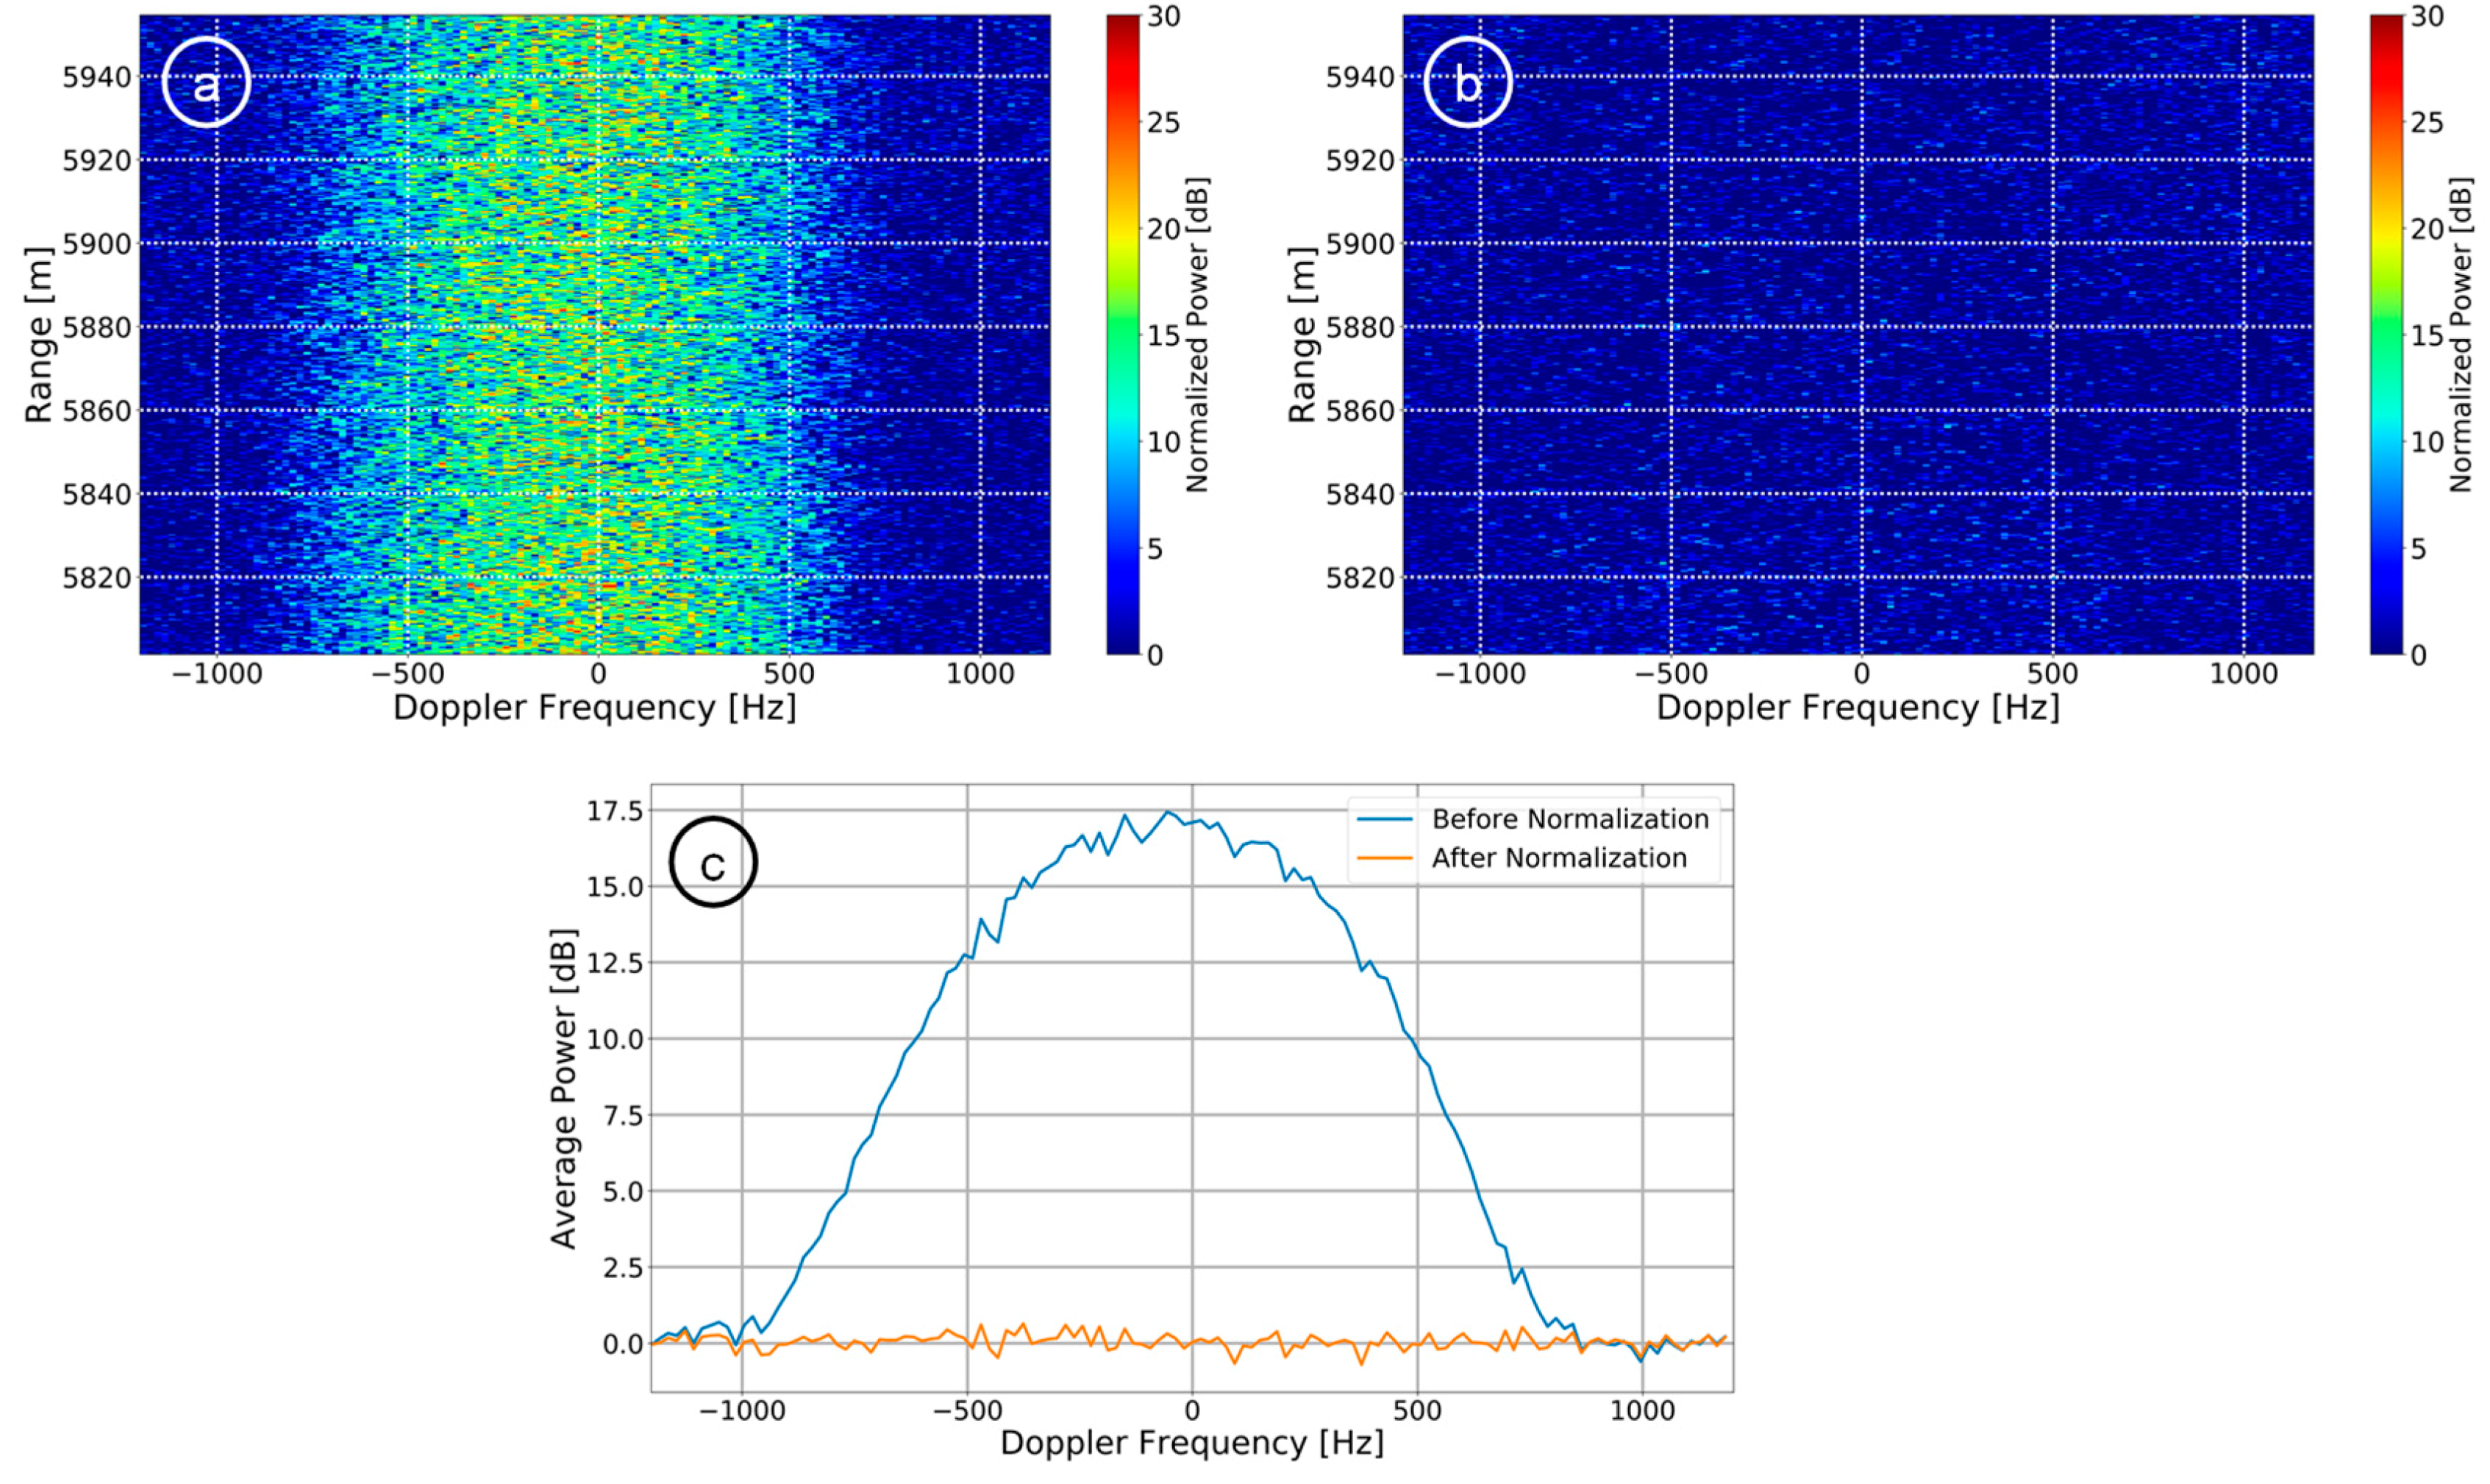
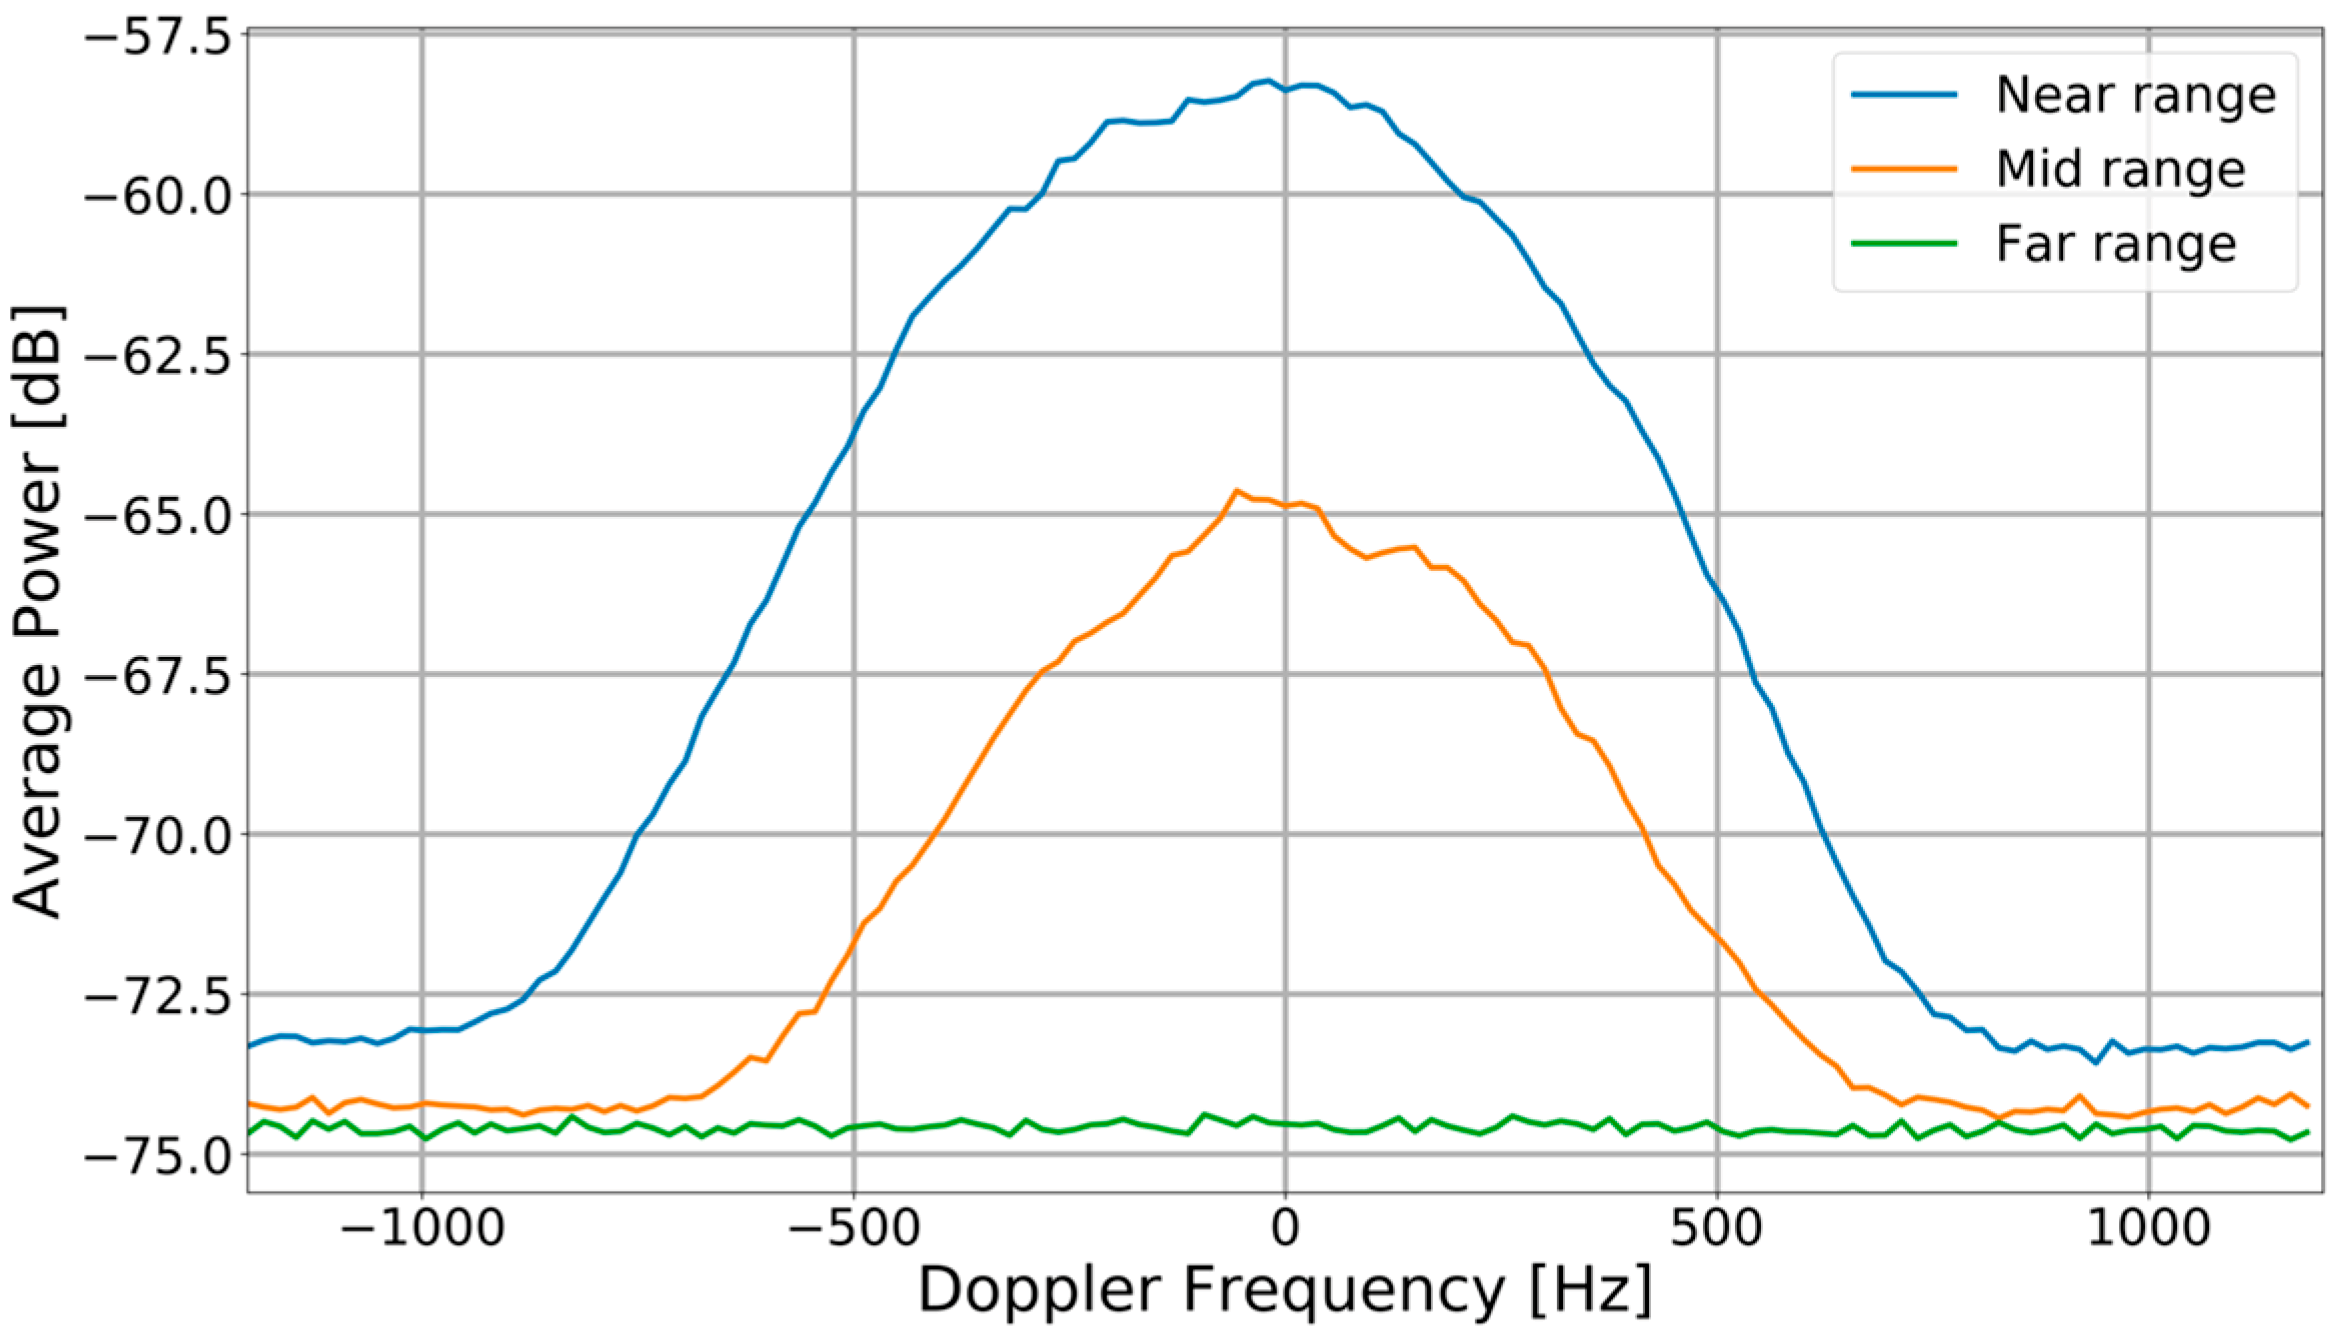
  • Normalization over Doppler for achieving a “flat” spectrum.
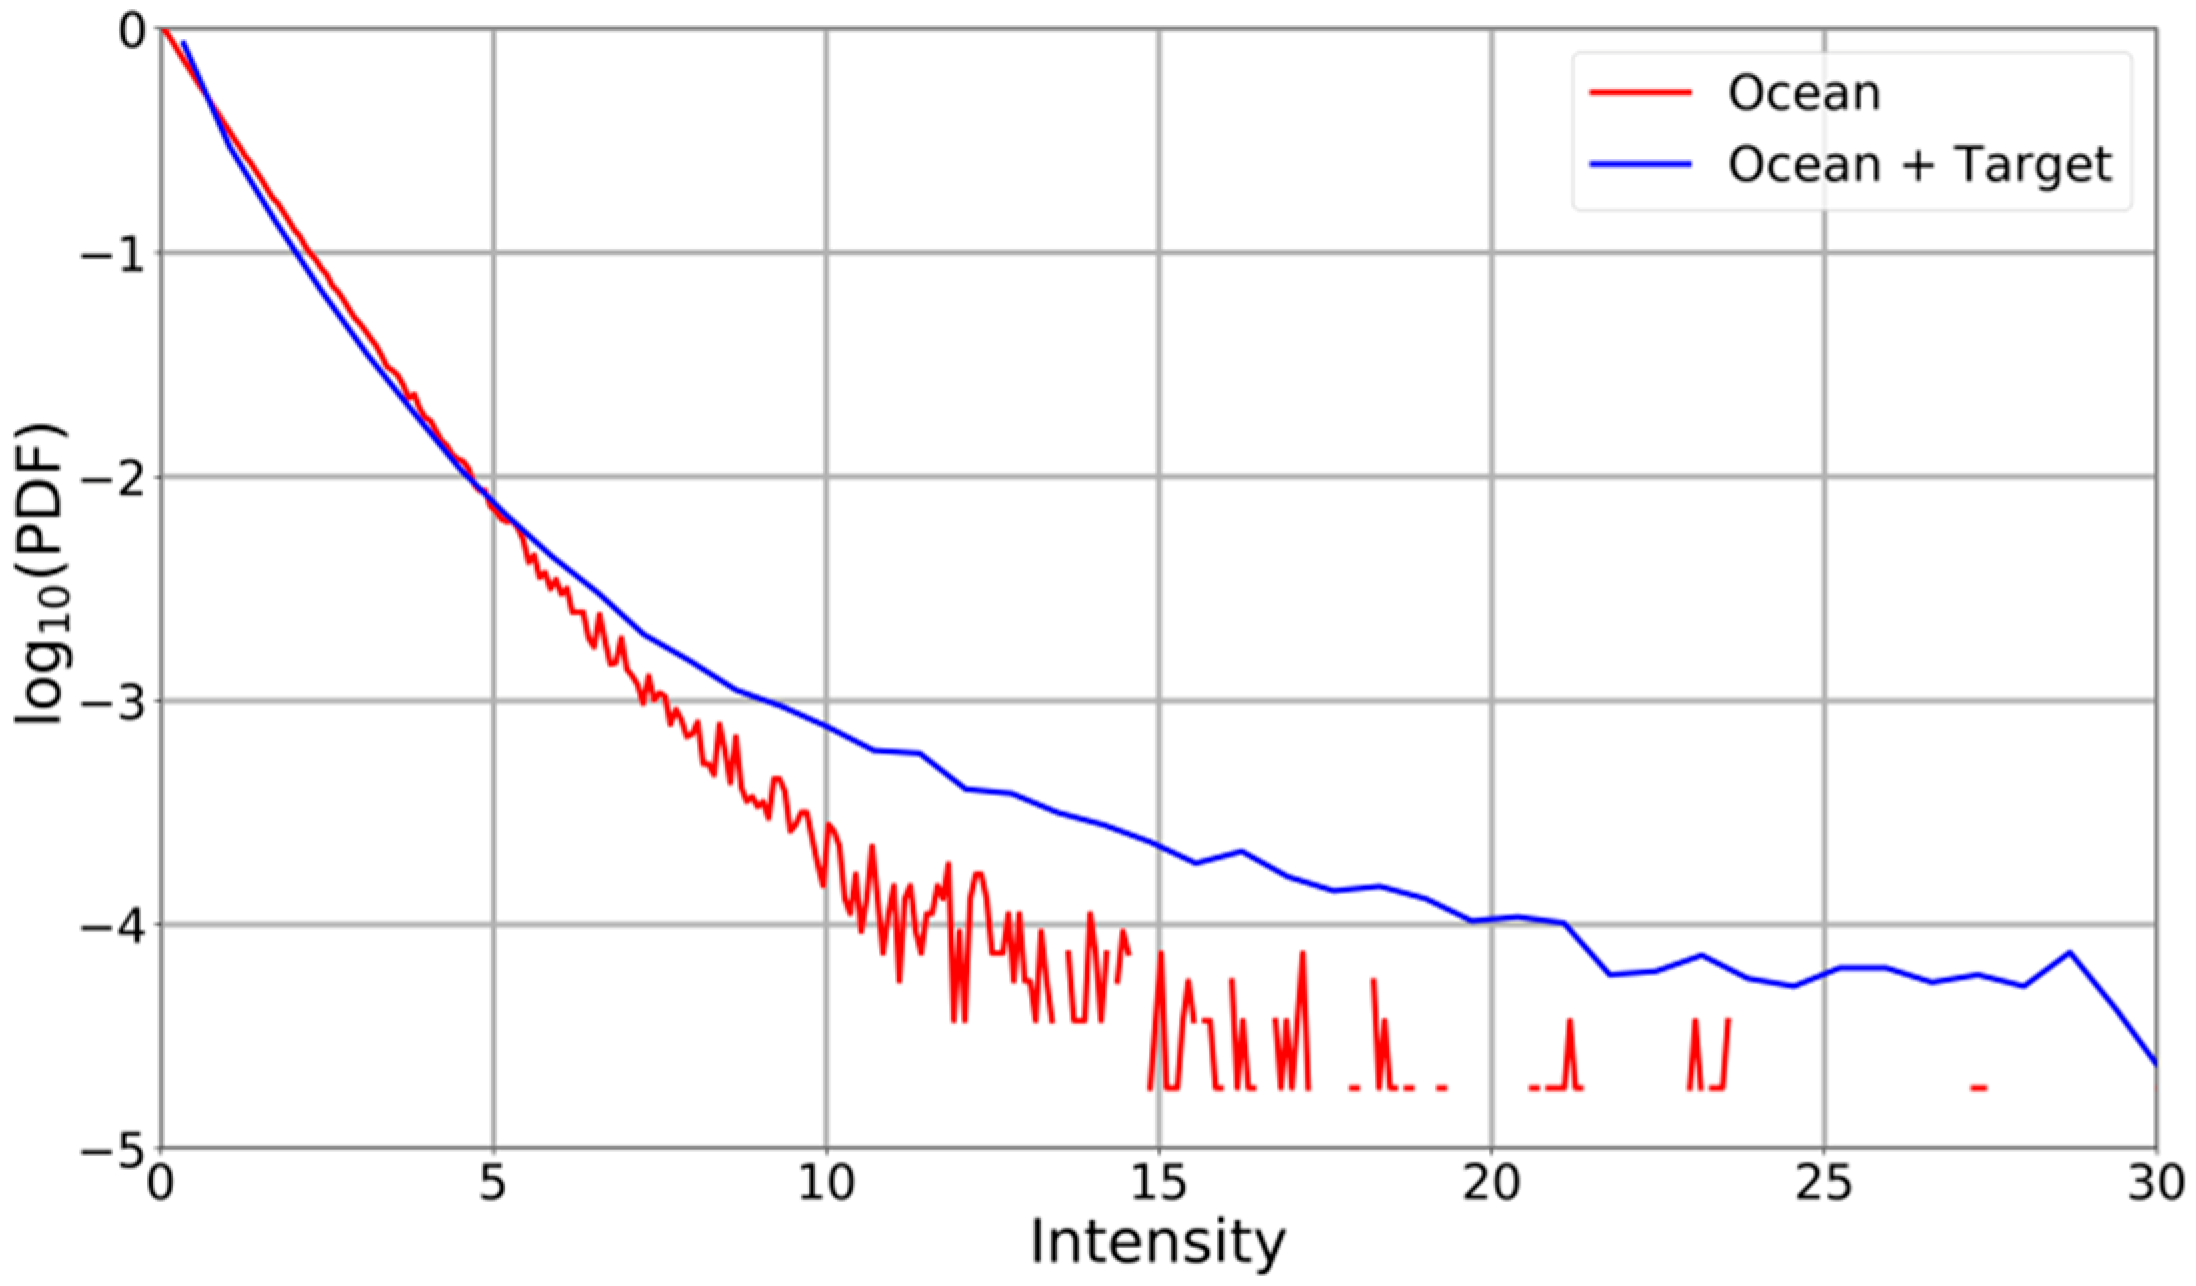
  • Estimation of the ocean clutter statistics.
  • Computation of a CFAR detection threshold based on the ocean clutter statistics.
  • Clustering of multiple detections to a single “physical object”.
  • Tracking of the clusters, i.e., of the cluster centroid positions.
Figure 1 illustrates the principle of the algorithm proposed in the paper. In this example, the images are generated using 128 azimuth and 512 range samples from F-SAR [20] X-band data. For visualization purposes, the images are normalized to a noise level of 0 dB.

2.1. Importance of Clutter Normalization

Clutter normalization is an important step in the proposed processing chain. The idea of clutter normalization is further illustrated in Figure 2.
The black curve in Figure 2a is the average Doppler spectrum of a range-Doppler image that includes both the clutter and the targets. Efficient clutter normalization requires the estimation of the red curve to perform normalization over Doppler [21,22]. This means that the potential targets have to be pre-detected first and cancelled before the estimation. Otherwise it will lead to a distorted power spectrum causing target self-whitening. After target pre-detection and clutter normalization the data can be considered as training data and can be used for fitting sea clutter models and computing a valid CFAR detection threshold (green line in Figure 2b).
A frequent update of the training data is very important, especially in case of ship detection using airborne platforms. This is because atmospheric disturbances cause variations in the aircraft’s Euler angles (roll, pitch and yaw) and these variations induce a change of the Doppler centroid over range and azimuth time. In the special case of a non-moving ocean surface, i.e., in case of stationary clutter, the clutter Doppler centroid is given as [23]
f clutter [ r , t ] 2 v p λ [ cos ( θ inc [ r ] + θ roll [ t ] ) tan ( θ pitch [ t ] ) + sin ( θ inc [ r ] + θ roll [ t ] ) tan ( θ yaw [ t ] ) ]
where v p , λ , θ inc , θ roll , θ pitch and θ yaw are the platform velocity, wavelength, incidence angle, roll, pitch and yaw, respectively.
For a non-moving ocean surface, the computed clutter Doppler centroid f clutter [ r , t ] as a function of range r and azimuth time t is shown in Figure 3 for a real circular flight of F-SAR. For computation, the Euler angles measured with the aircraft inertial measurement system were used.
From Figure 3 it is clear that, due to the change of the clutter Doppler centroid along range and azimuth time, a regular training data update is essential for obtaining a stable CFAR detection.
Note that in reality the ocean surface moves for itself and therefore will cause additional Doppler shifts. However, these shifts are anyhow considered by a regular training data update.

2.2. Algorithm Block Diagram

Figure 4 gives a detailed block diagram of the proposed methodology for ship detection in range-Doppler domain using single–channel RC radar data as input. Note that, as already mentioned in Section 1, instead of single-channel RC data, the sum-channel or the clutter-suppressed channel data obtained, e.g., after STAP applied on RC multi-channel data, can principally be used as input data as well.
In Figure 4, the RC radar data (top) are initially divided into “green” regions, where each green region is further partitioned along range into “red” sub-regions. Each red sub-region consists of a group of “blue” data blocks where each data block consists of a certain number of azimuth samples commonly known as coherent processing interval (CPI). The selection of the optimum number of azimuth samples is system dependent. For the F-SAR system, the typical acquisition geometry and the pulse repetition frequency (PRF) of 2400 Hz, we found that 128 azimuth samples per CPI are well suited.
First, an average amplitude profile over azimuth is estimated for a red sub-region (labelled with (1) in Figure 4). A trend along range is derived after performing median filtering (2). Then, for each blue data block this median filtered range trend is used for performing range de-trending (3). This is important for normalizing the range varying amplitude of the data to a constant value (4). After range de-trending, each data block is transformed into range-Doppler domain by performing an azimuth FFT (5).
From the “target pre-detection” module (6), the azimuth lines corresponding to “potential targets” at certain range positions are detected and cancelled in range-Doppler domain for each data block of the red sub-region (7). More details on the significance of target pre-detection and the proposed method are presented in Section 3.1. Afterwards, an average Doppler spectrum without target signals is estimated using all data blocks (8).
Normalization over Doppler is performed (9) individually for each “red” group of data blocks using the estimated average Doppler spectrum (10). As result a normalized Doppler spectrum is obtained (11).
More details on the average Doppler spectrum estimation and normalization are given in Section 3.2. The normalized, target free data are used as training data to estimate the local ocean clutter statistics (12). By setting a desired probability of false alarms (PFA) and by using the estimated statistics from the sea clutter model, a CFAR detection threshold is computed (13).
The average Doppler power spectrum (10), which was estimated before, is further used to normalize the “original” “blue” range-Doppler data blocks (14) (see also Figure 1a,b). The CFAR threshold is then applied individually to each of these data blocks to detect the ship pixels (15). This procedure is repeated until all “red” groups of data blocks along range (i.e., within the “green” region at the top of Figure 4) are covered.
Finally, clustering (16) is performed using all the available detections along the complete range of the scene and 128 azimuth samples (cf. black box in Figure 4 bottom right). The 2D positions of the computed cluster centroids for each “black” data block are then used for “Tracking” (17). The refined target positions obtained after tracking in range-Doppler domain are then projected back to time domain. An example of this processing step is shown in Figure 1d.
Although not shown in the block diagram in Figure 4 and not topic of the paper, by using the tracking information the RC data belonging to each detected ship can be extracted and used for generating high-resolution ISAR image sequences [9,24]. Furthermore, in the case of using multi-channel data, the target track or the target positions can also be converted easily to geographical coordinates using the estimated direction-of-arrival angle. Even a tracking directly applied on the geographical positions is then possible, either as the main tracking step or as a second tracking step, with the main goal of improving the accuracy of the geographical positions.
The proposed algorithm is mainly foreseen for airborne radar but not for spaceborne radar vessel detection. The major reason is because the algorithm only uses a relatively small number of azimuth samples for the azimuth FFT and the ship detection. This generally is too less for obtaining a sufficiently high peak signal-to-noise ratio (SNR) required for successful spaceborne vessel detection. In contrast, for the airborne case, a short integration time in the order of a few milliseconds, and hence, a small number of azimuth samples is sufficient for obtaining high enough peak SNR values. Therefore, for the spaceborne radars, either single-channel algorithms optimized for fully focused SAR images [10] or more sophisticated multi-channel algorithms, for instance the powerful EDPCA or ISTAP algorithms [25], should be used.

3. Training Data Selection

An appropriate selection of training data and sea clutter statistics estimation lead to an accurate computation of the detection threshold. In reality, training samples within a region of interest may be contaminated by target peaks and high clutter peaks. A typical example of the presence of a bright ship signal in the RC radar data in the time domain is shown in Figure 5.
To understand the effects of ocean clutter contamination due to bright targets, a logarithmic plot of the probability density functions (PDFs) of “ocean only” and “ocean with the bright ship signal” is shown in Figure 6.
Figure 6 shows how the presence of the target and other high peaks in the background clutter skews the histogram to extremely high intensity values (blue). Such high intensities can severely degrade the performance of clutter models. The detection threshold may be raised to a very high value which lowers the probability of detection. In the literature, such effects are termed as “capture effects”. Other complications in the modeling of sea clutter arise due to the presence of high clutter peaks that causes sudden transition and shift in the background intensity values. These effects are known as “clutter edge effects” [26].
Several versions of CFAR detectors were developed in the past to improve the target detection performance by eliminating these outliers. Order statistic CFAR, trimmed CFAR, censored mean level detector, iterative censoring are some of the state-of-the-art methods used to remove interfering targets. Despite showing relatively good performance in homogeneous scenarios, these techniques either have limited performance in heterogeneous environments, require wise choice of the parameters or are computationally ineffective [27,28,29,30]. More recently, a new algorithm based on truncated statistics CFAR (TS-CFAR) was developed in [31] where the threshold is estimated from the truncated distribution functions. TS-CFAR has been shown as a very effective way to eliminate the outliers and estimate a robust threshold. Although being a powerful method, the truncation depth has first to be fixed to a certain value and the truncated statistical distribution functions have to be derived afterwards. Fixing the truncation depth is tedious and deriving the truncated version of the sophisticated sea clutter models is both complex and time-consuming.
All these aforementioned developments and their associated problems led us to propose a simple, robust and effective method to pre-detect the potential targets with real time capability. In the following, the target pre-detection method in the time domain, the clutter normalization step and the importance of training data update are explained in detail.

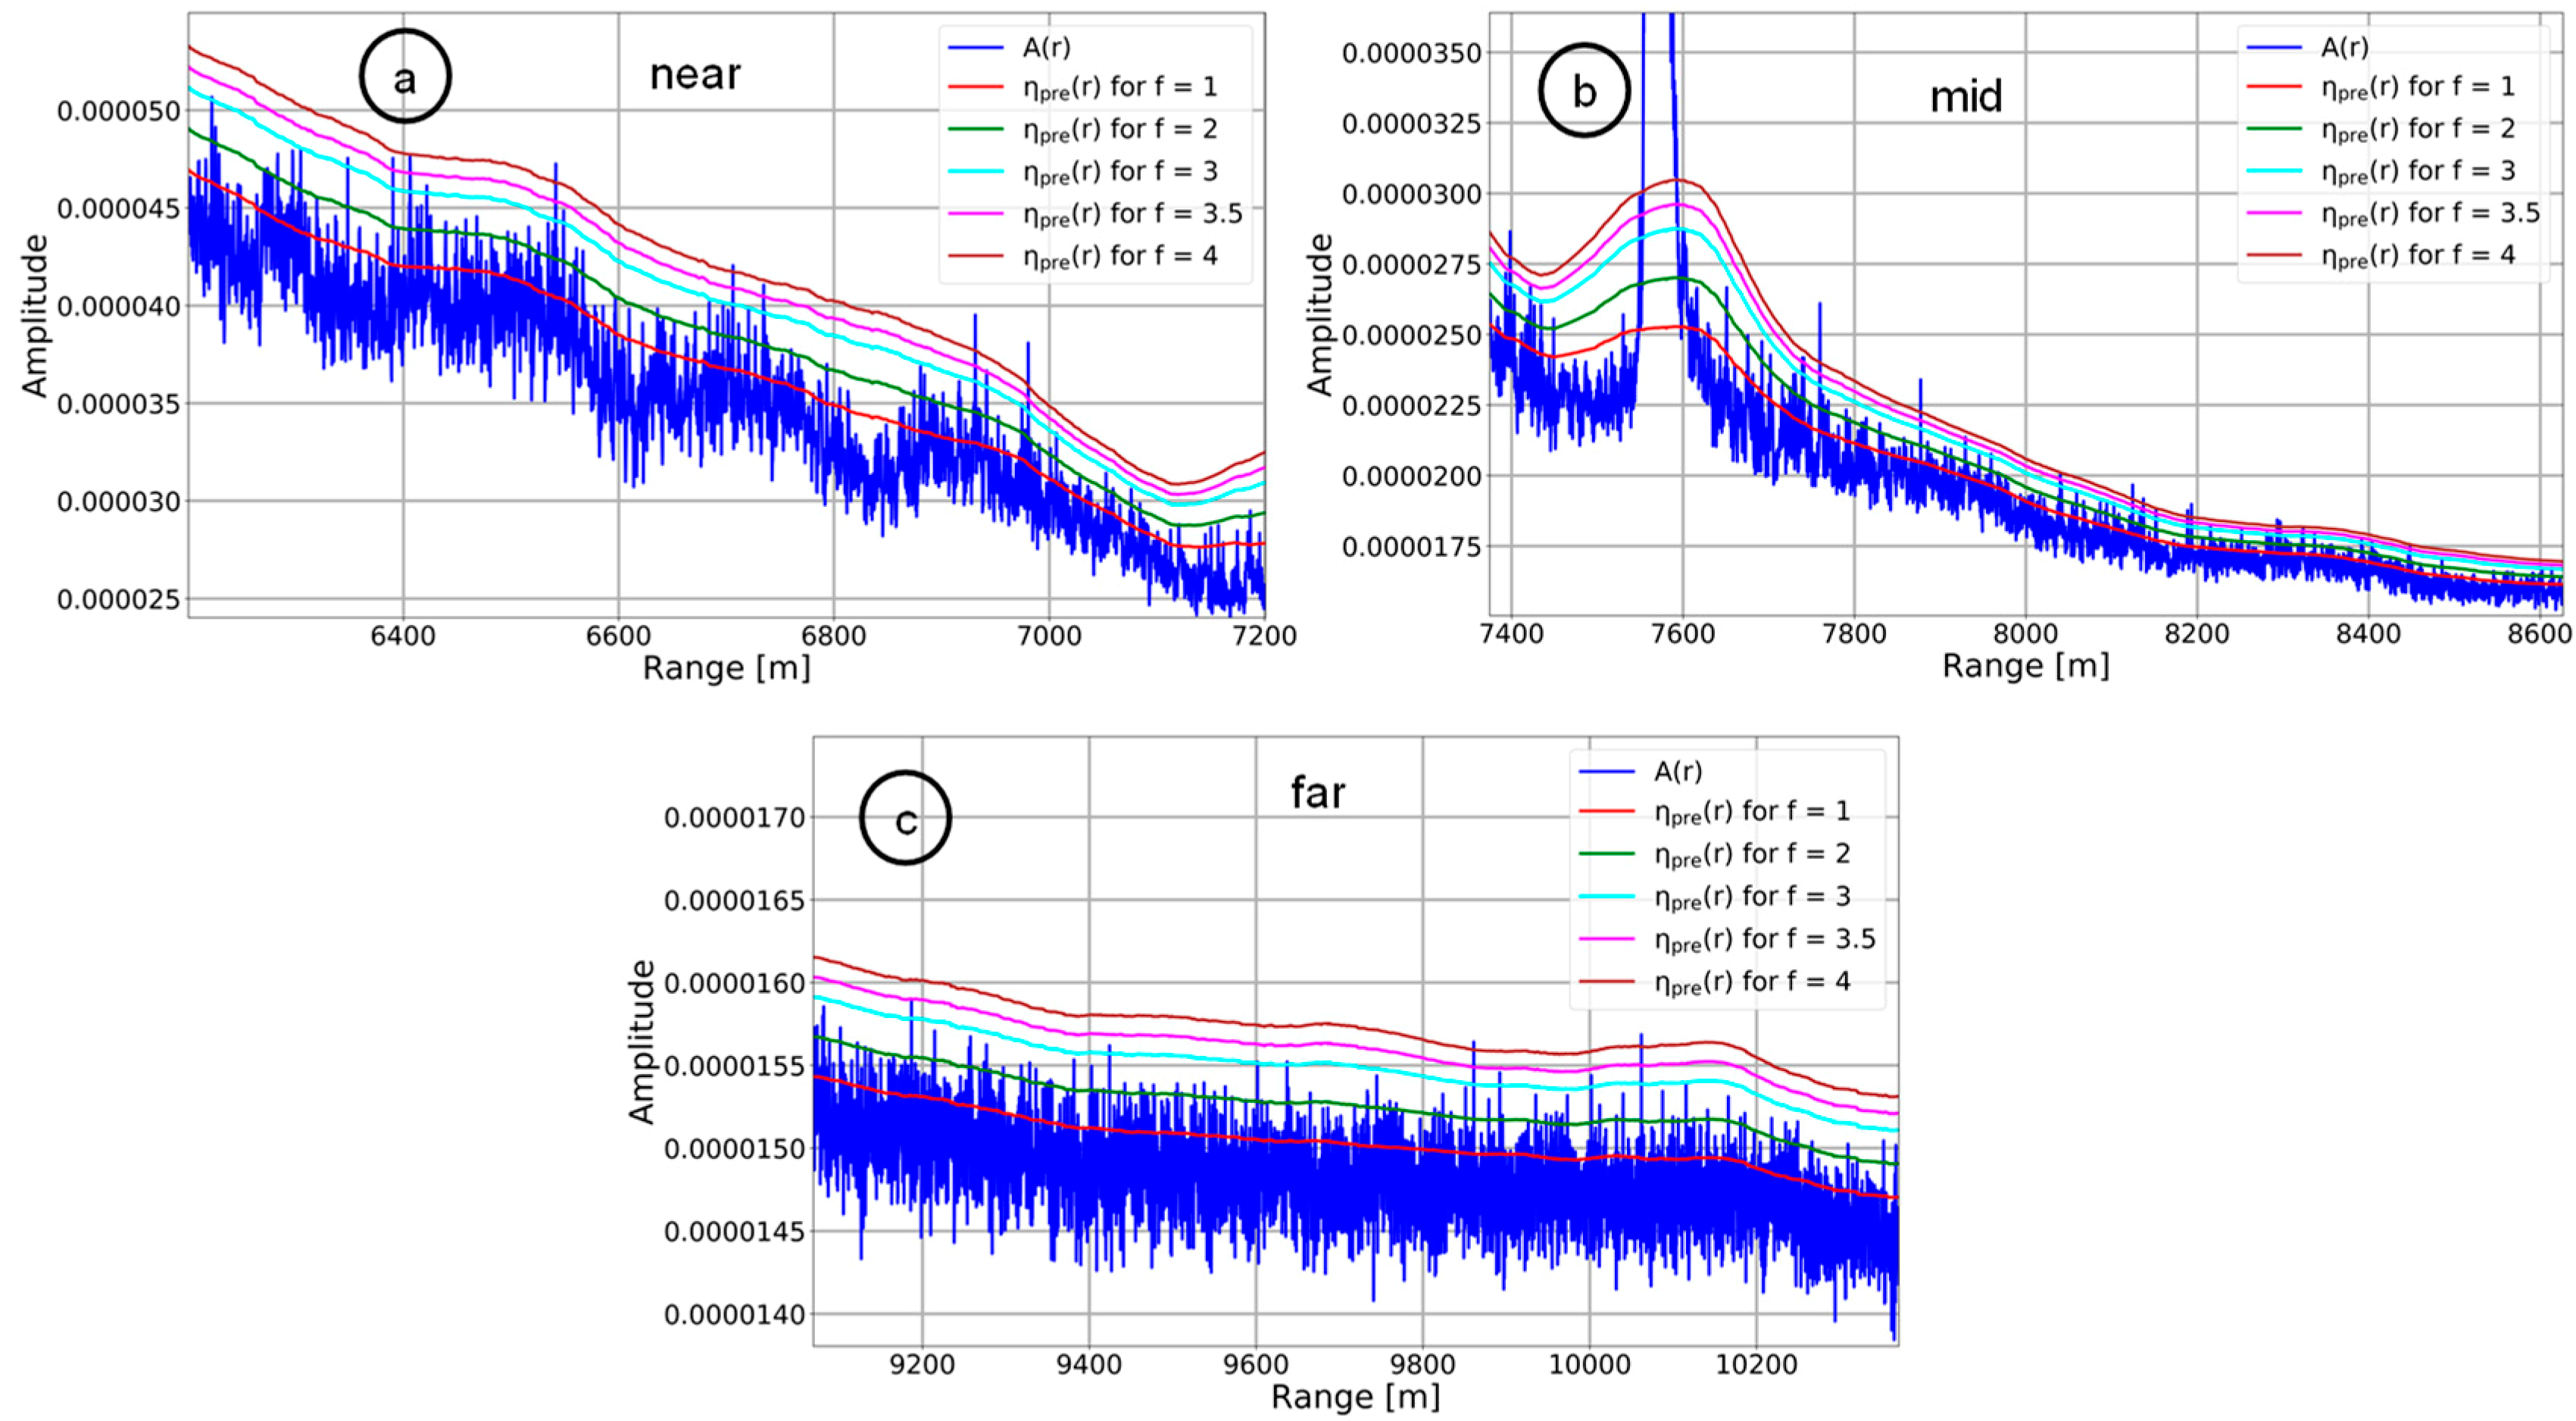
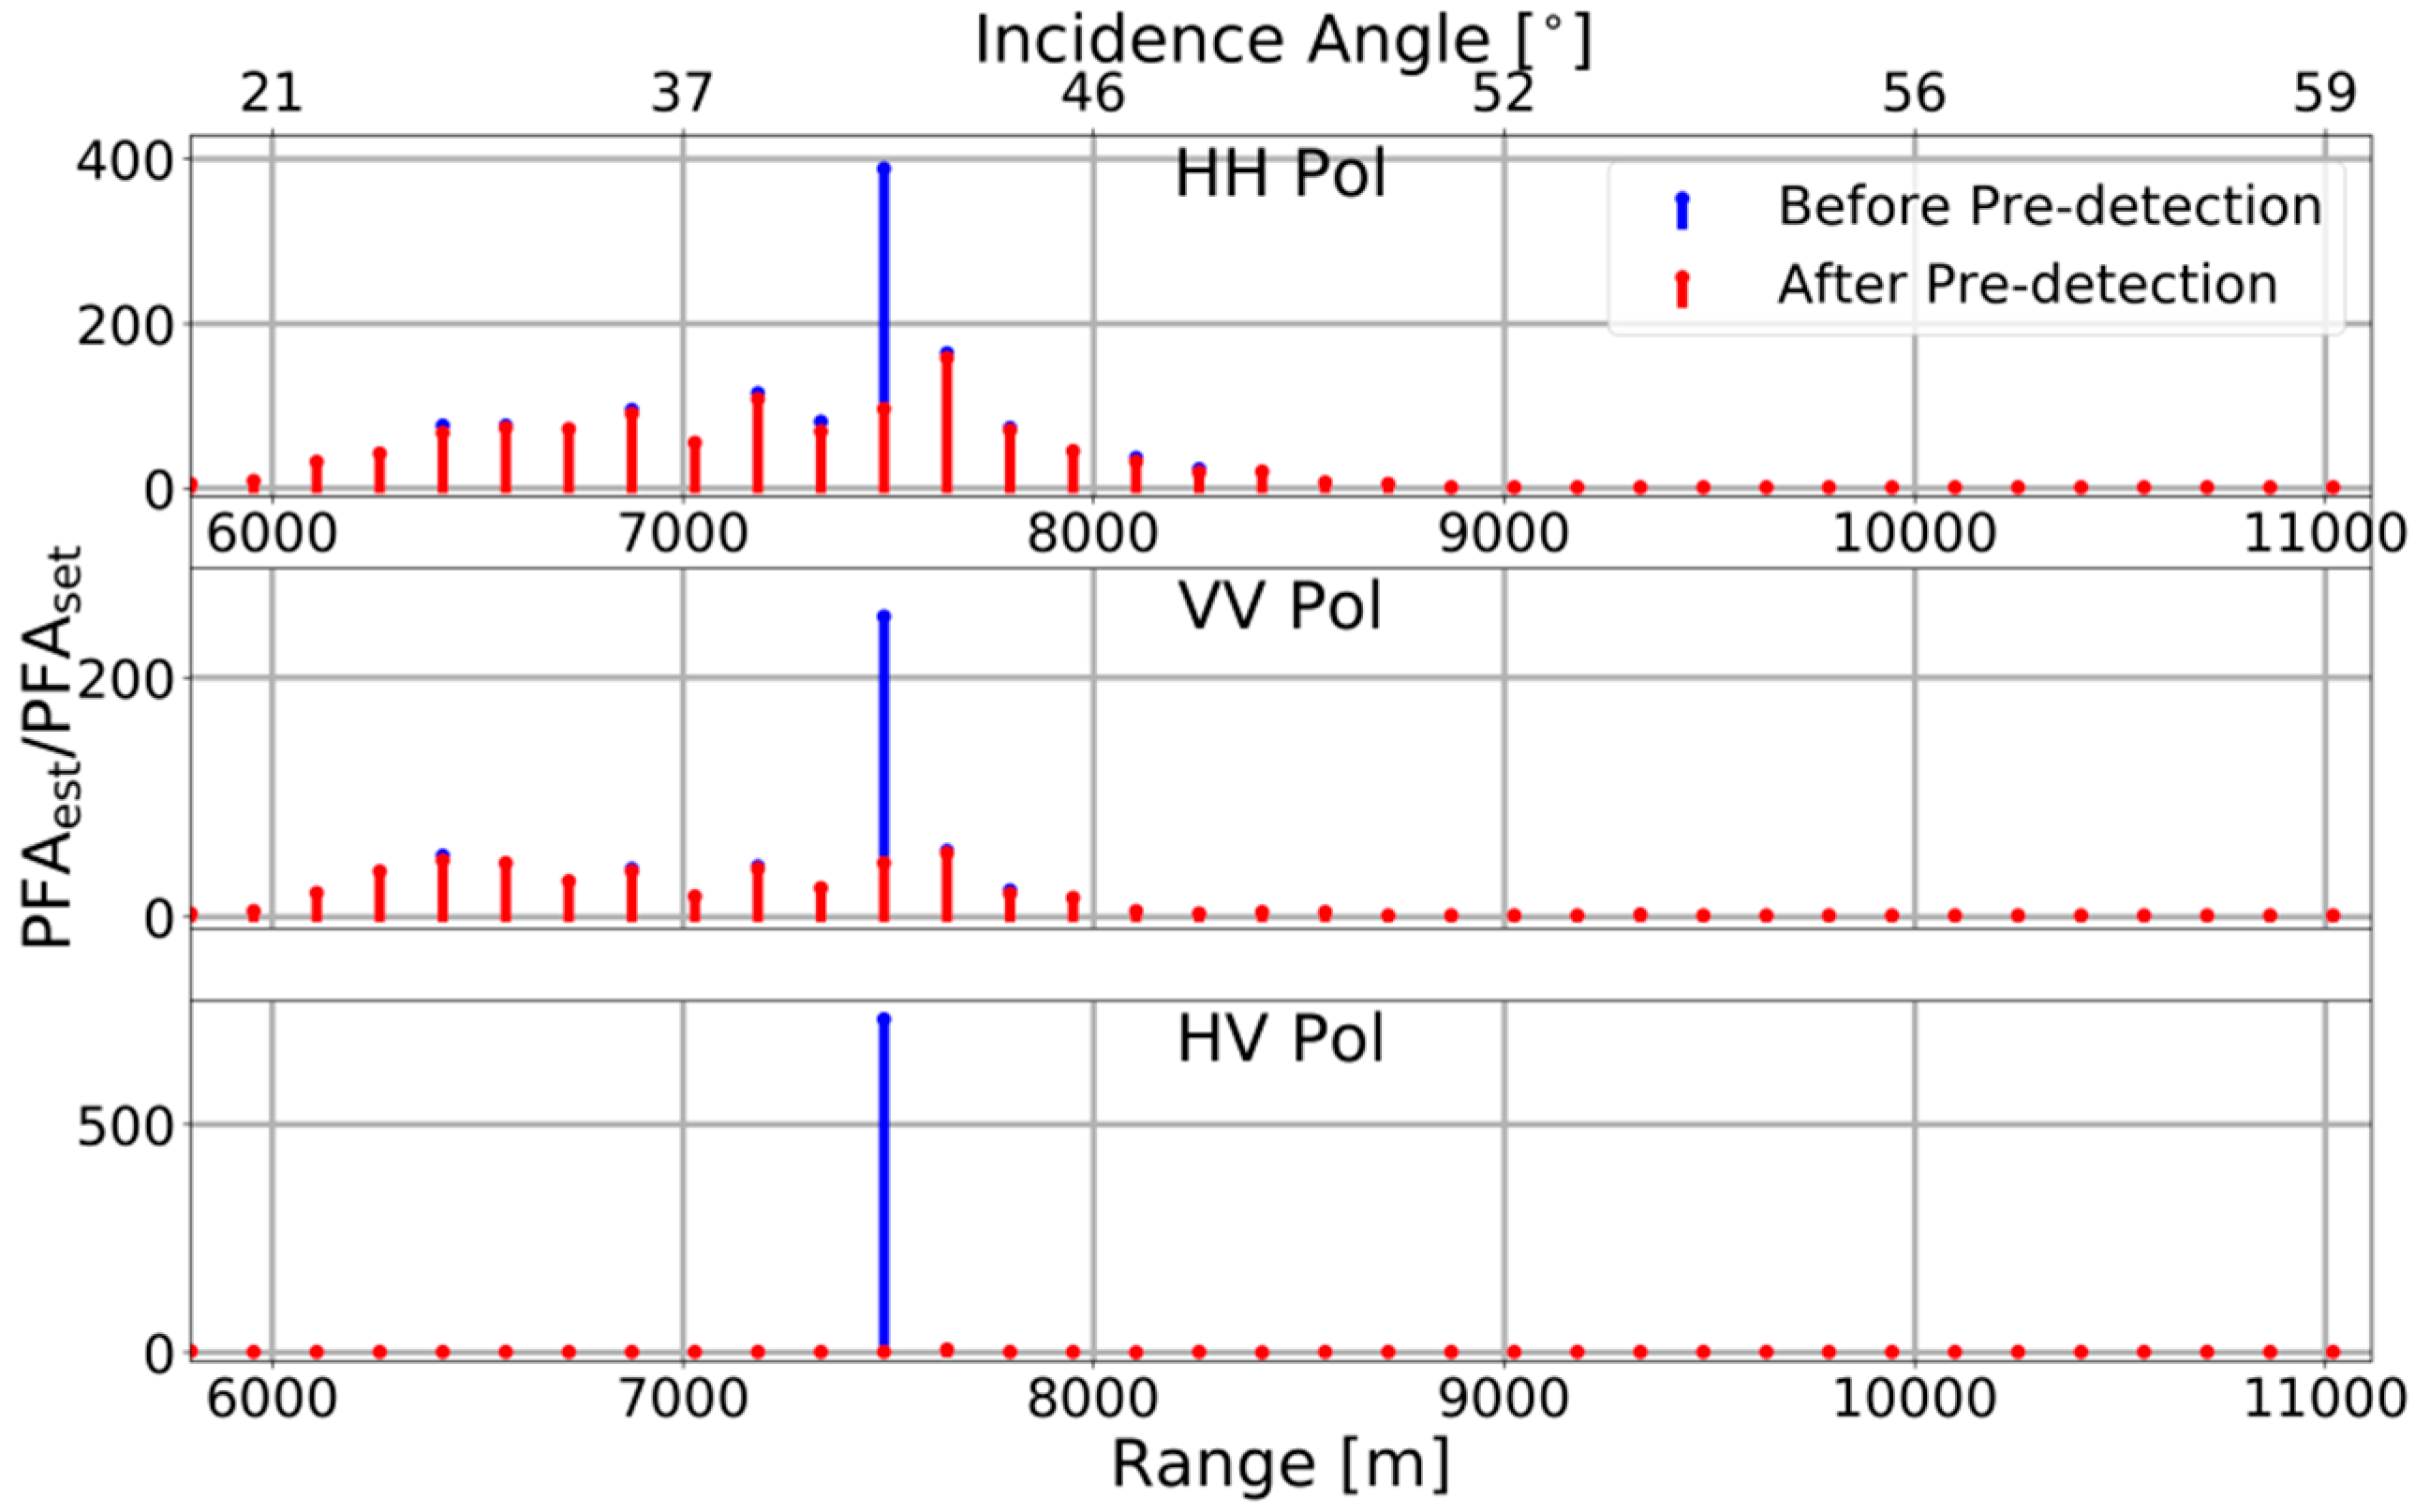
3.1. Target Pre-Detection

The proposed target pre-detection method is based on deriving an adaptive threshold which varies along range. Such a threshold is needed because the backscatter received by the radar system is range and incidence angle dependent. The proposed target pre-detection algorithm contains the following major steps:
  • RC radar data extraction in time domain (cf. green region in Figure 4).
  • Incoherent summation over azimuth.
  • Range-dependent adaptive threshold computation.
  • Target peak detection and cancellation.
For incoherent summation over azimuth let us consider a set of complex amplitude pixels z spanning over N azimuth samples and R range bins of the scene (cf. green region from Figure 4). The average amplitude profile A ( r ) for r = 1 ,   2 ,   3 ,   . R of these data is given as
A ( r ) =   1 N n = 1 N | z ( r ,   n ) | ,
Figure 7 shows A ( r ) which is plotted for different polarization channels of an F-SAR data patch which is free of target.
It can be seen in Figure 7 that the amplitude variation is a function of range and incidence angle, respectively. Generally, high backscatter is received at low incidence angles, the amplitude decreases as the incidence angle increases. The intensity of the backscatter observed is highest in HH channel and lowest in HV channel. It is now clear that for detecting potential targets at any range, the pre-detection threshold has to be adaptive along range. Therefore, the pre-detection threshold η pre ( r ) is defined as a function of range η pre ( r ) = f ( r ) where r is the range.
Referring to (3), the samples are incoherently added along azimuth and an average amplitude for each range is computed. Applying a moving average filter to A ( r ) will not be an effective step to cancel the target peaks. These peaks might be extremely high which could significantly alter the center mean computed from the samples within the moving window. Instead, we suggest applying a one-dimensional moving median filter of a certain window size because the median is more robust and less sensitive to such outliers. The median A ˜ ( r ) of the data vector A ( r ) is written as
A ˜ ( r ) = median ( A ( r ) ) ,
Instead of using the standard deviation around the mean to compute a pre-detection threshold, we use the median absolute deviation (MAD). Compared to the standard deviation computed from the mean, the MAD is a more robust estimator to measure the statistical dispersion and it is resilient to the outliers present in the data [32]. The M A D ( r ) is given as
M A D ( r ) = median ( | A ( r ) A ˜ ( r ) | ) ,
The M A D ( r ) is then used to estimate the standard deviation σ ( r ) defined as
σ ( r ) = k M A D ( r ) ,
where k is a scale factor with k 1.4826 representing the 0.75 quantile of the standard Gaussian distribution.
The standard deviation σ ( r ) is further smoothened by applying a Savitky Golay (SG) filter [33] with the window size being same as the one used in median filtering. This filter performs a moving polynomial fit to the data in order to further reduce the noise without greatly affecting the signal. The SG filter becomes a simple moving average filter when the polynomial order is 0. Unlike the moving average filter, which along with the noise also removes the high frequency component of the signal, the SG filter of a certain polynomial order is able to preserve these components in the data. There are no general guidelines to choose an appropriate parameter for the SG filter, however a polynomial order of two is a good compromise which leads to reasonable results for the F-SAR data.
The final mathematical expression for the adaptive pre-detection threshold η pre ( r ) can then be written as
η pre ( r ) = A ˜ ( r ) +   f   SG ( σ ( r ) ) ,
where f > 1 is a factor used to determine the decision criterion to set the pre-detection threshold. Figure 8 shows the influence of different factors f on the outlier detection.
From Figure 8 and Figure 9 it is noticed the pre-detection threshold is not only able to detect target peaks but also other high clutter peaks. A threshold based on a setting of f = 1 or 2 would cancel most of the peaks which might have originated from the ocean. The goal of target pre-detection is to cancel only the bright targets and high clutter peaks. Therefore, the best value for f has to be found empirically. For F-SAR X-band HH data it was found that a value of f = 3.5 or 4 effectively detects the outliers.
To demonstrate the effectiveness of the proposed pre-detection algorithm, it is applied to a real X-band HH polarized RC data in time domain. Exemplary data containing a ship signal are shown in Figure 10. For this particular case, the suitable window size of the median filter was set to 625. For an F-SAR range sample spacing of 0.3 m this value corresponds to an approximately 188 m slant range distance. It is recommended that the window size of the median filter should be in the order of the maximum expected slant range length of the ships to be pre-detected. This ensures proper peak detection capability.
The binary pre-detection map of the bright targets and outliers after applying the proposed pre-detection algorithm is shown in Figure 11.
To further illustrate the robustness of the pre-detection algorithm, the ratio of the actual (i.e., measured) false alarm rate P F A est and the desired false alarm rate P F A set was evaluated using the K-distribution sea clutter model (cf. Section 4.1) applied before and after target pre-detection and cancelation. In the optimum case, when the data contain no ships and no spiky clutter, the ratio P F A est / P F A set should be one. Practically this cannot be achieved, since there is always a slight difference between the chosen ocean clutter model and the actual ocean clutter statistics. The measured actual false alarm rate P F A est is obtained from the ratio
P F A est =   n detections n total ,
where n detections is the total number of obtained detections assuming that the evaluated data patch contains no ship targets, and n total is the total number of samples contained in the same data patch.
From the data shown in Figure 10 the HH, VV and HV polarization channels were chosen for the evaluation. A K-distribution sea clutter model was fit to the data and a CFAR detection threshold was computed for a desired false alarm rate P F A set = 10 6 . The measured ratio P F A est / P F A set is shown in Figure 12. The higher the ratio the worse is the detection performance.
As observed in Figure 12, irrespective of the polarization channels, the presence of a target severely degrades the estimated false alarm rate. After applying the proposed pre-detection algorithm which also cancels the target, the actual false alarm rate around the target region gets drastically improved. The value is in the order of the adjacent ranges which contain no target. However, the ratio is still higher in the near and mid ranges of the HH and VV channels. This is due to the fact that the K-distribution generally is not well suited for the RC F-SAR data. A further explanation and discussion on the proper selection of the optimum sea clutter model is given later in Section 4.
In addition to this, the Doppler centroid map of the data is also generated to further examine the potential of the pre-detection algorithm. The Doppler centroid is estimated from the data using the energy balance algorithm proposed in [34]. A moving window of 512 range samples and 128 azimuth samples for estimating the Doppler centroid were applied over linearly and circularly acquired RC F-SAR L-band data. The results are shown in Figure 13.
It can be clearly seen in the second row of Figure 13 that any bright target signals, contained in the first row, were cancelled after applying the proposed pre-detection module. It has to be further noted, that the Doppler centroid in Figure 13d matches well with the one computed using the aircraft’s Euler angles (cf. Figure 3 where a non-moving ocean surface is assumed). The observable difference is among others given by the fact that the ocean surface moves itself. Principally the ocean surface velocity can be estimated by exploiting the Doppler centroid differences. However, this is not the scope of the paper.
The strange Doppler centroid values in Figure 13c are due to the presence of sandbanks in the Wadensee area which lies in the southeastern part of the North Sea close to the town Cuxhaven. The ocean surface is very heterogeneous in this area. This is confirmed by comparing the RC data and the fully focused Pauli image of the scene with an optical Google Earth image (cf. Figure 14).

3.2. Clutter Normalization

With the proposed pre-detection algorithm running in time domain, potential targets are well detected and removed leaving behind the “ocean only” training data. These clean data can directly be used to determine a single CFAR threshold using standard sea clutter models. However, the steps of CFAR threshold computation in time domain cannot be applied one to one in Doppler domain because the training sample amplitude varies along the Doppler frequency (cf. Figure 1a and Figure 2a).
If no whitening of the Doppler spectra is performed and if it is directly used as the training data, then the CFAR threshold has to be estimated for each Doppler bin independently. Computing such a threshold for each Doppler bin comes with higher computational cost. The idea is to derive a single Doppler frequency independent threshold which is achieved by normalizing the clutter and noise power to 0 dB (cf. Figure 2b).
For the normalization, let us consider a data block in Doppler domain consisting of R range and a number of Doppler bins. The clutter normalization is based on the estimation of the average spectra A ^ s ( f a ) (cf. red curve in Figure 2a) which can be expressed [21,22]
A ^ s ( f a ) = 1 R k = 1 R | Z ( r k , f a ) | 2 ,
where Z ( r k , f a ) is the frequency domain representation of z ( r , n ) and f a is the Doppler frequency. For simplicity we write | Z ( r k , f a ) | 2 =   P k ( f a ) which is known as power spectral density or Doppler spectrum of the data Z ( r k , f a ) . The clutter normalized data Z CN ( r k , f a ) can then be written as
| Z CN ( r k , f a ) | 2 = P k ( f a ) / A ^ s ( f a ) ,
By estimating A ^ s ( f a ) with (9) for each Doppler bin and by using (10) the clutter and noise are scaled to 0 dB. An example of clutter normalization is shown in Figure 15 (cf. also Figure 1b).
The data in Figure 15b are the training data used to estimate the ocean clutter statistics. However, when the range-Doppler image additionally contains a ship signal, which may be the case if no target pre-detection is carried out, the clutter normalization causes target self-whitening. This negative and unwanted effect is shown in Figure 16b,c.
To avoid target self-whitening and a significant bias of the ocean statistics (cf. Figure 16a,b), it is essential to apply the proposed pre-detection and target cancellation algorithm before estimating the average Doppler spectrum used for clutter normalization (cf. Figure 16d,e).
To show the effects of target self-whitening, the signal-to-clutter-plus-noise ratio (SCNR) is estimated and listed in Table 1. The SCNR was computed by extracting a cut along Doppler at the maximum peak value of the image in Figure 16c,e. By using a guard zone around the peak value, the SCNR is measured.
From Table 1, it is clear that the proper estimation of an average Doppler spectrum to perform normalization over Doppler maintains the target SCNR. However, if the high peaks are not removed beforehand using pre-detection, then after normalization the target SCNR is severely degraded (≈10 dB in this case).

3.3. Importance of Training Data Update

As discussed in Section 2 the clutter statistics are estimated for each red sub-region within the green region (cf. Figure 4 top). This is how the training data is extracted locally and updated first along range and then along azimuth. Training data update is an important step because of two main reasons. The first reason was already explained in Section 2 where the contribution of the aircraft’s Euler angles is discussed (cf. Figure 3 and Figure 13). The second reason is due to the varying motion of the ocean surface. With a moving ocean surface, the clutter statistics tend to change significantly over range and time. To show this behavior, the texture (or shape) parameter from the K-distribution (cf. Section 4.1 and cf. (21)) is estimated. The variation of the texture both along range and azimuth is shown in Figure 17 for X-band HH polarized data acquired during a linear and circular flight. Lower values of texture indicate spiky clutter and higher values indicate Rayleigh like characteristics of the clutter intensity.
From Figure 17, it can be clearly observed that the K-distribution based texture parameter varies both over range and azimuth time. Significant changes are observed along range (incidence angle) where the texture values vary from very low to very high. Along the azimuth, the variation tends to follow a sinusoidal pattern which may be aligned with the wind direction [35]. Therefore, to consider these changes accurately, the training data need to be updated frequently in order to obtain bias free local sea clutter statistics [23].

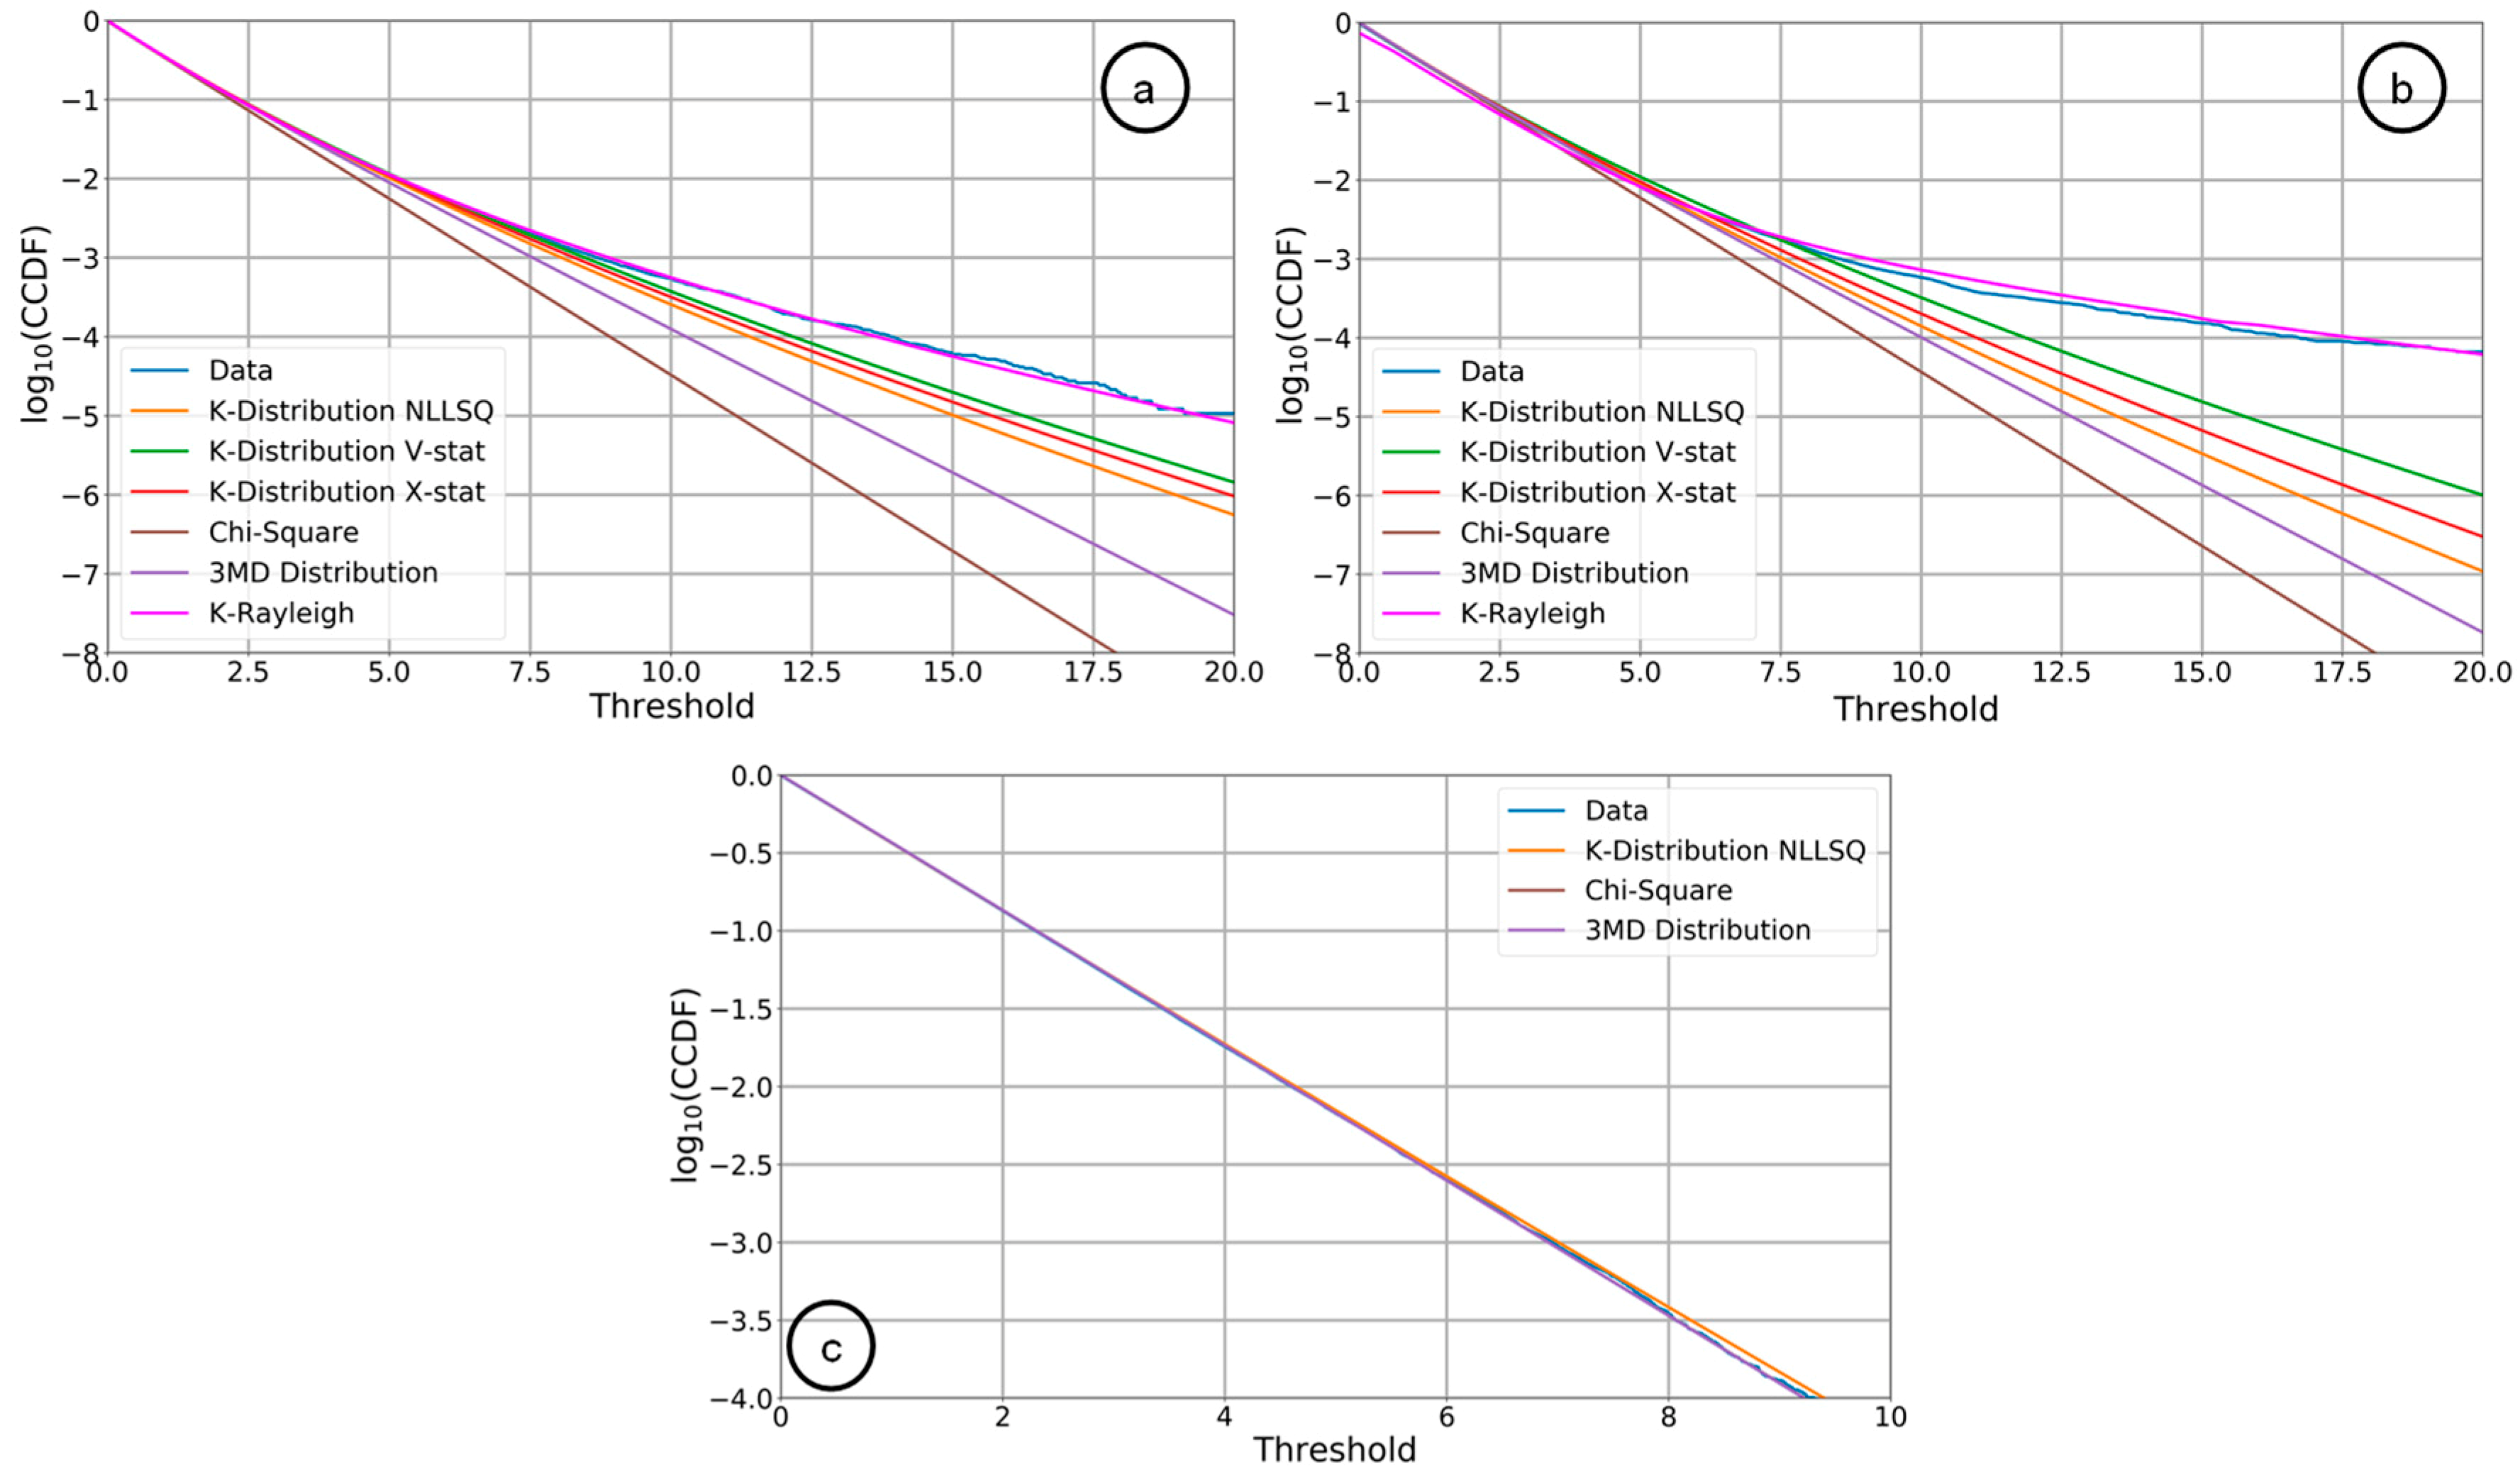
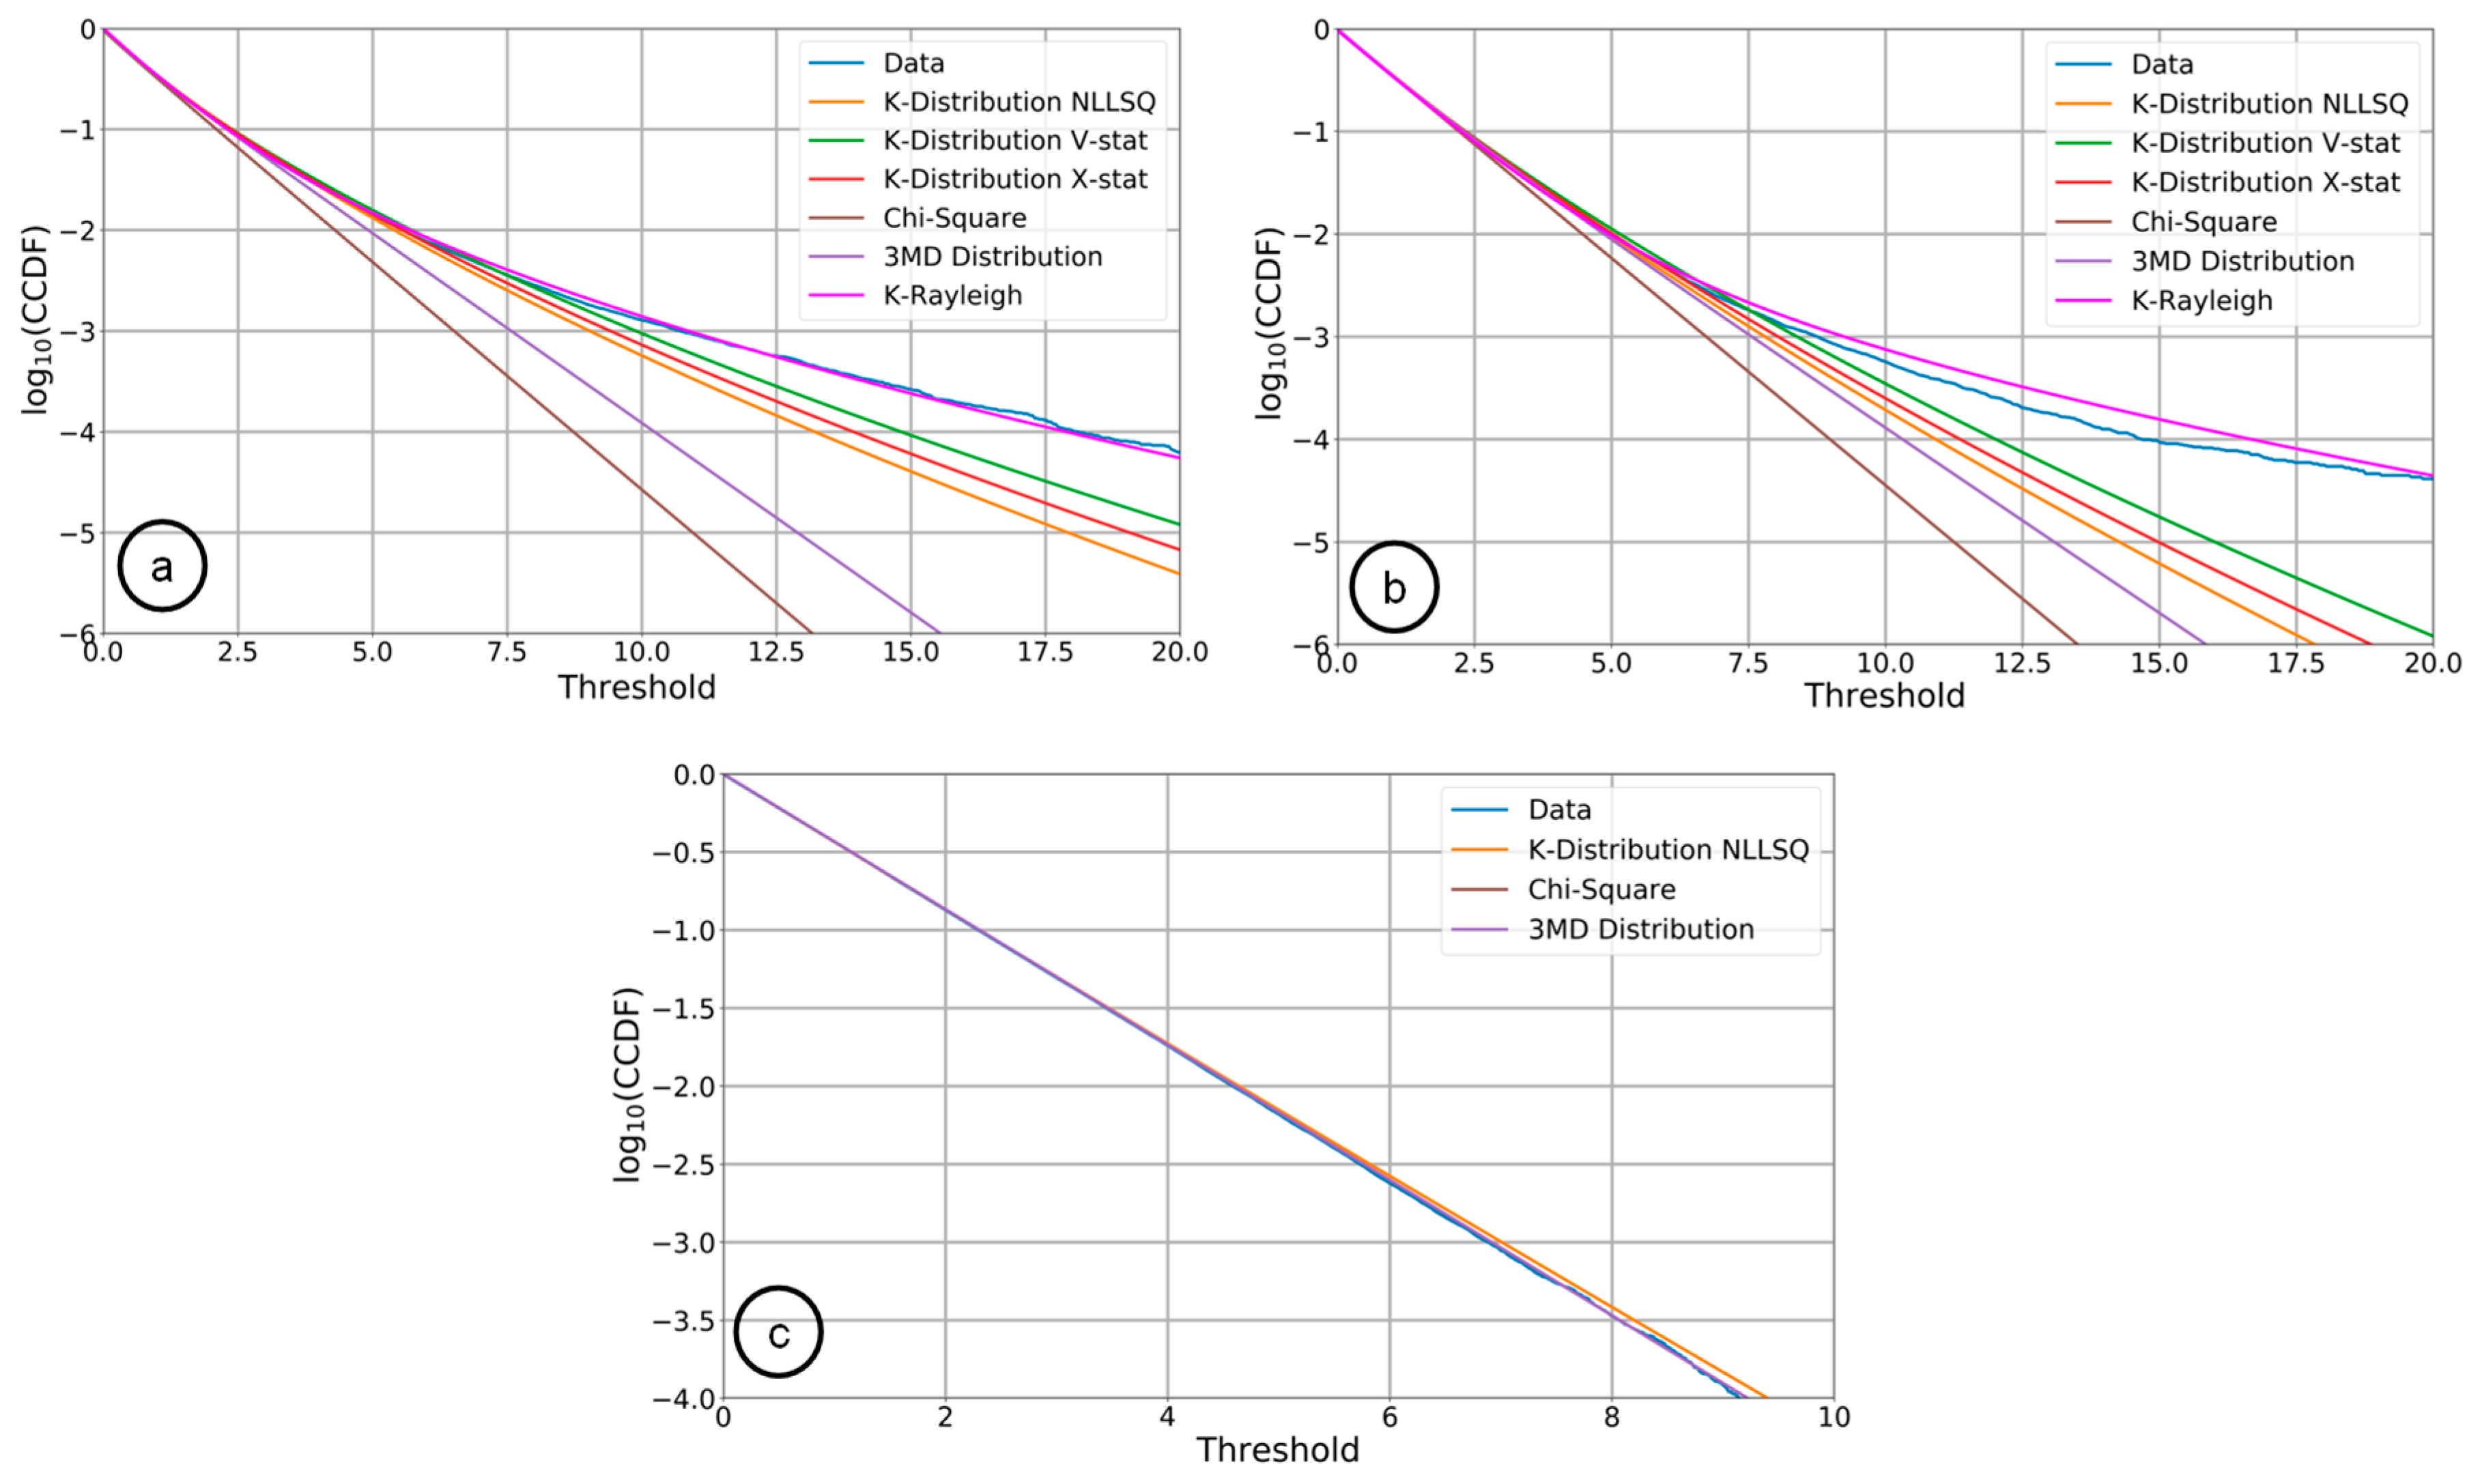
4. Clutter Statistics and Detection

As mentioned in the introduction section the ship detection method used in this paper is based on a CFAR. CFAR algorithms are pixel-based. Therefore, for a given ith complex amplitude pixel Z i , where i = 1 ,   2 , T p and T p is the total number of pixels, there exist two hypotheses H 0 and H 1 [17]
H 0 :   Z i = C i + N i ,        Moving   target   is   absent
H 1 : Z i = C i + N i + S i ,     Moving   target   is   present
where C i , N i and S i are the clutter, noise and target signals, respectively. The sea clutter models discussed in this section are formulated based on the backscatter intensity in Doppler domain, therefore for simplicity, | Z | 2 = I is written. Once a distribution function f ( I ) is chosen to model the ocean backscatter, and its parameters are estimated from the ocean samples, then the PFA for a given threshold η is given by
P fa =   η f ( I )   d I .
In the following sections, different sea clutter models and the methods used to determine the unknown sea clutter statistics are discussed.

4.1. K-Distribution

Equations (11) and (12) are valid only when the clutter is Rayleigh distributed (=homogeneous clutter). However, in the case of relatively low grazing angles (10°–50°) and high resolution systems, the clutter is no longer Rayleigh distributed [36]. To address this problem, an additional independent random variable called texture is introduced. This leads to the following expression [37]
Z i = C i + N i + S i ,
The introduction of the texture component leads to the product or compound clutter models. Compound models with a PDF P ( I ) in general are represented by the following expression
P ( I ) = 0 P I | X ( I | x ) P X ( x ) d x ,
where x is the speckle and the underlying speckle component P I | X ( I | x ) is modulated by the texture P X ( x ) . One of the most popular and widely used compound models is the K-distribution. It is a comprehensive representation of a Gamma distributed texture over Rayleigh distributed homogeneous clutter. For L number of looks, it is represented as [36,38,39]
f ( I , v , b , L ) = 2 Γ ( v ) 1 Γ ( L ) ( L b ) L + v 2 I L + v 2 2 K v L ( 2 L b I ) ,
where v , b , L , Γ ( ) and K ( ) are the shape, scale, number of looks, gamma function and the modified Bessel function of the second kind, respectively. The scale parameter b is related to the mean μ of the data as b = v / μ .
The shape parameter v , also known as texture, mainly controls the shape of the K-distribution. The range of v is [ 0.1 , ] , where for v = the PDF reduces to a Rayleigh distribution. Lower values of v represents spiky clutter (cf. Figure 17). For a given threshold η , above which a moving target is declared, the PFA for a given threshold η can be written as
P fa   ( η ) = 2 l = 0 L 1 ( v L ) ( v + l ) 2 Γ ( l + 1 ) Γ ( v ) η v + l 2 K v l ( 2 v L η ) ,
There are in total three unknowns; shape ( v ), scale ( v μ ) and number of looks ( L ) to be determined to fit the distribution. Different methods to determine the unknown parameters of the K-distribution are presented in the following.

4.1.1. Method of Moments (MoM)

Estimating the unknowns of the K-distribution using the maximum likelihood method is computationally intensive as it requires many iterations to maximize the likelihood function. An alternative and rather fast way is to apply MoM based approaches. The number of looks L is either known or can be estimated using the ratio of the square of the mean and the standard deviation [40]. One way to solve μ and v is to use first and second moments of the data. This method is referred to as MV (mean and variance), contrast based or V-statistic. The equations are [41]
μ ^ = I ,
( 1 + 1 v ^ ) ( 1 + 1 L ) = I 2 I 2 ,
where < > is the expectation operator. Knowing the number of looks L and the mean μ ^ , the shape parameter v ^ can be estimated using (19). It is found that the V-statistic works quiet well in most of the cases and is therefore preferred. Another estimator proposed in [42] is referred as X-statistic, which is computationally faster and gives a more straightforward solution than other log based estimators. The mathematical expression for the X-statistic is
( 1 v ^ + 1 L ) = I log I I log I ,
The mean μ ^ is estimated using (18).

4.1.2. Non-Linear Least Squares Method (NLLSQ)

Another way to estimate the known parameters of K-distribution is to use the NLLSQ method. This method uses the Levenberg–Marquardt algorithm [43] to find the local minima of a function which is expressed as a sum of the squares of the difference between the proposed PDF and the data PDF. The minimization function is expressed as
argmin α m = 1 M ( f T ( I , L , α )   h m ) 2 ,
where f T ( I , L , α ) is the distribution function having α unknown parameters and M histogram bins h m .
Regardless of being a widely used model, it is found that the K-distribution works well only in the case of high-resolution homogeneous ocean environments. Cases where the ocean is highly heterogeneous or the signal energy recorded by the radar system is extremely low, the estimated shape parameter values are not acceptable. Using the MoM for estimation yielded either to too high or too negative values [44].
An example of the ship detection using the K-distribution applied on the RC F-SAR X-band HH polarized data is shown in Figure 18. The NLLSQ method was used to estimate the unknown parameters of the K-distribution. For a desired P fa = 10 6 , the computed CFAR threshold is applied in range-Doppler domain as per the methodology described in previous sections. For visualization purposes, the detections obtained in Doppler domain are shown in time domain.
In Figure 18, it can be observed that along with the ship (left) the heterogeneous ocean clutter (i.e., the high sea spikes) at lower incidence angles are also detected. Therefore, in the next section other models are discussed as an alternative to the K-distribution.

4.2. Chi Square ( χ 2 ) Distribution

The χ 2 distribution is one of the models used when the K-distribution fit fails because the estimated shape parameter gives negative values. The χ 2 distribution function with 2 L degrees of freedom is represented as [45]
f ( I , σ , L ) = I L 1 2 L σ 2 L Γ ( L ) exp ( I 2 σ 2 ) , I 0 ,
The number of unknowns in this case is 2: number of looks L and the standard deviation σ . The PFA as a function of the threshold η can be written as
P fa   ( η ) = 1 Γ ( L ) Γ ( L , η 2 σ 2 ) ,
where Γ ( ) is the gamma function. For a single look, the threshold becomes η = 2 σ 2 ln ( P fa ) . The parameters in this case are estimated using the NLLSQ method as explained in Section 4.1.2.

4.3. Tri-Modal Discrete (3MD) Texture Model

A new model called tri-modal discrete texture model (3MD) was recently proposed. This model is able to detect moving targets with a very low PFA . The model was mainly invented for spaceborne fully focused SAR data. It is based on the idea of the statistical modeling of the sea texture in a discrete form. The PDF of the 3MD model for L number of looks can be written as [46,47]
f ( I , ʘ , L , ρ c ) = L L Γ ( L ) I L 1 d = 1 D c d exp ( L I ρ c a d 2 + ρ n ) ( ρ c a d 2 + ρ n ) L .
where ʘ = [ c d ,   a d ] , D corresponds to the number of discrete scatterers in a single pixel and Γ ( ) is the gamma function. The variables ρ c and ρ n are the normalized clutter and noise variances, respectively, whose sum is unity. The parameters a d and c d are the discrete texture intensity levels and their corresponding relative weightings, respectively, where d = 1 D c d = 1 ,   c d > 0 .
The PFA for a given threshold η is given as
P fa   ( η ) = d = 1 D c d Γ ( L , L η ρ c a d 2 + ρ n ) Γ ( L ) .
The value of D after testing even highly heterogeneous sea state was found to be 3 [47]. Therefore, for the 3MD clutter model there are eight unknown parameters: ʘ = [ c d , a d ] , ρ c and L . These unknowns are estimated using the non-linear least squares fit as explained in Section 4.1.2.

4.4. K-Rayleigh Distribution

The presence of a non-Bragg scattering component in the ocean surface, better known as discrete sea spikes, is the main reason why the K-distribution fit fails even when the thermal noise is taken into account [48]. Due to the high intensities of the sea spikes, they are often confused with the target, giving rise to very high false alarms (cf. Figure 18). In recent studies, KA (K-class A), KK and Pareto distribution models, along with their adaptations to consider thermal noise were proposed and investigated to model these sea spikes. However, these models have many unknowns to estimate and require a prior knowledge of the thermal noise [48].
The K-Rayleigh distribution function is one of the recently proposed distribution functions that models sea spikes as an extra Rayleigh component which is typically not captured by K or even K+Noise (K+N) distributions [48]. In the K-Rayleigh distribution, the total speckle mean from (15) is expressed into two components; x = x r + ρ r where x r and ρ r are the modified speckle mean and the extra Rayleigh component modeled like the thermal noise ρ n . If ρ r = 0 , it takes the form of the K+N distribution. The texture is modeled as a gamma distribution similar as in the K-distribution. The PDF of the K-Rayleigh distribution has no closed form solution and is given as [48]
f ( I , b r , v r ,   ρ r + ρ n ) =   b r v r Γ ( v r ) 0 x r v r 1 x r + ρ r + ρ n exp ( I x r + ρ r + ρ n b r x r ) d x r ,
where v r ,   b r are the shape and scale parameters, respectively. There are three unknowns in the K-Rayleigh distribution, and they are estimated using the MoM. The three equations to be solved are
v ^ r = 18 ( I 2 2 I 2 ) 3 ( 12 I 3 9 I 2 I + I 3 ) 2 .
( ρ ^ r + n ) =   I   v ^ r 2 ( I 2 2 I 2 ) .
b ^ r = v ^ r I ( ρ ^ r + n ) .
The term ρ ^ r + n consists of ρ ^ r + n = ρ r + ρ n , where the Rayleigh offset ρ r and the thermal noise ρ n are estimated as a single parameter using (28). Even when the thermal noise is not known, all the parameters needed to fit the data can be well estimated with the above equations. The PFA in this case is computed using (13). A comparison between the detections obtained from the K and K-Rayleigh distribution functions is shown in Figure 19.
In Figure 19, it is clearly visible that the threshold computed using the K-Rayleigh distribution function is much higher compared to the K-distribution. As a consequence, the number of false alarms is significantly decreased but also the number of true detections.

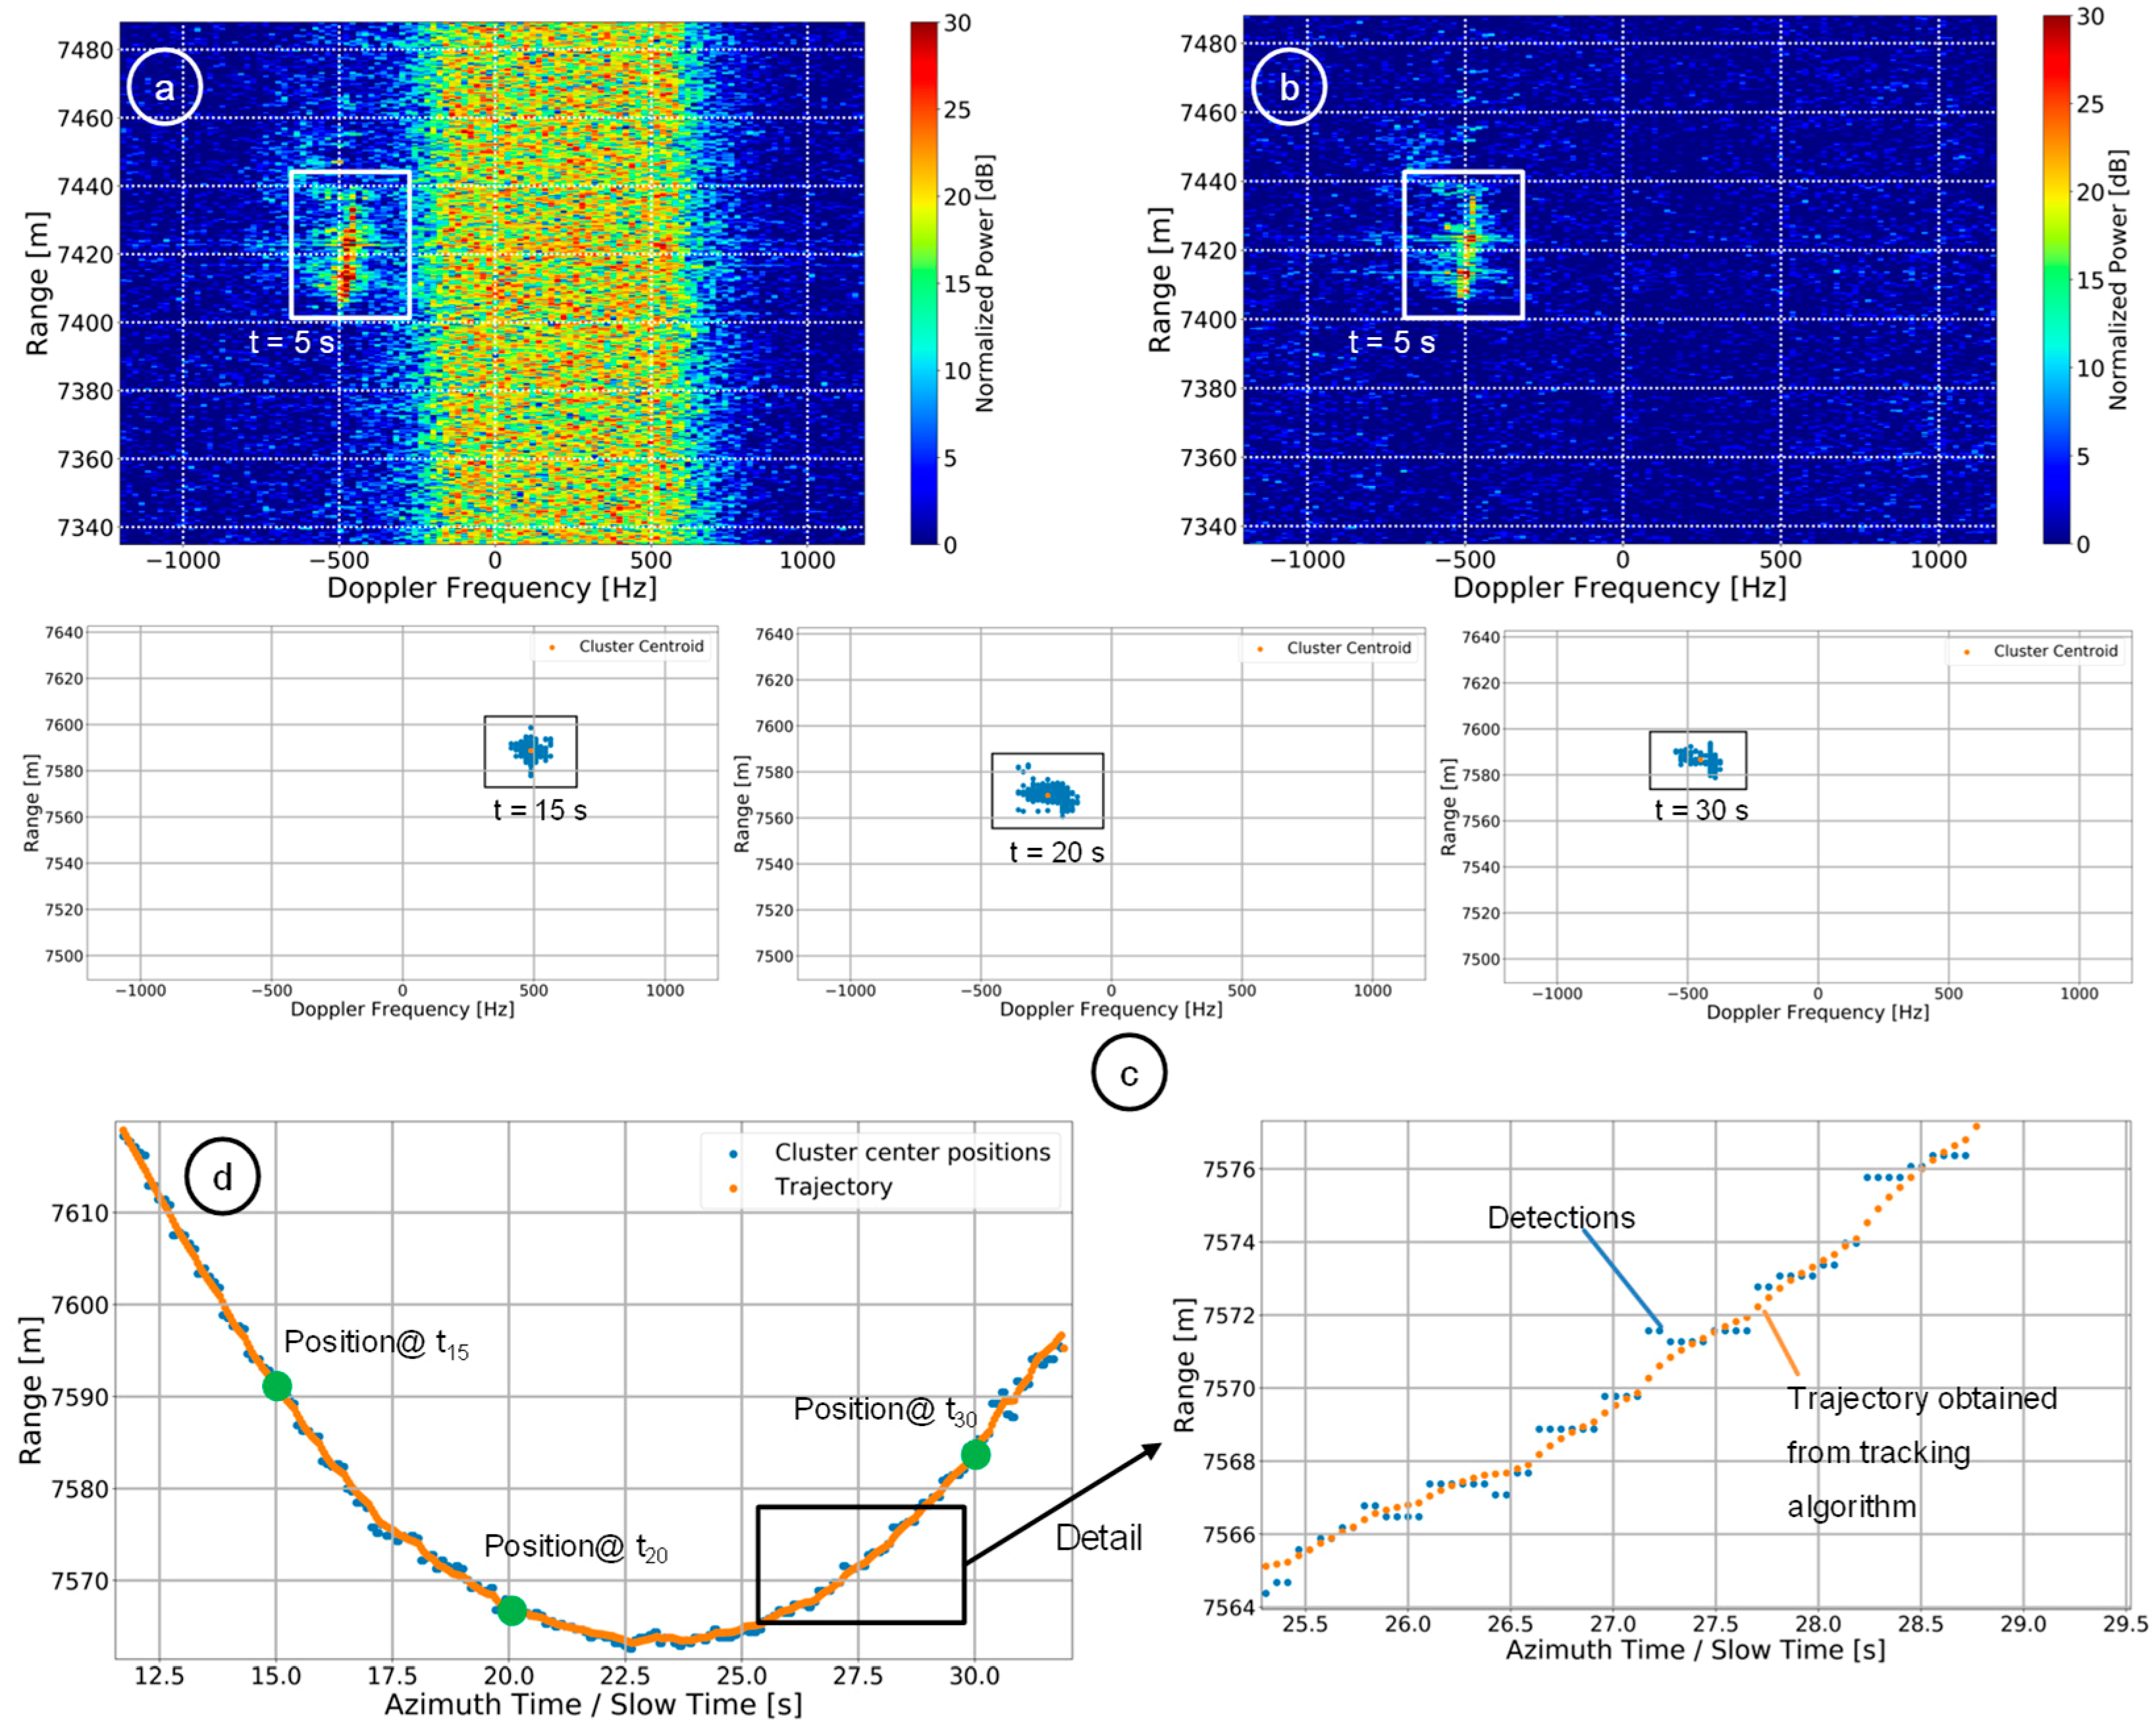
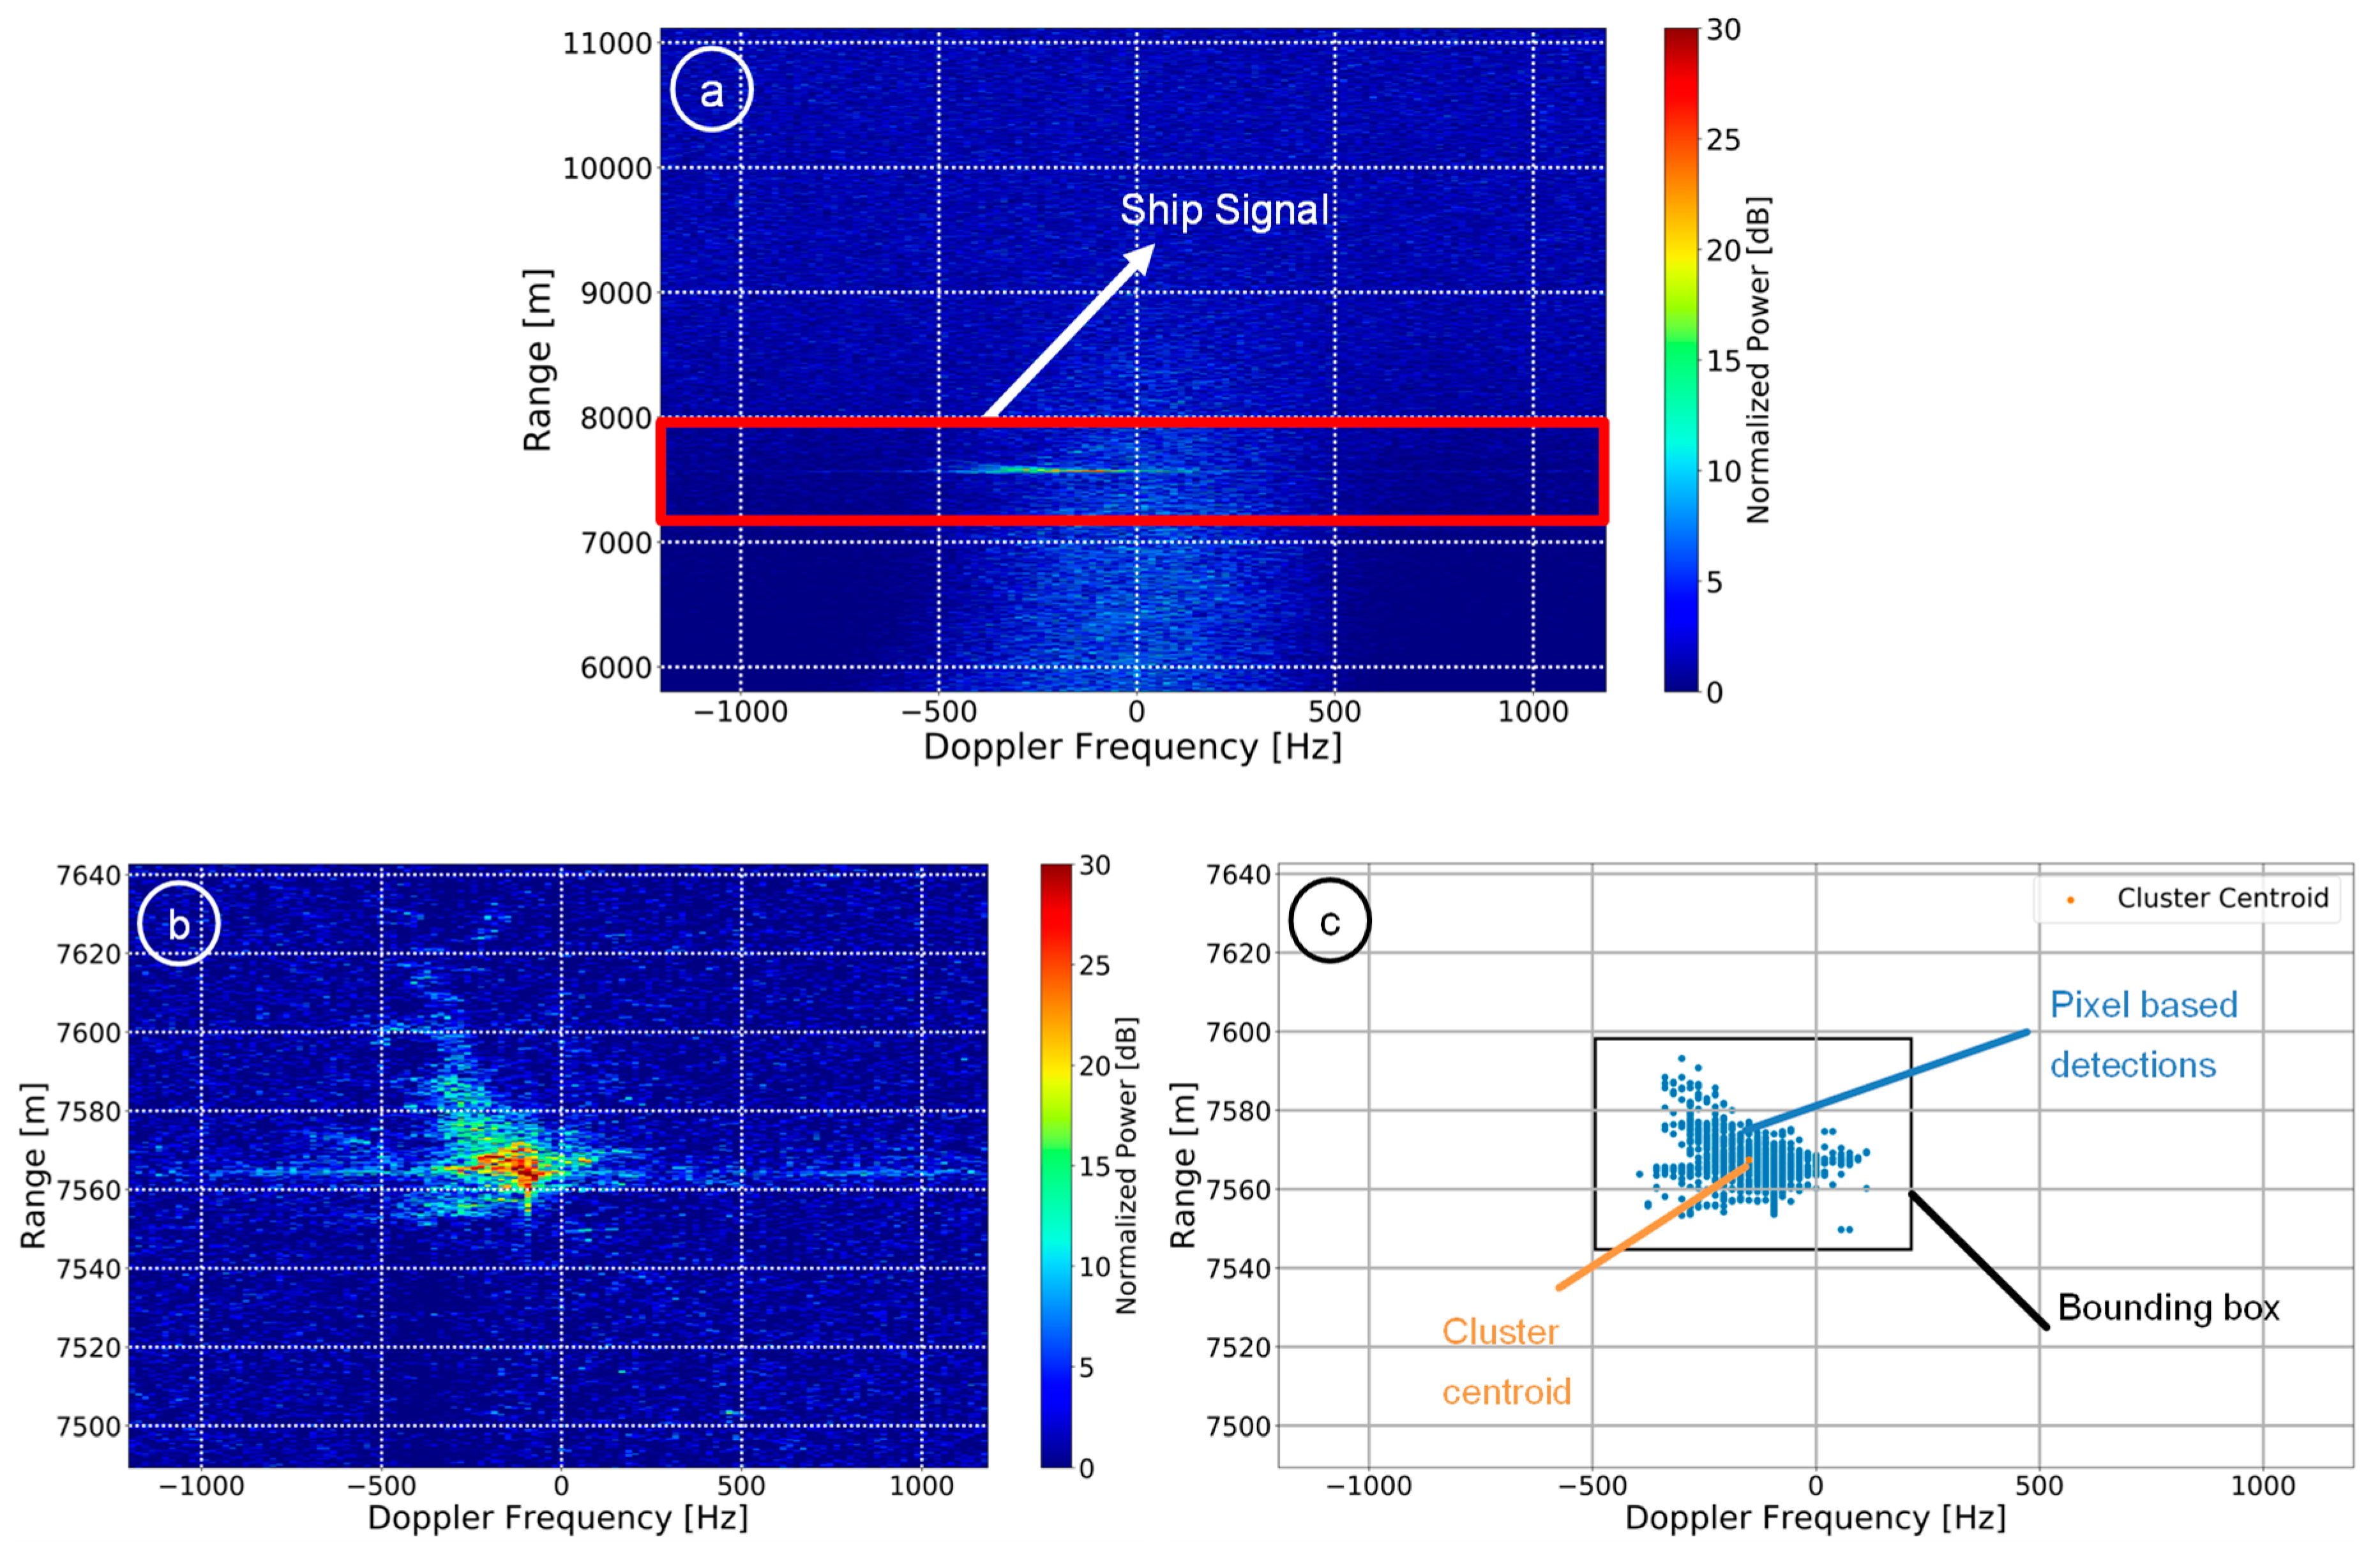
5. Clustering and Tracking

Ships are generally extended targets occupying more than a single resolution cell in the data (cf. Figure 18 and Figure 19). After obtaining multiple pixel-based detections for a single ship, clustering has an important role to declare this group of detections per scene and per ship as a single “physical object”. For clustering, we use the DBSCAN (density based spatial clustering of applications with noise) method [49]. It is able to form clusters of arbitrary shape with only two inputs from the user, i.e., m i n P t s (minimum number of points) and ε (radius). Given a set of points, DBSCAN algorithm starts with an arbitrary point a . Point a is considered as a core point and forms a cluster if there are at least m i n P t s points (including a ) within distance ε of point a . Every reachable point from point a belongs to the same cluster. Point b is directly reachable from point a if it is within distance ε from point a . Point c is also reachable from point a if there is a chain of points a 1 , , a n (all are core points, except a n ) with a 1 = a and a n = c , where each a i + 1 is directly reachable from a i . The edge of the cluster is defined by the reachable non-core points, also known as the border points. The non-reachable points are considered as outliers or noise.
The radius ε is set based on the Euclidean distance. This distance metric can only be used in the case when the two axes have the same unit. However, in a range-Doppler image, the y-axis corresponds to the slant range (in meters) and the x-axis to the Doppler frequency (in Hz). Therefore, to do clustering, the detected pixels in slant range are firstly projected to ground range. Then, the corresponding Doppler frequency bins (which are spaced in Hz) are mapped to meters (i.e., cross-range coordinates) using the following approximation [24]
δ cr = λ r 0 2 v p T CPI .
where δ cr , v p , r 0 and T CPI are the cross-range resolution (in meters), platform velocity (in meters/second), the target range (in meters) and the time duration of a CPI (in seconds), respectively. An example of clustering applied on a CPI of 128 azimuth samples is shown in Figure 20.
Figure 20c shows the clustered ship signal with its centroid and the corresponding bounding box. The estimated 2D cluster centroids in ground-range/cross-range coordinates are projected back to slant range/Doppler coordinates for performing target tracking afterwards.
Target tracking is a method to reconstruct the trajectory of a moving object based on a given noisy measurement. Although tracking is not the main focus of this paper, for completeness we also show some tracking results. Here, the Kalman filter [50] is used to track the cluster centroids in successive range-Doppler image patches. It is a recursive filter that updates the probability density function of the state recursively over azimuth time using the measurements at each time step, i.e., at each CPI. In the Kalman filter, the target dynamics, measurements and the probability distribution of the state are assumed to be Gaussian and linear. It is computationally very fast as it uses the current measurement and the estimated state and uncertainty matrix from the previous time step. In our case, tracking is performed completely in the range-Doppler domain where the range and Doppler coordinates are considered as the target dynamics which are written in the form of a vector x k , where k is the given time step (=CPI). The Kalman filter computes an a posteriori state estimate x ^ k as a linear combination of an a priori estimate x ^ k (predicted state) and a weighted difference between the sensor originated measurement z k and a measurement prediction H k x ^ k . The posteriori state estimate or the corrected state x ^ k of the target is written as:
x ^ k = x ^ k + K k ( z k H k x ^ k )
where K k , z k H k are the Kalman gain, the measurement vector (=cluster centroids) and the observation matrix, respectively. The corrected state x ^ k gives the refined coordinates of the moving ship in range-Doppler domain. An exemplary tracking result was already shown in Figure 1d.

6. Experimental Results and Discussion

A two-day F-SAR flight campaign was conducted in June 2016 in the North Sea [9]. All radar data, in total more than 1 TB, were acquired fully polarimetric and simultaneously in X- and L-band. Additionally, the AIS data transmitted by the ships were collected for ground truth purposes. At the first day of the campaign the island Helgoland and the town Cuxhaven including the coastal areas and ships of opportunity were observed, mainly during linear flight tracks but also during a circular track with the radar antenna pointing not to the circle center but to the opposite direction (cf. red circle in Figure 21, top). At the second day, a dedicated experiment with a controlled ship operated by the German federal police was carried out. The ship moved with velocities of 0 to 20 kn (knot) between three different waypoints. The circular flight tracks, this time with the antenna pointing to the circle center, were flown with a radius of 5600 m resulting in a total ship observation time of approx. 400 s (=6.7 min) per circle (cf. red circle in Figure 21, bottom) [9].
A small part of the acquired fully polarimetric radar data as well as the corresponding AIS data is shown in Figure 22.
Figure 23 shows the Google Earth image of the scene where the linear and circular flight experiments were conducted.
In Table 2 the X- and L-band system and acquisition geometry parameters used during the experiments are listed.

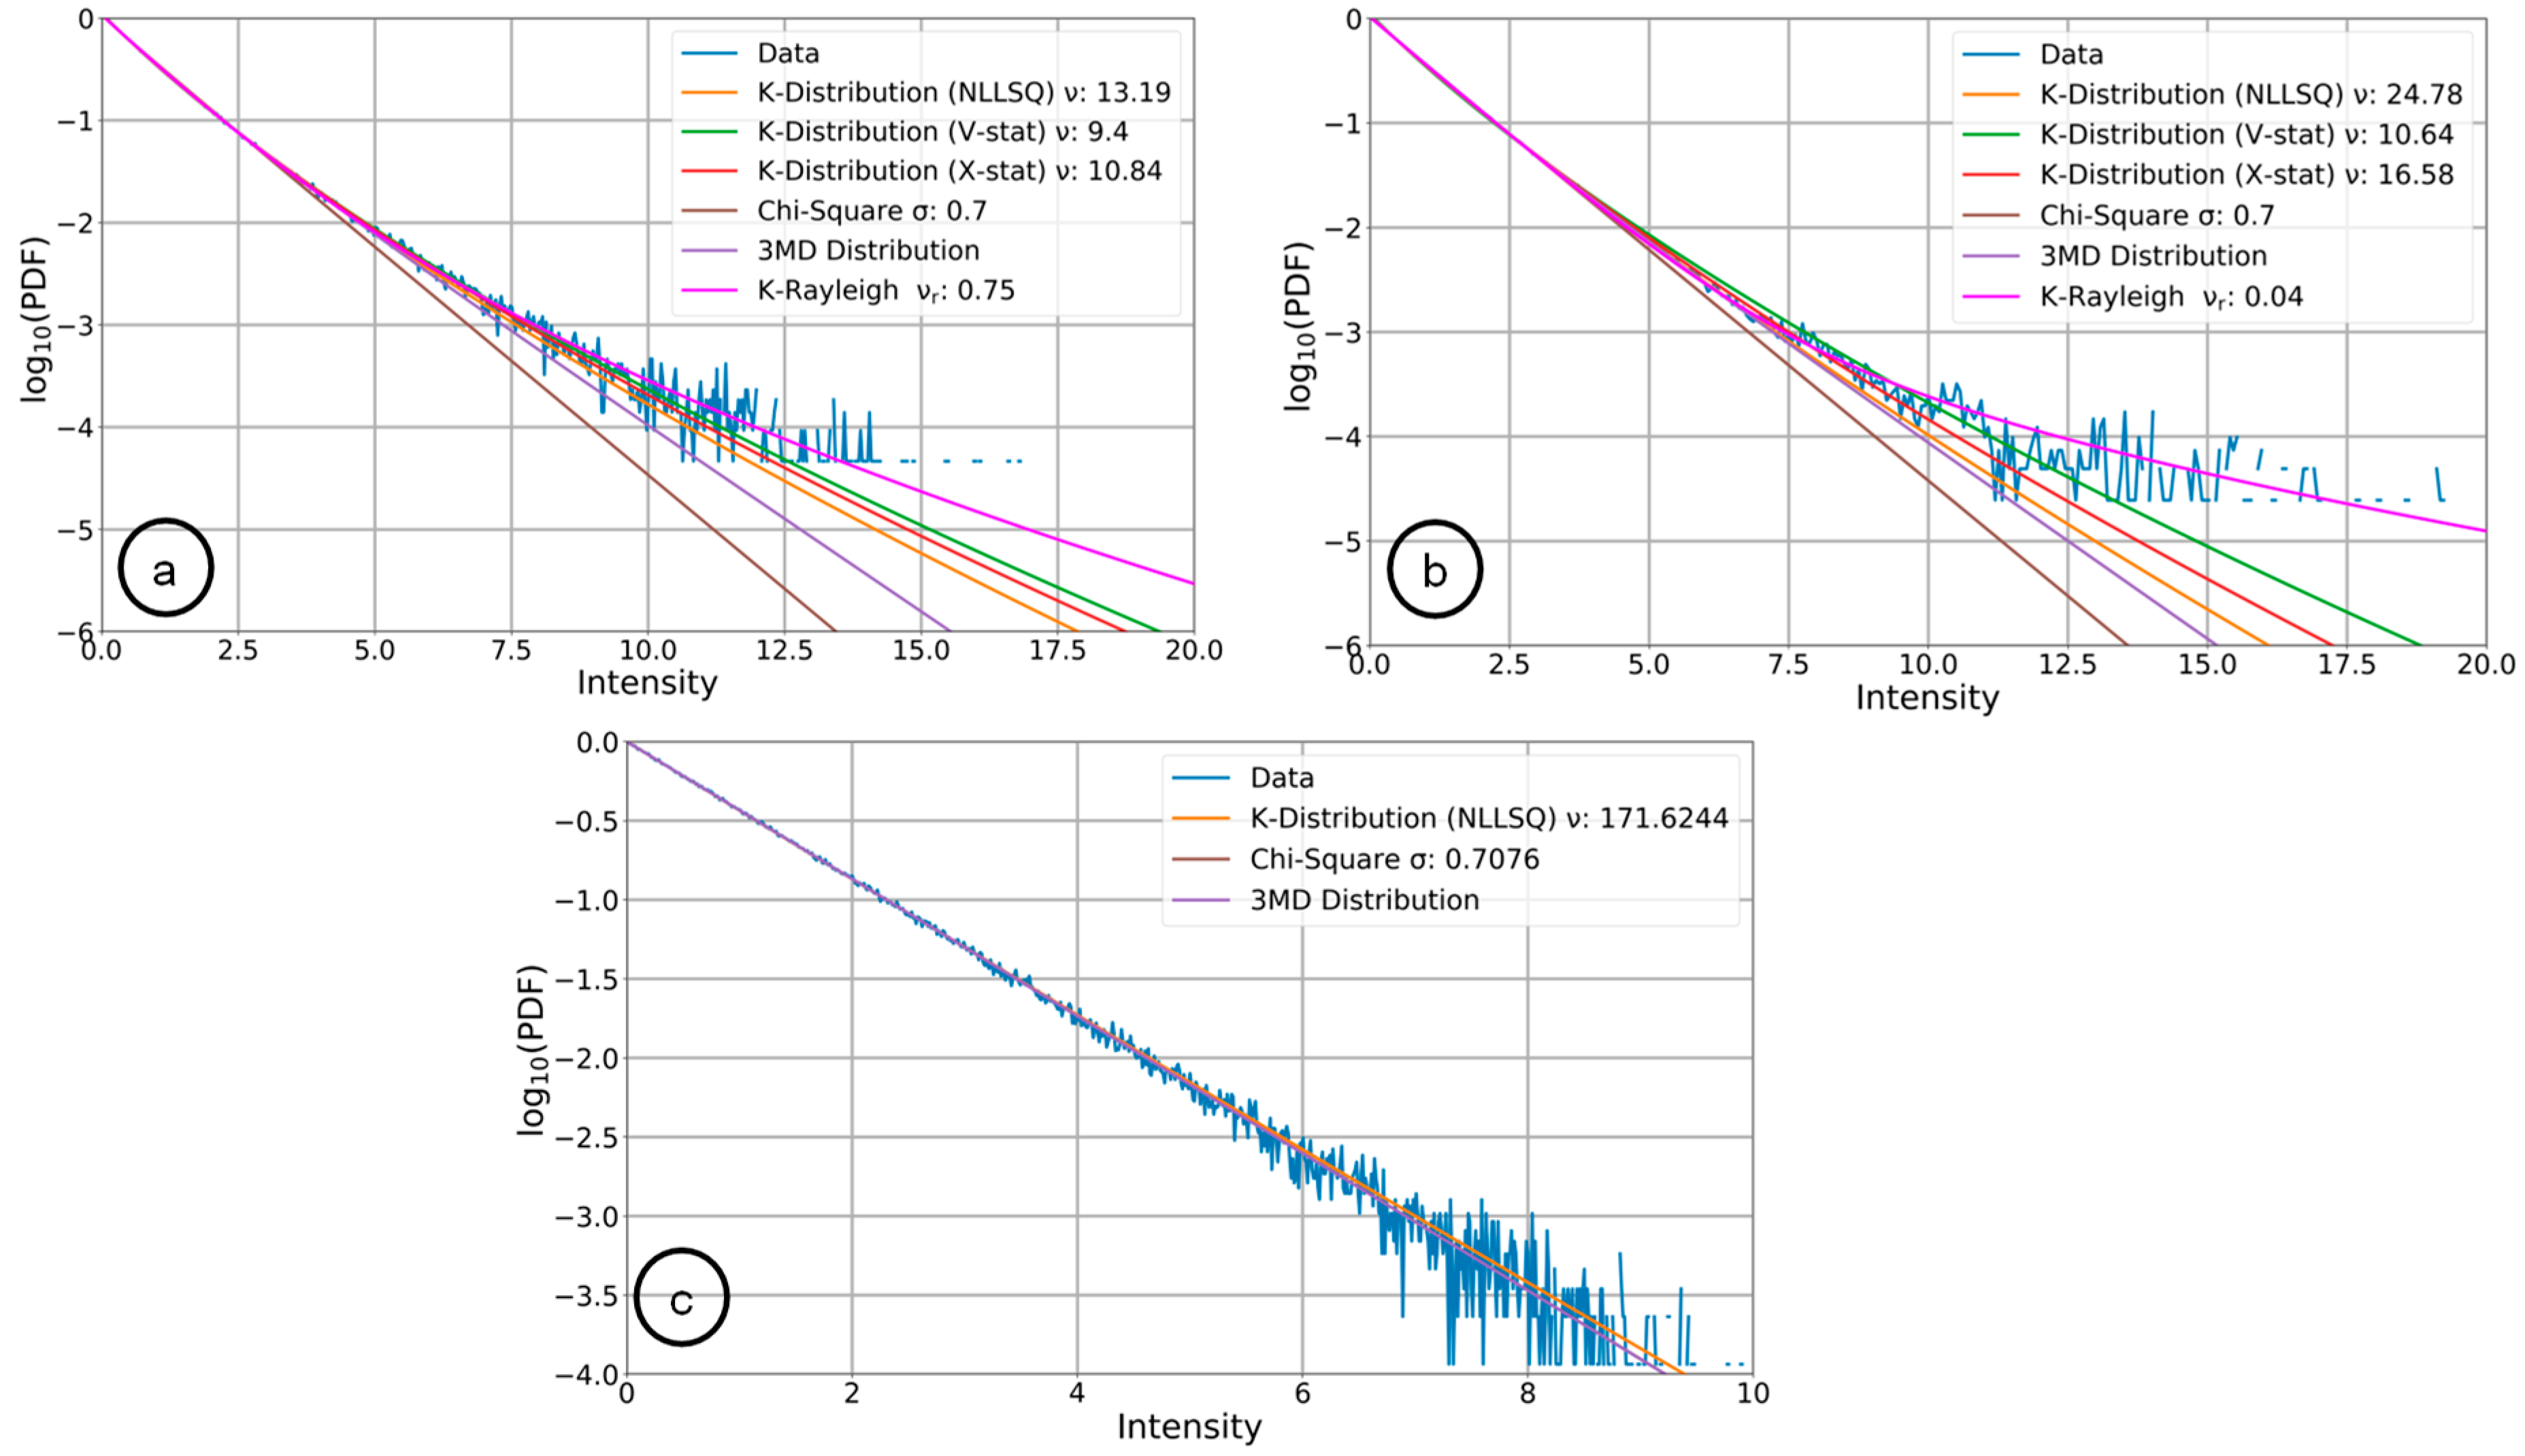
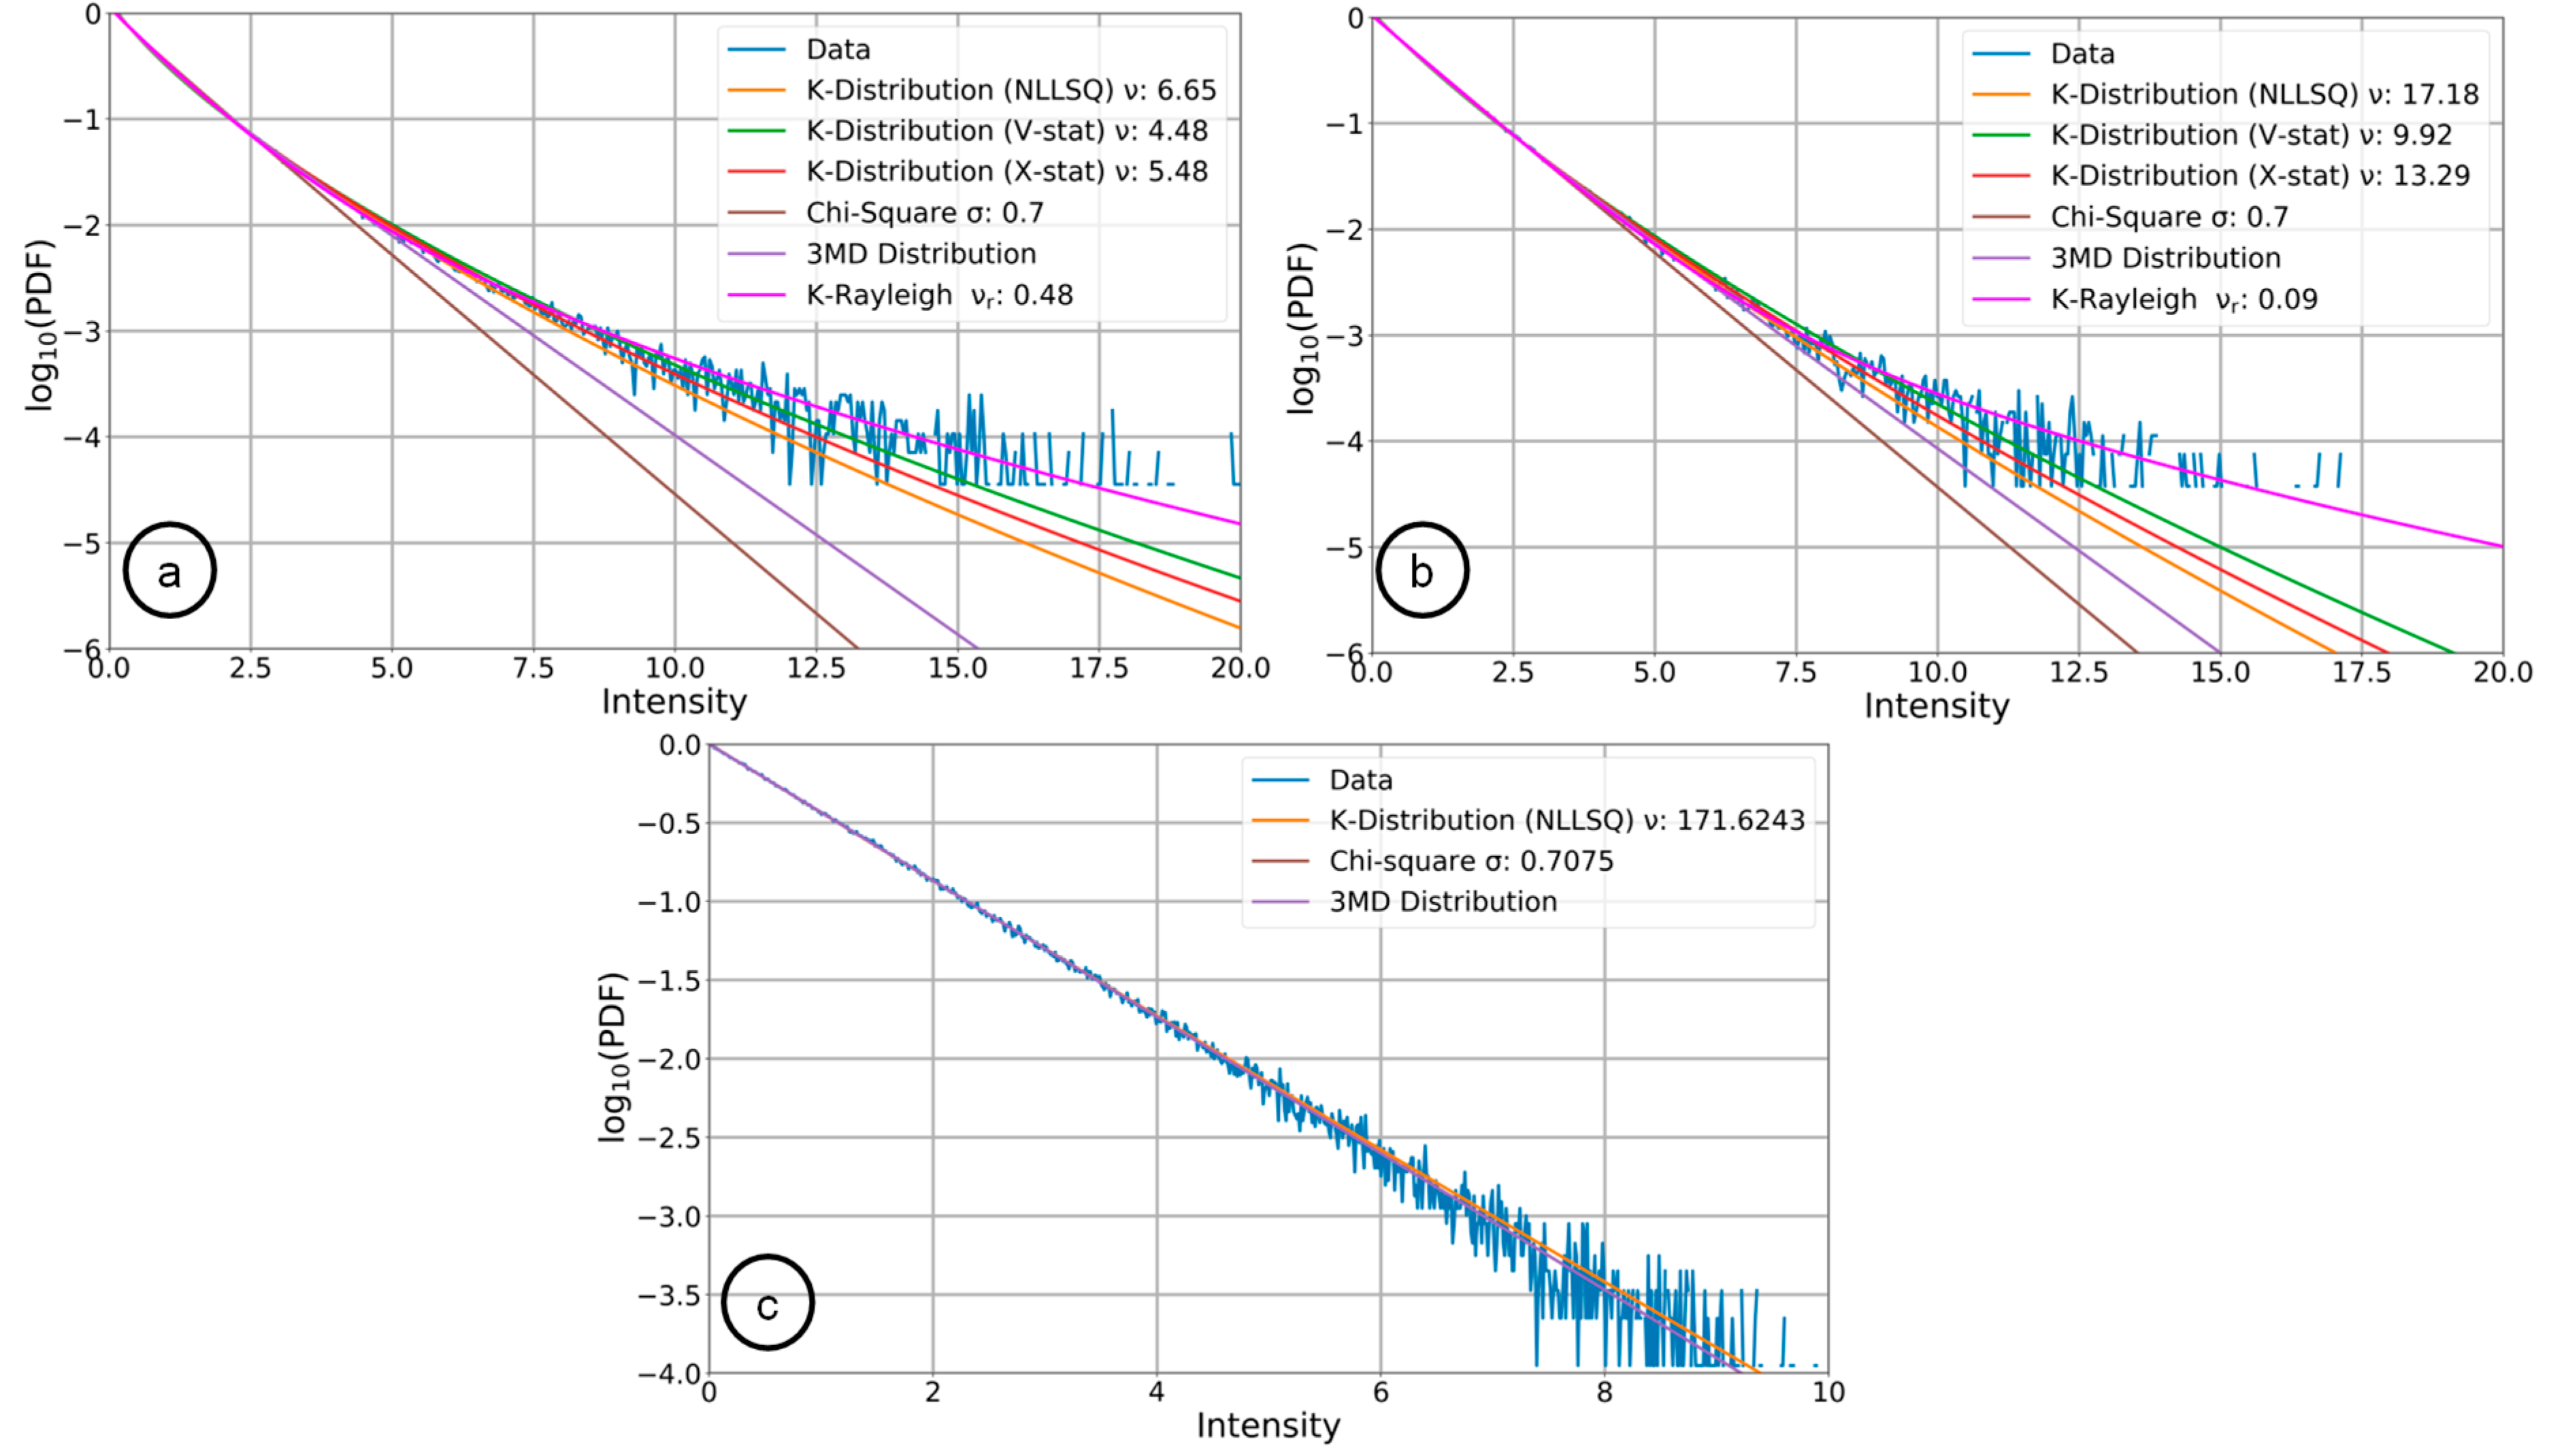
6.1. Clutter Model Fitting and Performance Evaluation

To test the clutter models fitting, the radar data are first partitioned into three regions: (a) near range (15°–30° incidence angle), (b) mid-range (30°–50°) and (c) far range (>50°). Since the backscatter changes over the incidence angle range (cf. Figure 7), it is important to segment the data for a detailed investigation and understanding of the chosen models.
The image patches, each from the near, mid and far ranges of the linear and circular data, were independently chosen from each other to evaluate the models behavior. The RC data patch used for the investigations has 1280 azimuth samples and 512 range samples (cf. the red sub-region shown at the top in Figure 4). Figure 24 and Figure 25 show the fit between the measured data PDF and the PDFs provided from different sea clutter models.
From Figure 24a,b and Figure 25a,b, it can be observed that in near and mid-range, the K-distribution, the chi-square distribution and the 3MD model fit only for the intensity values of up to 2.5 and 4, respectively. In contrast, the K-Rayleigh distribution is able to fit well in the near and mid-range for both linear and circular data. Due to the presence of spiky clutter, the data histogram is more skewed in the mid-range compared to the near range. The K-Rayleigh distribution is able to model this skewness by estimating an extremely low texture value of 0.04 (cf. Figure 24b), and 0.09 (cf. Figure 25b) respectively. When the K-distribution is used instead of the preferred K-Rayleigh, then the V-statistics rather than the X-statistics and the NLLSQ shall be used for parameter estimation, since it leads to the best K-distribution performance in both near and mid ranges.
In the far range however, only the K-distribution parameters estimated using the NLLSQ method, the chi-square and the 3MD model fit well. Others do not fit because the estimated parameters have negative values. This is because the NLLSQ fits the data histogram in a least square sense, whereas the MoM doesn’t have optimal properties [44]. Another reason why they do not fit in far range is because, due to the long range and shallow incidence angle, the clutter power in far range is comparable to the noise power, as shown in Figure 26.
From Figure 26, it is clear that due to high incidence angle, the backscatter power received in far range is very low. It can also be said that in far range, the intensities are more Rayleigh distributed. This is evident from Figure 24c and Figure 25c, where the texture value from the K-distribution estimated using the NLLSQ method in both the data is approximately 171. Such a high value implies Rayleigh distributed statistics [48].
Furthermore, the complementary cumulative distribution function (CCDF) computed from the estimated data PDF and the CCDFs computed from different clutter models are also plotted. Plotting such functions is important due to their relationship with the detection threshold. In the literature, the CCDF is also known as PFA [48]. The logarithmic CCDF plots for linearly and circularly acquired data are shown in Figure 27 and Figure 28, respectively.
It can be observed from Figure 27a,b and Figure 28a,b (near and mid ranges) that the CCDF from the K-Rayleigh distribution align very well with the estimated data CCDF. In contrast in Figure 27c and Figure 28c (far range), the CCDF from the K-Distribution using NLLSQ for parameter estimation, the chi-square and the 3MD model fit very well with the data CCDF. The reason why other models don’t fit in far range can again be explained in terms of low clutter-to-noise ratio (CNR) and Rayleigh distributed characteristics.
In the following sections, the methods to evaluate the accuracy of the clutter models (cf. Section 4) are presented. For this paper, we have used two different error matrices: threshold error for a fixed CCDF and false alarm rate error for a fixed PFA = 10 6 .

6.1.1. Threshold Error

In order to know which models give the best results, the actual threshold errors are estimated. The threshold error is computed by calculating the absolute difference between the thresholds estimated from the data CCDF and the model CCDF at a certain CCDF value in the tail region of the histogram. The threshold error e r r o r threshold is written as
e r r o r threshold = | η data η model | CCDF = 10 4 .
where η data and η model are the thresholds obtained from the data and the clutter model at a specific CCDF value, respectively. The threshold error is computed in the tail region because of two reasons: bright ship target signals lie mostly in that region and the tail region is the region where most of the mismatch between reality and models occurs. The threshold errors (in log scale) at CCDF = 10 4 and 10 5 computed using different distribution functions for near, mid and far ranges as well as for linear and circular data are shown in Table 3 and Table 4, respectively.
From Table 3 and Table 4 it can be seen that the threshold error is minimum in case of K-Rayleigh distribution and maximum in case of chi-square distribution in near and mid-range. In circular data, for far range the chi-square distribution gives the minimum error.
In far range of linearly acquired data (cf. Table 3, right), the computed threshold errors are the same for CCDF = 10 4 for the K-NLLSQ, chi-square and 3MD model. Therefore, the threshold errors were additionally computed for CCDF = 10 5 and it is found that the 3MD gives minimum error in far range of linear data.

6.1.2. False Alarm Rate Error

To further quantify the suitability of the clutter models, the actual false alarm rates are also evaluated for different ranges. The false alarm rate is estimated as the ratio of the number of false detections to the number of samples in the data (cf. (8)). It has to be noted that for estimating the false alarm rate all the bright targets have first to be excluded from the scene for avoiding biases. This can be done using the proposed pre-detection method. The obtained results from all the clutter models using linearly and circularly acquired data are shown in Table 5 and Table 6, respectively.
From Table 5 and Table 6, it can be concluded that the K-Rayleigh distribution gives the least false alarm rate error in near and mid ranges, whereas the chi-square gives the highest error. In far range, the 3MD, chi-square and K-NLLSQ match well with the set false alarm rate.
Based on the analyses in the previous three sections, it can be concluded that for near and mid ranges (15°–50° incidence angle) the K-Rayleigh distribution function is the best suitable choice, whereas for the far range (>50° incidence angle), the 3MD model or the chi-square is the preferred choice. This recommendation is at least valid for the RC X-band HH polarized F-SAR data used for the investigations and the current sea state conditions during data acquisitions.
It has to be further noted that the detection rate of the proposed CFAR detector is not evaluated in this paper. This is because the vessel size is larger than the spatial resolution of the image which gives several pixel-based detections for a single vessel (cf. Figure 20c). Thus, even with the ground truth information the number of “true” detections belonging to a vessel cannot be determined reliably. Therefore, it is difficult when not even impossible to accurately measure the probability of detection using data containing real ships. Even if the detected pixels would be (manually) clustered to a single physical object, it is important to set an appropriate detection criterion to consider it as a “true” detection. Therefore, this kind of “object-based” detection and the derived “object-based” detection rate so far cannot be compared with the established “pixel-based” probability of detection used in any CFAR detection framework [37,51].

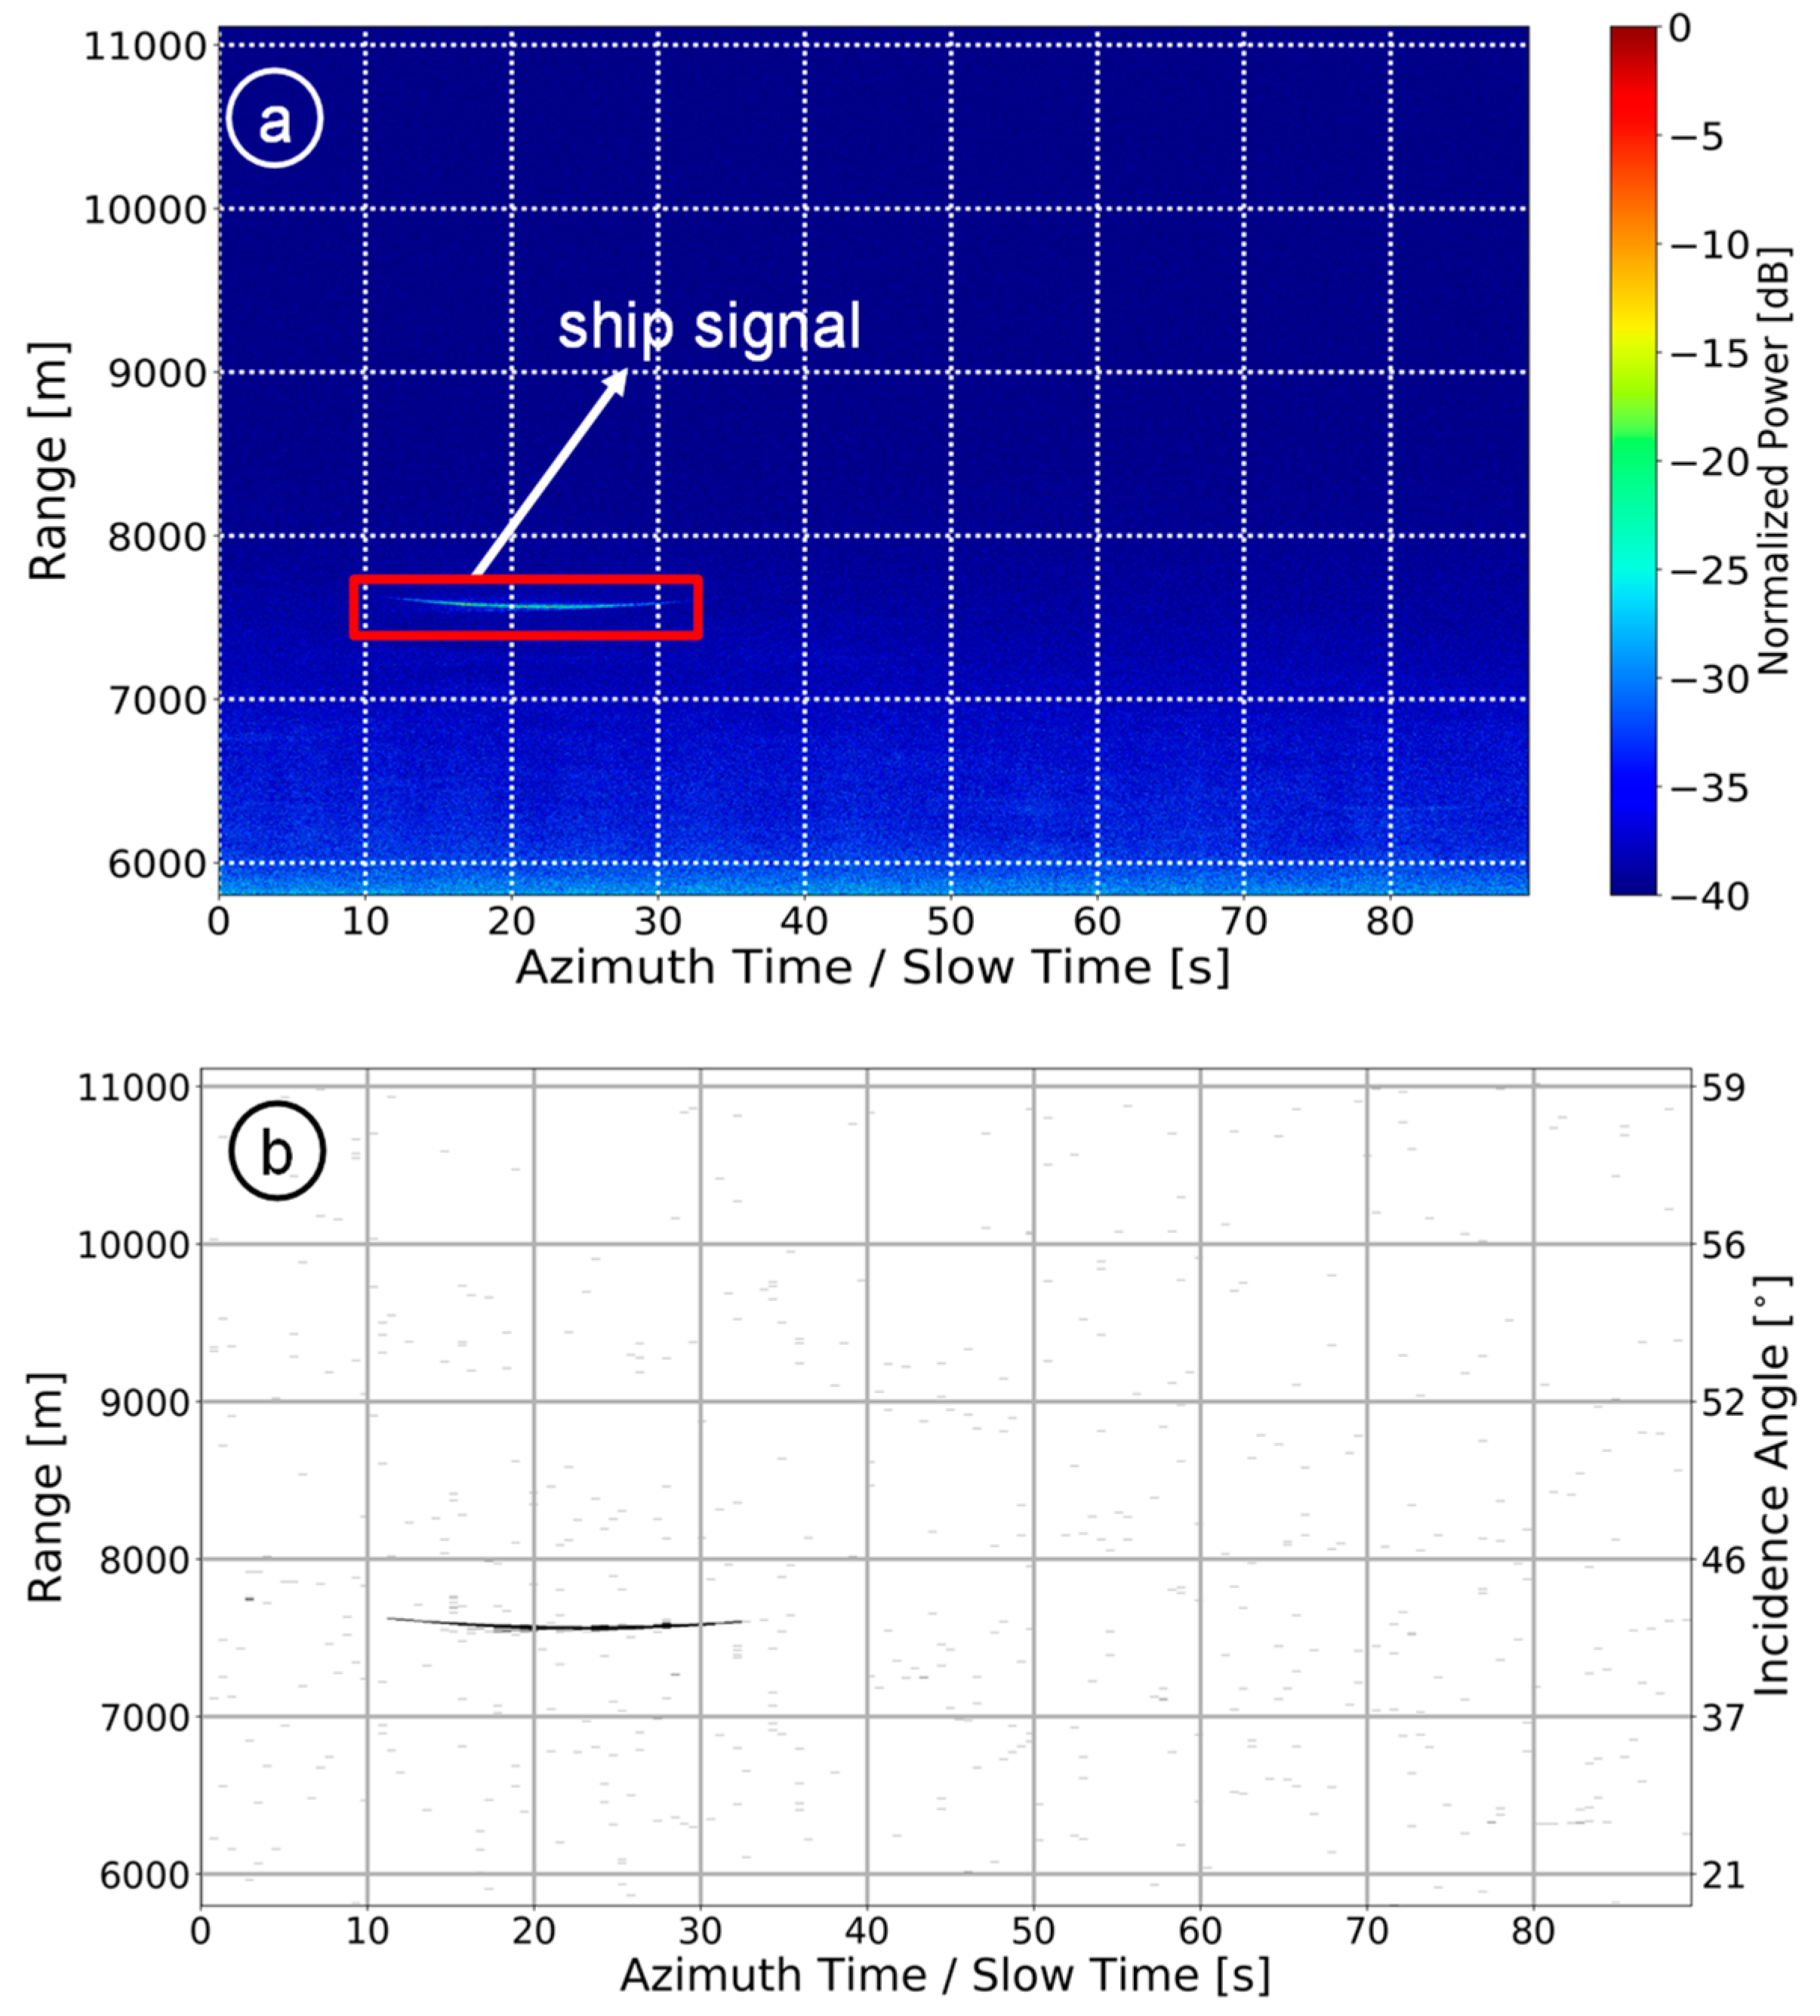
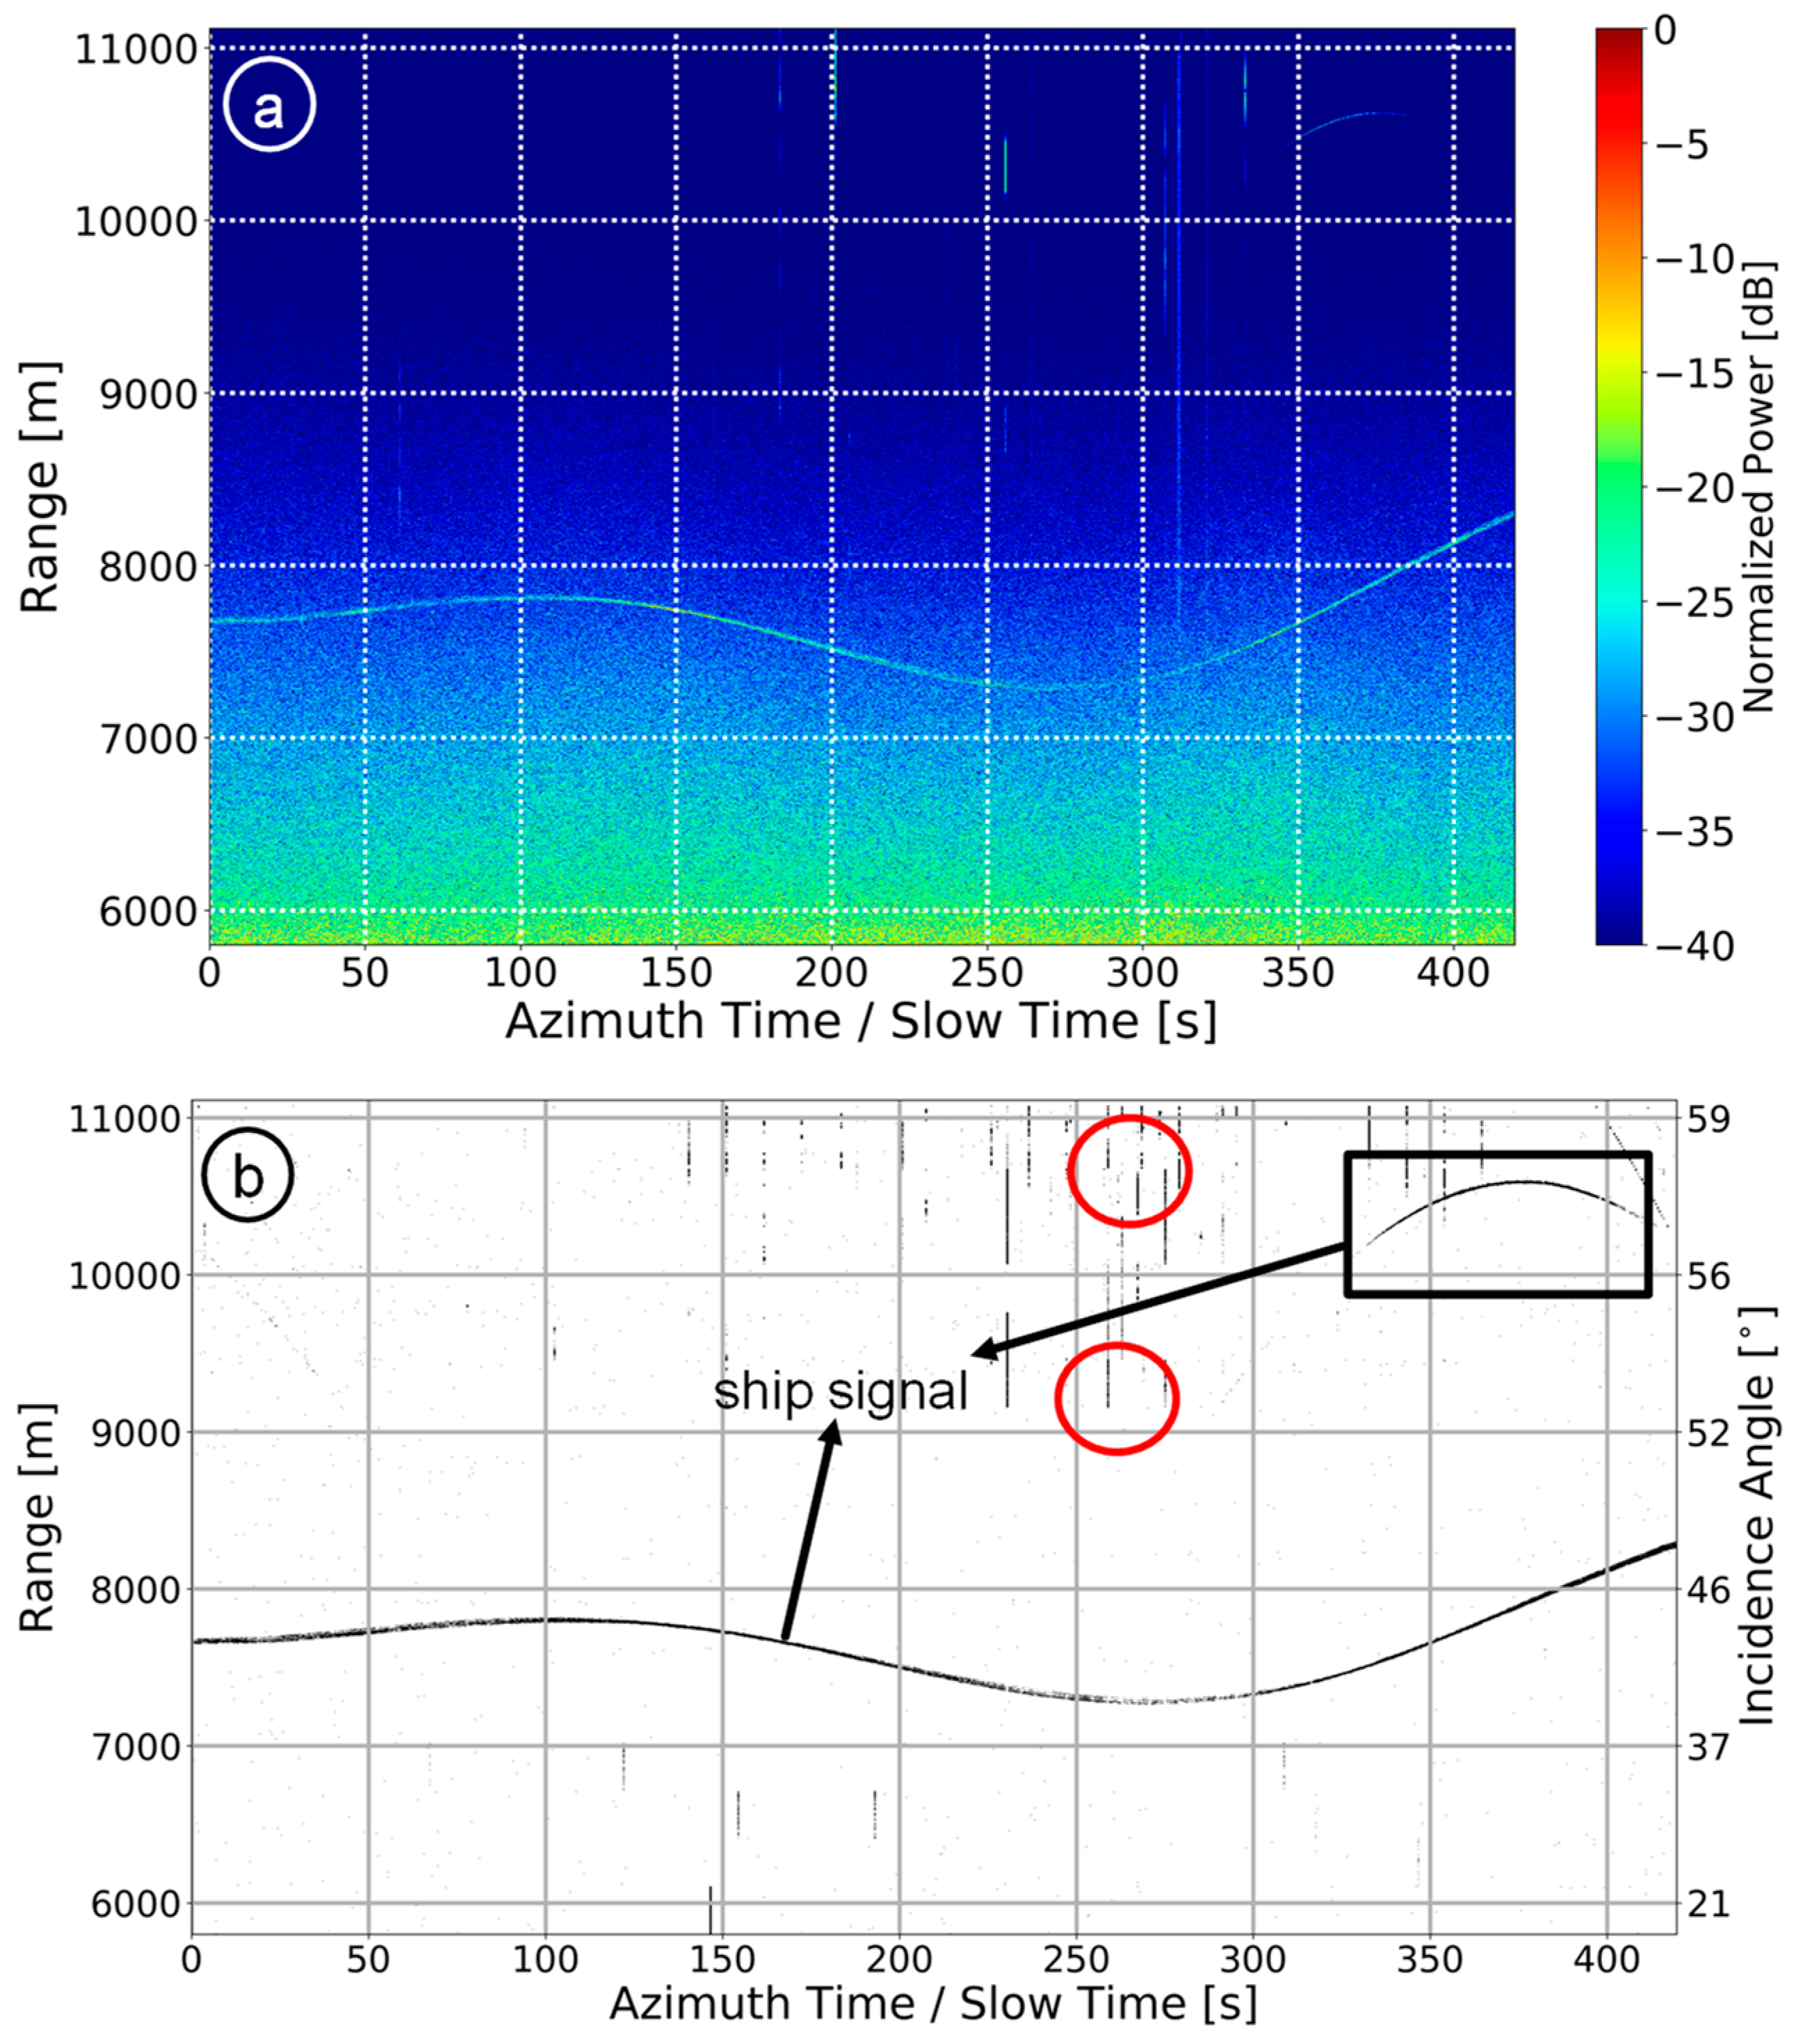
6.2. Detection Results

This section of the paper provides the detection results obtained after the analyses performed in Section 6.1. The K-Rayleigh distribution function is used in the near and mid ranges and 3MD model is used in the far range of the data. The detection threshold is estimated based on a desired false alarm rate of 10 6 . The binary ship detection maps of the linearly and circularly acquired F-SAR data are shown in Figure 29 and Figure 30, respectively. The equations finally used to generate the detection results are (7), (10), (13), (25) and (26).
In Figure 30, the ship signal is not completely visible over the entire observation time. There are some gaps. This is because the F-SAR X-band 3 dB azimuth antenna beamwidth in the order of 8° is rather small. Since the antenna also cannot be steered electronically or mechanically, during a circular flight with a ship moving in the circle center, the cross-wind may cause a significant yaw angle so that the ship is not always illuminated. In contrast to the X-band, the L-band 3 dB azimuth antenna beamwidth is in the order of 18° so that the ship signal is always visible in the data as shown in Figure 31.
Furthermore, experimental detection results from the linearly acquired VV polarized real X-band single-channel RC radar data are shown in Figure 32. Here, the ships are moving in directions of 45°, 90° and 0° w.r.t. the flight direction.
From Figure 32, it can be observed that the ship is well detected in the RC radar data with the proposed methodology, independent of its moving direction w.r.t. the flight path.
To summarize, the performance of the proposed CFAR ship detection algorithm mainly depends on two factors: the target pre-detection threshold (cf. Section 3.1) and the accuracy of the clutter model. Inappropriate estimation of the target pre-detection threshold in time domain may prevent target cancellation, and, thus can directly impact the average Doppler spectrum (cf. Figure 16c) and degrade the performance of the clutter models. Therefore, the parameters for computing the target pre-detection threshold should be carefully selected for obtaining later a valid CFAR threshold in Doppler domain. Additionally, an appropriate selection of the clutter model also plays a key role to improve the target detection by minimizing the detection threshold amplitude and the false alarm rate errors (cf. Section 6.1.1 and Section 6.1.2). In the paper, we recommend using a K-Rayleigh distribution in the near and mid ranges because of the numerous discrete sea spikes present in the data at those ranges. For the far range, where less sea spikes are observable in our experimental data, the clutter intensity is more Rayleigh distributed so we recommend using a chi-square or 3MD model.
One potential third factor which may negatively influence the performance of the proposed algorithm is the sea state, although not investigated in the paper. Especially in the case of high sea state, i.e., if the pixels corresponding to the vessel have similar statistics and intensity as the surrounding clutter, it may happen that the vessel is not detectable, especially not in the time or imaging domain. However, high sea state does not prevent the vessel detection if it is properly illuminated by the radar (i.e., if the illumination is not prevented by high sea waves) and, if the line-of-sight velocity component is large enough so that the corresponding echo signal is shifted to the exo-clutter region (cf. (1) and Figure 1a).

7. Conclusions

This paper proposes a CFAR-based ship detection processing chain principally suitable for real time applications. The major component of the proposed processing chain is the automatic training data selection approach. This approach includes a novel target pre-detection module used for successfully cancelling the outliers, i.e., spiky clutter peaks and strong ship signals, from the training data. This ensures a proper fit of suitable sea clutter models, and consequently an accurate CFAR threshold computation. A proper fit of the sea clutter models and an accurate CFAR threshold computation are essential for keeping the threshold errors and false alarm rate errors at a low level.
Various sea clutter models were thoroughly investigated in terms of threshold errors and false alarm rate errors using experimental single-channel range-compressed radar data acquired with DLR’s airborne sensor F-SAR during linear and circular flight tracks. Many X-band data with HH polarization and a range bandwidth of 384 MHz were used for these investigations. It was found that as a sea clutter model the K-distribution (regardless of any parameter estimation method) is generally not a good choice, especially not for near (15°–30° incidence angle) and mid ranges (30°–50°). The chi-square and the 3MD model lead to extremely high false alarm rate errors and threshold errors in the near and mid ranges but perform very well in the far range (>50° incidence angle), which is dominated by thermal noise. In contrast, the K-Rayleigh distribution results in the smallest false alarm rate errors and threshold errors in the near and mid-ranges but were found unsuitable for the far range.
Therefore, in terms of suitable sea clutter models, we recommend using the K-Rayleigh distribution function for lower incidence angle ranges (15°–50°) and the 3MD model or the chi-square model for higher incidence angles (>50°). We also want to point out that for the investigations in this paper we mainly have used X-band radar data acquired during two F-SAR flights each lasting only a few hours. During that short time frame, it can be expected that the sea state has not changed significantly. Therefore, we were not able to investigate the influence of the sea state on the sea clutter model performance. This is an open topic for the future. Further investigations using linearly and circularly acquired radar data at different sea states are recommended. However, to the authors knowledge, so far, such an extensive data set, which would allow for more sophisticated investigations, does not exist.

Author Contributions

Conceptualization, S.K.J. and S.V.B.; Methodology, S.K.J. and S.V.B.; Software, S.K.J. and S.V.B.; Validation, S.K.J. and S.V.B.; Formal Analysis, S.K.J. and S.V.B.; Investigation, S.K.J.; Resources, S.V.B.; Writing—Original Draft Preparation, S.K.J.; Writing—Review & Editing, S.K.J., S.V.B., A.B.C.d.S. and G.K.; Visualization, S.K.J. and S.V.B.; Supervision, S.V.B.; Funding Acquisition, S.V.B.

Funding

This research was funded by the German Academic Exchange Service (DAAD) [grant number 57265855].

Acknowledgments

The authors would like to thank the anonymous reviewers for their useful comments and suggestions that significantly improved the clarity of the paper.

Conflicts of Interest

The authors declare no conflict of interest.

References

  1. Te Hennepe, F.; Rinaldo, R.; Ginesi, A.; Tobehn, C.; Wieser, M.; Olsen, Ø.; Helleren, Ø.; Challamel, R.; Storesund, F. Space-based detection of AIS signals: Results of a feasibility study into an operational space-based AIS system. In Proceedings of the ASMS/SPSC 2010: 2010 5th Advanced Satellite Multimedia Systems Conference and the 11th Signal Processing for Space Communications Workshop, Cagliari, Italy, 13–15 September 2010; pp. 17–24. [Google Scholar]
  2. Eldhuset, K. An automatic ship and ship wake detection system for spaceborne SAR images in coastal regions. IEEE Trans. Geosci. Remote Sens. 1996, 34, 1010–1019. [Google Scholar] [CrossRef]
  3. Iervolino, P.; Guida, R.; Whittaker, P. A Model for the Backscattering from a Canonical Ship in SAR Imagery. IEEE J. Sel. Top. Appl. Earth Obs. Remote Sens. 2016, 9, 1163–1175. [Google Scholar] [CrossRef]
  4. Souyris, J.-C.; Henry, C.; Adragna, F. On the use of complex SAR image spectral analysis for target detection: Assessment of polarimetry. IEEE Trans. Geosci. Remote Sens. 2003, 41, 2725–2734. [Google Scholar] [CrossRef]
  5. Tings, B.; Velotto, D. Comparison of ship wake detectability on C-band and X-band SAR. Int. J. Remote Sens. 2018, 39, 4451–4468. [Google Scholar] [CrossRef] [Green Version]
  6. Biondi, F. A Polarimetric Extension of Low-Rank Plus Sparse Decomposition and Radon Transform for Ship Wake Detection in Synthetic Aperture Radar Images. IEEE Geosci. Remote Sens. Lett. 2019, 16, 75–79. [Google Scholar] [CrossRef]
  7. Biondi, F. Low-Rank Plus Sparse Decomposition, Multi-Chromatic Analysis and Generalized Likelihood Ratio Test for Ship Weak Detection, (L+S)-MCA-GLRT. In Proceedings of the 5th International Workshop on Compressed Sensing Applied to Radar, Multimodal Sensing, and Imaging (CoSeRa), Siegen, Germany, 10–13 September 2018; pp. 1–5. [Google Scholar]
  8. Brusch, S.; Lehner, S.; Fritz, T.; Soccorsi, M.; Soloviev, A.; van Schie, B. Ship surveillance with TerraSAR-X. IEEE Trans. Geosci. Remote Sens. 2011, 49, 1092–1103. [Google Scholar] [CrossRef]
  9. Baumgartner, S.V. Linear and Circular ISAR Imaging of Ships Using DLR’s Airborne Sensor F-SAR. In Proceedings of the International Conference on Radar Systems, IET Radar 2017, Belfast, UK, 23–26 October 2017. [Google Scholar]
  10. Martorella, M.; Pastina, D.; Berizzi, F.; Lombardo, P. Spaceborne radar imaging of maritime moving targets with the Cosmo-SkyMed SAR system. IEEE J. Sel. Top. Appl. Earth Obs. Remote Sens. 2014, 7, 2797–2810. [Google Scholar] [CrossRef]
  11. Liu, C.; Vachon, P.W.; Geling, G.W. Improved ship detection with airborne polarimetric SAR data. Can. J. Remote Sens. 2005, 31, 122–131. [Google Scholar] [CrossRef]
  12. Osman, H.; Blostein, S.D. Probabilistic winner-take-all segmentation of images with application to ship detection. IEEE Trans. Syst. Man Cybern. Part B Cybern. 2000, 30, 485–490. [Google Scholar] [CrossRef]
  13. Fingas, M.F.; Brown, C.E. Review of ship detection from airborne platforms. Can. J. Remote Sens. 2001, 27, 379–385. [Google Scholar] [CrossRef]
  14. Makhoul, E.; Baumgartner, S.V.; Jager, M.; Broquetas, A. Multichannel SAR-GMTI in Maritime Scenarios with F-SAR and TerraSAR-X Sensors. IEEE J. Sel. Top. Appl. Earth Obs. Remote Sens. 2015, 8, 5052–5067. [Google Scholar] [CrossRef]
  15. Cerutti-Maori, D.; Sikaneta, I.C.; Gierull, C.H. Ship Detection with Spaceborne Multi-channel SAR/GMTI Radars. In Proceedings of the 9th European Conference on Synthetic Aperture Radar, Nuremberg, Germany, 23–26 April 2012; pp. 400–403. [Google Scholar]
  16. Joshi, S.K.; Baumgartner, S.V. Sea clutter model comparison for ship detection using single channel airborne raw SAR data. In Proceedings of the EUSAR 2018: 12th European Conference on Synthetic Aperture Radar, Aachen, Germany, 4–7 June 2018; pp. 731–735. [Google Scholar]
  17. Melvin, W.L. A STAP overview. IEEE Aerosp. Electron. Syst. Mag. 2004, 19, 19–35. [Google Scholar] [CrossRef]
  18. Da Silva, A.B.C.; Baumgartner, S.V. Novel post-Doppler STAP with a priori knowledge information for traffic monitoring applications: Basic idea and first results. Adv. Radio Sci. 2017, 15, 77–82. [Google Scholar] [CrossRef]
  19. Ward, J. Space-Time Adaptive Processing for Airborne Radar. IEE Colloq. Space Time Adapt. Process. 1998, 2/1–2/6. [Google Scholar]
  20. Reigber, A.; Scheiber, R.; Jager, M.; Prats-Iraola, P.; Hajnsek, I.; Jagdhuber, T.; Papathanassiou, K.P.; Nannini, M.; Aguilera, E.; Baumgartner, S.; et al. Very-high-resolution airborne synthetic aperture radar imaging: Signal processing and applications. Proc. IEEE 2013, 101, 759–783. [Google Scholar] [CrossRef]
  21. Watts, S.; Rosenberg, L. A comparison of coherent and non-coherent radar detection performance in radar sea clutter. In Proceedings of the International Conference on Radar Systems (Radar 2017), Belfast, UK, 23–26 October 2017; pp. 1–6. [Google Scholar]
  22. Rosenberg, L.; Watts, S. Model based coherent detection in medium grazing angle sea-clutter. In Proceedings of the 2016 IEEE Radar Conference, Philadelphia, PA, USA, 2–6 May 2016. [Google Scholar]
  23. Silva, A.B.C.; Baumgartner, S.V. Training Data Selection and Update for Airborne Post-Doppler Space-Time Adaptive Processing. In Proceedings of the EUSAR 2018: 12th European Conference on Synthetic Aperture Radar, Aachen, Germany, 4–7 June 2018; pp. 1285–1290. [Google Scholar]
  24. Baumgartner, S.V. Circular and Polarimetric ISAR Imaging of Ships Using Airborne SAR Sensors. In Proceedings of the EUSAR 2018: 12th European Conference on Synthetic Aperture Radar, Aachen, Germany, 4–7 June 2018; pp. 116–121. [Google Scholar]
  25. Cerutti-Maori, D.; Sikaneta, I.; Gierull, C.H. Optimum SAR/GMTI processing and its application to the radar satellite RADARSAT-2 for Traffic Monitoring. IEEE Trans. Geosci. Remote Sens. 2012, 50, 3868–3881. [Google Scholar] [CrossRef]
  26. Himonas, S.D.; Barkat, M. Automatic Censored CFAR Detection for Nonhomogeneous Environments. IEEE Trans. Aerosp. Electron. Syst. 1992, 28, 286–304. [Google Scholar] [CrossRef]
  27. Rohling, H. Radar CFAR Thresholding in Clutter and Multiple Target Situations. IEEE Trans. Aerosp. Electron. Syst. 1983, 19, 608–621. [Google Scholar] [CrossRef]
  28. El Mashade, M.B. Monopulse detection analysis of the trimmed mean level CFAR processor in nonhomogeneous situations. IEE Radar Sonar Navig. 1996, 143, 87–94. [Google Scholar] [CrossRef]
  29. Rickard, J.T.; Dillard, G.M. Adaptive Detection Algorithms for Multiple-Target Situations. IEEE Trans. Aerosp. Electron. Syst. 1977, 13, 338–343. [Google Scholar] [CrossRef]
  30. Cui, Y.; Zhou, G.; Yang, J.; Yamaguchi, Y. On the iterative censoring for target detection in SAR images. IEEE Geosci. Remote Sens. Lett. 2011, 8, 641–645. [Google Scholar] [CrossRef]
  31. Tao, D.; Anfinsen, S.N.; Brekke, C. Robust CFAR Detector Based on Truncated Statistics in Multiple-Target Situations. IEEE Trans. Geosci. Remote Sens. 2016, 54, 117–134. [Google Scholar] [CrossRef]
  32. Leys, C.; Ley, C.; Klein, O.; Bernard, P.; Licata, L. Detecting outliers: Do not use standard deviation around the mean, use absolute deviation around the median. J. Exp. Soc. Psychol. 2013, 49, 764–766. [Google Scholar] [CrossRef] [Green Version]
  33. Schafer, R.W. What is a savitzky-golay filter? IEEE Signal Process. Mag. 2011, 28, 111–117. [Google Scholar] [CrossRef]
  34. Bamler, R. Doppler frequency estimation and the Cramer-Rao bound. IEEE Trans. Geosci. Remote Sens. 1991, 29, 385–390. [Google Scholar] [CrossRef] [Green Version]
  35. Crisp, D.J.; Rosenberg, L.; Stacy, N.J.; Dong, Y. Modelling X-band sea clutter with the K-distribution: Shape parameter variation. In Proceedings of the 2009 International Radar Conference “Surveillance for a Safer World” (RADAR 2009), Bordeaux, France, 12–16 October 2009; pp. 1–6. [Google Scholar]
  36. Ward, K.D.; Tough, R.J.A.; Watts, S. Sea clutter: Scattering, the K distribution and radar performance. Waves Random Complex Media 2007, 17, 233–234. [Google Scholar] [CrossRef]
  37. Gierull, C.H. Numerical Recipes to Determine the Performance of Multi-Channel GMTI Radars; Defence R&D Canada: Ottawa, ON, Canada, 2011; p. 28.
  38. Jakeman, E. On the statistics of K-distributed noise. J. Phys. A Math. Gen. 1980, 13, 31–48. [Google Scholar] [CrossRef]
  39. Ward, K.D. Compound representation of high resolution sea clutter. Electron. Lett. 1981, 17, 561–563. [Google Scholar] [CrossRef]
  40. Greidanus, H. Applicability of the K distribution to RADARSAT maritime imagery. In Proceedings of the 2004 IEEE International Geoscience and Remote Sensing Symposium, Anchorage, AK, USA, 20–24 September 2004. [Google Scholar]
  41. Lombardo, P.; Oliver, C.J. Estimation of texture parameters in K-distributed clutter. IEE Proc. Radar Sonar Navig. 1994, 141, 196–204. [Google Scholar] [CrossRef]
  42. Blacknell, D.; Tough, R.J.A. Parameter estimation for the K-distribution based on [z log(z)]. IEE Proc. Radar Sonar Navig. 2001, 148, 309–312. [Google Scholar] [CrossRef]
  43. Moré, J.J. The Levenberg-Marquardt Algorithm: Implementation and Theory. In Numerical analysis; Springer: Berlin, Heidelberg, 1978; pp. 105–116. [Google Scholar]
  44. Abraham, D.A.; Lyons, A.P. Reliable methods for estimating the K-distribution shape parameter. IEEE J. Ocean. Eng. 2010, 35, 288–302. [Google Scholar] [CrossRef]
  45. Henschel, M.D.; Rey, M.T.; Campbell, J.W.M.; Petrovic, D. Comparison of probability statistics for automated ship detection in SAR imagery. Proc. SPIE 1998, 3491, 986–991. [Google Scholar]
  46. Gierull, C.H.; Sikaneta, I.C.; Defence, R.; Drdc, D.C. Improved SAR Vessel Detection Based on Discrete Texture. In Proceedings of the EUSAR 2016: 11th European Conference on Synthetic Aperture Radar, Hamburg, Germany, 6–9 June 2016; pp. 523–526. [Google Scholar]
  47. Gierull, C.H.; Sikaneta, I. A Compound-Plus-Noise Model for Improved Vessel Detection in Non-Gaussian SAR Imagery. IEEE Trans. Geosci. Remote Sens. 2018, 56, 1444–1453. [Google Scholar] [CrossRef]
  48. Rosenberg, L.; Watts, S.; Bocquet, S. Application of the K+Rayleigh distribution to high grazing angle sea-clutter. In Proceedings of the 2014 International Radar Conference, Radar 2014, Lille, France, 13–17 October 2014. [Google Scholar]
  49. Ester, M.; Kriegel, H.-P.; Sander, J.; Xu, X. A density-based algorithm for discovering clusters in large spatial databases with noise. In Proceedings of the International Conference on Knowledge Discovery and Information Retrieval, Portland, Oregon, 2–4 August 1996; pp. 226–231. [Google Scholar]
  50. Kalman, R.E. A New Approach to Linear Filtering and Prediction Problems. J. Basic Eng. 1960, 82, 35–45. [Google Scholar] [CrossRef] [Green Version]
  51. Tings, B.; Bentes, C.; Velotto, D.; Voinov, S. Modelling ship detectability depending on TerraSAR-X-derived metocean parameters. CEAS Space J. 2019, 11, 81–94. [Google Scholar] [CrossRef]
Figure 1. (a) Range-Doppler image of real X-band RC F-SAR data. The clutter with a bandwidth of around 800 Hz and a ship appearing at −500 Hz are clearly visible. (b) Normalized image. (c) Clustered detections with their centroids and bounding boxes at azimuth times t = 15 s, t = 20 s and t = 30 s, respectively. (d) Target trajectory obtained from a tracking algorithm (orange) and cluster centroids (blue).
Remotesensing 11 01270 g001
Figure 2. Illustration of the average Doppler spectrum of a range-Doppler image containing clutter and ship targets (a) before and (b) after normalization over Doppler. The red curve in (a) is the average Doppler profile estimated without considering the targets. The green line in (b) is the detection threshold computed based on clutter plus noise level.
Remotesensing 11 01270 g002
Figure 3. Clutter Doppler centroid map computed by using the measured aircraft Euler angles for a circular flight carried out with F-SAR (details about the flight are given in Section 6).
Remotesensing 11 01270 g003
Figure 4. Block diagram of the proposed algorithm which uses RC airborne radar data as input. The individual blocks and processing steps are numbered from 1 to 17 and are discussed in detail in the text.
Remotesensing 11 01270 g004
Figure 5. Patch of HH polarization X-band F-SAR data containing a ship target (at a range of approx. 7570 m). For visualization purposes, the data were normalized to the maximum power.
Remotesensing 11 01270 g005
Figure 6. Logarithmic plot of the PDFs of the ocean only (red) and ocean with a ship signal (blue) are shown. For visualization purposes, the intensity axis is truncated as the maximum intensity due to the ship is around 600.
Remotesensing 11 01270 g006
Figure 7. Amplitude over range profile of the sea backscatter in HH, VV and HV polarization channels of RC F-SAR X-band radar data.
Remotesensing 11 01270 g007
Figure 8. Average amplitude range profile with range dependent pre-detection thresholds. A high target peak (=ship) is present at a range of approximately 7500 m. The effectiveness of the MAD based pre-detection is evaluated in three different zones; near (red), mid (green) and far range (blue). Details are shown in Figure 9.
Remotesensing 11 01270 g008
Figure 9. Details of the pre-detection thresholds computed for different factors f in (a) near (b) mid and (c) far ranges.
Remotesensing 11 01270 g009
Figure 10. RC F-SAR X-band HH polarized radar data acquired during a linear flight track. Ship signal is indicated in the figure.
Remotesensing 11 01270 g010
Figure 11. Binary detection map after applying the proposed pre-detection algorithm. The pre-detected ship signal (left) as well as spiky clutter peaks can clearly be seen.
Remotesensing 11 01270 g011
Figure 12. Ratio of the false alarm rates over range for X-band HH (top), VV (middle) and HV (bottom) polarization before (blue) and after pre-detection and target cancellation (red). Note that a ship target is present at around 42° incidence angle.
Remotesensing 11 01270 g012
Figure 13. Doppler centroid map estimated from (a) linearly and (b) circularly acquired F-SAR L-band HH polarized RC data. The ship histories in both (a,b) can be clearly seen. (c,d) Doppler centroid maps re-estimated after cancelling the potential targets using the proposed pre-detection algorithm.
Remotesensing 11 01270 g013
Figure 14. (a) RC radar data, (b) Google Earth image and (c) Pauli image corresponding to Figure 13a. Sandbanks can be clearly observed in the Google Earth image. The bright spots in the Pauli image are strong scatterers, e.g., buoys or ships.
Remotesensing 11 01270 g014
Figure 15. Range-Doppler image of a target free image patch (a) before and (b) after clutter normalization. The normalized average power profiles of (a,b) are shown in (c).
Remotesensing 11 01270 g015
Figure 16. Data containing a ship target: (a) range-Doppler image before clutter normalization, (b) average Doppler spectrum estimated without using pre-detection for removing the target from (a,c) normalized image after using the average Doppler spectrum from (b,d) target free estimation of average power spectrum after using pre-detection algorithm, (e) normalized image after using (d).
Remotesensing 11 01270 g016
Figure 17. Estimated texture parameter of the K-distribution along (a,c) range and (b,d) azimuth using data acquired during a linear and circular flight.
Remotesensing 11 01270 g017
Figure 18. Binary detection map based on the K-distribution obtained from the same RC F-SAR X-band HH polarized data shown in Figure 10. The detected ship signal (left) and high sea clutter spikes can be clearly observed.
Remotesensing 11 01270 g018
Figure 19. Binary detection map in range-Doppler domain using (a) K-distribution and (b) K-Rayleigh distribution. The thresholds estimated in both the cases are shown on the top right. The X-band HH F-SAR data were used as an input. The detection maps were generated using 128 azimuth and 512 range samples, the desired false alarm rate was set to P fa = 10 6 .
Remotesensing 11 01270 g019
Figure 20. (a) Range-Doppler image showing the total range of the complete scene and 128 Doppler bins respectively (cf. black box in Figure 4 bottom right). The ship signal is highlighted by the red box. (b) Scaled detail of the red box from (a); (c) the clustered ship signal with its centroid and the bounding box. The ship pixels shown in this example were detected using the K-distribution.
Remotesensing 11 01270 g020
Figure 21. Flight tracks flown during the two-day North Sea campaign (top: day 1; bottom: day 2).
Remotesensing 11 01270 g021
Figure 22. Simultaneously acquired fully polarimetric X- and L-band data of the region around Cuxhaven and the corresponding AIS data.
Remotesensing 11 01270 g022
Figure 23. (a) Google Earth image showing a part of the test site. The region within the white box marks the area where the data were acquired during (b) a linear and (c) a circular F-SAR flight track. The red and yellow ellipses in (b,c) are the 3 dB antenna footprints of the X- and L-band antenna, respectively.
Remotesensing 11 01270 g023
Figure 24. Logarithmic PDFs of different distribution functions plotted for (a) near (b) mid and (c) far range using the data acquired during the linear flight track (cf. Figure 23b). The estimated parameters corresponding to different distribution functions are shown in the legends of the plots, apart from the 3MD model since it has 8 unknowns.
Remotesensing 11 01270 g024
Figure 25. Logarithmic PDFs of different distribution functions plotted for (a) near (b) mid and (c) far range using data acquired during the circular flight track (cf. Figure 23c). The estimated parameters corresponding to different distribution functions are shown in the legends of the plots.
Remotesensing 11 01270 g025
Figure 26. Average Doppler spectrum of the linearly acquired data estimated in near, mid and far range. The ambiguities cause a variation in the average power in the noise region of the spectrum.
Remotesensing 11 01270 g026
Figure 27. Logarithmic CCDFs of different distribution functions plotted for (a) near (b) mid and (c) far range. These plots are generated from the same data used for generating the plots shown in Figure 24.
Remotesensing 11 01270 g027
Figure 28. Logarithmic CCDFs of different distribution functions plotted for (a) near (b) mid and (c) far range. These plots are generated from the same data used for generating the plots shown in Figure 25.
Remotesensing 11 01270 g028
Figure 29. (a) Linearly acquired real single-channel HH polarized RC X-band radar data. (b) Corresponding binary detection map shown in time-domain after applying CFAR based ship detection in range–Doppler domain. K-Rayleigh distribution function was used in the near and mid ranges, and the 3MD model was used in the far range of the data. The desired false alarm rate was set to P fa = 10 6 . The detected ship signal is clearly visible in the RC data and in the detection map.
Remotesensing 11 01270 g029
Figure 30. (a) Circularly acquired real single-channel HH polarized RC X-band radar data. (b) Corresponding binary detection map shown in time-domain after applying CFAR based ship detection in range–Doppler domain. K-Rayleigh distribution was used in the near and mid ranges, and the 3MD model was used in the far range of the data. The desired false alarm rate was set to P fa = 10 6 . The detections marked by the red circles are due to the interfering signals from a ground surveillance radar located close to the test site (for visualization purposes not all of the interfering signals are marked).
Remotesensing 11 01270 g030
Figure 31. (a) Circularly acquired real single-channel HH polarized RC L-band radar data. (b) Binary detection map shown in time-domain after applying CFAR based ship detection in range–Doppler domain. K-Rayleigh distribution was used in the near and mid ranges, and the 3MD model was used in the far range of the data. The desired false alarm rate was set to P fa = 10 6 . The detections marked by the red circles are due to the interfering signals from a ground surveillance radar located close to the test site (for visualization purposes not all of the interfering signals are marked).
Remotesensing 11 01270 g031
Figure 32. RC F-SAR X-band VV polarized radar data with a ship moving at (a) 45°, (b) 90° and (c) 0° w.r.t the flight track. The detection results corresponding to (ac) are shown in (df) respectively. Only the K-Rayleigh distribution was used for detection because the maximum incidence angle in the data is below 50°. The desired false alarm rate was set to P fa = 10 6 .
Remotesensing 11 01270 g032
Table 1. Measured target SCNR before and after clutter normalization.
Range-Doppler ImageTarget SCNR [dB]
Before normalization (Figure 16a)24.02
After normalization but without pre-detection (Figure 16c)14.20
After normalization with pre-detection and target cancellation (Figure 16e)23.08
Table 2. Radar system and acquisition geometry parameters for the linear and circular flight.
Acquisition ParametersLinearCircular
Average platform velocity [m/s]91.483.55
Platform altitude above ground [m]56385637
Total observation time along azimuth [s]90400
Number of SAR image(s) used11
Azimuth spacing [m]0.0380.034
Chirp bandwidth [MHz] for X- and L-band384, 150
Incidence angle range [°]15–60
Radar wavelength [m] for X- and L-band0.0306, 0.226
Pulse repetition frequency [Hz]2403.85
Total number of range samples17,723
Ground swath [km]8
Range Resolution [m] for X- and L-band0.39, 1.0
Range sample spacing [m] for X- and L-band0.3, 0.6
Azimuth antenna length [m] for X- and L-band0.3 m (Transmit), 0.2 m (Receive) (X-band)
0.3 m (Transmit), 0.3 m (Receive) (L-band)
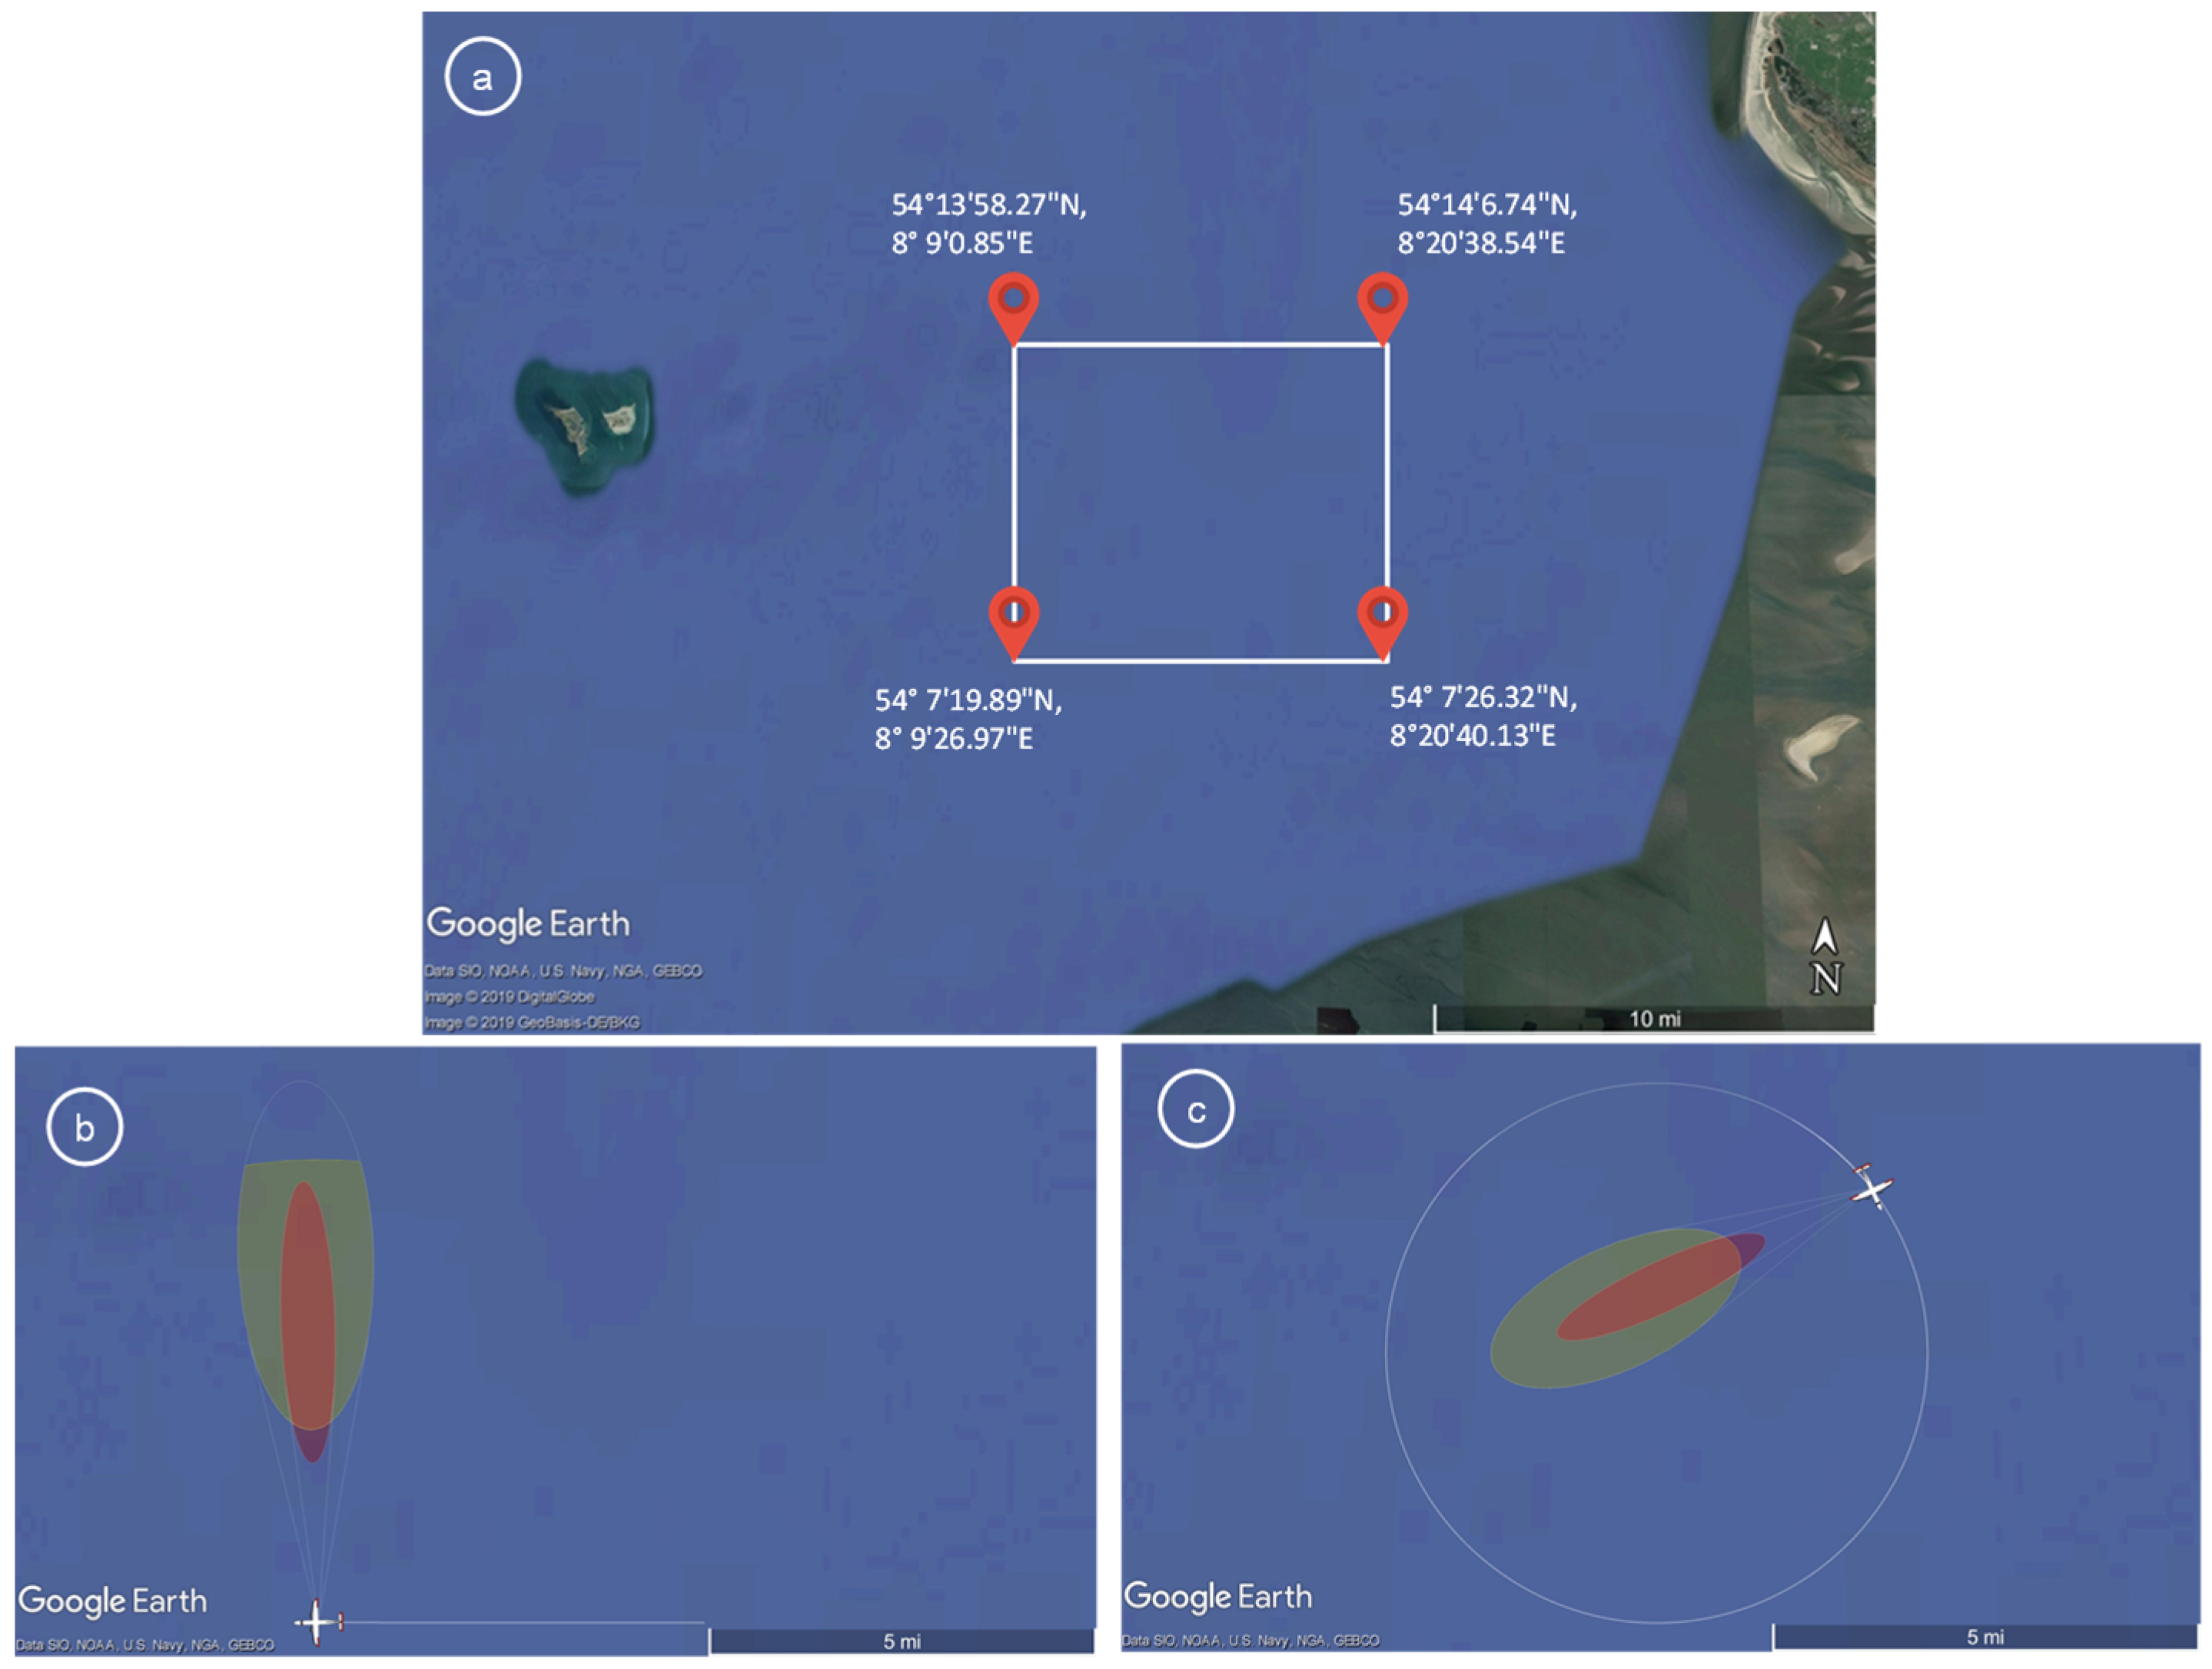
Geographical coordinatesShown in Figure 23a
Table 3. Estimated threshold errors for different clutter models for linearly acquired F-SAR data.
Clutter ModelsNear RangeMid-RangeFar Range
CCDF
10 4 10 4 10 4 10 5
K-NLLSQ3.978.01−10.34−2.16
K-Vstat2.416.89-
K-Xstat3.237.61-
Chi-square6.988.87−10.34−4.98
3MD5.628.27−10.34−5.17
K-Rayleigh−5.79−0.26-
Table 4. Estimated threshold error for different clutter models for circularly acquired F-SAR data.
Clutter ModelsNear RangeMid-RangeFar Range
CCDF
10 4 10 4 10 4
K-NLLSQ6.896.02−5.86
K-Vstat5.194.60-
K-Xstat6.195.49-
Chi-square9.707.73−11.65
3MD8.946.94−10.86
K-Rayleigh−6.682.27-
Table 5. False alarm rate errors for linearly acquired data. The values in the table are the ratio between the estimated actual false alarm rate and the set false alarm rate of 10 6 .
Distribution FunctionsNear RangeMid-RangeFar Range
K-NLLSQ80.5112.13.08
K-Vstat35.157.1-
K-Xstat56.986.8-
Chi-square277.4242.92.43
3MD149.2135.91.56
K-Rayleigh1.311.68-
Table 6. False alarm rate errors for circularly acquired data. The values in the table are the ratio between the estimated actual false alarm rate and the set false alarm rate of 10 6 .
Distribution FunctionsNear RangeMid-RangeFar Range
K-NLLSQ63.374.612.2
K-Vstat30.638.9-
K-Xstat46.955.9-
Chi-square422.4234.99.43
3MD257.9154.77.73
K-Rayleigh2.032.08-

