Article

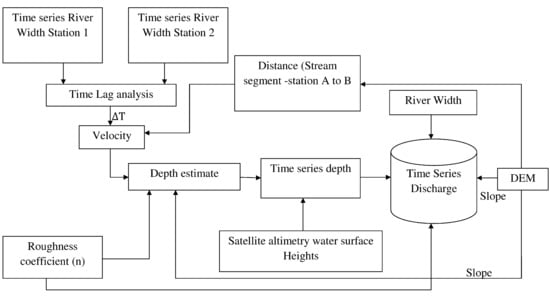
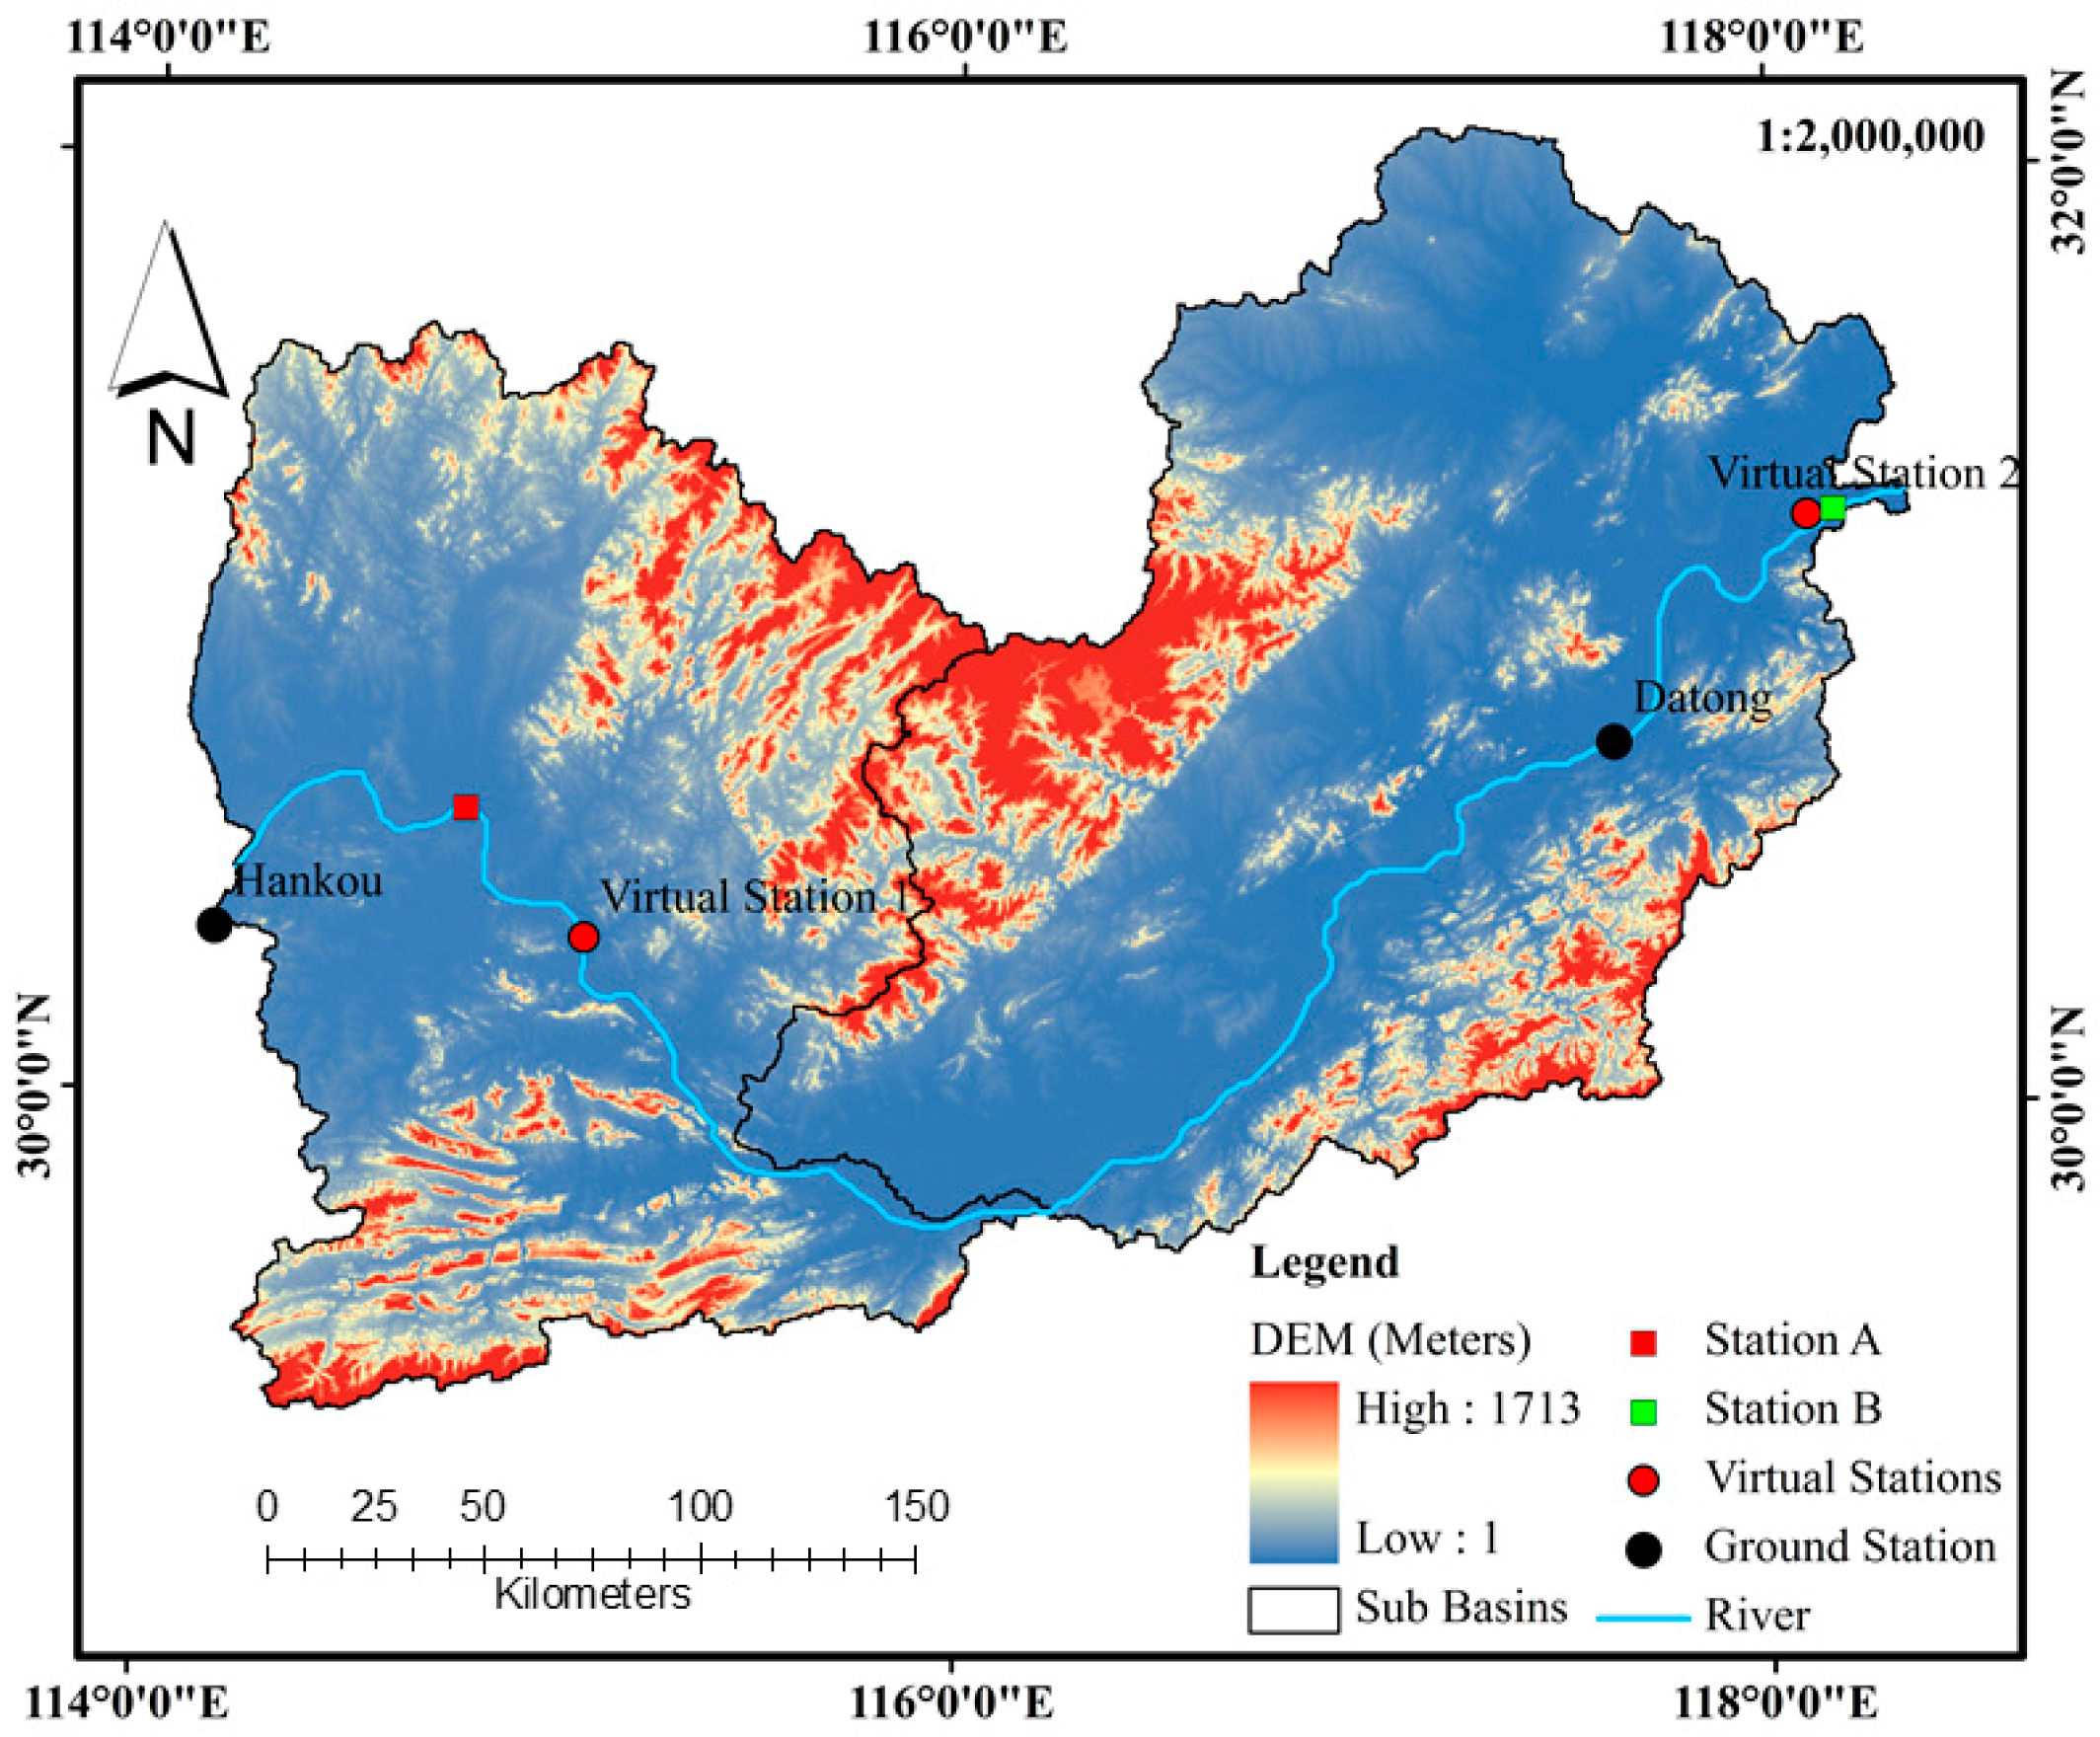
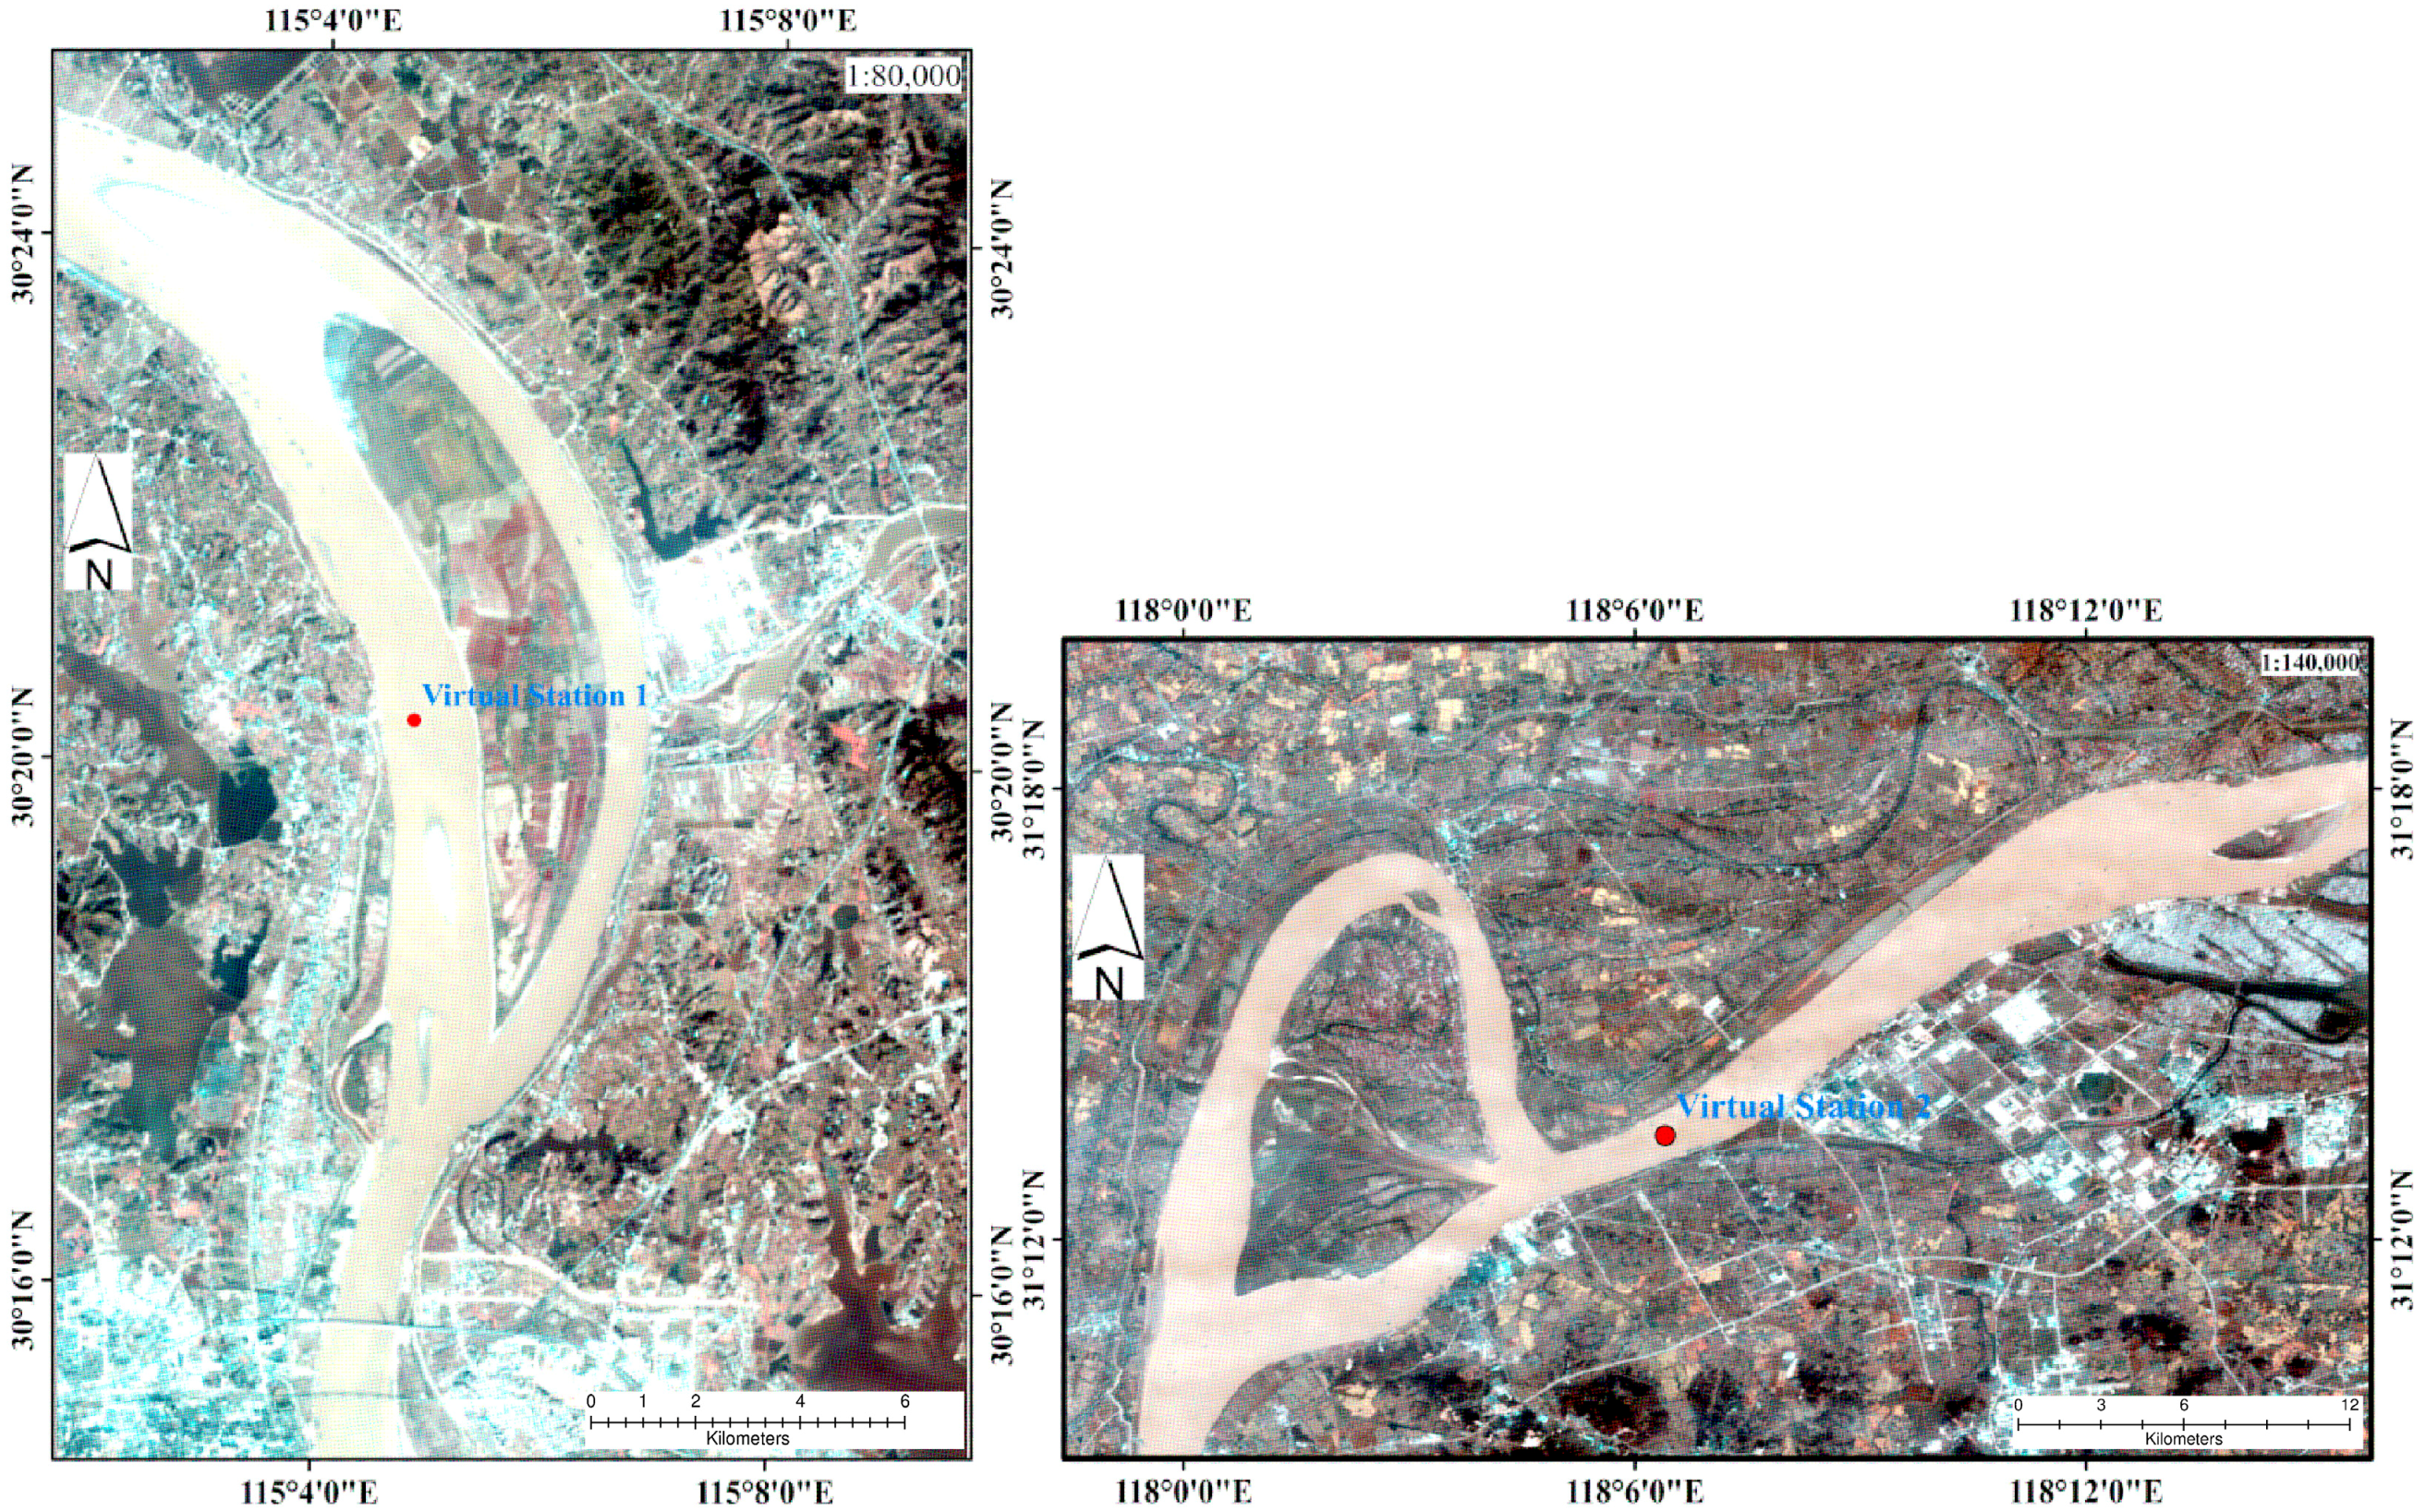
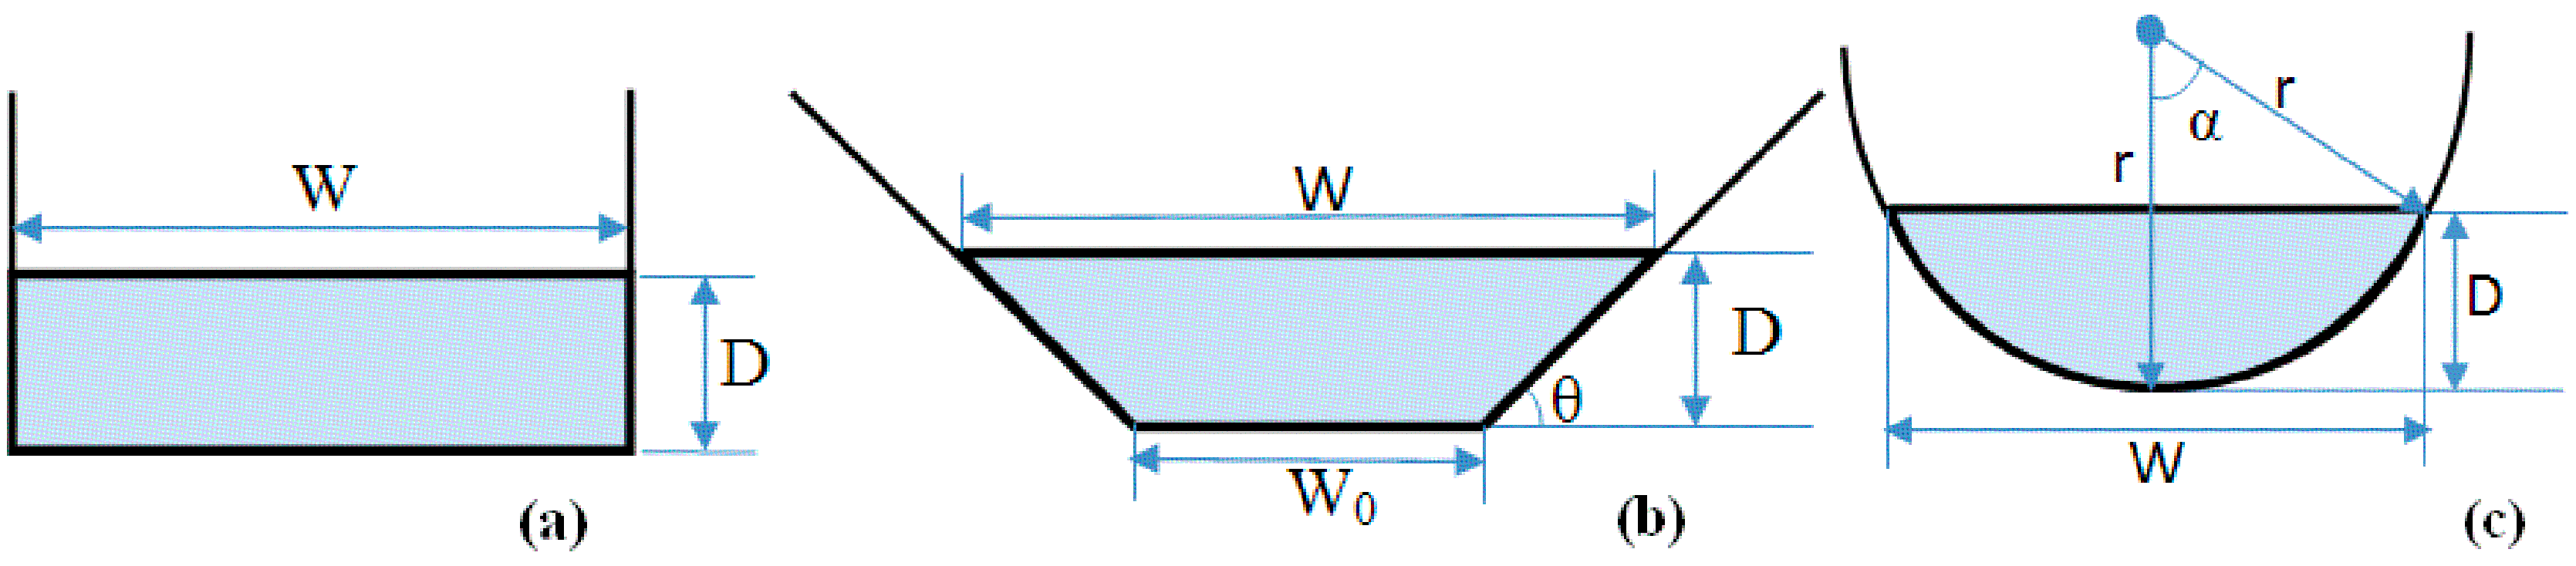
Estimation of River Discharge Solely from Remote-Sensing Derived Data: An Initial Study Over the Yangtze River

1
Key Laboratory of Tibetan Environment Changes and Land Surface Processes, Institute of Tibetan Plateau Research, Chinese Academy of Sciences, Beijing 100101, China
2
University of Chinese Academy of Sciences, Beijing 100101, China
3
Institute of Geomatics, GIS and Remote Sensing, Dedan Kimathi University of Technology, Nyeri 10100, Kenya
4
CAS Center for Excellence in Tibetan Plateau Earth Sciences, Beijing 100101, China
5
Information Center, Ministry of Water Resources, Beijing 100053, China
*
Author to whom correspondence should be addressed.
Remote Sens. 2018, 10(9), 1385; https://doi.org/10.3390/rs10091385
Submission received: 29 June 2018 / Revised: 20 August 2018 / Accepted: 21 August 2018 / Published: 31 August 2018
(This article belongs to the Special Issue Remote Sensing of Large Rivers)

Abstract

:
A novel approach has been developed to estimating river discharge solely using satellite-derived parameters. The temporal river width observations from Moderate Resolution Imaging Spectroradiometer (MODIS), made at two stream segments a distance apart, are plotted to identify the time lag. The river velocity estimate is then computed using the time lag and distance between the width measurement locations, producing a resultant velocity of 0.96 m/s. The estimated velocity is comparable to that computed from in situ gauge-observed data. An empirical relationship is then utilized to estimate river depth. In addition, the channel condition values published in tables are used to estimate the roughness coefficient. The channel slope is derived from the digital elevation model averaged over a river section approximately 516 km long. Finally, the temporal depth changes is captured by adjusting the estimated depth to the Envisat satellite altimetry -derived water level changes, and river width changes from Landsat ETM+. The newly developed procedure was applied to two river sites for validation. In both cases, the river discharges were estimated with reasonable accuracy (with Nash–Sutcliffe values >0.50). The performance evaluation of discharge estimation using satellite-derived parameters was also analyzed. Since the methodology for estimating discharge is solely dependent on global satellite datasets, it represents a promising technique for use on rivers worldwide.

Graphical Abstract

1. Introduction

Measurement of river discharge is necessary in hydrology and water resource management. The knowledge of river flow propagation speed and the time for flows to pass downstream is critical for flood forecasting, reservoir operations, and watershed modeling [1]. Therefore, there is a great need for long-term, continuous, spatially consistent, and readily available discharge data. River discharges are currently recorded at river gauging stations. However, the available recordings are intermittent or nonexistent, especially in underdeveloped countries and they are under proprietary control in developed nations [2]. These challenges limit the studies that require river discharge data. Unlike ground observations, remote sensing provides a limitless coverage of rivers and other water bodies. As evidenced by recent studies, remote sensing has a good spatial coverage and a long monitoring period, both of which have contributed to a growing interest in deriving discharge estimates from remote sensing [3,4,5,6,7,8]. An underlying factor in estimating river discharge lies in the ability to realistically estimate spatial hydraulic variables (i.e., width, depth, and velocity) and/or to establish the relationships between them [9]. The ground observation method is the most accurate measure of river discharge. However, ground river discharge is obtained by estimating the hydraulic characteristics of stream channels including depth, width, and velocity.
Recent efforts to estimate river discharge from remote sensing data use the in situ gauge discharge data to calibrate the river width [10,11,12], stage [5,13,14], both stage and width [3], and finally pixels [4]. These have been proven valid under the functional power law relationships that relate the width (w), depth (d), and velocity (v) to discharge in accordance with Equations (1)–(3) [15].
w = a Q b ,
d = c Q f ,
v = k Q m ,
where a, b, c, f, k, and m are empirical constants.
Attempts to use remote sensing data (river width or water surface elevation) as surrogates for in situ measurements in hydrological model calibration have also been tested [16,17]. With the discovery of at-many-stations hydraulic geometry (AMHG) [6,7], the potential of estimating discharge based on remote sensing data has been of interest. According to [6], AMHG holds that certain parameters of traditional at-a-station hydraulic geometry (AHG), presented in Equations (1)–(3), are not independent but log-linearly related along a river. Discharge estimation based solely on remote sensing data is largely seen as the most viable solution to the current limitations in discharge estimation. Table 1 gives a summary of river discharge estimation methods. It is clear that few studies have estimated river discharge based solely on remote-sensing-derived data [6,7].
In this study, a novel method for discharge estimation was developed. The method does not require prior knowledge of existing in situ gauge discharge data. The potential of estimating discharge through the estimation of hydraulic parameters is demonstrated as follows: (1) river velocity by carrying out a time lag analysis using the temporal river width measurements from Moderate Resolution Imaging Spectroradiometer MODIS (MOD09GQ) at two user-defined stream sites; (2) roughness coefficient by substituting channel condition values referenced from published tables in an empirical equation [26]; (3) river reach slope using the Shuttle Radar Topographic Mission Digital Elevation Model (SRTM DEM); (4) estimated depth by using the developed empirical relationship between the velocity, slope, and roughness coefficient; (5) time series river depth using the estimated depth and water level changes from Envisat; and (6) time series river discharge by using all the estimated parameters and the modified Manning’s equation.
Therefore, the main objectives of this study were as follows: (1) to estimate hydraulic parameters (i.e., river velocity, roughness coefficient, and time series river depth); and (2) to estimate the time series river discharge using the estimated parameters in the modified Manning’s equation.

2. Materials and Methods

The methodology was implemented on the lower course of the Yangtze River. The Yangtze is the longest river in Asia and the third longest river in the world with a length of 6300 km and an average discharge of 30,166 m3/s. It flows from the glaciers on the Qinghai–Tibet Plateau to the East China Sea at Shanghai, China [27]. The in situ gauge observations of mean daily discharge, used for validation, were acquired for the Yangtze River at the Hankou and Datong stations from the Global Runoff Data Centre [28]. Envisat satellite altimetry data, taken of locations close to the ground observation stations, were retrieved from an online database (http://www.legos.obs-mip.fr/en/soa/hydrologie/hydroweb/) [29]. These satellite pass stations are referred to as virtual stations 1 and 2 (Figure 1).
The Envisat satellite carries 10 complementary instruments including a radar altimeter and a nadir-pointing radar altimeter that operates at two frequencies, the Ku-band (13.575 GHz/wavelength, 2.3 cm) and the S-band (3.2 GHz/9.3 cm) [30]. The temporal resolution of Envisat RA-2 is 35 days with an along-track resolution of 350 m in high-frequency mode, which makes it suitable for studying water level changes in rivers with widths greater than 350 m [31]. At each virtual station, a search for archived Landsat ETM+ images that were taken within two days of the altimetry pass was conducted using the United States Geological Surveys’ (USGS’s) Earth Explorer interface (http://earthexplorer.usgs.gov/). The spatial and temporal resolutions for Landsat ETM+ are 30 m and 16 days, respectively. Landsat 8 images were used for the description of the channel conditions at the virtual stations. The MODIS product MOD09GQ was downloaded from (https://lpdaac.usgs.gov). These images provided bands 1 and 2 at 250 m resolution as a daily gridded product. MODIS high temporal capability provided daily river width plots at the respective station so that the time lag in width variation could be determined. A 90-m digital elevation model (DEM) was downloaded from (http://srtm.csi.cgiar.org). This DEM was used to calculate slope. The riverbed cross-sections, in combination with the time series elevation from the GPS, were used to compute the cross-sectional areas and heights for validation. The riverbed cross-sections and the time series water elevations data were acquired for the Yangtze River at the Hankou and Datong stations from the Ministry of Water Resources, Republic of China. The Ministry of Water Resources uses sounders to determine the riverbed cross-section and GPS floaters to estimate the time series water elevation data. To verify river velocity datasets, the in situ ground discharge was divided by the cross-sectional areas.

2.1. Estimate of River Velocity Using Temporal River Width

Time lag analysis has been used to estimate river velocity. The time and distance separation allow the average propagation speed to be computed. However, in order to estimate river flow using remotely sensed data, the temporal river width observations from MODIS (MOD09GQ) were made in lieu of river discharge at a station. This is based on the previous findings on the high correlation coefficient observed between the river flow and temporal variation in the water-to-land ratio pixel observations [32].

2.2. Estimates of the Roughness Coefficient

The roughness coefficient of river channels depends on factors such as the vegetation type and structure, the cross-section area, degree of meandering, and obstructions in the river [33]. Various approaches for roughness quantification exist such as visual interpretation (visually inspecting and comparing photographs related to reaches) and assigning the appropriate roughness values to similar tabulated reference roughness coefficients [34]. Chow [26] tabulated values that can be substituted in Equation 4 to obtain the roughness coefficient (Table 2).
n = ( n 0 + n 1 + n 2 + n 3 + n 4 ) n 5 ,
The channel condition classification table was used to estimate the roughness coefficient values as subsequently described.
According to Albertson and Simons [35], a river with fair conditions has a base value (n0) of 0.025, a value which is also found suitable for alluvial sand bedded channels such as the main stem of the Amazon River [36]. The base values were adopted for the lower Yangtze River. The degree of irregularity (n1) is considered negligible because the depth-to-width ratio is small for large rivers, therefore the roughness caused by eroded and scalloped banks, projecting points, and exposed tree roots along the banks are minimal. The degree of variation of the channel cross-section (n2) was determined from Landsat 8 images (Figure 2).
In uniform and gradual channel changes, the value of n is not significantly affected by relatively large changes in the shape and size of cross-sections. Greater roughness is often associated with alternating large and small cross-sections and sharp bends, constrictions, and side-to-side shifting of the low-water channel. Therefore, the value of (n2) used was 0.
Figure 2 shows that there are no obstructions that could potentially disturb the flow pattern in the channel of the Yangtze River and increase roughness. Therefore, the obstruction values (n3) were considered negligible (Table 2).
The satellite images also showed the two sites had minimal vegetation. Thus, the combined effect of a small depth-to-width ratio and less vegetation on the riverbed results in a lower effect of bank vegetation, and is therefore assigned a maximum adjustment value (n4) of 0.005 (Table 2).
The degree of meandering (n5) was obtained by measuring the total length of the meandering river reach to the virtual station to the straight length of the channel reach. The river reach used to determine the meander was defined to be a distance of 10 km on either side of the virtual station. The amount of meandering is considered minor for ratios of 1.0 to 1.2, appreciable for ratios of 1.2 to 1.5, and severe for ratios of 1.5 and greater. The ratios obtained at virtual stations 1 and 2 were 1.19 and 1.3, respectively. These variations in the degree of meandering were defined at each of the sub-basins. According to Chow [26], meanders can increase the n value by as much as 30% when flow is confined within a stream channel. However, it should be noted that the meander adjustment should be considered only when the flow is confined to the channel. In this study, the flow is confined within the channel and thus the adjustments were made.

2.3. Formulation

From Manning’s equation [37], possible hydrological relationships that could potentially estimate discharge estimates from space were deduced.
The discharge equation (Q) can be deduced from Equation (5):
Q A = 1 n R 2 3 S 1 2 ,
where n is the roughness coefficient, A is the cross- sectional area of the river, R is the hydraulic radius (A/Pwet, where Pwet is the wetted perimeter (total length of streambed from one bank to the opposite bank)), and S is the slope of the riverbed.
Equation (6) was derived by substituting the hydraulic radius into Equation (5) as follows:
Q = 1 n A ( A P w e t ) 2 3 S 1 2 ,
Three ideal river cross-sections can be considered in deriving the equations: rectangular, trapezoidal, and arc cross-sections (Figure 3).
The rectangular cross-section (Figure 3a) was defined as:
Q = S 1 2 n ( W · D ) 5 3 ( W + 2 D ) 2 3 ,
where W is the space-derived river width, and D is the water heights.
The trapezoid cross-section (Figure 3b) was defined as:
Q = S 1 2 n ( W · D D 2 tan θ 1 ) 5 3 ( W + 2 D 1 cos θ sin θ ) 2 3 ,
If the river is very wide, i.e., W D , then equation 9 can be derived from Equations (7) and (8).
Q S 1 2 n W · D 5 3
The arc cross-section (Figure 3c) is defined as:
Q = S 1 2 n W · D 5 3 ( 1 2 · ( π · α 180 sin α · cos α ) ) 5 3 sin α · ( π · α 180 ) 2 3 ( 1 cos α ) 5 3
For Equation (10), it is also found that Q is proportional to W · D 5 3 if two parameters are considered.
Given that r = W 2 sin α = D 1 cos α ,   W = 2 D sin α 1 cos α is obtained. As a result, if there is only one parameter and its D, then Equation (11) can be derived as follows:
Q = 2 S 1 2 n D 8 3 ( 1 2 · ( π · α 180 sin α · cos α ) ) 5 3 ( π · α 180 ) 2 3 ( 1 cos α ) 8 3
Equation (9) could be equated to Q = w d v . Thus, D can be estimated as:
D = ( V n S 1 / 2 ) 3 / 2

2.4. Flowchart

With reference to the formula in Section 3.1, Figure 4 illustrates the steps used to estimate discharge solely using remote sensing-derived parameters.
The steps illustrated are as follows:
(1)
The time series river width measurements for 2003, 2004, 2007, and 2008 taken at an upstream and downstream locations were derived using MODIS (MOD09GQ) (Figure 5). Most of the images for 2005 and 2006 were affected by clouds and therefore data for these years were not used.
(2)
The ensemble mean of individual river width measurements was determined over a reach length of approximately 1 km at each site. The ensemble mean reduces the measurement error and localized variability [38].
(3)
A lag analysis was then carried out to estimate the time lag of the river width changes between station A and station B. A time lag is the time interval for the peak river width measurement observed at station A to be recorded at station B. The peak river width used in this case is the average of the daily river width measurements.
(4)
Using the time lag and the distance separation between stations A and B, the average river velocity (assuming a uniform velocity) was estimated.
(5)
The roughness coefficient (n) was then estimated using Equation (4) as described in Section 2.2. Equation (12) was then used to estimate the river depth for each river segment.
(6)
The estimated water depth was adjusted using the time series stage data derived from satellite altimetry to obtain the time series river depth (Figure 6).
(7)
The depth estimates at the virtual stations were compared to the depths computed using the in situ ground discharge data. The depth comparison is meant to establish whether the estimated values are within the range of the values obtained at the ground observation stations. However, it is not an accurate validation of the estimated depths at the virtual station. In order to compute the river depths at the in situ ground stations, the following key steps were used: using datasets derived from river sounding, the river cross-sections were plotted. Then the time series river depth for the period 2003–2008 were taken using a floating GPS device. The cross-sectional areas were computed by fitting the cross-sections by two regular figures, a triangle and a trapezium, separated by a baseline (Figure 7).
The area of the triangle has a constant value whereas the area of the trapezium changes with height. In order to obtain the time series height, the areas were divided by the average river width. The procedure used to obtain the time series river width was adopted because the riverbed is irregular.
(8)
Landsat images were used to measure the river width and were employed at the last stage with other estimates for time series river depth, slope, and roughness coefficient to estimate river discharge (Equation (9)). To obtain a reliable slope, the slope values were averaged over a long river reach [36]. For the lower Yangtze River, the standard error of the slope average values from the SRTM DEM (represented as σ in Equation (9) was ±1.3 m. Using a simple relationship equation developed by LeFavour and Alsdorf [36], the appropriate reach length (RL) was determined as follows:
RL 2 σ S m i n ,
where S m i n is the minimum slope, for which a value of 0.5 × 10⁵ was adopted as indicated by [39].
(9)
The discharge estimates at virtual station 1 and virtual station 2 were validated using the closest ground stations at Hankou (located approximately 43 km from the virtual station (1) and Datong (located approximately 85 km from the virtual station (2) respectively. There are no tributaries in these sections, therefore the discharge at the ground stations and virtual stations were assumed to be the same.

2.5. Performance Evaluation

The accuracy of river depth estimates was determined using the root mean square error (RMSE), relative root mean square error (RRMSE), and relative error (RE). The performance of the resultant discharge estimates was then evaluated using the Nash–Sutcliffe (NS) equation [40], RMSE, RRMSE, and RE as the evaluation criterion.
RMSE = ( ( Q m Q e ) 2 n ) ,
NS = 1 ( Q m Q e ) 2 ( Q m Q m ¯ ) 2 ,
RRMSE = RMSE Q m ¯ × 100 % ,
RE = 1 n Q e 1 n Q m 1 n Q m × 100 % ,
where Qm is the measured discharge, Qe is the estimated discharge, Q m ¯ is the mean measured discharge, and n is the number of observations. The values of NS range from −∞ to 1. When NS is equal to one, it represents a perfect match of the estimated discharge to the measured discharge.
We further evaluated the performance of estimating discharge using the satellite-derived parameters. The discharge error contribution from each parameter was obtained by varying the parameters by the measurement errors associated with each.

3. Results

3.1. Estimation of Hydraulic Parameters

For the study period of 2003–2008, most of the cloud-free MODIS (MOD09GQ) images were found in 2003, 2004, 2007, and 2008 (Figure 8). The temporal variations for the river width measurements shown in Figure 5b (station A) and Figure 5c (station B) are represented in Figure 8. An overlay of the river width for the two stations shows similarity in the measured river width trends. However, a time lag of 6.7 days in 2003, 6.0 days in 2004, 5.9 days in 2007, and 6.1 days in 2008 was observed between the two stations, which resulted in an average time lag of 6.18 days (Figure 9).
The time lag between the two stations was determined by subtracting the peak time at the two stations, giving a time difference of 6.7 days in 2003, 6.0 days in 2004, 5.9 days in 2007, and 6.1 days in 2008. The distance separation was 498,221 m, resulting in a velocity of 0.96 m/s. The estimated velocity lies within the results of the computed velocity i.e., peak velocities of 0.63–1.2 m/s at virtual station 1 and 0.81–1.35 m/s at virtual station 2 (Figure 10).
The elevation at the lower Yangtze is gently sloping, rising from 1 m to less than 15 m over a stretch of 15 km (Figure 11).
In Equation (13), a minimum value of approximately 516 km is required to obtain a sensible slope value. This translates to a slope of 2.3 ± 0.2 cm/km.
The roughness coefficient values at the two stations were computed separately owing to the variations in the site characteristics (as described in Section 2.2). The value of 0.034 ± 0.002 was obtained at virtual station 1 and 0.030 ± 0.002 was obtained at virtual station 2.
The estimated river depth computed using the new parameters in Equation (12) gives a value of 15.90 m for virtual station 1 and 13.18 m for virtual station 2 during the 2004 peak period. The estimated depth lies within the depth ranges of 10–20 m for the lower Yangtze River as described by Chen, Li, Shen, and Zhanghua [39]. The adjusted temporal variation in river depth has values ranging from 7.0 to 18.6 m at virtual station 1 and from 9.0 to 15.0 m for virtual station 2 (Figure 12).

3.2. Estimation of the Time Series River Discharge

The time series river discharge was calculated using the estimated hydraulic parameters presented in Section 3.1 above. The result of the estimated river discharge is presented in Figure 13 (with its computations presented in Table 3). From the results in Table 3, its evident that the NS values obtained at the two virtual stations are greater or equal to 0.5. However, a significant difference in the accuracy of river discharge estimation between the virtual station 1 and virtual station 2 (Table 3). An NS value of 0.76 is obtained at the virtual station 2; this value is 0.26 higher than the NS at the virtual station 1.

4. Discussion

4.1. Estimation of Hydraulic Parameters

The accuracy of river discharge estimates depends on the accuracy of the remotely derived observations of river width, stage, slope, and estimated roughness coefficient. [19,41,42] have investigated remote sensing data sources and their potential use for measuring river stage, effective river width, velocity, and slope. A number of different techniques have made use of these remote sensing data sources to estimate river discharge (as outlined in Table 1). To our knowledge, this study is the first to use the time lag derived from different river sections to estimate river velocity. The time series river widths at each cross-section for the two sections vary depending on the local conditions but conform to the general trend (Figure 8). Ideally, the choice of data for the velocity estimate should include the following features: a high temporal resolution to capture the daily variations, a high spatial resolution that matches the river width, and clear images. However, the estimated velocity was an average value for 2003, 2004, 2007, and 2008. This is a potential source of error as it does not capture the temporal variations in river width measurements during this period. According to [43], temporal and spatial down-scaling of remotely sensed products improves the accuracy of the resultant estimates. The choice of MODIS (MOD09GQ) was informed by its high temporal resolution. However, MODIS has the following limitations: cloud penetration problems, which hinder visibility, and mixing of water and non-water surfaces during resampling resulting in noisy readings. The mean velocity derived from the river surface velocity using SAR has been previously investigated [23]; however, estimating surface velocity is limited to channels where the effects of wind speed and direction can be adequately corrected [23,25,44]. An additional limitation is that surface velocity data may only be available on an occasional basis depending on the satellite orbits and the sensor. With this in mind, our velocity estimation method is advantageous over SAR-derived velocity as it does not suffer the aforementioned limitations.
The process of estimating the roughness coefficient is subjective, and its accuracy is largely dependent on the careful consideration of the parameters to be evaluated. Our estimation of the values is totally based on river channel characteristics derived from space. Using the criteria put forward by Chow [26], most of the characteristics are derived from space. This works for the larger rivers because most of the roughness factors in Table 2, caused by the interaction of the river bank with the water, are negligible. However, the roughness factor may not be overlooked for smaller rivers. A study carried out by [45] showed that low complexity models perform well in simple landscape due to their inherent capabilities and limitations. This agrees with the current study because the channel under investigation is a large river channel with less meander and confluences. A sensitivity analysis carried out by varying the roughness coefficient values by the error shows that error changes of ±0.002 in the roughness coefficient can result in a RE of up to 6.91%, as in the case of virtual station 1 in Table 4. Despite the simplified landscape, the errors in Table 4 are possible.
Additional errors emanate from the river width measurement. However, in the current study, we used Landsat, which has a spatial resolution of 30 m. This translates to a RE of 1.65 and 3.85 at virtual stations 1 and 2, respectively (Table 4 and Table 5).
Slope estimates are another potential source of error; in the current study, the measurement error in slope is ±1.3 m which contributes to a RE of up to 4.71%.
This study is also the first to estimate river depth using an empirical relationship with the velocity, roughness coefficient and slope. The estimated river depth lies within the range of the computed river depth at the in situ ground stations. Additionally, the river depth estimates obtained also agrees with the depths within the lower Yangtze River basin as investigated in other studies [39]. However, the river depth estimate by this method is limited to:
(1)
The accuracy with which the river velocity is estimated. In our methodology, we assume a uniform river flow, which simplifies the variations in river velocity at each point along the river.
(2)
The criteria and accuracy with which the roughness coefficient values are assigned or computed.
(3)
Finally, the slope of the river affects the accuracy of the height estimate. In a typical natural course, the slope varies from one point to another which limits the potential of estimating the slope from space. Nevertheless, average river slope can be estimated with the assumption of a uniform slope for a chosen river reach.
The success of adjusting the estimated river depth during the peak to capture the temporal variation as obtained in Figure 12 depends on the availability of the altimeter reading at the peak time. Otherwise, we interpolated the value from the closest altimeter reading as our best estimate.

4.2. Estimation of the Time Series River Discharge

The accuracy of the discharge estimates presented in Table 3 indicates that this method holds promise. In this study, two sites were used for the method development i.e., virtual station 1 and virtual station 2. A performance evaluation indicated a significant difference in the accuracies, with virtual station 2 having higher accuracies than virtual station 1. For instance, the NS value for virtual station 2 was 0.26 more than that of virtual station 1. This could be attributed to the assumption made when reducing the discharge estimation equation for the three ideal river cross-sections to Equation (9). Equation (9) holds for river channels whose width (w) is greater than the river depth (d). Using the cross-section at virtual station 1 (Figure 7), the ratio W D gives a value of 46.42, whereas the cross-section at virtual station 2 gives a value of 48.3. This means that at virtual station 2, the river width was greater than the depth at virtual station 1. The difference in accuracies obtained at the two virtual stations is an indication that the method proposed in this paper should be tested on rivers spanning a diverse range of geomorphic and climatic settings. Testing the proposed method on other rivers will reveal other potential causes of the variation in performance at the different virtual stations besides the ratio W D .

5. Conclusions

In this study, a method that estimates river discharge exclusively from remote-sensing-derived parameters was proposed. Specifically, this paper uses remote-sensing-derived data to estimate hydraulic parameters (i.e., river velocity, roughness coefficient, and time series river depth); the time series river discharge is thereafter estimated using the hydraulic parameters in a modified Manning’s equation. River flow velocity at the peak was estimated to be 096 m/s. The estimated velocity lies within the results of the computed velocity i.e., peak velocities of 0.63–1.2 m/s at virtual station 1 and 0.81–1.35 m/s at virtual station 2. From the estimated parameters of velocity and slope and careful assigning of the roughness coefficient, its shown that river depth could potentially be estimated by developing an empirical relationship between the parameters. The resultant discharge estimates provide good results, indicating a potential good discharge estimate method, i.e., NS values of 0.50 and 0.76 at virtual stations 1 and 2, respectively.
The uniqueness of this study lies in its ability to estimate river discharge without the use of any in situ ground observed datasets whatsoever. This performance is quite encouraging for possible discharge estimates in ungauged river sites and therefore the methodology can be applied in large river channels without ground observation measuring stations. Currently, this methodology is limited to few overlapping datasets during the years 2003 to 2008; however, the forthcoming National Space Agency/Centre National d’Etudes Spatiales Surface Water and Ocean Topography (NASA/CNES SWOT) satellite which provides simultaneous measurements of width and stage will provide adequate and regular datasets for discharge estimation using this method. The current method development has been tested on two sites of River Yangtze. For future research, it is highly recommended that the current method development be tested in other rivers in different physiographic and climatologic settings.

Author Contributions

Conceptualization, A.S. and L.W.; Methodology, A.S.; Validation, A.S., L.W. and Z.H.; Software, A.S., Formal Analysis, A.S.; Investigation, A.S.; Resources, L.W., Z.H.; Data Curation, A.S., L.W. and Z.H; Writing-Original Draft Preparation, A.S.; Writing-Review & Editing, L.W.; Visualization, A.S.; Supervision, L.W.; Project Administration, L.W.; Funding Acquisition, L.W., Z.H.

Funding

This work was funded by the “Strategic Priority Research Program” of the Chinese Academy of Sciences (XDA19070301) and the National Natural Science Foundation of China (Grant 91747201, 41571033). It was also supported by the International Partnership Program of the Chinese Academy of Sciences (131C11KYSB20160061) and the Top-Notch Young Talents Program of China.

Acknowledgments

The first author wishes to thank the Chinese Academy of Sciences-The World Academy of Sciences (CAS-TWAS) Presidential Fellowship for the scholarship. We would also like to thank the Centre de Topographie des Océans et de l’Hydrosphère (CTOH) at LEGOS (www.legos.obs-mip.fr/en/soa/hydrologie/hydroweb/) for providing the Envisat RA-2 GDR data, GRDC for the ground station river discharge dataset (bafg.de/GRDC), the United States Geological Survey for the MODIS (lpdaac.usgs.gov) and Landsat data (earthexplorer.usgs.gov/). We thank CGIAR-CSI (srtm.csi.cgiar.org) for providing DEM data.

Conflicts of Interest

The authors declare no conflict of interest.

References

  1. Brakenridge, G.R.; Cohen, S.; Kettner, A.J.; De Groeve, T.; Nghiem, S.V.; Syvitski, J.P.M.; Fekete, B.M. Calibration of satellite measurements of river discharge using a global hydrology model. J. Hydrol. 2012, 475, 123–136. [Google Scholar] [CrossRef]
  2. Calmant, S.; Seyler, F. Continental surface waters from satellite altimetry. C. R. Geosci. 2006, 338, 1113–1122. [Google Scholar] [CrossRef]
  3. Sichangi, A.W.; Wang, L.; Yang, K.; Chen, D.; Wang, Z.; Li, X.; Zhou, J.; Liu, W.; Kuria, D. Estimating continental river basin discharges using multiple remote sensing data sets. Remote Sens. Environ. 2016, 179, 36–53. [Google Scholar] [CrossRef]
  4. Brakenridge, G.R.; Nghiem, S.V.; Anderson, E.; Mic, R. Orbital microwave measurement of river discharge and ice status. Water Resour. Res. 2007, 43. [Google Scholar] [CrossRef] [Green Version]
  5. Tarpanelli, A.; Barbetta, S.; Brocca, L.; Moramarco, T. River discharge estimation by using altimetry data and simplified flood routing modeling. Remote Sens. 2013, 5, 4145–4163. [Google Scholar] [CrossRef]
  6. Gleason, C.J.; Smith, L.C.; Lee, J. Retrieval of river discharge solely from satellite imagery and at-many-stations hydraulic geometry: Sensitivity to river form and optimization parameters. Water Resour. Res. 2014, 50, 9604–9619. [Google Scholar] [CrossRef] [Green Version]
  7. Gleason, C.J.; Smith, L.C. Toward global mapping of river discharge using satellite images and at-many-stations hydraulic geometry. Proc. Natl. Acad. Sci. USA 2014, 111, 4788–4791. [Google Scholar] [CrossRef] [PubMed] [Green Version]
  8. Pan, F.; Wang, C.; Xi, X. Constructing river stage-discharge rating curves using remotely sensed river cross-sectional inundation areas and river bathymetry. J. Hydrol. 2016, 540, 670–687. [Google Scholar] [CrossRef]
  9. Mersel, M.K.; Smith, L.C.; Andreadis, K.M.; Durand, M.T. Estimation of river depth from remotely sensed hydraulic relationships. Water Resour. Res. 2013, 49, 3165–3179. [Google Scholar] [CrossRef] [Green Version]
  10. Smith, L.C.; Isacks, B.L.; Bloom, A.L.; Murray, A.B. Estimation of discharge from three braided rivers using synthetic aperture radar satellite imagery: Potential application to ungaged basins. Water Resour. Res. 1996, 32, 2021–2034. [Google Scholar] [CrossRef]
  11. Pavelsky, T.M. Using width-based rating curves from spatially discontinuous satellite imagery to monitor river discharge. Hydrol. Process. 2014, 28, 3035–3040. [Google Scholar] [CrossRef]
  12. Smith, L.C.; Pavelsky, T.M. Estimation of river discharge, propagation speed, and hydraulic geometry from space: Lena River, Siberia. Water Resour. Res. 2008, 44. [Google Scholar] [CrossRef] [Green Version]
  13. Papa, F.; Bala, S.K.; Pandey, R.K.; Durand, F.; Gopalakrishna, V.V.; Rahman, A.; Rossow, W.B. Ganga-Brahmaputra river discharge from jason-2 radar altimetry: An update to the long-term satellite-derived estimates of continental freshwater forcing flux into the Bay of Bengal. J. Geophys. Res. Ocean. 2012, 117, C11021. [Google Scholar] [CrossRef]
  14. Birkinshaw, S.J.; O’Donnell, G.M.; Moore, P.; Kilsby, C.G.; Fowler, H.J.; Berry, P.A.M. Using satellite altimetry data to augment flow estimation techniques on the mekong river. Hydrol. Process. 2010, 24, 3811–3825. [Google Scholar] [CrossRef]
  15. Leopold, L.B.; Maddock, T. The Hydraulic Geometry of Stream Channels and Some Physiographic Implications; Geological Survey Professional Paper 252; US Government Printing Office: Washington, DC, USA, 1953; 57p.
  16. Sun, W.; Ishidaira, H.; Bastola, S. Calibration of hydrological models in ungauged basins based on satellite radar altimetry observations of river water level. Hydrol. Process. 2012, 26, 3524–3537. [Google Scholar] [CrossRef]
  17. Sun, W.; Ishidaira, H.; Bastola, S. Prospects for calibrating rainfall-runoff models using satellite observations of river hydraulic variables as surrogates for in situ river discharge measurements. Hydrol. Process. 2012, 26, 872–882. [Google Scholar] [CrossRef]
  18. Javaheri, A.; Nabatian, M.; Omranian, E.; Babbar-Sebens, M.; Noh, S. Merging real-time channel sensor networks with continental-scale hydrologic models: A data assimilation approach for improving accuracy in flood depth predictions. Hydrology 2018, 5, 9. [Google Scholar] [CrossRef]
  19. Bjerklie, D.M.; Dingman, S.L.; Vorosmarty, C.J.; Bolster, C.H.; Congalton, R.G. Evaluating the potential for measuring river discharge from space. J. Hydrol. 2003, 278, 17–38. [Google Scholar] [CrossRef]
  20. Elmi, O.; Tourian, M.J.; Sneeuw, N. River discharge estimation using channel width from satellite imagery. In Proceedings of the 2015 IEEE International Geoscience and Remote Sensing Symposium (IGARSS), Milan, Italy, 26–31 July 2015; pp. 727–730. [Google Scholar]
  21. Durand, M.; Rodriguez, E.; Alsdorf, D.E.; Trigg, M. Estimating river depth from remote sensing swath interferometry measurements of river height, slope, and width. IEEE J. Sel. Top. Appl. Earth Obs. Remote Sens. 2010, 3, 20–31. [Google Scholar] [CrossRef]
  22. Jarihani, A.A.; Larsen, J.R.; Callow, J.N.; McVicar, T.R.; Johansen, K. Where does all the water go? Partitioning water transmission losses in a data-sparse, multi-channel and low-gradient dryland river system using modelling and remote sensing. J. Hydrol. 2015, 529, 1511–1529. [Google Scholar] [CrossRef] [Green Version]
  23. Bjerklie, D.M.; Moller, D.; Smith, L.C.; Dingman, S.L. Estimating discharge in rivers using remotely sensed hydraulic information. J. Hydrol. 2005, 309, 191–209. [Google Scholar] [CrossRef]
  24. Sun, W.; Ishidaira, H.; Bastola, S.; Yu, J. Estimating daily time series of streamflow using hydrological model calibrated based on satellite observations of river water surface width: Toward real world applications. Environ. Res. 2015, 139, 36–45. [Google Scholar] [CrossRef] [PubMed]
  25. Grünler, S.; Romeiser, R.; Stammer, D. Estimation of tidally influenced estuarine river discharge from space using along-track insar technology: A model-based feasibility study. J. Geophys. Res. Oceans 2013, 118, 3679–3693. [Google Scholar] [CrossRef]
  26. Chow, V.T. Open Channel Hydraulics; McGraw-Hill: New York, NY, USA, 1959. [Google Scholar]
  27. USGS. Delta Research and Global Observation Network (Dragon). Available online: http://deltas.usgs.gov (accessed on 30 April 2018).
  28. Global Runoff Data Centre (GRDC). River Discharge Data; GRDC: Koblenz, Germany, 2014. [Google Scholar]
  29. Crétaux, J.F.; Jelinski, W.; Calmant, S.; Kouraev, A.; Vuglinski, V.; Bergé-Nguyen, M.; Gennero, M.C.; Nino, F.; Abarca Del Rio, R.; Cazenave, A.; et al. Sols: A lake database to monitor in the near real time water level and storage variations from remote sensing data. Adv. Space Res. 2011, 47, 1497–1507. [Google Scholar] [CrossRef]
  30. Zelli, C.; Aerospazio, A. Envisat ra-2 advanced radar altimeter: Instrument design and pre-launch performance assessment review. Acta Astronaut. 1999, 44, 323–333. [Google Scholar] [CrossRef]
  31. Leon, J.G.; Calmant, S.; Seyler, F.; Bonnet, M.P.; Cauhopé, M.; Frappart, F.; Filizola, N.; Fraizy, P. Rating curves and estimation of average water depth at the upper negro river based on satellite altimeter data and modeled discharges. J. Hydrol. 2006, 328, 481–496. [Google Scholar] [CrossRef] [Green Version]
  32. Tarpanelli, A.; Brocca, L.; Lacava, T.; Melone, F.; Moramarco, T.; Faruolo, M.; Pergola, N.; Tramutoli, V. Toward the estimation of river discharge variations using modis data in ungauged basins. Remote Sens. Environ. 2013, 136, 47–55. [Google Scholar] [CrossRef]
  33. Coon, W.F. Estimation of Roughness Coefficients for Natural Stream Channels with Vegetated Banks; US Geological Survey: Reston, VA, USA, 1998.
  34. Green, J.C. Effect of macrophyte spatial variability on channel resistance. Adv. Water Resour. 2006, 29, 426–438. [Google Scholar] [CrossRef]
  35. Albertson, M.L.; Simons, D.B. Fluid Mechanics. In Handbook of Applied Hydrology: A Compendium of Water-Resources Technology; McGraw-Hill: New York, NY, USA, 1964. [Google Scholar]
  36. LeFavour, G.; Alsdorf, D. Water slope and discharge in the Amazon River estimated using the shuttle radar topography mission digital elevation model. Geophys. Res. Lett. 2005, 32, L17404. [Google Scholar] [CrossRef]
  37. Manning, R. On the flow of water in open channels and pipes. Trans. Inst. Civ. Eng. Irel. 1891, 20, 161–207. [Google Scholar]
  38. Sun, W.C.; Ishidaira, H.; Bastola, S. Towards improving river discharge estimation in ungauged basins: Calibration of rainfall-runoff models based on satellite observations of river flow width at basin outlet. Hydrol. Earth Syst. Sci. 2010, 14, 2011–2022. [Google Scholar] [CrossRef]
  39. Chen, Z.; Li, J.; Shen, H.; Zhanghua, W. Yangtze River of China: Historical analysis of discharge variability and sediment flux. Geomorphology 2001, 41, 77–91. [Google Scholar] [CrossRef]
  40. Nash, J.E.; Sutcliffe, J.V. River flow forecasting through conceptual models part I—A discussion of principles. J. Hydrol. 1970, 10, 282–290. [Google Scholar] [CrossRef]
  41. Alsdorf, D.E.; Rodríguez, E.; Lettenmaier, D.P. Measuring surface water from space. Rev. Geophys. 2007, 45. [Google Scholar] [CrossRef] [Green Version]
  42. Tang, Q.; Gao, H.; Lu, H.; Lettenmaier, D.P. Remote sensing: Hydrology. Prog. Phys. Geogr. Earth Environ. 2009, 33, 490–509. [Google Scholar] [CrossRef]
  43. Omranian, E.; Sharif, H.O. Evaluation of the global precipitation measurement (GPM) satellite rainfall products over the lower Colorado River basin, Texas. JAWRA J. Am. Water Resour. Assoc. 2018, 54, 882–898. [Google Scholar] [CrossRef]
  44. Plant, W.J.; Keller, W.C.; Hayes, K. Measurement of river surface currents with coherent microwave systems. IEEE Trans. Geosci. Remote Sens. 2005, 43, 1242–1257. [Google Scholar] [CrossRef] [Green Version]
  45. Afshari, S.; Tavakoly, A.A.; Rajib, M.A.; Zheng, X.; Follum, M.L.; Omranian, E.; Fekete, B.M. Comparison of new generation low-complexity flood inundation mapping tools with a hydrodynamic model. J. Hydrol. 2018, 556, 539–556. [Google Scholar] [CrossRef]
Figure 1. Locations of the ground observation stations, river width measurement stations A and B, and virtual stations 1 and 2 along the lower course of the Yangtze River.
Remotesensing 10 01385 g001
Figure 2. The site characteristics at virtual stations 1 and 2 derived from a true color Landsat 8 image acquired on the 14 October 2014.
Remotesensing 10 01385 g002
Figure 3. The three ideal river cross-sections considered in the formulas.
Remotesensing 10 01385 g003
Figure 4. A flowchart to extract river discharge estimates using remote sensing-derived parameters (Equations (4), (9) and (12)).
Remotesensing 10 01385 g004
Figure 5. An illustration of the study area. The background image is a MODIS (MOD09GQ) band 2 overlaid by Envisat altimetry virtual stations 1 and 2 (a), insets of Figure 5a showing sections for river width measurements at an upstream station A (b), and a downstream station B (c).
Remotesensing 10 01385 g005
Figure 6. Adjustment of the estimated river depth at time (T) to capture the changes in the water level at times (T1, 2, 3, … n). The blue line shows an estimate of peak river depth by using Equation (12) at time tpeak. The time-series black lines illustrate the water level from the Envisat satellite altimetry data. Through comparing the river depth values at tpeak, the altimetry data can be adjusted accordingly.
Remotesensing 10 01385 g006
Figure 7. River cross-sections illustrating the riverbed, maximum and minimum water height for the study period 2003–2008, and average water height for 2003, 2004, 2007, and 2008.
Remotesensing 10 01385 g007
Figure 8. Demonstration of the river width changes derived using cloud-free MODIS images for the study period of 2003–2008.
Remotesensing 10 01385 g008
Figure 9. Illustration of the overlap between the temporal river width at stations A and B, as illustrated in Figure 8.
Remotesensing 10 01385 g009
Figure 10. The figure shows the river velocity computed using ground discharge observations and the river cross-sectional areas given in Figure 7.
Remotesensing 10 01385 g010
Figure 11. Average slope between stations A and B, indicated by the major diagonal. The solid points are the elevation values for the center line of river segments extracted from the DEM map. The solid points in sections with gently sloping terrain translate into a thick horizontal line.
Remotesensing 10 01385 g011
Figure 12. Comparison of the estimated river depth at the virtual stations (red) and the computed depth using the river cross-section measurement at the ground station (black).
Remotesensing 10 01385 g012
Figure 13. The estimated (red points) and observed (black line) discharges during 2003–2008.
Remotesensing 10 01385 g013
Table 1. A summary of studies using remote sensing to estimate river discharge (the current paper is added for completeness). It is evident that few studies have performed river discharge estimation exclusively from remote-sensing-derived data. In addition, not all studies have estimated river flow using satellite-derived data and not all models can estimate depth by using an empirical relationship between the velocity, slope, and roughness coefficient. In this case, the three are flagged as not applicable (N/A) in the key results. The aforementioned components are coded in the ‘Key Results’ column as: (1) estimate of discharge exclusively from remote sensing data (2) estimation of river discharge flow using satellite-derived data, and (3) estimation of river depth using an empirical relationship.
StudyData UsedApproachKey Results
[7]Landsat TM.Landsat TM is used to approximate at-many-stations (AMHG).
  • AMHG used to retrieve instantaneous river discharge.
  • N/A
  • N/A
[6]Landsat TM.Advances the AMHG discharge retrieval approach via additional parameter optimizations and validation on 34 gauged rivers spanning a diverse range of geomorphic and climatic settings.
  • AMHG used to retrieve instantaneous river discharge.
  • N/A
  • N/A
[18]Water levels, digital elevation model (DEM).Proposes a data assimilation framework to reduce the error of water depth prediction in tributaries, update the streamflow prediction, and introduce a scope for updating the initial conditions of continental-scale hydrological models.
  • N/A
  • N/A
  • After data assimilation, the root mean square errors of the estimated depth were reduced by 50 cm (51%). However, the error was not reduced at all sensor locations.
[3]MODIS and multiple satellite altimetry.River stage is incorporated with the effective river width. A comparison is made against a stage-derived discharge estimation equation and the empirical equation proposed by [19].
  • N/A
  • N/A
  • River stage is derived from satellite altimetry data.
[20]MODIS MOD09Q1 and in situ discharge measurements.A method that constructs the rating curve through the quantile functions of measured discharge and calculated river width is used.
  • The validation results show that the error in discharge estimation (10% root mean square error, RMSE) is at the same level as the conventional method.
  • N/A
  • N/A
[21]The Surface Water and Ocean Topography (SWOT) measurements are modeled.The estimated measurements are input into an algorithm to obtain estimates of river depth and discharge.
  • Discharge estimates over the one-year evaluation period had median normalized RMSE of 10.9%, and 86%.
  • The depth errors showed a very slight positive bias, with a mean relative error of 4.1%. The standard deviation of the depth error was 11.2%. There were several outliers, with maximum and minimum errors of 89% and 56%, respectively.
  • N/A
[22]Jason-2, MODIS-derived inundation extent and water elevation and discharge data.A hydrodynamic model is built using remotely-sensed inputs to augment traditional hydrological data for a series of linked reaches along a dryland anabranching river system.
  • N/A
  • Estimated flow resistance using 500 m MODIS Open Water Likelihood index (OWL) data.
  • N/A
[23]Topographical maps, aerial photos, synthetic Aperture radar (SAR) images.The hydraulic relationship is used to estimate in-bank river discharge using remotely sensed data [19].
  • The standard error of the discharge estimates was within a factor of 1.5–2 (50–100%) of the observed data, with the mean estimate accuracy within 10%.
  • Estimates in velocity from SAR improved the accuracy in discharge estimation.
  • N/A
[24]Forcing meteorological data from publicly available datasets and remotely sensed river width (SAR imagery).A method calibrating hydrological models using river width derived from remote sensing is demonstrated.
  • A Nash–Sutcliffe efficiency of 95.7% was obtained for the simulated streamflow at the 50% quantile.
  • N/A
  • N/A
[16] Water levels derived from satellite altimetry at a basin outlet were used to calibrate the model.
  • The Nash–Sutcliffe efficiency of averaged simulated streamflow by the parameter sets was 64.50%.
  • N/A
  • N/A
[25]Along-track interferometric synthetic aperture radar InSAR, along track interferometric (ATI).Surface velocity measurements from SAR were converted to depth-integrated velocity and then empirical models were applied to estimate discharge.
  • A simulated TerraSAR-X sampling scenario provided discharge estimates for the Elbe estuary with accuracies in the range of 20–30%.
  • N/A
  • N/A
This studyMODIS, Landsat, satellite altimetry, Shuttle Radar Topographic Mission Digital Elevation Model (SRTM DEM).Estimates river discharge exclusively using satellite-derived parameters.
  • Discharge was estimated exclusively from remote sensing data giving NS values greater than 0.5 at the investigated sites.
  • The estimated velocity (0.96 m/s) lies within the results of the computed velocity i.e., 0.63–1.2 m/s (virtual station 1) and 0.81–1.35 m/s (virtual station 2)
  • The resultant RRMSE is 17.42 (virtual station 1) and 26.35 (virtual station 2).
Table 2. Values for the computation of the roughness coefficient [26].
Channel Conditions Values
Material involvedEarthn00.025
Rock cut 0.025
Fine gravel 0.024
Course gravel 0.027
Degree of irregularitySmoothn10.000
Minor 0.005
Moderate 0.010
Severe 0.020
Variation of channel cross-sectionGradualn20.000
Alternating occasionally 0.005
Alternating frequently 0.010–0.015
Relative effect of obstructionsNegligiblen30.000
Minor 0.010–0.015
Appreciable 0.020–0.030
Severe 0.040–0.060
VegetationLown40.005–0.010
Medium 0.010–0.025
High 0.025–0.050
Very High 0.050–0.100
Degree of meanderingMinorn51.000
Appreciable 1.150
Severe 1.300
Table 3. The performance evaluation results of discharge estimation for virtual station 1 (near Hankou station) and virtual station 2 (near Datong station).
NS (±)RMSE (±m3/s)RRMSE (±%)RE (±%)R2
Virtual station 10.507144.6834.6310.510.59
Virtual station 20.765489.4926.340.940.90
Table 4. Estimated resultant errors associated with the roughness coefficient, slope and width parameters using Equation (4) at virtual station 1.
NS (±)RMSE (±m3/s)RRMSE (±%)RE (±%)
Roughness coefficient0.11744.633.766.91
Slope0.07503.32.454.71
Width0.02163.240.791.65
Table 5. Estimated resultant errors associated with the roughness coefficient, slope and width parameters using Equation (4) at virtual station 2.
NS (±)RMSE (±m3/s)RRMSE (±%)RE (±%)
Roughness coefficient0.04952.361.994.40
Slope0.03788.511.272.58
Width0.04885.301.703.85

