Article

Integration of Low-Resolution ALS and Ground-Based SfM Photogrammetry Data. A Cost-Effective Approach Providing an ‘Enhanced 3D Model’ of the Hound Tor Archaeological Landscapes (Dartmoor, South-West England)

1
Department of Archaeology, University of Exeter, Laver Building, North Park Road, EX4 4QE Exeter, UK
2
Archeodata, Polní 1158, Vejprnice 330 27, Czech Republic
3
Education and Research Library of Pilsener Region, Smetanovy sady 2, Pilsen 301 00, Czech Republic
4
Institute of Heritage Sciences (Incipit), Spanish National Research Council (CSIC), Avenida de Vigo, s/n Edificio IIAG-CSIC, 15705 Santiago de Compostela, Spain
*
Author to whom correspondence should be addressed.
Remote Sens. 2018, 10(9), 1357; https://doi.org/10.3390/rs10091357
Submission received: 4 July 2018 / Revised: 15 August 2018 / Accepted: 24 August 2018 / Published: 26 August 2018
(This article belongs to the Special Issue Advances in Remote Sensing for Archaeological Heritage)

Abstract

:
Airborne laser scanning (ALS) data is increasingly distributed freely for ever larger territories, albeit usually in only low resolution. This data source is extensively used in archaeology; however, various remains of past human activities are not recorded in sufficient detail, or are missing completely. The main purpose of this paper is to present a cost-effective approach providing reliable and accurate 3D documentation of the deserted medieval settlement of Hound Tor, a complex site consisting of preserved stone building walls and field system remains. The proposed procedure integrates ALS data with structure from motion (SfM) photogrammetry into a single data source (point cloud). Taking advantage of the benefits of both techniques (reclassified ALS data documents the hinterland, while SfM records the residential area in high detail), an enhanced 3D model has been created surpassing the available ALS data and reflecting the actual state of preserved features. The final outputs will help with the management of the site, its presentation to the general public, and also to enrich understanding of it. As both data sources are currently easily accessible and the proposed procedure has only limited budget requirements, it can be easily adopted and applied extensively (e.g., for virtual preservation of threatened complex sites and areas).

Graphical Abstract

1. Introduction

Airborne laser scanning (ALS) is a very effective remote-sensing technique which also has a considerable use in archaeology, e.g., [1]. Thanks to the ability to penetrate under woodland canopies, it enables us to produce a 3D representation of large areas of landscape free of vegetation (DTMs—digital terrain models) very efficiently, and thus to document archaeological sites, or to identify other (previously unknown) traces of past human activities preserved in the relief. It is applicable both in research and cultural heritage management. ALS data currently covers large parts of Europe and, in addition, it is also increasingly distributed freely for ever larger territories. In this case, however, its primary purpose is not archaeological, but mostly environmental. That is why freely available ALS data is generally in a lower resolution (with a density usually of no more than 1 point per square meter) compared with commercial data or data acquired for a particular archaeological research project. Nevertheless, freely distributed ALS data is widely used by archaeologists; in many cases, it is the only data source available, especially in low-budget projects. The precision and details of final outputs, and thus the visibility of earthworks/relief features, are dependent on many factors—flight height, type of terrain, extent, density and type of vegetation (especially low vegetation inhibiting the penetration of laser pulses to the relief) [2,3], or post-processing procedures (data classification, interpolation and visualization) [1,4,5,6,7,8,9]. Primarily, the point cloud density-representing relief (also influenced by some factors mentioned above) is the main determinant of the final DTM resolution and, therefore, a quality with which earthworks are recorded [10] (p. 4688). Furthermore, another limitation of freely available ALS data is that above-ground structures (e.g. architectural debris) may not be recorded in DTMs because of (automatic/semi-automatic) poor classification (manual, usually time-consuming classification of data is necessary to retain them). In digital surface models (DSMs), the relief features can be hidden under dense vegetation cover. Because of that, many ephemeral archaeological remains are hardly visible, generalized (e.g. lateral parts of architectural debris are hidden when viewed from above) or completely left out in the outputs derived from low-resolution ALS data. Additionally, an occurrence of ‘false structures’ increases [11] (pp. 34–35): (1) the ones existing in the relief/on the surface like natural elements, recent features or some disruptions; or (2) ‘virtual structures’ generated during data post-processing. As a result of all above, low-resolution ALS data does not mostly provide entirely reliable 3D representation of sites as it often lacks various elements and generalizes the site’s details (especially the complex ones containing architectural debris or objects above the ground), decreasing the potential for analysis, presentation to the public, or preservation.
On the other hand, there are currently other techniques applied in archaeology to produce 3D models; photogrammetry is being frequently applied as a cost-effective method (compared to terrestrial laser scanning) [12,13]. More specifically, structure from motion (SfM) photogrammetry is currently widely used for the 3D documentation of small objects/artefacts [14], skeletal remains [15], excavations [14,16,17], architecture [12,18] or landscapes [14,19,20]. It can be applied using unmanned aerial vehicles (UAVs), poles, or simply by manually operated cameras. Because of the recent development of hardware and software, this technique is available for almost everybody. However, it has its limits as well, especially at the macro-scale level, because of considerable hardware requirements; it is not very suitable for thorough documentation of large areas. In addition to that, the outputs are DSMs containing vegetation and any other overground elements which are not as easy to filter as ALS data [12] (p. 178), although filtration and classification are also possible; only exposed areas of the bare ground can be considered DTMs. Therefore, it does not allow recording relief features and any elements if they are hidden, especially under low vegetation. However, the integral 3D representation of all above-ground structures (including the lateral parts of architectural remains) is possible, since ALS only documents the parts visible from above.
Recently, as a logical consequence, the combination (in terms of ‘layering’ different data) and integration of several data sources (especially terrestrial laser scanning (TLS), UAV and terrestrial photogrammetry) have emerged to increase the quality of documentation ensuring its high precision, and thus to produce complete and accurate outputs/models of a particular area/site as much as possible [21,22,23,24,25,26,27,28,29,30]. However, the integration of ALS and photogrammetry is still not commonly applied in archaeology, even though the high potential of such a procedure has been demonstrated in other disciplines, e.g. [31,32]. In this context, the accuracy and validation of 3D models have become an important and essential issue. The application of both TLS and SfM is dependent on many factors (type and characteristics of the site/study area, budget etc.). SfM can provide very accurate and detailed documentation when used in appropriate conditions, and the spatial error is thoroughly accessed [12,33,34]; see also critical review in [35,36].
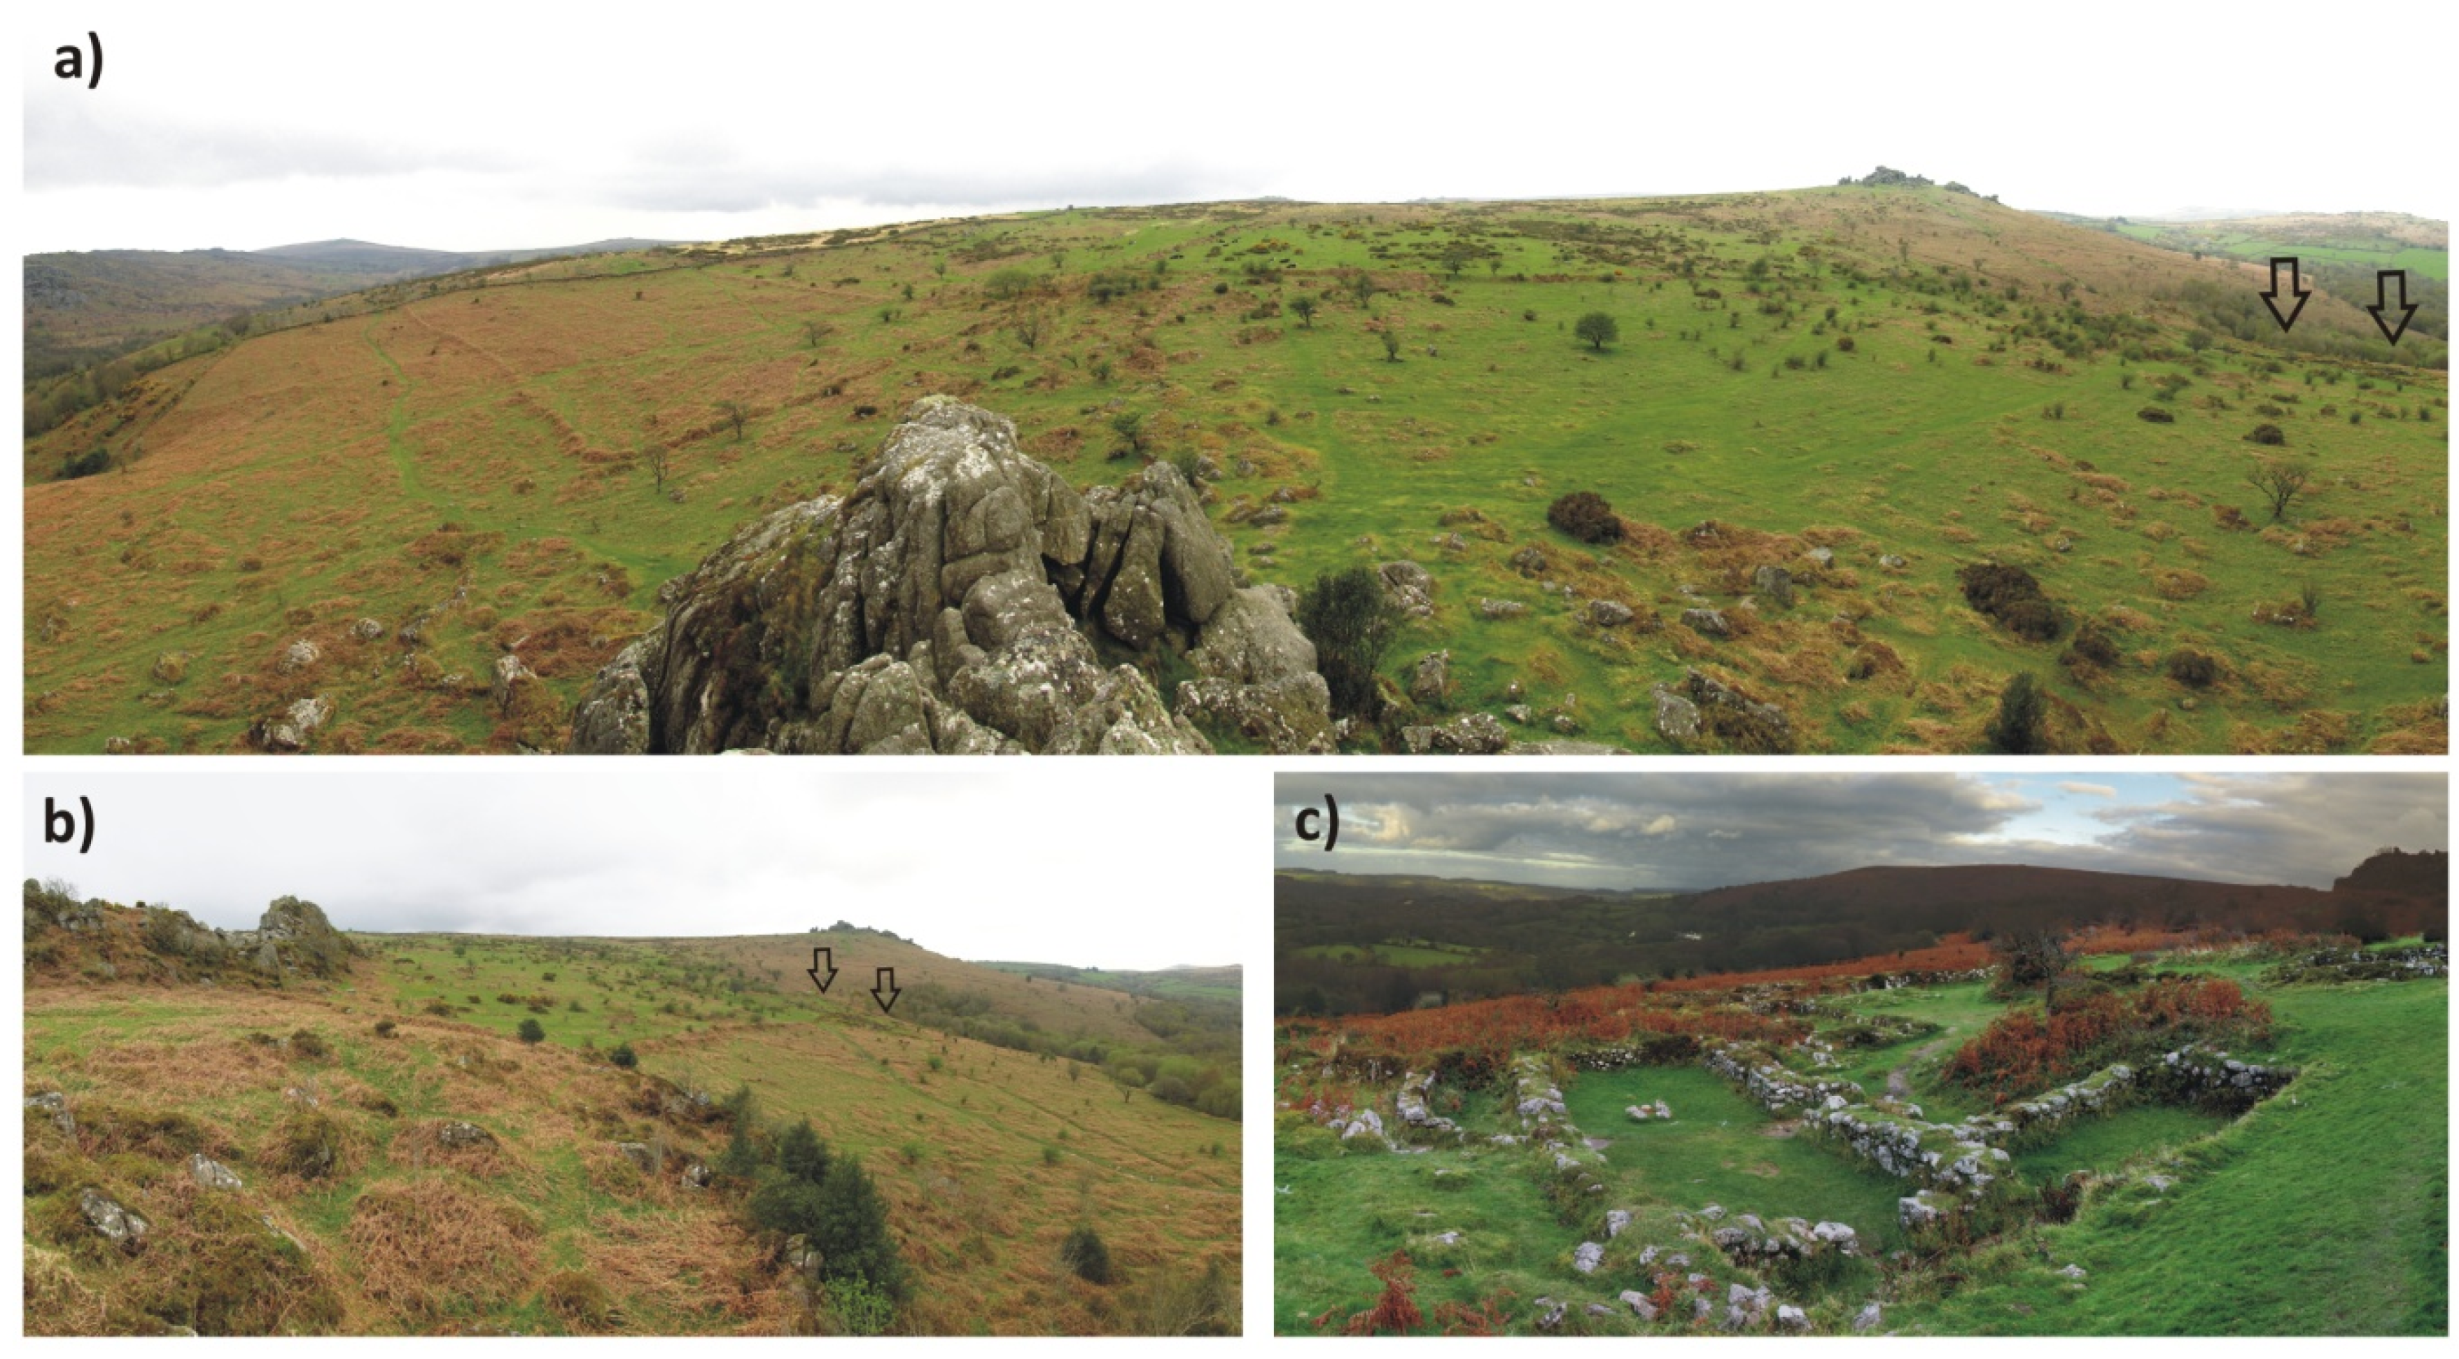
The primary purpose of this paper is to present an approach providing detailed, precise and accurate 3D documentation of the deserted medieval settlement of Hound Tor, situated at the fringe of Dartmoor, in south-west England (Figure 1a,b). This site consists of variable types of remains, represented by conserved stone building walls which were excavated entirely [37] (p. 100), and a nearby field system. The latter, covered by low vegetation, is preserved in the full extent as lynchets, ridge-and-furrow and field enclosures (walls, corn-ditches; see more detailed description in Section 2.1.; Figure 2). Therefore, it constitutes a typical complex site which is difficult to document by a single technique only (only by ALS or by SfM; see below). Although it is an iconic medieval rural settlement in England, with a large number of visitors, only traditional 2D plans are available today [37,38] (pp. 87,130), together with defective models derived from freely available ALS data (see Section 2.1.). In the DTM, over-ground structures such as remains of buildings, walls around fields and ditch-and-banks are completely missing. In the DSM, a vast area of the field is covered by dense vegetation (mostly bracken), the residential area is not recorded in sufficient detail and many elements are missing (more description in Section 2.1.).
Therefore, we intend to propose a specific technique of ALS and ground-based SfM photogrammetry integration into one data source (point cloud) as the background for the complete 3D documentation and reconstruction of the whole site in one output where all components are included. More specifically, it means the incorporation of the residential area with the highest detail as possible and also the full extent of the surrounding field system, with the vegetation removed in both cases. Doing so, our purpose is to take advantage of both techniques, integrate them, filling the gaps between them, and produce an improved 3D model surpassing and enhancing the freely available ALS data, reflecting the real situation and actual state of preserved features as much as possible. SfM photogrammetry is applied here as a tool for refinement and improvement of ALS models to record and emphasize all details (especially architectural debris) missing in the residential area. On the other hand, ALS data is used as a means to document a more significant piece of landscape with enclosures and areas with earthworks, hidden somewhere under the vegetation. The 3D virtual reconstruction will help with the management of the site, its presentation to the general public, and also to enhance understanding of it.
Additionally, as both data sources are currently easily accessible, inexpensive and individually widely used (although their integration is still not common in archaeology), our second aim is, therefore, to propose a cost-effective procedure which can be readily adopted using only minimal equipment and budget (typical for most archaeological projects). To that, we were partly compelled by the fact that using UAVs for the site documentation in the area of Dartmoor National Park is restricted, so we had to find an alternative way of acquiring images for SfM photogrammetry: using a pole. Thanks to this, we intend to propose a procedure which can be easily adopted and applied extensively for precise documentation of a large number of similar complex sites and surrounding landscape. Our motivation is based on the fact that there is still a great number of threatened sites for various reasons (especially current land management and erosion) or even that many sites have been heavily damaged without adequate documentation. Precise and reliable documentation of such sites is urgent before their destruction or damage so they can be preserved at least digitally, directly contributing to cultural heritage management and dissemination. Therefore, the inclusion of all the details in the 3D models and their reliability is necessary [12] (p. 181), [13] (p. 137). For these reasons, an essential part of the paper is related with the examination of accuracy and precision of the resulting 3D models and validity testing (especially areas documented by SfM) regarding the spatial error to justify such approach and credibility of final outputs.

2. Materials and Methods

2.1. Case Study and Existing Documentation of the Site

Hound Tor is a deserted medieval hamlet situated at the eastern fringe of Dartmoor (Devon, south-west England), the area with the highest density of preserved archaeological sites in England (and one of the best in the whole Europe). In fact, large pieces of the area consist of remains of past land use (albeit mostly free of woodland canopies), often in the form of a palimpsest contributing to the complexity and variability of the area and all elements there. A considerable effort to document sites and transects of past landscape has been made in Dartmoor [39], as there is a significant public interest in the whole area.
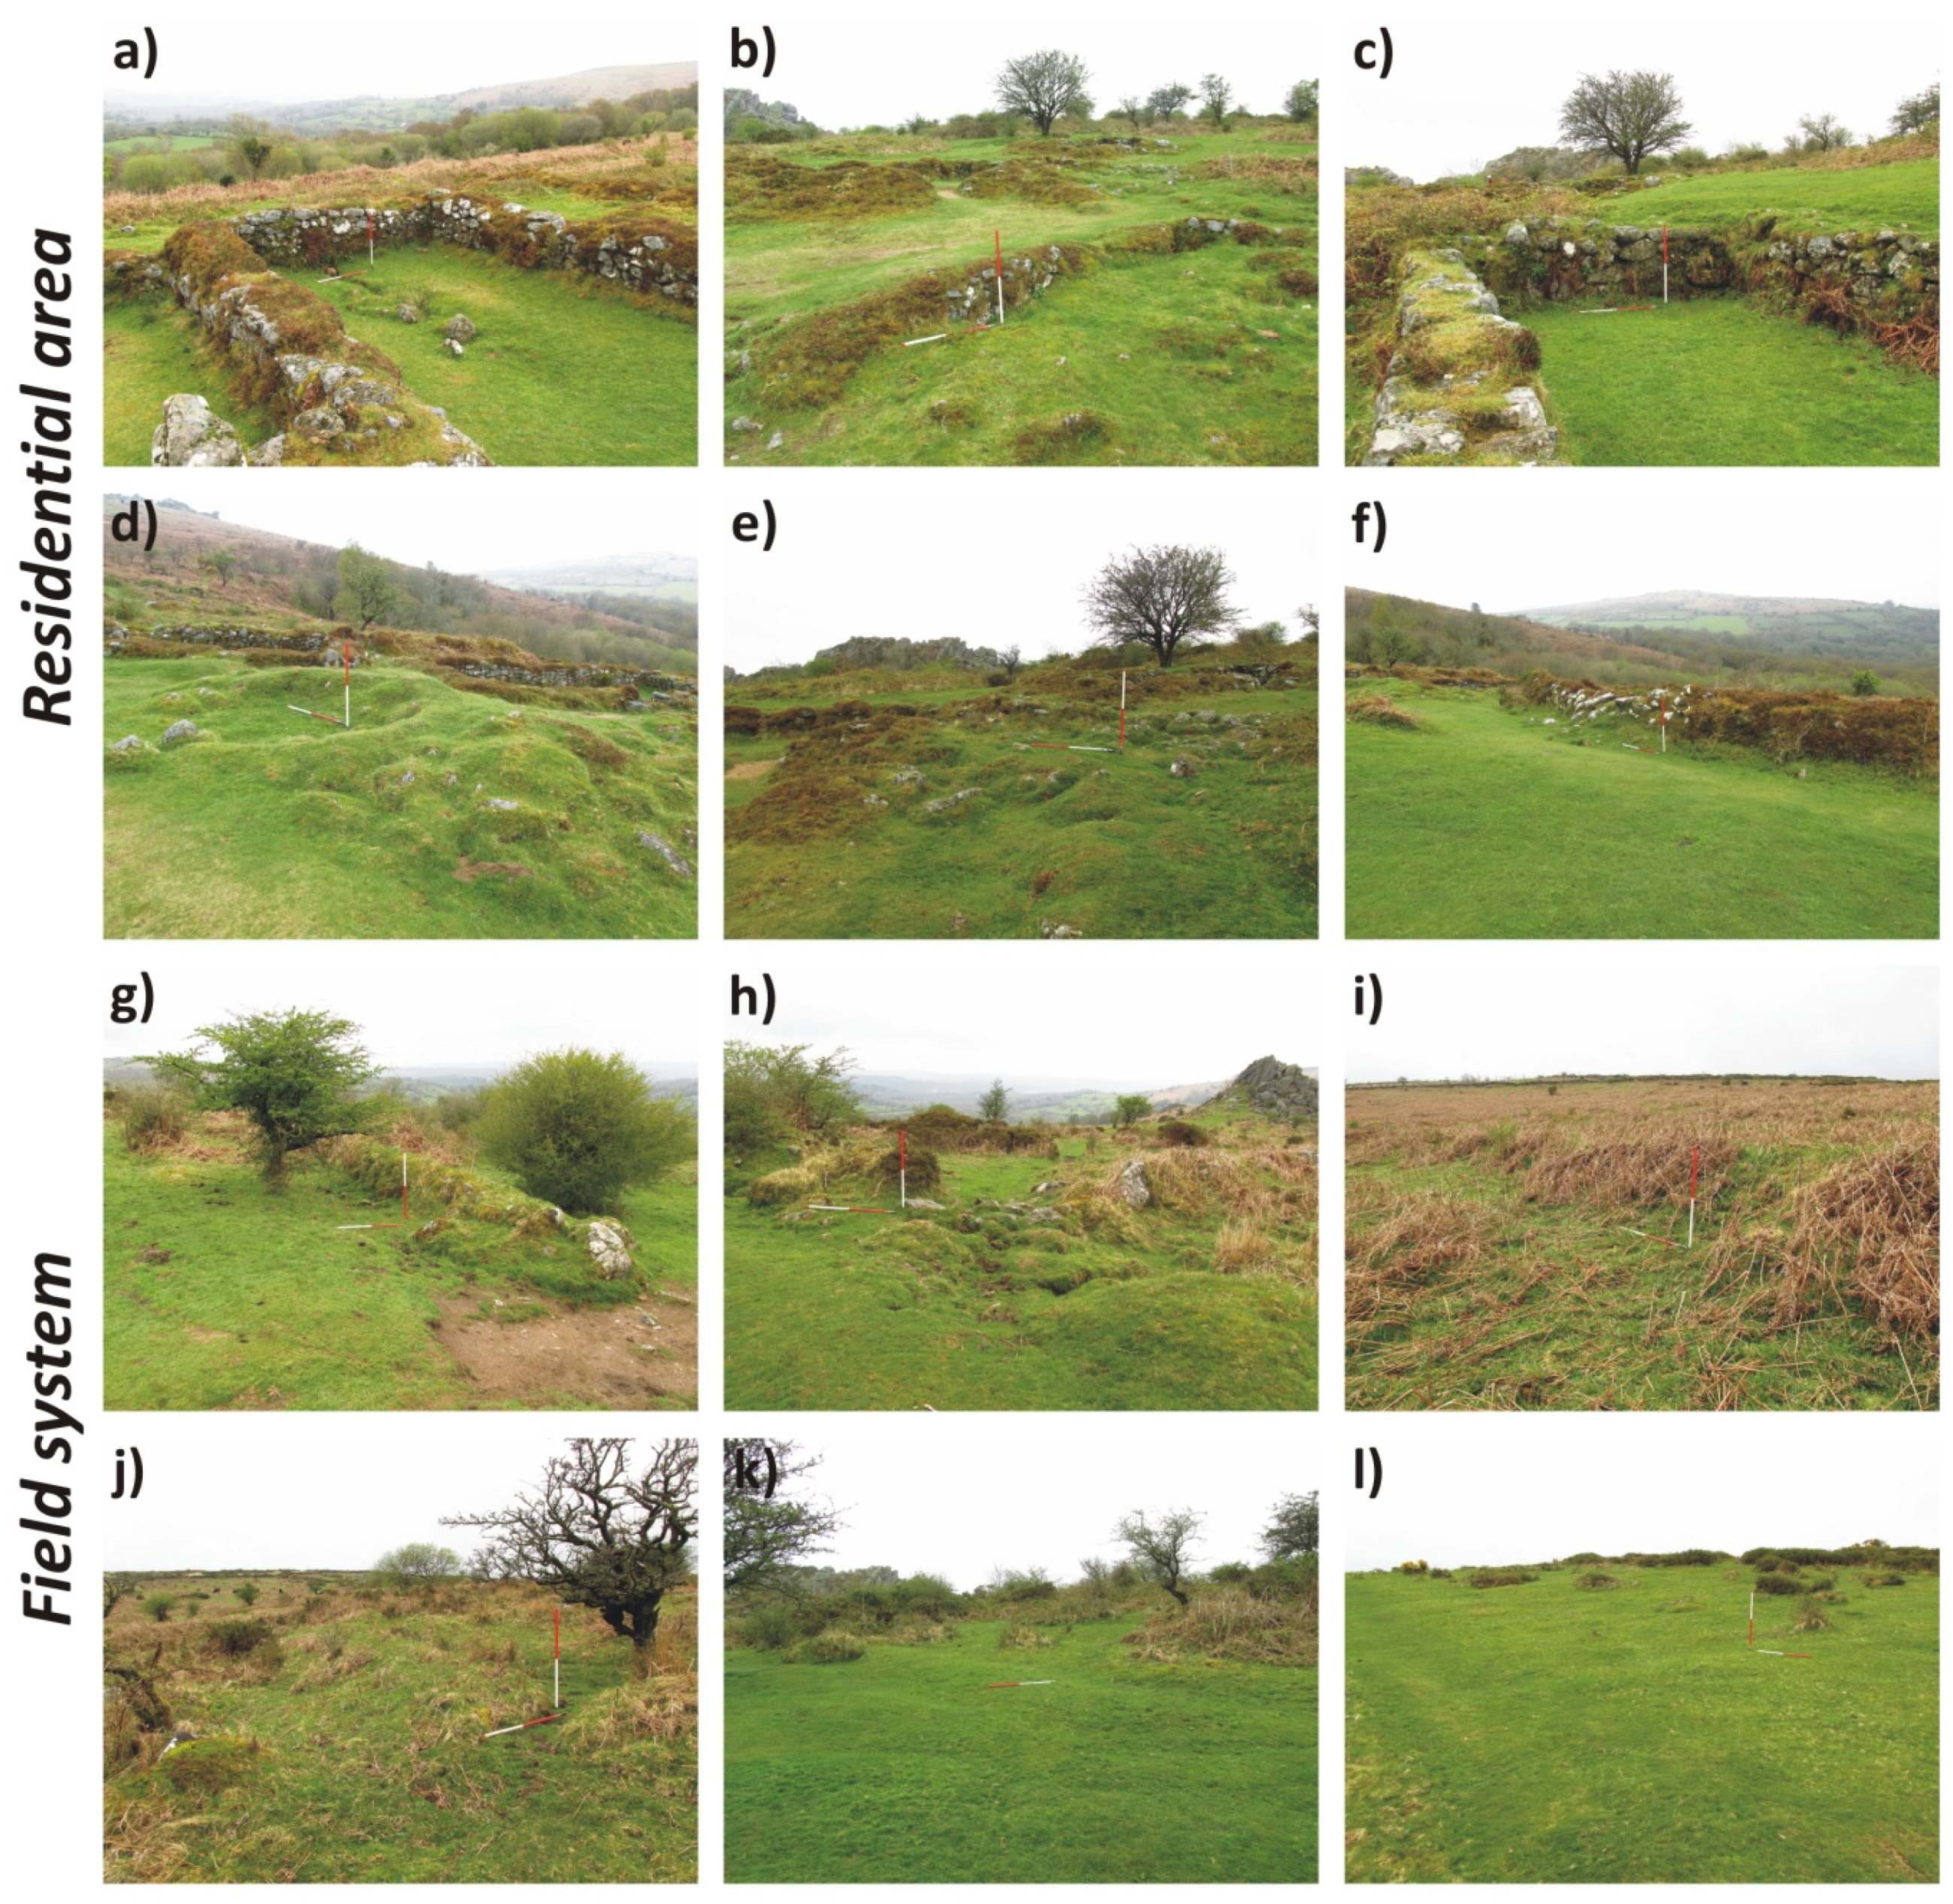
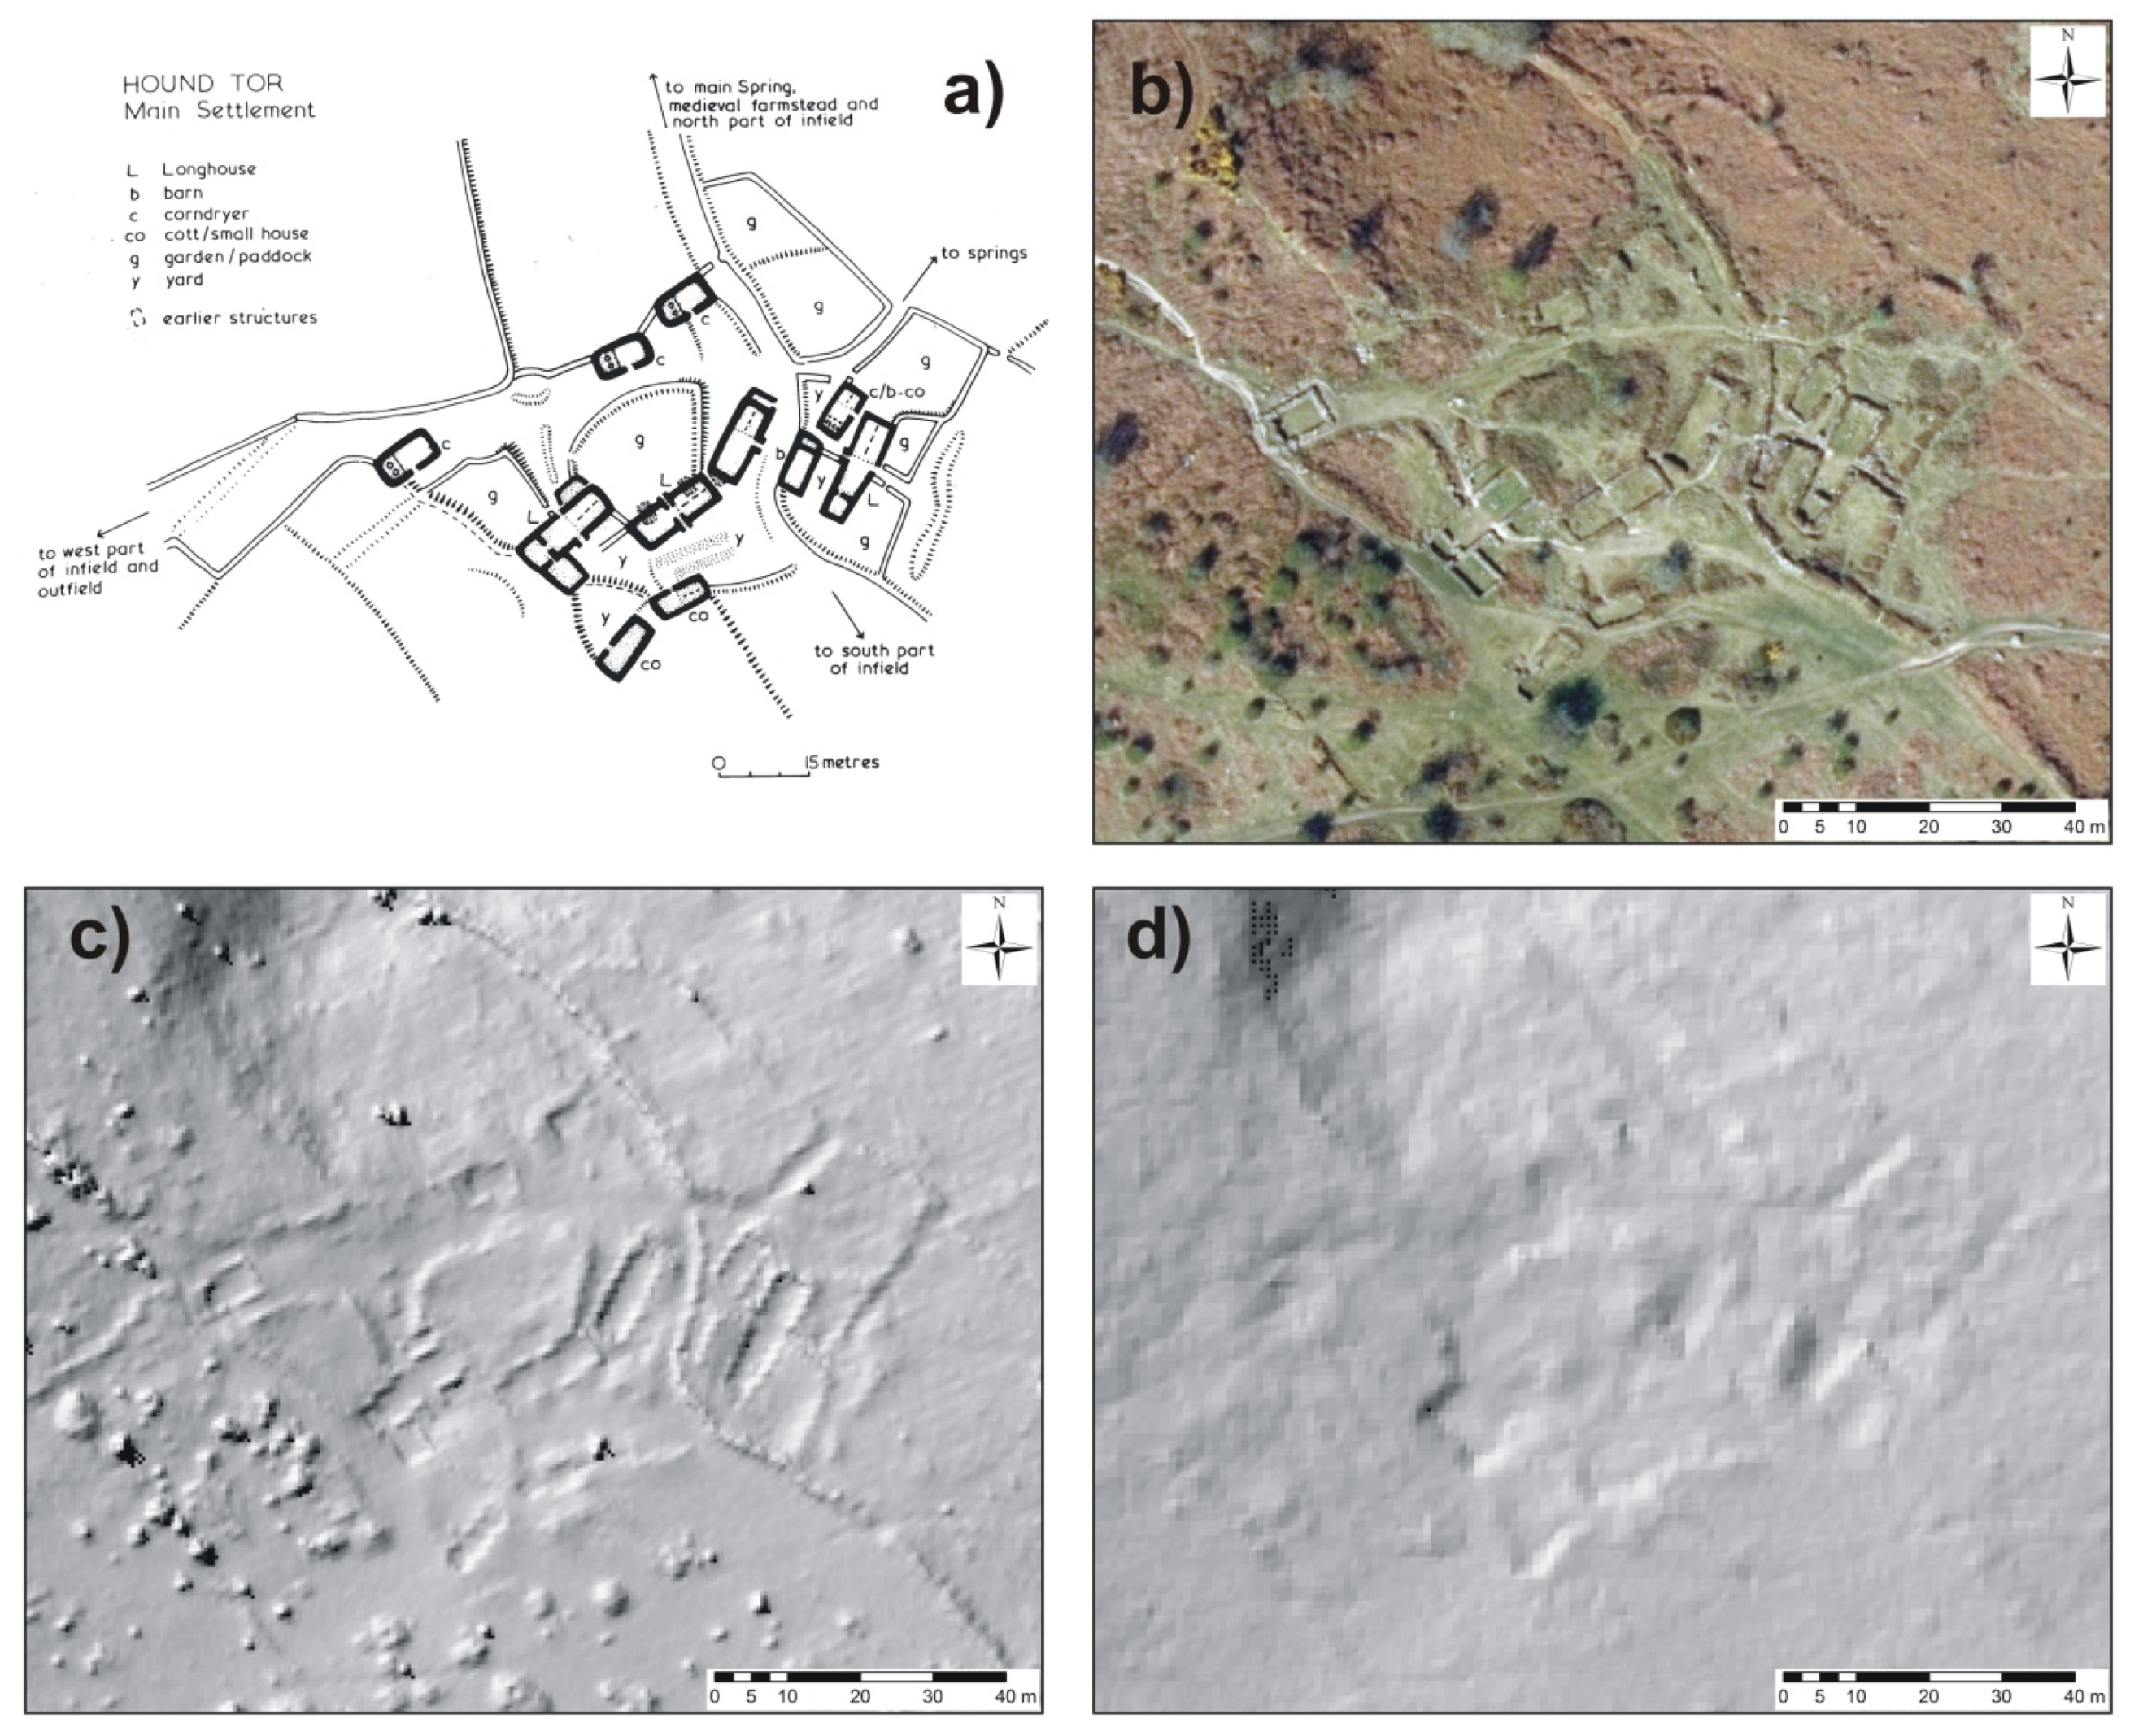
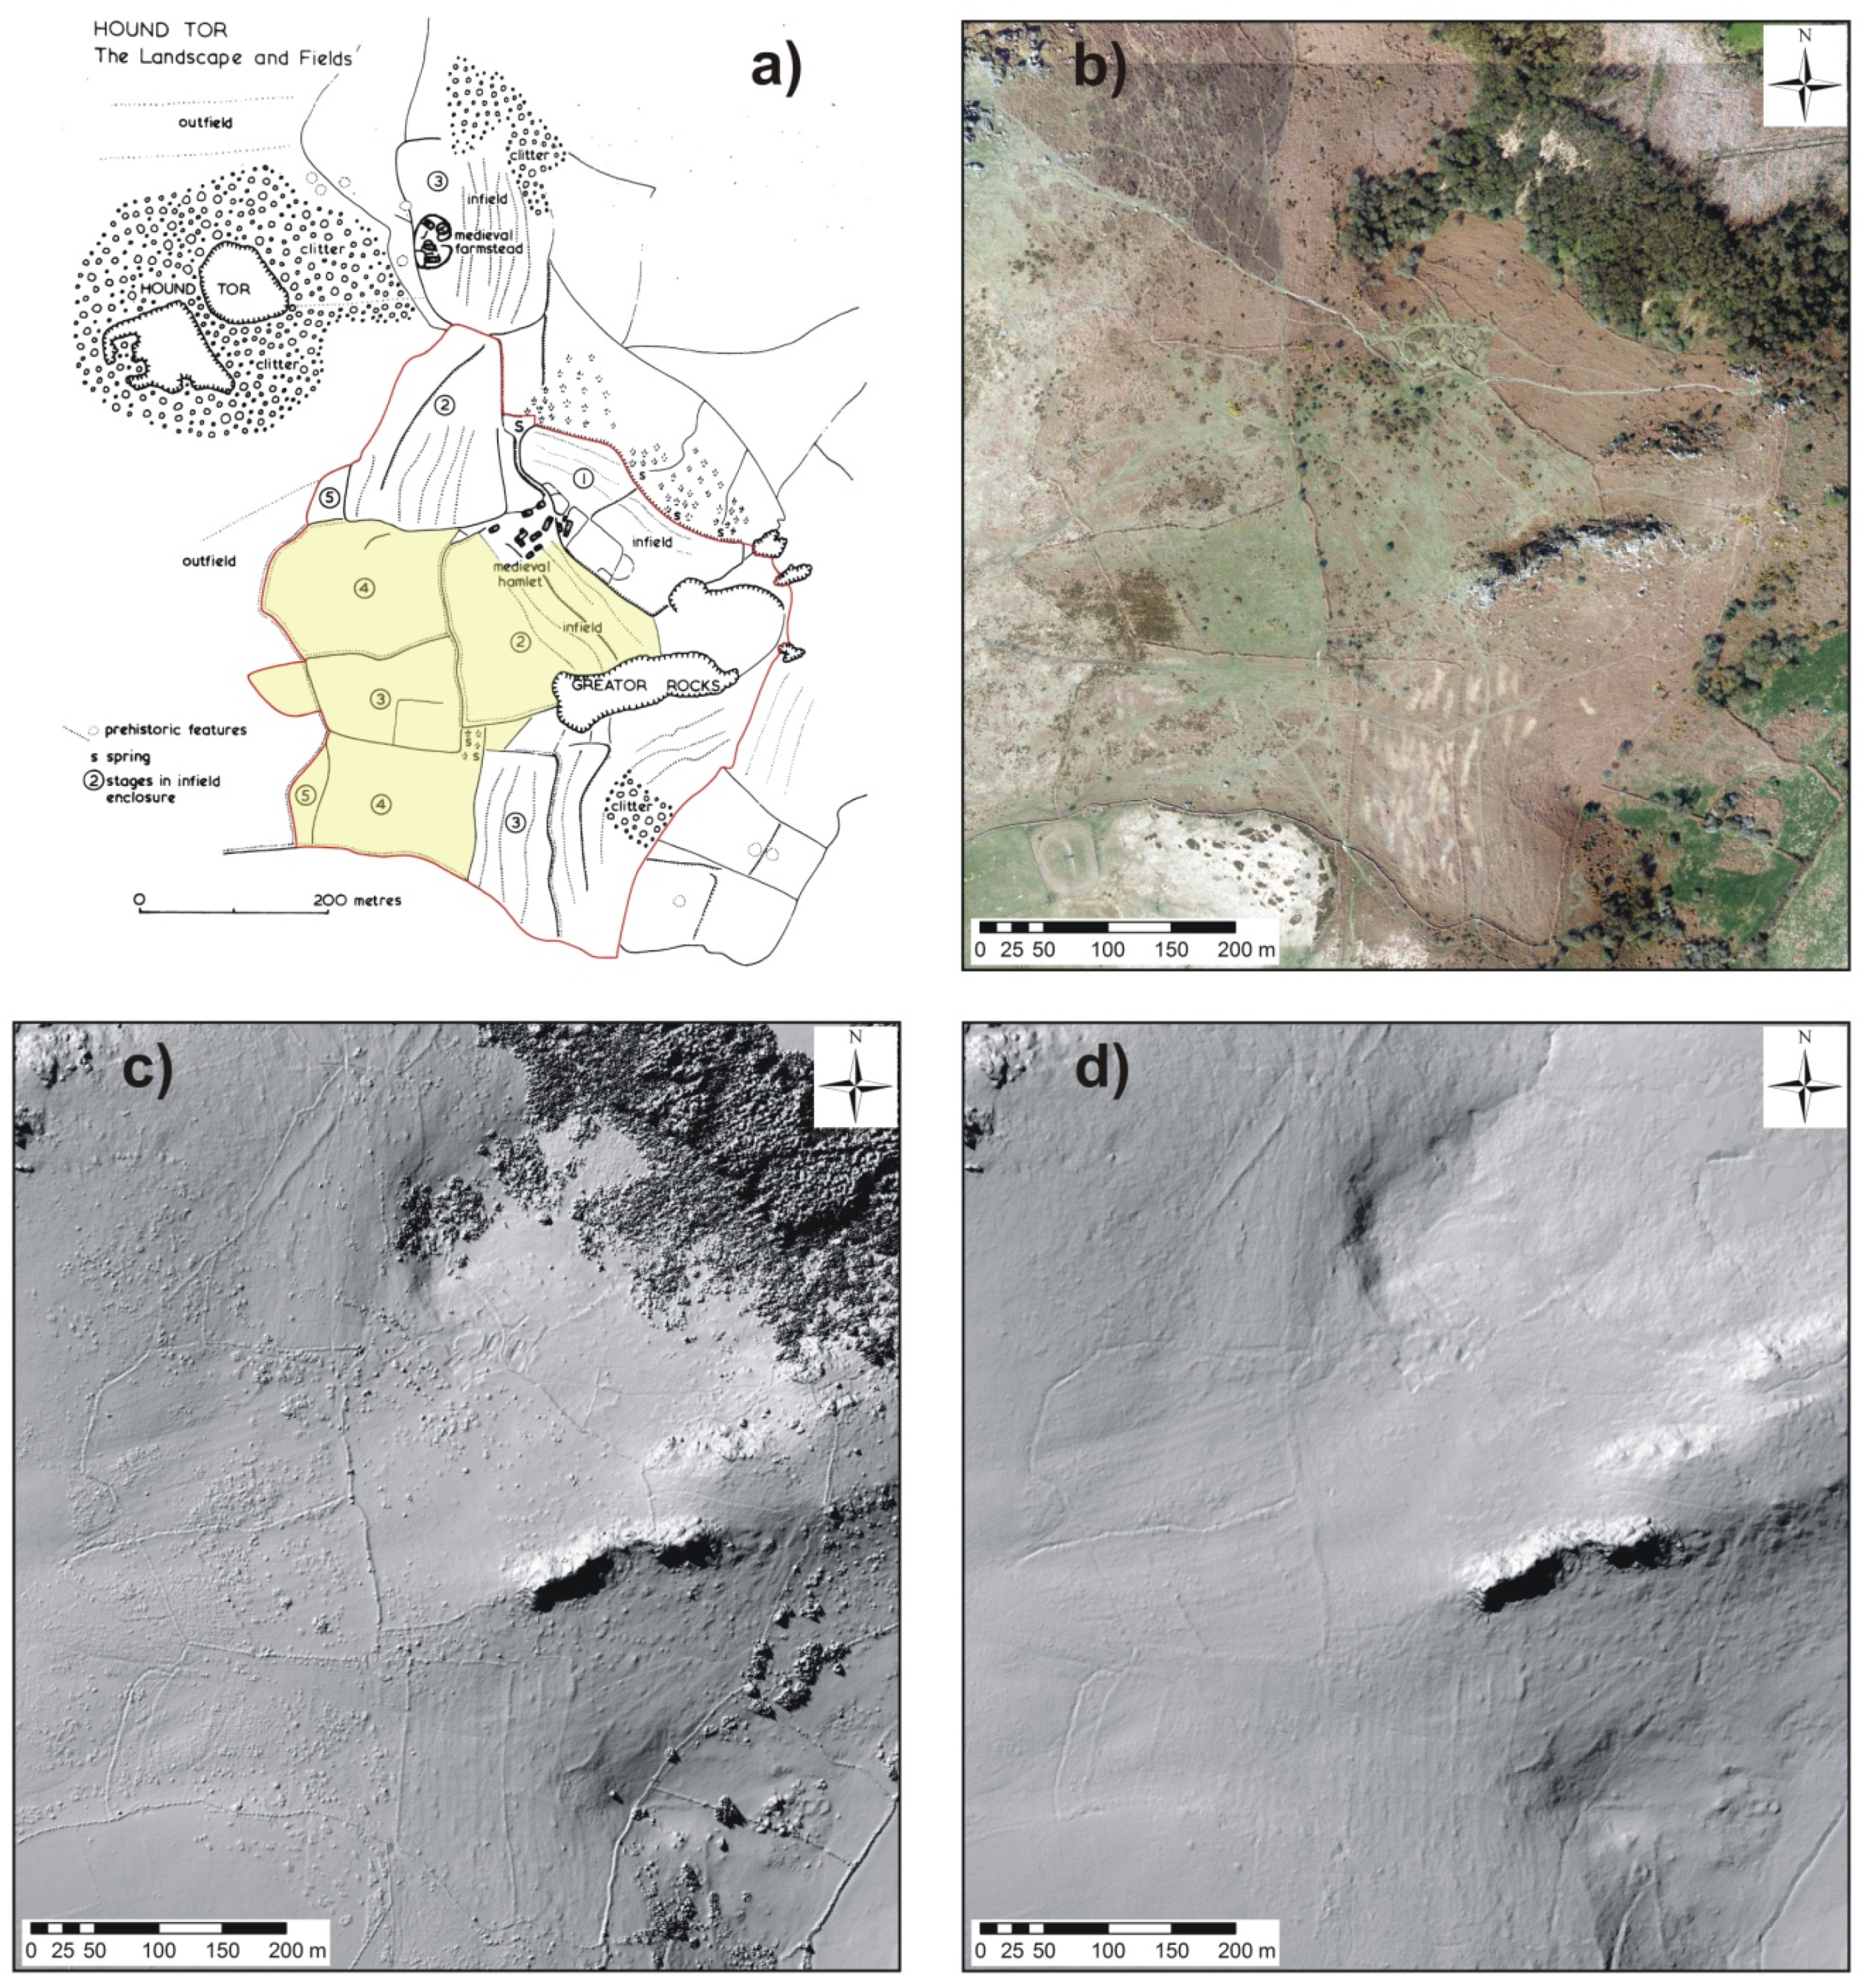
The archaeological site at Hound Tor is situated on a slope, approx. 340 m a.s.l. (meters above sea level) under the Hound Tor peak (419 m a.s.l.; Figure 2a,b). The hamlet was first mentioned in Domesday Book, 1086 AD; based on the pottery, the beginning of occupation is supposed in the 9th century. The settlement was abandoned during the second half of the 14th century [40], although human activities are also documented in the post-medieval period until the 19th century (see below). All buildings (4 longhouses, 3 corn-drying barns and 4 outbuildings) and their vicinity in the residential area were completely excavated by Mrs. Minter during the 1960s; later, the excavations were evaluated and published by G. Beresford [37]. Remains of buildings (stone foundations/retaining walls) were then conserved up to the height of ca. 1.2 m (Figure 2c and Figure 3a–c). Although moss covers several places, the stone construction is still visible today. The surface inside and outside the vast majority of buildings is covered by very short grass only (1–2 cm height) and in several places, piles of material and disturbed structures are clearly visible (Figure 3d–e); this provides ideal conditions for the application of the SfM as the resulting 3D model can be considered the DTM. The existing plan [37,38] depicts the position of all buildings and structures (walls and earthworks) based on the excavation (Figure 4a), albeit several parts are not apparent in the current relief as they are hidden under the bracken (Figure 2c and Figure 4b). This low vegetation occurs during the whole year and it was very dense when the images for the SfM photogrammetry were taken (see Section 2.3.), so the bare ground is not exposed there. It spreads on all margins of the residential area; in the north, it expands onto two corn-drying barns, and the one in the northern edge is currently hardly visible. Additionally, it also occurs among the buildings covering piles of material from the excavation, disturbed surface, and previous gardens. Tourists frequently visit Hound Tor as it is located directly at the tourist trail, and therefore the site is potentially threatened. The irregular rectangle of the residential area extends over a space of ca. 5500 m2 (85 m × 60 m).
The upland arable economy of the community in Hound Tor, also confirmed by pollen evidence [41] (pp. 149–151), left traces of the field system around. It mostly spread south of the hamlet. In the north, the site called Hound Tor II is situated—a former farmstead with surrounding field system as well, which, according to pottery, was established after the abandonment of Hound Tor [40] (p. 144); this settlement has not been included into our analysis. According to previous prospection and documentation [37], the landscape around Hound Tor is a palimpsest consisting of 3 main occupations which represent past human activities. Leaving aside prehistoric reaves (first layer), remains of the medieval open-field landscape have survived (second layer). It comprises arable fields of irregular size and shape, bounded by stone walls and banks, sometimes accompanied with shallow ditches (Figure 3f–h; the thorough description of the field system and its plan are provided in [37]). Fields used to be subdivided by a series of strip lynchets, which are now hardly visible at some places (Figure 3i–j). Several fields are filled with ridge-and-furrow (third layer, Figure 3k–l), somewhere in the superposition with lynchets (Figure 5a,b). These earthworks originated from the period after the abandonment of the hamlet and are unlikely to be earlier than c. 1780. They are very subtle (the height is only several centimetres) and difficult to distinguish on the ground, especially in the areas densely covered by bracken vegetation. The whole situation is a unique English example of a complete medieval field pattern preserved until today. The full extent of the territory (the settlement area) reaches 243,716 m2 (the maximum length of the most extended axes is 717 m × 617 m).
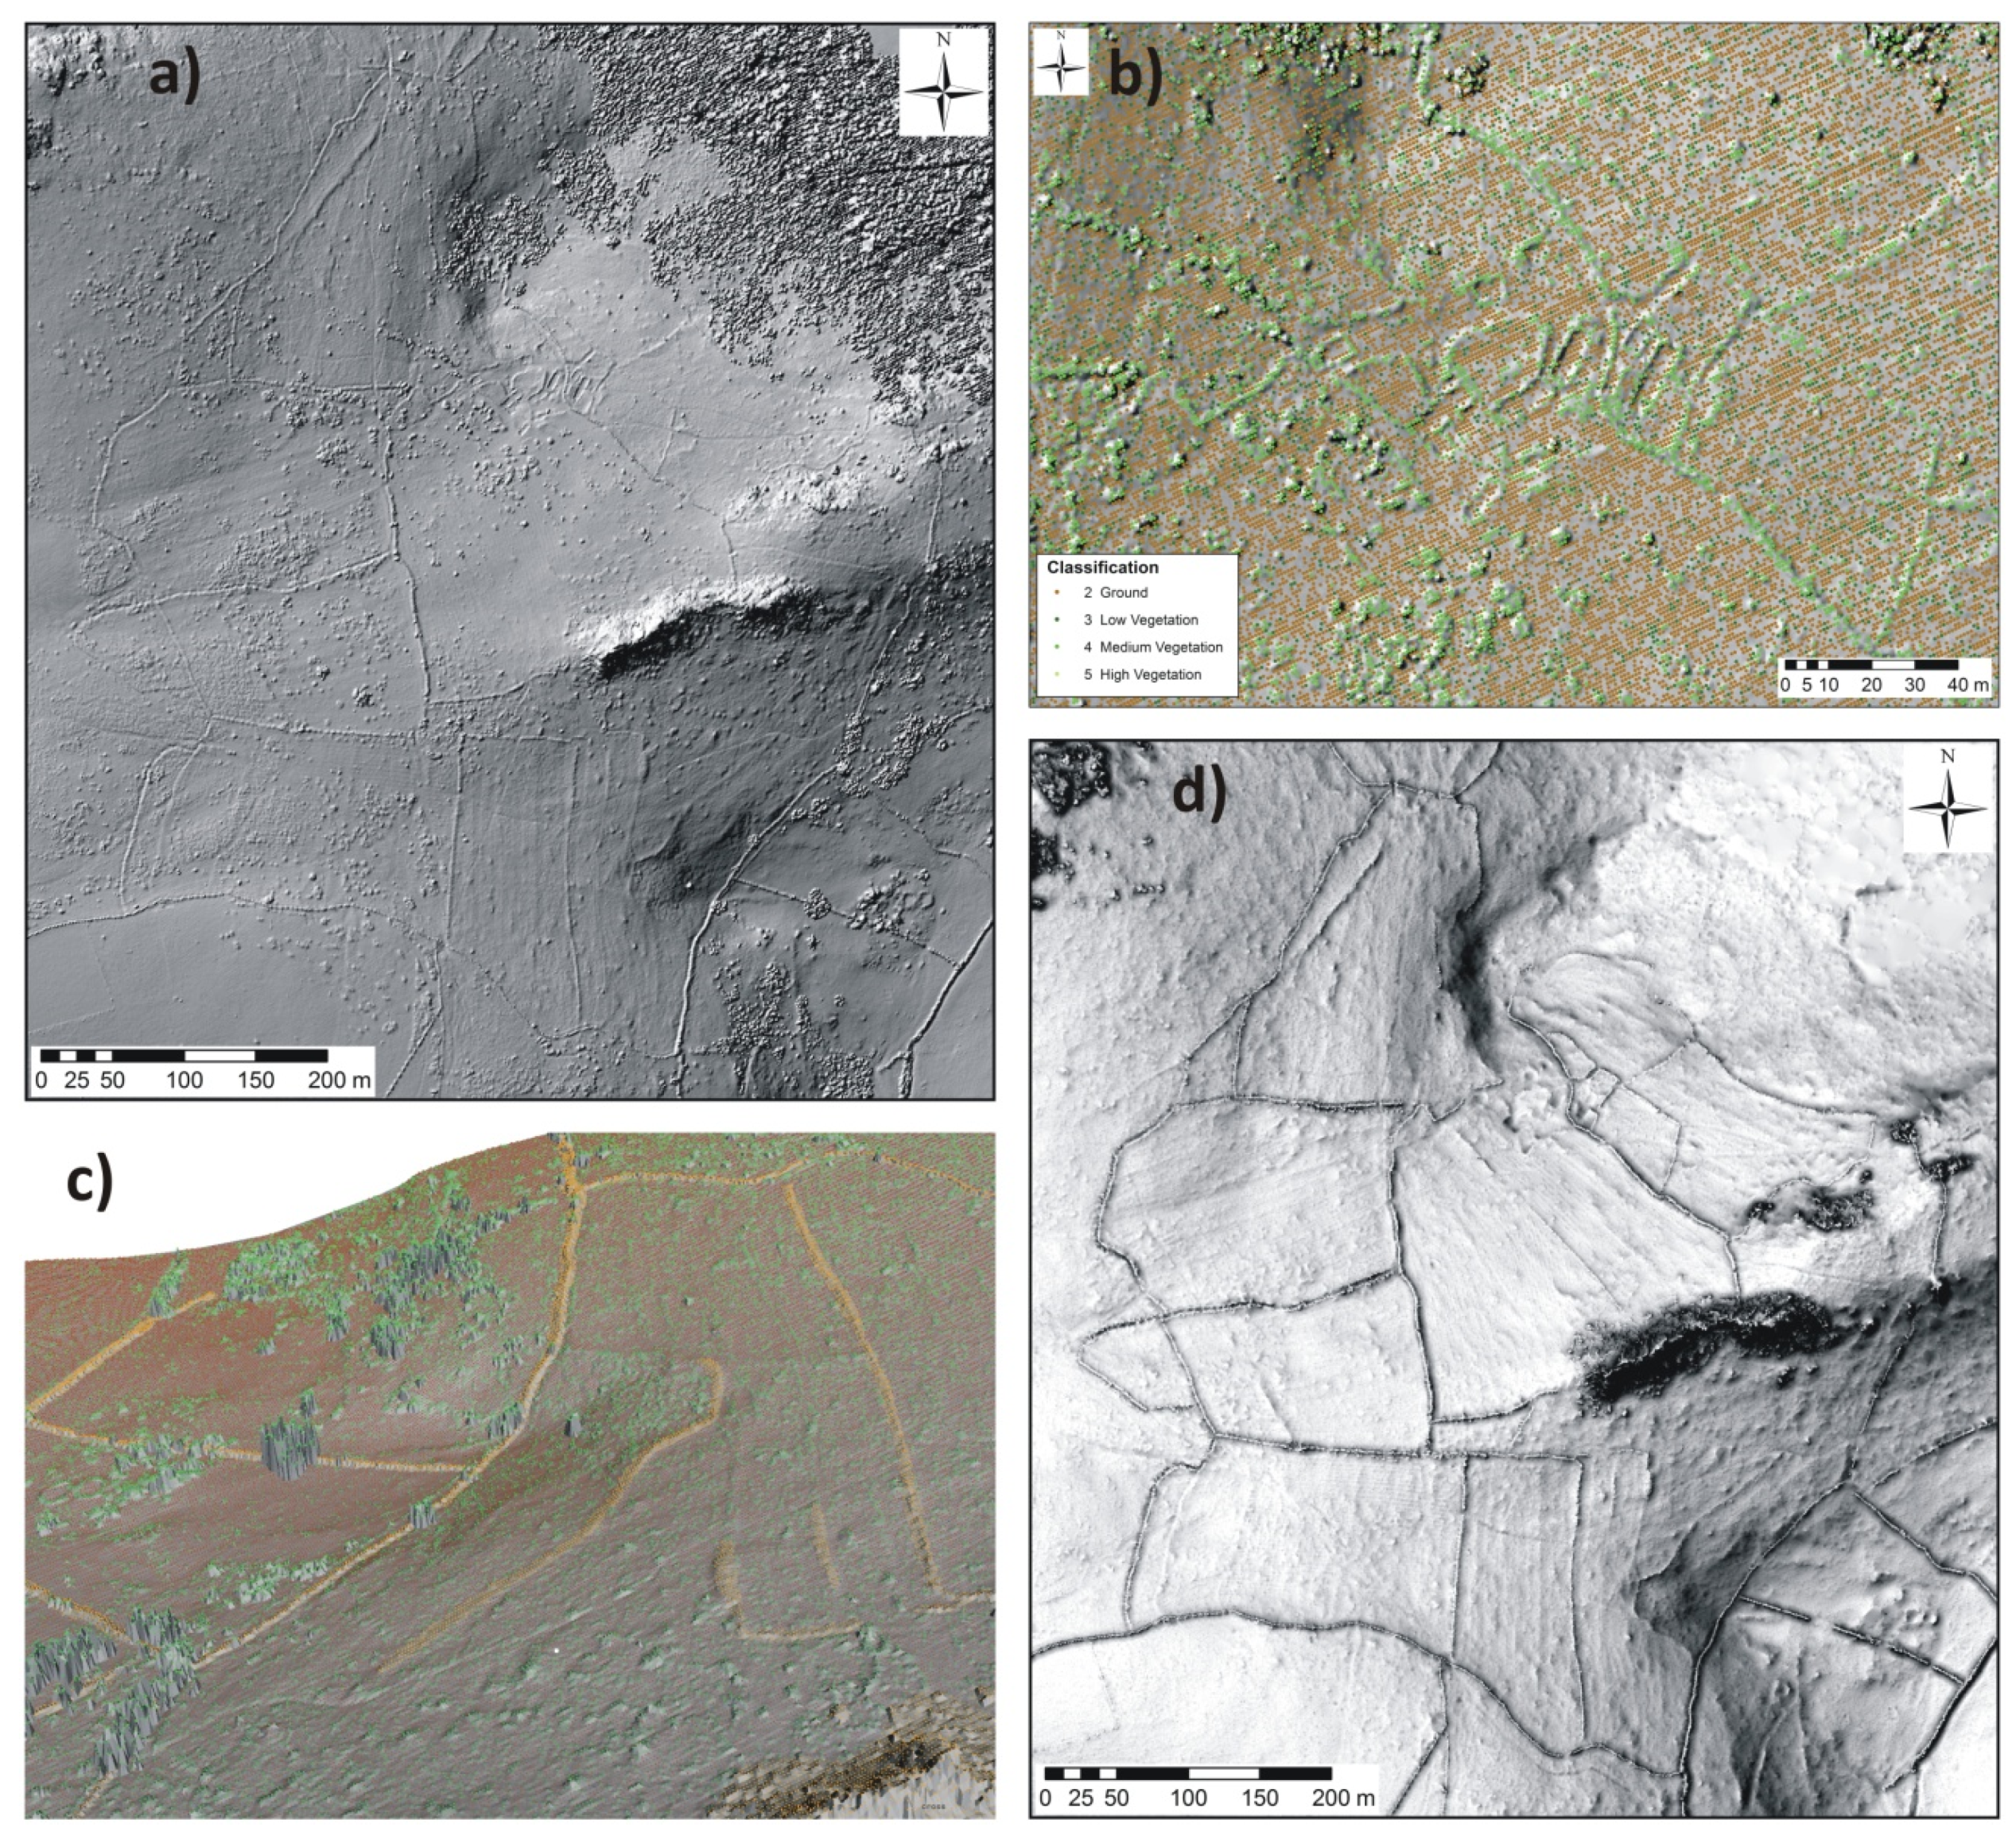
For this site, ALS data from the UK Environment Agency is freely available (scanned in 2010 [42]). It is possible to download prepared DSMs and DTMs tiles as well as the original point cloud. The DSM displays the whole settlement area with the field enclosures apparent there. However, large areas with earthworks are completely hidden under low vegetation (Figure 5c). It is also possible to recognize the residential area with particular buildings (Figure 4c). Nevertheless, this output is not precise enough and does not contain all details compared to the original plan and current field situation. Several walls are not displayed there; building remains are smooth and only indicated, some are hardly recognizable at all; edges of the remains and walls are not sharp; several components, as drainage channels in the bottom part of longhouses, are missing entirely. In the DTM, the residential area is only indicated as a terrain anomaly (Figure 4d), building remains are very hard to decipher as they were filtered out, considered to be vegetation by automatic classification algorithms. The same applies to all the over-ground structures (field walls) in the hinterland (Figure 5d). Nevertheless, linear earthworks of the field system such as lynchets and ridge-and-furrow are more visible despite the fact they are very subtle. They are interrupted in several places as the vegetation was incorrectly filtered out by an automatic procedure. Additionally, both DSM and DTM include ‘overage’ points which are covered by more than a single flight line, and they create false features over the site, miming ridge-and-furrow (Figure 5c–d, see Section 2.2.).

2.2. Airborne Laser Scanning (ALS) Data Evaluation

Within the project, we used freely available point cloud of ALS data provided by UK Environment Agency, scanned in 2010 [42]. Data is provided in the .laz file format, in the British National Grid coordinate system, with orthometric heights (OSGM’02 geoid model, Ordnance Datum Newlyn), with four returns and a point density of 1.57 per square meter in all returns. The absolute height error of data (root mean square error—RMSE) is less than ±15 cm; the absolute spatial error of data is less than ± 40 cm [43]. The ALS data was evaluated in LAStools [44].
In the first step, ‘overage’ points creating the false lines similar to ridge-and-furrow were removed using lasoverage (Figure 6a)—a tool which enables researchers to find (based on the flightline information) and remove points that are covered by more than a single flightline (overlapping flightlines). The basic information on point cloud (point density, flight lines, etc.) has been acquired using lasinfo in which the point content is reported. The point cloud is provided as classified into seven main categories (unclassified; ground, low, medium and high vegetation; buildings and keypoints). However, the ‘vegetation’ category (especially the ‘medium vegetation’ category) also includes the over-ground features as the field enclosures together with small rocks and boulders (Figure 6b). Therefore, these were manually reclassified into the correct category using lasview, a visualization and editing tool (the ‘buildings’ category was used including rocks on the site; Figure 6c). For this purpose, the plans of the hinterland (Figure 5a) [37] (p. 151), [38] (p. 130) were utilized as a key to identify of the main pattern of all structures (fields walls, banks) in the field system; the problematic or complicated features were validated in the field. The manual reclassification of the point cloud in the whole area (complete hinterland and the close surrounding) took ca. 8h. The residential area/building remains were ignored in this step as it is the area where SfM photogrammetry has been applied (see Section 2.3. and Section 2.4.). The generated ALS point cloud, which will be then integrated with SfM point cloud, consists of points now classified as the ‘ground’ and ‘buildings’, and therefore covers the relief and the over-ground structures without vegetation (the point density is 1.12 per square meter). For the visualization and comparison with provided DTM and DSM, the Sky-view Factor in RVT 1.3 [45,46] was applied (0.5 m cell size, Natural Neighbor interpolation in Surfer 12; Figure 6d).

2.3. Acquiring Images for Structure from Motion (SfM) in the Residential Area and Spatial Recording

The fieldwork in the residential area of Hound Tor took place in 22/10/2017. As the site is situated in the Dartmoor National Park, UAVs are not generally allowed there except with special permission and a pilot’s license. Therefore, a more complicated way of documentation had to be applied: pole and handheld photography. The working process in the field and the method of taking images were based on the available ground plan (Figure 4a). Due to a large extent and high vertical articulation of the area, it was divided up into five sections which correspond with the main concentration of buildings and structures. These were documented (and processed, see Section 2.4.) individually using the SfM photogrammetry. The extent of particular sections ranges from 550 m2 up to 1430 m2. The whole area under SfM documentation covers ca. 4390 m2.
In each section, two groups of ground control points (GCPs) were established:
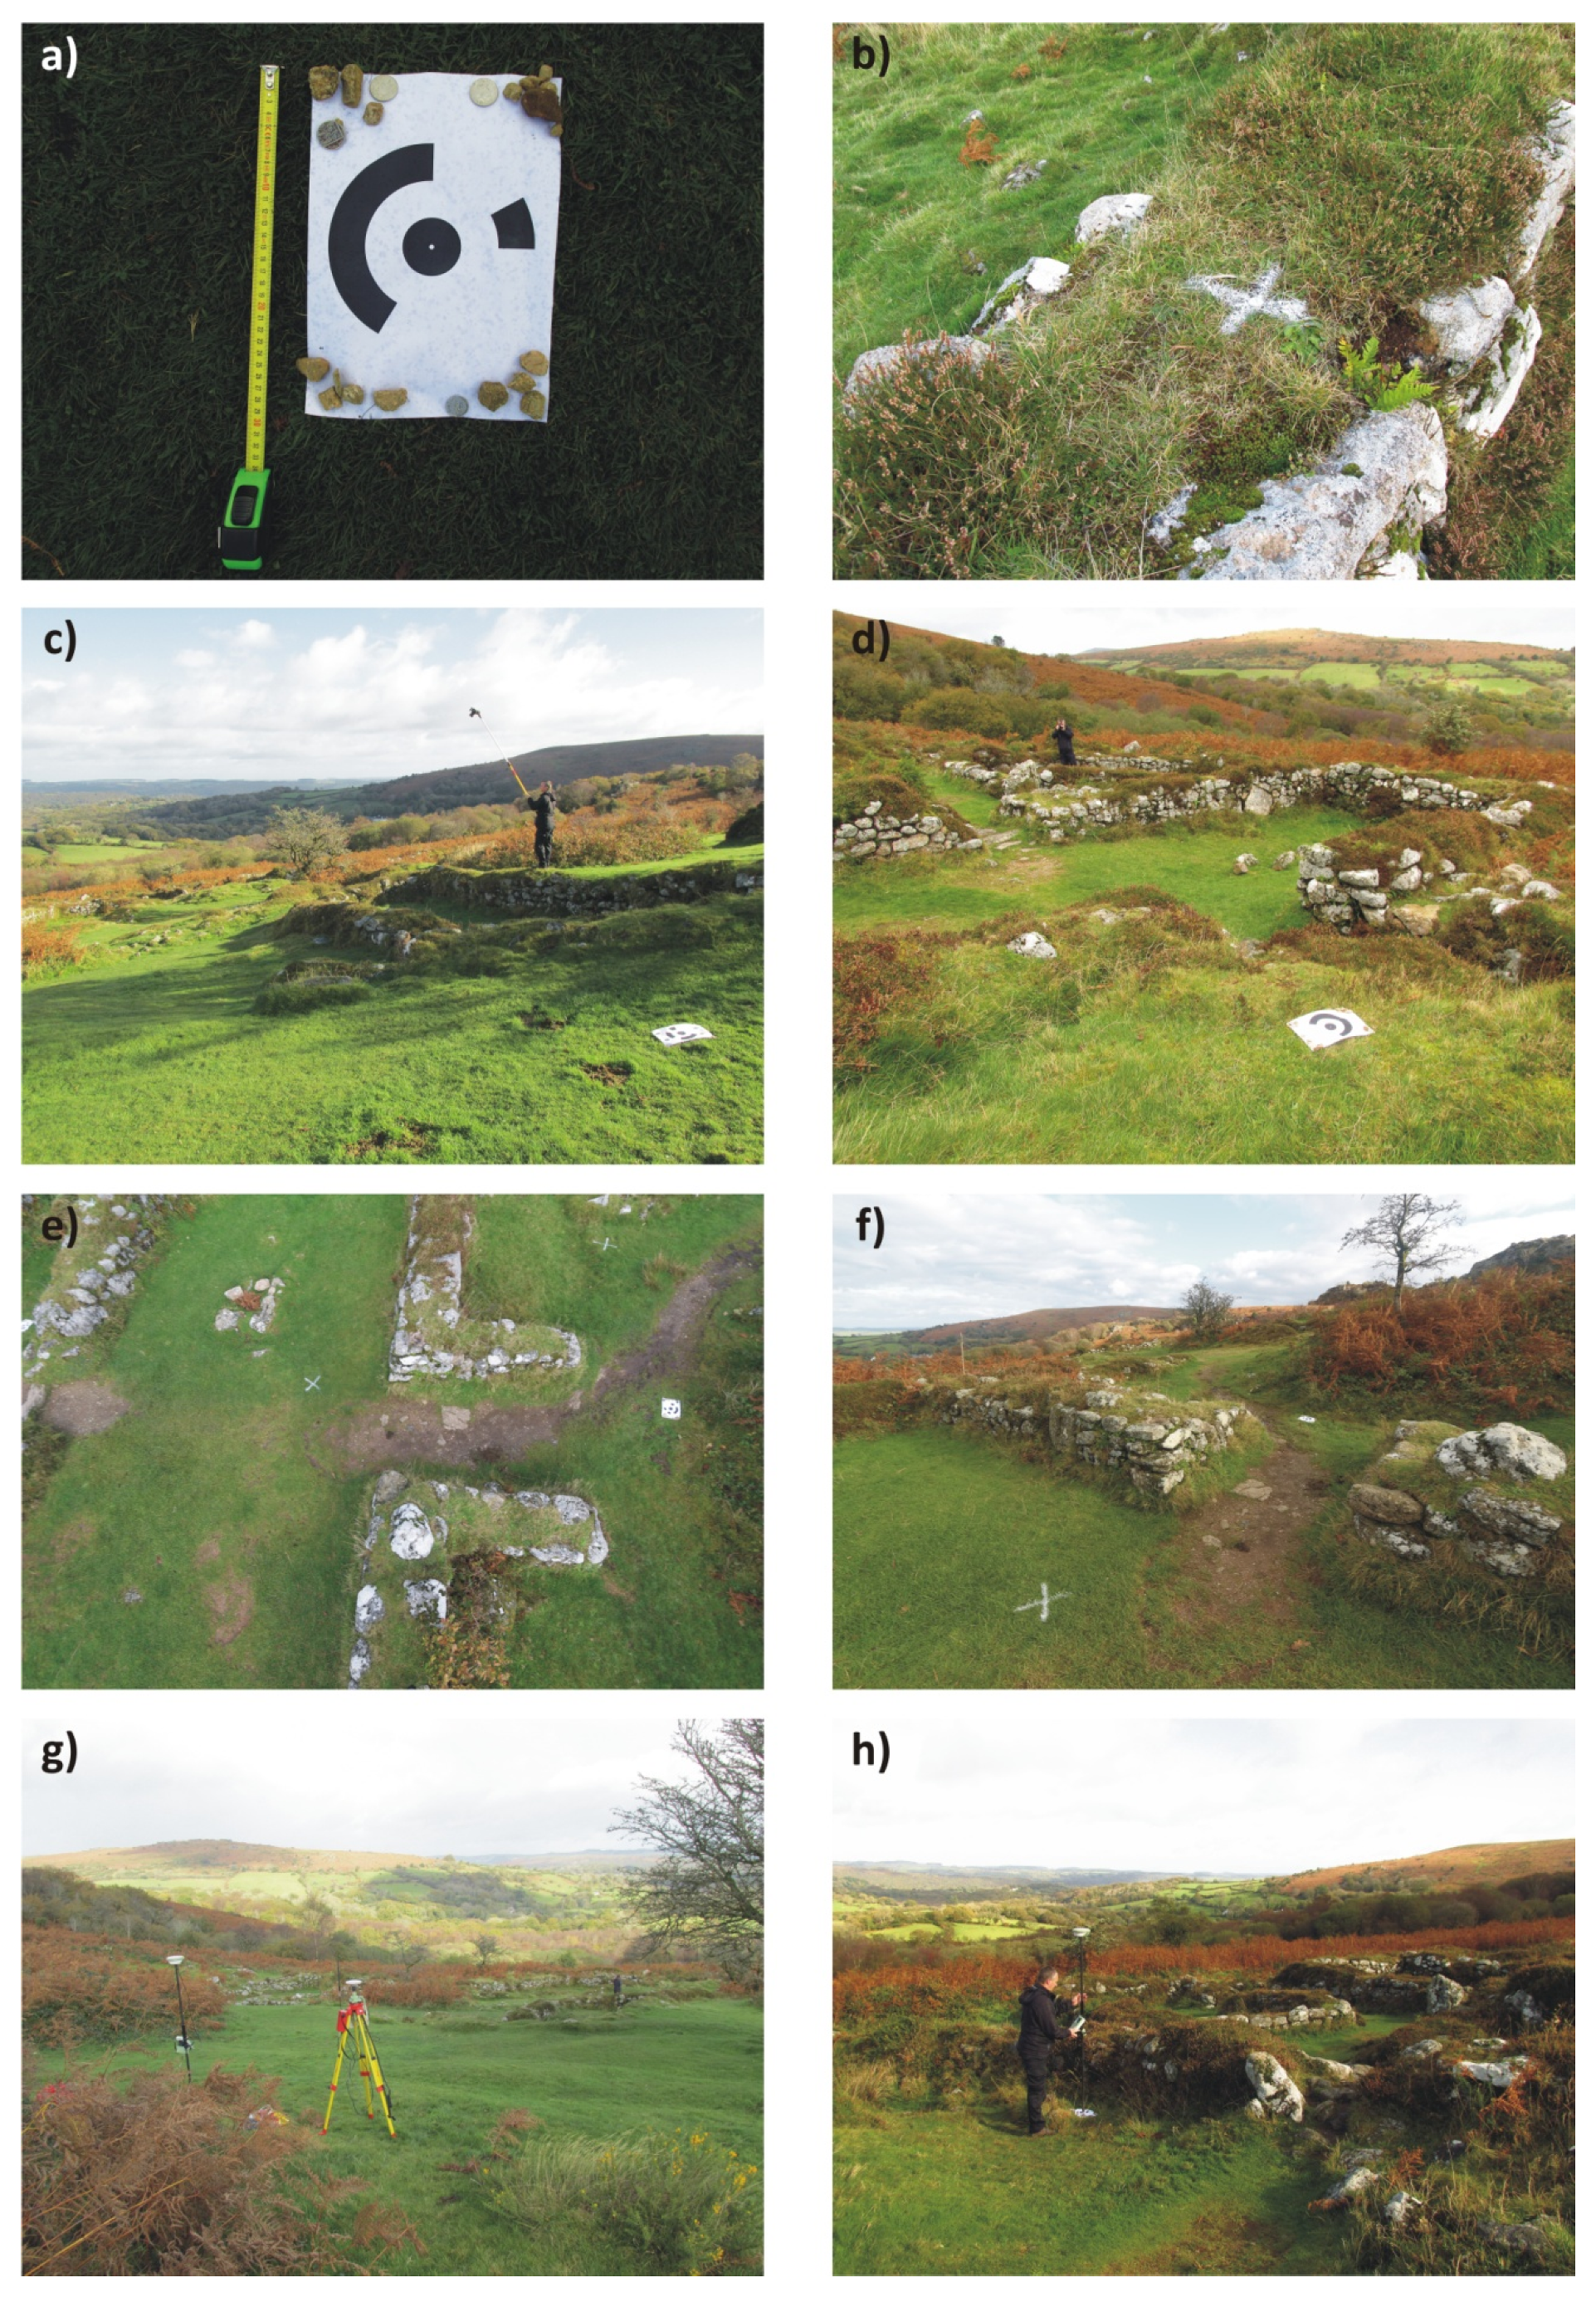
  • 5–7 coded markers (CMs; their number corresponds with the extent of the section and the density of structures there) generated from Agisoft Photoscan (the software used for SfM processing, Professional Edition, version 1.4.0). The CMs were printed on A3 paper size sheets and put onto the cardboard/hard paper to avoid their deformation on the ground and to ensure they are stable during the spatial recording (Figure 7a). As the wind was strong during the day and small nails did not work well in these weather conditions, all of them were loaded with different kind of weights (small stones, coins) so that the encoded graphic element is not disturbed and the marker is fixed at the particular place during the shooting. Their advantage lies in the fact that precise centres of the CMs are automatically detected in Agisoft Photoscan. This means that the spatial error is limited and working time during the evaluation decreases radically [13] (pp. 143–144). As the CMs are primarily used for the model georeferencing into a specific coordinate system (British National Grid after post-processing), they were distributed to cover the entire documented area as evenly as possible. For this purpose, at least 3–4 GCPs were necessary, so we used more than sufficient number of CMs in case that some of them would not be recognized because of: a) insufficient photo coverage and quality; b) a displacement by strong wind or many tourists walking through the site; c) damage by unexpected rain occurring during the day, which is typical for weather in Dartmoor.
  • 5–7 more permanent points (check points–CPs) represented by measuring nails put into the ground and marked by a chalk spray for their better visibility and easier identification in the photos (Figure 7b). They have dual-purpose: (a) primarily for testing the 3D model precision, as an independent control and for the validation of the 3D model (see Section 2.6.); (b) they were also placed there as a safeguard if the georeferencing using CMs failed for any reason (see above). The CPs were placed in variable positions, usually in the areas among the CMs, several of them intentionally in distinctive lower or upper positions (e.g., top of the walls) to make sure that deformations in the 3D model would not occur [47], see below).
Overall, 31 CMs and 32 CPs were established across the whole site.
For the SfM documentation, a 24.2 megapixel Canon EOS 700 D APS-C reflex camera (DSLR—digital single-lens reflex camera) was used equipped with a 10–22mm f/3.5–4.5 USM Canon objective (wide-angle lens objective, focal length used = 10 mm). It ensured the highest possible coverage and a considerable overlap among the images in the system of documentation we set up and routes we followed (see below; no area should remain undocumented or covered by only a limited number of photos placed in unsuitable angles or positions even in the case of any change on the followed route due to obstacles or any other circumstances; Figure 8b). The DSLR camera was set to automatic shooting mode with a fixed ISO sensitivity of 100 ISO and focusing on the central point (the centre focus point is the most accurate and fastest).
The collection of images was taken according to the following steps:
  • Pole photography. The residential area was recorded by DSLR camera on the pole; the aluminium roller extension pole was used (1.2–2.4 m long, commonly used for painting) with a screw at the end where an Adapter for Painter’s Poles with a mount for a DSLR camera was placed to fix the camera (Figure 7c). The individual exposures were taken with a remote wireless trigger (controlled by a photographer) whenever the camera was in the ideal location for a suitable shot. For the image recording, a systematic methodology of several parallel passages was applied while walking in the longitudinal direction of the walls and also on the walls of preserved houses; a maximum distance of 4 m apart separated the individual passages, so for each section at least four passages were necessary. Images were recorded in ca. 1 m intervals. When standing on the walls (0.5–1.2 m), the surface was documented from the height of approx. 3.5 m; dimensions of the recorded areas are ca. 8 × 5 m (Figure 7e). In each position, a space was recorded in front of the operator holding the pole (to avoid shooting his own legs) and then an image from the original location to the left and to the right were taken, where it was possible to reach the pole; this ensured the utmost image overlay and multiple coverage of the large area from different points of view and angles. Our effort was to avoid doing entirely vertical images as they are not recommended for SfM due to the creation of a systematic mistake caused by a camera calibration error [48,49]). Therefore, images were slightly oblique (ca. 10°).
  • Handheld photography. This was used for the full coverage at the site, primarily focused on the vertical elements (usually facing the masonry) which are not visible in the images taken from the pole at a large angle and from inappropriate positions (Figure 7d,f). The coverage of the documented section by these images ensures proper photo composition, and thus better interconnection of images to complete the three-dimensional capture of all elements at the site which are documented with higher precision (the complete 3D model can be generated instead as ‘ortho’ view only; Figure 8e). Additionally, handheld photos were used as redundancy for possible problems of later computation (e.g., blurry images from the pole, potential incomplete coverage by images of particular areas, etc.).
The photographic coverage of each section was always overlapped at the edges to be then joined into the one point cloud; see Section 2.4.). Overall, 3558 photos were taken (2879 images from the pole and 679 handheld images; Table 1).
After taking the photos of each section, positioning data of all GCPs was obtained using a Leica System 1200 dGPS ‘rover’ unit referencing a Leica System 500 ‘base station’ (Figure 7g,h). The referencing and roving data collected was post-processed in relation to the nearest five Ordnance Survey RINEX control stations (Appledore, Exmouth, Padstow, Plymouth, and Prawle) using Leica GeoOffice software. The data was put into the British National Grid coordinate system; the heights were converted to orthometric heights (OSGM’02 geoid model). The estimated average spatial error is 1.1 cm (Posn, Qlty: 0.0046–0.0174 m; Hgt, Qlty: 0.0077–0.0229 m; Posn, Hgt, Qlty: 0.0096–0.0262 m).
For testing accuracy and comparison with ALS data, one building and one area covered by bracken were documented by GNSS (Global Navigation Satellite System) as well (see Section 2.5.). All procedures of the fieldwork lasted approx. 6h. Taking photos of each section took approx. 30–50 min.

2.4. SfM Point Cloud Generation of the Residential Area

SfM were processed using Agisoft PhotoScan installed on the Workstation PC (CPU: the six-core Intel Core i7, 32 GB RAM DDR4, GPU: Nvidia GeForce GTX 980) which enabled us to shorten the working time. Detailed descriptions of the evaluation process to obtain 3D data have been provided in different places [16,48,50,51,52]. The settings of parameters are available in the Photoscan manual [53] which we used as the most appropriate for this site and demanding output.
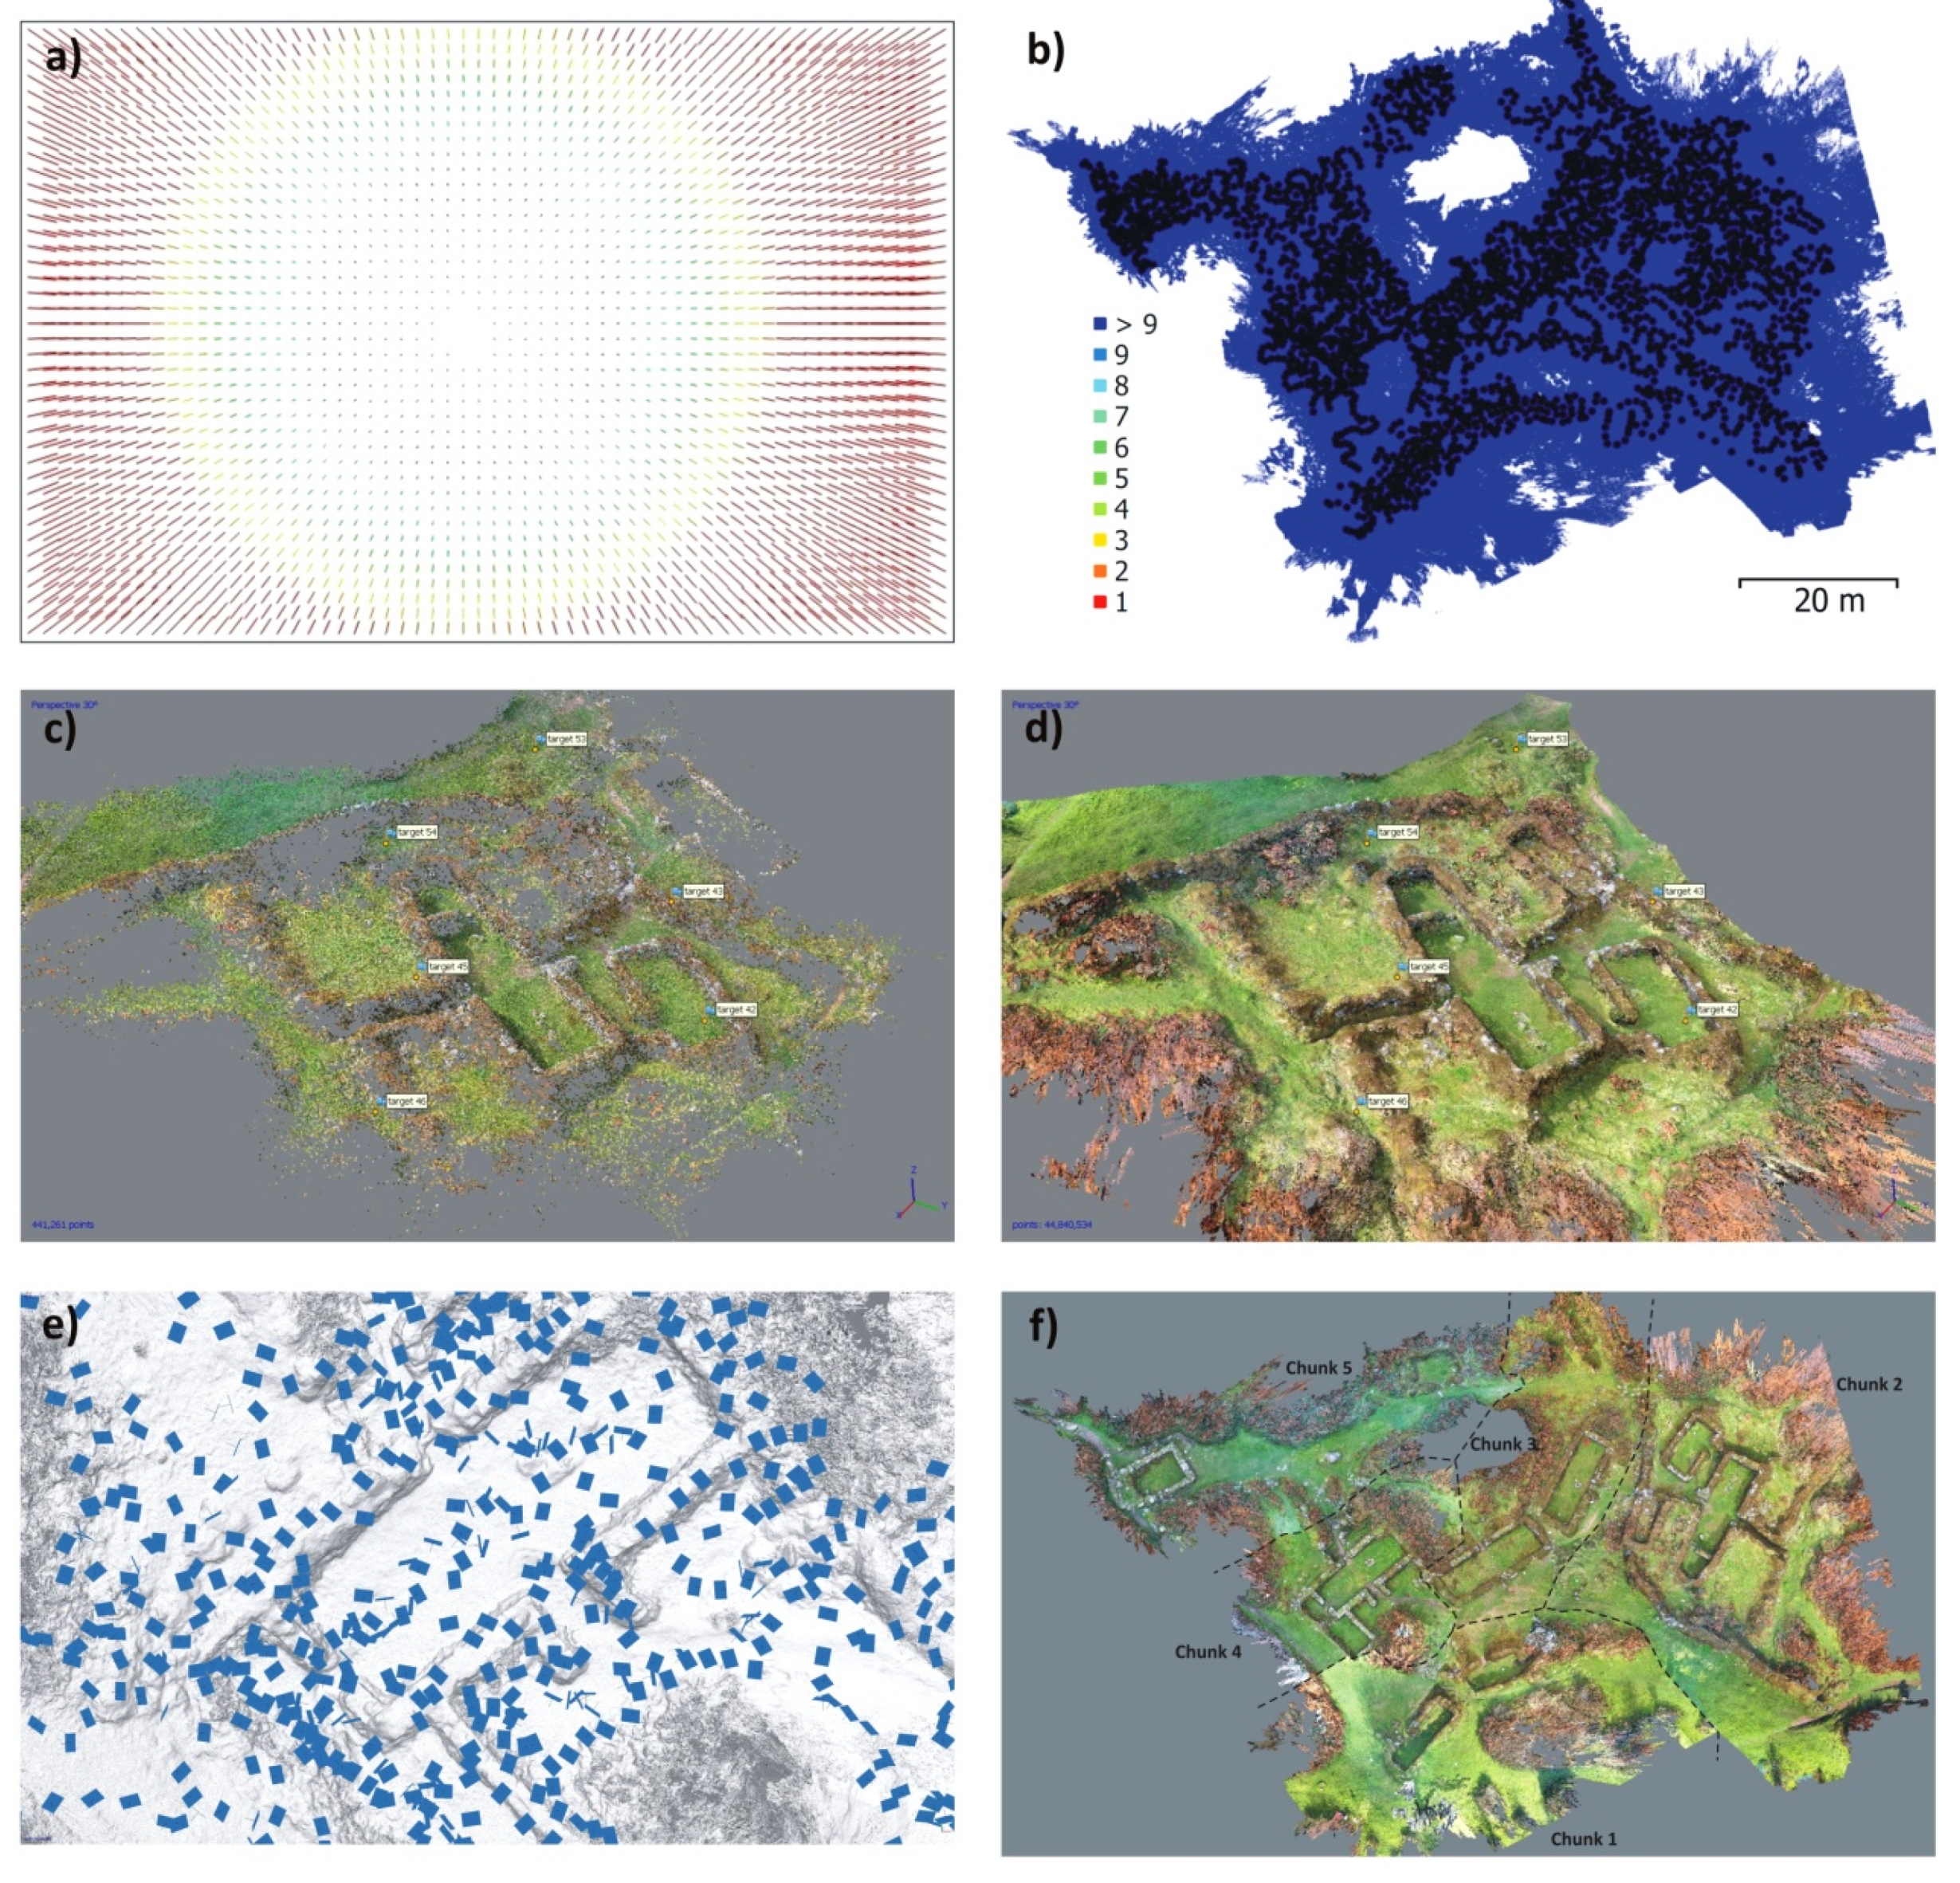
At first, the camera was calibrated using Agisoft Lens 1.4.0 build 5076 (19 September 2017) to reduce the impact of the lens distortion, and thus to achieve higher precision of the final output (Figure 8a). Lens calibration values were obtained for later use during the image processing (see below).
Pole and handheld images were processed together in each section (Figure 8e); sections in the field correspond with the chunks in Agisoft PhotoScan; 5 chunks were processed in total.
For each chunk, the steps were as follows:
  • The images with the lowest quality (e.g., blurry photos) were removed (Estimate Image Quality). Only a negligible number of images from the total collection was not used.
  • In the workflow, images were aligned (Align Photos) in the highest accuracy (Generic preselection and Adaptive camera model fitting were on; key point limit: 50,000, tie point: 5,000). Total machine time was about 1h. As a result, the sparse point cloud was calculated (Figure 8c).
  • Optimization of camera alignment by computed values from the lens calibration for refining and elimination of significant errors of reprojection. The entire chunk was then optimized according to all parameters from the lens calibration. The points were refined thanks to the familiar external and internal orientation of the camera. The calculation time was several seconds.
  • Removing points with a high error of reprojection from the sparse point cloud (Gradual selection–Reprojection error–Reconstruction uncertainty). Calculation time only took dozens of seconds.
  • Detecting the CMs (Tools–Markers–Detect Markers; Figure 8c). Only negligible number of targets had to be manually centred on the marker. The coordinates from GNSS were uploaded for each CM, and the projection of sparse point cloud was georeferenced into the coordinates (British_National_Grid WKID: 27700 Authority: EPSG), and RMSE was calculated (Update; see Section 2.5.). Calculation time was several minutes. CPs were manually found in the images, and their coordinates were exported to the .txt format.
  • The Region was checked whether it was in the correct position, and the dense cloud was built (Build Dense Cloud, quality = medium; filtration algorithm = aggressive; Figure 8d,e). Calculation time was ca. 10h.
  • Far margins of each dense cloud were cut out to ensure their continuous bonding and removing wrong overlays.
Thereafter, the dense clouds of 5 chunks were merged (Merge Chunks–Merge dense clouds; Figure 8f), with the final point cloud consisting of 240,099,763 points in total. However, for the integration with ALS data (see Section 2.6.) the dense cloud had to be exported from the Agisoft Photoscan and reduced/simplified as well because of extremely high hardware requirements. Although we used 32 GB RAM on the Workstation PC, it was impossible to work with it in the following steps. Photoscan allows the decimation only at the mesh creation which we do not need for the integration (furthermore, a vast number of points forming the dense cloud did not allow this step because of limited computer performance).
Therefore, we proposed a specific procedure of export and decimation altogether, which followed these steps:
  • At first, a DEM was built in Photoscan (automatically generated cell size = 0.0052 m).
  • The DEM was exported as the .tiff format. The cell size was changed to 0.1 m.
  • DEM (.tiff) was opened in ArcGIS (ArcMap 10.5.1). Using the Raster to point function, the regular grid of points cloud (0.1 m x 0.1 m) was generated. This point cloud consisted of 902,721 points in total.
  • The Feature to 3D By Attribute enabled us to create 3D features using height values derived from the attribute of the input features, and thus the final point cloud used for the integration with ALS data was prepared (see Section 2.6.).
For the evaluation and visual control of the point cloud, we calculated a Hillshade in ArcMap from the DEM generated in the previous step (Figure 9a). The detail of the model after decimation is comparable with the one based on the original dense point cloud; it is only slightly smoother at maximum zoom. The decimated point cloud enables integration with the ALS point cloud easily.

2.5. Accuracy Analysis and Validation of Outputs

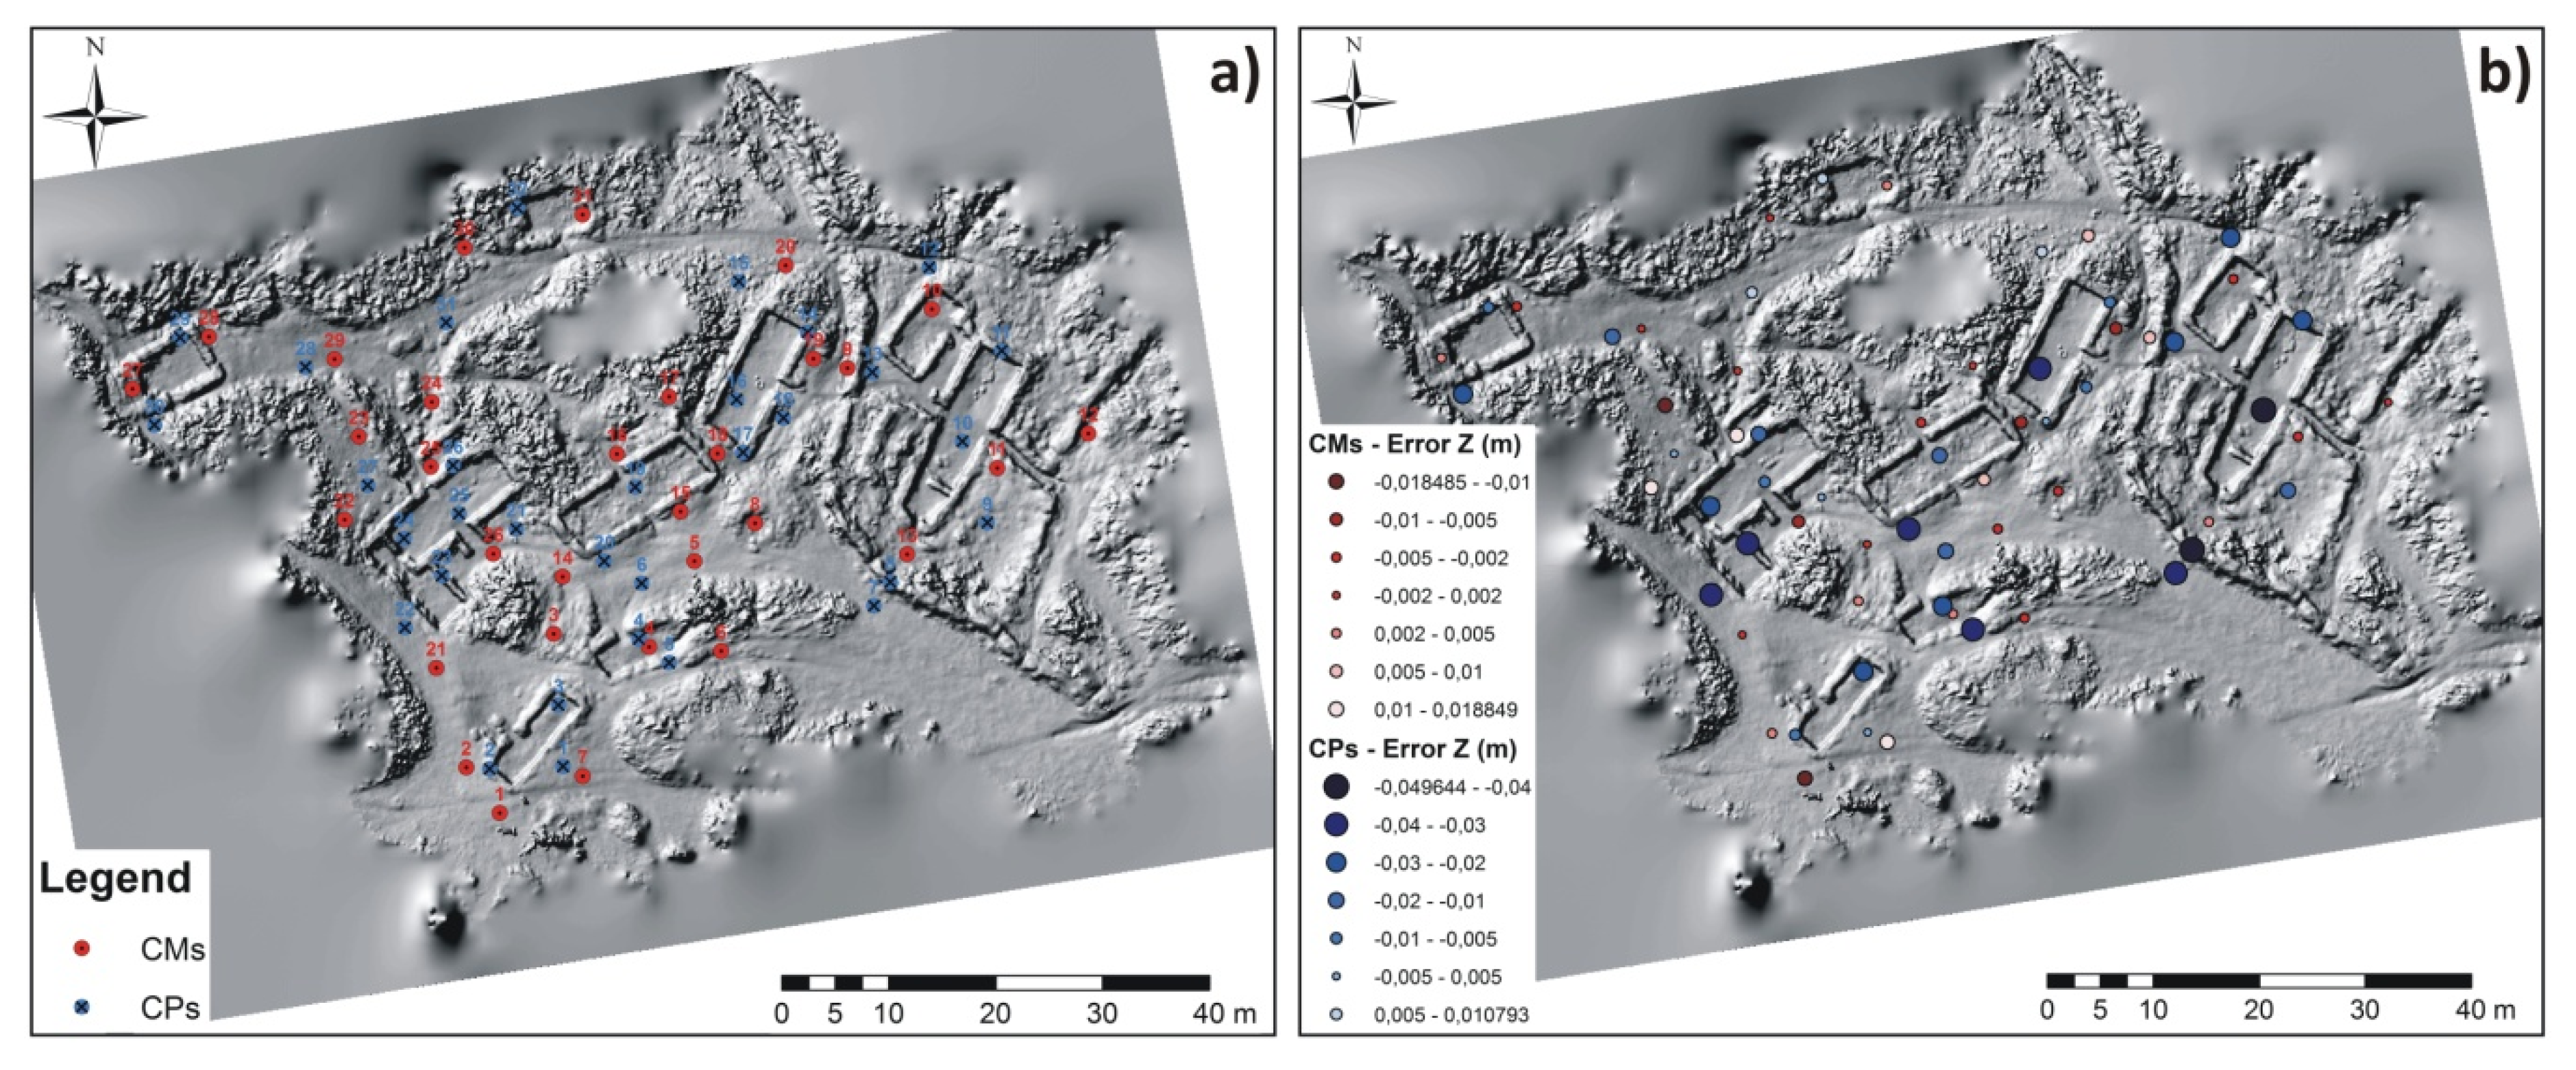
Accuracy analysis of the generated SfM point cloud was performed with the CMs measured by GNSS (Figure 9a). The error was calculated using the RMSE. In total, the error was 1.34 cm (Table 2). Horizontal accuracy of the geo-referenced point cloud was less than 1 cm (error X = 0.83 cm, error Y = 0.77 cm; the maximum error at the point of 18 was 1.98 cm, the minimum error at the point of 20 was 0.02 cm) and vertical accuracy was 0.72 cm (the maximum error at the point of 7 was 1.9 cm, the minimum error at the point of 14 was 0.07 cm; Figure 9b).
In addition, the validation of dense cloud precision was performed using recorded CPs (Figure 9a) which were not included into the georeferencing of the dense cloud, and thus independent. RMSE was used for the error calculation as well. The error was 2.73 cm in total (Table 2). The horizontal precision of the georeferenced point cloud was around 1 cm only (error X = 0.99 cm, error Y = 1.15 cm; the maximum error at the point of 8 was 3.87 cm, the minimum error at the point of 18 was 0.03 cm). The altimetry precision was 2.27 cm (the maximum error at the point of 8 was 4.96 cm; the minimum error at the point of 21 was 0.015 cm). The highest Z errors are equally distributed across the site (Figure 9b).
Results of the analyses indicate that the dense point cloud generated by SfM photogrammetry is very accurate, with only minimal/negligible errors. Placing the CPs among CMs, and also in distinctive positions (e.g., the top of walls) confirms that no deformations exist in the dense point cloud; the height of features corresponds with the real height in the field, only with the negligible difference of several centimetres.
Additionally, it was necessary to test whether ALS data corresponds with SfM point cloud (and thus with the GNSS measurements) to be sure that there is no considerable spatial deflection between them, the final 3D model will reflect the real position of all remains with their correct spatial and height relationships to each other. This was performed in two steps: testing spatial (X and Y) and vertical (Z) accuracy (2 tests):
  • The edge of walls in the inner space of the cott/small house at the southern margin of the residential area was recorded using GNSS. The measured points corresponded precisely to the remains of the house in the DSM; there was no spatial deflection, the measurement had the same orientation, and the longest distance of points from the edge was within a few centimetres maximally.
  • As the relief in several areas (formed by piles of material and disturbed surface) was not visible during the fieldwork because of dense bracken vegetation, we made 26 measurements by GNSS on one of these areas to compare the Z values with the DEM derived from modified point cloud of ALS data with 0.5 m cell size (see Section 2.2.). The results proved that the ALS data was located above the GNSS measurement (min = 1.52 cm, max = 45.57 cm, arithmetic mean = 21.74 cm, median = 23.61 cm). Additionally, ALS points adjacent to the furthest edge of the area documented by SfM were selected to explore the transition of both data sources. As the final SfM output consisted of the regular grid 0.1 m x 0.1 m, the maximal distance of the each ALS point was 7.07 cm (in the case it is exactly in the middle of the grid, however, the distance generally was lower: arithmetic mean = 4.03 cm). Then the elevation (Z values) of the nearest SfM and ALS points were compared. In total, 238 ALS points were assessed locating around the residential area. The results indicated that ALS data was placed slightly higher than the area documented by SfM photogrammetry (arithmetic mean = 14.1 cm, median = 14.7 cm).
The test of spatial accuracy confirmed there was no considerable horizontal deflection between ALS and GNSS data (absolute horizontal error is up to several centimeters only). The remains in the residential area were thus in the correct spatial relationship with those in the field system. However, two tests of vertical accuracy indicated the deflection of both data sources. This was attributed to the vertical accuracy of ALS data (RMSE is ± 15 cm as stated in [43], so the deflection was still in the range), together with accuracy of GNSS measurements (up to 2.3 cm) and also to the inclusion of low vegetation in the ALS data despite its classification as the ‘ground’ as it is very dense in and around the residential area (also other factors such as setting of antenna or the influence of the transformation of the GNSS measurement can at least partly contribute to the deflection). For this reason, we still considered the vertical deflection to be tolerable for the purpose of the final output in which the elevation will not be included, only a specific visualization method. It did not have a significant effect on the height relationships of remains.

2.6. Integration of ALS and SfM Point Clouds and the Generating of the Final 3D Models

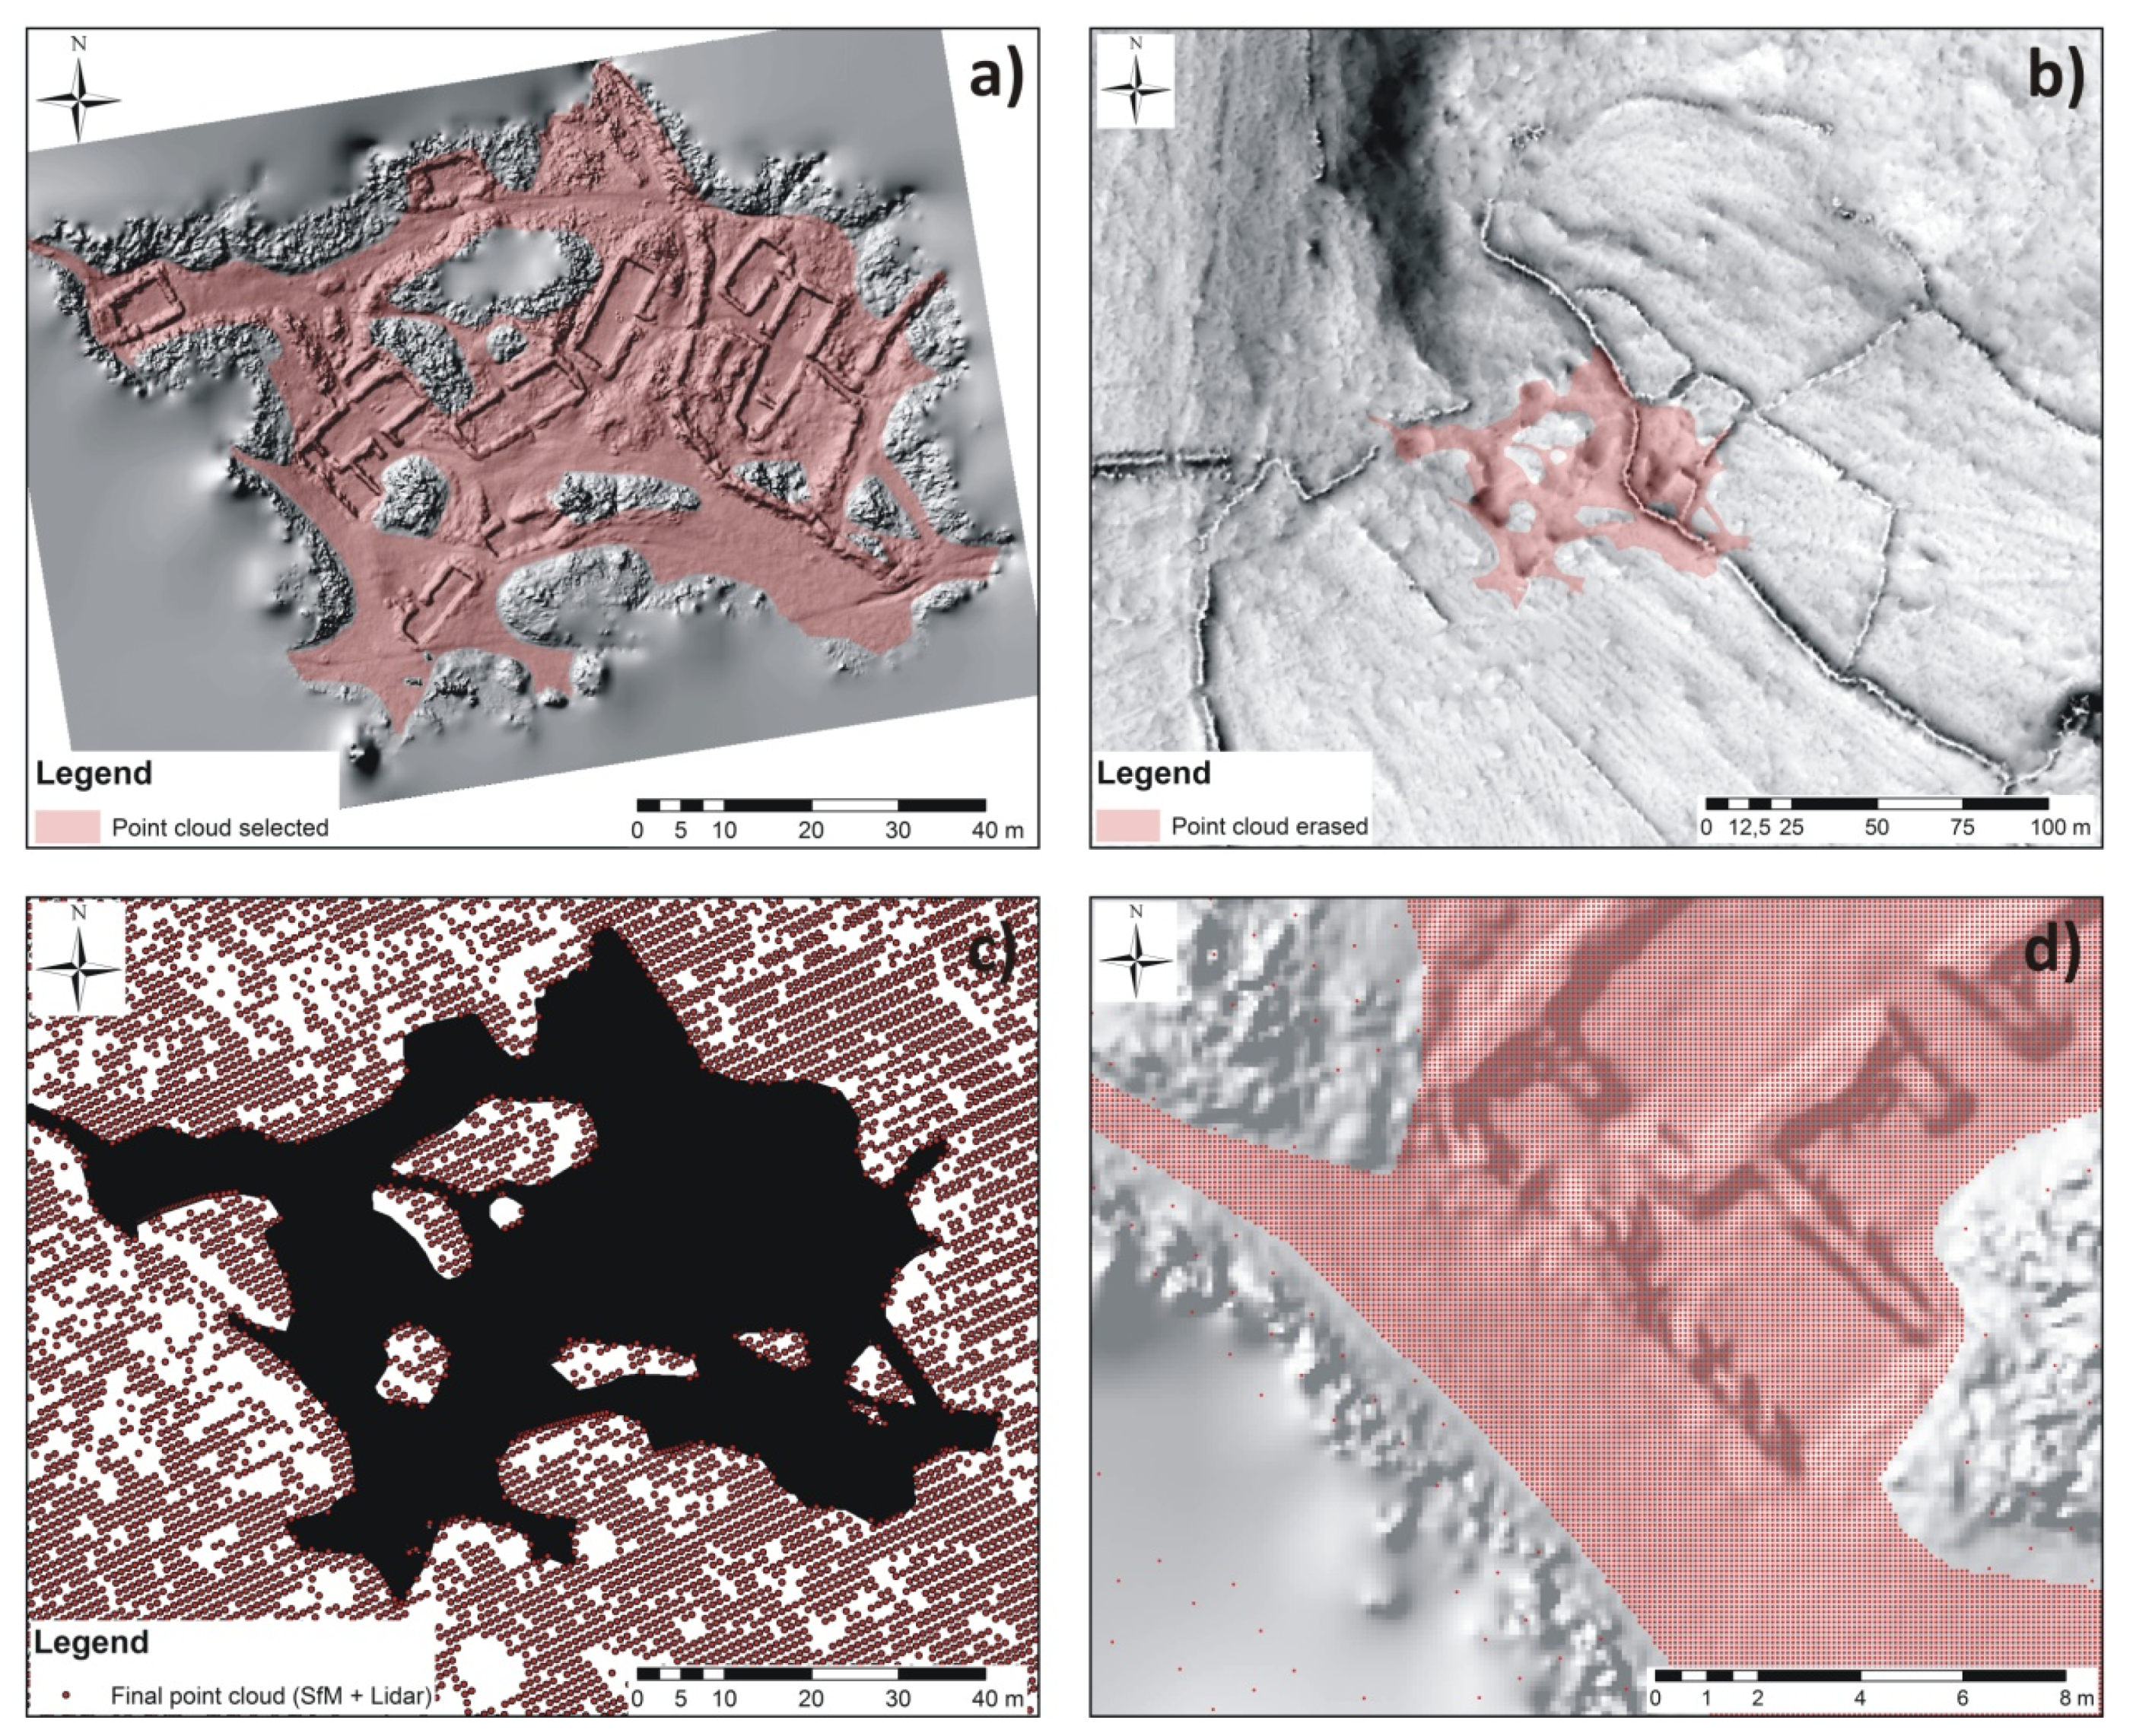
The points representing the relief were selected from the SfM point cloud using the .shp layer mask and Clip in ArcMap (Figure 10a). In this manner, bracken and unrecorded areas were removed from the point cloud, so only points representing the relief and building remains and other structures in the residential area were left. As both point clouds were in the same coordinate system (British National Grid), the same .shp layer mask was used to delete points in the ALS data (Erase). This means that the points covering all buildings and structures as well as the relief in the residential area were removed while areas with bracken and undocumented areas for the SfM were left there, together with the whole surroundings of the settlement. Both dense point clouds were, therefore, complementary; ALS data records the entire hinterland, and the bare ground under vegetation in the residential area, while the SfM point cloud represents all remains of the settlement in the highest detail. Both point clouds were then simply merged into one layer (Merge; Figure 10b). In the residential area, a significant contrast of the point density was apparent (Figure 10c,d). However, except for one corn-drying barn and parts of fencing walls, any considerable structures were not under bracken as this was tested during the fieldwork; usually, there were only debris and disturbed relief. ALS points were thus sufficient to record the general vertical articulation of these areas and the essential remains (stone walls of buildings) documented by the SfM were pointed out.
The two final outputs were prepared:
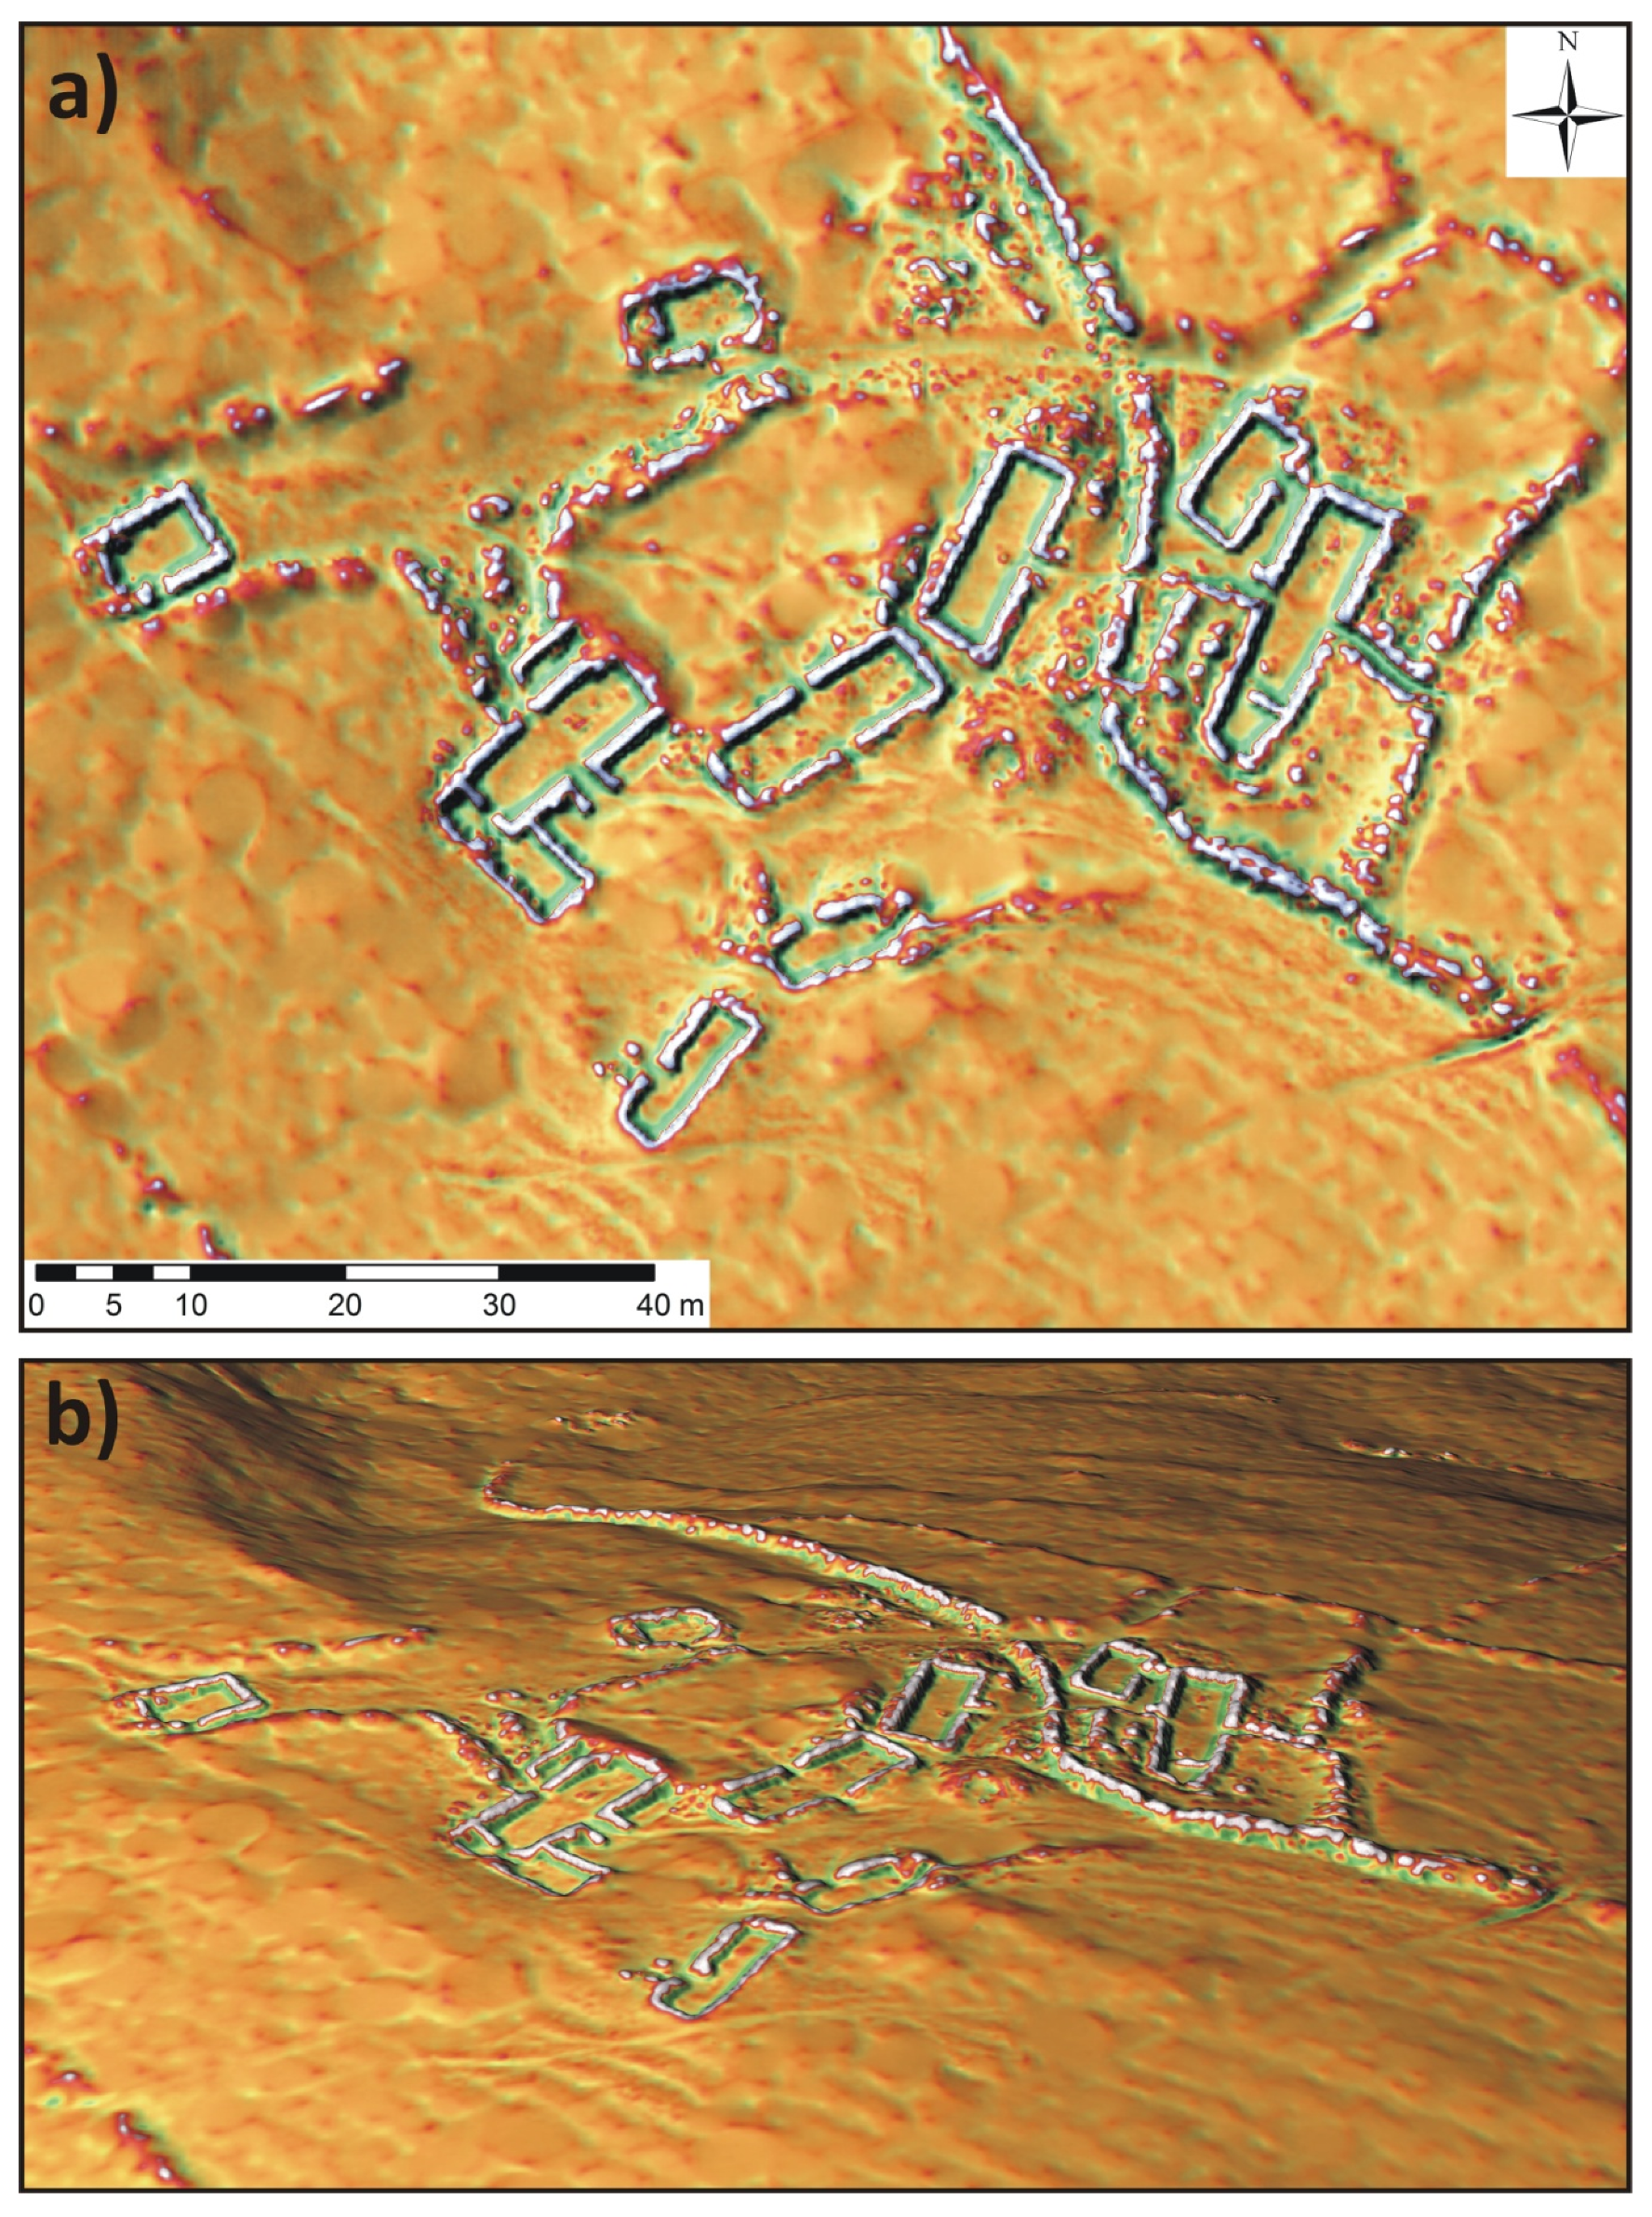
  • The 3D model including the residential area and the closest surroundings (422 × 355 m tile) only to ensure all buildings and structures documented by SfM were recorded in the highest possible detail. Due to the high resolution of the DEM interpolated from points in ArcMap, sharp transitions between ALS and SfM point clouds emerged in a few places (because of vegetation in the residential area and the vertical deflection between them, see Section 2.5.). This was apparent especially in the southern part where the mostly the flat relief of bare ground occurs. Therefore, the point cloud covering this area was first exported from ArcMap (ASCII format) and uploaded to Geomagic Wrap 2018 [54] allowing local smoothing through the creation of the polygon mesh. The smooth transition of data in problematic parts was thus ensured. Derived point cloud was then uploaded back to ArcMap (ASCII format) and interpolated into the DEM using Natural Neighbor algorithm; the cell size was 0.1 m. For the visualization of the earthworks and architectural debris, Local Relief Model (LRM) in planlauf/TERRAIN 2018 R2 software [55] was used (Figure 11a,b).
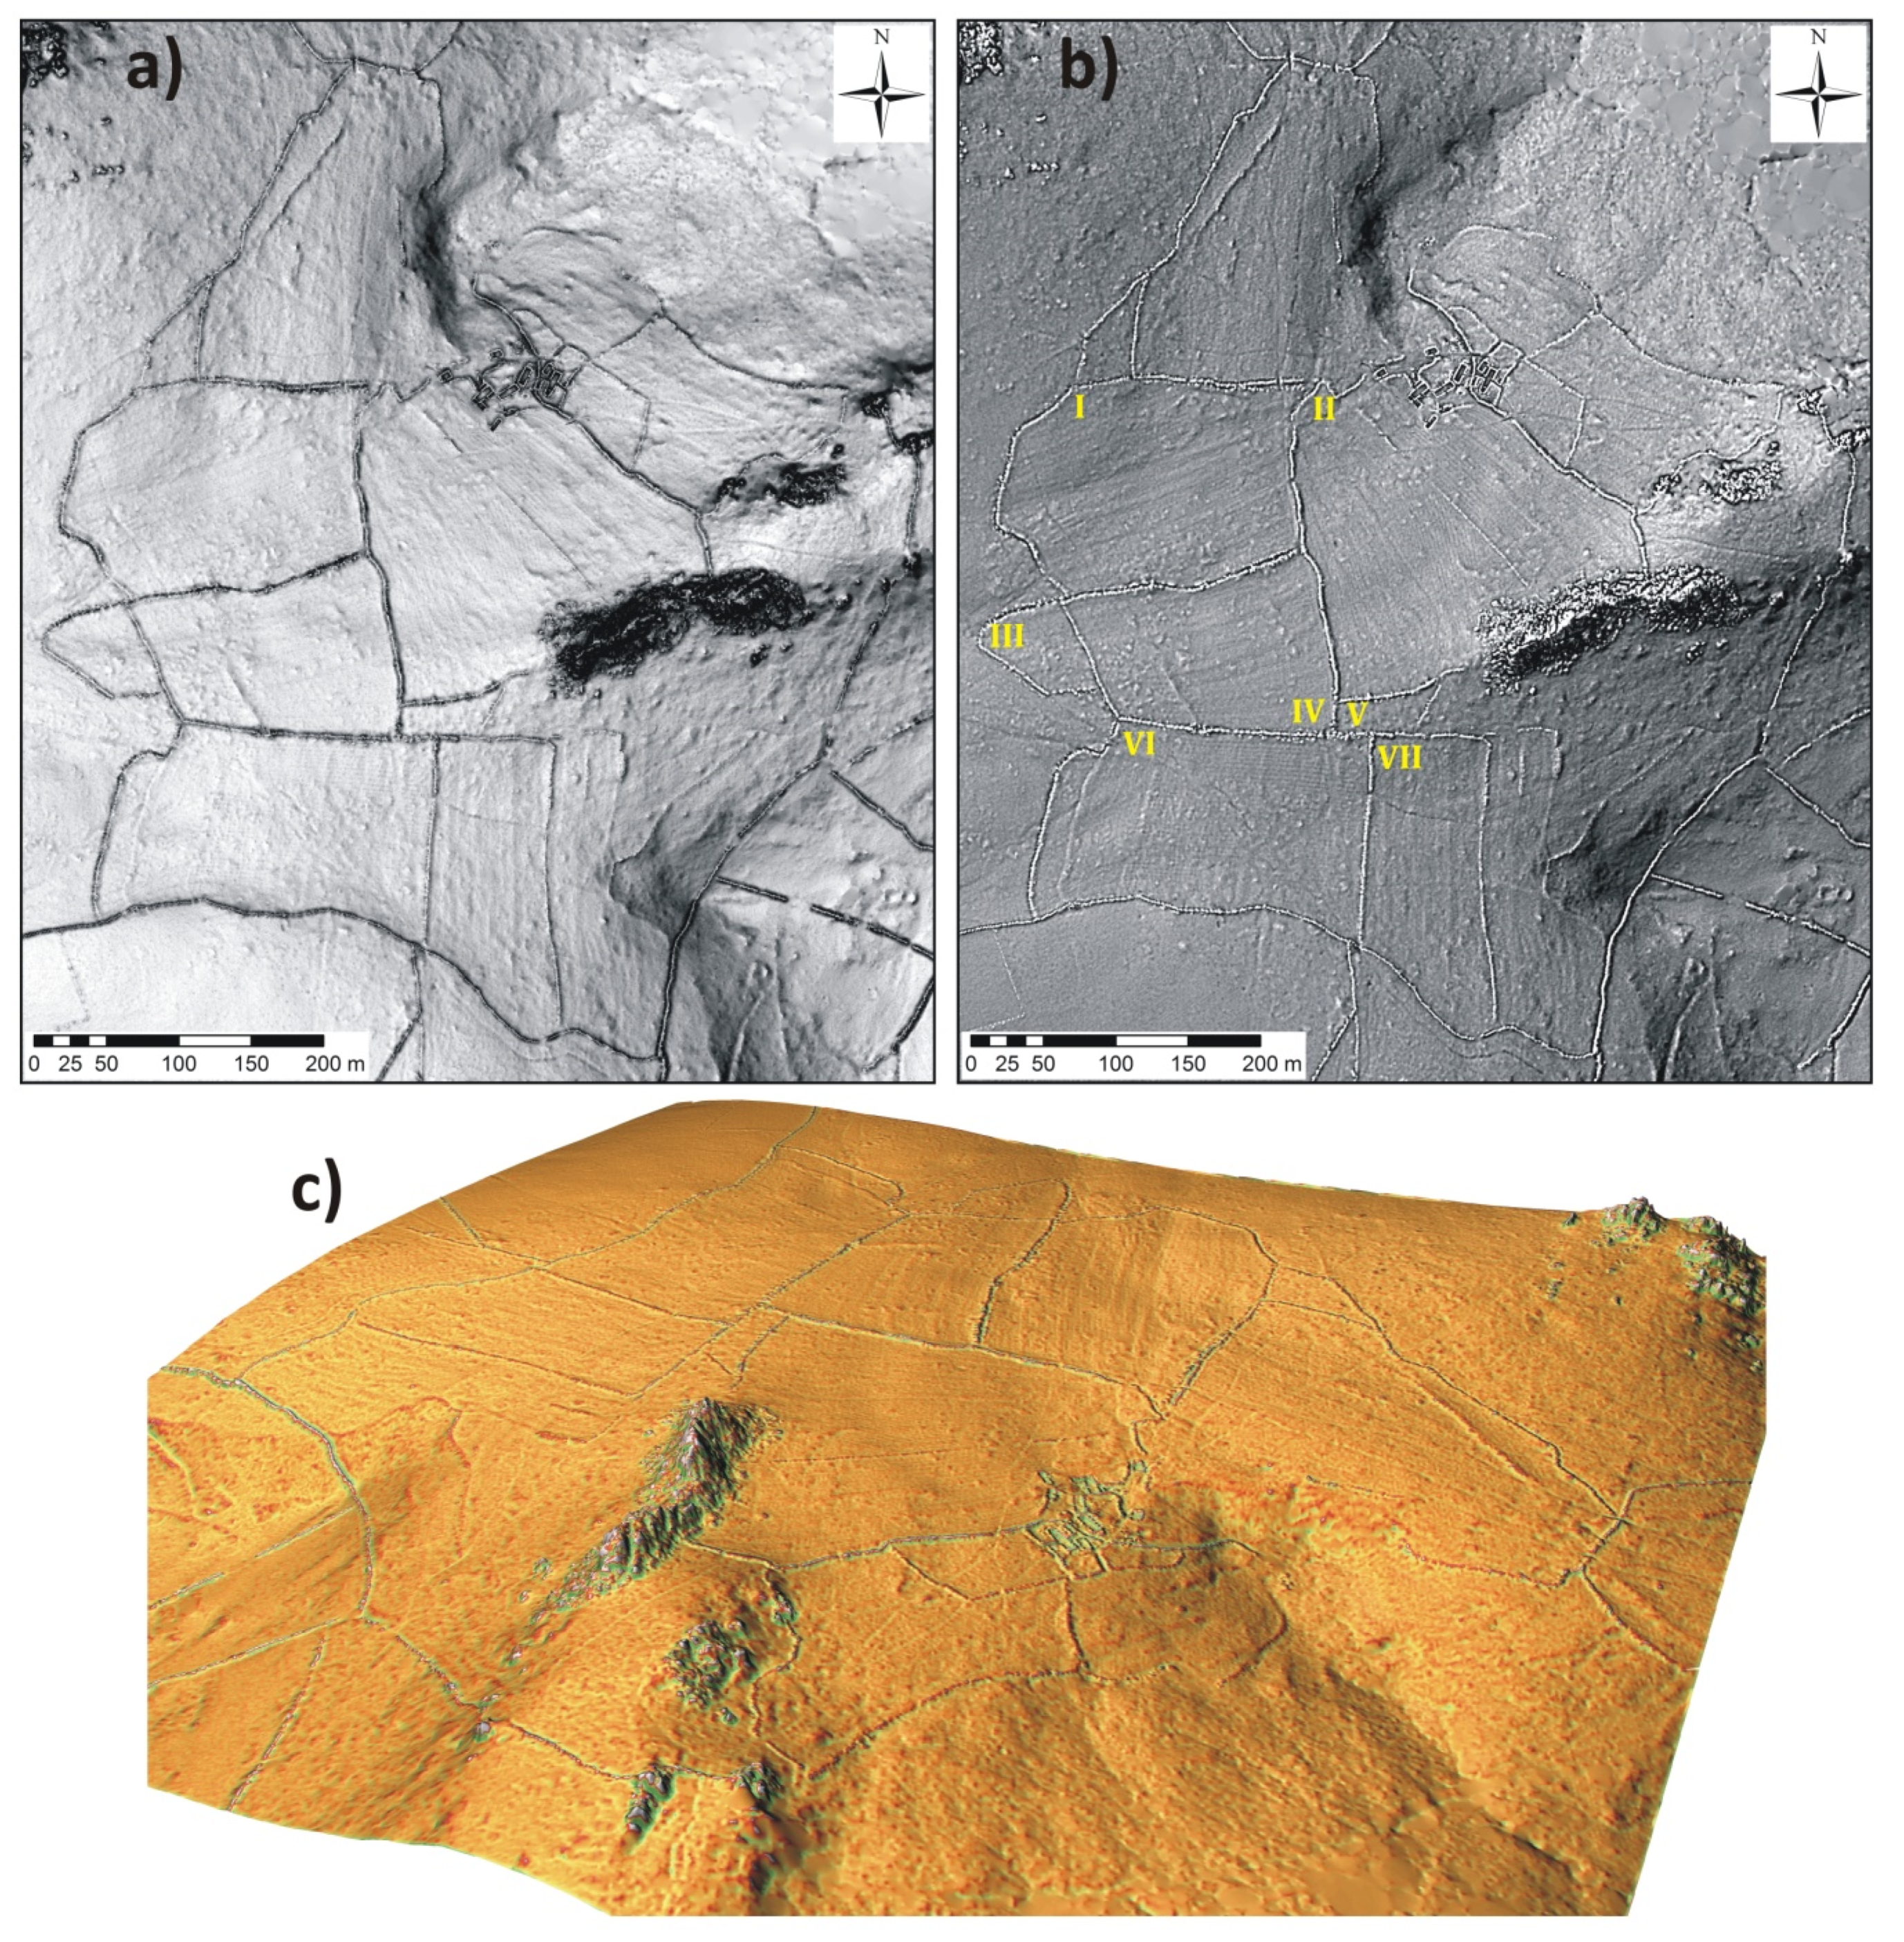
  • The 3D model of the whole study area covering the complete hinterland and its surroundings (790 × 705 m tile). The final, merged point cloud was directly interpolated in ArcMap (Natural Neighbor algorithm) with a cell size of 0.25 m. For the visualization, the Sky-view Factor applied in RVT 1.3 [45,46], and LRM in planlauf/TERRAIN 2018 R2 software [55] were used (Figure 12a–c).
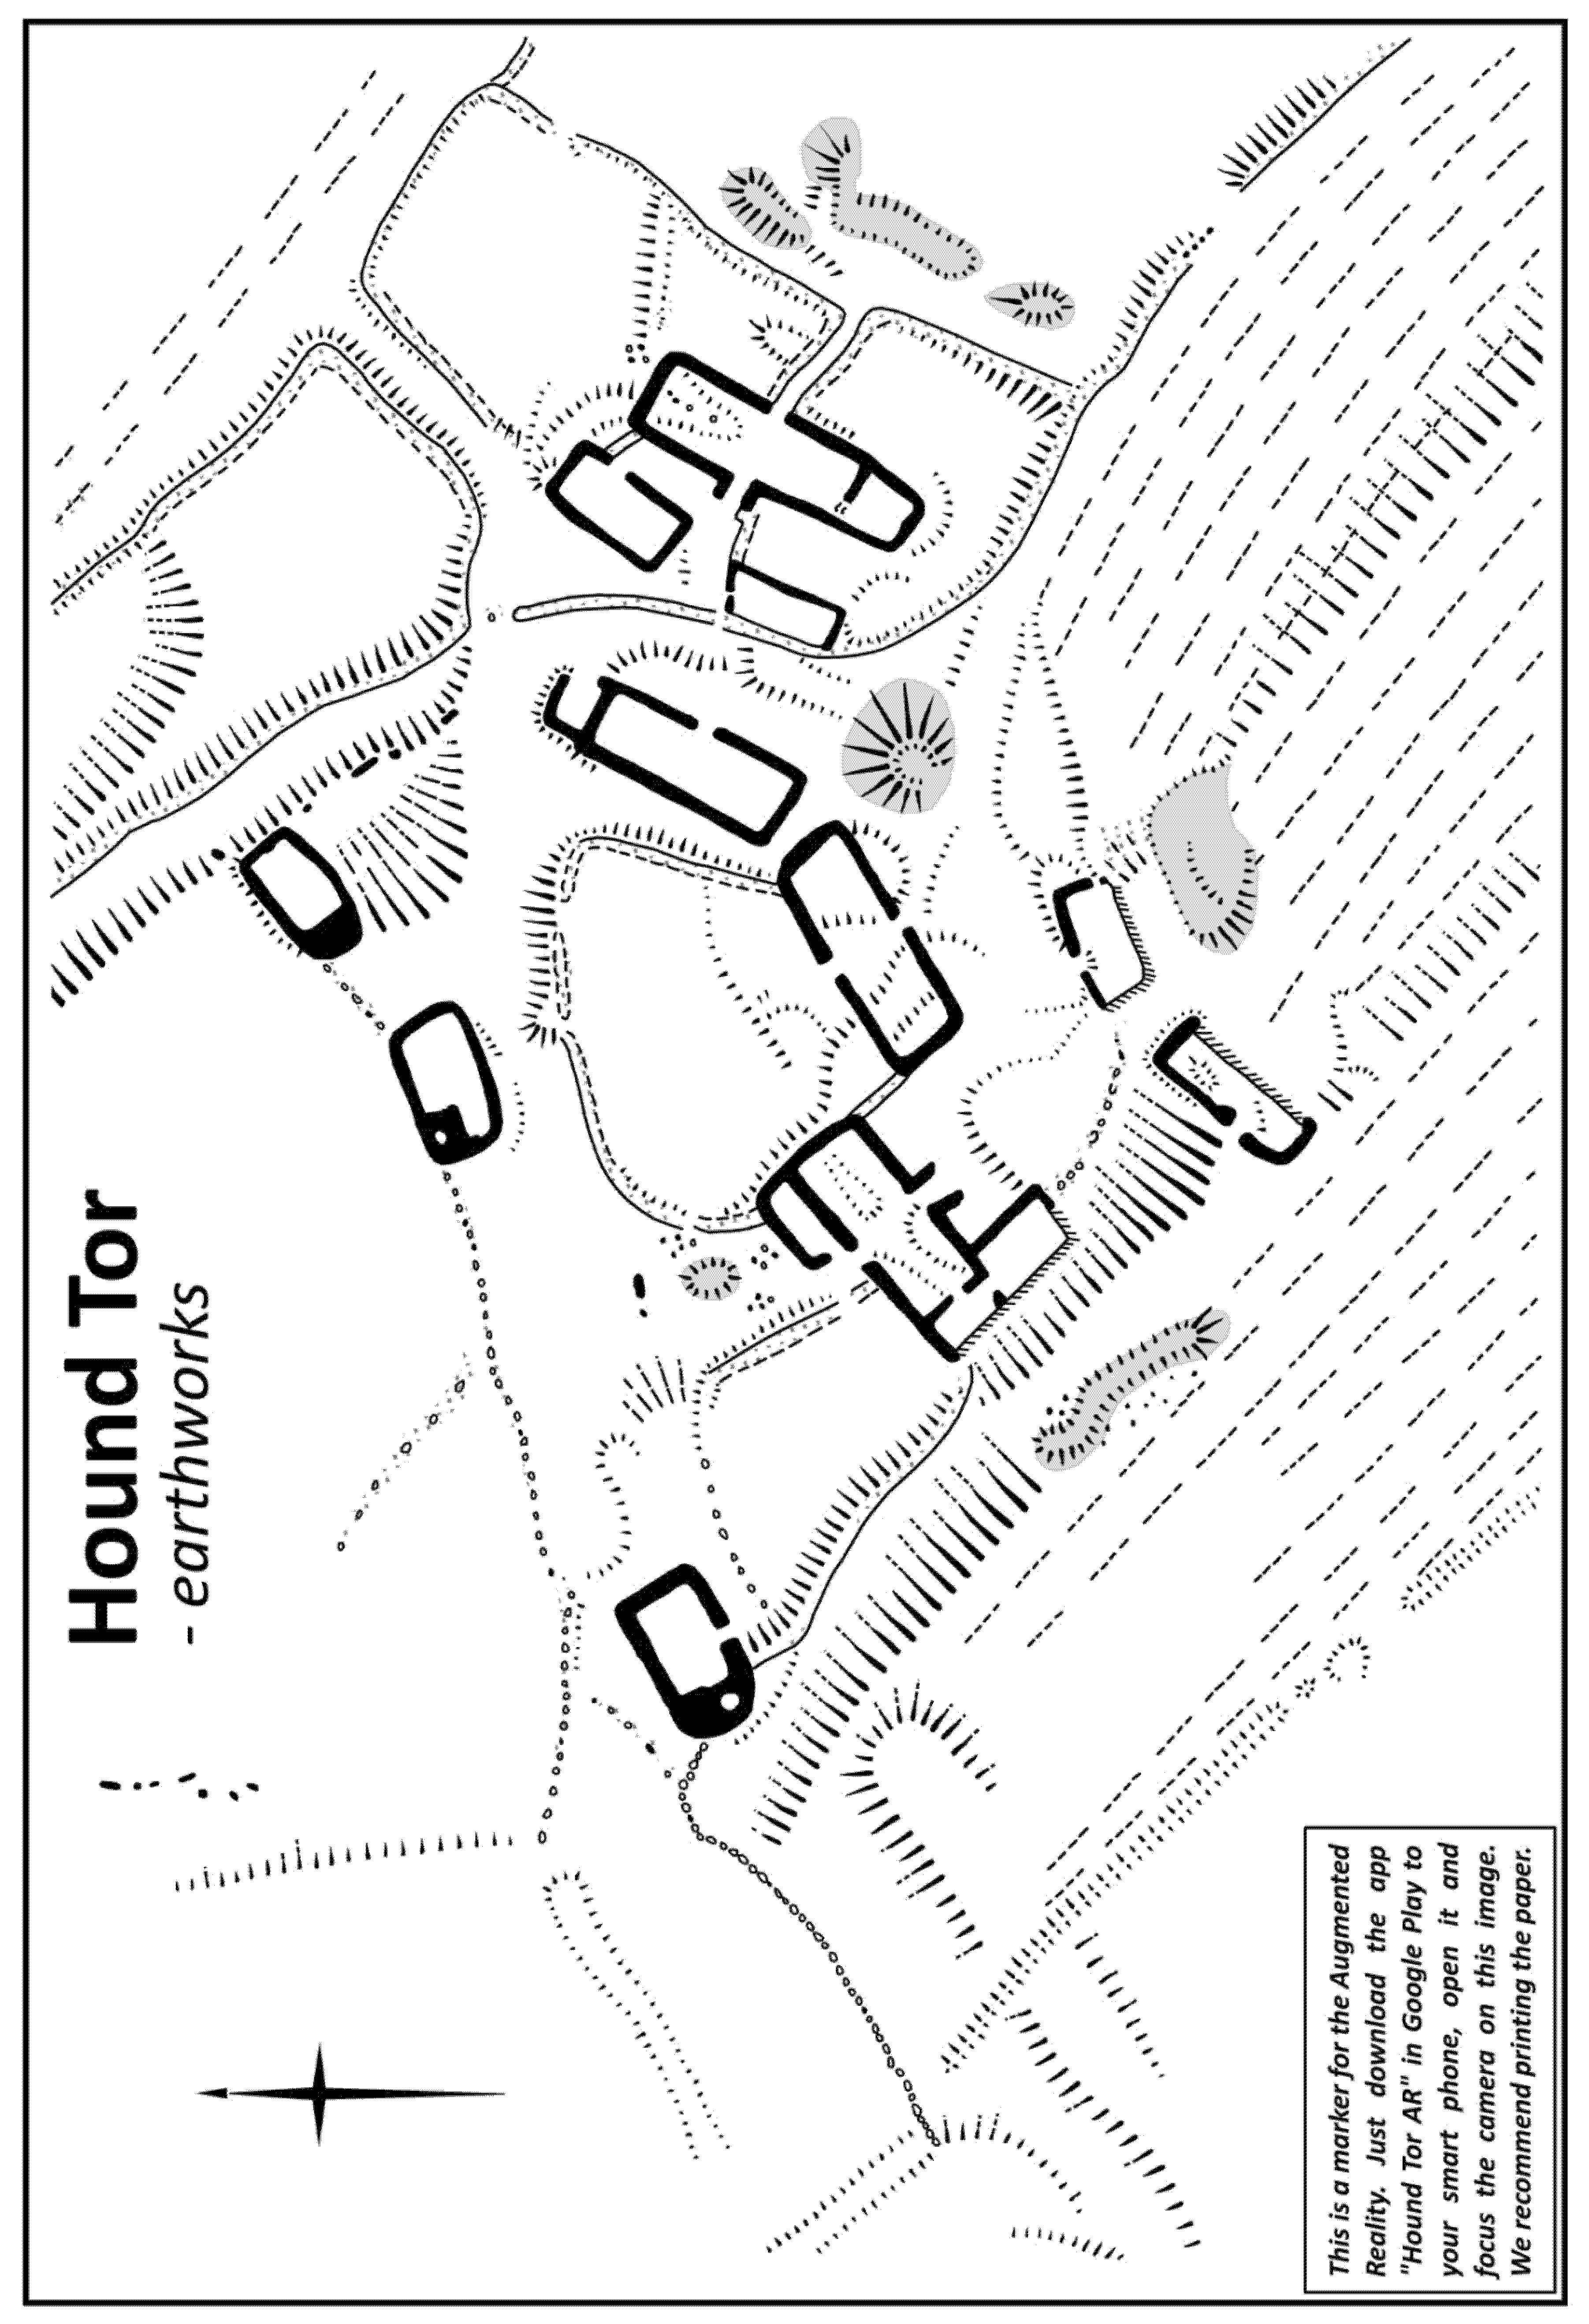
Additionally, the presentation of 3D data was prepared as well. The 3D models were exported from the planlauf/TERRAIN software and Geomagic Wrap 2018 in the .obj format and uploaded into Sketchfab [56] allowing the 3D visualization of the site. The 3D model was also presented via augmented reality. For this purpose, we used the plan of earthworks as a marker (Figure A1) and freely available software Unity 2018.1 Personal [57] and Vuforia Engine 7.1 [58] to build an Android application ‘Hound Tor AR’ downloadable on Google Play [59].

3. Results

As a result of data processing and integration of ALS and SfM point clouds, the detailed 3D model of the residential area was integrated into the wider landscape and thus the complete 3D documentation of the deserted settlement of Hound Tor has been provided. The final, enhanced 3D model surpasses the DTM and DSM generated from low resolution ALS data as it contains all kinds of preserved remains while vegetation is entirely filtered out from the output. The remains of buildings in the residential area were recorded with a high detail together with the enclosures in the hinterland (both initially completely removed in the available DTM) and less distinctive earthworks as well (lynchets and ridge-and-furrow, which are detracted in the DSM because of low vegetation covering the relief in many areas there). The remains are visible together with the (micro)topography in the 3D model, allowing us to observe the character of the whole landscape.
The testing of the spatial error of the SfM point cloud confirmed that the generated 3D model of the residential area is very accurate and precise, corresponding with the real heights and shapes of the remains in the field. Although the SfM point cloud was decimated for the integration with ALS point cloud, the final 3D model is still much more detailed than models derived from freely available ALS data (see Figure 4c,d). Building remains are very distinct with clearly visible side walls, layouts and internal divisions of houses and their entrances (Figure 11). Such elements like drainage channels in the lower part of two long-houses and kilns in corn-drying barns are apparent as well together with recent interventions/disruptions such as a fireplace in the middle of the building or current intensely-used pathways among the structures and over the ridge-and-furrow south of the residential area. The 3D model also includes other structures on the site such as earthworks (piles of material, disturbed surface) and fencing walls delimiting gardens and yards. The LRM visualization (implemented in planlauf/TERRAIN 2018 R2) indicates the height of the remains and, thus, their prominence over the local relief. However, the inner structure of the residential area is still not as clear as in the ground plan (see Figure 4a, Figure A1). Although it is not possible to exclude changes on the site (e.g., disruption of some structures) as time has passed since the ground-plan was created, the main reason is that dense bracken vegetation covered some structures on the site (especially parts of the fencing walls) during the photogrammetric documentation, and the relief was invisible there. Therefore, they are recorded by ALS point cloud in the 3D model. As its density is much lower than for SfM point cloud, impossible to precisely capture the real shape of structures, these remains are not recorded in sufficient detail, but rather only indicated. For the same reason, the most significant limitation of the provided 3D model has emerged—one corn-drying barn is completely missing there as its full extent was under dense bracken vegetation during the fieldwork; we did not make (without the necessary permission) any modification of the site. Its shape is apparent in the northern margin of the residential area and demonstrates the poor quality of low-resolution ALS point cloud recording the building remains on the site. Only in such cases is the transition between ALS and SfM data visible, as it is smooth elsewhere; for instance, ridge-and-furrow directly adjacent to the residential area from the south are recorded by SfM, and they are only a little sharper than their continuation covered by ALS point cloud.
The 3D model of the whole area surpasses the freely distributed ALS products (see Figure 5c,d) especially in the clear visibility of all types of remains. The field enclosures are very well distinguishable (especially in the Sky-view factor visualization; Figure 12a) even if they are disturbed and not very prominent in the field; in several parts, ditches following the banks are also possible to decipher. Due to this, particular field plots and the complete field pattern are apparent. The 3D model generally corresponds with the 2D plan of the site (see Figure 5a). However, the shape of some field plots is slightly different; the plan is probably only schematic (for instance in the south-west corner) or generalized as it does not record the exact outline of some enclosures. Although most of the less distinctive remains such as lynchets and ridge-and-furrow are very hard to decipher in the field, they are easy to identify in the 3D model, especially in the LRM visualization (Figure 12b,c). The remains of slight lynchets had not been previously identified as they are not displayed in the 2D plan of the field system (see Figure 5a). Contrary to the plan, lynchets fill the entire field plot adjacent to the residential area from the south (Figure 12b, marked by II) and they also occur in the three large field plots in the western–south-western part of the hinterland (I, IV, VI). In the south-western corner (VI), they run in SSW–NNE direction which is the same as the neighbouring field plot in the east (VII), where these remains are depicted in the plan. In both western field plots (I, IV) the orientation of the lynchets is WSW–ENE, and they are slightly arched (C-shape). Additionally, there is an indication that the lynchets run into the trapezoidal protrusion delimited by the enclosures in the west margin (III) and thus they are ‘statigraphically under’ them. However, the situation is not clear enough, the linear forms are difficult to see in both types of visualization, and the thorough ground-truthing (and removal of the dense bracken there) is necessary to confirm or reject this statement. An occurrence of the areas with ridge-and-furrow is also different from the results of previous field surveys. They should be located in the central, western and south-western part of the hinterland (see Figure 5a–corresponding with labels I–VI in the Figure 12b). However, they are undoubtedly in the field plots labelled by I, II and VI only; they are definitely absent in the small trapezoidal field plots (III, V); in the section labelled with IV, they are either not too perspicuous or missing as well–the very slight lines that may indicate them have to be verified by the field survey. In addition to that, ridge-and-furrow does not cover the full extent of the south-west field plot (VI), but only two-thirds of the area. The superposition of the lynchets and ridge-and-furrow is evident in the sections I, II and VI; their course is almost parallel in I and II (especially in the lower part adjacent to the residential area); the orientation in VI is perpendicular. The Figure 12c displays the topography of the whole area placed on the mild slope with rising rocks, stretching the settlement and adjacent field plot above the spring area bounded by a steep slope. In addition to all relics, this area is also intersected by the network of footpaths which are also very well visible, especially in LRM (for instance the main access route from the peak of Hound Tor to the residential area).

4. Discussion

Freely distributed ALS data is undoubtedly a very useful data source in archaeology as it is often the only one available for the particular site/area. However, it is necessary to take into account that it is usually provided in low resolution only, and thus a considerable number of earthworks and other remains of past human activities may be completely left out or not be recorded in sufficient detail. Overcoming or mitigating the deficiencies of these ALS products by integrating with other procedures and thus creating enhanced 3D models is not, so far, a common practice despite the fact that a number of different techniques can currently be easily implemented. Their selection and use is dependent on the character of the site, the primary purpose of the output, and the budget that determines the available equipment. Integration of various techniques and multi-sensor data to ensure that the models are detailed, accurate, precise and thus credible is an increasingly common procedure in the field of 3D modeling [21,22,23,24,25,26,27,28,29,30].
The procedure of ALS and SfM point clouds integration proposed here radically increases the quality of freely available ALS data. The reliable 3D models of the whole area of deserted Hound Tor were created utilizing the advantages of both techniques. In addition, given the circumstances of the research (freely-available ALS data for Hound Tor, suitable conditions for SfM photogrammetry in the residential area, impossibility to use UAV for photo-documentation), the procedure has only minimal budget requirements; there is no need for any specific equipment. In the field, just a camera, a pole and a GNSS station were used; in the data processing, only Photoscan has got a paid license, which is rather cheap, especially for an academic institution (open-source software packages are available for SfM photogrammetry as well). We used very expensive ArcMap for particular steps in data integration (with an institutional license) because we are used to it from the university environment, but all operations can be easily replicated in open-source GIS. Other software used for the editing of the point cloud, visualization, and the augmented reality is open-source (although some of them were trial versions with time-limited availability). The reclassification of ALS point cloud was easy to do although it requires several hours of manual editing. The application of SfM was as fast and effective as many papers confirm; the fieldwork lasted up to one working day in total, although the residential area has significant architectural debris over the area to a considerable extent. The most time-consuming part was to find the optimal way to integrate both data sources. However, when we found a solution, the iteration of the entire process from the acquired images up to the final outputs only took a few days in total, mainly because of hardware requirements for the SfM processing. Generally, the evaluation of data and preparation of enhanced 3D model is not a complicated long-term process. It can be readily adopted by museums, or local heritage organizations, which are usually confronted with limited budget and equipment and applied widely to acquire 3D documentation of complex sites consisting of variable remains (architectural debris and different types of earthworks) even though (partly) covered with vegetation. It is the most effective and efficient way to include high detail elements into the wider landscape context wherever the ALS data is available.
There are other techniques or procedures able to generate more detailed 3D models of the residential area than the one provided in this paper. Primarily, terrestrial laser scanning is an advantageous and effective technique (for instance Faro Focus is currently being used combined with vertical and oblique images); however, the budget would be much higher compared to the procedure we have applied. Using UAV SfM photogrammetry would undoubtedly shorten the fieldwork, but it always demands permission or compliance with specific conditions (as in this case) which are becoming ever more extensive and strict in many places. Also, the quality of the output (detail, accuracy, and precision) is dependent on the camera used for documentation; frequently used UAVs are limited by payload capability, mostly with an integrated camera taking lower-quality images than the DSLR camera we attached to the pole. UAVs that allow connecting a high-quality camera (and eventually ALS or multi-spectral sensors) are a significant item in the budget.
It would be also possible to document the whole site (including hinterland) by a single technique only to avoid integration of different data sources. However, the use of UAV SfM photogrammetry for such a large area demands extraordinary hardware requirements to provide a model with sufficient details. In addition, low and dense vegetation covering the area throughout the year is an additional problem, making it impossible to see the bare ground, and thus to record earthworks located there. ALS data with a high point density (dozens of points per square metre) would increase the visibility of the earthworks in the hinterland, and may reveal others which are not recorded by low-resolution ALS data. However, we are convinced that the documentation of the residential area would not exceed the existing 3D model provided by SfM photogrammetry regarding its quality, details, accuracy, and precision while the budget would be much higher.
We must critically admit that we do not provide the highest quality models we could have created by the applied procedure. One building (corn-drying barn) is completely missing; some walls are not recorded in sufficient detail, both because of dense bracken covering these remains which is making their documentation by SfM photogrammetry impossible. These deficiencies can only be eliminated by repeating the whole procedure after the removal of all vegetation from the entire residential area and exposing all currently hidden structures. Only this intervention will ensure that the 3D model accurately represents the real shape of all remains, unlike the one presented here. Nevertheless, both final outputs presented here have broad applicability, especially in the three main spheres:
Enrichment of the State of the Art: removing vegetation from the 3D model but maintaining all types of remains enables researchers to determine the location of lynchets and the extent of ridge-and-furrow. The enhanced 3D model of the whole area does not exactly correspond with the results of previous surveys and existing plan of the field system. Although the interpretation of structures is not clear everywhere (only verification during a thorough field survey can resolve it which is however extremely difficult due to the presence of dense low vegetation throughout the year), this newly acquired 3D model constitutes a background for the reconstruction of past land-use and landscape development. Reflecting on the known history of the site, the sequence of human activities and their spatial organization can be determined and reassessed if necessary (this issue is beyond the scope of this paper). This output has a broad analytical potential regarding exploration of the topography or the relationship of the residential area with its surroundings.
Outreach: the 3D models enable the presentation of archaeological sites to the general public in an unconventional and attractive way. Various types of representation for Hound Tor are possible instead of existing outputs presented so far, such as standard 2D plans and photos of remains. The 3D model of the site can be viewed on the web, for instance via the link to the Sketchfab [56]. Therefore, the presentation is not limited to derived 2D outputs whose form and angle of view are a choice of the author. The site can also be printed on a 3D printer to obtain a physical representation at a particular scale. An advanced way of data presentation is through augmented reality. Using the 2D ground plan of the residential area as a marker (Figure A1) allows the real perception of the remains and relief in 3D via a smartphone or a tablet. This form of presentation can be applied directly at the site using an information board with any kind of marker, e.g., [60]; after downloading the designed application, the visitor will immediately gain an overall vision of all remains and topographic setting of the site. In the case of Hound Tor, not only can the preserved relics of buildings, but also its wider archaeological landscape with different remains, be perceived. A further issue is the reconstruction of buildings and the original state of the settlement presented directly on the ground-plan using augmented reality.
Heritage management: several tests confirmed that the 3D model of the residential area is very accurate and precise. Nevertheless, a much more detailed model than we used for integration with ALS data is available (see Section 2.4.). In case of any damage or disruption of the site, its accurate virtual representation (except for one corn-drying house) is preserved as of the date of 22/10/17 when the site was documented. Due to the easy acquisition of accurate 3D models, it is possible to regularly monitor the state of preservation of archaeological sites and to detect any potential damage (for instance erosion at the site or disruption of relics) according to the changes in the 3D model (using the residual model) [61] (p. 27), cf. [62,63]. On this basis, different strategies of site management can be proposed in the future for its better preservation. Similarly, changes of remains in the hinterland can also be detected by ALS data, although it depends on its availability. For this purpose, increased attention must be paid to the thorough (re)classification of the point cloud as suggested in the paper. The procedure of SfM and ALS data integration can be applied to other contexts than Dartmoor—also for areas under woodland canopies as the typical environment where various sites are preserved in the relief (potentially with architectural debris), often with their hinterland or fossilized landscapes. However, some extra time is needed for removing tree trunks from the SfM point cloud. ALS data which is increasingly freely available for ever larger territories, as well as massive hardware and software development, radically extend the use of this procedure. This cost-effective 3D representation of complex sites, consisting of architectural debris and various kinds of remains in the surrounding landscape, can guarantee at least its virtual preservation before any potential damage occurs.

5. Conclusions

The procedure of freely available airborne laser scanning (ALS) and structure from motion (SfM) data integration proposed in the paper allowed the creation of an enhanced 3D model of the Hound Tor medieval settlement and its hinterland. Although it is still not a commonly used practice in archaeology (unlike the frequent combining of terrestrial laser scanning with images and photogrammetry), the outputs demonstrate its considerable potential in the documentation of archaeological landscape as it radically increases the quality of the DTM and the DSM derived from low-resolution ALS data. All different types of remains in the whole area of Hound Tor were recorded, including architectural debris of buildings in the residential area together with field enclosures, lynchets, and ridge-and-furrow in the hinterland. Therefore, the 3D models provided are reliable, detailed, accurate, and precise, reflecting the real situation and actual state of preserved features as much as possible. Nevertheless, the final outputs have several limitations as well; one corn-drying barn and several parts of fencing walls could not be documented by SfM photogrammetry because they were covered by dense vegetation. Therefore, we argue that SfM and the procedure of data integration should be repeated after the removal of all vegetation in the residential area to acquire the 3D documentation without any limitations. However, the existing enhanced 3D models still have broad applicability for a better understanding of the site (the location of lynchets and the extent of ridge-and-furrow was precisely determined contrary to the previous surveys); its management (the state of preservation can be monitored to detect its potential damage); and presentation to the general public (the augmented reality allows a real perception of the remains and relief in an unconventional and attractive way). The whole procedure (including fieldwork, processing of ALS data and SfM, data integration and preparing the final 3D models with their specific visualization) was applied with only a minimal budget, without any specific equipment. Therefore, this allows a broad adoption and extensive use of such an approach to include high-detail elements in a wider context, and thus to provide a credible 3D documentation of complex sites or the whole transects of the landscape. It is useful especially for threatened areas, which can be preserved at least digitally, before any potential damage.

Author Contributions

L.H. conceived the study and wrote the paper; R.S. evaluated ALS data; L.H., J.P., and J.F. did the fieldwork; J.P. processed SfM photogrammetry and prepared the final outputs; J.F. and L.H. visualized the final outputs; J.P. prepared the presentation of 3D data (the 3D models in Sketchfab and the augmented reality); J.F. and R.S. edited the paper.

Funding

This research was funded by the Marie Skłodowska-Curie Actions (H2020-MSCA-IF-2014), grant number 656650–ABANDONMENT‘ (L.H.) and postdoctoral grant funded by the Galician Regional Government: “The archaeological landscapes of the Roman frontier: comparative perspectives on resources exploitation, social change and imperialism through a non-invasive methodology” (J.F.).

Acknowledgments

The authors would like to thank Chris Smart (Department of Archaeology, University of Exeter) for technical support (post-processing of GNSS data), valuable comments and discussion. We also thank Alexandra Rášová (Faculty of Civil Engineering, Slovak University of Technology in Bratislava) for helpful advice in the issue of data precision and accuracy. We are very committed to Jan Kaňka for English proof-reading. We would also like to thank both unknown reviewers for their valuable comments on the original manuscript.

Conflicts of Interest

The authors declare no conflict of interest.

Appendix A

Figure A1. The plan of earthworks in Hound Tor working as a marker for the augmented reality, according to [39] (p. 130), modified.
Remotesensing 10 01357 g0a1

References

  1. Opitz, R.; Cowley, D. Interpreting Archaeological Topography: Airborne Laser Scanning, 3D Data and Ground Observation; Oxbow Books: Oxford, UK, 2013; ISBN 9781842175163. [Google Scholar]
  2. Hyyppä, H.; Yu, X.; Hyyppä, J.; Kaartinen, H.; Kaasalainen, S.; Honkavaara, E.; Rönnholm, P. Factors affecting the quality of DTM generation in forested areas. Int. Arch. Photogramm., Remote Sens. Spat. Inf. Sci. 2005, 36, 85–90. [Google Scholar]
  3. Bollandsås, O.M.; Risbøl, O.; Ene, L.T.; Nesbakken, A.; Gobakken, T.; Næsset, E. Using airborne small-footprint laser scanner data for detection of cultural remains in forests: An experimental study of the effects of pulse density and DTM smoothing. J. Archaeol. Sci. 2012, 39, 2733–2743. [Google Scholar] [CrossRef]
  4. Humme, A.; Lindenbergh, R.; Sueur, C. Revealing celtic fields from lidar data using kriging based filtering. In In Proceedings of the ISPRS Commission Symposium, Dresden, Germany, 25–27 September 2006. [Google Scholar]
  5. Liu, X. Airborne LiDAR for DEM generation: Some critical issues. Progr. Phys. Geogr. Intern. Rev. Geogr. Work Nat. Environ. Sci. 2008, 32, 31–49. [Google Scholar] [CrossRef]
  6. Liu, X.; Zhang, Z.; Peterson, J. Evaluation of the performance of DEM interpolation algorithms for LiDAR data. In Proceedings of the Surveying & Spatial Sciences Institute Biennial International Conference Adelaide 2009, Adelaide, Australia, 28 September–2 October 2009; Ostendorf, B., Baldock, P., Bruce, D., Burdett, M., Corcoran, P., Eds.; Surveying & Spatial Sciences Institute: Adelaide, Australia, 2009; pp. 771–780. [Google Scholar]
  7. Masini, N.; Coluzzi, R.; Lasaponara, R. On the airborne lidar contribution in archaeology: From site identification to landscape investigation. In Laser Scanning, Theory and Applications; Wang, C.-C., Ed.; IntechOpen: London, UK, 2011; pp. 263–290. ISBN 978-953-307-205-0. [Google Scholar]
  8. Doneus, M. Openness as visualization technique for interpretative mapping of airborne lidar derived digital terrain models. Remote Sens. 2013, 5, 6427–6442. [Google Scholar] [CrossRef]
  9. Kokalj, Ž.; Hesse, R. Airborne Laser Scanning Raster Data Visualization. A Guide to Good Practice; Založba ZRC: Ljubljana, Slovenia, 2017; Available online: https://iaps.zrc-sazu.si/sites/default/files/pkc014_kokalj.pdf (accessed on 6 January 2018).
  10. Risbøl, O.; Bollandsås, O.M.; Nesbakken, A.; Ørka, H.O.; Næsset, E.; Gobakken, T. Interpreting cultural remains in airborne laser scanning generated digital terrain models: Effects of size and shape on detection success rates. J. Archaeol. Sci. 2013, 40, 4688–4700. [Google Scholar] [CrossRef]
  11. Holata, L.; Plzák, J. Podstawowe prace z danymi pochodzącymi z lotniczego skanowania laserowego (opracowanie i ocena), możliwości ich testowania i ograniczenia w dokumentowaniu antropogenicznych form rzeźby terenu. In Lotnicze skanowanie laserowe jako narzędzie archeologii; Gojda, M., Kobyliński, Z., Eds.; Archaeologica Hereditas 11—Prace Instytutu Archeologii UKSW: Warsawa, Poland, 2018; pp. 23–44. ISBN 978-83-946496-6-1. [Google Scholar]
  12. Green, S.; Bevan, A.; Shapland, M. A comparative assessment of structure from motion methods for archaeological research. J. Archaeol. Sci. 2014, 46, 173–181. [Google Scholar] [CrossRef]
  13. Sapirstein, P. Accurate measurement with photogrammetry at large sites. J. Archaeol. Sci. 2016, 66, 137–145. [Google Scholar] [CrossRef]
  14. Olson, B.R.; Placchetti, R.A.; Quartermaine, J.; Killebrew, A.E. The Tel Akko Total Archaeology Project (Akko, Israel): Assessing the suitability of multiscale 3D field recording in archaeology. J. Field Archaeol. 2013, 38, 244–262. [Google Scholar] [CrossRef]
  15. Yravedra, J.; García-Vargas, E.; Maté-González, M.Á.; Aramendi, J.; Palomeque-González, J.F.; Vallés-Iriso, J.; Matesanz-Vicente, J.; González-Aguilera, D.; Domínguez-Rodrigo, M. The use of micro-photogrammetry and geometric morphometrics for identifying carnivore agency in bone assemblages. J. Archaeol. Sci. Rep. 2017, 14, 106–115. [Google Scholar] [CrossRef]
  16. De Reu, J.; De Smedt, P.; Herremans, D.; Van Meirvenne, M.; Laloo, P.; De Clercq, W. On introducing an image-based 3D reconstruction method in archaeological excavation practice. J. Archaeol. Sci. 2014, 41, 251–262. [Google Scholar] [CrossRef]
  17. Larsson, L.; Trinks, I.; Söderberg, B.; Gabler, M.; Dell’Unto, N.; Neubauer, W.; Ahlström, T. Interdisciplinary archaeological prospection, excavation and 3D documentation exemplified through the investigation of a burial at the Iron Age settlement site of Uppåkra in Sweden. Archaeol. Prospect. 2015, 22, 143–156. [Google Scholar] [CrossRef]
  18. Koutsoudis, A.; Vidmar, B.; Ioannakis, G.; Arnaoutoglou, F.; Pavlidis, G.; Chamzas, C. Multi-image 3D reconstruction data evaluation. J. Cult. Herit. 2014, 15, 73–79. [Google Scholar] [CrossRef]
  19. Verhoeven, G. Taking computer vision aloft—archaeological three-dimensional reconstructions from aerial photographs with photoscan. Archaeol. Prospect. 2011, 18, 67–73. [Google Scholar] [CrossRef]
  20. Verhoeven, G.; Doneus, M.; Briese, Ch.; Vermeulen, F. Mapping by matching: A computer vision-based approach to fast and accurate georeferencing of archaeological aerial photographs. J. Archaeol. Sci. 2012, 39, 2060–2070. [Google Scholar] [CrossRef]
  21. Eisenbeiss, H.; Zhang, L. Comparison of DSMs generated from mini UAV imagery and terrestrial laser scanner in a cultural heritage application. Int. Arch. Photogramm, Remote Sens. Spat. Inf. Sci. 2006, XXXVI-5, 90–96. [Google Scholar]
  22. Lambers, K.; Eisenbeiss, H.; Sauerbier, M.; Kupferschmidt, D.; Gaisecker, T.; Sotoodeh, S.; Hanusch, T. Combining photogrammetry and laser scanning for the recording and modelling of the Late Intermediate Period site of Pinchango Alto, Palpa, Peru. J. Archaeol. Sci. 2007, 34, 1702–1710. [Google Scholar] [CrossRef]
  23. Guidi, G.; Russo, M.; Ercoli, S.; Remondino, F.; Rizzi, A.; Menna, F. A multi-resolution methodology for the 3D modeling of large and complex archeological areas. Int. J. Arch. Comput. 2009, 7, 39–55. [Google Scholar] [CrossRef]
  24. Escarcena, J.C.; de Castro, E.M.; García, J.L.P.; Calvache, A.M.; del Castillo, T.F.; García, J.D.; Castillo, J.C. Integration of photogrammetric and terrestrial laser scanning techniques for heritage documentation. Virt. Arch. Rev. 2011, 2, 53–57. [Google Scholar] [CrossRef]
  25. Gonizzi Barsanti, S.; Remondino, F.; Visintini, D. 3D surveying and modeling of archaeological sites—some critical issues. ISPRS Ann. Photogramm. Remote Sens. Spatial Inf. Sci. 2013, II-5/W1, 145–150. [Google Scholar] [CrossRef]
  26. Lai, L.; Sordini, M. 3D documentation of a megalithic building in Sardinia. In Proceedings of the 18th International Conference on Cultural Heritage and New Technologies 2013 (CHNT 18, 2013), Wien, Austria, 11–13 November 2013; Börner, W., Uhlirz, S., Eds.; Museen der Stadt Wien—Stadtarchäologie: Wien, Austria, 2014. Available online: https://www.chnt.at/wp-content/uploads/Lai_Sordini_2014.pdf (accessed on 17 November 2017).
  27. Torres, J.A.; Hernandez-Lopez, D.; Gonzalez-Aguilera, D.; Moreno Hidalgo, M.A. A hybrid measurement approach for archaeological site modelling and monitoring: the case study of Mas D’Is, Penàguila. J. Archaeol. Sci. 2014, 50, 475–483. [Google Scholar] [CrossRef]
  28. Balletti, C.; Guerra, F.; Scocca, V.; Gottardi, C. 3D integrated methodologies for the documentation and the virtual reconstruction of an archaeological site. Int. Arch. Photogramm. Remote Sens. Spat. Inf. Sci. 2015, XL-5/W4, 215–222. [Google Scholar] [CrossRef]
  29. Chiabrando, F.; Spanò, A.; Sammartano, G.; Losè, L.T. UAV oblique photogrammetry and lidar data acquisition for 3d documentation of the Hercules Fountain. Virt. Arch. Rev. 2017, 8, 83–96. [Google Scholar] [CrossRef]
  30. Trinks, I.; Wallner, M.; Kucera, M.; Verhoeven, G.; Torrejón Valdelomar, J.; Löcker, K.; Nau, E.; Sevara, C.; Aldrian, L.; Neubauer, E.; Klein, M. Documenting bronze age Akrotiri on Thera using laser scanning, image-based modelling and geophysical prospection. Int. Arch. Photogramm. Remote Sens. Spat. Inf. Sci. 2017, XLII-2/W3, 631–638. [Google Scholar] [CrossRef]
  31. Franceschi, M.; Martinelli, M.; Gislimberti, L.; Rizzi, A.; Massironi, M. Integration of 3D modeling, aerial LiDAR and photogrammetry to study a synsedimentary structure in the Early Jurassic Calcari Grigi (Southern Alps, Italy). Eur. J. Remote Sens. 2015, 48, 527–539. [Google Scholar] [CrossRef] [Green Version]
  32. Kolzenburg, S.; Favalli, M.; Fornaciai, A.; Isola, I.; Harris, A.J.L.; Nannipieri, L.; Giordano, D. Rapid updating and improvement of airborne LIDAR DEMs through ground-based SfM 3-D Modeling of volcanic features. IEEE Trans. Geosci. Remote Sens. 2016, 54, 1–13. [Google Scholar] [CrossRef]
  33. Verhoeven, G.; Taelman, D.; Vermeulen, F. Computer vision-based orthophoto mapping of complex archaeological sites: the ancient quarry of Pitaranha (Portugal–Spain). Archaeometry 2012, 54, 1114–1129. [Google Scholar] [CrossRef]
  34. Galeazzi, F.; Moyes, H.; Aldenderfer, M. Defining best 3D practices in archaeology: Comparing laser scanning and dense stereo matching techniques for 3D intrasite data recording. Adv. Archaeol. Pract. 2014, 2, 353–365. [Google Scholar] [CrossRef]
  35. Wilkinson, M.W.; Jones, R.R.; Woods, C.E.; Gilment, S.R.; McCaffrey, K.J.W.; Kokkalas, S.; Long, J.J. A comparison of terrestrial laser scanning and structure-from-motion photogrammetry as methods for digital outcrop acquisition. Geosphere 2016, 12, 1865–1880. [Google Scholar] [CrossRef] [Green Version]
  36. Chandler, J.H.; Buckley, S. Structure from motion (SFM) photogrammetry vs terrestrial laser scanning. In Geoscience Handbook 2016: AGI Data Sheets, 5th ed.; Carpenter, M.B., Keane, C.M., Eds.; American Geosciences Institute: Alexandria, VA, USA, 2016; ISBN 978-0913312476. [Google Scholar]
  37. Beresford, G.; Brandon, P.; Linehan, C.D. Three deserted medieval settlements on Dartmoor: A report on the late E. Marie Minter’s excavations. Mediev. Archaeol. 1979, 23, 98–158. [Google Scholar] [CrossRef]
  38. Aston, M. Interpreting the Landscape. Landscape Archaeology and Local History; Routledge: London, UK; New York, NY, USA, 1985; ISBN 0-203-44212-1. [Google Scholar]
  39. Newman, P. The Field Archaeology of Dartmoor; English Heritage: Swindon, UK, 2011; ISBN 9781848020337. [Google Scholar]
  40. Allan, J. Medieval pottery and the dating of deserted settlement on Dartmoor. Devon Arch. Soc. Proc. 1994, 52, 141–147. [Google Scholar]
  41. Austin, D.; Walker, J.C. A new landscape context for Hound Tor. Med. Archaeol. 1985, 29, 147–152. [Google Scholar]
  42. Environmental open-data applications and datasets. Available online: http://environment.data.gov.uk/ds/survey/#/survey (accessed on 8 October 2017).
  43. Environment Agency LIDAR data. Available online: http://www.geostore.com/environment-agency/docs/Environment_Agency_LIDAR_Open_Data_FAQ_v5.pdf (accessed on 11 November 2017).
  44. LAStools, “Efficient LiDAR Processing Software” (Version 171231, Unlicensed). Available online: http://rapidlasso.com/LAStools (accessed on 23 November 2017).
  45. Zakšek, K.; Oštir, K.; Kokalj, Ž. Sky-view factor as a relief visualization technique. Remote Sens. 2011, 3, 398–415. [Google Scholar] [CrossRef]
  46. Relief Visualization Toolbox (RVT). Available online: https://iaps.zrc-sazu.si/en/rvt#v (accessed on 2 May 2017).
  47. Gonçalves, J.A.; Moutinho, O.F.; Rodrigues, A.C. Pole photogrammetry with an action camera for fast and accurate surface mapping. ISPRS Int. Arch. Photogramm. Remote Sens. Spat. Inf. Sci. 2016, XLI-B1, 571–575. [Google Scholar]
  48. Bemis, S.P.; Micklethwaite, S.; Turner, D.; James, M.R.; Akciz, S.; Thiele, S.T.; Bangash, H.A. Ground-based and UAV-Based photogrammetry: A multi-scale, high resolution mapping tool for structural geology and paleoseismology. J. Struct. Geosci. 2014, 69, 163–178. [Google Scholar] [CrossRef]
  49. James, M.R.; Robson, S. Mitigating systematic error in topographic models derived from UAV and ground-based image networks. Earth Surf. Process. Landf. 2014, 39, 1413–1420. [Google Scholar] [CrossRef] [Green Version]
  50. Wessling, R.; Maurer, J.; Krenn-Leeb, A. Structure from motion for systematic single surface documentation of archaeological excavations. In Proceedings of the 18th International Conference on Cultural Heritage and New Technologies 2013—CHNT 18, Vienna, Austria, 11–13 November 2013; Museen der Stadt Wien—Stadtarchäologie: Vienna, Austria, 2014. [Google Scholar]
  51. Prins, A.B. 3D Modeling for Archaeological Documentation: Using the JVRP Method to Record Archaeological Excavations with Millimeter-Accuracy. Available online: http://jezreelvalleyregionalproject.com/Prins-2016_3D-Modeling-for-Archaeological-Documentation_Version-3.0.pdf (accessed on 18 May 2018).
  52. Historic England. Photogrammetric Applications for Cultural Heritage. Guidance for Good Practice; Historic England: Swindon, UK, 2017; Available online: https://historicengland.org.uk/images-books/publications/photogrammetric-applications-for-cultural-heritage/ (accessed on 24 February 2018).
  53. Photoscan. Agisoft PhotoScan User Manual. Professional Edition, Version 1.4. 2018. Available online: http://www.agisoft.com/pdf/photoscan-pro_1_4_en.pdf (accessed on 13 January 2018).
  54. Geomagic Wrap. Available online: https://www.3dsystems.com/software/geomagic-wrap/free-trial (accessed on 8 April 2018).
  55. Planlauf GmbH. Available online: https://www.planlauf.com/en/planlaufterrain/ (accessed on 16 May 2018).
  56. Sktechfab. Available online: https://sketchfab.com/plzak/collections/hound-tor (accessed on 20 June 2018).
  57. Unity. Available online: https://unity3d.com/unity (accessed on 26 May 2018).
  58. Vuforia. Developer portal. Available online: https://developer.vuforia.com (accessed on 26 May 2018).
  59. ‘Hound Tor AR’ application in Google Play. Available online: https://play.google.com/store/apps/details?id=com.Archeodata.HoundTorAR (accessed on 28 May 2018).
  60. Unger, J.; Květina, P. An on-site presentation of invisible prehistoric landscapes. Int. Archaeol. 2017, 43. [Google Scholar] [CrossRef]
  61. Willis, M.D.; Koenig, C.W.; Black, S.L.; Castañeda, A.M. Archeological 3D mapping: the structure from motion revolution. J. Texas Arch. and Hist. 2016, 3, 1–36. [Google Scholar]
  62. Nadal-Romero, E.; Revuelto, J.; Errea, P.; López-Moreno, J.I. The application of terrestrial laser scanner and SfM photogrammetry in measuring erosion and deposition processes in two opposite slopes in a humid badlands area (central Spanish Pyrenees). Soil 2015, 1, 561–573. [Google Scholar] [CrossRef] [Green Version]
  63. Sevara, C.; Verhoeven, G.; Doneus, M.; Draganits, E. Surfaces from the visual past: Recovering high-resolution terrain data from historic aerial imagery for multitemporal landscape analysis. J. Archaeol Method Theory 2018, 25, 611–642. [Google Scholar] [CrossRef] [PubMed]
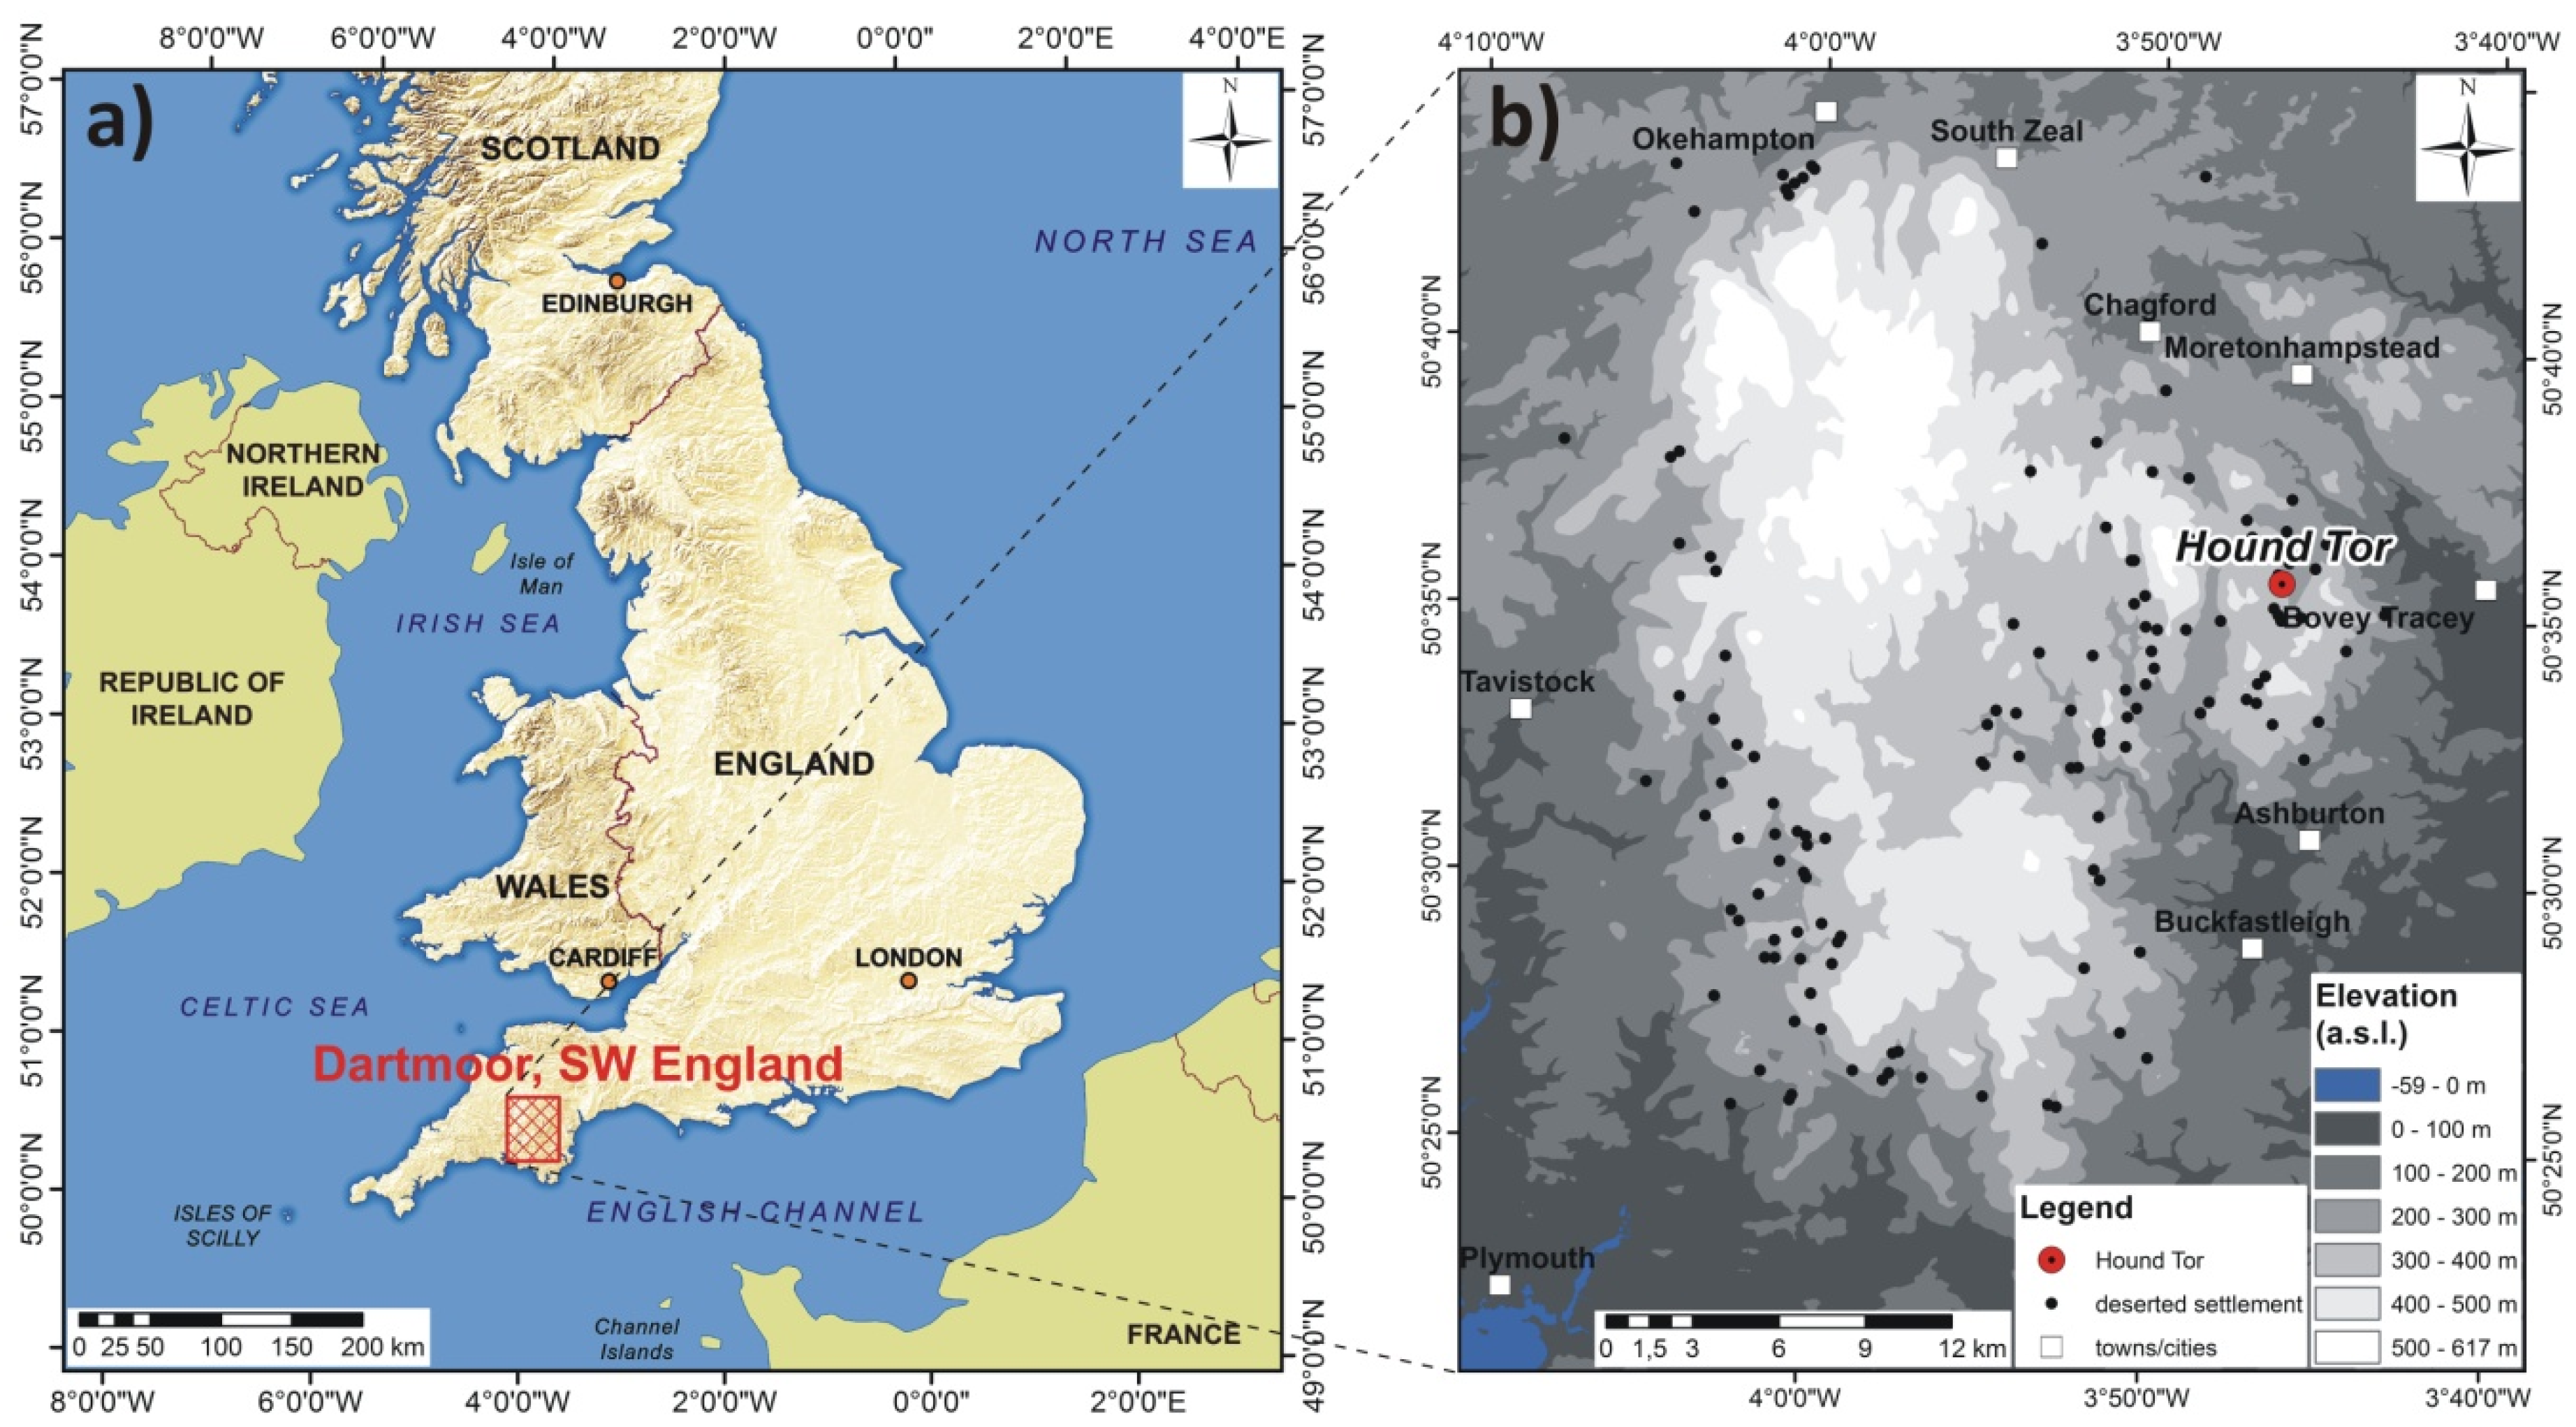
Figure 1. Location of Dartmoor in the south-west of England (a) and Hound Tor at the eastern fringe of Dartmoor (b).
Remotesensing 10 01357 g001
Figure 2. A panoramic view of Hound Tor: (a) the panorama showing the vast majority of the hinterland, especially parts south from the residential area (marked by black arrow; (b) the panorama showing the eastern and northern part of the site which is not depicted in the previous one; (c) the image showing the remain of a long-house with dense bracken vegetation at several places.
Remotesensing 10 01357 g002
Figure 3. Overview of remains at the site: (a) distinctive double-faced wall of a building; (b) less-distinctive double-faced wall of a buildings; (c) prominent single-faced wall of a building; (d) piles of material; (e) disturbed surface; (f) prominent field wall at the residential area; (g) ditch and bank; (h) disturbed bank without ditch; (i) significant lynchet; (j) hardly visible lynchet; (k) the area of well visible ridge-and-furrow; (l) the area of less significant ridge-and-furrow.
Remotesensing 10 01357 g003
Figure 4. The overview of available documentation of the residential area: (a) the ground plan of Hound Tor, according [38] (p. 87); (b) orthophoto view (cell size = 25 cm); (c) hillshade representation of digital surface model (DSM); (d) hillshade representation of digital terrain model (DTM).
Remotesensing 10 01357 g004
Figure 5. The overview of available documentation in the whole area of Hound Tor: (a) the plan of the field system, according [38] (p. 130); the area considered for our analysis marked by red line; areas with ridge-and-furrow covered by transparent yellow); (b) orthophoto view (cell size = 25 cm); (c) hillshade representation of DSM (areas with ‘overage’ points mimic ridge-and-furrow are apparent east and west of the residential area; (d) hillshade representation of DTM.
Remotesensing 10 01357 g005
Figure 6. Processing of airborne laser scanning (ALS) data: (a) hillshade model of the DSM after removing of ‘overage’ points; (b) the classification of points over the residential area and its surroundings (all over-ground structures are in the category of vegetation); (c) manual reclassification of ALS point cloud (over-ground structures placed into the category of ‘buildings’; (d) sky-view visualization of the point cloud used for the integration with the structure from motion (SfM) photogrammetry.
Remotesensing 10 01357 g006
Figure 7. Acquiring images for the SfM photogrammetry and spatial recording: (a) an example of the coded marker (CM); (b) an example of the check point (CP); (c) taking photos using a pole; (d) taking photos of vertical elements; (e) an example of photo from the pole; (f) an example of photo from hands; (g) Global Navigation Satellite System (GNSS) on the site; (h) spatial recording of ground control points (GCPs).
Remotesensing 10 01357 g007
Figure 8. The processing of SfM photogrammetry: (a) lens distortion of the camera; (b) camera location and image overlap; (c) a sparse point cloud of a selected chunk with detected CMs; (d) a dense point cloud of a selected chunk with recognized CMs; (e) variable positions and angles of the camera against the dense point cloud; (f) the whole documented area after merging of all chunks together.
Remotesensing 10 01357 g008
Figure 9. The Hillshade visualization of the SfM point cloud with GCPs: (a) position of the CMs and CPs with their ID number; (b) CMs and CPs with the Z error calculated using RMSE.
Remotesensing 10 01357 g009
Figure 10. The integration of both ALS and SfM point clouds: (a) points selected from the SfM point cloud (visualized as a Hillshade model) using a polygon; (b) points erased from ALS data point cloud (visualized as Sky-view Factor model) using the same polygon; (c) both point clouds merged; (d) both point clouds merged–detail.
Remotesensing 10 01357 g010
Figure 11. The final (enhanced) 3D model of Hound Tor focused on the residential area derived from the integrated ALS and SfM point clouds (cell size = 0,1 m, local relief model (LRM) visualization, colour version): (a) orthophoto view; (b) oblique view from the SSW direction.
Remotesensing 10 01357 g011
Figure 12. The final (enhanced) 3D model of Hound Tor (the whole settlement area) derived from the integrated ALS and SfM point clouds (cell size = 0,25 m): (a) orthophoto view–Sky-view factor visualization; (b) orthophoto view–LRM visualization, black and white version (Roman numerals indicate the field plots discussing in the text); (c) oblique view–LRM visualization, colour version.
Remotesensing 10 01357 g012
Table 1. The extent of all sections at the site, number of photos taken and number of GCPs.
Sections at the SiteApprox. Extent Number of Photos: PoleNumber of Photos: HandheldTotal Number of PhotosNumber of CMsNumber of CPs
11020 m24167449076
21430 m28871971,08467
3680 m259314473777
4550 m256015271267
5710 m242311253555
Total4390 m22,8796793,5583132
Table 2. Root mean square error (RMSE) for the SfM dense point cloud (CMs and CPs).
CMsError X (m)Error Y (m)Error Z (m)CPsError X (m)Error Y (m)Error Z (m)
10.012722−0.001444−0.0184851−0.0022060.012299−0.003385
20.004321−0.0002030.0042982−0.0014930.015249−0.005015
3−0.0028480.0026200.0031333−0.0048880.008884−0.021287
4−0.008928−0.0126000.00267740.0072500.013403−0.028217
50.0179430.009761−0.0049145−0.0135180.008935−0.036133
6−0.0079400.004818−0.0046786−0.0027430.013753−0.016652
7−0.0148080.0014170.01884970.0027900.021699−0.035159
80.004527−0.000926−0.0022868−0.0130600.038725−0.049644
90.003244−0.0081560.0067639−0.0007510.009348−0.012350
100.0029560.003374−0.00327310−0.008943−0.002943−0.044225
11−0.0079730.001187−0.00433111−0.011684−0.008504−0.026420
120.0101110.0080850.00104112−0.0074380.001591−0.022924
13−0.0135490.0025750.00398313−0.0268890.009393−0.023337
14−0.012069−0.0024430.000698140.006547−0.005556−0.005490
150.0104300.0041990.006233150.007514−0.0082620.010793
160.000882−0.005114−0.00387116−0.007760−0.001662−0.031556
170.0063730.007501−0.00173317−0.003943−0.0104420.000187
180.003335−0.019813−0.005111180.0049770.000327−0.009834
19−0.0067790.008642−0.00774819−0.003435−0.004528−0.017033
200.000195−0.0081820.00778120−0.012785−0.009234−0.030692
21−0.0023730.005997−0.001159210.0024480.006591−0.000155
22−0.010529−0.0106470.010706220.013873−0.009720−0.033920
230.000338−0.000769−0.014007230.007474−0.009854−0.030370
240.0060750.0012570.001129240.0005310.010894−0.021551
250.0046420.0016590.010871250.0073140.004758−0.007147
260.0011510.005222−0.007016260.013458−0.001372−0.014629
270.0126960.0052300.003918270.006561−0.0151280.001484
28−0.008455−0.002247−0.00495628−0.0083400.008177−0.014064
29−0.009628−0.0134430.00074229−0.0106400.008699−0.009945
300.0026060.018283−0.001709300.016681−0.002395−0.021333
310.001082−0.0057600.002588310.007604−0.0036040.006818
320.0165850.0027440.007693
RMSE0.0082780.0077100.007208RMSE0.0099200.0115020.022762
RMSE XYZ0.013414RMSE XYZ0.027364