Connection of the Photochemical Reflectance Index (PRI) with the Photosystem II Quantum Yield and Nonphotochemical Quenching Can Be Dependent on Variations of Photosynthetic Parameters among Investigated Plants: A Meta-Analysis


Abstract
1. Introduction
2. Methods
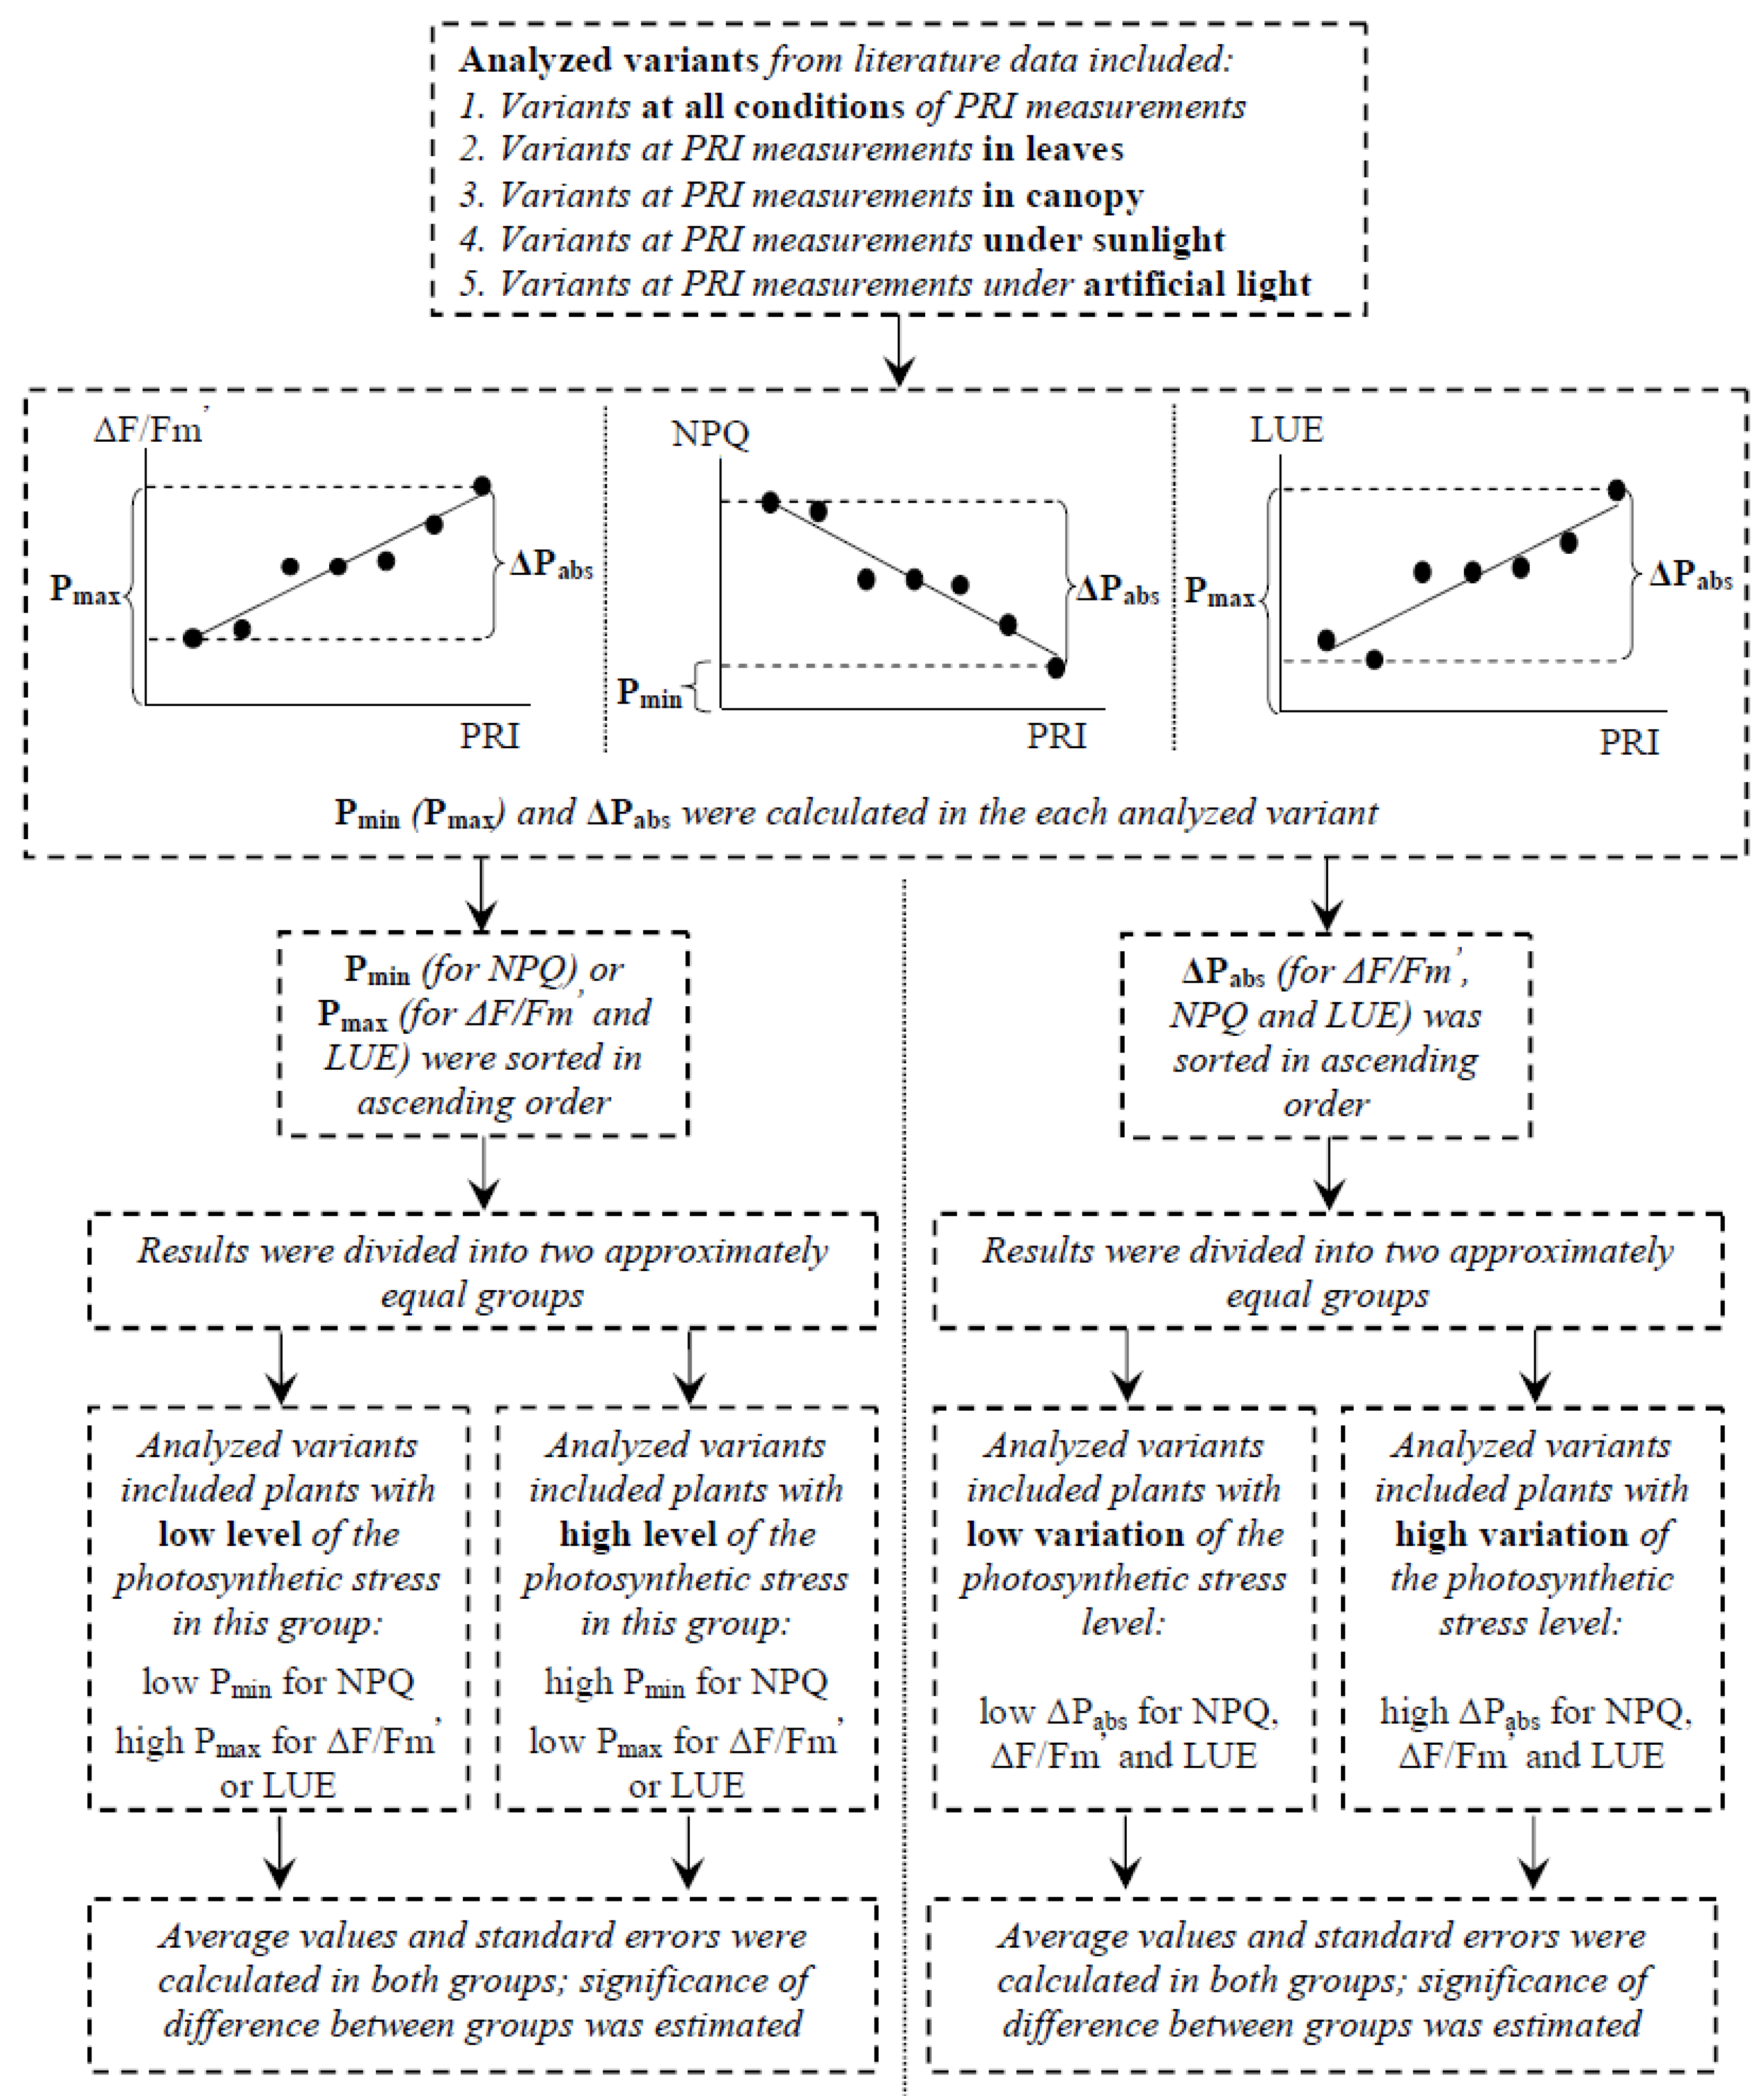
2.1. Main Principles of Data Analysis
- -
- We used only the photochemical reflectance index calculated with an equation where R531 and R570 were reflectance at 531 and 570 nm;
- -
- We analyzed correlations of PRI with the quantum yield of photosystem II (ΔF/Fm’), the nonphotochemical quenching of chlorophyll (NPQ), and the light use efficiency (LUE). ΔF/Fm’ and NPQ were used because these parameters show the efficiency of photosynthetic light reactions and the response of photosynthetic machinery to stressors. LUE was used for the estimation of efficiency of photosynthetic assimilation;
- -
- We used only linear correlations between PRI and photosynthetic parameters. These correlations were taken from papers or were calculated on the basis of the determination coefficient (in case of a linear regression) or were calculated on the basis of data from the articles. If correlation coefficients, determination coefficients for linear functions, or graphical data with changes of photosynthetic parameters and PRI were absent, we did not include these works in the analysis;
- -
- We analyzed the investigation of PRI on the levels of leaves and canopy. Data that were registered by satellites were not used in the analysis.
2.2. Analysis of the Influence of Distribution of Photosynthetic Parameters among Investigated Plants on Connection of these Parameters with PRI
3. Results
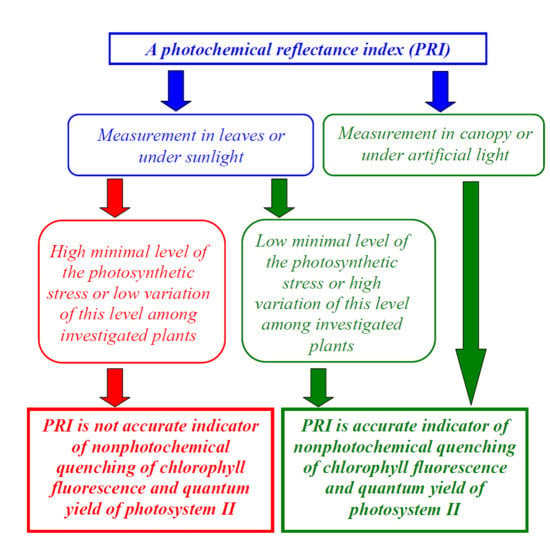
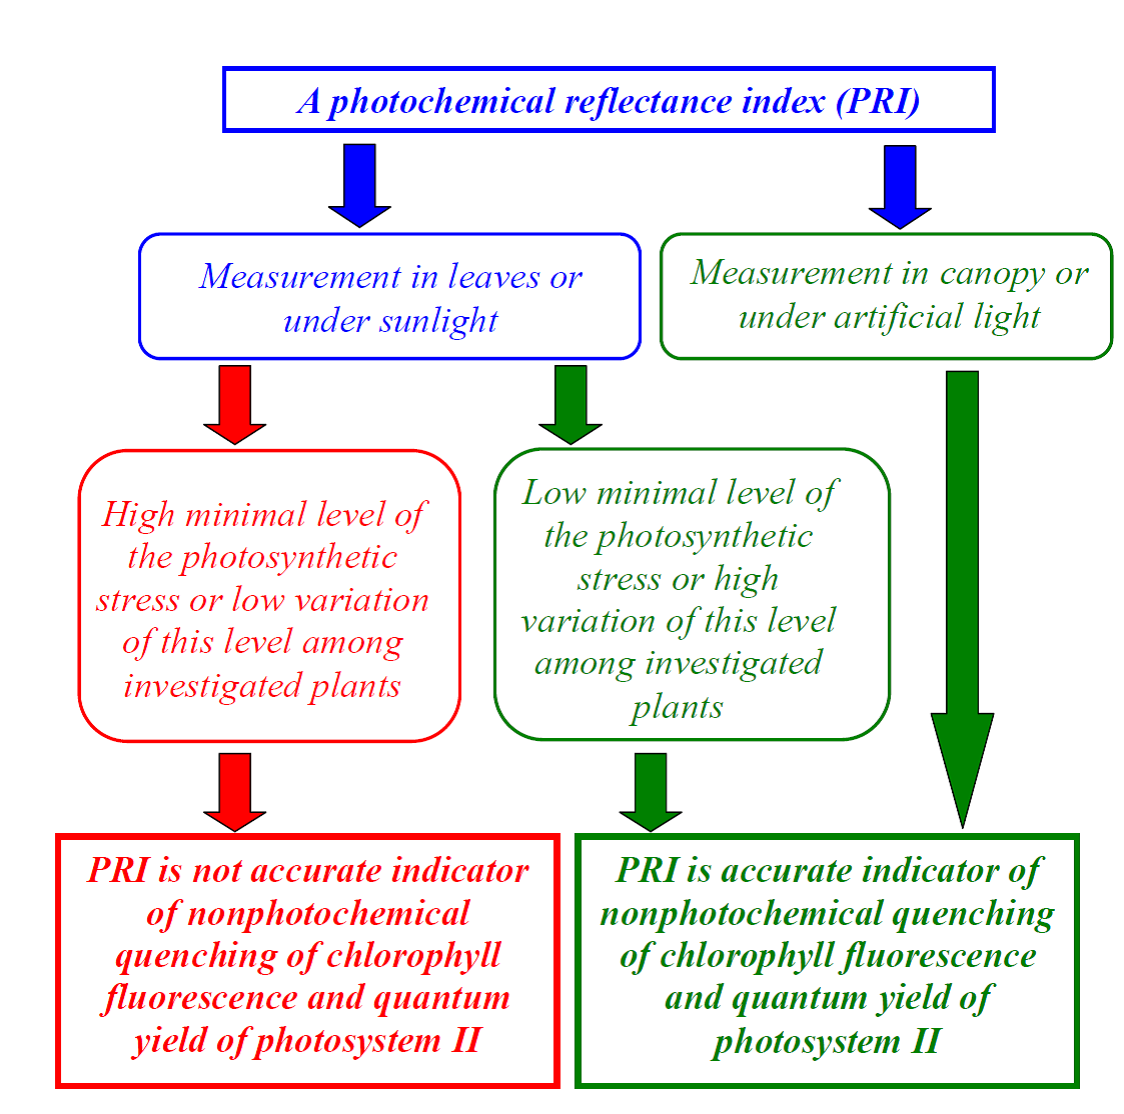
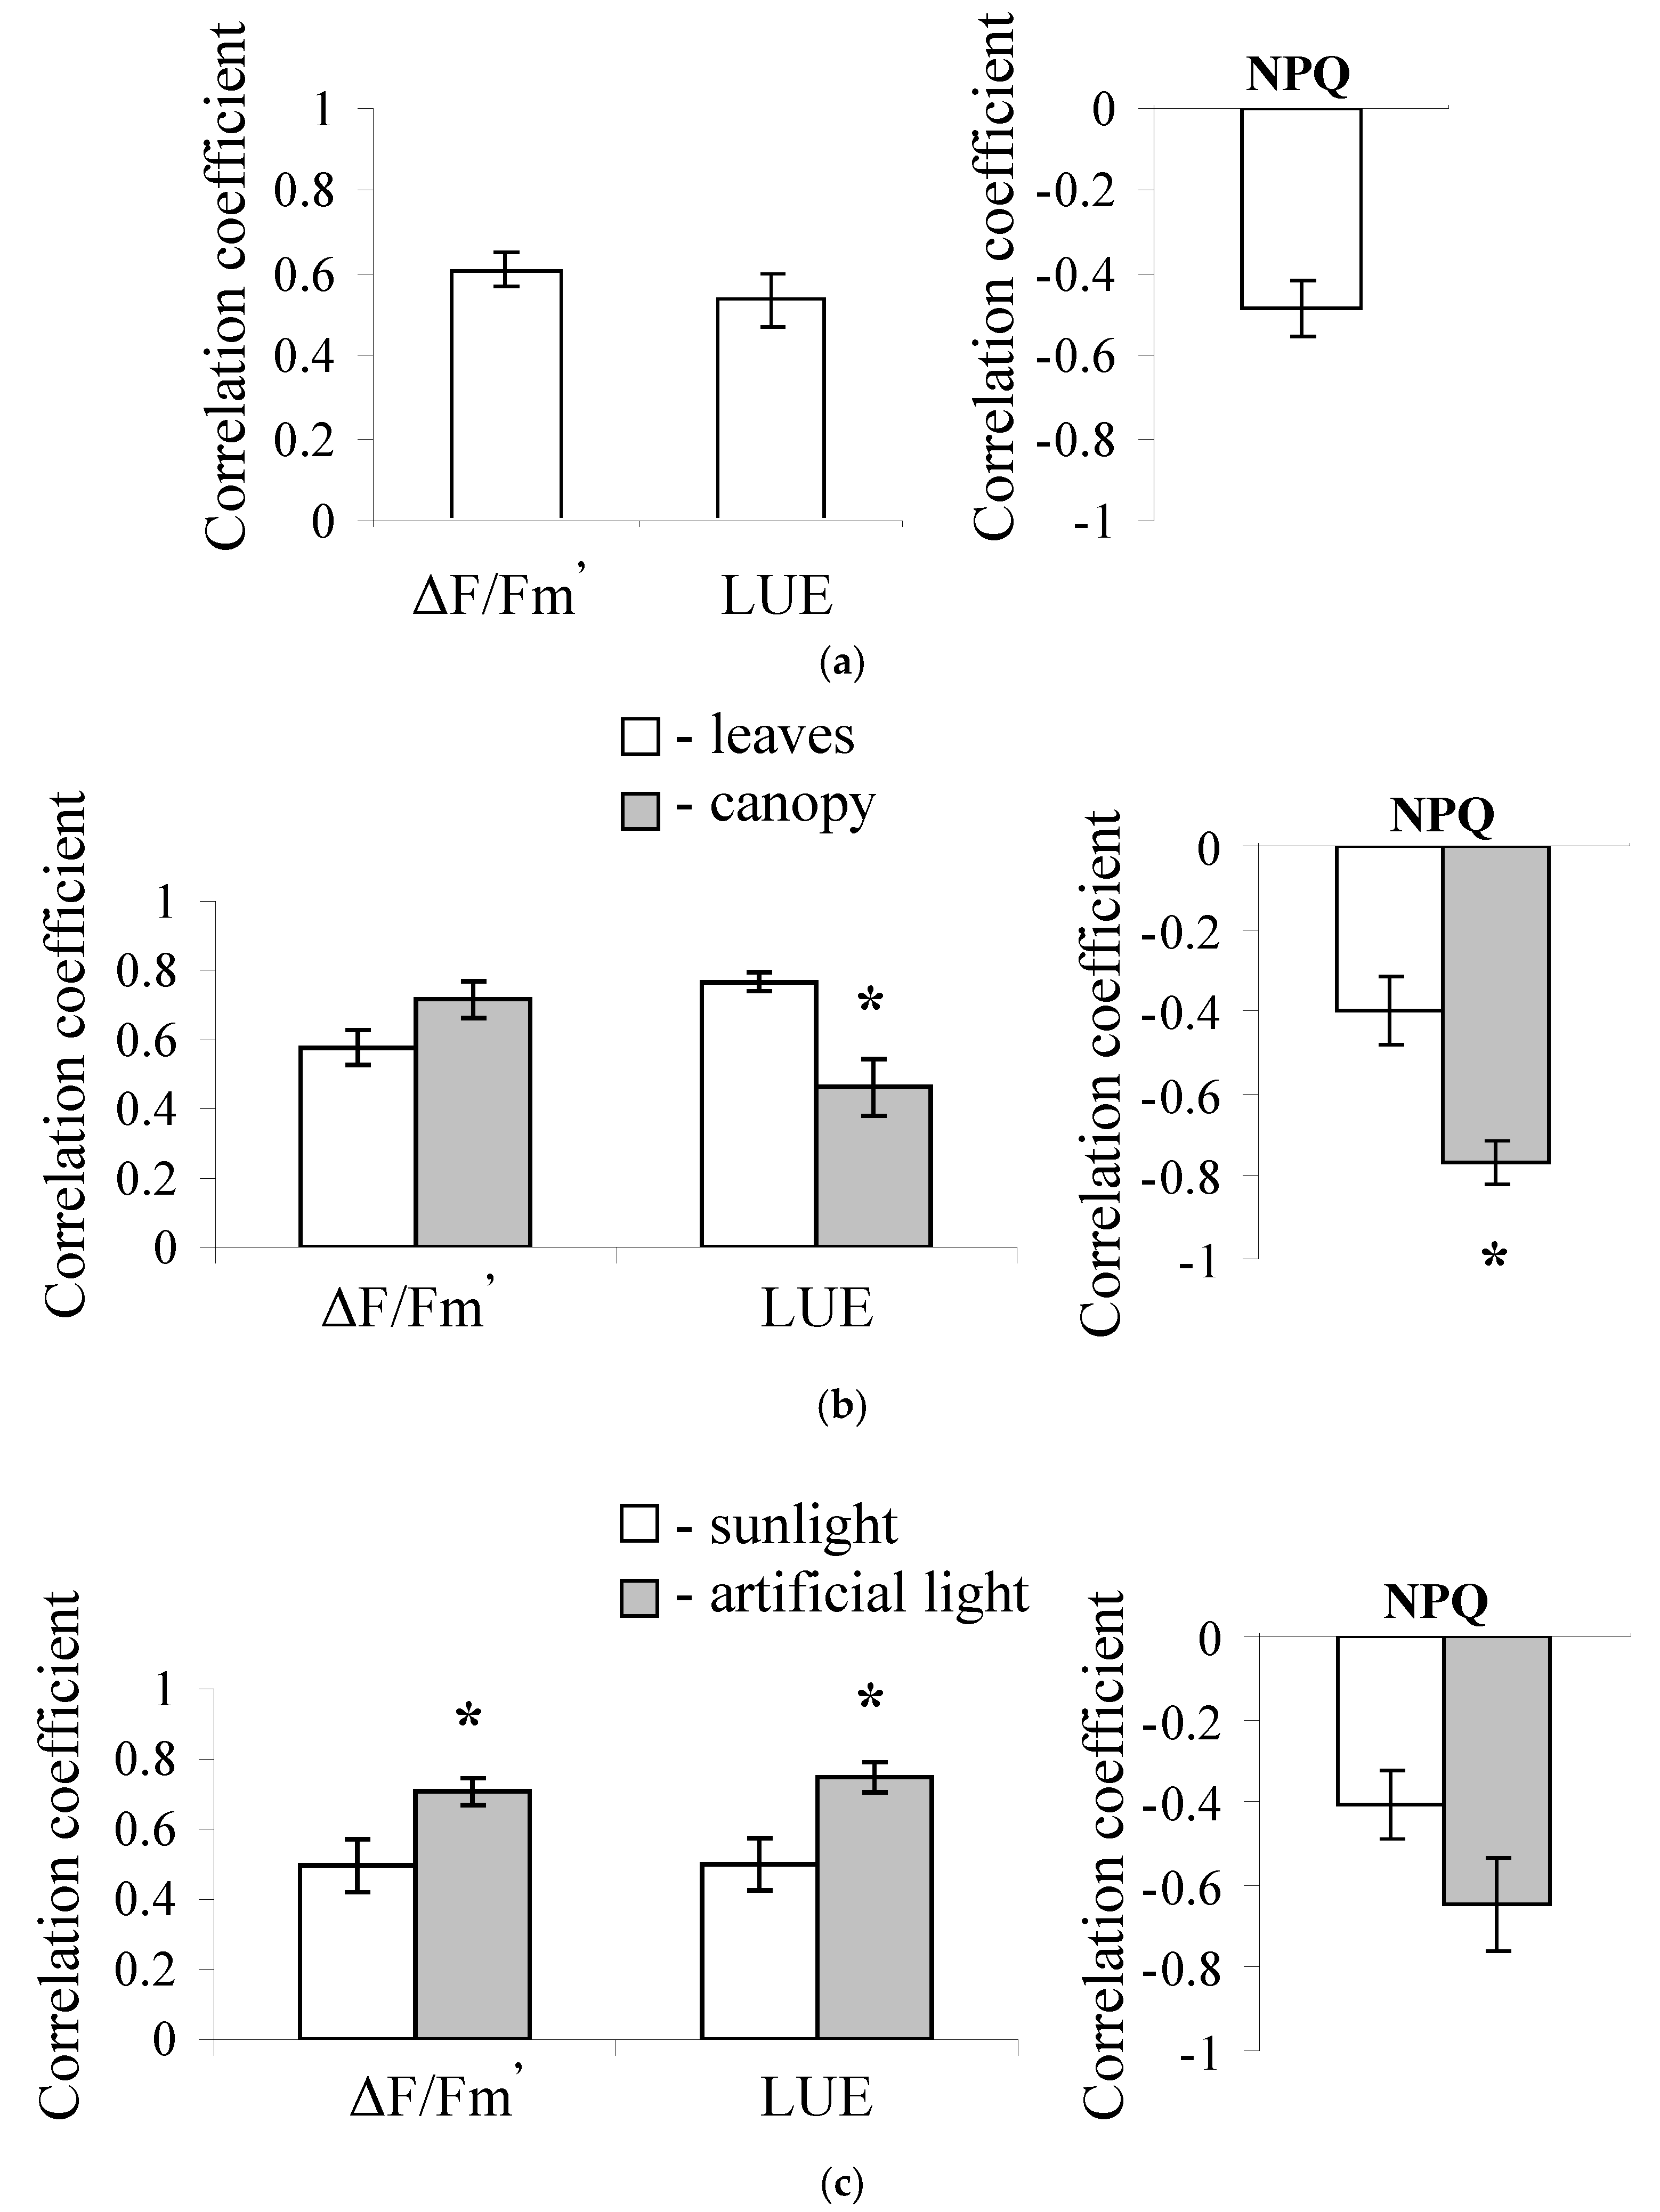
3.1. Connection of PRI with Photosynthetic Parameters under Different Measurement Conditions
3.2. Influence of Distribution of Photosynthetic Parameters among Investigated Plants on Connection of These Parameters with PRI
3.3. Influence of Distribution of Photosynthetic Parameters among Investigated Plants on Connection of These Parameters with PRI Measurements in Leaves and Canopy
3.4. Influence of Distribution of Photosynthetic Parameters among Investigated Plants on Connection of These Parameters with PRI at Measurements under Sunlight and Artificial Light
4. Discussion
5. Conclusions
Author Contributions
Acknowledgments
Conflicts of Interest
References
- Reddy, A.R.; Chaitanya, K.V.; Vivekanandan, M. Drought-induced responses of photosynthesis and antioxidant metabolism in higher plants. J. Plant Physiol. 2004, 161, 1189–1202. [Google Scholar] [CrossRef]
- Muñoz, R.; Quiles, M.J. Illumination in hibiscus plants. Int. J. Mol. Sci. 2013, 14, 5432–5444. [Google Scholar] [CrossRef] [PubMed]
- Peñuelas, J.; Llusia, J.; Piñol, J.; Filella, I. Photochemical reflectance index and leaf photosynthetic radiation-use-efficiency assessment in Mediterranean trees. Int. J. Remote Sens. 1997, 18, 2863–2868. [Google Scholar] [CrossRef]
- Allakhverdiev, S.I.; Nishiyama, Y.; Miyairi, S.; Yamamoto, H.; Inagaki, N.; Kanesaki, Y.; Murata, N. Salt stress inhibits the repair of photodamaged photosystem II by suppressing the transcription and translation of psbA genes in Synechocystis. Plant Physiol. 2002, 130, 1443–1453. [Google Scholar] [CrossRef] [PubMed]
- Murata, N.; Takahashi, S.; Nishiyama, Y.; Allakhverdiev, S.I. Photoinhibition of photosystem II under environmental stress. Biochim. Biophys. Acta 2007, 1767, 414–421. [Google Scholar] [CrossRef] [PubMed]
- Mehta, P.; Allakhverdiev, S.I.; Jajoo, A. Characterization of photosystem II heterogeneity in response to high salt stress in wheat leaves (Triticum aestivum). Photosynth. Res. 2010, 105, 249–255. [Google Scholar] [CrossRef] [PubMed]
- Zinnert, J.C.; Nelson, J.D.; Hoffman, A.M. Effects of salinity on physiological responses and the photochemical reflectance index in two co-occurring coastal shrubs. Plant Soil. 2012, 354, 45–55. [Google Scholar] [CrossRef]
- Mathur, S.; Allakhverdiev, S.I.; Jajoo, A. Analysis of high temperature stress on the dynamics of antenna size and reducing side heterogeneity of photosystem II in wheat leaves (Triticum aestivum). Biochim. Biophys. Acta 2011, 1807, 22–29. [Google Scholar] [CrossRef] [PubMed]
- Ivanov, A.G.; Allakhverdiev, S.I.; Huner, N.P.A.; Murata, N. Genetic decrease in fatty acid unsaturation of phosphatidylglycerol increased photoinhibition of photosystem I at low temperature in tobacco leaves. Biochim. Biophys. Acta 2012, 1817, 1374–1379. [Google Scholar] [CrossRef] [PubMed]
- Pospíšil, P. Production of reactive oxygen species by photosystem II as a response to light and temperature stress. Front. Plant Sci. 2016, 7, 1950. [Google Scholar] [CrossRef] [PubMed]
- Pospíšil, P.; Yamamoto, Y. Damage to photosystem II by lipid peroxidation products. Biochim. Biophys. Acta 2017, 1861, 457–466. [Google Scholar] [CrossRef] [PubMed]
- Ruban, A.V. Nonphotochemical chlorophyll fluorescence quenching: Mechanism and effectiveness in protecting plants from photodamage. Plant Physiol. 2016, 170, 1903–1916. [Google Scholar] [CrossRef] [PubMed]
- Garbulsky, M.F.; Peñuelas, J.; Papale, D.; Filella, I. Remote estimation of carbon dioxide uptake by a Mediterranean forest. Glob. Chang. Biol. 2008, 14, 2860–2867. [Google Scholar] [CrossRef]
- Prabhakar, M.; Prasad, Y.G.; Rao, M.N. Remote sensing of biotic stress in crop plants and its applications for pest management. In Crop Stress and Its Management: Perspectives and Strategies; Venkateswarlu, B., Shanker, A., Shanker, C., Maheswari, M., Eds.; Springer: Dordrecht, The Netherlands, 2012; pp. 517–545. [Google Scholar]
- Zhang, C.; Filella, I.; Garbulsky, M.F.; Peñuelas, J. Affecting factors and recent improvements of the photochemical reflectance index (PRI) for remotely sensing foliar, canopy and ecosystemic radiation-use efficiencies. Remote Sens. 2016, 8, 677. [Google Scholar] [CrossRef]
- Schreiber, U. Pulse-Amplitude-Modulation (PAM) fluorometry and saturation pulse method: An Overview. In Chlorophyll a Fluorescence. Advances in Photosynthesis and Respiration; Papageorgiou, G.C., Govindjee, Eds.; Springer: Dordrecht, The Netherlands, 2004; Volume 19, pp. 279–319. [Google Scholar]
- Kalaji, H.M.; Schansker, G.; Ladle, R.J.; Goltsev, V.; Bosa, K.; Allakhverdiev, S.I.; Brestic, M.; Bussotti, F.; Calatayud, A.; Dąbrowski, P.; et al. Frequently asked questions about in vivo chlorophyll fluorescence: Practical issues. Photosynth. Res. 2014, 122, 121–158. [Google Scholar] [CrossRef] [PubMed]
- Strasser, R.J.; Tsimilli-Michael, M.; Srivastava, A. Analysis of the chlorophyll a fluorescence transient. In Chlorophyll a Fluorescence. Advances in Photosynthesis and Respiration; Papageorgiou, G.C., Govindjee, Eds.; Springer: Dordrecht, The Netherlands, 2004; Volume 19, pp. 321–362. [Google Scholar]
- Stirbet, A. On the relation between the Kautsky effect (chlorophyll a fluorescence induction) and Photosystem II: Basics and applications of the OJIP fluorescence transient. J. Photochem. Photobiol. B 2011, 104, 236–257. [Google Scholar] [CrossRef] [PubMed]
- Goltsev, V.N.; Kalaji, H.M.; Paunov, M.; Bąba, W.; Horaczek, T.; Mojski, J.; Kociel, H.; Allakhverdiev, S.I. Variable chlorophyll fluorescence and its use for assessing physiological condition of plant photosynthetic apparatus. Russ. J. Plant Physiol. 2016, 63, 869–893. [Google Scholar] [CrossRef]
- Jones, H.G.; Stoll, M.; Santos, T.; de Sousa, C.; Chaves, M.M.; Grant, O.M. Use of infrared thermography for monitoring stomatal closure in the field: Application to grapevine. J. Exp. Bot. 2002, 53, 2249–2260. [Google Scholar] [CrossRef] [PubMed]
- Ferrara, G.; Flore, J. Comparison between different methods for measuring transpiration in potted apple trees. Biol. Plant. 2003, 46, 41–47. [Google Scholar] [CrossRef]
- Costa, J.M.; Grant, O.M.; Chaves, M.M. Thermography to explore plant–environment interactions. J. Exp. Bot. 2013, 64, 3937–3949. [Google Scholar] [CrossRef] [PubMed]
- Berghuijs, H.N.C.; Yin, X.; Hob, Q.T.; Driever, S.M.; Retta, M.A.; Nicolaï, B.M.; Struik, P.C. Mesophyll conductance and reaction-diffusion models for CO2 transport in C3 leaves; needs, opportunities and challenges. Plant Sci. 2016, 252, 62–75. [Google Scholar] [CrossRef] [PubMed]
- Gago, J.; de Menezes Daloso, D.; Figueroa, C.M.; Flexas, J.; Fernie, A.R.; Nikoloski, Z. Relationships of leaf net photosynthesis, stomatal conductance, and mesophyll conductance to primary metabolism: A multispecies meta-analysis approach. Plant Physiol. 2016, 171, 265–279. [Google Scholar] [CrossRef] [PubMed]
- Gamon, J.A.; Peñuelas, J.; Field, C.B. A narrow-waveband spectral index that tracks diurnal changes in photosynthetic efficiency. Remote Sens. Environ. 1992, 41, 35–44. [Google Scholar] [CrossRef]
- Rouse, J.W., Jr.; Haas, R.H.; Schell, J.A.; Deering, D.W.; Harlan, J.C. Monitoring the Vernal Advancement and Retrogradation (Green Wave Effect) of Natural Vegetation; Type III Final Rep; The National Aeronautics and Space Administration (NASA)/Goddard Space Flight Center (GSFC): Greenbelt, MD, USA, 1974. [Google Scholar]
- Rondeaux, G.; Steven, M.; Baret, F. Optimization of soil-adjusted vegetation indices. Remote Sens. Environ. 1996, 55, 95–107. [Google Scholar] [CrossRef]
- Huete, A.R.; Justice, C.; van Leeuwen, W. MODIS Vegetation Index (Mod13). Algorithm Theoretical Basis Document; Version 2; NASA Goddard Space Flight Center: Greenbelt, MD, USA, 1996. [Google Scholar]
- Huete, A.R.; Liu, H.Q.; Batchily, K.; van Leeuwen, W. A comparison of vegetation indices global set of TM images for EOS-MODIS. Remote Sens. Environ. 1997, 59, 440–451. [Google Scholar] [CrossRef]
- Gitelson, A.; Merzlyak, M.N. Spectral reflectance changes associated with autumn senescence of Aesculus hippocastanum L. and Acer platanoides L. leaves. Spectral features and relation to chlorophyll estimation. Plant Physiol. 1994, 143, 286–292. [Google Scholar] [CrossRef]
- Gamon, J.A.; Surfus, J.S. Assessing leaf pigment content and activity with a refectometer. New Phytol. 1999, 143, 105–117. [Google Scholar] [CrossRef]
- Peñuelas, J.; Baret, F.; Filella, I. Semi-emperical indeces to asses caratenoids/chlorophyll ratio from leaf spectral reflectance. Photosynthetica 1995, 31, 221–230. [Google Scholar]
- Eitel, J.U.H.; Long, D.S.; Gessler, P.E.; Hunt, E.R. Combined spectral index to improve ground-based estimates of nitrogen status in dryland wheat. Agron. J. 2008, 100, 1694–1702. [Google Scholar] [CrossRef]
- Hernández-Clemente, R.; Navarro-Cerrillo, R.M.; Zarco-Tejada, P.J. Carotenoid content estimation in a heterogeneous conifer forest using narrow-band indices and PROSPECT+DART simulations. Remote Sens. Environ. 2012, 127, 298–315. [Google Scholar] [CrossRef]
- Gamon, J.A.; Field, C.B.; Bilger, W.; Björkman, O.; Fredeen, A.L.; Peñuelas, J. Remote sensing of the xanthophyll cycle and chlorophyll fluorescence in sunflower leaves and canopies. Oecologia 1990, 85, 1–7. [Google Scholar] [CrossRef] [PubMed]
- Müller, P.; Li, X.-P.; Niyogi, K.K. Non-photochemical quenching. A response to excess light energy. Plant Physiol. 2001, 125, 1558–1566. [Google Scholar] [CrossRef] [PubMed]
- Evain, S.; Flexas, J.; Moya, I. A new instrument for passive remote sensing: 2. Measurement of leaf and canopy reflectance changes at 531 nm and their relationship with photosynthesis and chlorophyll fluorescence. Remote Sens. Environ. 2004, 91, 175–185. [Google Scholar] [CrossRef]
- Inamullah; Isoda, A. Adaptive responses of soybean and cotton to water stress II. Changes in CO2 assimilation rate, chlorophyll fluorescence and photochemical reflectance index in relation to leaf temperature. Plant Prod. Sci. 2005, 8, 131–138. [Google Scholar]
- Peguero-Pina, J.J.; Morales, F.; Flexas, J.; Gil-Pelegrín, E.; Moya, I. Photochemistry, remotely sensed physiological reflectance index and de-epoxidation state of the xanthophyll cycle in Quercus coccifera under intense drought. Oecologia 2008, 156, 1–11. [Google Scholar] [CrossRef] [PubMed]
- Sarlikioti, V.; Driever, S.M.; Marcelis, L.F.M. Photochemical reflectance index as a mean of monitoring early water stress. Ann. Appl. Biol. 2010, 157, 81–89. [Google Scholar] [CrossRef]
- Yoshizumi, Y.; Li, M.S.; Akihiro, I. Assessment of photochemical reflectance index as a tool for evaluation of chlorophyll fluorescence parameters in cotton and peanut cultivars under water stress condition. Agric. Sci. China 2010, 9, 662–670. [Google Scholar]
- Osório, J.; Osório, M.L.; Romano, A. Reflectance indices as nondestructive indicators of the physiological status of Ceratonia siliqua seedlings under varying moisture and temperature regimes. Funct. Plant Biol. 2012, 39, 588–597. [Google Scholar] [CrossRef]
- Magney, T.S.; Eusden, S.A.; Eitel, J.U.H.; Logan, B.A.; Jiang, J.; Vierling, L.A. Assessing leaf photoprotective mechanisms using terrestrial LiDAR: Towards mapping canopy photosynthetic performance in three dimensions. New Phytol. 2014, 201, 344–356. [Google Scholar] [CrossRef] [PubMed]
- Naumann, J.C.; Young, D.R.; Anderson, J.E. Spatial variations in salinity stress across a coastal landscape using vegetation indices derived from hyperspectral imagery. Plant Ecol. 2009, 202, 285–297. [Google Scholar] [CrossRef]
- Ibaraki, Y.; Matsumura, K.; Gupta, S.D. Low-cost photochemical reflectance index measurements of micropropagated plantlets using image analysis. Comput. Electron. Agric. 2010, 71, 170–175. [Google Scholar] [CrossRef]
- Ripullone, F.; Rivelli, A.R.; Baraldi, R.; Guarini, R.; Guerrieri, R.; Magnani, F.; Peñuelas, J.; Raddi, S.; Borghetti, M. Effectiveness of the photochemical reflectance index to track photosynthetic activity over a range of forest tree species and plant water statuses. Funct. Plant Biol. 2011, 38, 177–186. [Google Scholar] [CrossRef]
- Porcar-Castell, A.; Garcia-Plazaola, J.I.; Nichol, C.J.; Kolari, P.; Olascoaga, B.; Kuusinen, N.; Fernández-Marín, B.; Pulkkinen, M.; Juurola, E.; Nikinmaa, E. Physiology of the seasonal relationship between the photochemical reflectance index and photosynthetic light use efficiency. Oecologia 2012, 170, 313–323. [Google Scholar] [CrossRef] [PubMed]
- Chou, S.; Chen, J.M.; Yu, H.; Chen, B.; Zhang, X.; Croft, H.; Khalid, S.; Li, M.; Shi, Q. Canopy-level photochemical reflectance index from hyperspectral remote sensing and leaf-level non-photochemical quenching as early indicators of water stress in maize. Remote Sens. 2017, 9, 794. [Google Scholar] [CrossRef]
- Filella, I.; Amaro, T.; Araus, J.L.; Peñuelas, J. Relationship between photosynthetic radiation-use efficiency of barley canopies and the photochemical reflectance index (PRI). Physiol. Plant. 1996, 96, 211–216. [Google Scholar] [CrossRef]
- Nichol, C.J.; Huemmrich, K.F.; Black, T.A.; Jarvis, P.G.; Walthall, C.L.; Grace, J.; Hall, F.G. Remote sensing of photosynthetic-light-use efficiency of boreal forest. Agric. For. Meteorol. 2000, 101, 131–142. [Google Scholar] [CrossRef]
- Serrano, L.; Peñuelas, J. Assessing forest structure and function from spectral transmittance measurements: A case study in a Mediterranean holm oak forest. Tree Physiol. 2005, 25, 67–74. [Google Scholar] [CrossRef] [PubMed]
- Nakaji, T.; Ide, R.; Takagi, K.; Kosugi, Y.; Ohkubo, S.; Nasahara, K.N.; Saigusa, N.; Oguma, H. Utility of spectral vegetation indices for estimation of light conversion efficiency in coniferous forests in Japan. Agric. For. Meteorol. 2008, 148, 776–787. [Google Scholar] [CrossRef]
- Liu, L.; Zhang, Y.; Jiao, Q.; Peng, D. Assessing photosynthetic light-use efficiency using a solar-induced chlorophyll fluorescence and photochemical reflectance index. Int. J. Remote Sens. 2013, 34, 4264–4280. [Google Scholar] [CrossRef]
- Hmimina, G.; Dufrêne, E.; Soudani, K. Relationship between photochemical reflectance index and leaf ecophysiological and biochemical parameters under two different water statuses: Towards a rapid and efficient correction method using real-time measurements. Plant Cell Environ. 2014, 37, 473–487. [Google Scholar] [CrossRef] [PubMed]
- Peñuelas, J.; Gamon, J.A.; Fredeen, A.L.; Merino, J.; Field, C.B. Reflectence indeces associated with physiological changes in nitrogen- and water-limited sunflower leaves. Remote Sens. Environ. 1994, 48, 135–146. [Google Scholar] [CrossRef]
- Stylinski, C.D.; Gamon, J.A.; Oechel, W.C. Seasonal patterns of reflectance indices, carotenoid pigments and photosynthesis of evergreen chaparral species. Oecologia 2002, 131, 366–374. [Google Scholar] [CrossRef] [PubMed]
- Letts, M.G.; Phelan, C.A.; Johnson, D.R.E.; Rood, S.B. Seasonal photosynthetic gas exchange and leaf reflectance characteristics of male and female cottonwoods in a riparian woodland. Tree Physiol. 2008, 28, 1037–1048. [Google Scholar] [CrossRef] [PubMed]
- Buddenbaum, H.; Rock, G.; Hill, J.; Werner, W. Measuring stress reactions of beech seedlings with PRI, fluorescence, temperatures and emissivity from VNIR and thermal field imaging spectroscopy. Eur. J. Remote Sens. 2015, 48, 263–282. [Google Scholar] [CrossRef]
- Shrestha, S.; Brueck, H.; Asch, F. Chlorophyll index, photochemical reflectance index and chlorophyll fluorescence measurements of rice leaves supplied with different N levels. J. Photochem. Photobiol. B Biol. 2012, 113, 7–13. [Google Scholar] [CrossRef] [PubMed]
- Garbulsky, M.F.; Peñuelas, J.; Gamon, J.; Inoue, Y.; Filella, I. The photochemical reflectance index (PRI) and the remote sensing of leaf, canopy and ecosystem radiation use efficiencies. A review and meta-analysis. Remote Sens. Environ. 2011, 115, 281–297. [Google Scholar] [CrossRef]
- Peñuelas, J.; Filella, I.; Gamon, J.A. Assessment of photosynthetic radiation-use efficiency with spectral reflectance. New Phytol. 1995, 131, 291–296. [Google Scholar] [CrossRef]
- Gamon, J.A.; Serrano, L.; Surfus, J.S. The photochemical reflectance index: An optical indicator of photosynthetic radiation use efficiency across species, functional types, and nutrient levels. Oecologia 1997, 112, 492–501. [Google Scholar] [CrossRef] [PubMed]
- Méthy, M. Analysis of photosynthetic activity at the leaf and canopy levels from reflectance measurements: A case study. Photosynthetica 2000, 38, 505–512. [Google Scholar] [CrossRef]
- Nichol, C.J.; Lloyd, J.; Shibistova, O.; Arneth, A.; Röser, C.; Knohl, A.; Matsubara, S.; Grace, J. Remote sensing of photosynthetic-light-use efficiency of a Siberian boreal forest. Tellus B 2002, 54, 677–687. [Google Scholar] [CrossRef]
- Strachan, I.B.; Pattey, E.; Boisvert, J.B. Impact of nitrogen and environmental conditions on corn as detected by hyperspectral reflectance. Remote Sens. Environ. 2002, 80, 213–224. [Google Scholar] [CrossRef]
- Trotter, G.M.; Whitehead, D.; Pinkney, E.J. The photochemical reflectance index as a measure of photosynthetic light use efficiency for plants with varying foliar nitrogen contents. Int. J. Remote Sens. 2002, 23, 1207–1212. [Google Scholar] [CrossRef]
- Winkel, T.; Méthy, M.; Thénot, F. Radiation use efficiency, chlorophyll fluorescence, and reflectance indeces associated with ontogenic changes. Photosynthetica 2002, 40, 227–232. [Google Scholar] [CrossRef]
- Gamon, J.A. Diverse optical and photosynthetic properties in a neotropical dry forest during the dry season: Implications for remote estimation of photosynthesis. Biotropica 2005, 37, 547–560. [Google Scholar] [CrossRef]
- Nakaji, T.; Takeda, T.; Fujinuma, Y.; Oguma, H. Effect of autumn senescence on the relationship between the PRI and LUE of young japanese larch trees. Phyton 2005, 45, 535–542. [Google Scholar]
- Raddi, S.; Cortes, S.; Pippi, I.; Magnani, F. Estimation of vegetation photochemical processes: An application of the photochemical reflectance index at the San Rossore test site. In Proceedings of the 3rd ESA CHRIS/Proba Workshop, Frascati, Italy, 21–23 March 2005. [Google Scholar]
- Guo, J.M.; Trotter, C.M. Estimating photosynthetic light-use efficiency using the photochemical reflectance index: The effects of short-term exposure to elevated CO2 and low temperature. Int. J. Remote Sens. 2006, 27, 4677–4684. [Google Scholar] [CrossRef]
- Inoue, Y.; Peñuelas, J. Relationship between light use efficiency and photochemical reflectance index in soybean leaves as affected by soil water content. Int. J. Remote Sens. 2006, 27, 5109–5114. [Google Scholar] [CrossRef]
- Nakaji, T.; Oguma, H.; Fujinuma, Y. Seasonal changes in the relationship between photochemical reflectance index and photosynthetic light use efficiency of Japanese larch needles. Int. J. Remote Sens. 2006, 27, 493–509. [Google Scholar] [CrossRef]
- Nichol, C.J.; Rascher, U.; Matsubara, S.; Osmond, B. Assessing photosynthetic efficiency in an experimental mangrove canopy using remote sensing and chlorophyll fluorescence. Trees 2006, 20, 9–15. [Google Scholar] [CrossRef]
- Sims, D.A.; Luo, H.; Hastings, S.; Oechel, W.C.; Rahman, A.F.; Gamon, J.A. Parallel adjustments in vegetation greenness and ecosystem CO2 exchange in response to drought in a Southern California chaparral ecosystem. Remote Sens. Environ. 2006, 103, 289–303. [Google Scholar] [CrossRef]
- Weng, J.H.; Chen, Y.N.; Liao, T.S. Relationships between chlorophyll fluorescence parameters and photochemical reflectance index of tree species adapted to different temperature regimes. Funct. Plant Biol. 2006, 33, 241–246. [Google Scholar] [CrossRef]
- Hall, F.G.; Hilker, T.; Coops, N.C.; Lyapustin, A.; Huemmrich, K.F.; Middleton, E.; Margolis, H.; Drolet, G.; Black, T.A. Multi-angle remote sensing of forest light use efficiency by observing PRI variation with canopy shadow fraction. Remote Sens. Environ. 2008, 112, 3201–3211. [Google Scholar] [CrossRef]
- Naumann, J.C.; Anderson, J.E.; Young, D.R. Linking physiological responses, chlorophyll fluorescence and hyperspectral imagery to detect salinity stress using the physiological reflectance index in the coastal shrub, Myrica cerifera. Remote Sens. Environ. 2008, 112, 3865–3875. [Google Scholar] [CrossRef]
- Naumann, J.C.; Young, D.R.; Anderson, J.E. Leaf chlorophyll fluorescence, reflectance, and physiological response to freshwater and saltwater flooding in the evergreen shrub, Myrica cerifera. Environ. Exp. Bot. 2008, 63, 402–409. [Google Scholar] [CrossRef]
- Busch, F.; Hüner, N.P.A.; Ensminger, I. Biochemical constrains limit the potential of the photochemical reflectance index as a predictor of effective quantum efficiency of photosynthesis during the winter spring transition in Jack pine seedlings. Funct. Plant Biol. 2009, 36, 1016–1026. [Google Scholar] [CrossRef]
- Middleton, E.M.; Cheng, Y.-B.; Hilker, T.; Black, T.A.; Krishnan, P.; Coops, N.C.; Huemmrich, K.F. Linking foliage spectral responses to canopy-level ecosystem photosynthetic light-use efficiency at a Douglas-fir forest in Canada. Can. J. Remote Sens. 2009, 35, 166–188. [Google Scholar] [CrossRef]
- Ibaraki, Y.; Gupta, S.D. Nondestructive evaluation of the photosynthetic properties of micropropagated plantlets by imaging photochemical reflectance index under low light intensity. Cell. Dev. Biol. Plant. 2010, 46, 530–536. [Google Scholar] [CrossRef]
- Naumann, J.C.; Bissett, S.N.; Young, D.R.; Edwards, J.; Anderson, J.E. Diurnal patterns of photosynthesis, chlorophyll fluorescence, and PRI to evaluate water stress in the invasive species, Elaeagnus umbellata Thunb. Trees-Struct. Funct. 2010, 24, 237–245. [Google Scholar] [CrossRef]
- Weng, J.H.; Jhaung, L.H.; Lin, R.J.; Chen, H.Y. Relationship between photochemical efficiency of photosystem II and the photochemical reflectance index of mango tree: Merging data from different illuminations, seasons and leaf colors. Tree Physiol. 2010, 30, 469–478. [Google Scholar] [CrossRef] [PubMed]
- Wu, C.; Niu, Z.; Tang, Q.; Huang, W. Revised photochemical reflectance index (PRI) for predicting light use efficiency of wheat in a growth cycle: Validation and comparison. Int. J. Remote Sens. 2010, 31, 2911–2924. [Google Scholar] [CrossRef]
- Ač, A.; Malenovský, Z.; Urban, O.; Hanuš, J.; Zitová, M.; Navrátil, M.; Vráblová, M.; Olejníčková, J.; Špunda, V.; Marek, M. Relation of chlorophyll fluorescence sensitive reflectance ratios to carbon flux measurements of montanne grassland and norway spruce forest ecosystems in the temperate zone. Sci. World J. 2012, 2012, 705872. [Google Scholar] [CrossRef] [PubMed]
- Rahimzadeh-Bajgiran, P.; Munehiro, M.; Omasa, K. Relationships between the photochemical reflectance index (PRI) and chlorophyll fluorescence parameters and plant pigment indices at different leaf growth stages. Photosynth. Res. 2012, 113, 261–271. [Google Scholar] [CrossRef] [PubMed]
- Weng, J.H.; Wong, S.L.; Lai, K.M.; Lin, R.J. Relationships between photosystem II efficiency and photochemical reflectance index under different levels of illumination: Comparison among species grown at high- and low elevations through different seasons. Trees-Struct. Funct. 2012, 26, 343–351. [Google Scholar] [CrossRef]
- Cheng, Y.-B.; Middleton, E.M.; Zhang, Q.; Huemmrich, K.F.; Campbell, P.K.E.; Corp, L.A.; Cook, B.D.; Kustas, W.P.; Daughtry, C.S. Integrating solar induced fluorescence and the photochemical reflectance index for estimating gross primary production in a cornfield. Remote Sens. 2013, 5, 6857–6879. [Google Scholar] [CrossRef]
- Rossini, M.; Fava, F.; Cogliati, S.; Meroni, M.; Marchesi, A.; Panigada, C.; Giardino, C.; Busetto, L.; Migliavacca, M.; Amaducci, S.; et al. Assessing canopy PRI from airborne imagery to map water stress in maize. ISPRS J. Photogramm. Remote Sens. 2013, 86, 168–177. [Google Scholar] [CrossRef]
- Soudani, K.; Hmimina, G.; Dufrêne, E.; Berveiller, D.; Delpierre, N.; Ourcival, J.-M.; Rambal, S.; Joffre, R. Relationships between photochemical reflectance index and light-use efficiency in deciduous and evergreen broadleaf forests. Remote Sens. Environ. 2014, 144, 73–84. [Google Scholar] [CrossRef]
- Rossini, M.; Panigada, C.; Cilia, C.; Meroni, M.; Busetto, L.; Cogliati, S.; Amaducci, S.; Colombo, R. Discriminating irrigated and rainfed maize with diurnal fluorescence and canopy temperature airborne maps. ISPRS Int. J. Geo-Inf. 2015, 4, 626–646. [Google Scholar] [CrossRef]
- Šebela, D.; Quiñones, C.; Olejníčková, J.; Jagadish, K.S.V. Temporal chlorophyll fluorescence signals to track changes in optical properties of maturing rice panicles exposed to high night temperature. Field Crops Res. 2015, 177, 75–85. [Google Scholar] [CrossRef]
- Van Leeuwen, M.; Kremens, R.L.; van Aardt, J. Tracking diurnal variation in photosynthetic down-regulation using low cost spectroscopic instrumentation. Sensors 2015, 15, 10616–10630. [Google Scholar] [CrossRef] [PubMed]
- Wu, C.; Huang, W.; Yang, Q.; Xie, Q. Improved estimation of light use efficiency by removal of canopy structural effect from the photochemical reflectance index (PRI). Agric. Ecosyst. Environ. 2015, 199, 333–338. [Google Scholar] [CrossRef]
- Zhang, C.; Filella, I.; Liu, D.; Ogaya, R.; Llusià, J.; Asensio, D.; Peñuelas, J. Photochemical reflectance index (PRI) for detecting responses of diurnal and seasonal photosynthetic activity to experimental drought and warming in a mediterranean shrubland. Remote Sens. 2017, 9, 1189. [Google Scholar] [CrossRef]
- Zhang, C.; Preece, C.; Filella, I.; Farré-Armengol, G.; Peñuelas, J. Assessment of the response of photosynthetic activity of mediterranean evergreen oaks to enhanced drought stress and recovery by using PRI and R690/R630. Forests 2017, 8, 386. [Google Scholar] [CrossRef]
- Panigada, C.; Rossini, M.; Meroni, M.; Cilia, C.; Busetto, L.; Amaducci, S.; Boschetti, M.; Cogliati, S.; Picchi, V.; Pinto, F.; et al. Fluorescence, PRI and canopy temperature for water stress detectionin cereal crops. Int. J. Appl. Earth Obs. Geoinf. 2014, 30, 167–178. [Google Scholar] [CrossRef]
- Moran, M.S.; Inoue, Y.; Barnes, E.M. Opportunities and limitations for image-based remote sensing in precision crop management. Remote Sens. Environ. 1997, 61, 319–346. [Google Scholar] [CrossRef]
- Pinter, P.J.; Hatfield, J.L.; Schepers, J.S.; Barnes, E.M.; Moran, M.S.; Daughtry, C.S.T.; Upchurch, D.R. Remote sensing for crop management. Photogramm. Eng. Remote Sens. 2003, 69, 647–664. [Google Scholar] [CrossRef]
- Mahlein, A.-K. Plant disease detection by imaging sensors–parallels and specific demands for precision agriculture and plant phenotyping. Plant Dis. 2016, 100, 241–251. [Google Scholar] [CrossRef]
- Bogue, R. Sensors key to advances in precision agriculture. Sens. Rev. 2017, 37, 1–6. [Google Scholar] [CrossRef]
- Drolet, G.G.; Huemmrich, K.F.; Hall, F.G.; Middleton, E.M.; Black, T.A.; Barr, A.G.; Margolis, H.A. A MODIS-derived photochemical reflectance index to detect inter-annual variations in the photosynthetic light-use efficiency of a boreal deciduous forest. Remote Sens. Environ. 2005, 98, 212–224. [Google Scholar] [CrossRef]
- Berni, J.A.J.; Zarco-Tejada, P.J.; Suárez, L.; Fereres, E. Thermal and narrowband multispectral remote sensing for vegetation monitoring from an unmanned aerial vehicle. IEEE Trans. Geosci. Remote Sens. 2009, 47, 722–738. [Google Scholar] [CrossRef]
- Zhang, M.; Liu, X.; O’Neill, M. Spectral discrimination of Phytophthora infestans infections on tomatoes based on principal component and cluster analyses. Int. J. Remote Sens. 2002, 23, 1095–1107. [Google Scholar] [CrossRef]
- Mahlein, A.-K.; Steiner, U.; Dehne, H.-W.; Oerke, E.-C. Spectral signatures of sugar beet leaves for the detection and differentiation of diseases. Precis. Agric. 2010, 11, 413–431. [Google Scholar] [CrossRef]
- Filella, I.; Porcar-Castell, A.; Munné-Bosch, S.; Bäck, J.; Garbulsky, M.F.; Peñuelas, J. PRI assessment of long-term changes in carotenoids/chlorophyll ratio and short-term changes in de-epoxidation state of the xanthophyll cycle. Int. J. Remote Sens. 2009, 30, 4443–4455. [Google Scholar] [CrossRef]
- Barton, C.V.M.; North, P.R.J. Remote sensing of canopy light use efficiency using the photochemical reflectance index. Model and sensitivity analysis. Remote Sens. Environ. 2001, 78, 264–273. [Google Scholar] [CrossRef]
- Liu, L.-X.; Xu, S.-M.; Woo, K.C. Influence of leaf angle on photosynthesis and the xanthophyll cycle in the tropical tree species Acacia crassicarpa. Tree Physiol. 2003, 23, 1255–1261. [Google Scholar] [CrossRef] [PubMed]
- Jahns, P.; Latowski, D.; Strzalka, K. Mechanism and regulation of the violaxanthin cycle: The role of antenna proteins and membrane lipids. Biochim. Biophys. Acta 2009, 1787, 3–14. [Google Scholar] [CrossRef] [PubMed]
- Jajoo, A.; Mekala, N.R.; Tongra, T.; Tiwari, A.; Grieco, M.; Tikkanen, M.; Aro, E.-M. Low pH-induced regulation of excitation energy between the two photosystems. FEBS Lett. 2014, 588, 970–974. [Google Scholar] [CrossRef] [PubMed]
- Holzwarth, A.R.; Miloslavina, Y.; Nilkens, M.; Jahns, P. Identification of two quenching sites active in the regulation of photosynthetic light-harvesting studied by time-resolved fluorescence. Chem. Phys. Lett. 2009, 483, 262–267. [Google Scholar] [CrossRef]
- Zaks, J.; Amarnath, K.; Kramer, D.M.; Niyogi, K.K.; Fleming, G.R. A kinetic model of rapidly reversible nonphotochemical quenching. Proc. Natl. Acad. Sci. USA 2012, 109, 15757–15762. [Google Scholar] [CrossRef] [PubMed]
- Guadagno, C.R.; De Santo, A.V.; D’Ambrosio, N. A revised energy partitioning approach to assess the yields of non-photochemical quenching components. Biochim. Biophys. Acta 2010, 1797, 525–530. [Google Scholar] [CrossRef] [PubMed]
- Ahn, T.K.; Avenson, T.J.; Peers, G.; Li, Z.; Dall’Osto, L.; Bassi, R.; Niyogi, K.K.; Fleming, G.R. Investigating energy partitioning during photosynthesis using an expanded quantum yield convention. Chem. Phys. 2009, 357, 151–158. [Google Scholar] [CrossRef]
- Sato, R.; Ohta, H.; Masuda, S. Prediction of respective contribution of linear electron flow and PGR5-dependent cyclic electron flow to non-photochemical quenching induction. Plant Physiol. Biochem. 2014, 81, 190–196. [Google Scholar] [CrossRef] [PubMed]
- Pfannschmidt, T.; Bräutigam, K.; Wagner, R.; Dietzel, L.; Schröter, Y.; Steiner, S.; Nykytenko, A. Potential regulation of gene expression in photosynthetic cells by redox and energy state: Approaches towards better understanding. Ann. Bot. 2009, 103, 599–607. [Google Scholar] [CrossRef] [PubMed]
- Rochaix, J.-D.; Lemeille, S.; Shapiguzov, A.; Samol, I.; Fucile, G.; Willig, A.; Goldschmidt-Clermont, M. Protein kinases and phosphatases involved in the acclimation of the photosynthetic apparatus to a changing light environment. Philos. Trans. R. Soc. B 2012, 367, 3466–3474. [Google Scholar] [CrossRef] [PubMed]
- Johnson, G.N. Cyclic electron transport in C3 plants: Fact or artefact? J. Exp. Bot. 2005, 56, 407–416. [Google Scholar] [CrossRef] [PubMed]
- Latowski, D.; Kuczyńska, P.; Strzałka, K. Xanthophyll cycle–a mechanism protecting plants against oxidative stress. Redox Rep. 2011, 16, 78–90. [Google Scholar] [CrossRef] [PubMed]
- Porcar-Castell, A.; Tyystjärvi, E.; Atherton, J.; van der Tol, C.; Flexas, J.; Pfündel, E.E.; Moreno, J.; Frankenberg, C.; Berry, J.A. Linking chlorophyll a fluorescence to photosynthesis for remote sensing applications: Mechanisms and challenges. J. Exp. Bot. 2014, 65, 4065–4095. [Google Scholar] [CrossRef] [PubMed]
- Allen, J.F. Cyclic, pseudocyclic and noncyclic photophosphorylation: New links in the chain. Trends Plant Sci. 2003, 8, 15–19. [Google Scholar] [CrossRef]
- Ashraf, M.; Harris, P.J.C. Photosynthesis under stressful environments: An overview. Photosynthetica 2013, 51, 163–190. [Google Scholar] [CrossRef]
- Rahman, A.F.; Gamon, J.A.; Fuentes, D.A.; Roberts, D.A.; Prentiss, D. Modeling spatially distributed ecosystem flux of boreal forest using hyperspectral indices from AVIRIS imagery. J. Geophys. Res. 2001, 106, 33579–33591. [Google Scholar] [CrossRef]
- Atherton, J.; Nichol, C.J.; Porcar-Castell, A. Using spectral chlorophyll fluorescence and the photochemical reflectance index to predict physiological dynamics. Remote Sens. Environ. 2016, 176, 17–30. [Google Scholar] [CrossRef]
- Kuusk, A. A Markov chain model of canopy reflectance. Agric. For. Meteorol. 1995, 76, 221–236. [Google Scholar] [CrossRef]
- Kuusk, A. A fast, invertible canopy reflectance model. Remote Sens. Environ. 1995, 51, 342–350. [Google Scholar] [CrossRef]
- Bousquet, L.; Lachérade, S.; Jacquemoud, S.; Moya, I. Leaf BRDF measurements and model for specular and diffuse components differentiation. Remote Sens. Environ. 2005, 98, 201–211. [Google Scholar] [CrossRef]
- Baranoski, G.V.G. Modeling the interaction of infrared radiation (750 to 2500 nm) with bifacial and unifacial plant leaves. Remote Sens. Environ. 2006, 100, 335–347. [Google Scholar] [CrossRef]
- Stuckens, J.; Verstraeten, W.W.; Delalieux, S.; Swennen, R.; Coppin, P. A dorsiventral leaf radiative transfer model: Development, validation and improved model inversion techniques. Remote Sens. Environ. 2009, 113, 2560–2573. [Google Scholar] [CrossRef]
- Vilfan, N.; van der Tol, C.; Muller, O.; Rascher, U.; Verhoef, W. Fluspect-B: A model for leaf fluorescence, reflectance and transmittance spectra. Remote Sens. Environ. 2016, 186, 596–615. [Google Scholar] [CrossRef]
- Jacquemoud, S.; Baret, F. PROSPECT: A Model of leaf optical properties spectra. Remote Sens. Environ. 1990, 34, 75–91. [Google Scholar] [CrossRef]
- Dawson, T.P.; Curran, P.J. The biochemical decomposition of slash pine needles from reflectance spectra using neural networks. Int. J. Remote Sens. 1998, 19, 1433–1438. [Google Scholar] [CrossRef]
- Féret, J.-B.; Gitelson, A.A.; Noble, S.D.; Jacquemoud, S. PROSPECT-D: Towards modeling leaf optical properties through a complete lifecycle. Remote Sens. Environ. 2017, 193, 204–215. [Google Scholar] [CrossRef]
- Sun, J.; Shi, S.; Yang, J.; Du, L.; Gong, W.; Chen, B.; Song, S. Analyzing the performance of PROSPECT model inversion based on different spectral information for leaf biochemical properties retrieval. ISPRS J. Photogramm. Remote Sens. 2018, 135, 74–83. [Google Scholar] [CrossRef]
- Hilker, T.; Coops, N.C.; Hall, F.G.; Black, T.A.; Wulder, M.A.; Nesic, Z.; Krishnan, P. Separating physiologically and directionally induced changes in PRI using BRDF models. Remote Sens. Environ. 2008, 112, 2777–2788. [Google Scholar] [CrossRef]
- Cheng, Y.-B.; Middleton, E.M.; Zhang, Q.; Corp, L.A.; Dandois, J.; Kustas, W.P. The photochemical reflectance index from directional cornfield reflectances: Observations and simulations. Remote Sens. Environ. 2012, 124, 444–453. [Google Scholar] [CrossRef]
- Gamon, J.A.; Field, C.B.; Fredeen, A.L.; Thayer, S. Assessing photosynthetic downregulation in sunflower stands with an optically-based model. Photosynth. Res. 2001, 67, 113–125. [Google Scholar] [CrossRef] [PubMed]
- Sukhov, V.; Sherstneva, O.; Surova, L.; Katicheva, L.; Vodeneev, V. Proton cellular influx as a probable mechanism of variation potential influence on photosynthesis in pea. Plant Cell Environ. 2014, 37, 2532–2541. [Google Scholar] [CrossRef] [PubMed]
- Sherstneva, O.N.; Vodeneev, V.A.; Katicheva, L.A.; Surova, L.M.; Sukhov, V.S. Participation of intracellular and extracellular pH changes in photosynthetic response development induced by variation potential in pumpkin seedlings. Biochem. Moscow 2015, 80, 776–784. [Google Scholar] [CrossRef] [PubMed]
- Sherstneva, O.N.; Vodeneev, V.A.; Surova, L.M.; Novikova, E.M.; Sukhov, V.S. Application of a mathematical model of variation potential for analysis of its influence on photosynthesis in higher plants. Biochem. Moscow Suppl. Ser. A 2016, 10, 269–277. [Google Scholar] [CrossRef]
- Sukhov, V. Electrical signals as mechanism of photosynthesis regulation in plants. Photosynth. Res. 2016, 130, 373–387. [Google Scholar] [CrossRef] [PubMed]
- Sukhov, V.; Surova, L.; Morozova, E.; Sherstneva, O.; Vodeneev, V. Changes in H+-ATP synthase activity, proton electrochemical gradient, and pH in pea chloroplast can be connected with variation potential. Front. Plant Sci. 2016, 7, 1092. [Google Scholar] [CrossRef] [PubMed]
- Surova, L.; Sherstneva, O.; Vodeneev, V.; Katicheva, L.; Semina, M.; Sukhov, V. Variation potential-induced photosynthetic and respiratory changes increase ATP content in pea leaves. J. Plant Physiol. 2016, 202, 57–64. [Google Scholar] [CrossRef] [PubMed]
- Sukhova, E.; Akinchits, E.; Sukhov, V. Mathematical models of electrical activity in plants. J. Membr. Biol. 2017, 250, 407–423. [Google Scholar] [CrossRef] [PubMed]
- Sukhova, E.; Mudrilov, M.; Vodeneev, V.; Sukhov, V. Influence of the variation potential on photosynthetic flows of light energy and electrons in pea. Photosynth. Res. 2018, 136, 215–228. [Google Scholar] [CrossRef] [PubMed]
- Grams, T.E.E.; Koziolek, C.; Lautner, S.; Matyssek, R.; Fromm, J. Distinct roles of electric and hydraulic signals on the reaction of leaf gas exchange upon re-irrigation in Zea mays L. Plant Cell Environ. 2007, 30, 79–84. [Google Scholar] [CrossRef] [PubMed]
- Białasek, M.; Gуrecka, M.; Mittler, R.; Karpiński, S. Evidence for the involvement of electrical, calcium and ROS signaling in the systemic regulation of non-photochemical quenching and photosynthesis. Plant Cell Physiol. 2017, in press. [Google Scholar]


| Year | Reference | Scale | Source of Light | Species/Vegetation Type | Parameters |
|---|---|---|---|---|---|
| 1994 | Peñuelas et al. [56] | Canopy | Sunlight | Sunflower | LUE * |
| 1995 | Peñuelas et al. [62] | Leaves | Artificial light | Hedera canariensis, Phaseolus vulgaris, Rhus integrifolia, Heteromeles arbutifolia, Agave americana, Opuntia ficusindica and Cereus hexagonus | ΔF/Fm’, LUE *** |
| 1996 | Filella et al. [50] | Leaves/Canopy | Sunlight | Barley | LUE * |
| 1997 | Gamon et al. [63] | Canopy | Sunlight | Phaseolus vulgaris, | ΔF/Fm’ *** |
| Gossypium barbadense, | |||||
| Helianthus annuus, | |||||
| Zea mays, | |||||
| Nicotiana tabacum, | |||||
| Trifolium repens, | |||||
| Aesculus californica, | |||||
| Cercis occidentalis, | |||||
| Platanus racemosa, | |||||
| Populus fremontii, | |||||
| Quercus lobata, | |||||
| Vitis californica, | |||||
| Vitis girdiana, | |||||
| Heteromeles arbutifolia, | |||||
| Ligustrum japonicum, | |||||
| Quercus ilex, | |||||
| Prunus ilicifolia, | |||||
| Quercus agrifolia, | |||||
| Quercus chrysolepis, | |||||
| Hedera canariensis, | |||||
| 1997 | Peñuelas et al. [3] | Leaves | Sunlight | Quercus ilex, Phillyrea latifolia | ΔF/Fm’, LUE * |
| 2000 | Méthy [64] | Leaves | Artificial light | Quercus ilex | ΔF/Fm’ ** |
| 2000 | Nichol et al. [51] | Canopy | Sunlight | Populus tremuloides, Corylus cornutta, Rosa woodsii, Pinus banksiana, Menyanthes trifoliata, Carex and Eriophorum spp, Betula pumila, Larix laricina, P. glauca, Arctostaphylos uva-ursi, Vaccinium vitis-idaea, Cladina spp, Alnus crispa, Picea mariana | LUE ** |
| 2002 | Nichol et al. [65] | Canopy | Sunlight | Pinus sylvestris, Abies siberica, Picea | LUE ** |
| abies, Pinus siberica, | |||||
| Sorbus aucuparia, Abies siberica, and Betel pendula | |||||
| 2002 | Strachan et al. [66] | Canopy | Sunlight | Maize | LUE ** |
| 2002 | Trotter et al. [67] | Canopy | Artificial light | Hebe townsonii, Carex buchanani Осокa, Metrosideros excelsa, Pittosporum eugenioides, Hebe ‘Otari Delight’, Grisilinea littoralis, Hebe pimeleoides, Pittosporum tenuifolium ‘Shirley’ | LUE ** |
| 2002 | Winkel et al. [68] | Leaves | Sunlight | Chenopodium quinoa | ΔF/Fm’, LUE ** |
| 2004 | Evain et al. [38] | Leaves/Canopy | Artificial light | Grapevine | ΔF/Fm’, NPQ *** |
| 2005 | Gamon [69] | Leaves | Sunlight | Anacardium excelsum, Carica papaya, Cecropia longipes, Enterolobium cyclocarpum, Ficus insipida, Luehea seemannii, Piper reticulatum, Pseudobombax septenatum and Maclura tinctoria | ΔF/Fm’ * |
| 2005 | Inamullah and Isoda [39] | Leaves | Sunlight | Soybean and cotton | ΔF/Fm’, NPQ * |
| 2005 | Nakaji et al. [70] | Canopy | Sunlight | Larix kaempferi | LUE * |
| 2005 | Raddi et al. [71] | Leaves | Artificial light | Medicago sativa, | NPQ ** |
| Phragmites australis, | |||||
| Rubus fruticosus, | |||||
| Silybum marianum | |||||
| Populus euroamericana, | |||||
| Fraxinus angustifolia, | |||||
| Alnus glutinosa | |||||
| Quercus ilex | |||||
| Pinus pinaster and | |||||
| Pinus pinea | |||||
| 2005 | Serrano and Peñuelas [52] | Canopy | Sunlight | Quercus | LUE ** |
| ilex, Phyllirea latifolia, | |||||
| Arbutus unedo, | |||||
| Erica arborea, Juniperus oxycedrus and Cistus albidus | |||||
| 2006 | Guo and Trotter [72] | Leaves | Artificial light | Ackama roseafolia, | ΔF/Fm’, LUE *** |
| Brachyglottis repanda, Fejoa selloiana, Rhaphiolepsis indica, Grisilinea littoralis, Corynocarpus laevigatus, | |||||
| Pseudopanax arboreus, Olearia ilicifolia, Pinus patula, Dodonaea viscose, Pinus radiata, | |||||
| Viburnum marisii and Populus deltoides | |||||
| 2006 | Inoue and Peñuelas [73] | Leaves | Sunlight | Soybean | LUE * |
| 2006 | Nakaji et al. [74] | Canopy | Sunlight | Japanese larch | LUE * |
| 2006 | Nichol et al. [75] | Canopy | Sunlight | Rhizophora mangle | ΔF/Fm’, NPQ ** |
| and Avicennia germinans | |||||
| 2006 | Sims et al. [76] | Canopy | Sunlight | Adenostoma fasciculatum, Adenostoma sparsifolium, Arctostaphylos pungens | LUE *** |
| 2006 | Weng et al. [77] | Leaves | Artificial light | Mangifera indica, podocarpus nagi, alnus formosana | ΔF/Fm’***, NPQ** |
| 2008 | Hall et al. [78] | Canopy | Sunlight | Douglas fir, western red cedar and | LUE ** |
| western hemlock | |||||
| 2008 | Nakaji et al. [53] | Canopy | Sunlight | Japanese larch, Japanese cypress, hybrid larch and dwarf bamboo | LUE * |
| 2008 | Naumann et al. [79] | Canopy | Sunlight | Myrica cerifera | ΔF/Fm’ ** |
| 2008 | Naumann et al. [80] | Canopy | Artificial light | Myrica cerifera | ΔF/Fm’ ** |
| 2008 | Peguero-Pina et al. [40] | Canopy | Sunlight | Quercus coccifera | NPQ *** |
| 2009 | Busch et al. [81] | Leaves | Artificial light | Jack pine | ΔF/Fm’, NPQ ** |
| 2009 | Middleton et al. [82] | Canopy | Sunlight | Douglas fir | LUE ** |
| 2009 | Naumann et al. [45] | Canopy | Sunlight | Myrica cerifera and Iva frutescens | ΔF/Fm’ ** |
| 2010 | Ibaraki et al. [46] | Leaves | Artificial light | Strawberry, lettuce and potato | ΔF/Fm’ ** |
| 2010 | Ibaraki and Gupta [83] | Leaves | Artificial light | Potato | ΔF/Fm’ ** |
| 2010 | Naumann et al. [84] | Canopy | Artificial light/ Sunlight | Elaeagnus umbellata | ΔF/Fm’ ** |
| 2010 | Sarlikioti et al. [41] | Leaves | Artificial light | Tomato | ΔF/Fm’, NPQ *** |
| 2010 | Shahenshah et al. [42] | Leaves | Sunlight | Cotton and Peanut | ΔF/Fm’, NPQ * |
| 2010 | Weng et al. [85] | Leaves | Artificial light/ Sunlight | Mango | ΔF/Fm’ ** |
| 2010 | Wu et al. [86] | Canopy | Sunlight | Wheat | LUE ** |
| 2011 | Ripullone et al. [47] | Leaves | Sunlight | Arbutus unedo, Quercus ilex, | ΔF/Fm’ ** |
| Quercus pubescens, Quercus cerris, | |||||
| Quercus robur, Cannabis sativa, | |||||
| Fagus sylvatica and | |||||
| Populus euroamericana | |||||
| 2012 | Ač et al. [87] | Canopy | Sunlight | (Festuca rubra, Hieracium sp., Plantago sp, Nardus stricta and Jacea pseudophrygia | LUE *** |
| 2012 | Osório et al. [43] | Leaves | Artificial light | Ceratonia siliqua | ΔF/Fm’ * |
| 2012 | Porcar-Castell et al. [48] | Leaves | Sunlight/ Artificial light | Pinus sylvestris | ΔF/Fm’, NPQ, LUE * |
| 2012 | Rahimzadeh-Bajgiran et al. [88] | Leaves | Artificial light | Solanum melongena | NPQ ** |
| 2012 | Shrestha et al. [60] | Leaves | Artificial light | Rice | NPQ *** |
| 2012 | Weng et al. [89] | Leaves | Artificial light | Pinus taiwanensis, Stranvaesia | ΔF/Fm’ ** |
| niitakayamensis, two | |||||
| Miscanthus spp. and mango | |||||
| 2012 | Zinnert et al. [7] | Canopy | Artificial light | Baccharis Halimifolia and | ΔF/Fm’, NPQ ** |
| Myrica cerifera | |||||
| 2013 | Cheng et al. [90] | Canopy | Sunlight | Maize | LUE ** |
| 2013 | Liu et al. [54] | Canopy | Sunlight | Maize and winter wheat | NPQ ** |
| 2013 | Rossini et al. [91] | Canopy | Sunlight | Maize | ΔF/Fm’ ** |
| 2014 | Hmimina et al. [55] | Leaves | Sunlight | Quercus robur and Fagus sylvatica | ΔF/Fm’, LUE ** |
| 2014 | Magney et al. [44] | Leaves | Artificial light | Sunflower, wheat, Quercus | NPQ ** |
| macrocarpa, Betula papyrifera, | |||||
| and Populus tremuloides | |||||
| 2014 | Soudani et al. [92] | Canopy | Sunlight | Quercus | LUE ** |
| robur, Quercus petraea, Quercus ilex, Carpinus betulus | |||||
| 2015 | Rossini et al. [93] | Canopy | Sunlight | Maize | ΔF/Fm’ ** |
| 2015 | Šebela et al. [94] | Leaves | Artificial light | Rice | ΔF/Fm’ * |
| 2015 | van Leeuwen et al. [95] | Canopy | Artificial light | Douglas fir | LUE ** |
| 2015 | Wu et al. [96] | Canopy | Sunlight | Wheat | LUE ** |
| 2017 | Chou et al. [49] | Canopy | Sunlight | Maize | ΔF/Fm’, NPQ ** |
| 2017 | Zhang et al. [97] | Canopy | Sunlight | Erica multiflora | ΔF/Fm’ ** |
| 2017 | Zhang et al. [98] | Leaves | Sunlight | Quercus ilex | ΔF/Fm’ ** |
| Conditions of Measurement | Analyzed Parameter or Effect | ΔF/Fm’ | NPQ | LUE | |
|---|---|---|---|---|---|
| Scale | Leaves | Average correlation coefficient | 0.58±0.05 | −0.40±0.08 | 0.77±0.03 |
| Influence of Pmax (Pmin) | +++ | +++ | − | ||
| Influence of ΔPabs | +++ | +++ | − | ||
| Canopy | Average correlation coefficient | 0.72±0.05 | −0.77±0.05 | 0.46±0.08 | |
| Influence of Pmax (Pmin) | − | + | − | ||
| Influence of ΔPabs | − | − | − | ||
| Source of light | Sunlight | Average correlation coefficient | 0.50±0.08 | −0.41±0.08 | 0.50±0.07 |
| Influence of Pmax (Pmin) | +++ | +++ | − | ||
| Influence of ΔPabs | +++ | +++ | − | ||
| Artificial light | Average correlation coefficient | 0.71±0.04 | −0.65±0.11 | 0.75±0.04 | |
| Influence of Pmax (Pmin) | +++ | − | − | ||
| Influence of ΔPabs | − | − | − | ||
© 2018 by the authors. Licensee MDPI, Basel, Switzerland. This article is an open access article distributed under the terms and conditions of the Creative Commons Attribution (CC BY) license (http://creativecommons.org/licenses/by/4.0/).
Share and Cite
Sukhova, E.; Sukhov, V. Connection of the Photochemical Reflectance Index (PRI) with the Photosystem II Quantum Yield and Nonphotochemical Quenching Can Be Dependent on Variations of Photosynthetic Parameters among Investigated Plants: A Meta-Analysis. Remote Sens. 2018, 10, 771. https://doi.org/10.3390/rs10050771
Sukhova E, Sukhov V. Connection of the Photochemical Reflectance Index (PRI) with the Photosystem II Quantum Yield and Nonphotochemical Quenching Can Be Dependent on Variations of Photosynthetic Parameters among Investigated Plants: A Meta-Analysis. Remote Sensing. 2018; 10(5):771. https://doi.org/10.3390/rs10050771
Chicago/Turabian StyleSukhova, Ekaterina, and Vladimir Sukhov. 2018. "Connection of the Photochemical Reflectance Index (PRI) with the Photosystem II Quantum Yield and Nonphotochemical Quenching Can Be Dependent on Variations of Photosynthetic Parameters among Investigated Plants: A Meta-Analysis" Remote Sensing 10, no. 5: 771. https://doi.org/10.3390/rs10050771
APA StyleSukhova, E., & Sukhov, V. (2018). Connection of the Photochemical Reflectance Index (PRI) with the Photosystem II Quantum Yield and Nonphotochemical Quenching Can Be Dependent on Variations of Photosynthetic Parameters among Investigated Plants: A Meta-Analysis. Remote Sensing, 10(5), 771. https://doi.org/10.3390/rs10050771