Article

Supervised Classification High-Resolution Remote-Sensing Image Based on Interval Type-2 Fuzzy Membership Function

1
School of Mining Industry and Technology, Liaoning Technical University, Huludao 125105, China
2
School of Geomatics, Liaoning Technical University, Fuxin 123000, China
*
Author to whom correspondence should be addressed.
Remote Sens. 2018, 10(5), 710; https://doi.org/10.3390/rs10050710
Submission received: 14 March 2018 / Revised: 18 April 2018 / Accepted: 2 May 2018 / Published: 4 May 2018

Abstract

:
Because of the degradation of classification accuracy that is caused by the uncertainty of pixel class and classification decisions of high-resolution remote-sensing images, we proposed a supervised classification method that is based on an interval type-2 fuzzy membership function for high-resolution remote-sensing images. We analyze the data features of a high-resolution remote-sensing image and construct a type-1 membership function model in a homogenous region by supervised sampling in order to characterize the uncertainty of the pixel class. On the basis of the fuzzy membership function model in the homogeneous region and in accordance with the 3σ criterion of normal distribution, we proposed a method for modeling three types of interval type-2 membership functions and analyze the different types of functions to improve the uncertainty of pixel class expressed by the type-1 fuzzy membership function and to enhance the accuracy of classification decision. According to the principle that importance will increase with a decrease in the distance between the original, upper, and lower fuzzy membership of the training data and the corresponding frequency value in the histogram, we use the weighted average sum of three types of fuzzy membership as the new fuzzy membership of the pixel to be classified and then integrated into the neighborhood pixel relations, constructing a classification decision model. We use the proposed method to classify real high-resolution remote-sensing images and synthetic images. Additionally, we qualitatively and quantitatively evaluate the test results. The results show that a higher classification accuracy can be achieved with the proposed algorithm.

Graphical Abstract

1. Introduction

Image classification is the basic task for the processing of remote-sensing images. Its results will greatly affect the accuracy of the subsequent tasks, such as feature extraction, target recognition, and ground object classification. Benefiting from the rich and the detailed information of ground objects, high-resolution remote-sensing images have good application prospects and advantages in large-scale and accurate object classification. A high-resolution remote-sensing image, however, has two uncertainties, uncertainty of pixel class and uncertainty of classification decision, and both of them introduce new problems to the design of the classification algorithm.
The uncertainty of pixel class is derived mainly from the mixed pixels for the medium and low-resolution remote-sensing images. For high-resolution remote-sensing images, it is mainly caused by the clearly visible surface information. For example, stones on the grass, cracks on the asphalt pavement, and manhole covers on the road are clearly visible in high-resolution remote-sensing images. Such detailed information can bring changes to the characteristic distribution curve in the homogeneous region, thereby aggravating the uncertainty of pixel class and causing great difficulties for classification. In addition, for high-resolution remote-sensing images, the uncertainty of the classification decision is further increased by the complexity and the diversity of ground objects and the lack of real surface information.
Type-1 fuzzy theory has a wide range of applications in image processing, because it can effectively characterize the uncertainty of the image data itself [1,2], such as the uncertainty of the pixel membership, the inaccuracy of the boundary and the contour, and so on. Among the existing fuzzy classification algorithms, fuzzy clustering is one of the most common and effective methods to solve the clustering problem of uncertain data. For example, the Fuzzy C-means (FCM) method is proposed, bringing in the local (neighborhood) spatial information. In the proposed method, the neighborhood relation is modeled by defining the deterministic function of the neighborhood pixel spectral measure [3,4,5,6,7,8], and the correlation model of neighborhood pixels is integrated into the FCM based image classification algorithm after establishment by the use of the Markov Random Field (MRF) model [9,10]. Although the uncertainty of pixel class caused by pixel spatial correlation is effectively solved, the noise is smoothed, and the classification accuracy of the algorithm is improved to a certain extent by these methods, the adverse effects on the high-resolution images caused by the uncertainty of the classification decision still cannot be handled by these clustering methods.
A type-2 membership function [11] is characterized by the primary membership function and the secondary membership function. The membership of each element in the type-2 membership function is a fuzzy set (called primary membership) between [0, 1], rather than a single definite value, and each element in the primary membership has its corresponding membership (called secondary membership). The three-dimensional membership function, which can describe a large amount of uncertain information, is used by the type-2 membership function. So, when compared with the type-1 membership function, the type-2 membership function can provide richer information and present a stronger ability to handle uncertainties. Its popularization and application in more extensive fields is limited, however, because of the complexity of its expression and the reduced type calculation. For the type-2 membership function [12], the computational cost can be overcome because the secondary memberships of all the elements in the primary membership function are defined as 1. Therefore, data modeling that is based on the interval type-2 fuzzy theory is the most commonly used format in practical work.
At present, interval type-2 fuzzy theory has been applied successfully in the fields of fuzzy control [13,14], time series decisions [15], speech recognition [16], fuzzy clustering [17,18], and medical image segmentation [19]. The main construction forms, principles, and applications of the interval type-2 fuzzy model are shown in Table 1.
Type-reducing is a key and difficult aspect of type-2 fuzzy theory and application. Regarding feature recognition, type-reducing is intended to defuzzify the type-2 fuzzy membership model and to construct a decision model whose quality will directly affect recognition accuracy. For the interval type-2 fuzzy neural network model [30,31,32], the common construction method for the decision model is designed as a sum of weights used to link the upper and the lower boundary information. The symbol of weight is used to judge the role on the objective function. If the symbol of weight is positive, membership function information is activated. Otherwise, the membership function information is inhibited. For the interval type-2 FCM [33,34,35,36] method, the fuzzy factor in its objective function is fuzzily, and the interval fuzzy membership matrix and the interval fuzzy clustering center are computed by the factor. Then, the centroid of the interval fuzzy clustering center regarding as the cluster center is calculated to improve the classification accuracy. The decision model, which is modeled by a linear combination of the upper and the lower membership functions in the Gaussian mixture models (GMM) of the training samples, is used for speech recognition by Zeng and Liu [27]. When compared with the traditional construction method for the decision model, although the uncertainty of a decision is considered and the recognition accuracy is improved to some extent in the previous modeling method that is based on the interval type-2 fuzzy model, two problems persist. First, the important influence of the type-1 fuzzy membership function on a decision is not considered; and, second, the influence of the data’s spatial correlation on a decision is not considered.
The modeling method that is based on interval type-2 fuzzy theory can be applied to handle a large amount of uncertain information from multiple fields. Therefore, to address the uncertainty of pixel class and the classification decision of the high-resolution remote-sensing data, this paper proposes a weighted average supervised classification method based on interval type-2 fuzzy theory. The classification method is based on a type-1 fuzzy membership function and an interval type-2 fuzzy membership function, and it takes the pixel spatial correlation into consideration, which can realize the accurate classification of high-resolution remote-sensing images.
This paper is organized as follows. Section 2 contains algorithm description. The construction principle and method of the type-1 fuzzy membership function model, the interval type-2 fuzzy membership function model, and the classification decision model are introduced. Additionally, we analyzed the application of the three interval type-2 fuzzy membership function models. Section 3 contains experiments and results. We conducted classification experiments regarding high-resolution remote-sensing images with different resolutions and different scales by the use of both the proposed method and a traditional method. Additionally, we quantitatively and qualitatively analyzed the classification results. Section 4 contains the conclusions, summarizes the proposed method, and suggests further research in the future.

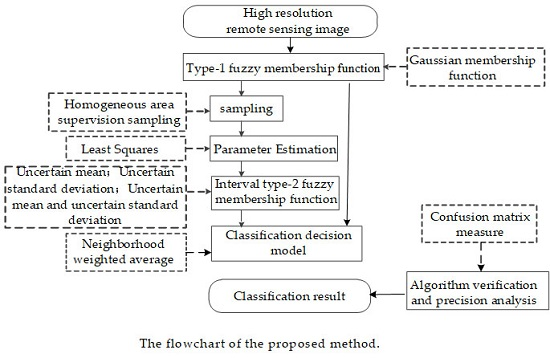
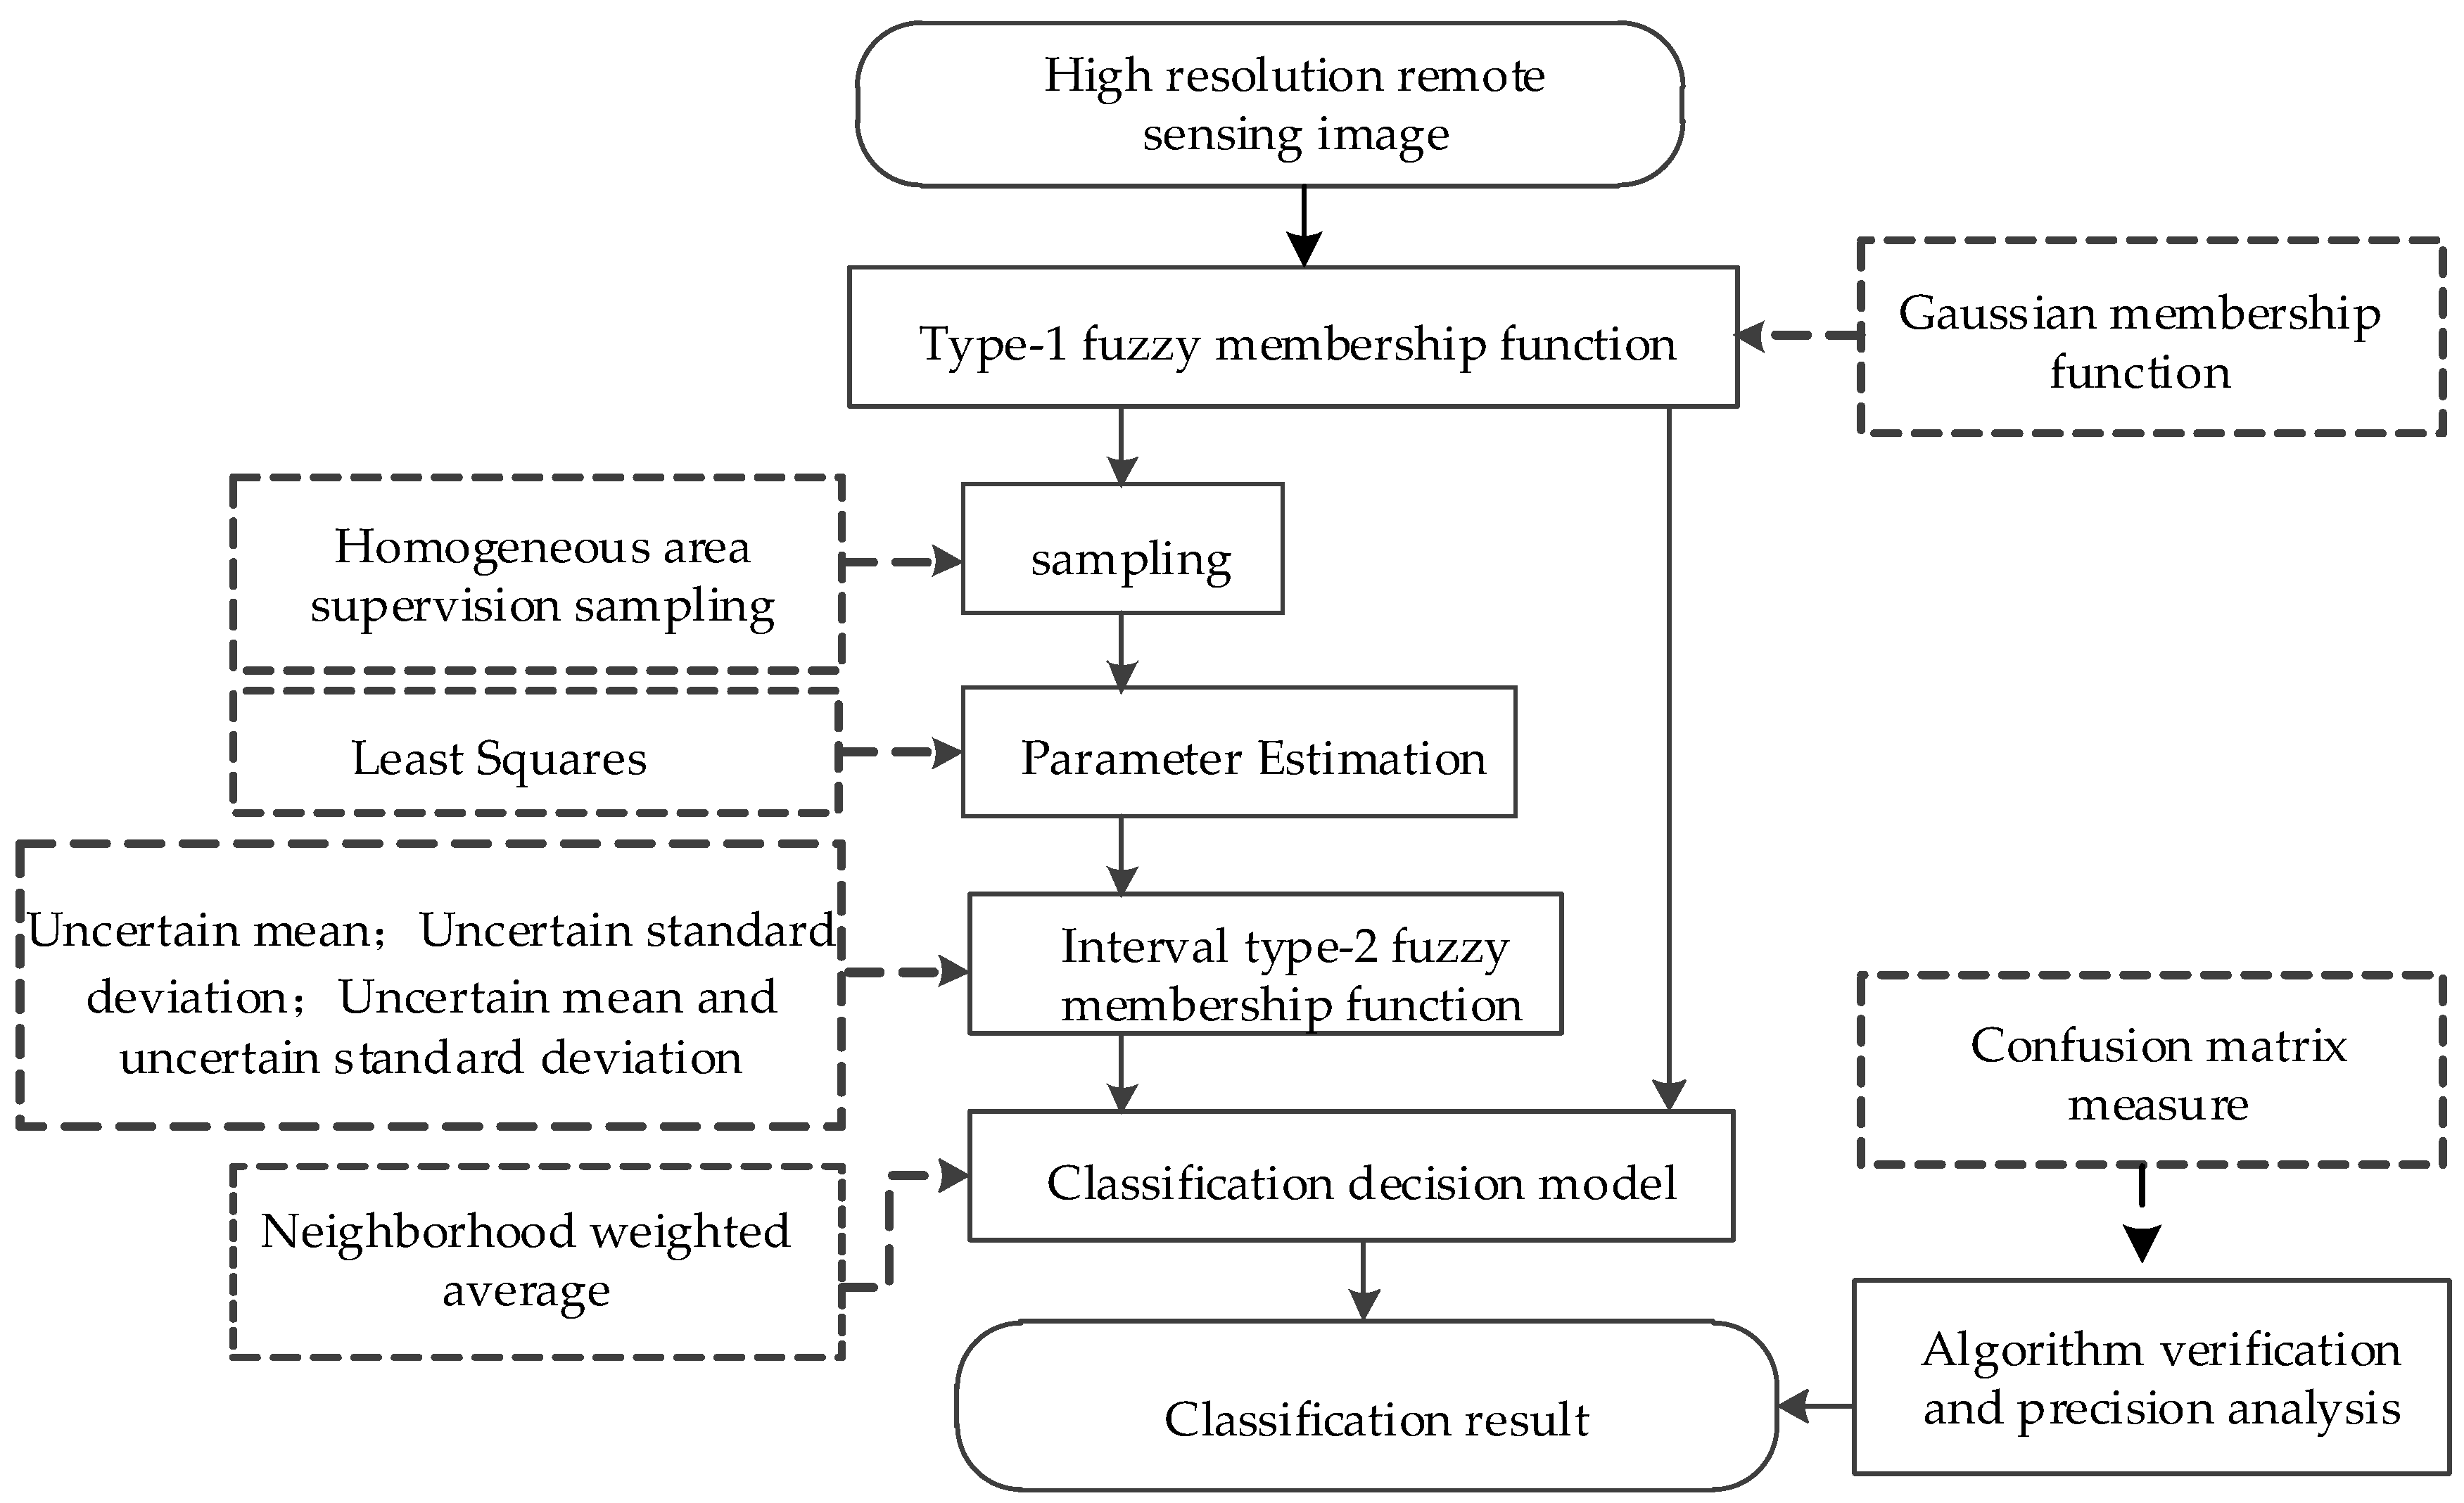
2. Algorithm Descriptions

2.1. Type-1 Fuzzy Membership Function Model for Homogeneous Region

To characterize the uncertainty of pixel class, for a given image X = {xi, i = 1, ..., n}, where n is the total number of pixels, i is the pixel index, and xi is the spectral measure of the ith pixel (i.e., the grayscale value). The following fuzzy membership matrix is established for high-resolution remote-sensing images.
U = [ U i j ] n × k ,
where k is the number of classeses; j = 1, ..., k is the category index; and, 0 ≤ Uij ≤ 1 is the membership of the ith pixel belonging to the jth category, satisfying the constraint condition j = 1 k U i j = 1 .
The Gaussian membership function model is a universal distribution model with good computational performance. In this paper, it is used as the type-1 fuzzy membership function model Uij for the homogeneous region of the image.
  U i j ( x ; u , σ ) = α j 1 2 π σ j exp { ( x i u j ) 2 2 σ j 2 }
where αj, uj, and σj are the coefficients (0 < αj < 1), mean and standard deviation of the jth homogeneous region model, respectively.
In this paper, we supervised each homogenous region and selected about its 30% as the training samples, and then we obtained the parameters of fuzzy Gaussian function model by the use of the least square histogram fitting method.
Figure 1a1–c1 are high-resolution panchromatic remote-sensing images with a resolution of 0.5 m, covering typical agricultural areas. Figure 1a2–c2 correspond to the type-1 fuzzy membership function (fuzzy Gaussian membership function) models that were constructed in accordance with the proposed method, where “*” is the training data histogram and the curve is the corresponding type-1 fuzzy membership function model. In Figure 1a1, the spectral measure within the farmland is evenly distributed, so its training data histogram is Gaussian. Therefore, the histogram is well fitted by the type-1 fuzzy membership function model that is proposed in this paper. In Figure 1b1, the training data histogram exhibits an asymmetrical distribution, because part of the farmland is covered by snow, and its spectral measure is overall shifted to the right when compared with the spectral measure in Figure 1a1. Therefore, the proposed type-1 fuzzy membership function model can reflect only the basic distribution of the histogram. In Figure 1c1, within the farmland, there are two homogenous regions with distinct differences in the spectral measure, and the spectral measure in the two regions is distributed evenly, so the corresponding histogram shows a bimodal distribution. In this case, the spectral features cannot be characterized accurately by the type-1 fuzzy membership function with a unimodal feature.
It is evident that the spectral features and histogram features of the same ground object will change uncertainly because of the clearly visible details of the ground object in a high-resolution remote-sensing image. Therefore, these uncertain features cannot be characterized by the type-1 fuzzy membership function model. At the same time, the model established based on pixels with uncertain feature should also be uncertain, and this uncertainty will further cause the difficulty of classification decision.
Therefore, an interval type-2 fuzzy membership function model for a homogenous region is constructed to characterize model uncertainty and to enhance the accuracy of the classification decision.

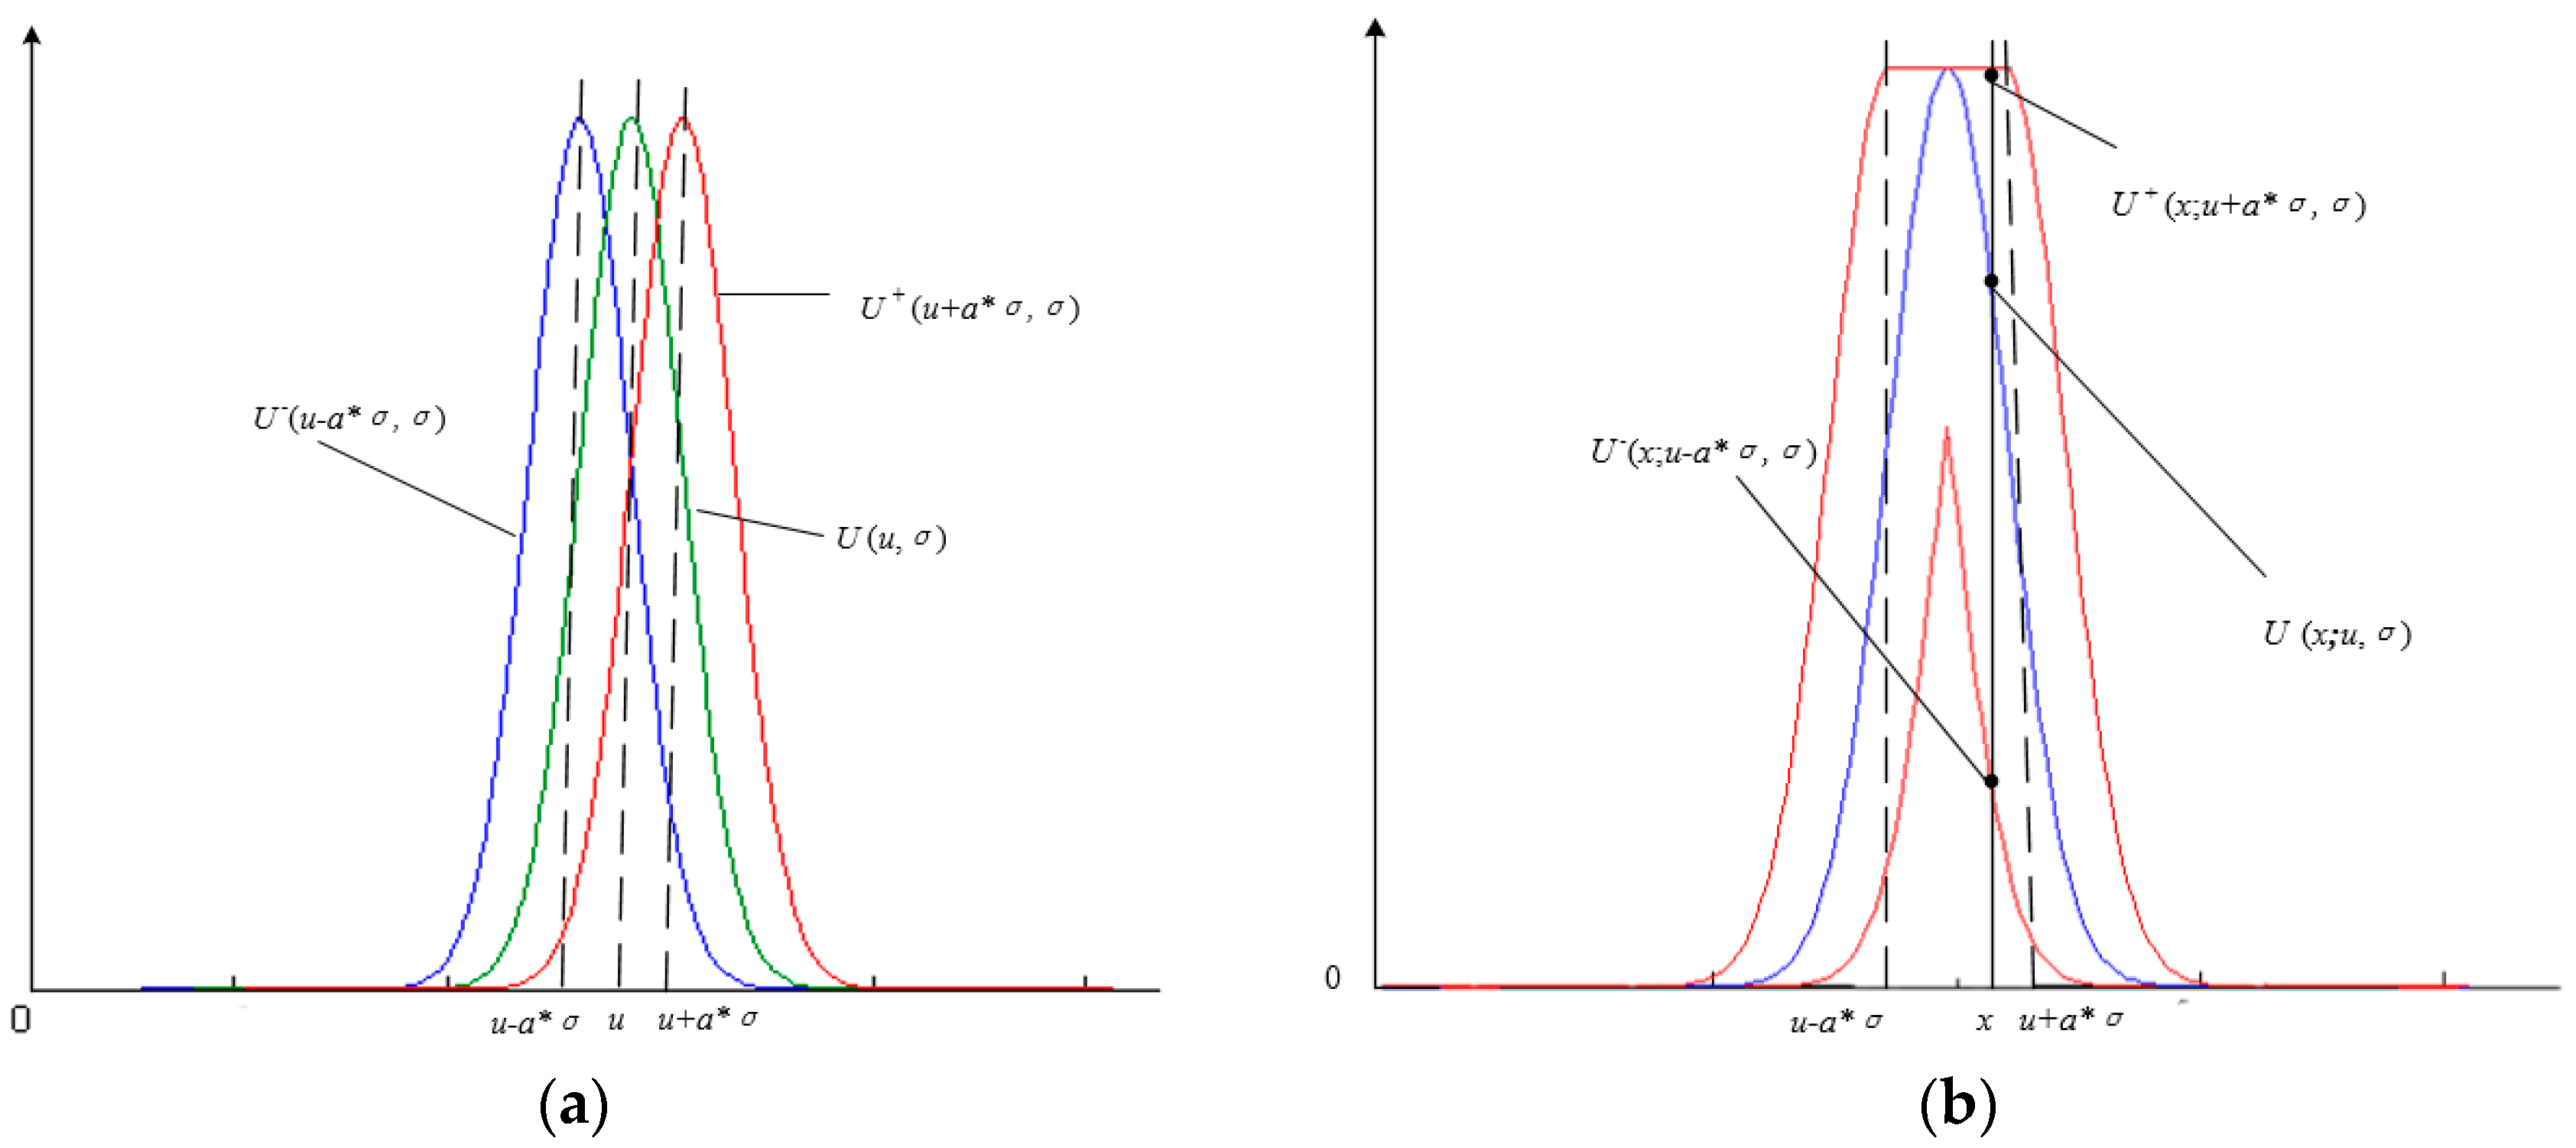
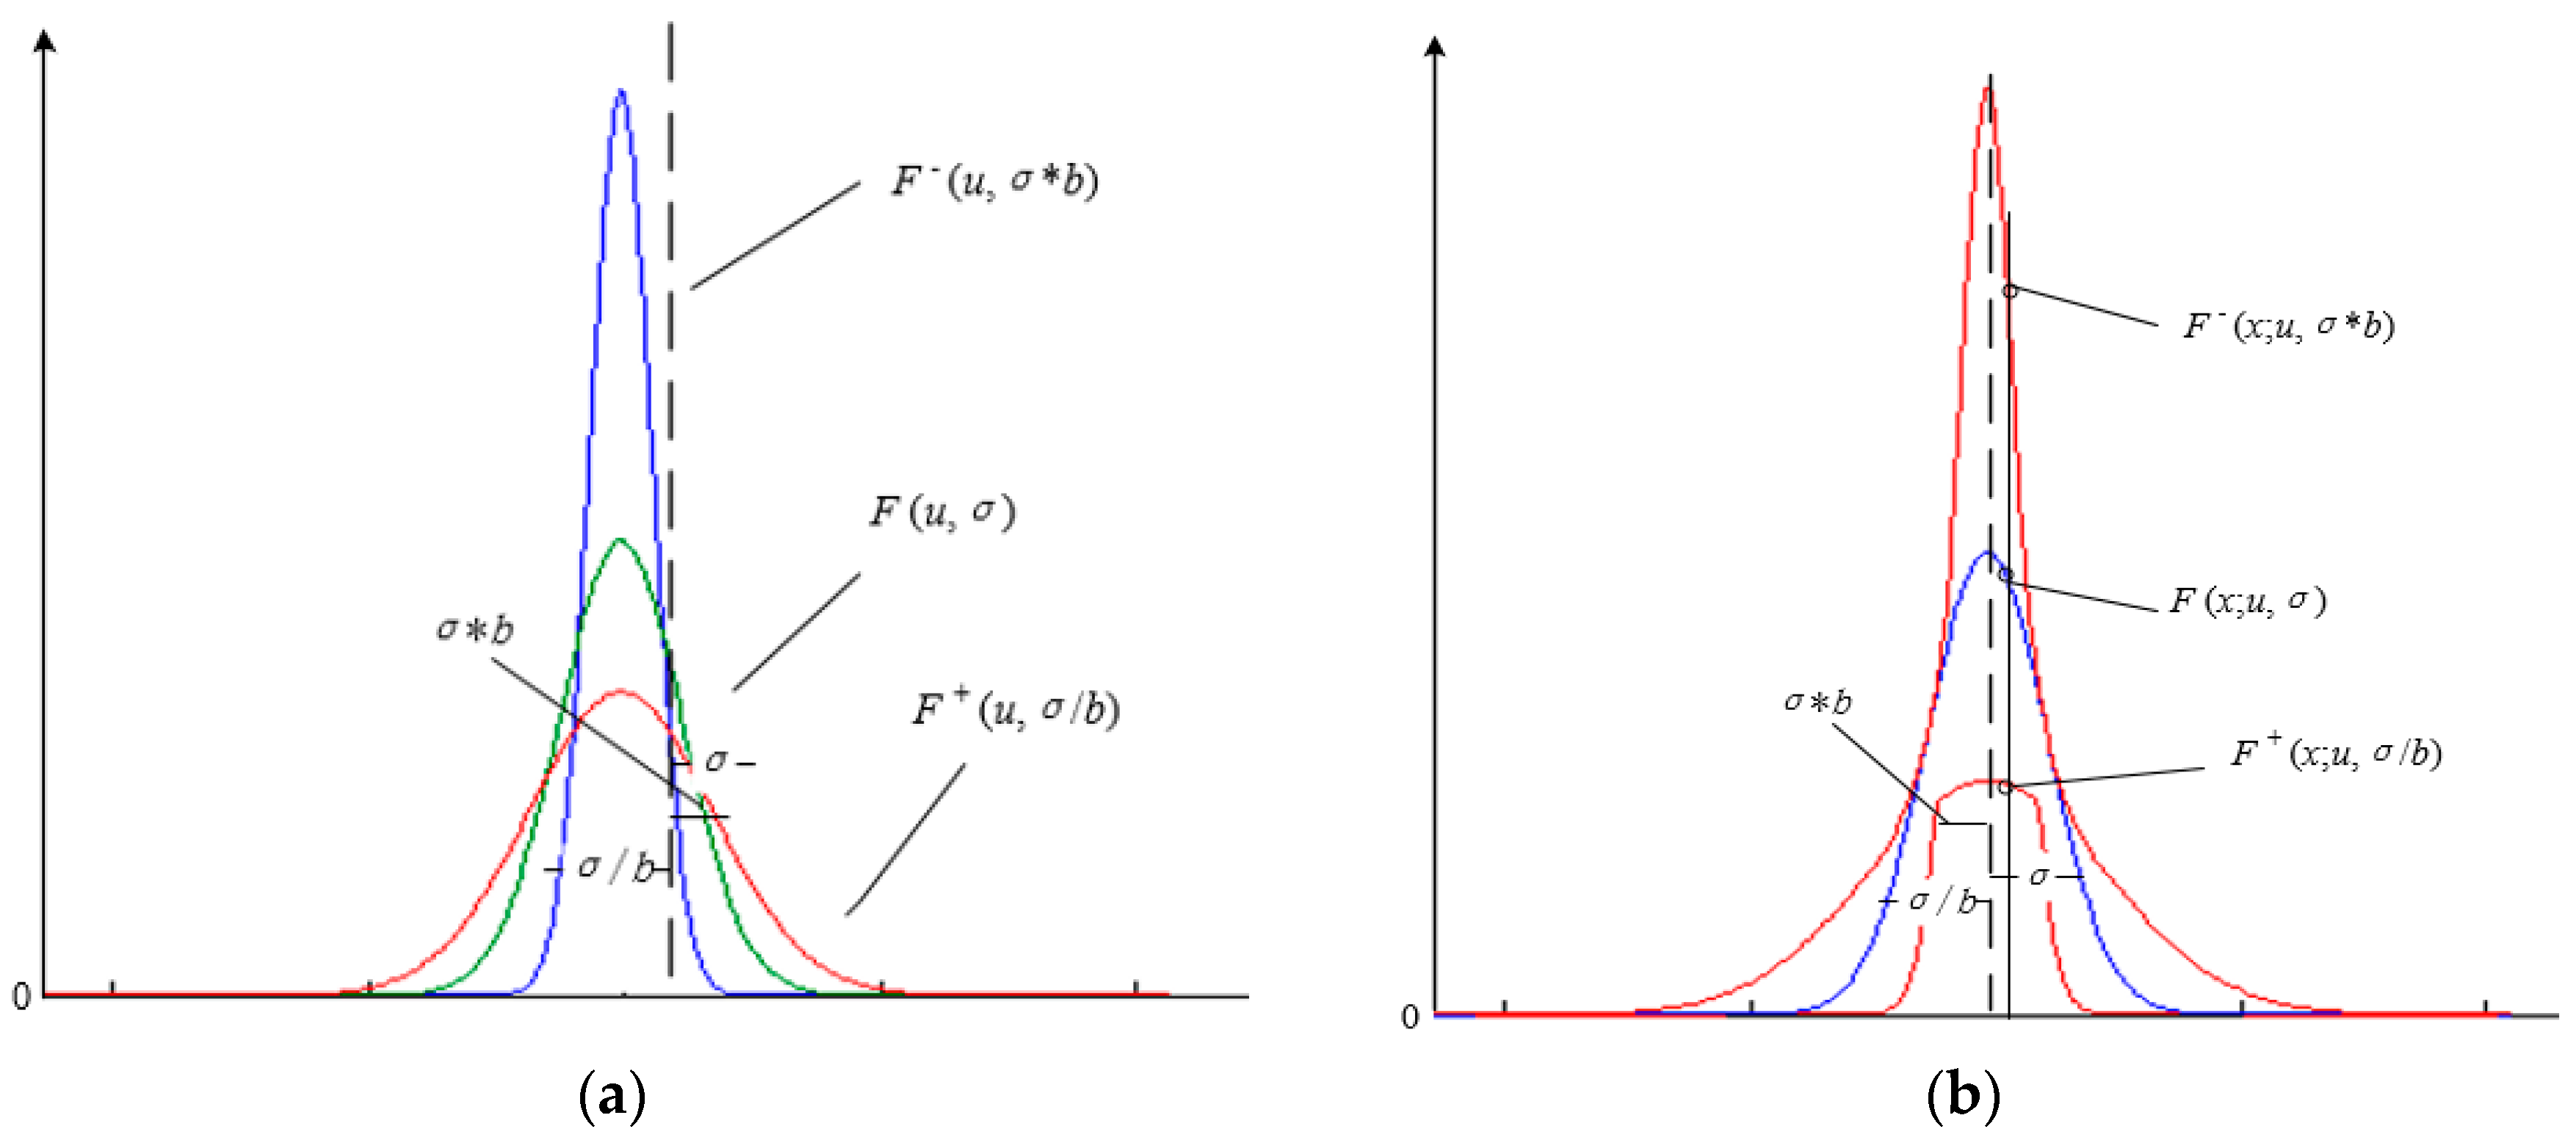
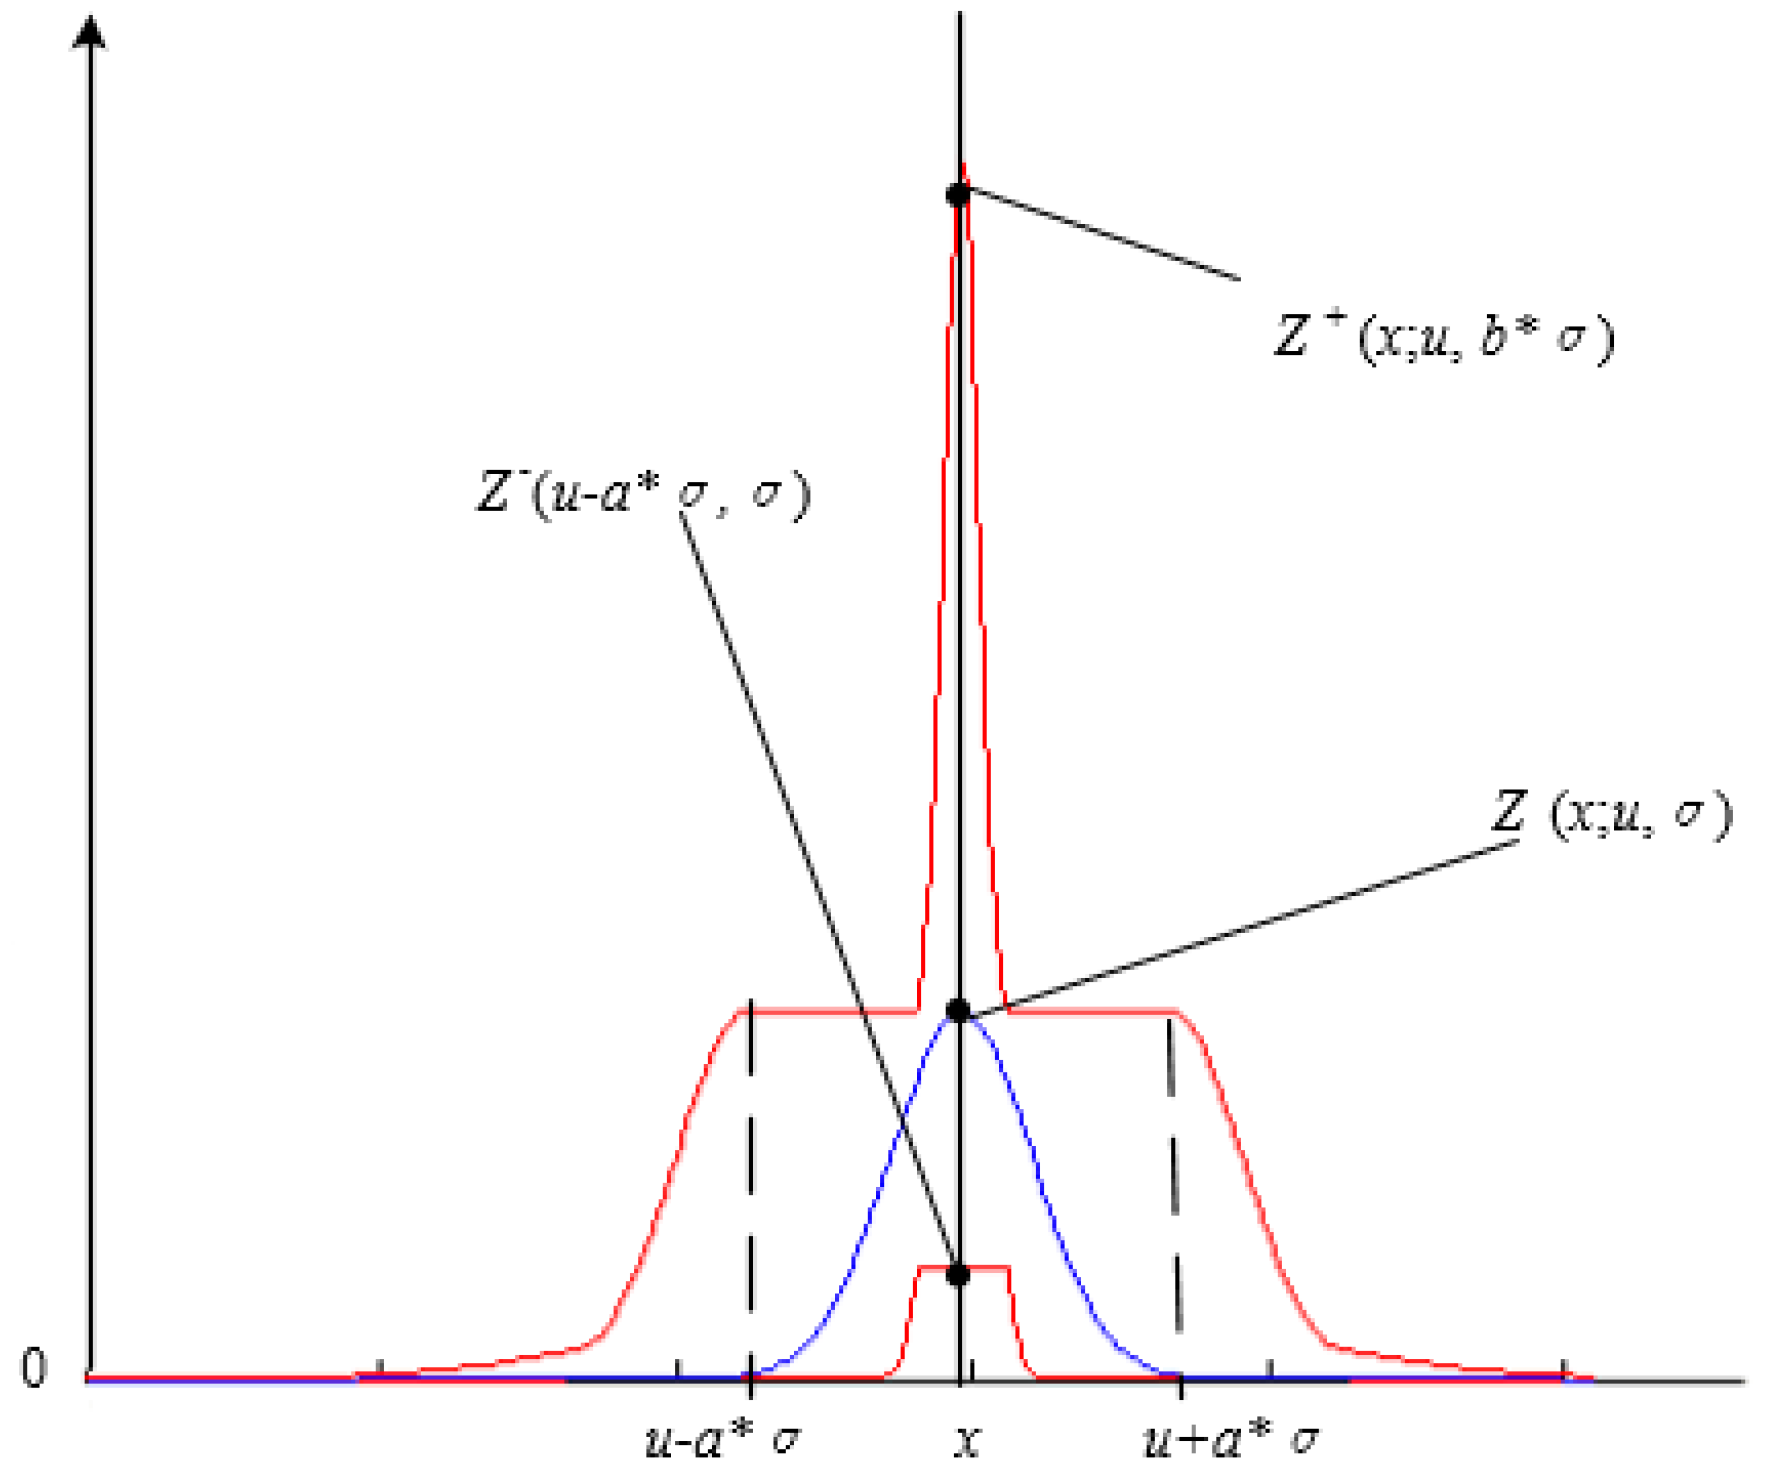
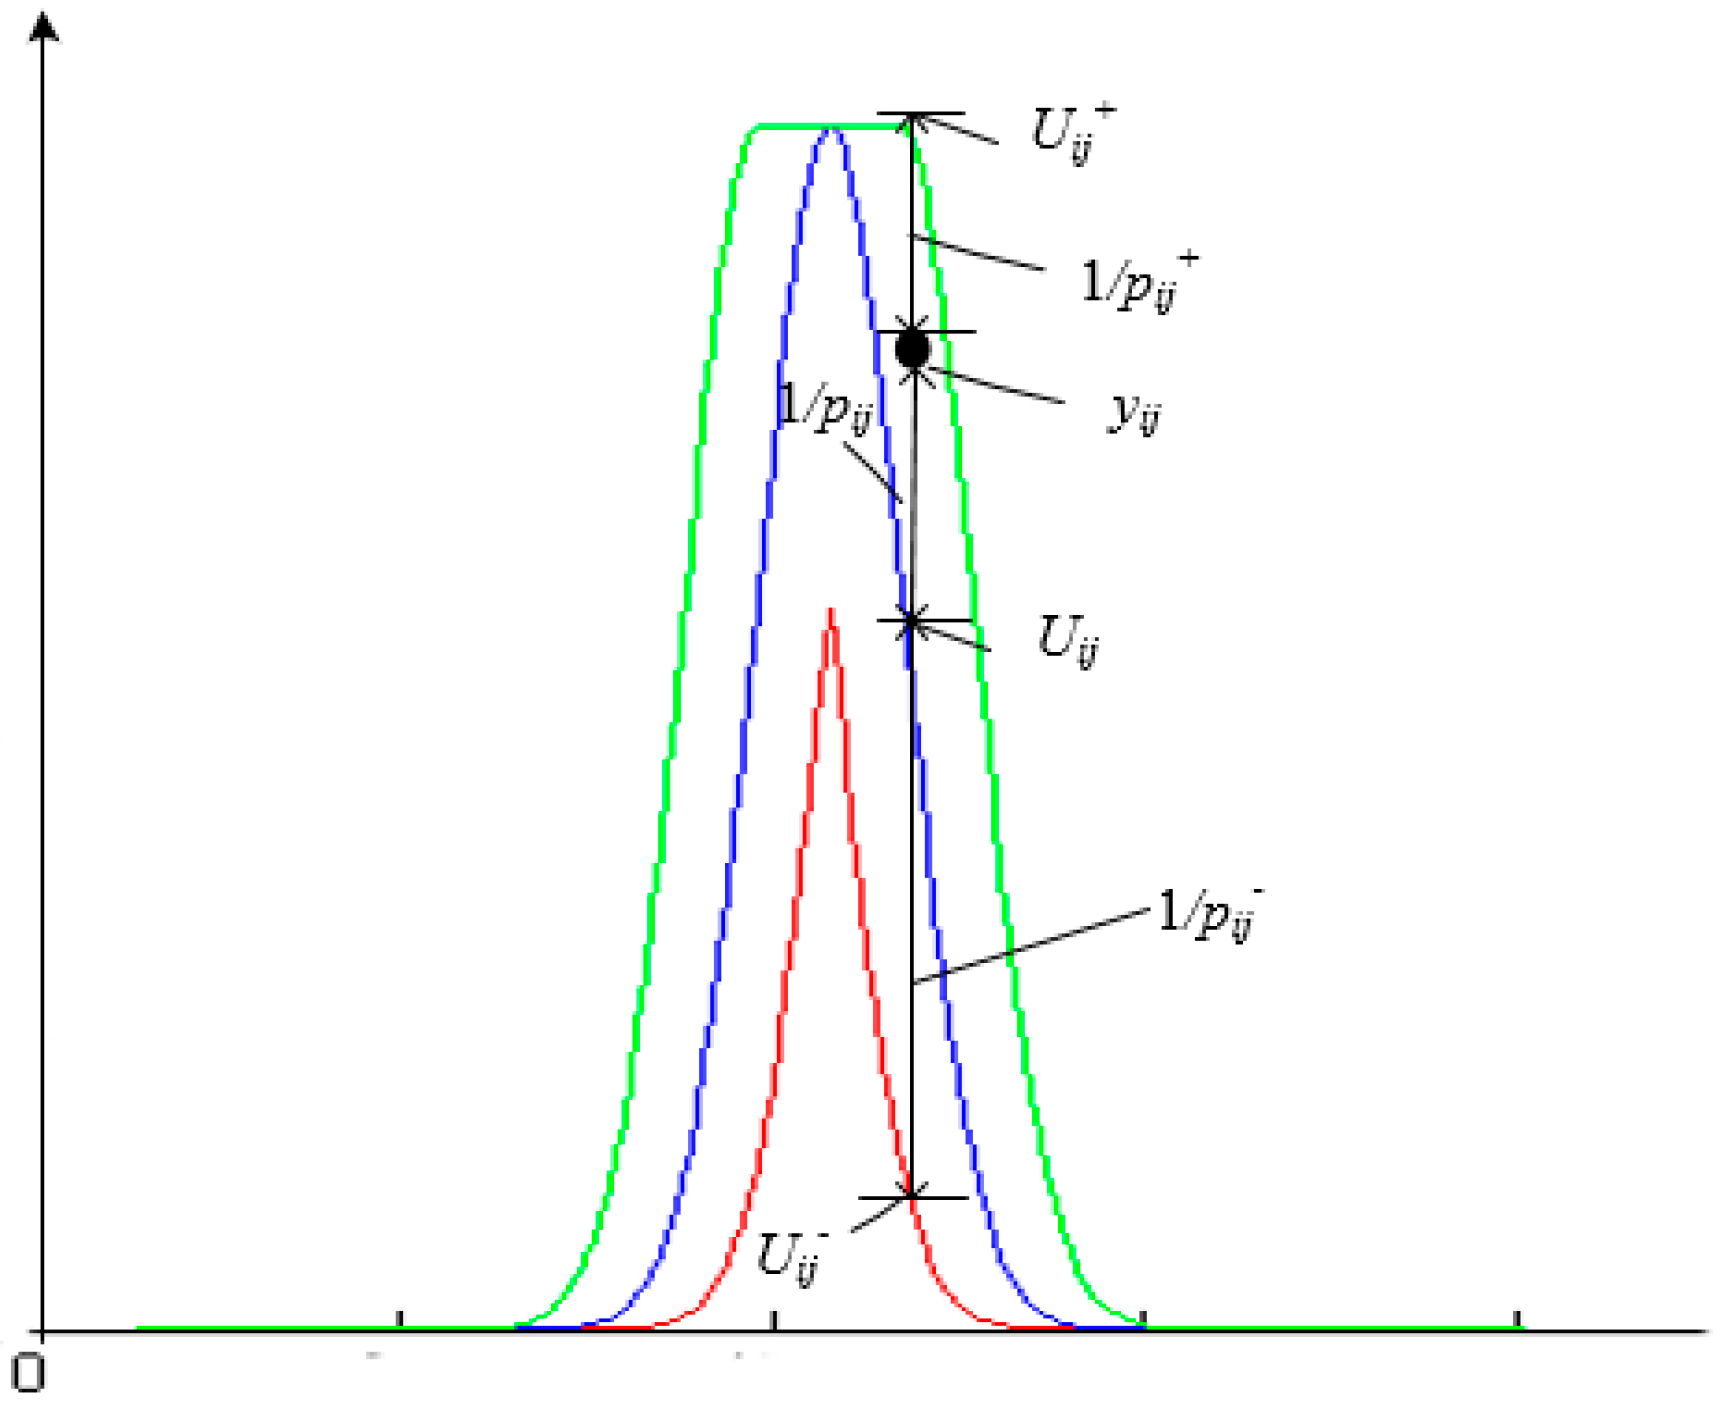
2.2. Interval Type-2 Fuzzy Membership Function Model for a Homogenous Region

On the basis of the Gaussian membership function in homogeneous regions and according to the 3σ criterion of Gaussian distribution, the parameters of fuzzy membership function for a homogeneous region are fuzzed to build the following three interval type-2 fuzzy membership function models. They are the models with uncertain mean, with uncertain standard deviation, and with uncertain mean and uncertain standard deviation, respectively. For the previous interval type-2 fuzzy models, the membership of each pixel is an interval, and all of the elements in the interval appear with the same probability.
The Gaussian distributions with uncertain mean or uncertain standard deviation, and with uncertain mean and uncertain standard deviation are defined, as follows:
  U i j ( x ; u , σ ) = α j 1 2 π σ j exp { ( x i u j ) 2 2 σ j 2 }     u j     [ u j ,   u j + ]   or
  U i j ( x ; u , σ ) = α j 1 2 π σ j exp { ( x i u j ) 2 2 σ j 2 }     σ j     [ σ j ,   σ j + ]   or
U ( x ; u , σ ) = α j 1 2 π σ j exp { ( x i u j ) 2 2 σ j 2 }     u j     [ u j ,   u j + ] ,     σ j     [ σ j ,   σ j + ]
where u′ and σ′ denote uncertain mean and standard deviation. uj and μj+ and σj and σj+, are the left and the right boundary of the jth interval mean and standard deviation.
The upper and lower membership functions of the interval type-2 fuzzy model with uncertain mean, as shown in Figure 2, are given by:
U i j + ( x ) = { U i j ( x ; u , σ )       x i < u j α j                 u j <   x i < u j + U i j ( x ; u + , σ )             x i > u j + ,   and
U i j + ( x ) = { U i j ( x ; u + , σ )             x i u j + u j + 2 U i j ( x ; u , σ )             x i > u j + u j + 2 ,
The upper and lower membership functions of the interval type-2 fuzzy model with uncertain standard deviation, as shown in Figure 3, are written as:
      F i j + ( x ) = U i j ( x ; u , σ ) ,   and
  F i j ( x ) = U i j ( x ; u , σ + ) ,
The upper and lower membership functions of the interval type-2 fuzzy membership function model with uncertain mean and uncertain standard deviation, as shown in Figure 4, are formulated as:
Z i j + = { U i j +                 U i j + F i j +     F i j +                   U i j + < F i j + ,   and
Z i j = { U i j                 U i j F i j     F i j                   U i j < F i j       ,
The factors aj and bj control the intervals in which the parameters vary
  u j = u j a j σ j                         u j + = u j + a j σ j             a j [ 0 , 3 ] ,
  σ j = σ j b j       σ j + = σ j × b j       b j = [ 0.3 , 1 ] ,
According to the 3σ criterion, the probability that the true value falls in [μ − 3σ, μ + 3σ] is 99.7%. Additionally, the mean and the standard deviation for a high-resolution remote-sensing image are positive, so aj ∈ [0, 3] and bj ∈ [0.3, 1] are set to control the change range of the Footprint of Uncertainty (FOU) of an interval type-2 fuzzy model. The bigger aj or smaller bj is, the wider the FOU range and the larger the uncertainty of the constructed interval type-2 fuzzy membership function model.
Because of the obvious features of ground objects in a high-resolution remote-sensing image, the difference in grayscale measures of ground objects in homogeneous regions is significant, and the uncertainty of the training samples is also relatively large. Therefore, training samples that were extracted by different users or even by the same one at different times may not be the same, and the corresponding membership function model for homogenous regions also will change greatly. The Gaussian membership function model that was constructed for a homogeneous region can be any curve shown in Figure 2a or Figure 3a, and the uncertainty also meets the 3σ criterion of normal distribution. That is to say, if a series of fuzzy membership function models are constructed within (μ − 3σ, μ + 3σ) or (σj/0.3, σj), a qualified membership function curve can be found within this region, no matter what kind of uncertainty exists (e.g., different grayscale measure, different people, different prior knowledge, different data source). Training samples of local sampling are uncertain, and the type-1 fuzzy model based on the uncertain local training samples is also uncertain. In this case, the interval type-2 fuzzy model (given an uncertain region for the type-1 fuzzy model) can effectively characterize the modeling uncertainty. The interval type-2 fuzzy model essentially realizes a global constraint on the parameter changes of the type-1 fuzzy image model, and it describes the global membership in the same region by modeling the uncertainty of the classification decision.
As shown in Figure 2b, Figure 3b, and Figure 4, for a given variable x, there is a clear membership U in the original type-1 fuzzy membership function, and the membership function is within [U, U+] for the interval type-2 fuzzy membership function. If a (b) is set to be 3 (0.3), in accordance with Equation (5), then there is a 99.7% probability that there is a “real” membership (true value corresponding to the observed value) of x within [U, U+], and the boundary information reflects the uncertainty degree of the membership function model.
As shown in Figure 2, the interval type-2 fuzzy membership function model with an uncertain mean is the region that is surrounded by the red solid lines in Figure 2b. With the change of adjustment factor a, the region that is covered by the interval type-2 fuzzy membership function model with an uncertain mean will change in the horizontal direction, but it will not change in the vertical direction. Therefore, this model is suitable for characterizing the uncertainty of the spectral measure in a homogenous region.
Figure 3a is the expression of the type-1 membership function model with the same mean and different standard deviations, and Figure 3b is the expression of the interval type-2 fuzzy membership function with uncertain standard deviation, where the solid red line represents the upper and the lower boundaries of the interval type-2 fuzzy membership function, and the solid blue line represents the original type-1 fuzzy membership function. As shown in Figure 3, for the interval type-2 fuzzy membership function model with uncertain standard deviation, and the changes of adjustment factor b, the region that is covered by the interval type-2 fuzzy membership function model will change in the vertical direction. Therefore, this model is suitable for the homogeneous region where the change of spectral measure is not obvious, while the difference of frequency is relatively large.
Figure 4 shows the interval type-2 fuzzy membership function model with uncertain mean and standard deviation. The uncertainty is modeled in accordance with 3σ criterion in both the horizontal and the vertical directions, and the spectral measure uncertainty and the frequency uncertainty of the homogeneous region can be simultaneously characterized.
The parameters α, μ, σ, a, and b need to be estimated for the construction of an interval type-2 fuzzy membership function model in any homogeneous region. The adjustment factors a and b in this paper can be determined, according to prior knowledge. The estimation steps for the parameters of the interval type-2 fuzzy membership function model are as follows.
(1)
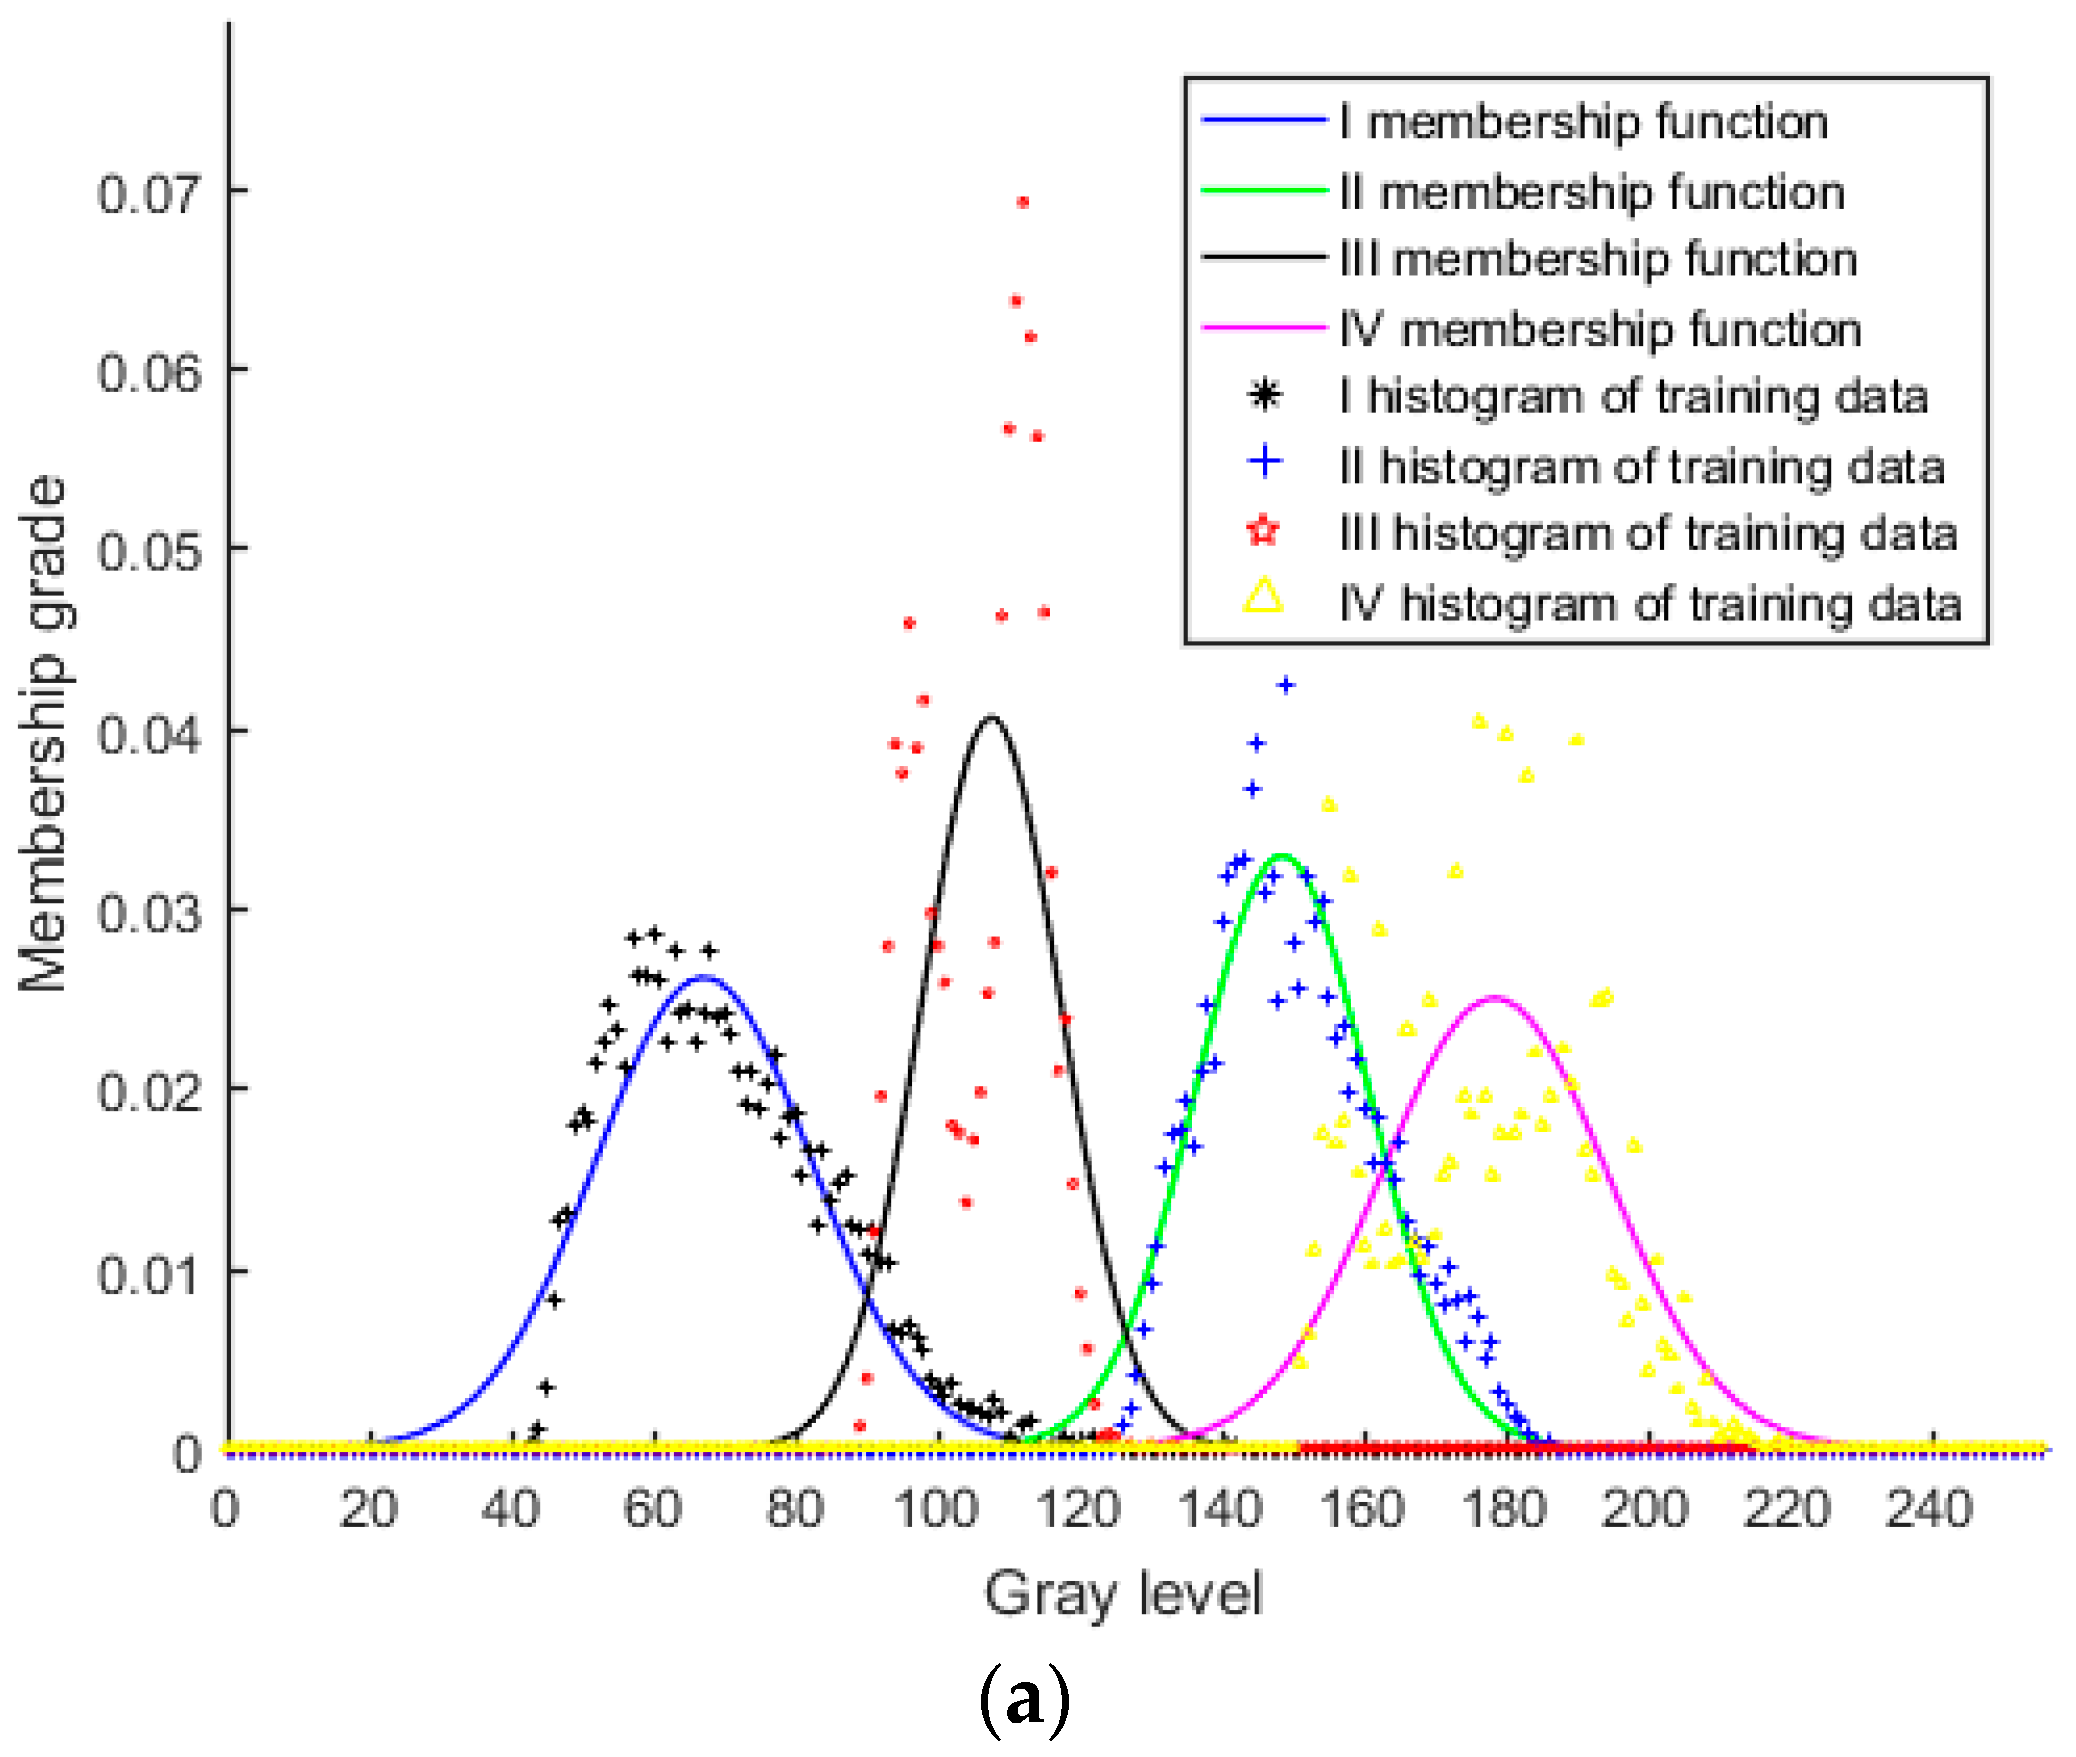
Supervise sample each region to be classified, and then solve the parameters α, μ, and σ by fitting the least square histogram.
(2)
Add adjustment factors a and b, in accordance with prior knowledge, and then according to Equations (12) and (13), construct the interval type-2 fuzzy membership function model with uncertain mean, the interval type-2 fuzzy membership function model with uncertain standard deviation, or the interval type-2 fuzzy membership function model with uncertain mean and uncertain standard deviation.

2.3. Classification Decision Model

For the category of any point on the image, its classification is only based on the single fuzzy membership when the traditional fuzzy classification method is used. In this paper, we proposes a classification decision model that is based on the weighted average method and considering the neighborhood pixel correlation. The modeling principle is as follows: in the grayscale space, the membership of the ith pixel belonging to the jth category is related not only to the three kinds of membership, but also to the membership of the neighborhood pixel belonging to the jth category. The greater the membership of the neighborhood pixel belonging to the jth category, the higher the membership of the ith pixel belonging to the jth category; that is, the category of a certain pixel is actually determined by the memberships of the pixel itself and its neighborhood pixels together. We constructed a fuzzy classification decision model integrated with spatial relations according to this principle:
F i j = 1 # N i i N i U i j * ,
where Fij″ is the membership of the ith pixel belonging to the jth classification decision and Ni is the set of 3 × 3 windows that are centered on the membership of the ith pixel in jth category. Defining Ni = 9, where i′ = 1, …, 9 is the pixel index for the window, Uij* can be calculated according to the following formula:
U i j * = P i j + U i j + + P i j U i j + P i j U i j P i j + + P i j + P i j
where Pij, Pij+, and Pij are the weights of the ith pixel belonging to the jth type-1 fuzzy membership, upper membership, and lower membership, respectively. Uij, Uij, and Uij+ are the weights of the ith pixel belonging to the jth type-1 fuzzy membership, lower membership, and upper membership, respectively.
The weight parameters are determined according to the similarity between the membership of training data belonging to the main, upper, and lower membership functions, and the training data histogram. We defined the similarity measure by Euclidean distance, that is, the weight decreases with the increasing in Euclidean distance between the membership value of the training data and the corresponding frequency value. Calculation can be carried out, as follows:
P i j = 1 ( y i j U i j ) 2 , P i j + = 1 ( y i j U i j + ) 2 , P i j = 1 ( y i j U i j ) 2
where yij is the frequency value of zi in the jth training sample, and the constraint that the weight of this point is 1, and the weight of other points is 0 when any denominator in Equation (16) is 0 is satisfied. The classification decision is determined by the membership only when any membership in a certain category of a pixel coincides with the histogram of this pixel. The interval type-2 model is type-reduced to a type-1 fuzzy model by the previous classification decision model.
According to Equations (14)–(16), we analyse the image to obtain the following fuzzy membership matrix:
F * = [ F i j ] n × k
To obtain a clear classification result, the fuzzy membership matrix F* of the classification decision model needs to be defuzzified. In this paper, we carried out defuzzification, according to the maximum membership criterion to realize the region classification.
D i = arg j { m a x { F i j } } i = 1 , , n ; j = 1 , , k
where Di is the category to which the ith pixel belongs, and the classification result is represented by D ={D1, D2, …, Dn}.
Figure 5 shows the determination of weight parameters when weighted average method is used to construct the classification decision model. The red and green solid lines, respectively, represent the lower and upper membership functions of the interval type-2 fuzzy model; the blue solid line represents the type-1 fuzzy membership function; and, the black dot represents the frequency of the ith pixel in the sample data of the jth category. In the least square histogram fitting process, the frequency value yij of the grayscale x in the histogram of the jth category is considered to be the expected value, and the corresponding membership is considered to be the measured value. The closer the measured value is to the expected value, the higher the accuracy of the measured value will be, and the greater the effect of the corresponding membership in classification decision is, and vice versa. This principle can be characterized by Euclidean distance among the three kinds of memberships and the corresponding histogram frequency. The effect of the corresponding membership in the classification decision will increase with a decrease in the distance among the three kinds of membership of training samples in a certain category and the corresponding frequency. In Figure 5, 1/Pij, 1/Pij+, and 1/Pij represent the weight of type-1 fuzzy membership, the upper membership, and the lower membership of the ith pixel over yij, respectively.
The specific flowchart for the proposed method is shown in Figure 6, where the solid line frame for each task needs to be completed, and the dashed line frame is the technique for realizing the task.

3. Experiments and Results

To verify the feasibility and effectiveness of the proposed method, we carry out classification experiments on high-resolution remote-sensing images with different resolutions and different scales using the proposed method and a traditional method. Additionally, we quantitatively and qualitatively evaluate the classification results.

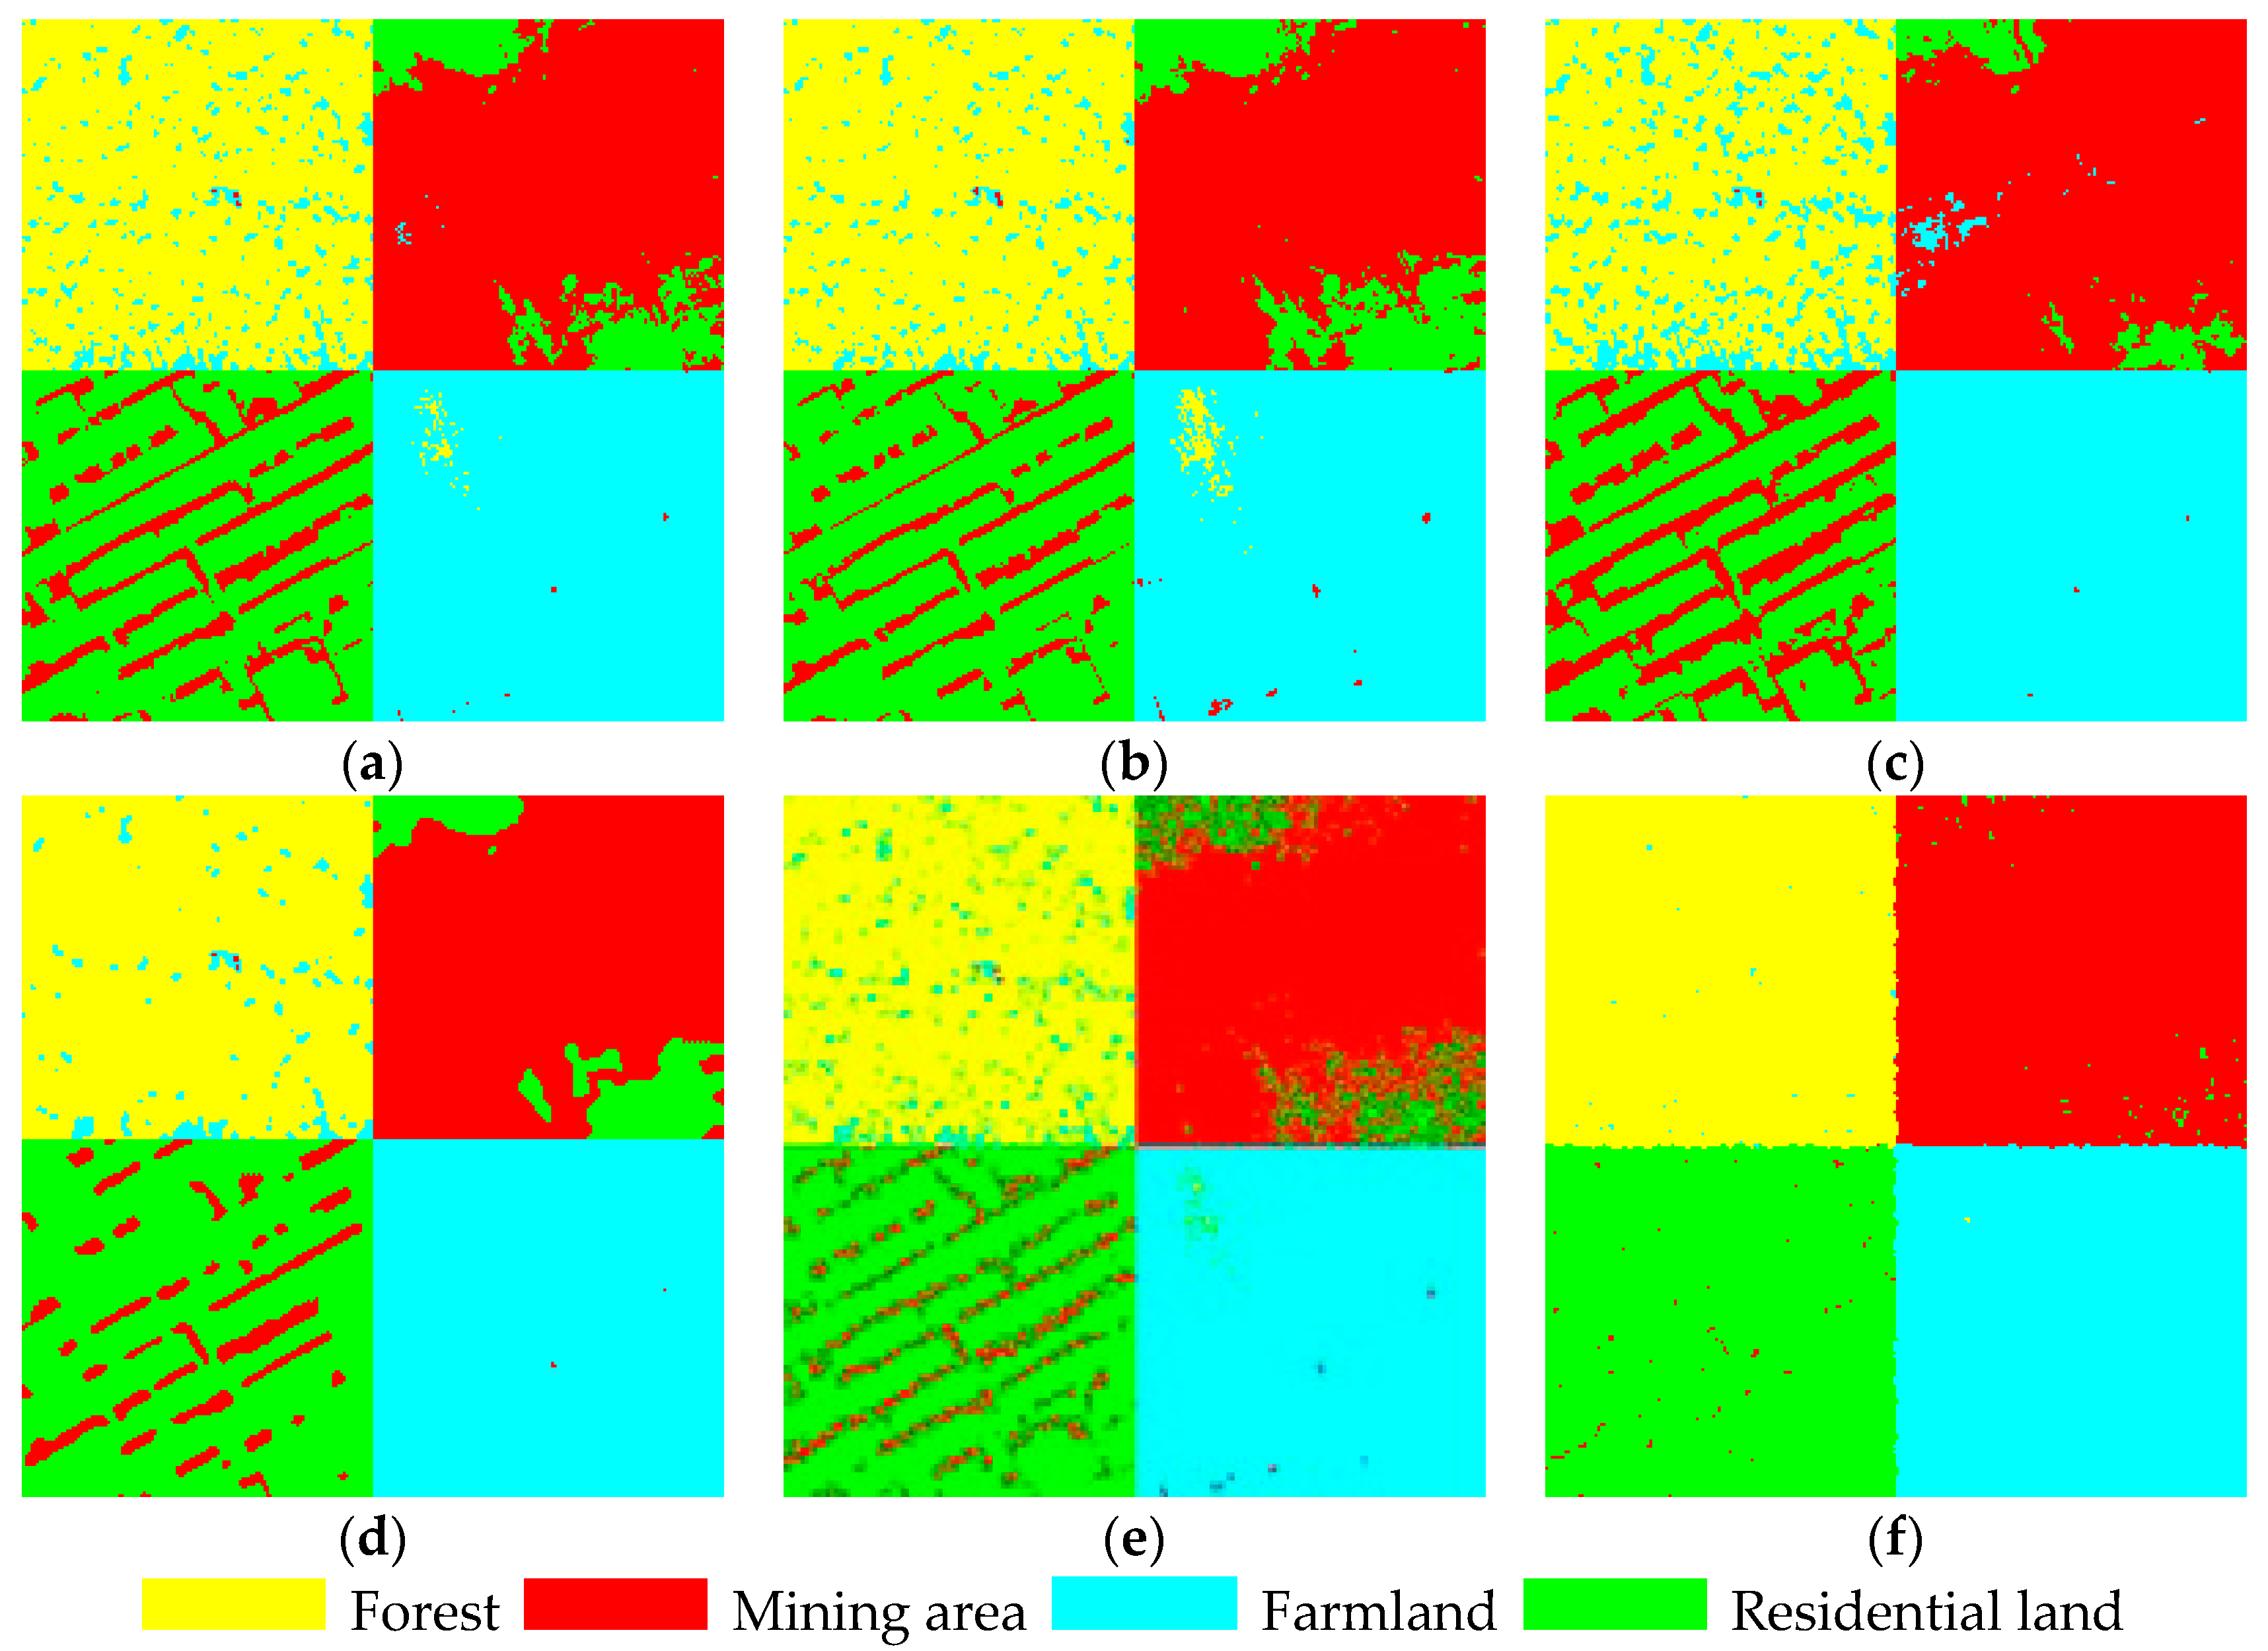
3.1. Experimental Results and Analysis of Synthetic High-Resolution Remote-Sensing Images

Figure 7 is a synthetic image that is composed by four types of ground objects that were acquired from a 0.6 m-resolution QuickBird panchromatic image. The size of the image is 256 × 256 pixels and contains four ground object types: forest (Class I), mine (Class II), farmland (Class III), and residential area (Class IV), where pits and rocks exist in the mining area (Class II), two kinds of crops with different grayscales exist in the farmland area (Class III), and houses, roads, and vegetation exist in the residential area (Class IV). These detailed features results in significant differences in the internal spectral measure of each homogeneous region, whereas the spectral measures of the heterogeneous regions have strong similarities, thus increasing the classification difficulty.
Figure 7 is a membership function model in a homogeneous region constructed based on the training data randomly sampled from Figure 7 by category and by a percentage of 30%. The horizontal axis is intensity and the vertical axis is membership. The solid lines of the four colors represent the training models of Region I to IV, respectively; and, “*”, “+”, “☆”, and “△” are the corresponding training data histogram of the four categories, respectively. Figure 8a is a type-1 fuzzy membership function model (fuzzy Gaussian membership function; and, Figure 8b is the best classification model based on uncertain mean and uncertain standard derivation, which has the best fitting effect and classification accuracy when we adopt the weighted average method (b1 = b2 = b3 = b4 = 0.3, a1 = a2 = a3 = a4 = 3).
In Figure 8, the training data histogram of the forest (Class I, represented by red “*”) and mining area (Class II, represented by blue “+”) presents an asymmetric distribution resulting from the detailed features in the homogenous region, the histogram of farmland (Class III, represented by green “☆”) presents a bimodal distribution, and the histogram of the residential area presents a complex irregular distribution (Class IV, represented by pink “Δ”). Because of the significant difference among the internal spectral measures for the homogenous regions of the four kinds of ground objects in the Quick Bird synthetic image, their histograms have different degrees of overlapping areas, which will cause the classification difficulty. These histogram distribution features can not be accurately fitted by the fuzzy Gaussian membership function (type-1 fuzzy model), as shown in Figure 8a. If it is used as the classification standard, the result will be affected by the poor fitting quality. As shown in Figure 8b, by the proposed method, the forest and the mining areas present an asymmetric unimodal distribution, the farmland area also presents a bimodal distribution and all can be accurately fitted. In addition, irregular curve fitting can be achieved for the residential area with irregular distribution.
Figure 9 shows the classification results that were obtained by different classification methods. Figure 9a–f are the fuzzy Gaussian membership function classification (type-1 fuzzy model), maximum likelihood classification, FCM classification, HMRF-FCM classification, optimal classification of weighted average method, and optimal classification of neighborhood weighted average method, respectively.
Table 2 lists the user accuracy, product accuracy, total accuracy, and Kappa coefficient that were obtained from the classification of the QuickBird synthetic image in Figure 7 by the previous methods. The higher these indicators are, the more accurate the classification results are.
Figure 9a,b are the classification results that were obtained by the fuzzy Gaussian membership function (type-1 fuzzy model) and the maximum likelihood method, respectively. The distribution curves of each ground object are assumed to be subject to Gaussian distribution, and the modeling principles are the same. For each region, although there are differences between user accuracy and the product accuracy after we adopt the two classification methods, the total classification accuracy is the same (total accuracy is 0.879 and the Kappa coefficient is 0.839). Figure 9c is the classification result that was obtained by the FCM method, and it is sensitive to the difference in the grayscale measure of the homogeneous region because of the FCM classification principle. The grayscale in the homogeneous regions of the four ground objects in Figure 7 is obviously changed, and among all of the classification methods, only the FCM method and the HMRF-FCM method are unsupervised. Generally, the classification accuracy of the unsupervised classification method is lower than that of the supervised method if the neighborhood relations are not considered. Therefore, the accuracy of the FCM classification method is the lowest (user accuracy is 0.857 and product accuracy is 0.809) compared with other classification methods. Figure 9d shows the classification result that was obtained by the HMRF-FCM method, and the salt-and-pepper noise of the classified area is largely suppressed as the relations among neighborhood pixels are considered in the classification process. Therefore, when compared with the FCM method, the fuzzy Gaussian membership function, and the maximum likelihood method, the classification accuracy of the HMRF-FCM method is enhanced to some extent (user accuracy is 0.898 and product accuracy is 0.863). Although the salt-and-pepper noise is effectively suppressed by the HMRF-FCM method, the regional noise is amplified and the over classification phenomenon is exacerbated, as shown in the light areas in the upper left corner and the lower right corner of the mining area. Figure 9e shows the classification result that was obtained by the weighted average method based on the interval type-2 fuzzy model. Thanks to the supervised sampling, the pixel grayscale distribution of the corresponding category can be reflected accurately by the histogram information of the training samples, and the training sample histogram can be more accurately fitted by the constructed classification decision model, all improving the noise immunity. Therefore, the classification accuracy is higher than that of the maximum likelihood method, FCM method, and HMRF-FCM method. The classification results have a lot of noise because the noise sensitivity to the spatial relationship of pixels is not considered in the maximum likelihood method, the FCM method, and the weighted average method. The fitting curves in Figure 8 correspond to Regions I, III, II, and IV in Figure 9, from left to right. As shown in Figure 8, the four ground objects in the fitting models have different degrees of overlapping areas, whereas the misclassified pixels are concentrated in the overlapping areas and the quality of pixel classification within these areas cannot be significantly improved by accurately fitting the histogram distribution features. For this reason, we integrated the neighborhood relations of pixels into the membership space of the image, as shown in Figure 9f. Then, we effectively solved the misclassified pixels in the overlapping areas of the fitted models and significantly improved the classification quality. The user accuracy and product accuracy of the neighborhood weighted method are both above 0.99, presenting the best classification result.
As shown in Table 2, the classification accuracy of the FCM method is the lowest, with a total accuracy of 0.857 and a Kappa value of 0.809. When we integrated spatial relations into the FCM method, we significantly improved the classification accuracy of the HMRF-FCM method, with a total accuracy of 0.898 and a Kappa coefficient of 0.863. When compared with the fuzzy Gaussian membership function (type-1 fuzzy model) method, the maximum likelihood method and the HMRF-FCM method, the total accuracy of the weighted average method is improved by 4.1%, 3.7%, and 3.2%, respectively, and the Kappa coefficient is increased by 5.0%, 4.9%, and 2.6%, respectively. This result proves again that the classification accuracy is affected by the quality of the fitted model. The more accurate the fitting model, the higher the classification accuracy. The HMRF-FCM method is suitable for the classification of high-resolution remote-sensing images as its classification accuracy is further improved.

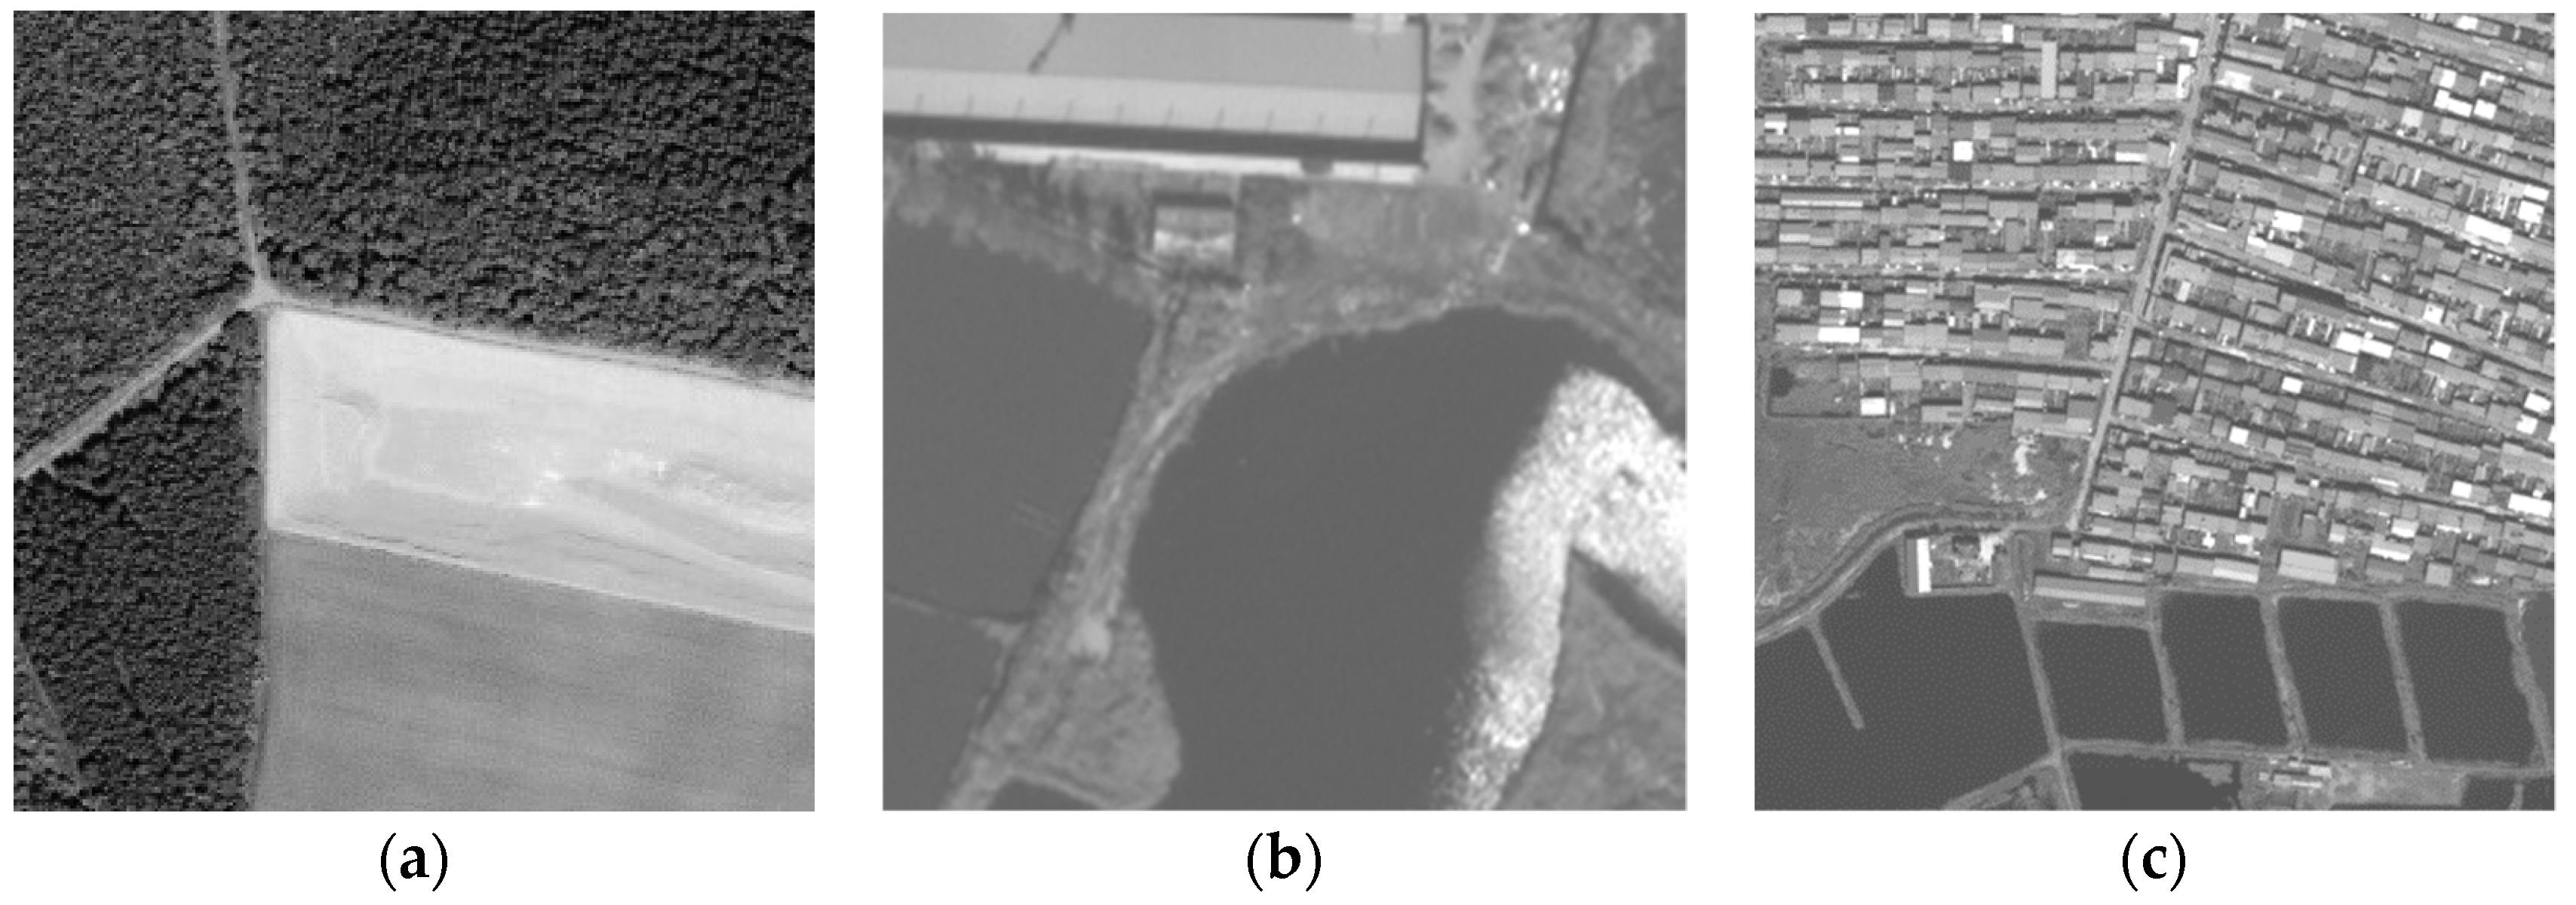
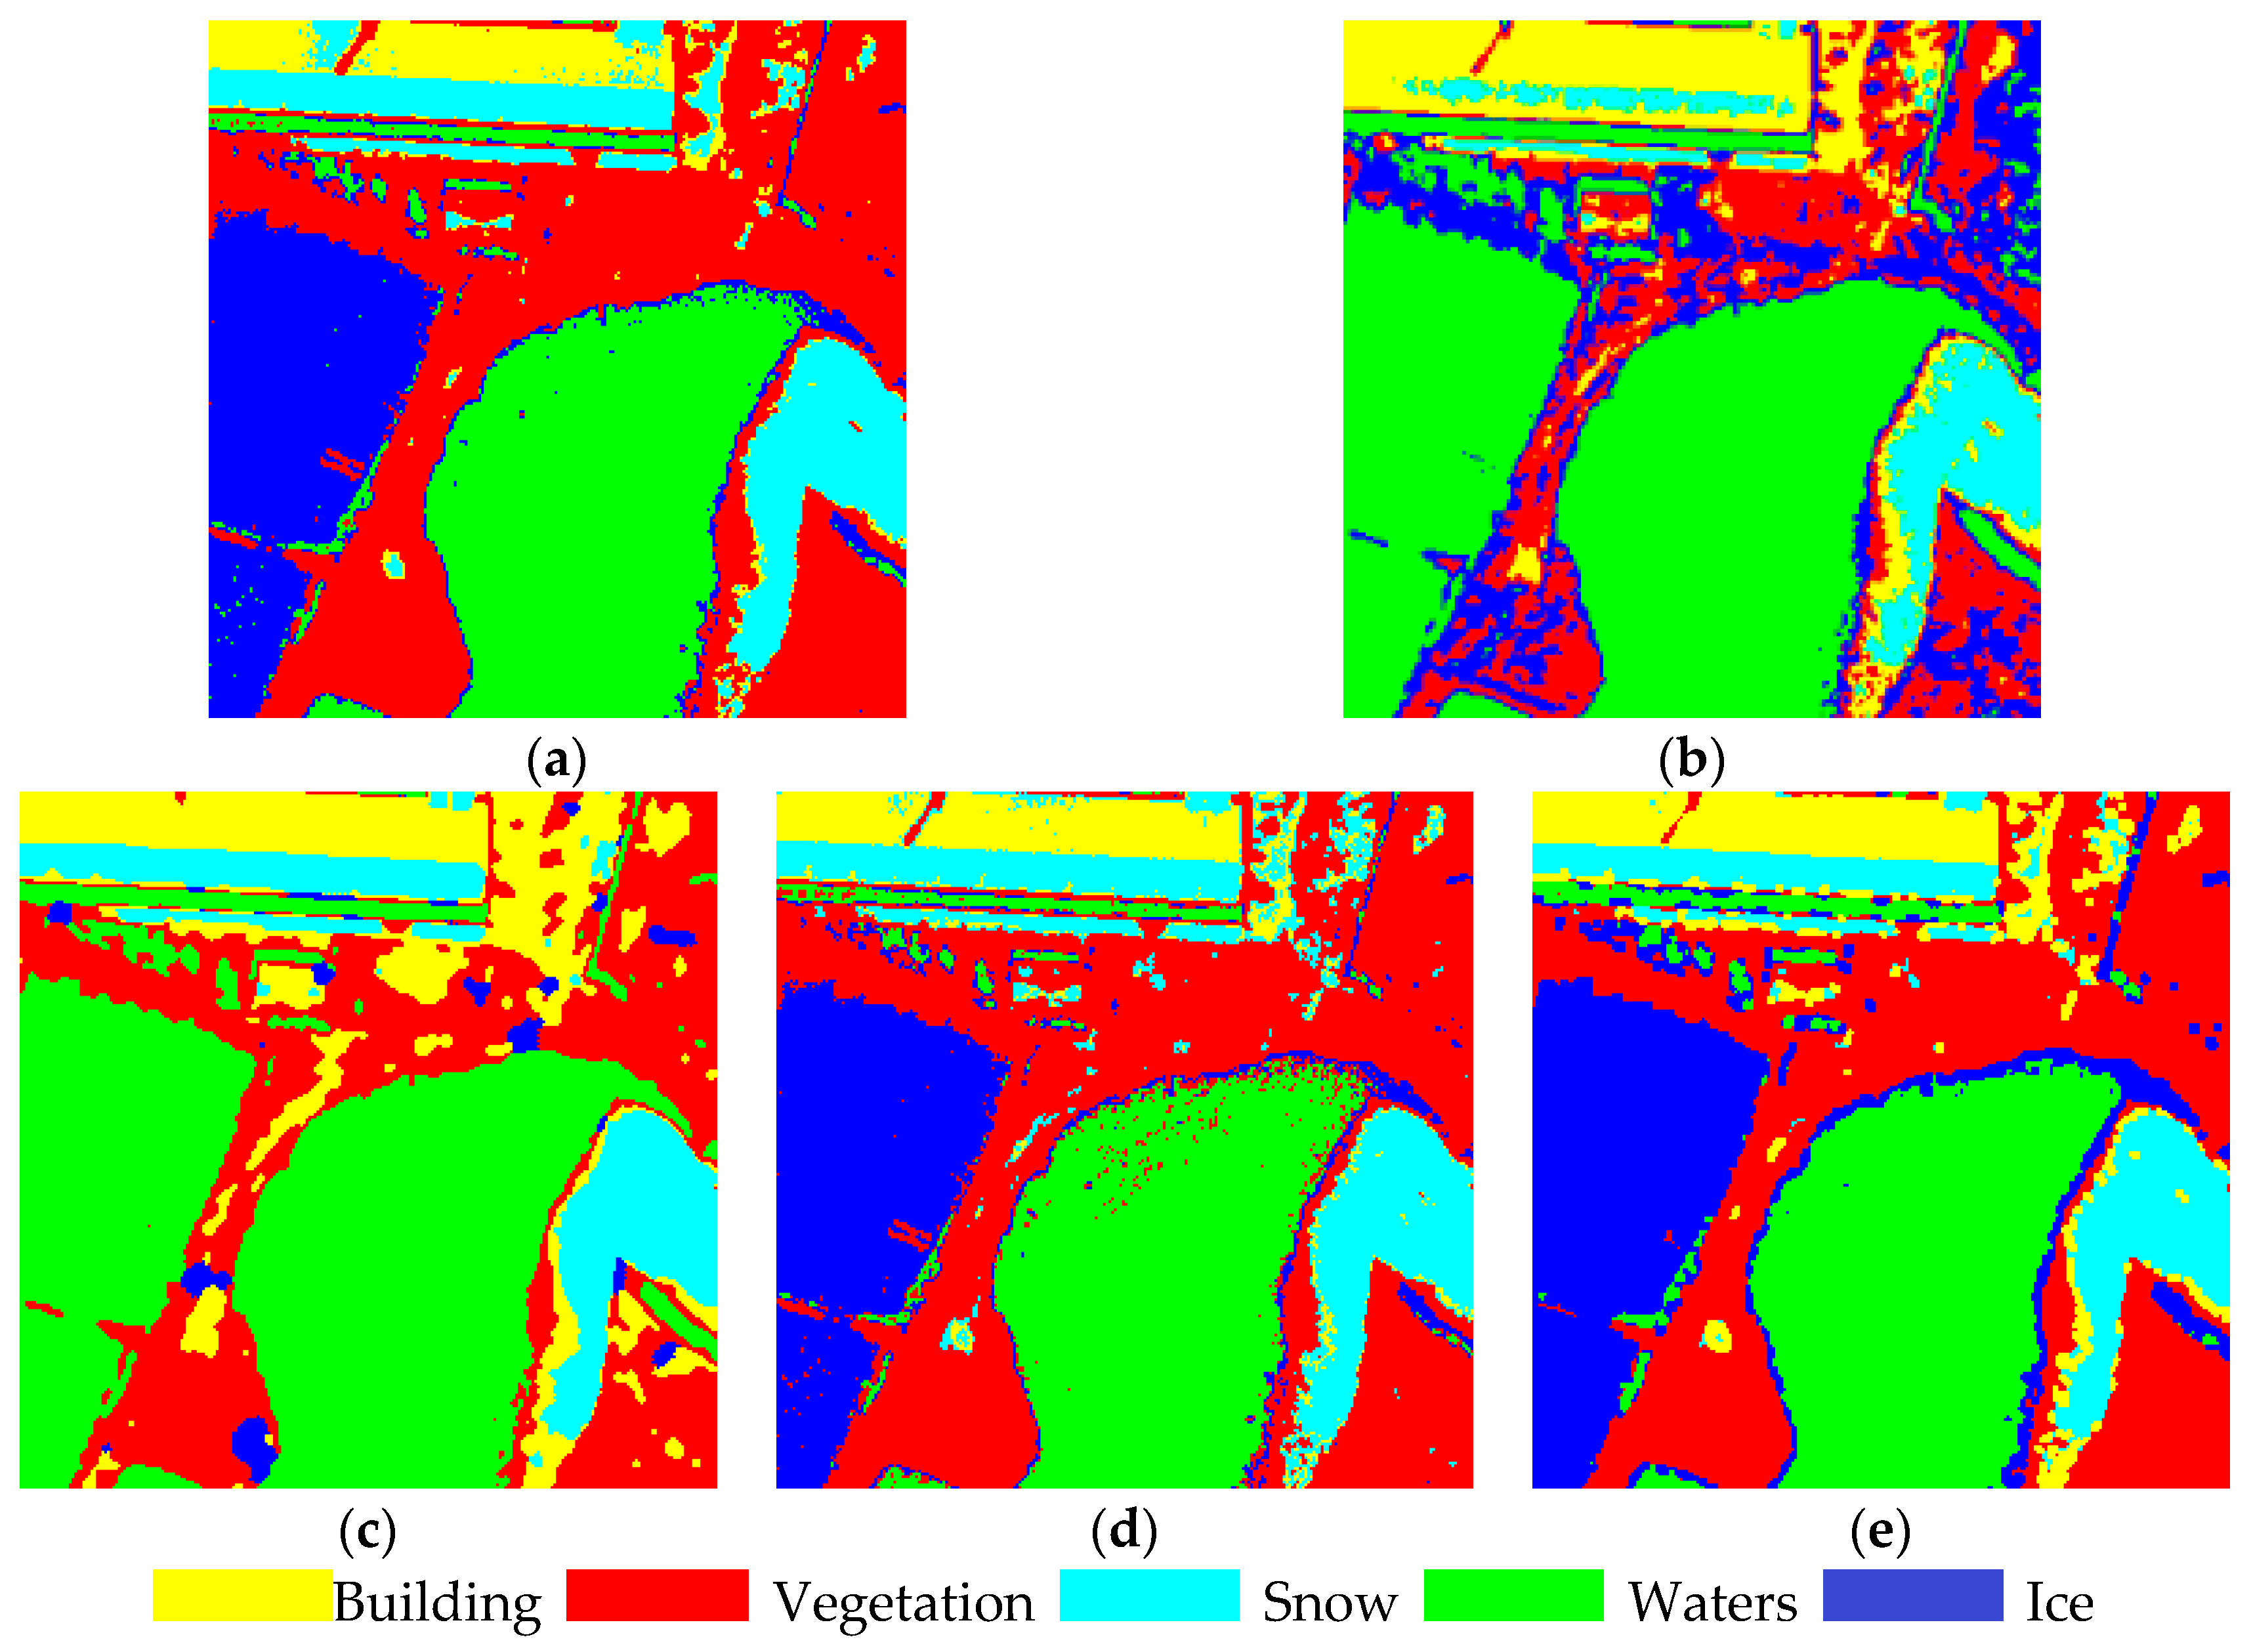
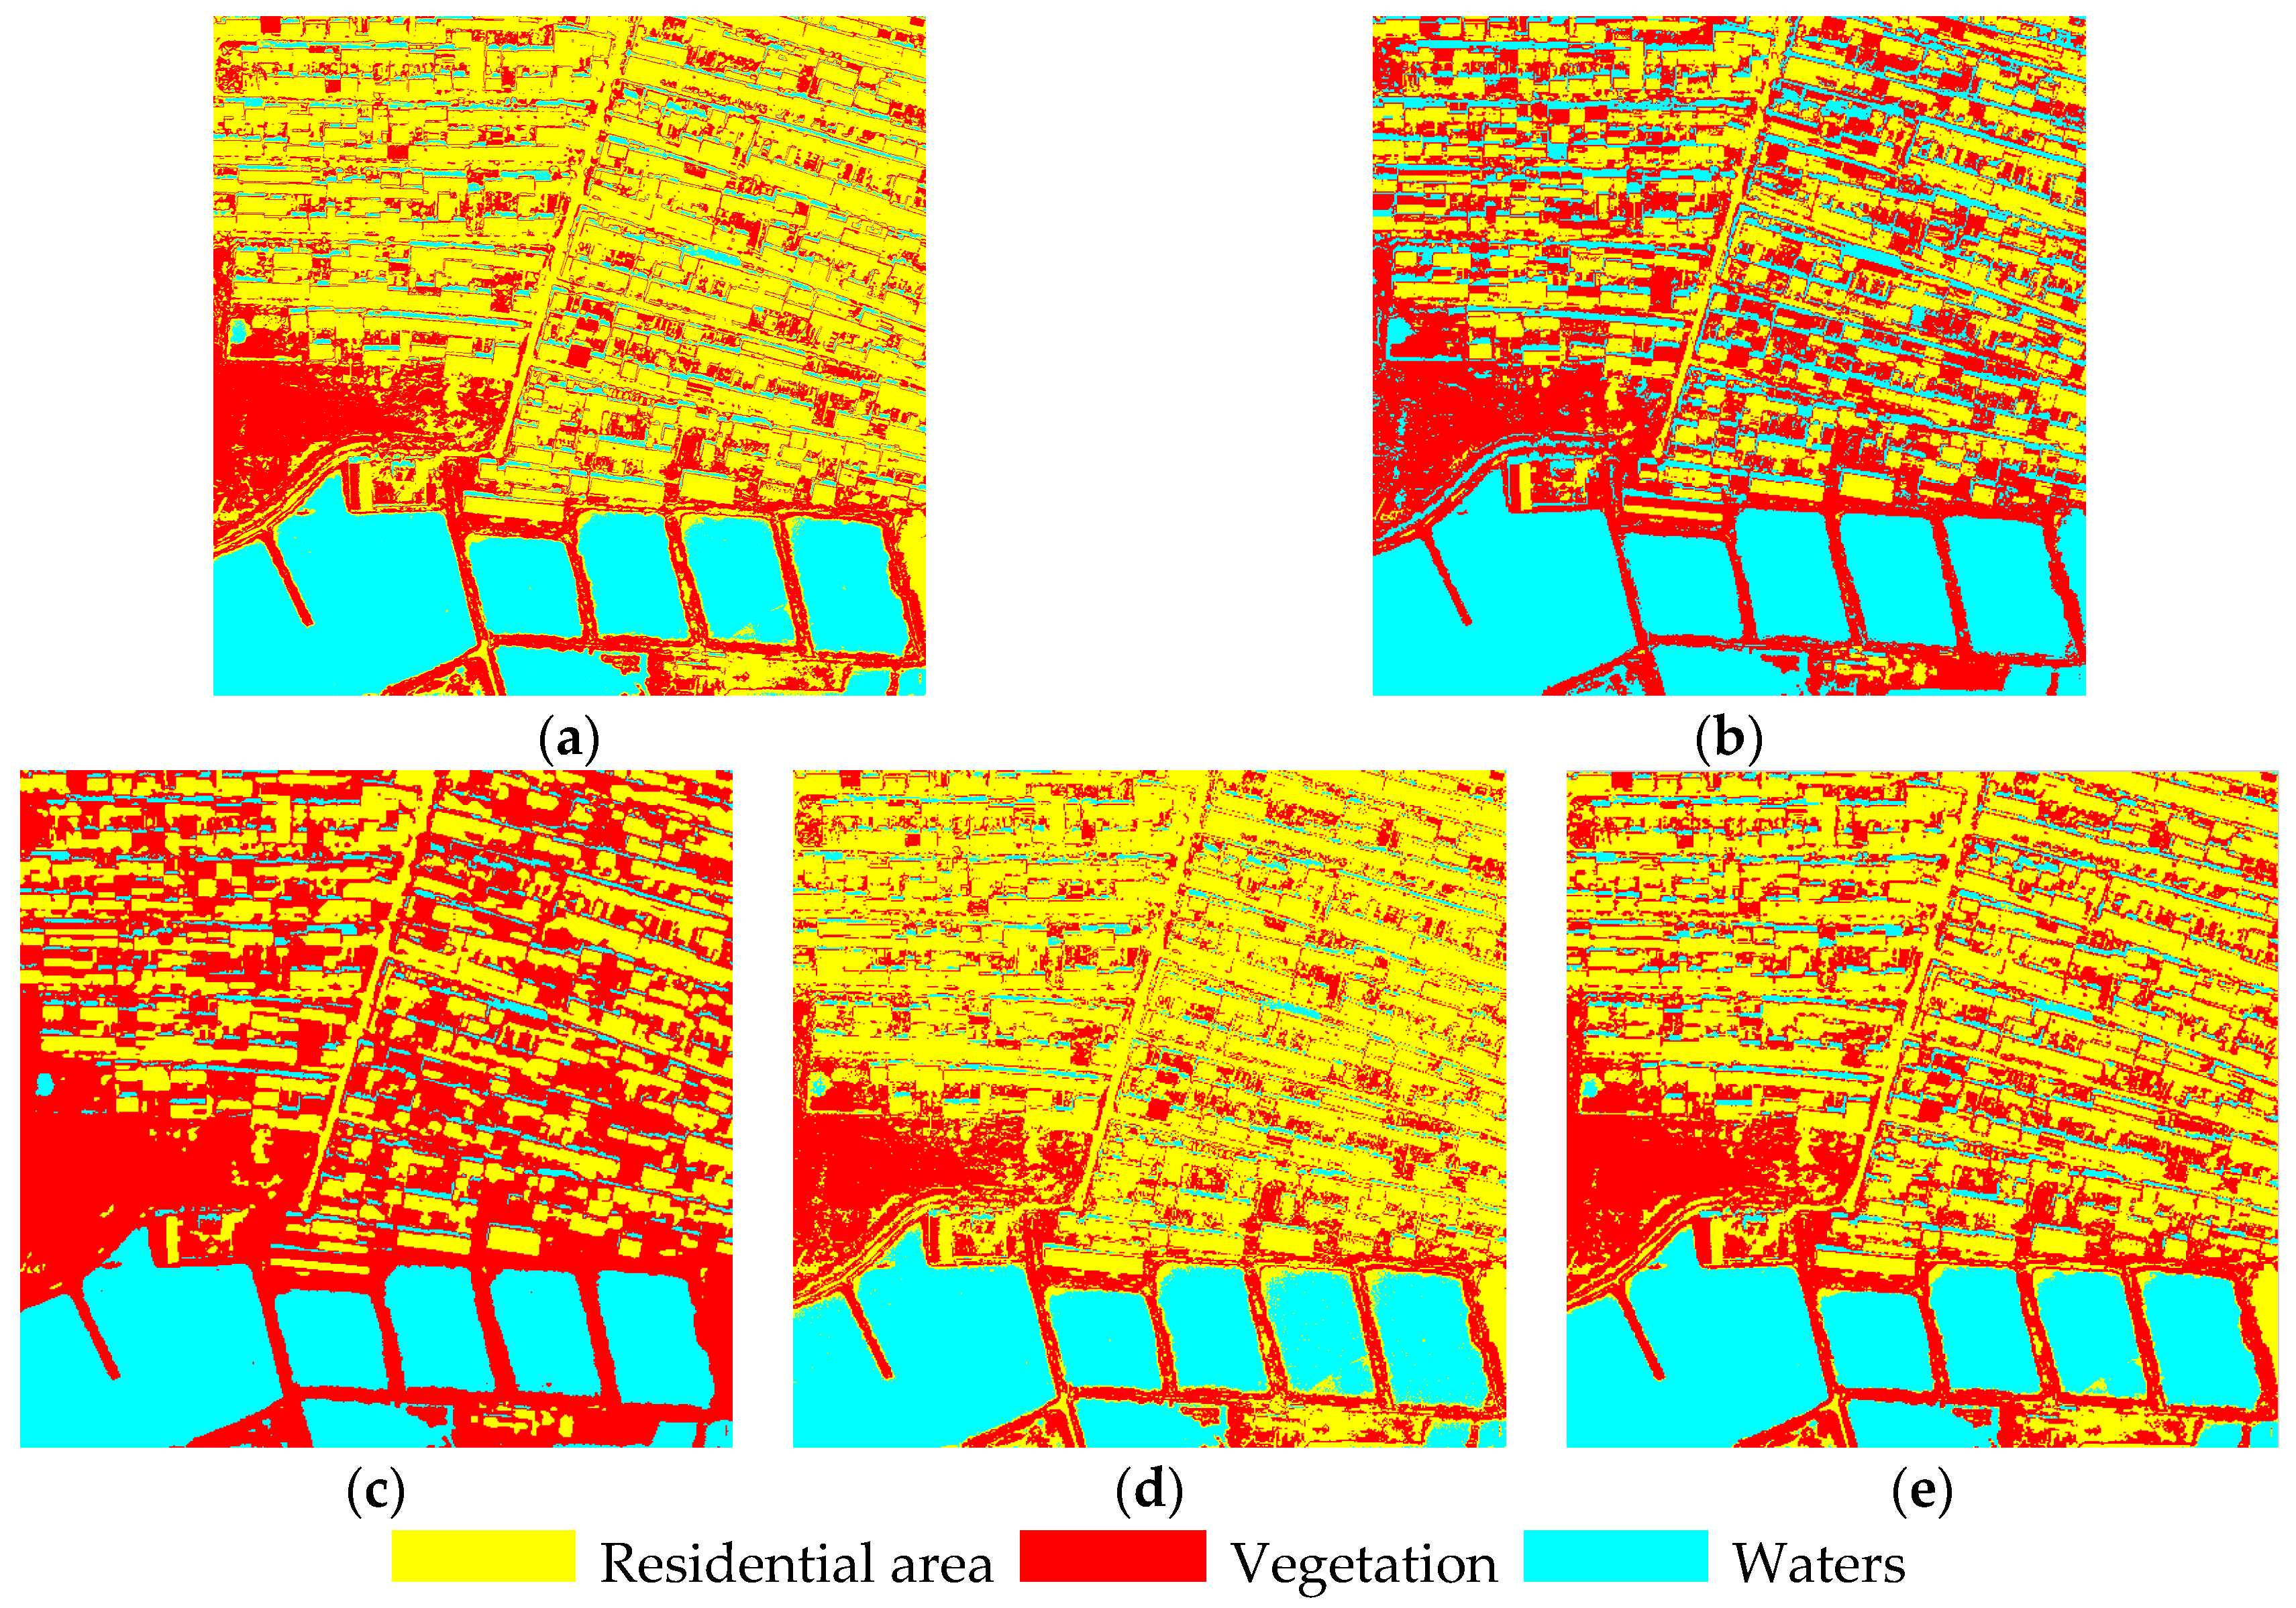
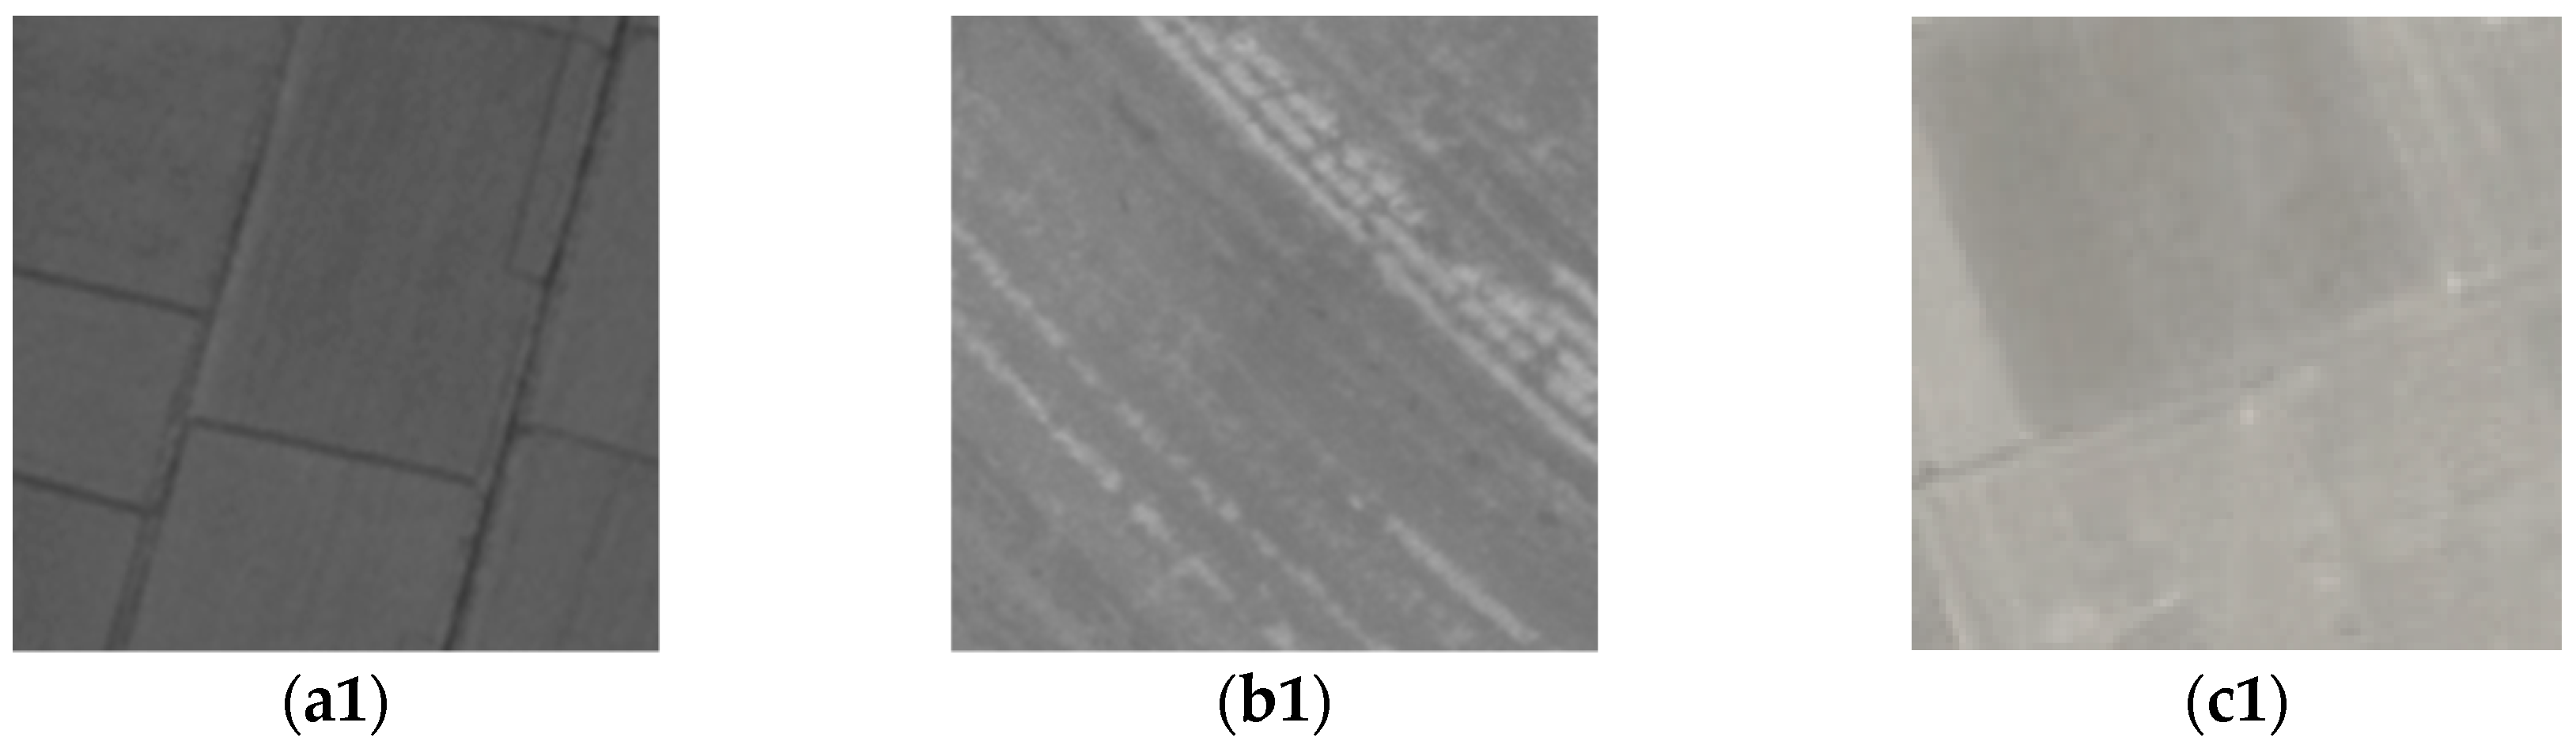
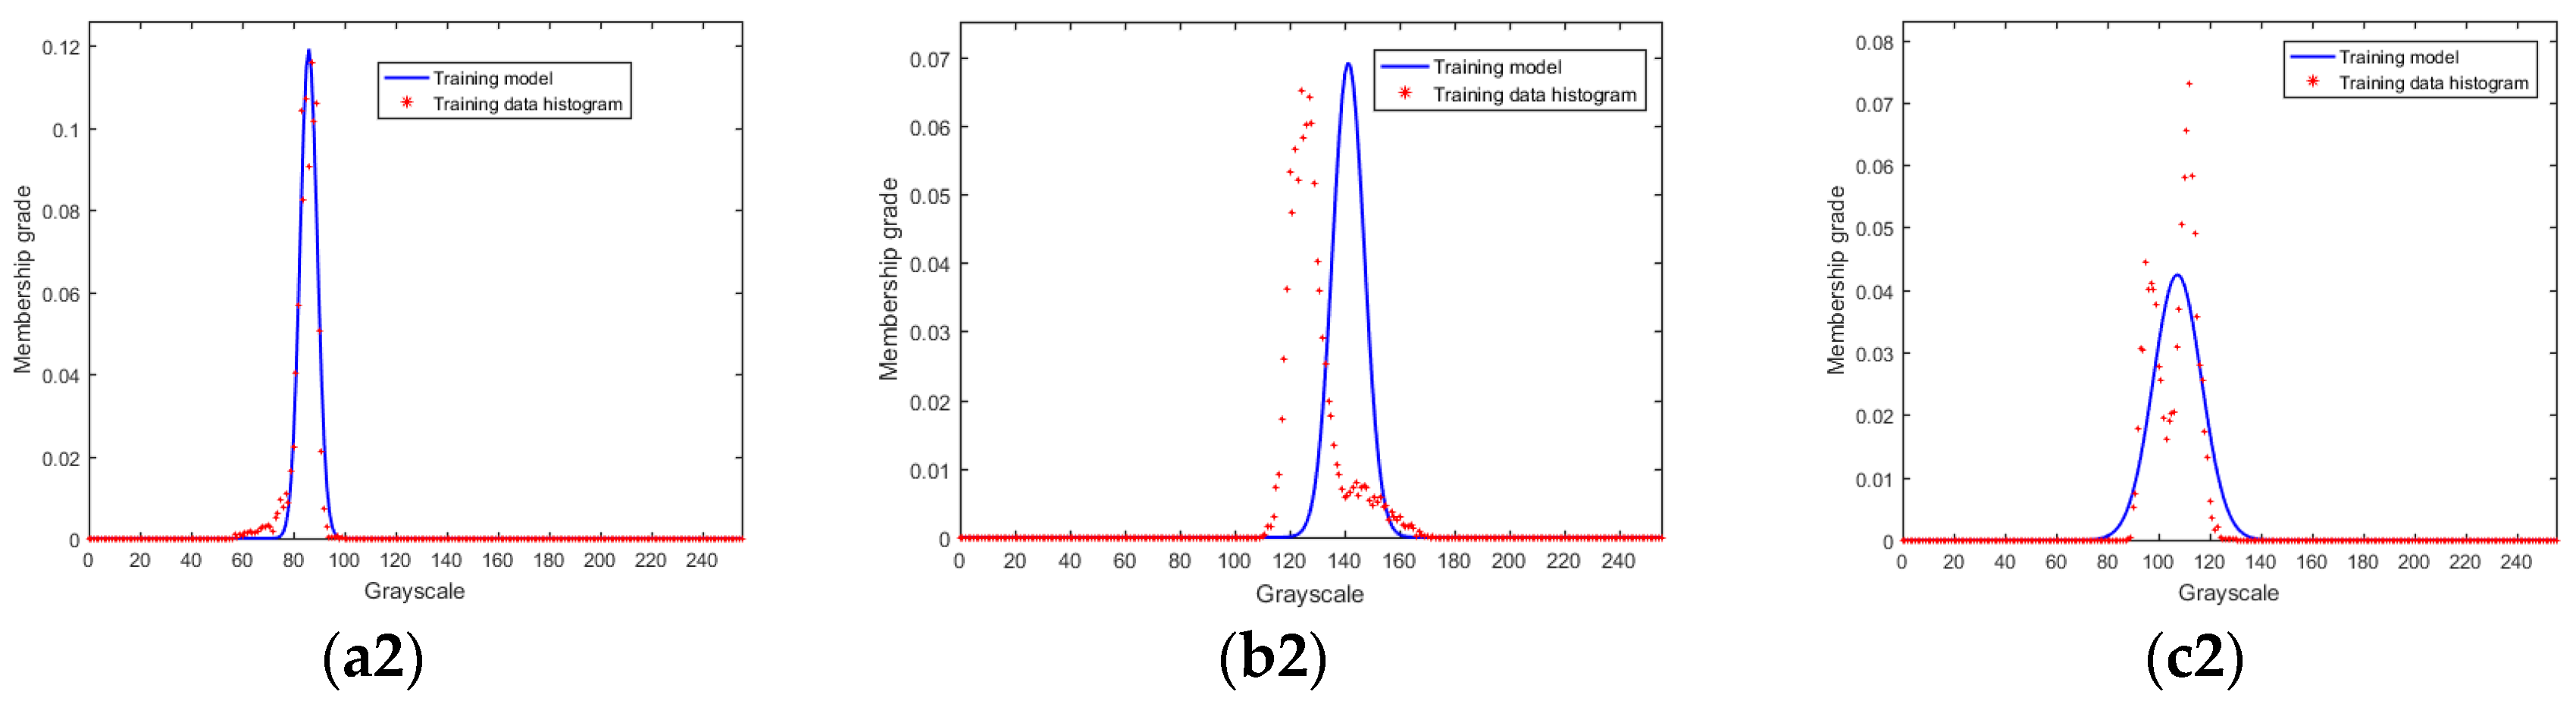
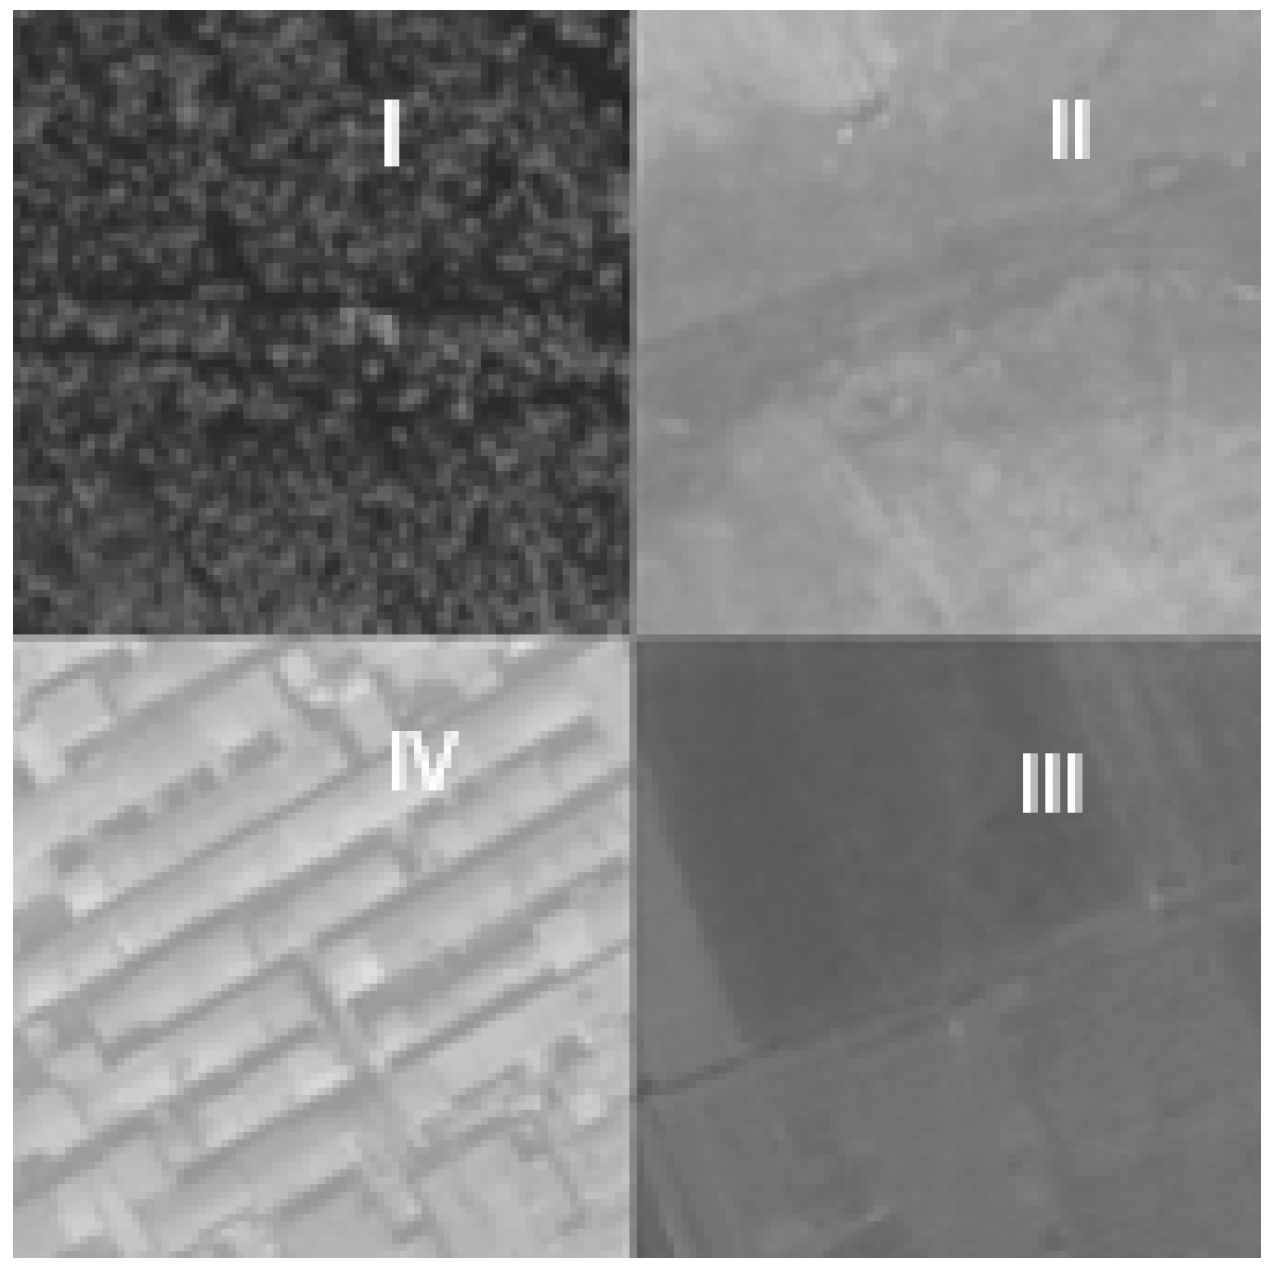
3.2. Experimental Results and Analysis of Real High-Resolution Remote-Sensing Images

Figure 10 shows panchromatic images that were taken from different high-resolution remote-sensing images. Figure 10a is an IKONOS image with a resolution of 1 m and an image size of 256 × 256 pixels. Figure 10b,c are WorldView-2 images with a resolution of 0.5 m and an image size of 256 × 256 pixels and 1024 × 1024 pixels, respectively, and the grayscale is from light to dark. Figure 10a contains three kinds of ground objects, including land, grass, and forest; Figure 10b contains five kinds of ground objects, including snow, building, vegetation, ice, and water; and, Figure 10c contains three kinds of ground objects, including buildings, vegetation, and water.
Figure 11, Figure 12 and Figure 13 show the classification results of the three images in Figure 10. Figure 11a–e show the results that we obtained using the classification methods in the following order: maximum likelihood method, FCM method, HMRF-FCM method, weighted average method (optimal classification), and neighborhood weighted average method (optimal classification). For the type-1 fuzzy model method and the maximum likelihood method, only the classification result of the latter is given in the experiment, because their classification principles are the same and their classification accuracy is similar.
To quantitatively evaluate classification results, total accuracy, Kappa value, and time cost of the classification results obtained by the different classification methods, the training data (about 30% of the total data) of different regions of each image in Figure 10 are given in Table 3.
For the three areas to be classified in Figure 10a, due to the significant differences in grayscale measurements, all of the methods, except for the FCM method, can achieve higher classification quality. If the spatial relationship of neighborhood pixels is not considered, the misclassified pixels are concentrated primarily in the forest area where the grayscale changes greatly and at the boundary between land and grass where the transitional grayscale exists. For the FCM method, by segmenting the nonsimilar measure between the pixel points and cluster centers, a large number of pixels in the forest area are classified as land, which has a similar grayscale, resulting in a decrease in the total classification quality. The total classification accuracy of the training data is 0.971 and the Kappa coefficient is 0.956, presenting the lowest classification accuracy.
As shown in Figure 11, when compared with the maximum likelihood method (see Figure 11a), the classification quality is improved by the accurate fitting method (see Figure 11d), and when the weighted average method is used, the total classification accuracy of the training data is 1.000 and the Kappa coefficient is 0.999. Although the classification accuracy is improved by the weighted average method to some extent, the salt-and-pepper noise cannot be suppressed. Therefore, a certain degree of noise still exists in Figure 11d. Because there exist the obvious difference in grayscale measure among the three kinds of regions to be classified and the salt-and-pepper noise can be handled effectively by the HMRF-FCM method, the classification accuracy of the HMRF-FCM method is higher than that of the other classification methods without consideration for the spatial relationship. Only sporadic salt-and-pepper noise exists in the forest area, and the total accuracy of the training data is close to 1. As shown in Figure 11e, by using the mean of all the pixels in the membership space window as its center membership, the noise in the homogeneous region is nearly eliminated, and only a small amount of noise exists at the boundary of the heterogeneous region, thus achieving high classification quality.
The five ground objects in Figure 10b have the following features: the grayscales of ice and water are similar and they can not be visually judged; with the ridgeline as the division, the grayscale difference between both sides of the gable roof is significant and the corresponding histogram of the gable roof presents a bimodal distribution; the difference in the grayscale of vegetation coverage is large as a result of the bare ground and trees; and, the spectral measure of snow is evident throughout almost the entire grayscale interval. We classified the image in Figure 10b using the FCM method. According to the similar grayscale measure criterion, the regions with a similar spectral measure will be classified as the same region. When we adopt the FCM method, ice is misclassified as water due to the similar grayscale between ice and water. For the house classification, because the dissimilarity measure, as defined by the Euclidean distance, which is sensitive to noise and outliers, applies the FCM method, the pixels of the brighter part of the roof are misclassified as snow, which has a similar grayscale measure because of the greatly changed brightness feature on both sides of the roof. For the vegetation classification, we could not classify this area using the FCM method because of the complex grayscale feature in the region. Among these classification methods, the FCM method shows the lowest classification quality, with a total accuracy of 0.691 and a Kappa coefficient of 0.505.
Among all of the methods in this paper, the FCM and HMRF-FCM methods are unsupervised classification methods, and the rest ones are supervised. Among the supervised classification methods, the maximum likelihood method can not model the bimodal characteristics of buildings because its histogram is a unimodal symmetric curve. Therefore, regarding the classification of a building’s roof when we adopt the maximum likelihood method, the roof on the light side will be completely misclassified as snow, which has a similar grayscale. When compared with the Gaussian membership function and the maximum likelihood method, the fitting of the weighted average method is more accurate. As the training data histogram of the light and the backlight side of the gable roof presents a bimodal distribution, even for the maximum uncertainty interval that was obtained by the use of interval type-2 fuzzy membership function model in accordance with the 3σ criterion, the training data histogram of the light side cannot be included within the range of the interval type-2 fuzzy membership function model. Therefore, the weighted average method, Gaussian membership function method, and the maximum likelihood method present a similar classification quality for house classification. Similarly, the neighborhood weighted average method cannot obviously improve the quality of house classification.
Regarding water and ice, when we adopt the standard FCM method and the HMRF-FCM method, we carried out the classification based on the minimum distance between the pixel spectral measure and the cluster center. According to this principle, the similar spectral measures will be classified as the same category. Therefore, water and ice cannot be distinguished by the use of the standard FCM method and the HMRF-FCM method because of the similar grayscale measures. Except for the previous two methods, all of the methods that were used in this paper are supervised sampling methods, and the classification is carried out according to the characteristic distribution curve of ice and water in line with the maximum membership principle. As the corresponding distribution curve of spectral measure varies with the category of the ground object, the classification of water and ice can be achieved by all of the methods that were used in this paper, except for the FCM and HMRF-FCM methods. The classification accuracy of water and ice by use of all the supervised classification methods that are in this paper is higher than that of the standard FCM method and the HMRF-FCM method, as shown in Table 3.
Regarding the classification of snow, all of the methods, except for FCM, misclassify the backlight side of the gable roof as snow. The classification quality of the snow cannot be improved by the HMRF-FCM method, the maximum likelihood method, the weighted average method, or the neighborhood weighted average method.
The grayscale feature of the homogeneous region in the vegetation area is complex because of the existence of low plants, trees, and bare ground. Regarding the classification of vegetation when we adopt the FCM method, according to the similarity of spectral measure, the pixels that have a similar measure with ice will be misclassified as ice, the pixels that have a similar measure with houses will be misclassified as houses, and only a small part of the area can be correctly classified. Therefore, the FCM method presents the lowest accuracy for vegetation classification. For the HMRF-FCM method, the salt-and-pepper noise in the vegetation area can be greatly reduced with the consideration of neighborhood pixels, presenting an obviously higher classification quality than the FCM method. Because the bare ground that has a similar spectral measure with houses is misclassified as a house, the classification quality of the HMRF-FCM method is obviously lower than the other methods. High-resolution remote sensing image classification is suitable for multiple coverage types and large scale.
Among all of the supervised classification methods, the classification decision of the maximum likelihood method is based only on the Gaussian feature of the image, whereas the classification decision of the weighted average method is based on the primary (Gaussian function), upper, and lower membership functions. Therefore, the weighted average method is superior to the maximum likelihood method for the classification of vegetation. On the other hand, the proposed method is generally applicable. In the follow-up work, the proposed method will be applied to the classification of different types of high-resolution remote sensing images (such as multi-spectral images, SAR images, etc.) and other tasks, such as feature extraction, target identification, etc., in order to demonstrate its wide applicability.
The fitting models for the three ground objects in Figure 10c have the following features: the grayscale difference of the building’s roof is clearly visible because of the high-resolution features; the spectral measure almost covers the entire grayscale measure interval; the training data histogram shows an irregular distribution; the training data histogram presents an independent double Gaussian distribution as the surface of the water in the lower right corner of Figure 10c is frozen; and, the image size of Figure 10a–c are 256 × 256 pixels, 256 × 256 pixels, and 1024 × 1024 pixels, respectively, so the image size of Figure 10c is four times larger than that of Figure 10a,b.
For the classification of buildings, we could not visually compare the classification quality of the methods in this paper. However, by comparing accuracy in Table 3, it is evident that the proposed method can obtain higher classification accuracy than the maximum likelihood method. For the classification of vegetation, the shadows within the building areas are misclassified as water by all of the methods in this paper. The building areas covered by vegetation, the shadows of buildings that have similar pixel grayscale with water, and the shadow features cannot be handled by the classification methods that are based on pixels. When we adopt the FCM and HMRF-FCM methods, we assumed the regions to be classified are subject to Gaussian distribution, and we could carry out the image classification according to the minimum similar measure principle. Therefore, the buildings and the corresponding shadows that have large differences in grayscale measure will be misclassified as water when we adopt the FCM method, leading to an overclassification of water, which reduces the total classification accuracy. For the HMRF-FCM method, although the salt-and-pepper noise can be effectively handled, the regional noise is further enlarged and the overclassification phenomenon is further aggravated, presenting lower total classification accuracy than that of the FCM method.
For the classification of water, its curve with a double independent Gaussian distribution cannot be accurately fitted by the maximum likelihood method, weighted average method, or neighborhood weighted average method. Therefore, the correct classification of the frozen water in the lower right corner of the image cannot be achieved. Note that the frozen water is also misclassified as vegetation when we adopt the HMRF-FCM method.
For the computation time, regardless of the time-consumption that is caused by manual participation, the times that are required for the classification of Figure 10a–c by the maximum likelihood method and the proposed method are about 1 s, 1 s, and 13 s, respectively. The times that are required for the classification of Figure 10a–c by the FCM method are about 150 s, 150 s, and 4126.3 s, respectively, whereas the time that is required by the HMRF-FCM method increases from the original 5 s to about 133 s. Thus, we concluded that the time cost of supervised classification methods is obviously lower than that of the unsupervised methods for a large map sheet.
The following conclusions can be drawn by analyzing the classification results of synthetic images and real high-resolution images:
(1)
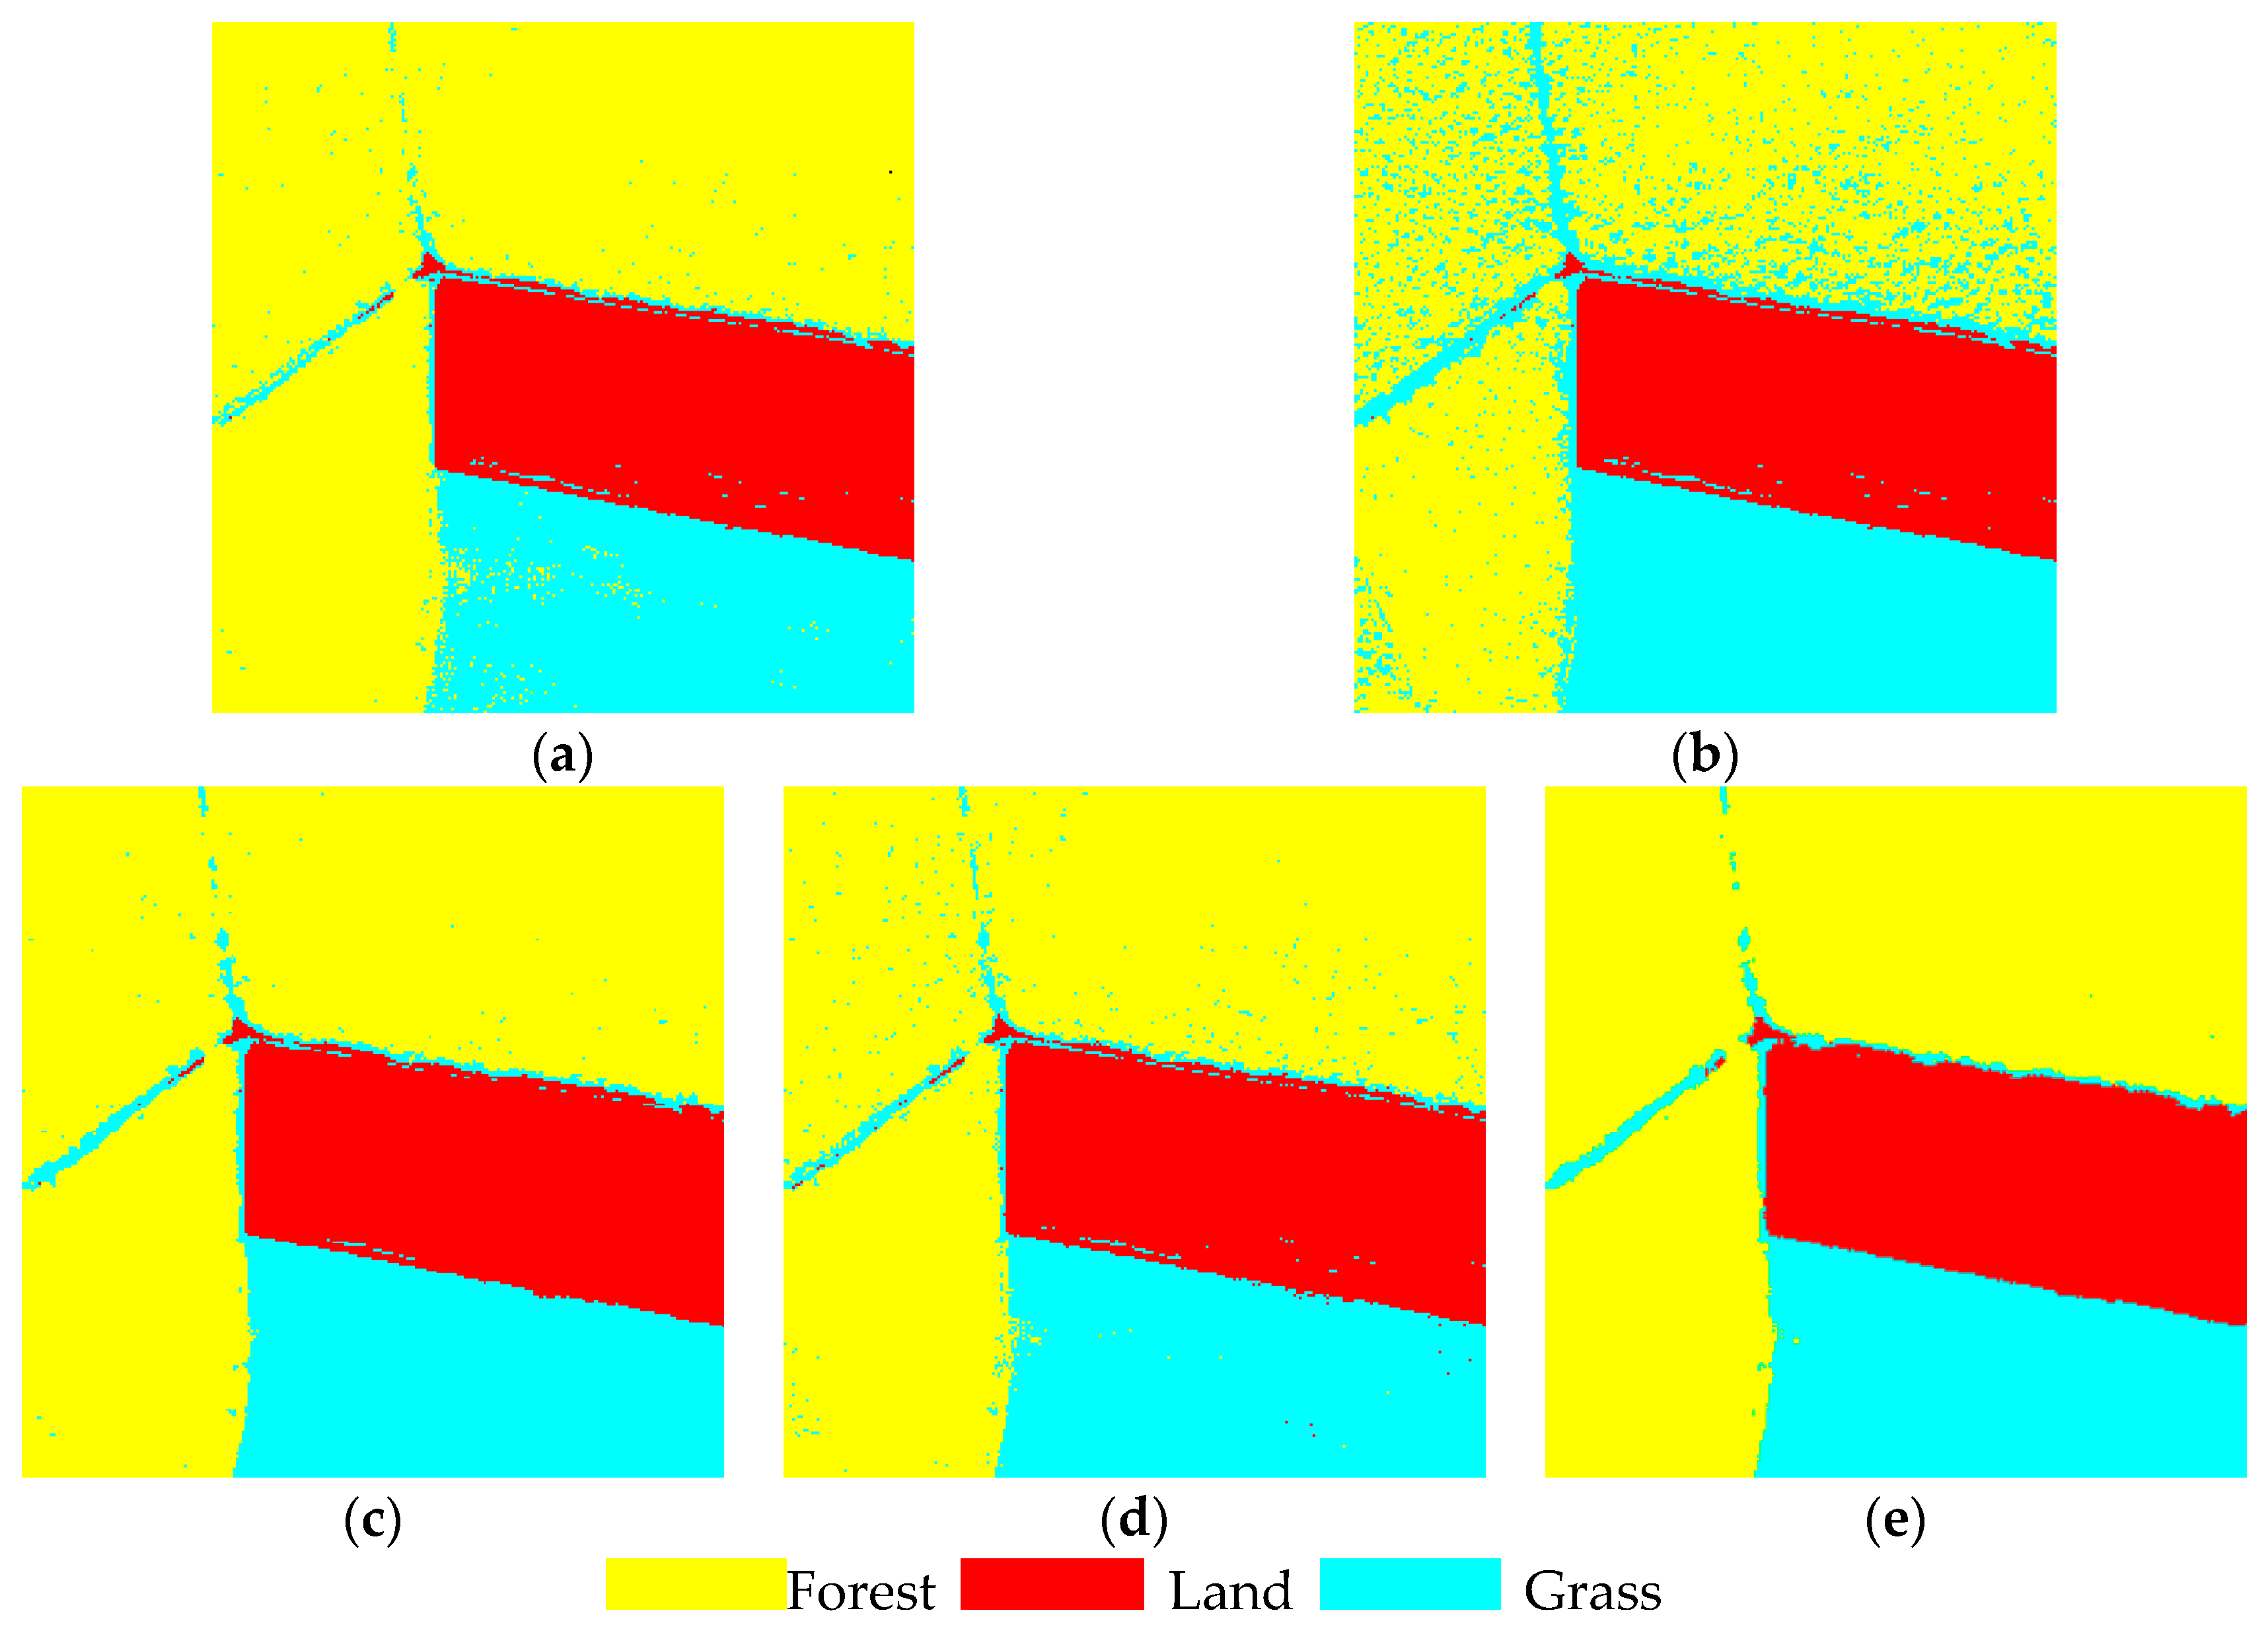
When the ground object to be classified complies with the standard Gaussian distribution and the grayscale of the heterogeneous region overlaps a little, the classification accuracy of the maximum likelihood method, the FCM method, and the weighted average is similar without considering the spatial relations. The HMRF-FCM method and the proposed neighborhood weighted average method can further improve the classification accuracy.
(2)
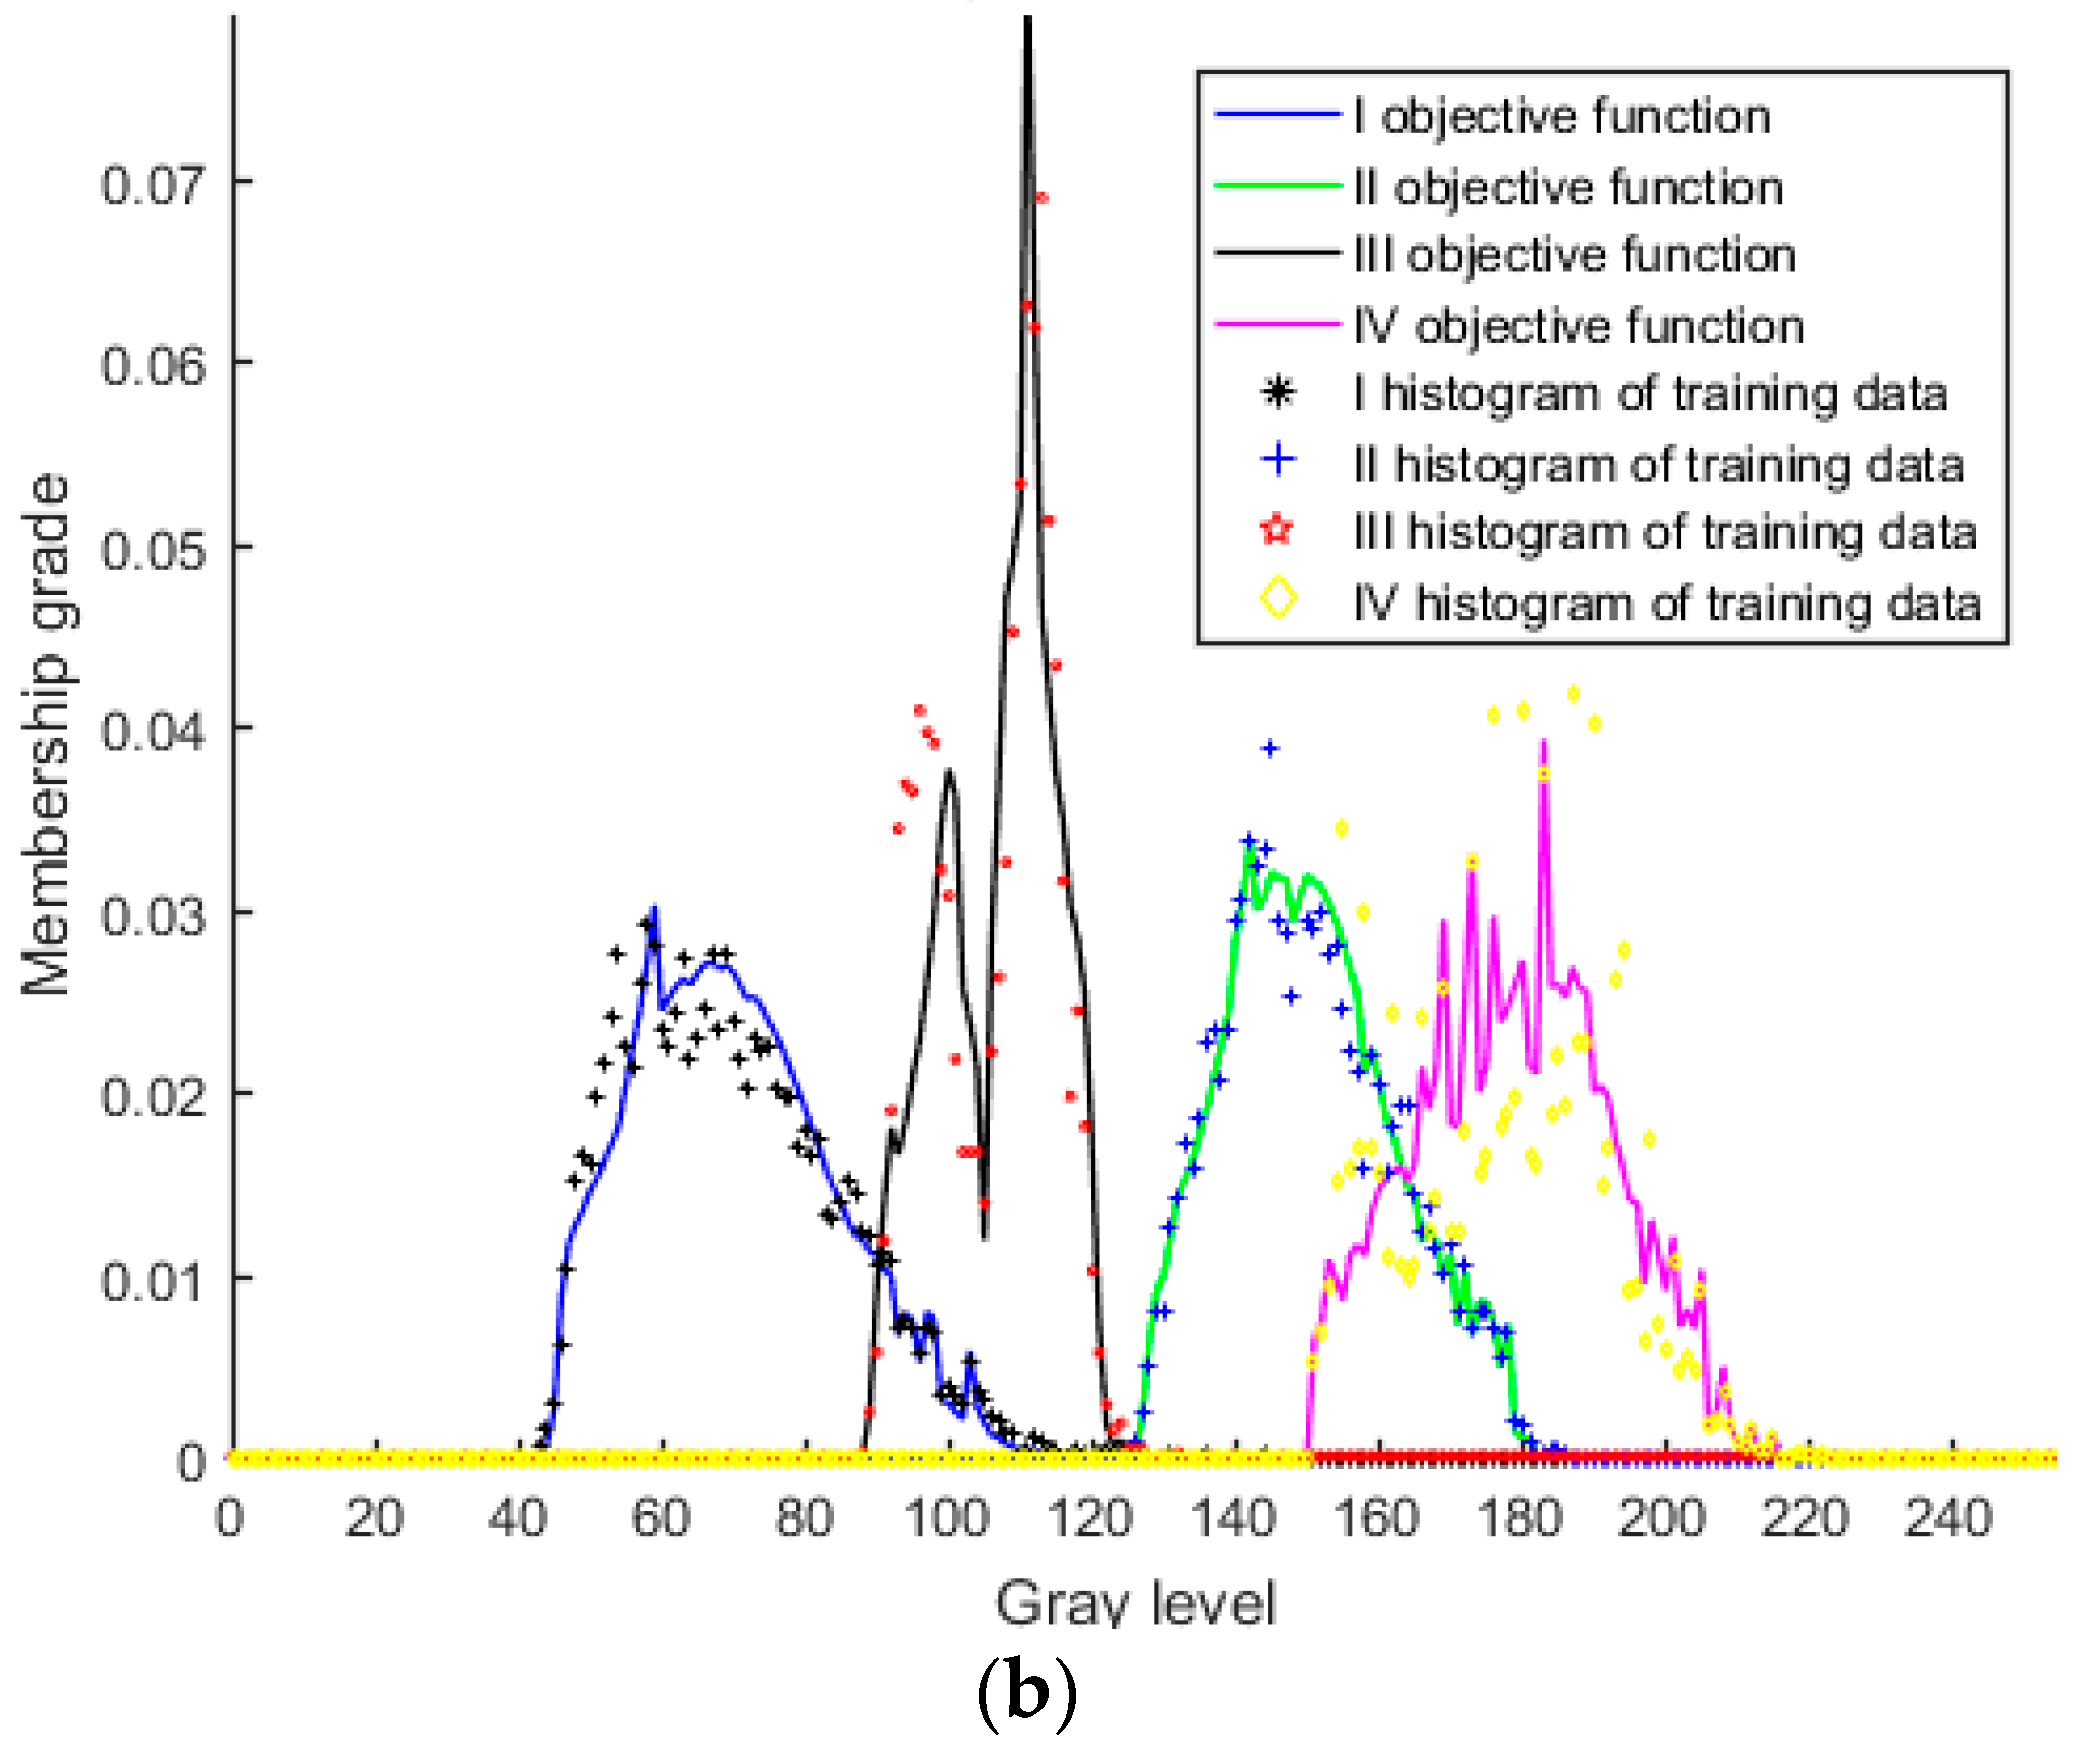
When the histogram of homogenous regions presents a continuous asymmetric unimodal, continuous multimodel, or irregular distribution feature, the weighted average method proposed in this paper can accurately fit the feature.
(3)
The classification decision model integrated with spatial relations that is proposed in this paper can effectively deal with the salt-and-pepper noise in the image and deal with the grayscale overlapping in different regions to some extent.
(4)
The time cost of the proposed method is relatively small for a large map sheet. For example, when the map sheet size increases by four times, the computation time will increase from the original 1 s to 13 s. Therefore, the method that is proposed in this paper can be applied to the data processing of large-scale remote-sensing images.
(5)
Although the accuracy evaluation of training data can reflect the classification quality of different classification methods, it can not precisely reflect the classification accuracy of the whole image.
(6)
When compared with the traditional methods, the proposed method can improve the classification accuracy and is suitable for the classification of high-resolution remote-sensing images.

4. Conclusions

This paper proposes a supervised image segmentation method that is based on interval type-2 fuzzy model with the spatial relationship. The proposed method improves the uncertainty expression for the membership of pixel, solves the problems that is caused by the complicated spatial relevance, and makes the segmentation strategy more accurately. The experiments show that this method is effective and feasible. To verify the feasibility and effectiveness of the proposed algorithm, we tests classification experiments on synthetic images and real high-resolution remote-sensing images using the proposed method, the type-1 fuzzy membership function model (synthetic images), the maximum likelihood method, the FCM method, and the HRFCM method. Then, through qualitative and quantitative comparisons and analyses, we prove that the classification accuracy of the proposed algorithm can be improved. The proposed method is suitable for the classification of high resolution remote sensing images with multiple coverage types and a large scale. The asymmetric unimodal distribution, continuous multimodel distribution, or irregular distribution of homogeneous regions can be accurately fitted by the proposed method, and the effect of internal noise is suppressed after considering the spatial relationship, presenting a relatively good classification of high-resolution remote-sensing images. A blurred boundary appeared at the same time, however. Therefore, to further improve the proposed algorithm, this will be the focus of future research. On the other hand, the proposed method is universal in theory. In the further work, the proposed method will be applied to the classification of different types of high-resolution remote sensing images (such as multi-spectral images, SAR images, etc.) and other tasks, such as feature extraction, target identification, etc.

Author Contributions

C.W. and A.X. conceived and designed the experiment; C.W. performed the experiment; C.W. and X.L. wrote the paper.

Acknowledgments

This work was supported by the National Key Research and Development Program of China (No. 2016YFC0803102), Liaoning Provincial Innovation Team Program of China (No. LT2015013), Liaoning Provincial Education Department Program of China (LJYL036). We would like to thank LetPub (www.letpub.com) for providing linguistic assistance during the preparation of this manuscript.

Conflicts of Interest

The authors declare no conflict of interest.

References

  1. Fu, S.; Ruan, Q.; Wang, W. A feature-dependent fuzzy bidirectional flow for adaptive image sharpening. Neurocomputing 2007, 70, 883–895. [Google Scholar] [CrossRef]
  2. Bloch, I. Information combination operators for data fusion: A comparative review with classification. IEEE Trans. Syst. Man Cybern. Part A 1996, 26, 52–67. [Google Scholar] [CrossRef]
  3. Ahmed, M.N.; Yamany, S.M.; Aly, A.; Farag, N.M. Bias field estimation and adaptive segmentation of MRI data using a modified fuzzy C-means algorithm. In Proceedings of the Conference on Computer Vision and Pattern Recognition, Fort Collins, CO, USA, 23–25 June 1999; Volume 1, pp. 1250–1255. [Google Scholar]
  4. Chen, S.; Zhang, D. Robust image segmentation using FCM with spatial constraints based on new kernel-induced distance measure. IEEE Trans. Syst. Man Cybern. Part B 2004, 34, 1907–1916. [Google Scholar] [CrossRef]
  5. Cai, W.; Chen, S.; Zhang, D. Fast and robust fuzzy c-means clustering algorithms incorporating local information for image segmentation. Pattern Recognit. 2007, 40, 825–838. [Google Scholar] [CrossRef]
  6. Zhao, X.; Li, Y.; Zhao, Q. Hidden markov Gaussian random field based fuzzy clustering algorithm for high-resolution remote sensing image segmentation. Acta Electron. Sin. 2016, 44, 679–686. (In Chinese) [Google Scholar] [CrossRef]
  7. Huang, N.; Jia, Z.; Yu, Y. Image segmentation based on combination of improved FCM and local information. Comput. Appl. Softw. 2011, 28, 97–100. (In Chinese) [Google Scholar]
  8. Zhao, X.; Li, Y.; Zhao, Q. Image segmentation by fuzzy clustering algorithm combining hidden Markov random field and Gaussian regression model. J. Electron. Inf. Technol. 2014, 36, 2730–2736. (In Chinese) [Google Scholar] [CrossRef]
  9. Chatzis, S.; Varvarigon, T.A. A fuzzy clustering approach toward hidden Markov random field models for enhanced spatially constrained image segmentation. IEEE Trans. Fuzzy Syst. 2008, 16, 1351–1361. [Google Scholar] [CrossRef]
  10. Zhao, X.; Li, Y.; Zhao, Q. A fuzzy clustering image segmentation algorithm with double neighborhood system combined with Markov Gaussian model. J. Comput.-Aided Des. Comput. Graph. 2016, 28, 615–623. (In Chinese) [Google Scholar]
  11. Zadeh, L.A. The concept of a linguistic variable and its application to approximate reasoning-1. Inf. Sci. 1975, 8, 199–249. [Google Scholar] [CrossRef]
  12. Liang, Q.; Mendel, J.M. Interval type-2 fuzzy logic systems: Theory and design. IEEE Trans. Fuzzy Syst. 2000, 8, 535–549. [Google Scholar] [CrossRef]
  13. John, R.I.; Innocent, P.R.; Barnes, M.R. Neuro-fuzzy clustering of radiographict tibia image data using type-2 fuzzy sets. Inf. Sci. 2000, 125, 65–82. [Google Scholar] [CrossRef]
  14. Liang, Q.; Mendel, J.M. MPEG VBR video traffic modeling and classification using fuzzy technique. IEEE Trans. Fuzzy Syst. 2001, 9, 183–193. [Google Scholar] [CrossRef]
  15. Karnik, N.N.; Mendel, J.M.; Liang, Q. Type-2 fuzzy logic systems. IEEE Trans. Fuzzy Syst. 1999, 7, 643–658. [Google Scholar] [CrossRef]
  16. Melin, P.; Urias, J.; Solano, D.; Soto, M.; Lopez, M.; Castillo, O. Voice recognition with neural networks, type-2 fuzzy logic and genetic algorithms. J. Eng. Lett. 2006, 13, 108–116. [Google Scholar]
  17. Zhang, W.B.; Hu, H.Z.; Liu, W.J. Rules extraction of interval type-2 fuzzy logic system based on fuzzy c-means clustering. In Proceedings of the 4th International Conference on Fuzzy Systems and Knowledge Discovery, Haikou, China, 24–27 August 2007; Volume 2, pp. 256–260. [Google Scholar]
  18. Kaur, P.; Lamba, I.M.S.; Gosain, A. Kernelized type-2 fuzzy c-means clustering algorithm in segmentation of noisy medical images. In Proceedings of the IEEE Recent Advances in Intelligent Computational Systems (RAICS), Trivandrum, India, 22–24 September 2011; pp. 493–498. [Google Scholar]
  19. Melin, P.; Castillo, O. A review on the applications of type-2 fuzzy logic in classification and pattern recognition. Expert Syst. Appl. 2013, 40, 5413–5423. [Google Scholar] [CrossRef]
  20. Tizhoosh, H.R. Image thresholding using type II fuzzy sets. Pattern Recognit. 2005, 38, 2363–2372. [Google Scholar] [CrossRef]
  21. Bustince, H.; Barrenechea, E.; Pagola, M.; Fernandez, J.; Sanz, J. Comment on: Image thresholding using type II fuzzy sets importance of this method. Pattern Recognit. 2010, 43, 3188–3192. [Google Scholar] [CrossRef]
  22. Hwang, C.; Rhee, F.C. Uncertain fuzzy clustering: Interval type-2 fuzzy approach to c -means. IEEE Trans. Fuzzy Syst. 2007, 5, 107–120. [Google Scholar] [CrossRef]
  23. Yu, L.; Xiao, J.; Zheng, G. Robust interval type-2 possibilistic c-means clustering and its application for fuzzy modeling. In Proceedings of the 6th International Conference on Fuzzy Systems and Knowledge Discovery, Tianjin, China, 14–16 August 2009; Volume 4, pp. 360–365. [Google Scholar]
  24. Askari, G.; Xu, A.G.; Li, Y.; Alavipanah, S.K. Automatic determination of number of homogenous regions in SAR images utilizing splitting and merging based on a reversible jump MCMC algorithm. J. Indian Soc. Remote Sens. 2013, 41, 509–521. [Google Scholar] [CrossRef]
  25. Chakravarty, S.; Dash, P.K. A PSO based integrated functional link net and interval type-2 fuzzy logic system for predicting stock market indices. Appl. Soft Comput. 2012, 12, 931–941. [Google Scholar] [CrossRef]
  26. Azad, A.Z.K.; Khanesar, M.A.; Teshnehlab, M. Type-2 fuzzy neural networks for sliding mode fuzzy control of nonlinear dynamical systems with adaptive learning rate. In Proceedings of the 3rd IEEE International Conference on Computer, Control and Communication (IC4), Karachi, Pakistan, 25–26 September 2013; pp. 1–6. [Google Scholar]
  27. Zeng, J.; Liu, Z.Q. Type-2 Fuzzy Graphical Models for Pattern Recognition; Springer: Heidelberg/Berlin, Germany; Tsinghua University Press: Beijing, China, 2015; pp. 97–112. [Google Scholar]
  28. Pinheiro, H.N.B.; Ren, T.I.; Cavalcanti, G.D.C.; Jyh, T.I.; Sijbers, J. Type-2 fuzzy GMMs for robust text-independent speaker verification in noisy environments. In Proceedings of the 22nd International Conference on Pattern Recognition (ICPR), Stockholm, Sweden, 24–28 August 2014; pp. 4531–4536. [Google Scholar]
  29. Tsang, I.R.; Gabriel, D.; Pinheiro, H.N.B.; Cavalcanti, G.D.C. Speaker verification using type-2 fuzzy gaussian mixture models. In Proceedings of the IEEE International Conference on Systems, Man, and Cybernetics (SMC), Seoul, Korea, 14–17 October 2012; Volume 41, pp. 2336–2340. [Google Scholar]
  30. MohammadZadeh, A.; Kaynak, O.; Teshnehlab, M. Two-mode indirect adaptive control approach for the synchronization of uncertain chaotic systems by the use of a hierarchical interval type-2 fuzzy neural network. IEEE Trans. Fuzzy Syst. 2014, 22, 1301–1312. [Google Scholar] [CrossRef]
  31. Khanesar, M.A.; Kayacan, K. Levenberg-marquardt training method for type-2 fuzzy neural networks and its stability analysis. In Proceedings of the IEEE International Conference on Fuzzy Systems, Istanbul, Turkey, 2–5 August 2015; pp. 1–7. [Google Scholar]
  32. Aliev, R.A.; Pedrycz, W.; Guirimov, B.G.; Aliev, R.R; Llhan, U. Type-2 fuzzy neural networks with fuzzy clustering and differential evolution optimization. Inf. Sci. 2011, 181, 1591–1608. [Google Scholar] [CrossRef]
  33. Kaur, P.; Soni, A.K.; Gosain, A. A robust kernelized intuitionistic fuzzy c-means clustering algorithm in segmentation of noisy medical images. Pattern Recognit. Lett. 2013, 34, 163–175. [Google Scholar] [CrossRef]
  34. Tan, W.W.; Foo, C.L.; Chua, T.W. Type-2 fuzzy system for ECG arrhythmic classification. In Proceedings of the IEEE International Fuzzy Systems Conference, London, UK, 23–26 July 2007; Volume 24, pp. 1–6. [Google Scholar]
  35. Zarandi, M.H.F.; Torshizi, A.D. A new validation criteria for type-2 fuzzy c-means and possibilistic c-means. In Proceedings of the Annual Meeting of the North American Fuzzy Information Processing Society(NAFIPS), Berkeley, CA, USA, 6–8 August 2012; pp. 1–6. [Google Scholar]
  36. Bouwmans, T.; Baf, F.E. Modeling of dynamic backgrounds by type-2 fuzzy gaussians mixture models. Stud. Comput. Intell. 2009, 1, 265–277. [Google Scholar]
Figure 1. Farmland and corresponding fuzzy membership function model. (a1) Farmland 1; (b1) Farmland 2; (c1) Farmland 3; (a2) Fuzzy membership function model of farmland 1; (b2) Fuzzy membership function model of farmland 2; and, (c2) Fuzzy membership function model of farmland 3.
Remotesensing 10 00710 g001aRemotesensing 10 00710 g001b
Figure 2. Interval type-2 fuzzy model with uncertain mean. (a) Type-1 fuzzy membership function with uncertainty of horizontal direction; and, (b) Interval Type-2 fuzzy membership function.
Remotesensing 10 00710 g002
Figure 3. Interval type-2 fuzzy model with uncertain standard deviation. (a) Type-1 fuzzy membership function with uncertainty of vertical direction; and, (b) Interval type-2 fuzzy membership function.
Remotesensing 10 00710 g003
Figure 4. Type-2 fuzzy model with uncertain mean and standard deviation.
Remotesensing 10 00710 g004
Figure 5. Schematic diagram of weighted average method for classification decision model.
Remotesensing 10 00710 g005
Figure 6. The flowchart of the proposed method.
Remotesensing 10 00710 g006
Figure 7. Quick Bird synthetic image.
Remotesensing 10 00710 g007
Figure 8. Quick Bird synthetic image of training data histogram and best classification model. (a) Type-1 fuzzy membership function model; and, (b) Best classification decision model deviation.
Remotesensing 10 00710 g008aRemotesensing 10 00710 g008b
Figure 9. Quick Bird synthetic image classification results. (a) Gauss membership function method; (b) Maximum likelihood method; (c) Fuzzy C-means (FCM); (d) Hidden Markov Random Field (HMRF-FCM); (e) Weighted average method; and, (f) Neighborhood weighted average method.
Remotesensing 10 00710 g009
Figure 10. High-resolution remote-sensing images. (a) IKONOS image; (b) World View-2 image; and, (c) World View-2 image.
Remotesensing 10 00710 g010
Figure 11. IKONOS image classification results. (a) Maximum likelihood method HMRF-FCM; (b) FCM; (c) HMRF-FCM; (d) Weighted average method; and, (e) Neighborhood weighted average.
Remotesensing 10 00710 g011
Figure 12. Word View-2 image classification results. (a) Maximum likelihood method; (b) FCM; (c) HMRF-FCM; (d) Weighted average method; and, (e) Neighborhood weighted average.
Remotesensing 10 00710 g012
Figure 13. Word View-2 image classification results. (a) Maximum likelihood method; (b) FCM; (c) HMRF-FCM; (d) Weighted average method; and, (e) Neighborhood weighted average.
Remotesensing 10 00710 g013
Table 1. Type, principle, and application of interval type-2 fuzzy model.
ModelPrincipleApplication
Interval type-2 fuzzy model based on information entropy [20,21]Based on the information entropy in information theory, construct the interval type-2 fuzzy information entropy model by defining the fuzzy conditions of information entropyImage segmentation/classification edge detection
Interval type-2 fuzzy model based on FCM [22,23,24]Under the framework of FCM, construct the interval type-2 FCM model by fuzzy exponential factorization, fuzzy membership function or fuzzy clustering centerFuzzy clustering
Interval type-2 fuzzy neural network model [25,26]Neural network model operated in accordance with Zadeh Extension Theorem, with interval type-2 fuzzy signal, interval type-2 fuzzy membership function or interval type-2 fuzzy logic activation functionFuzzy control
Time sequence decision
Interval type-2 Gaussian mixture model [27,28,29]Mean or standard deviation in fuzzy Gaussian mixture modelSegmentation/Classification
Object identification
Table 2. User accuracy, product precision, user accuracy, and Kappa value.
MethodAccuracy IndicatorHomogenous Region
IIIIIIIV
Type-1 fuzzy modelUser accuracy0.9980.7960.9010.833
Product precision0.8920.8410.9970.786
Total accuracy = 0.879; Kappa = 0.839
Maximum likelihoodUser accuracy0.9810.8220.9190.800
Product precision0.9130.7910.9780.834
Total accuracy = 0.879; Kappa = 0.839
FCMUser accuracy0.8430.7470.8951.000
Product precision1.0000.9050.6950.827
Total accuracy = 0.857; Kappa = 0.809
HMRF-FCMUser accuracy1.0000.9030.9320.781
Product precision0.9270.7431.0000.920
Total accuracy = 0.898; Kappa = 0.863
Weighted averageUser accuracy0.9950.8780.9360.874
Product precision0.9320.8730.9940.881
Total accuracy = 0.920; Kappa = 0.889
Neighborhood weighted averageUser accuracy0.9970.9930.9940.991
Product precision0.9950.9910.9990.991
Total accuracy = 0.994; Kappa = 0.992
Table 3. The real high-resolution remote-sensing images evaluation.
Images (Figure 10)Accuracy IndicatorMethod
Maximum LikelihoodFCMHMRF-FCMWeighted AverageNeighborhood Weighted
(a)Total accuracy0.8780.8990.6910.8120.907
Kappa0.8370.8710.5050.8790.881
Tims (s)1.13156.324.641.361.28
(b)Total accuracy0.8990.6910.8120.9070.912
Kappa0.8710.5050.8790.8810.887
Tims (s)12.74126132.713.2013.15
(c)Total accuracy0.7370.7080.6840.7280.914
Kappa0.6650.6430.6140.6520.865
Tims (s)1.38192.275.351.721.68

