Abstract
Spatial information on forest functional composition is needed to inform management and conservation efforts, yet this information is lacking, particularly in tropical regions. Canopy foliar traits underpin the functional biodiversity of forests, and have been shown to be remotely measurable using airborne 350–2510 nm imaging spectrometers. We used newly acquired imaging spectroscopy data constrained with concurrent light detection and ranging (LiDAR) measurements from the Carnegie Airborne Observatory (CAO), and field measurements, to test the performance of the Spectranomics approach for foliar trait retrieval. The method was previously developed in Neotropical forests, and was tested here in the humid tropical forests of Malaysian Borneo. Multiple foliar chemical traits, as well as leaf mass per area (LMA), were estimated with demonstrable precision and accuracy. The results were similar to those observed for Neotropical forests, suggesting a more general use of the Spectranomics approach for mapping canopy traits in tropical forests. Future mapping studies using this approach can advance scientific investigations and applications based on imaging spectroscopy.
1. Introduction
Canopy foliar traits—in particular, leaf chemistry—underpin functional biodiversity, which in turn provides important information about ecological processes including biogeochemical cycles, biosphere–atmosphere carbon exchange, evolution, and community assembly [1,2]. This information is key to understanding vegetation responses to climate change. Biological diversity is threatened by human activities and a rapidly changing climate, yet we lack critically important information at spatial scales needed for large-scale management and conservation actions. This is particularly true in humid tropical forests where inaccessibility, high species and canopy structural diversity, and expansive landscapes challenge ground-based studies. Remote sensing offers a means to help overcome these challenges.
Airborne imaging spectroscopy has been the primary tool for quantitatively estimating foliar traits at landscape levels to date. Full-range imaging spectroscopy utilizes contiguous, high-spectral-resolution measurements of reflected solar radiation in the 350–2510 nm wavelength region to estimate canopy traits such as water, nutrient, and defense compounds [3,4,5]. Although imaging spectroscopy has evolved in step with technological, computing, and modeling advances [6,7], few studies have attempted the retrieval of multiple foliar traits needed to characterize functional diversity. Moreover, despite a surge in field collections, foliar functional trait data remain relatively sparse, with little coverage across the humid tropics [8], and have had limited systematic sampling using consistent protocols [9] needed to develop robust methods for foliar trait retrieval from imaging spectroscopy.
Responding to this lack of information, the Carnegie Spectranomics Project [10] was founded to link canopy foliar traits from vast numbers of plant species collected throughout humid tropical and other forests to their optical spectral properties [11]. While still ongoing, this project has already reported on thousands of canopy tree species along elevation gradients and across varying soil types in the humid tropics in order to link geographic, environmental, and phylogenetic patterns of foliar trait variation with leaf- and canopy-level reflectance spectroscopy [11,12,13]. However, the project has not yet provided sufficient spatially explicit information to assess and model region-specific changes in community functional traits in many parts of the tropical forest biome. The ability to assess these region-specific changes is an important step toward applying airborne and future space-based imaging spectrometers to studies of tropical forest canopy traits and functional diversity.
Samples from the Spectranomics collections in the Neotropics have been successfully integrated with airborne imaging spectroscopy data from the Carnegie Airborne Observatory (CAO; [14]) to develop methods for foliar trait retrieval at local to regional scales. One study provided a model for retrieval of 16 foliar traits at one-hectare resolution for 79 plots across the Western Amazon region [15]. Functional diversity maps created from these field- and laboratory-based datasets revealed the functional biogeography of the Peruvian Andes and Amazon basin [16]. A second study using a similar methodology focused on finer-scale measurements (2 m) needed to resolve changes in foliar trait expression of rock-derived nutrients at the tree crown level as they respond to underlying topo-edaphic or hillslope gradients [17]. Mapping these rock-derived nutrients at fine spatial resolution yielded an understanding of subtle variation in nutrient cycling and limitation to plant growth along slopes being incised into impoverished terraces by stream activity. These and similar studies demonstrate the capability and significance of the Spectranomics approach for foliar trait retrieval. However, these studies are limited to Neotropical forests. Whether this approach will work in other regions of the tropics has not been fully assessed from leaf to airborne mapping levels.
Here we use methods developed in the Neotropics, with newly acquired CAO data and field measurements, to develop and test a model of foliar trait retrieval for forest canopies in Bornean forests of Sabah, Malaysia. We asked the following questions: (1) Is the Spectranomics method applicable to forests of Borneo that have evolved along a phylogenetic pathway distinct from that of the Neotropics? (2) Will the method accommodate the complex mix of land-use history, topography, substrates, and climate found in forests of Sabah? (3) Are there inherent spectral differences that prevent standardization of data for modeling, and do these affect the foliar trait retrievals using airborne imaging spectroscopy?
2. Materials and Methods
Our study utilized field and airborne data from four different regions in the state of Sabah, Malaysia in northern Borneo (Figure 1) to evaluate the capability of the foliar trait retrieval method developed in the Neotropics by Asner et al. [15] in this unique region. Airborne high-fidelity imaging spectroscopy and LiDAR (light detection and ranging) data were collected from 31 March to 30 April 2016. Foliar samples were collected from 479 tree canopies during two subsequent field visits, one in May and one in July 2017. Partial least squares regression (PLSR) analysis was used to model and evaluate the relationship between laboratory measurements of 17 foliar traits and airborne reflectance spectra of forest canopies.
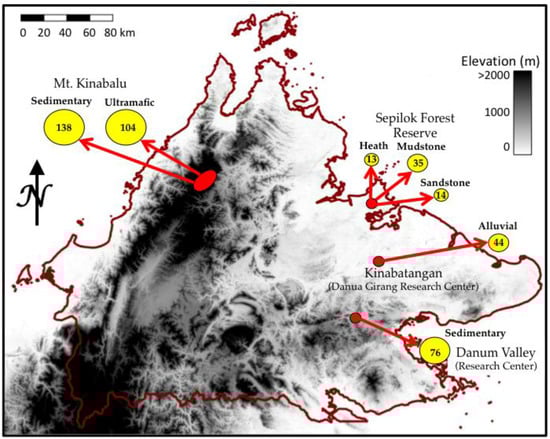
Figure 1.
Map of elevation across Sabah, Malaysia showing four locations (red circles) where canopy foliar traits were collected in the field for development and testing of the retrieval of foliar traits from airborne spectroscopy data. The numbers in the yellow circles indicate the number of canopies sampled on the corresponding soil substrate.
2.1. Study Region
The Sabah landscape comprises many complex terrain features, with elevations ranging from sea level to over 4000 m at the summit of Mt. Kinabalu. A variety of substrates also occur throughout the state, ranging from infertile, ultramafic extrusions concentrated at higher elevations to upland sedimentary substrates that include undulating hillcrest and sloping terrain of varying fertility. The natural canopy of the lowland portion of the study region is dominated by the plant family Dipterocarpaceae [18], which is not found in the Neotropics.
The lowland study sites include a diverse set of substrates in the western portion of the state, including fertile alluvial substrates along the Kinabatangan river [19], sedimentary substrates found in the Danum Valley [20], and fertile alluvial and infertile sandstone substrates in the Sepilok Forest Reserve (Table 1; [21]). The elevation at these lowland sites varies from 15 m to 150 m above sea level (asl). The mean annual temperature (MAT) and precipitation (MAP) are similar at these three sites 26.7 °C to 27.2 °C and 2882–2975 mm·year−1 [22]. Foliar samples were also collected along an elevation gradient from 700 m to 3100 m asl on the western slope of Mt. Kinabalu. This elevation gradient includes low fertility ultramafic and higher fertility substrates, including sedimentary and granite bedrock types [23]. Along the gradient, the MAT decreases from 24 °C to 11 °C, while precipitation increases from 2509 to 3285 mm·year−1 [24]. The forest type among all sites is classified as lowland rainforest with the exception of the sites on Mt Kinabalu, where the forests range from hill forest to subalpine forest (Table S1) [25].

Table 1.
Descriptive information for 13 field locations spanning a range of elevation and substrate and soil types (Soil Order as defined by USDA classification) across Sabah, Malaysia. The mean elevation (Elev), number of canopies sampled for foliar traits, and the number of spectra extracted for use in spectroscopic analysis are given. The environmental parameters mean annual precipitation (MAP) and temperature (MAT), as well as nitrogen to phosphorous ratio (N:P), an index of soil fertility, are also listed.
2.2. Imaging Spectrometer Data
In April 2016, imaging spectroscopy and LiDAR data were collected throughout the state of Sabah using the Carnegie Airborne Observatory-3 (CAO; [14]). The CAO integrates a high-fidelity visible-to-shortwave infrared (VSWIR) imaging spectrometer and a dual-laser waveform LiDAR. The VSWIR spectrometer was custom built for the CAO by the Jet Propulsion Laboratory, Pasadena, CA, USA. The LiDAR was also custom built by Optech International, Toronto, Canada. Data were acquired over the study sites at approximately 4000 m above ground level (agl) at an average flight speed of 67 m·s−1. The VSWIR spectrometer measures spectral radiance in 427 channels spanning the 350–2510 nm wavelength range in 5 nm increments (full width at half-maximum). The VSWIR has a 34° field-of-view and an instantaneous field-of-view of 1 mrad, providing 4 m ground sampling distance, or pixel size, from 4000 m agl. To achieve similar swath coverage to the VSWIR, the LiDAR beam divergence was set to 0.25 mrad, and operated at 200 kHz with a 19° scan half-angle from nadir. Airborne data were collected along adjacent flightlines with 30% overlap providing a mean LiDAR point density of two shots m−2, or eight shots per VSWIR pixel.
LiDAR data are essential to precisely ortho-geolocate the VSWIR data in order to mask canopy gaps, account for intra- and inter-canopy shadowing, and to identify regions of short or absent canopies that contaminate the spectral signal [26]. To achieve this, the laser ranges were combined with the embedded high resolution Global Positioning System-Inertial Measurement Unit (GPS-IMU) data to determine the 3D locations of laser returns, producing a ‘cloud’ of LiDAR point data. These points were used to interpolate a raster digital terrain model (DTM) for the ground surface of each landscape. This was achieved using a pair of tools within the LAStools software suite (Rapidlasso GmbH, Gilching, Germany). Ground returns were detected using the program lasground with a step size of 10 m. Interpolation of ground points to a raster DTM was performed using the program las2dem. The digital surface model (DSM) was created with las2dem using interpolations of all first-return points. Measurement of the vertical difference between the DTM and DSM yielded a digital canopy model (DCM) of vegetation height above ground.
The VSWIR data were radiometrically corrected from raw values to radiance (W sr−1·m−2) using a flat-field correction, radiometric calibration coefficients, and spectral calibration data collected in the laboratory. The standardized GPS pulse-per-second measurement was used to precisely co-locate the VSWIR spectral imagery to the LiDAR data. A camera model, created in the laboratory and refined following flight installation, was used to determine the three-dimensional location and field-of-view of each sensor element and subsequently combined with standardized timing information for high-precision data co-registration. The geometry data from the data fusion were then used to atmospherically correct the radiance imagery using the ACORN-6LX model (Imspec LLC, Glendale, CA USA). To improve aerosol corrections in ACORN-6LX, we iteratively ran the model with different visibility settings until the reflectance at 420 nm (which is relatively constant for vegetated pixels) was 1% [27]. If, for a given flightline, the automated atmospheric correction did not converge, or produced reflectance values at 420 nm that were much less than 1%, the visibility parameter was manually set and the line was rerun. All sites were processed through ACORN-6LX using the average ground elevation and flight altitude of the plots located within each site. The imagery was then orthorectified to the LIDAR DCM. The spectra were convolved to 10 nm bandwidth, and trimmed at the far ends (440 nm, 2440 nm) of the measured wavelength range, as well as in regions dominated by atmospheric water vapor (1330–1490, 1770–2050 nm) that block the spectral reflectance signal.
2.3. Foliar Sampling
Foliar collections began by first identifying individual trees visible in the CAO imagery. Once trees were manually identified, mature top-of-canopy leaf samples were collected from at least two fully sunlit branches within each tree crown, using tree climbers when necessary to ensure proper collection. In cases of small crowns at high elevations, locations were identified as suitable in the imagery and samples were collected for all sunlit individuals in that area. Sunlit branches were selected by sampling from the outer-most layer of the crown in sections that were exposed to full sunlight for at least 80% of daylight hours. Once acquired, each sample was immediately packed in a plastic bag and stored on ice in the dark until being transported to a local site for processing within 4–6 h of the initial collection.
At the local site, subsets from each crown sample were measured while fresh for leaf area and wet weight and an additional subset was oven dried for further analysis. Samples from Danum, Kinabatangan, and Sepilok were also cryo-cooled for additional chemical analysis. In addition, two representative branches were labeled and dried for herbarium vouchers. One voucher sample was transported to the Spectranomics herbarium in Stanford, CA, USA where it was mounted and scanned for addition to the online database. The second set of voucher specimens remained in Sabah at various locations depending on the sample origin: either at the Kinabalu Park Headquarters, the Danum Valley Herbarium, or at the Sabah Forestry Department Herbarium in Sandakan.
2.4. Laboratory Assays
A subset of leaves was selected from the branches for scanning and weighing. The leaf area was determined on a 600 dots-per-inch flatbed top-illumination optical scanner, using enough leaves to fill one scan area of 21 cm × 25 cm (up to about 10–25 leaves per sample depending on leaf size). Petioles were removed from each leaf prior to scanning, and mid-veins were removed when they exceeded 1 mm in diameter. Leaves exceeding the surface area of the scanner were cut into sections until 1–2 full scan areas were completed. The scanned leaves were dried at 70 °C for at least 72 h before dry mass (DM) was measured. Leaf mass per area (LMA) was calculated as g DM m−2. For samples collected at Danum, Kinabatangan, and Sepilok, leaf discs (at least 30 per leaf) were immediately taken from approximately 6–12 randomly selected leaves and transferred to −80 °C cryogenic shipping containers. The remaining leaves were detached from the branches and subsamples were selected to represent the range of colors and conditions found among all leaves collected. When epiphylls were encountered, they were removed, along with dust and debris, prior to drying at 70 °C for 72 h followed by vacuum sealing for transport.
Detailed chemical analysis protocols, along with instrument and standards information, are downloadable from the Carnegie Spectranomics Project website (https://cao.carnegiescience.edu/spectranomics) and are summarized here. Dried foliage was ground in a 20 mesh Wiley mill, and subsets were analyzed for a variety of elements and carbon fractions. Total element concentrations of rock-derived macro- (P, Ca, K, Mg) and micro-nutrients (B, Fe) were determined in 0.4 g dry leaf tissue per crown by inductively coupled plasma spectroscopy (ICP-OES; Thermo Scientific ICAP 6300 Duo View Spectrometer) after microwave digestion in 10 mL concentrated (70%) nitric acid solution (CEM MARSXpress; Matthews, NC, USA). One blank and two reference standards (Peach NIST SRM 1547 and internal lemon leaf) were digested and measured with each set of 37 foliar samples to track the reproducibility and accuracy of the method.
Carbon fractions including nonstructural carbohydrates (NSC), cellulose, and lignin were determined in 0.5 g dry ground leaf tissue per crown through using sequential digestion of increasing acidity in a fiber analyzer (Ankom Technology, Macedon, NY, USA). Carbon fractions were recorded on an ash-free, dry mass basis following ignition of the remaining sample at 500 °C for 5.5 h. A lemon leaf standard was used as a reference with each run to ensure consistency across runs. A subset of the ground material was further processed to a fine powder for determination of total C and N concentration by combustion–reduction elemental analysis (Costech Analytical Technologies Inc. Valencia, CA, USA). Following combustion, a portion of the gas is routed through a mass spectrometer (Picarro Inc. Santa Clara, CA, USA) where the separate isotopes of C12 and C13 are measured. The isotopic ratio δ13C is calculated against a reference standard as
δ13C (‰) = [(C13/C12sample/C13/C12standard) − 1] × 1000.
Frozen leaf disks were used for the chlorophyll ab (Chl ab), phenol, and tannin (here we measured condensed tannins, also known as protein-binding tannins) determinations. For phenols and tannins, one disk per crown was ground in 95% methanol on a high-throughput tissue homogenizer. A portion of the solution was further diluted and incubated on an orbital shaker at room temperature (15–18 °C) in the dark for 48 h to ensure proper phenol extraction [28]. A second portion of the solution was further diluted in a 2 mL centrifuge tube containing 10 mg Polyvinylpyrrolidone (PVP) and incubated on ice for 30 min after vortexing. Following centrifugation, 75% of the aliquot was placed in a new centrifuge tube containing another 10 mg PVP before extraction [29]. The total phenolic concentration in solution was determined colorimetrically using the Folin–Ciocalteau method. Phenol and tannin concentrations were measured in Gallic Acid Equivalents (GAE) relative to an eight-point gallic acid standard curve. Tannins were calculated as the total phenol concentration minus the concentration of phenols left in solution after PVP was added. Chlorophyll and carotenoid concentrations were quantified using two frozen leaf disks per crown (1.54 cm2). These disks were rapidly ground in 1.5 mL centrifuge tubes containing 0.75 mL of 100% acetone on a high-throughput tissue homogenizer (Troemner, Thorofare, NJ, USA) with a small amount of MgCO3 to prevent acidification. Following dilution and centrifugation for 3 min at 3000 rpm, the absorbance of the supernatant was measured using a dual-beam scanning UV–VIS spectrometer (Lambda 25, Perkin Elmer, Beaconsfield, UK).
2.5. Linking Field and Remotely Sensed Data
A diagram of the foliar trait retrieval process is shown in Figure 2. At each sampling location, fully exposed tree canopies that were distinguishable in preliminary orthorectified reflectance and/or canopy height imagery were hand-delineated. Field foliar trait sampling was restricted to the sunlit portion of the canopies identified in the imagery. Reflectance spectra from each of the sampled crowns were deemed suitable for use following a filtering method developed from Asner et al. [15,26]. This filtering method effectively reduces the total canopy analysis area to a level analogous to the “sunlit crown foliage” criterion. Restricting the spectral data to well-lit, highly foliated portions of the crowns helps to standardize sampling conditions, including bidirectional reflectance signals and thus minimizing the inherent difficulties in matching field to remotely sensed data.
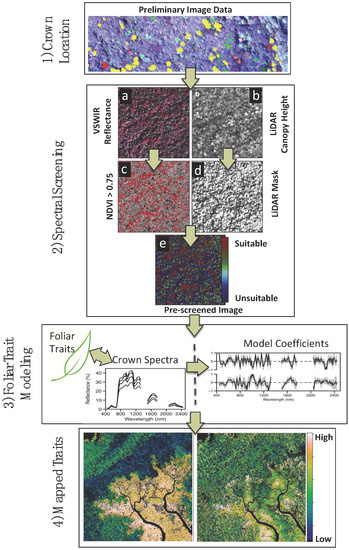
Figure 2.
Diagram of foliar trait retrieval process. Steps include: (1) Identifying crowns in preliminary remote sensing imagery for foliar collection; (2) Prescreening of (a) Carnegie Airborne Observatory (CAO) Visible-to-Shortwave Infrared (VSWIR) imaging spectrometer data using (b) embedded Light Detection and Ranging (LiDAR) data on canopy height and gaps; (c) Minimum Normalized Difference Vegetation Index (NDVI) threshold of 0.75 ensures sufficient foliar cover in each analysis pixel; (d) Combining LiDAR-based canopy height and solar-viewing geometry, a mask is generated to remove pixels in shade, and ground and water surfaces; (e) A visual representation of the combination of the prescreening steps in terms of suitability for use in chemometric modeling; (3) Foliar trait modeling combining field-based biochemical data and remotely sensed spectra (in this model, normalized for brightness). This step can be executed in a variety of different way. We chose to evaluate trait retrieval in five subgroups of the calibration data before testing the model against the global holdout set (30%); (4) Foliar trait models are applied to airborne data across the landscape. Figure adapted from Asner et al. [15].
The filtering method is described briefly here. Following orthorectification, a shade mask was developed using LiDAR tree canopy height data in concert with solar and target geometry at flight time. A 2 m height requirement was also applied to remove any bare ground and short nonforest vegetation such as grass. Next, a hand-generated cloud mask was applied to remove both cloud and cloud shadow. The remaining reflectance spectra were then extracted and further filtered to have values of the Normalized Difference Vegetation Index (NDVI) ≥0.75. Asner et al. [15] found that in tropical forests a minimum NDVI threshold of 0.80 for 2 m pixels was a rapid way to exclude any remaining areas of low leaf area and nonfoliated canopy, while still allowing most foliage into the analyses. Because of the larger pixel size in this study (4 m), more of the canopy area is covered, including portions of shade, which lowers the NDVI. Consequently, the threshold of 0.75 was chosen. Cross-spectrum brightness normalization was applied to all spectra prior to analysis. Cross-spectrum brightness (CSB) is calculated as
where R is the reflectance value at wavelength (nm) i for a given pixel. For this study, R included wavelength bands in the 440–1320, 1500–1760, and 2040–2440 nm regions after excluding portions of the spectrum with high atmospheric water absorption. The CSB uses a ‘spectral angle’ to minimize differences among spectra mainly associated with varying leaf area index [30], but also subtle variation in view and sun angle at the leaf surface on a pixel by pixel basis. CSB values between 1500 and 5100 were used as the final filtering step. CSB filtering eliminates pixels that have anomalously low or high reflectance values across a broad portion of the spectrum that may be missed using only the two bands in NDVI.
A histogram reporting the fraction of 4 m pixels that passed through the filtering process in each site is shown in Figure S1a. The fraction of canopies containing pixels suitable for model development in each site is shown in Figure S1b. On average, 55% of the pixels (3993 of 7245) passed the prescreening criteria. Suitable pixels were found in 424 out of 479 crowns, averaging 8 pixels per crown across the sites (Table 1). The use of preliminary imagery in the field for crown selection helped ensure that 89% of the sampled crowns could be used for modeling, thus limiting time-consuming and costly chemical assays. The crowns deemed unsuitable for model development were located where expected, mainly in the upper sites on Kinabalu where the vegetation is sparse.
We used partial least squares regression (PLSR; [31]) analysis to develop quantitative models relating the brightness normalized airborne spectroscopy data (Figure 3) to lab-assayed foliar traits from the crowns selected in the field. The PLSR approach is often employed in chemometric analyses where there is collinearity among the input variables and the number of input variables is large relative to the number of observations. PLSR is particularly beneficial for the analysis of airborne spectroscopy data because it utilizes the full suite of spectral data relative to the chemical constituents rather than a band-by-band analysis [32]. Using the full spectrum is important to quantify the convolved signal derived from the vibration, bending, and stretching of molecular constituents of the foliar trait that produce signals throughout the entire spectrum. To avoid overfitting, the number of orthogonal spectral–chemical dimensions or latent vectors used in each PLSR model was determined by minimizing the root mean square error (RMSE) statistic. This is analogous to using the Prediction Residual Error Sum of Squares statistic [33], which is simply the RMSE value squared. The RMSE statistic was calculated using a 10-fold cross-validation procedure for each PLSR model run with increasing numbers of latent vectors. PLSR analyses were run using ensemble_plsr.py (Code S1). This code uses the scikit-learn PLS package in Python [34] and draws on concepts from the AutoPLS package in R [35,36], but was redeveloped here to reduce computation time (see Supplementary Material for details). Other regression methods for foliar trait retrieval are becoming popular, especially with the growth of machine learning (i.e., Support Vector Machine, Random Forest) and Bayesian models. However, these approaches have only been tested in regions of low diversity such as temperate deciduous and coniferous forests [37,38], agricultural studies [39], or grasslands [40], not in high-diversity humid tropical forests. In addition, a majority of these methods focus on estimation of pigments (chlorophylls, carotenoids) and nitrogen associated with photosynthesis in the visible to near-infrared regions of the spectrum. Furthermore, many studies have not involved the final mapping step (i.e., [41]), making it difficult to know the efficacy of applying these models across a complicated landscape such as tropical forests.
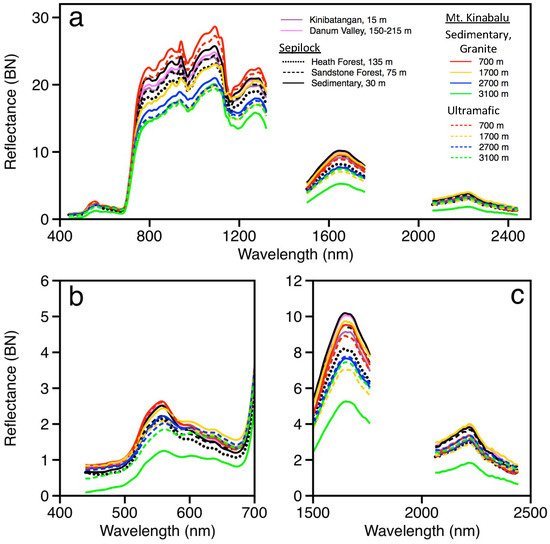
Figure 3.
(a) Mean canopy reflectance spectra at each site derived from pixels suitable for chemometric analysis following prescreening within each collection location. Zoom images of spectra are provided for (b) visible and (c) shortwave infrared regions to reveal subtle features associated with varying chemical concentrations.
For the purpose of PLSR model development and testing for each foliar trait, data from 123 crowns (30%) were reserved for final testing. The data from the remaining crowns were partitioned into five groups containing approximately 60 crowns each, which allowed for validation during the model development process. Five models were developed, each using four of the five groups or 80% of the training crowns (236 crowns). Each model was constructed by performing 100 PLSR iterations, each of which included 90% (212 crowns) of the available crowns and selected 5 pixels (with replacement) for each crown (spectra per iteration were 1700). The coefficient of determination (R2) and RMSE were calculated on the remaining 10% of crowns (24 crowns with 188 spectra). Model equations from robust models (having an R2 greater than the median R2 and RMSE less than the median RMSE for the 100 iterations) were selected and averaged. The average model was tested against each holdout group (60 crowns) to generate model validation statistics. Finally, equations from the robust models (n = 250) of the internal calibration were averaged to produce the final model for each foliar trait. The precision and accuracy of the final PLSR model for each foliar trait were assessed based on the R2 and RMSE, respectively, using standard least squares linear regression between the remotely sensed (modeled) trait values and field-measured trait values in the original holdout set (123 crowns). All accuracy calculations were performed using the crown-level average of each trait. This iterative process allowed us to account for the high degree of variation in both chemistry and spectra within each crown. This variation is expressed in the standard deviation of the spectral weightings.
3. Results
3.1. Canopy Chemical Variation
Foliar traits of sunlit crowns varied widely at both the local and regional scales (Table 2, Table S2). Our values are in agreement with ranges reported in global databases and biome syntheses [8,42,43]. However, the distributions of foliar traits measured at the 13 locations in Sabah were more similar to those of a foliar trait dataset from 395 crowns in Sarawak, Malaysia [44] than those measured with the same methods in the Neotropics. Similar to the measurements in Sarawak, foliar Ca, P, and N were lower and LMA was higher than those found in the Neotropics, suggesting nutrient limitation in these forests of Southeast Asia. Lignin and micronutrients, B and Fe, averaged 27%, and 24 and 37 µg·g−1, respectively, and also appeared to be suppressed compared to concentrations measured on elevation gradients within humid rainforests of the Neotropics and elsewhere around the world [43].
Table 2.
Mean partial least squares regression (PLSR) model results (R2; RMSE; mean standardized % RMSE) and latent vectors for 16 canopy chemical traits and leaf mass per area (LMA) using airborne high-fidelity visible-to-shortwave infrared (VSWIR) spectroscopy are shown. Statistics were generated using 303 randomly selected tree crowns (70%) containing the canopy trait mean and range detailed below. Also shown are field validation results from prediction of the remaining 123 crowns (30%) excluded from the model. Traits are as follows. N: total nitrogen; Water: leaf water content; Chl ab: chlorophyll ab; NSC: nonstructural carbohydrates; δ13C: the isotopic ratio of 13C; P, Ca, K, Mg, B, and Fe: total phosphorous, calcium, potassium, magnesium, boron, and iron, respectively; C: total carbon.
The diversity of foliar traits among species is a function of stoichiometric relationships between constituents [45]. Correlation among traits reduces the dimensionality of functional diversity in trait relationships, whereas orthogonal properties indicate the independent functionality of the foliar traits in the relationships. Principal component (PC) analysis revealed that a single linear combination of traits (PC1) explained just 32% of the variation among 17 foliar traits measured in the lowland locations (Figure 4a), and 29% for the seven locations where all 20 foliar traits (including chlorophylls and defense traits phenols and tannins) were measured (Figure 4b). In both cases, 75% of the variation was explained by the first six PCs, while 12 and 10 PCs were needed to explain 95% of the variation in the lowland dataset and all canopies, respectively (Table S3). Among the lowland sites where all 17 traits were measured, PCs strongly tied to defense traits—phenols, tannins, and cellulose (related to chemical and structural defense)—were orthogonal to PCs dominated by photosynthesis and growth traits such as N, P, chlorophylls, and LMA (Figure 4a). Similarly, when all 13 locations were considered (thus removing phenols, tannins, and chlorophylls), PCs related to structural defense traits—cellulose and lignin—were again orthogonal to PCs related to growth traits N, P, and LMA (Figure 4b, Table S3). These results suggest that trees in the tropical forest communities of Sabah follow the well-documented pattern of trade-off between growth promoted by foliar nutrients and physical defense (LMA; [42,46]), supported by significant investment in chemical defense (phenols and tannins), perhaps due to the dominance of long-lived Dipterocarp species found throughout the region [18,47].
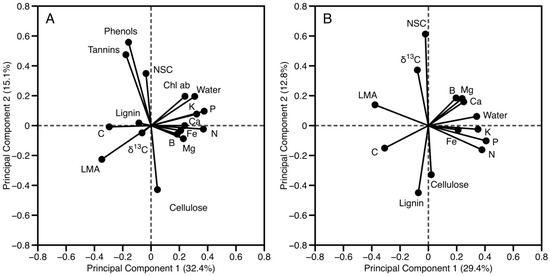
Figure 4.
Principal components analysis of (A) 17 foliar traits measured in the lowlands locations (n = 182), and (B) 14 foliar traits measured in all forest locations (n = 424).
3.2. Airborne Spectral Variation
Average crown spectral variation among the sites (Figure 3 and Figure S2) and within a single site (Figure S3) was greater than that measured among sites in a similar analysis of the Andes and western Amazon basin, even though the samples also spanned a similarly wide range of substrates and elevations from sea level to 3500 m asl. [15]. Relative differences among site-averaged spectra were generally maintained across all wavelength regions from visible to shortwave infrared and remained after normalizing for brightness (Figure 3). Spectra from higher elevation sites, 2700 m and 3100 m on Mt. Kinabalu, had lower reflectance values compared with all other sites. In addition, within a sampling region, average crown spectra had lower reflectance values from sites with lower fertility; for example, spectra from heath and sandstone forests were lower than those from the more dominant Dipterocarp forests found on sedimentary substrates. Furthermore, spectral reflectance values from canopies sampled on lower fertility ultramafic substrates were lower than those from crowns sampled on higher fertility sedimentary or granite substrates at corresponding elevations.
3.3. Model Calibration and Testing
Statistics for the PLSR model development and testing for each of the 17 traits are given in Table 2. Models involving spectral relationships to LMA and rock-derived nutrients in canopy foliage performed most consistently, as measured by R2, among model assessments. For these models, R2 values were greater than 0.25 for calibration and testing, with small decreases in performance in the validation check during model development. Results were generally lower and mixed for foliar traits related to growth and defense. For these traits, model calibration R2 ranged from 0.33 to 0.61, but most dropped by 0.20 during model testing, resulting in a range of 0.18–0.38 among these traits.
Model accuracy, expressed as normalized RMSE, was less than 40% for most traits (Table 2). The exceptions were rock-derived nutrients, where RMSE values were greater than 49% and extremely high, i.e., 96% for B. The number of latent vectors used in the PLSR models ranged from 13 to 21 for each foliar trait. There was no correlation between the number of latent vectors and the performance of the models during either development or testing against the holdout data.
Plots of the relationships between modeled and lab-measured foliar traits illustrate the consistency between model training/holdout data (points and line shown in gray) and model test data (points and line shown in black). In most regions there is strong overlap between training and testing datasets (Figure S4 and Table S4). All regressions were significant (p < 0.02); however, most of the intercepts were significantly different from zero, possibly because the range in modeled trait values was often narrower, biased towards lower values, than that measured by the laboratory assays (Table 2).
The standardized PLSR model coefficients, or weightings, for each chemical trait are shown in Figure 5. Although most wavelengths deviate from the zero line, indicating all wavelength regions were valuable for predicting most foliar traits, the pattern of these deviations away from zero reveals the importance of different spectral regions to specific traits. Spectral regions of known importance for foliar traits aligned well with regions of emphasis in model coefficients. For example, chlorophyll exhibited a well-defined feature in the visible region (Figure 5d), principally 660 nm, the region associated with chlorophyll absorption [48]. Total N (Figure 5b) exhibited features related to N in photosynthetic pigments (the spectral red-edge at approximately 700 nm). Additional features associated with protein N are also evident at 1020–1030 nm and 1500–1700 nm [49]. Foliar traits associated with carbon constituents show strong signals in the SWIR region, particularly at 1700 nm and again around 2200 nm, where secondary bending and stretching of C–H and O–H in cellulose and NSC occur [49,50]. Defense compounds, tannins, and phenols are also composed of C, O, and H, but contain aromatic rings that can bind carbohydrates with N-containing proteins [51]. The N bonding characteristics may account for the broadening of the feature at 2200 nm associated with defense compounds.
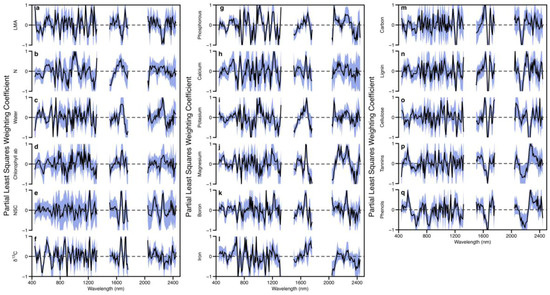
Figure 5.
Mean and standard deviation of standardized spectral weighting vectors for PLSR chemometric results for models reported on in Table 2 and Table S4. Subfigures show (a) leaf mass per area (LMA); (b) nitrogen; (c) leaf water; (d) chlorophyll ab; (e) nonstructural carbohydrates (NSC); (f) δ13C; (g) phosphorous; (h) calcium; (i) potassium; (j) magnesium; (k) boron; (l) iron; (m) calcium; (n) lignin; (o) cellulose; (p) tannins; (q) phenols.
The additional variation between positive and negative weighting coefficients of the models developed in this study, compared to other studies where the coefficients appear with fewer transitions (Figure 5 and Figure S5), arises partially from the fact that we did not remove coefficients based on a user-defined variable significance value as is often done when the AutoPLS package in R is used for model development. We tested models created with and without using coefficient removal, and although the performance statistics were very similar, inspection of the modeled data revealed that inclusion of the full variation was in better agreement with expectations during preliminary application of the model to the landscape level (data not shown); therefore, we continued with the method including all coefficients. The PLSR approach uses the relative importance of molecular constituents in the full spectrum for foliar trait retrieval. The latest high-fidelity sensors (such as CAO-3 of Carnegie and AVIRIS-NG built by the Jet Propulsion Laboratory, Pasadena, CA, USA) with high signal-to-noise performance more accurately measure subtle shifts in reflectance created by small differences at the molecular level in leaf chemistry that we feel should not be eliminated from the models, particularly when an iterative approach is utilized to incorporate a large number of model iterations with varying spectra and chemistry. Additionally, foliar traits are not separate entities within a leaf spectrum, and consequently should include signals of interactions among traits even when there is overlap in the spectral regions used [49,52].
4. Discussion
Across a wide array of forests in northern Borneo, we identified a set of canopy foliar traits that calibrated well with airborne imaging spectrometer measurements covering the 350–2510 nm wavelength region at a 4 m spatial resolution. The precision and accuracy of our foliar trait retrievals were similar to results found using airborne imaging spectroscopy in the Neotropics, a region with a physiognomy and evolutionary history distinct from Southeast Asia, and mapped at different spatial resolutions, both coarser (1 ha) and finer (2 m). For traits measured in both regions, many of the general patterns in coefficient weightings were similar (Figure S5), albeit different in amplitude and degree of variation. These differences may be due to differences in pixel size or the coefficient removal process used in the first model. More testing is needed. Forests of Sabah also reflect a high degree of phosphorous limitation [53] compared to those in the Neotropics where other nutrients such as Ca may be co-limiting. The overwhelming dominance of P limitation governs the stoichiometric relationships among foliar traits in this system that, in turn, underpin the spectral reflectance signatures of the foliage. For example, in all but one site (Kinabatangan), N/P ratios were greater than 14–16, the range above which phosphorous is often said to be the limiting nutrient for plant growth relative to nitrogen in tropical forests [54,55]. In addition, both measured and modeled foliar traits exhibit high correlation values among P, N, and LMA (Tables S5 and S6).
Mapped traits follow patterns of known forest types as shown in an example landscape from the Sepilok Forest Reserve (Figure 6). Higher fertility alluvial forests have low LMA and high N (Figure 6i). Mangrove forests are distinguished as areas of low N and P, with high LMA bordering the inlets (Figure 6ii). Phenols appear higher in transitional forests (Figure 6iii). The ability to retrieve multiple foliar traits from these forest canopies despite differences in the resolution of initial airborne image data compared to previous mapping studies (4 m versus 2 m) and forest physiognomy support the generality of this approach for foliar trait retrieval and mapping.
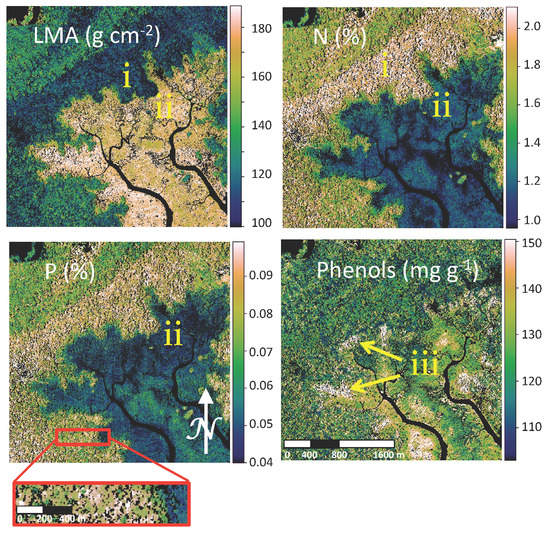
Figure 6.
Maps of predicted foliar traits (leaf mass per area (LMA); total nitrogen (N); total phosphorous (P); phenols) are shown for an example region of the Sepilok Forest Reserve. Color bars represent the linear scale for trait values. Nonvegetated pixels are shown in black (see zoom window). Mapped traits follow known patterns in this example landscape. Areas of low LMA and high N (i) are higher fertility alluvial forests. Areas of low N and P with high LMA bordering the inlets are mangrove forest (ii). Phenols are higher in transitional forests (iii).
4.1. Spectral Quality
Airborne remote sensing of foliar chemistry has been steadily evolving [6,7,56], and with airborne instrumentation approaching or exceeding laboratory quality, there is now a need to assess the consistency and generality of the latest methods for foliar trait retrieval more extensively. Spectroscopy is the quantification of the molecular signal derived from the vibration, bending, and stretching of elemental constituents of the foliar trait [49]. Imaging spectroscopy measures the convolved effects of the elemental chemistry and structural components of leaves and canopies as they have evolved in response to present and past environments [4,57].
The first step to a successful generalized model that can be used in different regions and at different spatial resolutions is the use of standardized spectra for model input and mapping. A major impediment to foliar chemical retrieval rests in separating the chemical signal from those of canopy structure and sun–sensor observation geometry [3,4]. The reduction of multiple sources of spectral contamination from airborne imaging spectroscopy data requires a method to prescreen portions of the crowns unsuitable for chemical analysis, which is possible through the fusion of LiDAR and spectral measurements. In tropical forests, pixels with low leaf area can usually be identified in spectral data using simple vegetation greenness indices like the NDVI. LiDAR measurements provide information about the height and structure of the vegetation, and thus can separate shorter vegetation from the taller forest canopy. In addition, the precise sun-to-canopy-to-sensor geometry provides a means to locate and remove canopy gaps and their associated shadows that interfere with the chemical signal [15]. We call this laser-guided imaging spectroscopy [16].
It is difficult to directly compare spectral reflectance values between flights because differences in absolute reflectance are dominated by brightness, mostly originating from the illumination conditions at the time of data collection, but also from the canopy structure [58]. Ultimately, 55% of the spectra were deemed suitable within the delineated crowns throughout Sabah, compared to 52% of spectra in Peru (Figure 2a), and the available spectra were well distributed among the crowns at each site such that the number of crowns available for analysis was not particularly limited at any specific site. Only one site, the highest elevation site on granitic substrates on Mt. Kinabalu, had approximately 30% of crowns remaining for use in the model (Figure S3b). The nominal spatial resolution for the Sabah flights was 4 m compared to 1–2 m in the Peruvian studies. A 4 m pixel size increases the areal coverage of the canopy fourfold relative to 2 m pixels, and concomitantly increases the probability of capturing intra-crown shadows within a pixel. Further, the 4 m pixel size begins to approach the size of some crowns themselves, particularly at locations of higher elevation or nutrient-poor substrates such as those found on Mt. Kinabalu. At these sites, the spectral reflectance values were much lower than at other sites, and when brightness normalization was applied, the suppressed spectral values remained, suggesting a residual effect of lower leaf area index (LAI) and/or intra-crown shading. The effects of spatial resolution on imaging spectrometer data require study; however, past studies can provide insight. For example, Asner and Warner [59] found that a 10% increase in shaded area within a pixel resulted in a decrease of 3% and 10% in the red and infrared reflectances from IKONOS satellite data, suggesting that more detailed analyses of spatial resolution and intra-/inter-crown shade may be warranted.
4.2. Model Development and Testing
Model development was similar to that presented in Chadwick and Asner [17], which generated crown-level models using a random selection of individual prescreened reflectance spectra from each crown. The advantage of this method is that it utilizes suitable spectra from any flightline that intersects with the crowns sampled for foliar traits in the field. This allows for the incorporation of samples with variation in measurement conditions (i.e., atmospheric haze), as well as multiple remote sensing view angles of the crowns, into the PLSR model development. Inclusion of these sources of variation enhances the generality of the models, which is beneficial because the same variation will be present in the spectra to which the models are applied during mapping.
Model development and test statistics, determined from iterative spectral and chemical selection, showed a consistent level of precision and accuracy. Over half of the traits exhibited retrieval errors of less than 35% relative RMSE, and most were in agreement with the previous studies using this method at the leaf or crown levels [15,17]. Although validation statistics showed slightly lower performances than did the calibration statistics, they followed the same overall pattern, indicating model consistency in foliar trait retrieval. This initial validation step is valuable for a number of reasons. For example, if the calibration and validation statistics revealed large disparities in performance, there would be concern about model overfitting or the appropriate screening of input data. This disparity can serve as a warning to further inspect the model input data, and details can be investigated before applying the derived models to the final holdout data and additional spectroscopic mapping datasets.
PLSR model coefficients followed known spectral–chemical relationships, and the weighting patterns were similar to those found using the same methodology in the Neotropics. N and P exhibited higher weightings in the near-infrared and shortwave infrared spectral regions compared to other regions (Figure 5 and Figure S5), which is indicative of the stoichiometric relationship among these traits (sensu Wright et al. [42]). The degree of similarity between weighting patterns of P and other rock-derived nutrients is less than that seen in the patterns from the Neotropical studies, further supporting the dominance of P limitation in this Southeast Asian landscape compared to the co-limitation of Ca, and possibly other nutrients, seen in the Neotropics. Moreover, structure and defense traits show more distinct weighting patterns in models in the Malaysian forests compared with those in the Neotropics (Figure S5), suggesting greater allocation to these traits as has been seen in other lower fertility tropical forests. Correlations among weighting coefficients showed similar patterns as those of field-measured foliar traits (Table S6), supporting the theory that spectroscopic remote sensing is capturing functionally important variation among foliar traits such as the stoichiometric relationships derived under P limitation.
5. Conclusions
Through our recent study in northern Borneo, we found that multiple canopy foliar traits could be retrieved to high precision and accuracy using a combined approach of airborne laser-guided imaging spectroscopy coupled with an image filtering process and a set of consistent field sampling methods. The results show that this approach performs well across a wide array of forests that have evolved along phylogenetic and evolutionary pathways distinct from that of the Neotropics where this approach was first developed, suggesting it may be generalizable to other humid tropical forests. Further testing of this approach is required, particularly regarding the spatial resolution of initial data collection, before the approach can be used with other airborne and future spaceborne systems. However, the successful retrieval of multiple foliar traits in this study supports the use of this method for mapping canopy functional diversity to aid management and conservation of forests in the humid tropics.
Supplementary Materials
The following are available online at www.mdpi.com/2072-4292/10/2/199. Figure S1: Histograms showing (A) the fraction of 4 m CAO VSWIR pixels within delineated crowns that passed through prescreening criteria in each collection site in Sabah, and (B) the fraction of tree crowns at each site that had suitable pixels following prescreening. Figure S2: (a) Examples of crown reflectance spectra derived from the mean number of pixels at each site (Table 1) suitable for chemometric analysis following prescreening within each collection location. Zoom images of spectra are provided for (b) visible and (c) shortwave infrared regions to reveal subtle features associated with varying chemicals. Figure S3: Mean (solid line), standard deviation (dashed lines), and total range (gray area) of the CAO visible-to-shortwave infrared (VSWIR) crown spectra that passed the prescreening step (see Figure S1) for a collection site (Danum Valley; Table 1). Figure S4: Linear regression analysis between model and lab-measured chemical traits and leaf mass per area (LMA) for crowns used in the canopy calibration model (70%), shown in grey, and the crowns held out for testing (30%), shown in black. The dashed line is the 1:1 line. Regression parameters are given in Table S4. Subfigures show (a) leaf mass per area (LMA), (b) nitrogen, (c) leaf water, (d) chlorophyll ab, (e) nonstructural carbohydrates (NSC), (f) δ13C, (g) phosphorous, (h) calcium, (i) potassium, (j) magnesium, (k) boron, (l) iron, (m) total carbon, (n) lignin, (o) cellulose, (p) tannins, and (q) phenols. Figure S5: Comparison of selected PLSR weighting coefficients from the study in Sabah, Malaysia (red lines) and Peru in the Neotropics (black lines). Table S1: Location (Latitude, Longitude) and forest type for 13 field locations spanning a range of elevation and substrate types across Sabah, Malaysia. Table S2: Mean and range of foliar chemical traits and leaf mass per area sampled from collection locations in Kinabatangan, Danum Valley, and Sepilok in western Sabah, Malaysia. Table S2 cont.: Mean and range in foliar chemical traits and leaf mass per area from collection locations along an elevation gradient on Mt. Kinabalu in Sabah, Malaysia. The upper portion lists traits from sedimentary and granitic substrates. The lower portion lists traits from ultramafic substrates. * nd—no data were collected at these sites for these traits. Table S3: Principle components analysis results for 14 and 17 foliar traits measured at all locations (n crowns = 424; spectra = 3993) or in the lowlands only (n crowns = 182; spectra = 2430). All components except the final one (shown in italics) were significant in explaining a percentage of the total variation (right column) among the traits (Bartlett’s Chi-square test; p < 0.01). Table S4: Parameters from linear regression analysis between model and lab-measured chemical traits and leaf mass per area (LMA) for crowns used in the canopy model development (70%) and the crowns held out for testing (30%). All models were significant p < 0.001, except phenols where the significance value was 0.02. Graphical depictions of results are shown in Figure S4. Table S5: Correlation values (top half of table) among foliar traits measured in 424 tree crowns in Sabah, Malaysia. Significance values are shown in italics in the lower portion of the table. Table S6: Correlation values (top half of table) among weighting coefficients for 14 foliar traits retrieved from airborne spectroscopic measurements of 424 crowns in Sabah, Malaysia. Significance values are shown in italics in the lower portion of the table. Code S1. The location for the python code (ensemble_plrs.py). The code, which draws on elements of the autoPLS package from R, was created to develop and manage results of multiple individual PLSR models in a more computationally efficient way. The code can be found in a public github repository at https://github.com/pgbrodrick/ensemblePLSR.git. The code requires an input csv file of coupled chemistry and spectral data from multiple crowns, as well as a settings file. Example can be found in the repository.
Acknowledgments
We thank our partners from the Sabah Forestry Department, LEAP, PACOS Trust, Layang Layang Aerospace, and other organizations within Malaysia for their support of this study. Airborne mapping, processing, and analysis was funded by the UN Development Programme GEF, Avatar Alliance Foundation, Roundtable on Sustainable Palm Oil, Worldwide Fund for Nature, Morgan Family Foundation, and the Rainforest Trust. The Carnegie Airborne Observatory has been made possible by grants and donations to G.P. Asner from the Avatar Alliance Foundation, Margaret A. Cargill Foundation, David and Lucile Packard Foundation, Gordon and Betty Moore Foundation, Grantham Foundation for the Protection of the Environment, William M. Keck Foundation, John D. and Catherine T. MacArthur Foundation, Andrew Mellon Foundation, Mary Anne Nyburg Baker and G. Leonard Baker Jr, and William R. Hearst III. We also thank three anonymous reviewers for their comments, which have helped strengthen the manuscript.
Author Contributions
The study was conceived and designed by Gregory P. Asner and Roberta E. Martin; Field data was collected by Roberta E. Martin and K. Dana Chadwick; Roberta E. Martin and Loreli Carranza-Jimenez carried out laboratory analyses; Data analysis was performed by Roberta E. Martin, Philip G. Brodrick., K. Dana Chadwick, and Nicholas R. Vaughn. The manuscript was written by Roberta E. Martin with contributions from Gregory P. Asner, Philip G. Brodrick, K. Dana Chadwick, Loreli Carranza-Jimenez, and Nicholas R. Vaughn.
Conflicts of Interest
The authors declare no conflict of interest.
References
- Townsend, A.R.; Asner, G.P.; Cleveland, C.C. The biogeochemical heterogeneity of tropical forests. Trends Ecol. Environ. 2008, 23, 424–431. [Google Scholar] [CrossRef] [PubMed]
- Reichstein, M.; Bahn, M.; Mahecha, M.D.; Kattge, J.; Baldocchi, D.D. Linking plant and ecosystem functional biogeography. Proc. Natl. Acad. Sci. USA 2014. [Google Scholar] [CrossRef] [PubMed]
- Kokaly, R.F.; Asner, G.P.; Ollinger, S.V.; Martin, M.E.; Wessman, C.A. Characterizing canopy biochemistry from imaging spectroscopy and its application to ecosystem studies. Remote Sens. Environ. 2009, 113, S78–S91. [Google Scholar] [CrossRef]
- Ollinger, S.V. Sources of variability in canopy reflectance and the convergent properties of plants. New Phytol. 2011, 189, 375–394. [Google Scholar] [CrossRef] [PubMed]
- Asner, G.P.; Martin, R.E.; Anderson, C.B.; Kryston, K.; Vaughn, N.; Knapp, D.E.; Bentley, L.P.; Shenkin, A.; Salinas, N.; Sinca, F.; et al. Scale dependence of canopy trait distributions along a tropical forest elevation gradient. New Phytol. 2017, 214, 973–988. [Google Scholar] [CrossRef] [PubMed]
- Ustin, S.L. Remote sensing of canopy chemistry. Proc. Natl. Acad. Sci. USA 2013, 110, 804–805. [Google Scholar] [CrossRef] [PubMed]
- Homolova, L.; Malenovský, Z.; Clevers, J.G.; García-Santos, G.; Schaepman, M.E. Review of optical-based remote sensing for plant trait mapping. Ecol. Complex. 2013, 15, 1–16. [Google Scholar] [CrossRef]
- Kattge, J.; Diaz, S.; Lavorel, S.; Prentice, I.C.; Leadley, P.; Bonisch, G.; Garnier, E.; Westoby, M.; Reich, P.B.; Wright, I.J.; et al. TRY—A global database of plant traits. Glob. Chang. Biol. 2011, 17, 2905–2935. [Google Scholar] [CrossRef]
- Schimel, D.S.; Asner, G.P.; Moorcroft, P.R. Observing changing ecological diversity in the Anthropocene. Front. Ecol. Environ. 2013, 11, 129–137. [Google Scholar] [CrossRef]
- Asner, G.P.; Martin, R.E. Airborne spectranomics: Mapping canopy chemical and taxonomic diversity in tropical forests. Front. Ecol. Environ. 2009, 7, 269–276. [Google Scholar] [CrossRef]
- Asner, G.P.; Martin, R.E. Spectranomics: Emerging science and conservation opportunities at the interface of biodiversity and remote sensing. Glob. Ecol. Conserv. 2016, 8, 212–219. [Google Scholar] [CrossRef]
- Asner, G.P.; Knapp, D.E.; Anderson, C.B.; Martin, R.E.; Vaughn, N. Large-scale climatic and geophysical controls on the leaf economics spectrum. Proc. Natl. Acad. Sci. USA 2016, 113, 4043–4051. [Google Scholar] [CrossRef] [PubMed]
- Asner, G.P.; Martin, R.E.; Carranza-Jiménez, L.; Sinca, F.; Tupayachi, R.; Anderson, C.B.; Martinez, P. Functional and biological diversity of foliar spectra in tree canopies throughout the Andes to Amazon region. New Phytol. 2014. [Google Scholar] [CrossRef] [PubMed]
- Asner, G.P.; Knapp, D.E.; Boardman, J.; Green, R.O.; Kennedy-Bowdoin, T.; Eastwood, M.; Martin, R.E.; Anderson, C.; Field, C.B. Carnegie Airborne Observatory-2: Increasing science data dimensionality via high-fidelity multi-sensor fusion. Remote Sens. Environ. 2012, 124, 454–465. [Google Scholar] [CrossRef]
- Asner, G.P.; Martin, R.E.; Anderson, C.B.; Knapp, D.E. Quantifying forest canopy traits: Imaging spectroscopy versus field survey. Remote Sens. Environ. 2015, 158, 15–27. [Google Scholar] [CrossRef]
- Asner, G.P.; Martin, R.E.; Knapp, D.E.; Tupayachi, R.; Anderson, C.B.; Sinca, F.; Vaughn, N.R.; Llactayo, W. Airborne laser-guided imaging spectroscopy to map forest trait diversity and guide conservation. Science 2017, 355, 385–389. [Google Scholar] [CrossRef] [PubMed]
- Chadwick, K.; Asner, G. Organismic-Scale Remote Sensing of Canopy Foliar Traits in Lowland Tropical Forests. Remote Sens. 2016, 8, 87. [Google Scholar] [CrossRef]
- Ashton, P.S. Dipterocarp biology as a window to the understanding of tropical forest structure. Ann. Rev. Ecol. Syst. 1988, 19, 347–370. [Google Scholar] [CrossRef]
- English, M.; Gillespie, G.; Ancrenaz, M.; Ismail, S.; Goossens, B.; Nathan, S.; Linklater, W. Plant selection and avoidance by the Bornean elephant (Elephas maximus borneensis) in tropical forest: Does plant recovery rate after herbivory influence food choices? J. Trop. Ecol. 2014, 30, 371–379. [Google Scholar] [CrossRef]
- Marsh, C.W.; Greer, A.G. Forest land-use in Sabah, Malaysia: An introduction to Danum Valley. Philos. Trans. R. Soc. Lond. B Biol. Sci. 1992, 335, 331–339. [Google Scholar] [CrossRef]
- Born, J.; Pluess, A.R.; Burslem, D.F.; Nilus, R.; Maycock, C.R.; Ghazoul, J. Differing Life History Characteristics Support Coexistence of Tree Soil Generalist and Specialist Species in Tropical Rain Forests. Biotropica 2014, 46, 58–68. [Google Scholar] [CrossRef]
- Walsh, R.P.D.; Newbery, D.M. The ecoclimatology of Danum, Sabah, in the context of the world’s rainforest regions, with particular reference to dry periods and their impact. Philos. Trans. R. Soc. Lond. B Biol. Sci. 1999, 354, 1869–1883. [Google Scholar] [CrossRef] [PubMed]
- Kitayama, K. An altitudinal transect study of the vegetation on Mount Kinabalu, Borneo. Vegetatio 1992, 102, 149–171. [Google Scholar] [CrossRef]
- Aiba, S.; Kitayama, K. Structure, composition and species diversity in an altitude-substrate matrix of rain forest tree communities on Mount Kinabalu, Borneo. Plant Ecol. 1999, 140, 139–157. [Google Scholar] [CrossRef]
- Kitayama, K.; Majalap-Lee, N.; Aiba, S. Soil phosphorus fractionation and phosphorus-use efficiencies of tropical rainforests along altitudinal gradients of Mount Kinabalu, Borneo. Oecologia 2000, 123, 342–349. [Google Scholar] [CrossRef] [PubMed]
- Asner, G.; Martin, R. Spectral and chemical analysis of tropical forests: Scaling from leaf to canopy levels. Remote Sens. Environ. 2008, 112, 3958–3970. [Google Scholar] [CrossRef]
- Colgan, M.S.; Baldeck, C.A.; Féret, J.B.; Asner, G.P. Mapping savanna tree species at ecosystem scales using support vector machine classification and BRDF correction on airborne hyperspectral and LiDAR data. Remote Sens. 2012, 4, 3462–3480. [Google Scholar] [CrossRef]
- Ainsworth, E.A.; Gillespie, K.M. Estimation of total phenolic content and other oxidation substrates in plant tissues using Folin Coicalteau reagent. Nat. Protoc. 2007, 2, 875–877. [Google Scholar] [CrossRef] [PubMed]
- Toth, G.B.; Pavia, H. Removal of dissolved brown algal phlorotannins using insoluble Polyvinylpyrrolidone (PVPP). J. Chem. Ecol. 2001, 27, 1899–1910. [Google Scholar] [CrossRef] [PubMed]
- Feilhauer, H.; Asner, G.P.; Martin, R.E.; Schmidtlein, S. Brightness-normalized Partial Least Squares Regression for hyperspectral data. J. Quant. Spectrosc. Radiat. Transf. 2010, 111, 1947–1957. [Google Scholar] [CrossRef]
- Haaland, D.M.; Thomas, E.V. Partial least-squares methods for spectral Analyses. 1. Relation to other quantitative calibration methods and the extraction of qualitative information. Anal. Chem. 1988, 60, 1193–1202. [Google Scholar] [CrossRef]
- Martens, H. Reliable and relevant modelling of real world data: A personal account of the development of PLS Regression. Chemometr. Intell. Lab. Syst. 2001, 58, 85–95. [Google Scholar] [CrossRef]
- Chen, S.; Hong, X.; Harris, C.J.; Sharkey, P.M. Sparse modeling using orthogonal forest regression with PRESS statistic and regularization. IEEE Trans. Syst. Man Cybern. 2004, 34, 898–911. [Google Scholar] [CrossRef]
- Pedregosa, F.; Varoquaux, G.; Gramfort, A.; Michel, V.; Thirion, B.; Grisel, O.; Blondel, M.; Prettenhofer, P.; Weiss, R.; Dubourg, V.; et al. Scikit-learn: Machine Learning in Python. J. Mach. Learn. Res. 2011, 12, 2825–2830. [Google Scholar]
- Development Core Team, R. R: A Language and Environment For Statistical Computing; R Foundation for Statistical Computing: Vienna, Austria, 2014. [Google Scholar]
- Schmidtlein, S.; Feilhauer, H.; Bruelheide, H. Mapping plant strategy types using remote sensing. J. Veg. Sci. 2012, 23, 395–405. [Google Scholar] [CrossRef]
- Martin, M.E.; Plourde, L.C.; Ollinger, S.V.; Smith, M.-L.; McNeil, B.E. A generalizable method for remote sensing of canopy nitrogen across a wide range of forest ecosystems. Remote Sens. Environ. 2008, 112, 3511–3519. [Google Scholar] [CrossRef]
- Roberts, D.A.; Ustin, S.L.; Ogunjemiyo, S.; Greenberg, J.; Dobrowski, S.Z.; Chen, J.Q.; Hinckley, T.M. Spectral and structural measures of northwest forest vegetation at leaf to landscape scales. Ecosystems 2004, 7, 545–562. [Google Scholar] [CrossRef]
- Mercier, G.; Lennon, M. Support vector machines for hyperspectral image classification with spectral-based kernels. In Proceedings of the 2003 IEEE International Geoscience and Remote Sensing Symposium, Toulouse, France, 21–25 July 2003; Volume 1, pp. 288–290. [Google Scholar]
- Knox, N.M.; Skidmore, A.K.; Sclerf, M.; de Boer, W.F.; van der Wall, C.; Prins, H.H.T.; Slotow, R. Nitrogen predition in grasses: Effect of bandwidth and plant material state on absorption feature selection. Int. J. Remote Sens. 2010, 31, 691–704. [Google Scholar] [CrossRef]
- Feilhauer, H.; Asner, G.P.; Martin, R.E. Multi-method ensemble selection of spectral bands related to leaf biochemistry. Remote Sens. Environ. 2015, 164, 57–65. [Google Scholar] [CrossRef]
- Wright, I.J.; Reich, P.B.; Westoby, M.; Ackerly, D.D.; Baruch, Z.; Bongers, F.; Cavender-Bares, J.; Chapin, T.; Cornelissen, J.H.C.; Diemer, M.; et al. The worldwide leaf economics spectrum. Nature 2004, 428, 821–827. [Google Scholar] [CrossRef] [PubMed]
- Asner, G.P.; Martin, R.E. Convergent elevation trends in canopy chemical traits of tropical forests. Glob. Chang. Biol. 2016, 22, 2216–2227. [Google Scholar] [CrossRef] [PubMed]
- Asner, G.P.; Martin, R.E.; Suhaili, A. Bin Sources of canopy chemical and spectral diversity in lowland Bornean forest. Ecosystems 2012, 15, 504–517. [Google Scholar] [CrossRef]
- Sterner, R.W.; Elser, J.J. Ecological Stoichiometry; Princeton University Press: Princeton, NJ, USA, 2002. [Google Scholar]
- Diaz, S.; Kattge, J.; Cornelissen, J.H.; Wright, I.J.; Lavorel, S.; Dray, S.; Reu, B.; Kleyer, M.; Wirth, C.; Prentice, I.C.; et al. The global spectrum of plant form and function. Nature 2016, 529, 167–171. [Google Scholar] [CrossRef] [PubMed]
- Katabuchi, M.; Kurokawa, H.; Davies, S.J.; Tan, S.; Nakashizuka, T. Soil resource availability shapes community trait structure in a species-rich dipterocarp forest. J. Ecol. 2012, 100, 643–651. [Google Scholar] [CrossRef]
- Blackburn, G.A. Remote sensing of forest pigments using airborne imaging spectrometer and LIDAR imagery. Remote Sens. Environ. 2002, 82, 311–321. [Google Scholar] [CrossRef]
- Curran, P.J. Remote sensing of foliar chemistry. Remote Sens. Environ. 1989, 30, 271–278. [Google Scholar] [CrossRef]
- Asner, G.; Martin, R. Spectroscopic Remote Sensing of Non-Structural Carbohydrates in Forest Canopies. Remote Sens. 2015, 7, 3526–3547. [Google Scholar] [CrossRef]
- Porter, L.J. Structure and Chemical Properties of the Condensed Tannins. In Plant Polyphenols; Springer: Boston, MA, USA, 1992; pp. 245–258. [Google Scholar]
- Blackburn, G.A. Hyperspectral remote sensing of plant pigments. J. Exp. Bot. 2007, 58, 855–867. [Google Scholar] [CrossRef] [PubMed]
- Potts, M.D.; Ashton, P.S.; Kaufman, L.S.; Plotkin, J.B. Habitat Patterns in Tropical Rain Forests: A Comparison of 105 Plots in Northwest Borneo. Ecology 2012, 83, 2782–2797. [Google Scholar] [CrossRef]
- McGroddy, M.E.; Daufresne, T.; Hedin, L.O. Scaling of C:N:P stoichiometry in forests worldwide: Implications of terrestrial Redfield-type ratios. Ecology 2004, 85, 2390–2401. [Google Scholar] [CrossRef]
- Townsend, A.R.; Cleveland, C.C.; Asner, G.P.; Bustamante, M.M.C. Controls over foliar N:P ratios in tropical rain forests. Ecology 2007, 88, 107–118. [Google Scholar] [CrossRef]
- Asner, G.P. CHAPTER TWELVE A chemical-evolutionary basis for remote sensing of tropical forest diversity. In Forests and Global Change; Coomes, D.A., Barslem, D.F.R.P., Simonson, W.D., Eds.; Cambridge University Press: Cambridge, UK, 2014; pp. 343–358. [Google Scholar]
- Townsend, P.A.; Serbin, S.P.; Kruger, E.L.; Gamon, J.A. Disentangling the contribution of biological and physical properties of leaves and canopies in imaging spectroscopy data. Proc. Natl. Acad. Sci. USA 2013, 110, 4431–4432. [Google Scholar] [CrossRef] [PubMed]
- Asner, G.G.P. Biophysical and biochemical sources of variability in canopy reflectance. Remote Sens. Environ. 1998, 64, 234–253. [Google Scholar] [CrossRef]
- Asner, G.P.; Warner, A.S. Canopy shadow in IKONOS satellite observations of tropical forests and savannas. Remote Sens. Environ. 2003, 87, 521–533. [Google Scholar] [CrossRef]
© 2018 by the authors. Licensee MDPI, Basel, Switzerland. This article is an open access article distributed under the terms and conditions of the Creative Commons Attribution (CC BY) license (http://creativecommons.org/licenses/by/4.0/).