1. Introduction
Soil moisture (SM) is an important hydrologic and climate variable, and it plays a key role in water and energy budgets [
1]. With the development of remote sensing (RS) technology, a large number of operational global-scale SM microwave products have become available, e.g., Soil Moisture Active Passive (SMAP) products [
2], Soil Moisture and Ocean Salinity (SMOS) products [
3], and merged productions [
4,
5]. These products have been shown to provide useful information for geophysical applications, such as studies of the water cycle [
6], numerical weather forecasting [
7], runoff prediction [
8], and climate change [
9]. In practical studies, RS SM products are generally assimilated into land surface models or hydrologic models to calibrate the parameters or to improve the state variables. Before employing these RS SM products, it is necessary to understand their accuracies.
Two factors lead to limitation and difficulty in the accuracy evaluations of RS SM products [
10]. One is the mismatch of the spatial scale between the ground single-point observations (~5 cm) and RS pixels (~25–40 km). The other is the strong spatial heterogeneity of SM. The above issues indicate that a large number of ground-based sites will be required to validate a single RS pixel. A great deal of available soil moisture measurement networks have been unified into a common dataset called the International Soil Moisture Network (ISMN) [
11]. However, the spatial characteristic of the ISMN is not ideal for the evaluation of satellite-derived soil moisture products due to low sampling densities of observation networks or even only one observation site in a single RS footprint, unless the observation networks are optimally designed [
12]. When the sampling designs are not good enough, effective upscaling algorithms can be implemented for sparse ground observation [
13].
Upscaling algorithms generally utilize the spatial and temporal variability of in situ measurements. The spatial variability information of ground-based measurements is hard captured by sparse observation networks, but single point or averaged multipoint observations are generally adopted to represent the ground truth [
14,
15]. It is feasible to upscale the limited number of sites by analyzing the temporal behaviors of in situ measurements, e.g., temporal stability analysis finding the most representative site [
16] or a Thiessen polygon area weighing the combination of all sites, assuming the representativeness of each site to its polygon field [
17]. The temporal representativeness at a given spatial extent has a significant impact on upscaling accuracies, especially sparse ground-based sites, but the representativeness is difficult to measure due to the unknown ground truth [
18].
Qin et al. [
19] developed an upscaling algorithm based on the Bayesian linear regression for sparse ground observations, which did not need to measure the representativeness of ground-based sites. This algorithm can give a representative weighting combination of all temporal observations from different ground-based sites by combining with a moderate spatial resolution of RS used to represent temporal changes of ground truth in the validated pixel scale, and it has been successfully applied in different cases [
20,
21]. However, the underlying correlation between the temporal in situ measurements may cause issues including an unstable weighting combination of all ground-based sites, an overfitting problem, and redundant ground observations, which may lead to ineffective predictions.
In this paper, an upscaling algorithm called ridge regression (RR) is employed to handle the above problems. Two cases with sparse ground-based sites are used to test the performance of the RR method with a limited number of sites, and the ordinary least squares (OLS) method and the arithmetic mean (AM) method are also performed for comparison with the RR method. Finally, the impact of the number of ground-based sites on upscaling accuracies is discussed.
2. Materials and Methods
2.1. Study Area and Data
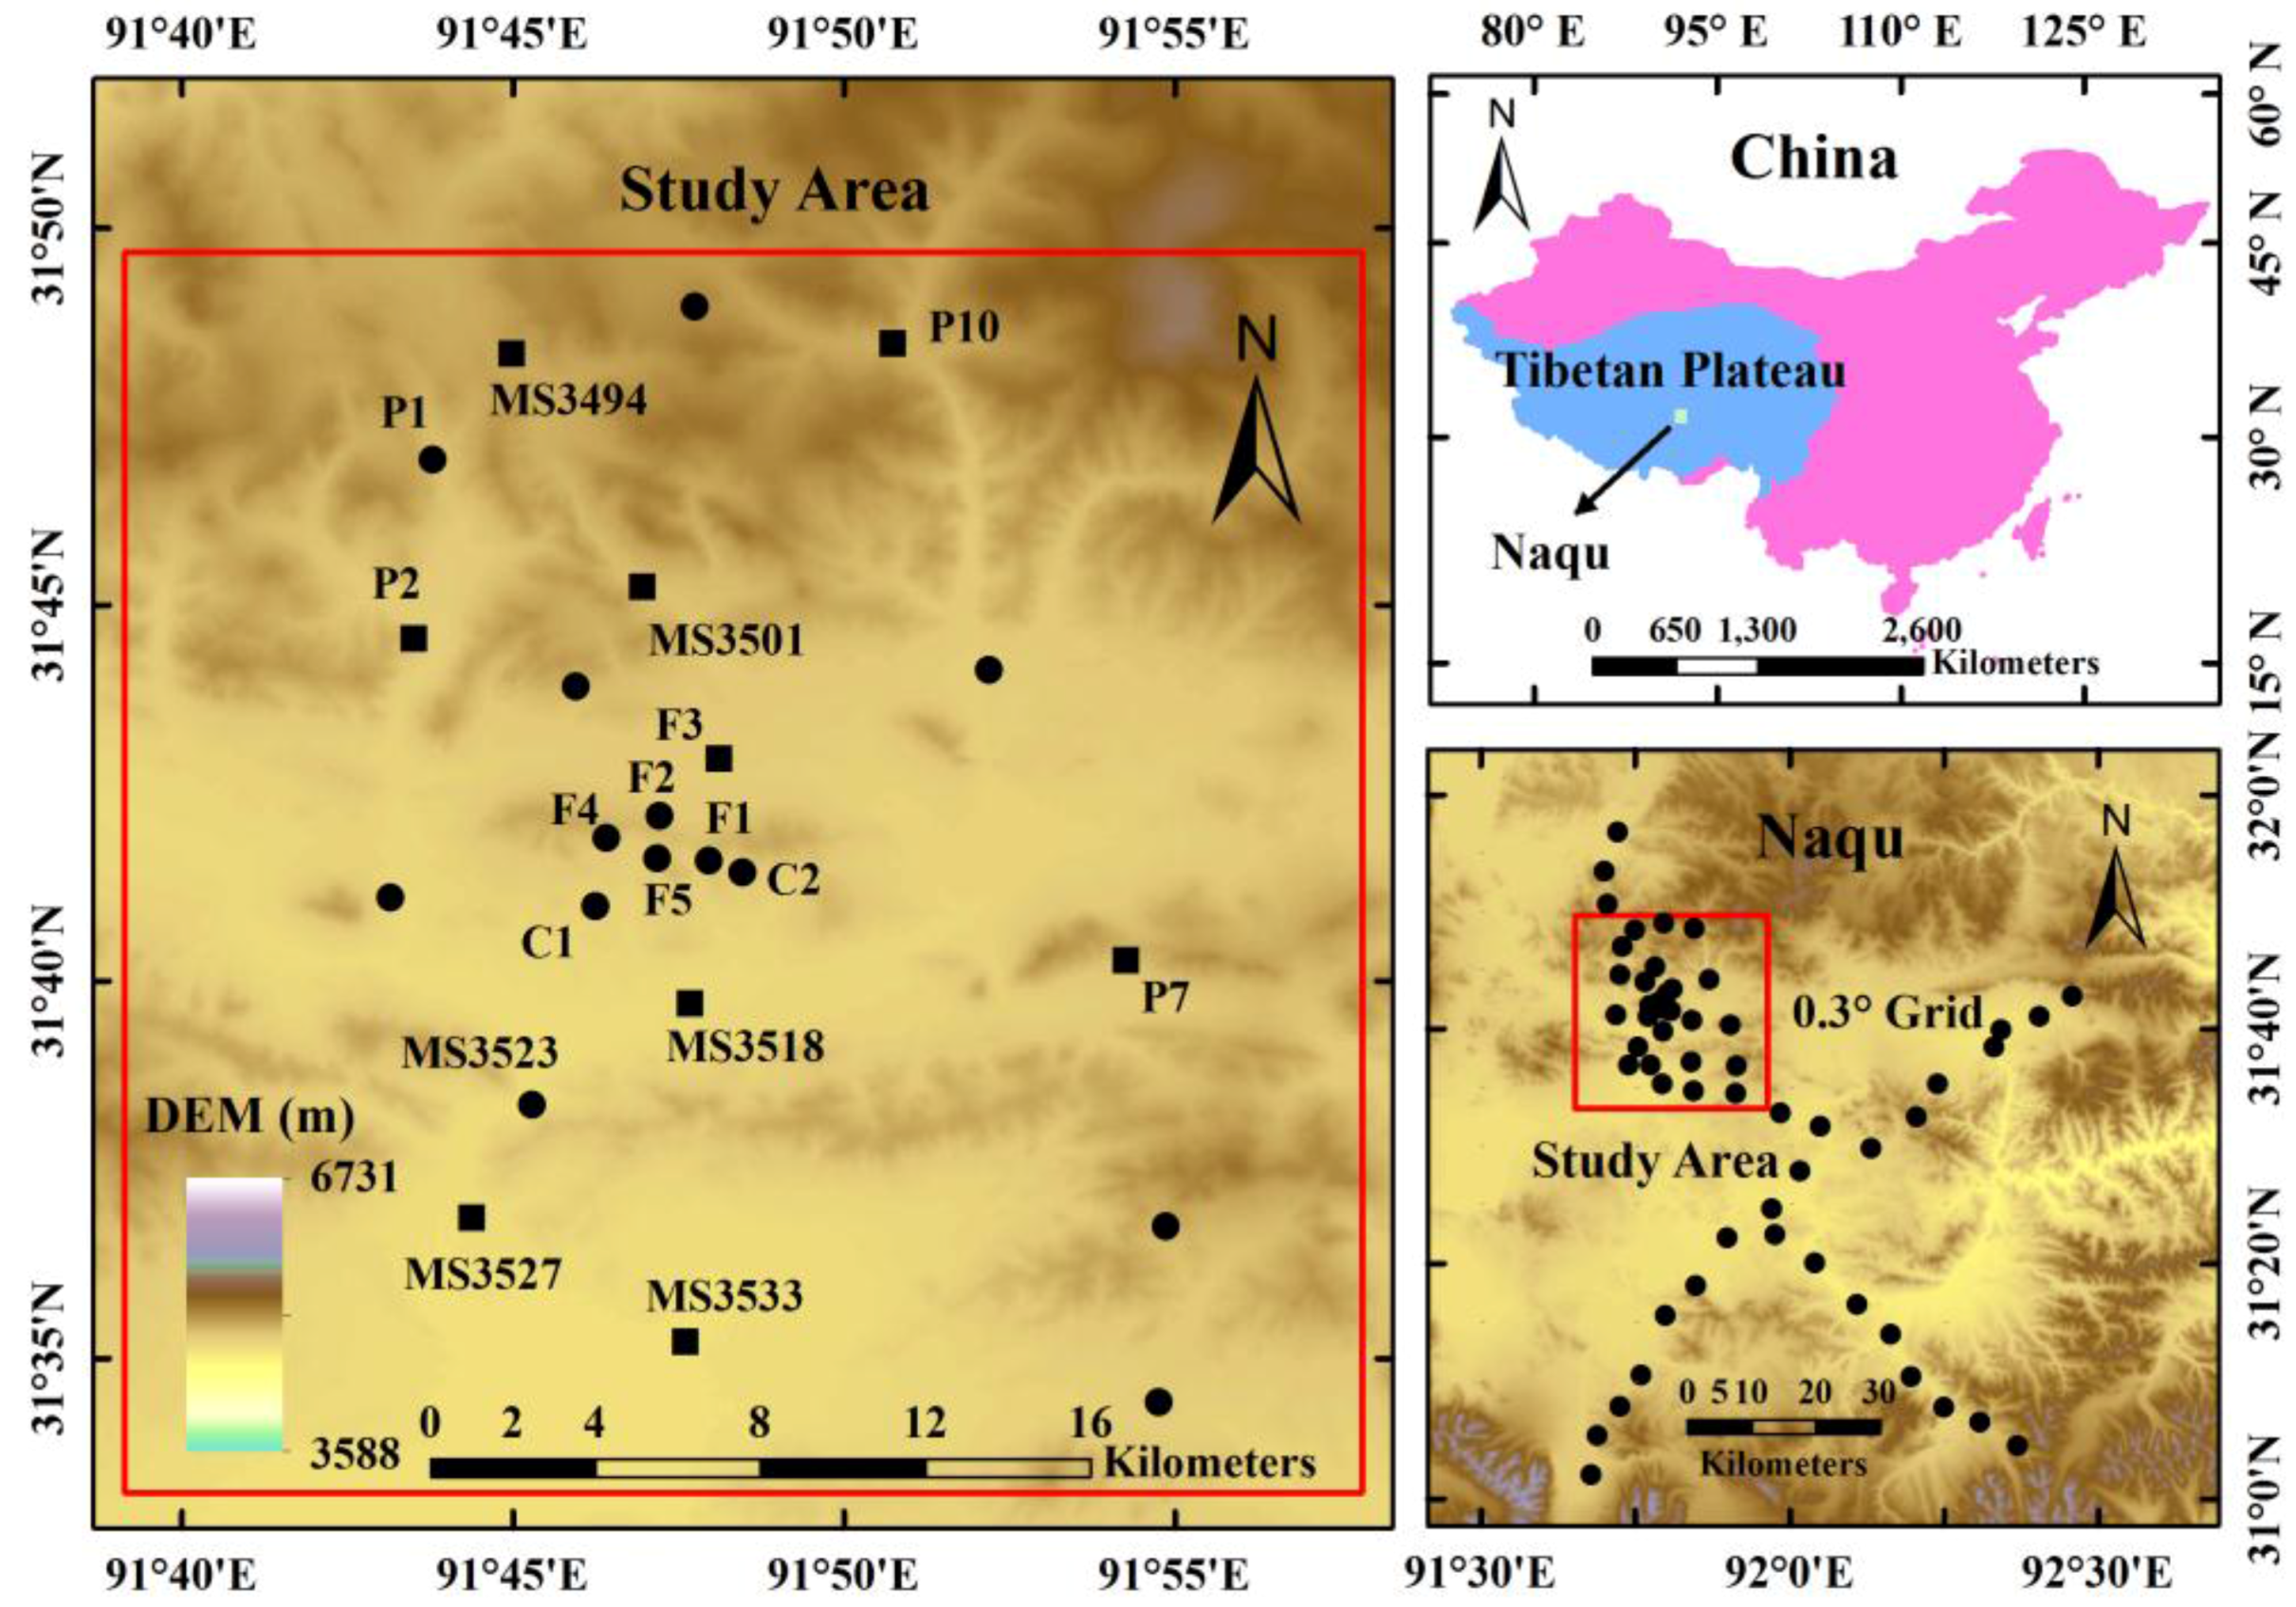
The study area is located in Naqu, which is situated on the Tibetan Plateau (TP), China. A multi-scale SM and temperature monitoring network on the central TP (CTP-SMTMN) was deployed in Naqu over an area covering approximately 1.0° × 1.0° [
22]. This network covers three scales, large, medium, and small, which have spatial extents of 1.0°, 0.3°, and 0.1°, respectively. As shown in
Figure 1, the ground-based sites located within the 0.3° × 0.3° grid are ideal for an upscaling algorithm study due to the high sample density. A total of 17 labeled sites in
Figure 1 without missing measurements are used (see
Table 1), and the average of all of the sites is considered as the relative ground truth (reference data) at the 0.3° × 0.3° grid scale. Nine randomly selected ground-based sites (denoted by squares in
Figure 1) are upscaled to a grid of 0.3° to test the suitability of the upscaling algorithm for sparse sites. The in situ measurements obtained at a depth of 5 cm from May 2015 to October 2015 are adopted. MODIS eight-day albedo (MCD43B3) and daily land surface temperature (LST, MOD11A1 and MYD11A1) data are used to calculate the apparent thermal inertia (ATI) with a spatial resolution of 1 km for representing the spatial heterogeneity of SM within the 0.3° grid.
2.2. Methodology
A number of studies have been conducted to validate remote sensing SM products by upscaling ground-based point observations. It is important to develop an upscaling algorithm to face the current situation of the existing ground networks—low-density sampling. An effective solution is to establish a temporal relationship between the in situ measurements and the ground truth at the validated pixel scale for assigning weighting coefficients (WCs) to ground-based sites.
2.2.1. Obtaining Samples of Ground Truth at the Validated Pixel Scale
The samples representing ground truth at the validated pixel scale are needed to determine an appropriate relationship between in situ measurements and ground truth. The samples can be obtained by taking the mean of high-density SM networks [
23], simulating SM by models [
24,
25,
26,
27] and auxiliary information related to SM derived from remote sensing data [
20,
28].
Remotely sensed observation and its derivative products, having high coverage and easy availability, can act as auxiliary data to capture the spatial distribution of SM. In this paper, ATI derived from MODIS with a moderate spatial resolution is adopted due to its inherent relationship with SM, and ATI with a spatial resolution of 1 km is computed using the MODIS albedo and LST products as follows [
29]:
where
is the solar correction factor, and
represents the surface albedo.
denotes the maximum daily amplitude of land surface temperature, and it can be derived from the MODIS LST product. An empirical relationship between the in situ SM measurements
and MODIS-derived ATI
can be formulated as:
where
represents the random error. The relationship function
is used to transform the ATI to SM. The samples representing the true values at the validated pixel can be calculated by averaging the SM obtained from Equation (2) within the validated pixel of 0.3°.
2.2.2. Determining Weighting Coefficients for Ground Sites
The temporal dynamic of SM at the validated pixel can be captured using the in situ measurements within or near the validated grid. An optimal linear relationship between the true values at the pixel scale
and the ground-based observations can be written as follows:
where
is the number of ground-based sites,
is the WC assigned to the
ith site and is constant in the time window
expressed as
, and
represents the temporal observations made at the
ith site.
The equation used to estimate
is written as follows:
where
indicates the vector of samples of the SM truth
,
is the vector of the WCs
, and
is the observation matrix:
where
represents the observation at the
Nth site at time
.
To minimize the estimation variance, the OLS method is generally used to determine
:
However, the underlying temporal correlations between
observed at different ground-based sites
result in the multicollinearity problem, which means that a time series of observations at one ground-based site can be linearly predicted from the temporal observations at other sites with a substantial degree of accuracy. As the multicollinearity problem worsens, the diversity of
becomes lower. The multicollinearity problem increases the complexity of the prediction model (the existence of redundant sites), may cause the overfitting problem, and induces unreasonable WCs, e.g., negative values [
30]. To reduce the adverse impact of multicollinearity when estimating
, the ridge regression is performed by adding a regularization parameter
to the diagonal direction of matrix
in Equation (6); then, the new form is as follows:
where the parameter
can be determined by analyzing the ridge trace, which represents the changes of
with different values of
. When the WCs are stable, the parameter
is confirmed depending on subjective experience.
3. Results and Discussion
To test the performance of the RR method for sparse ground-based sites, the limited number of sites needs to be determined. By analyzing the statistical characteristics of
n-site mean cases (
), the statistical indexes (e.g., standard deviation) tend to be stable when
n is greater than 10. Thus, the number of sites less than 10 is considered sparse, and then nine randomly selected ground-based sites with label names (see
Figure 1) are upscaled to a grid of 0.3°. The case with six sites optimally selected by the analysis of the ridge trace from nine sites is compared with the nine-site case. The means of all the ground-based observations within the 0.3° × 0.3° grid are used as reference data to compare the upscaling results produced by RR, OLS, and AM. Finally, the impact of the number of sites on the upscaling methods is discussed.
3.1. Samples of True Values Based on MODIS-Derived ATI
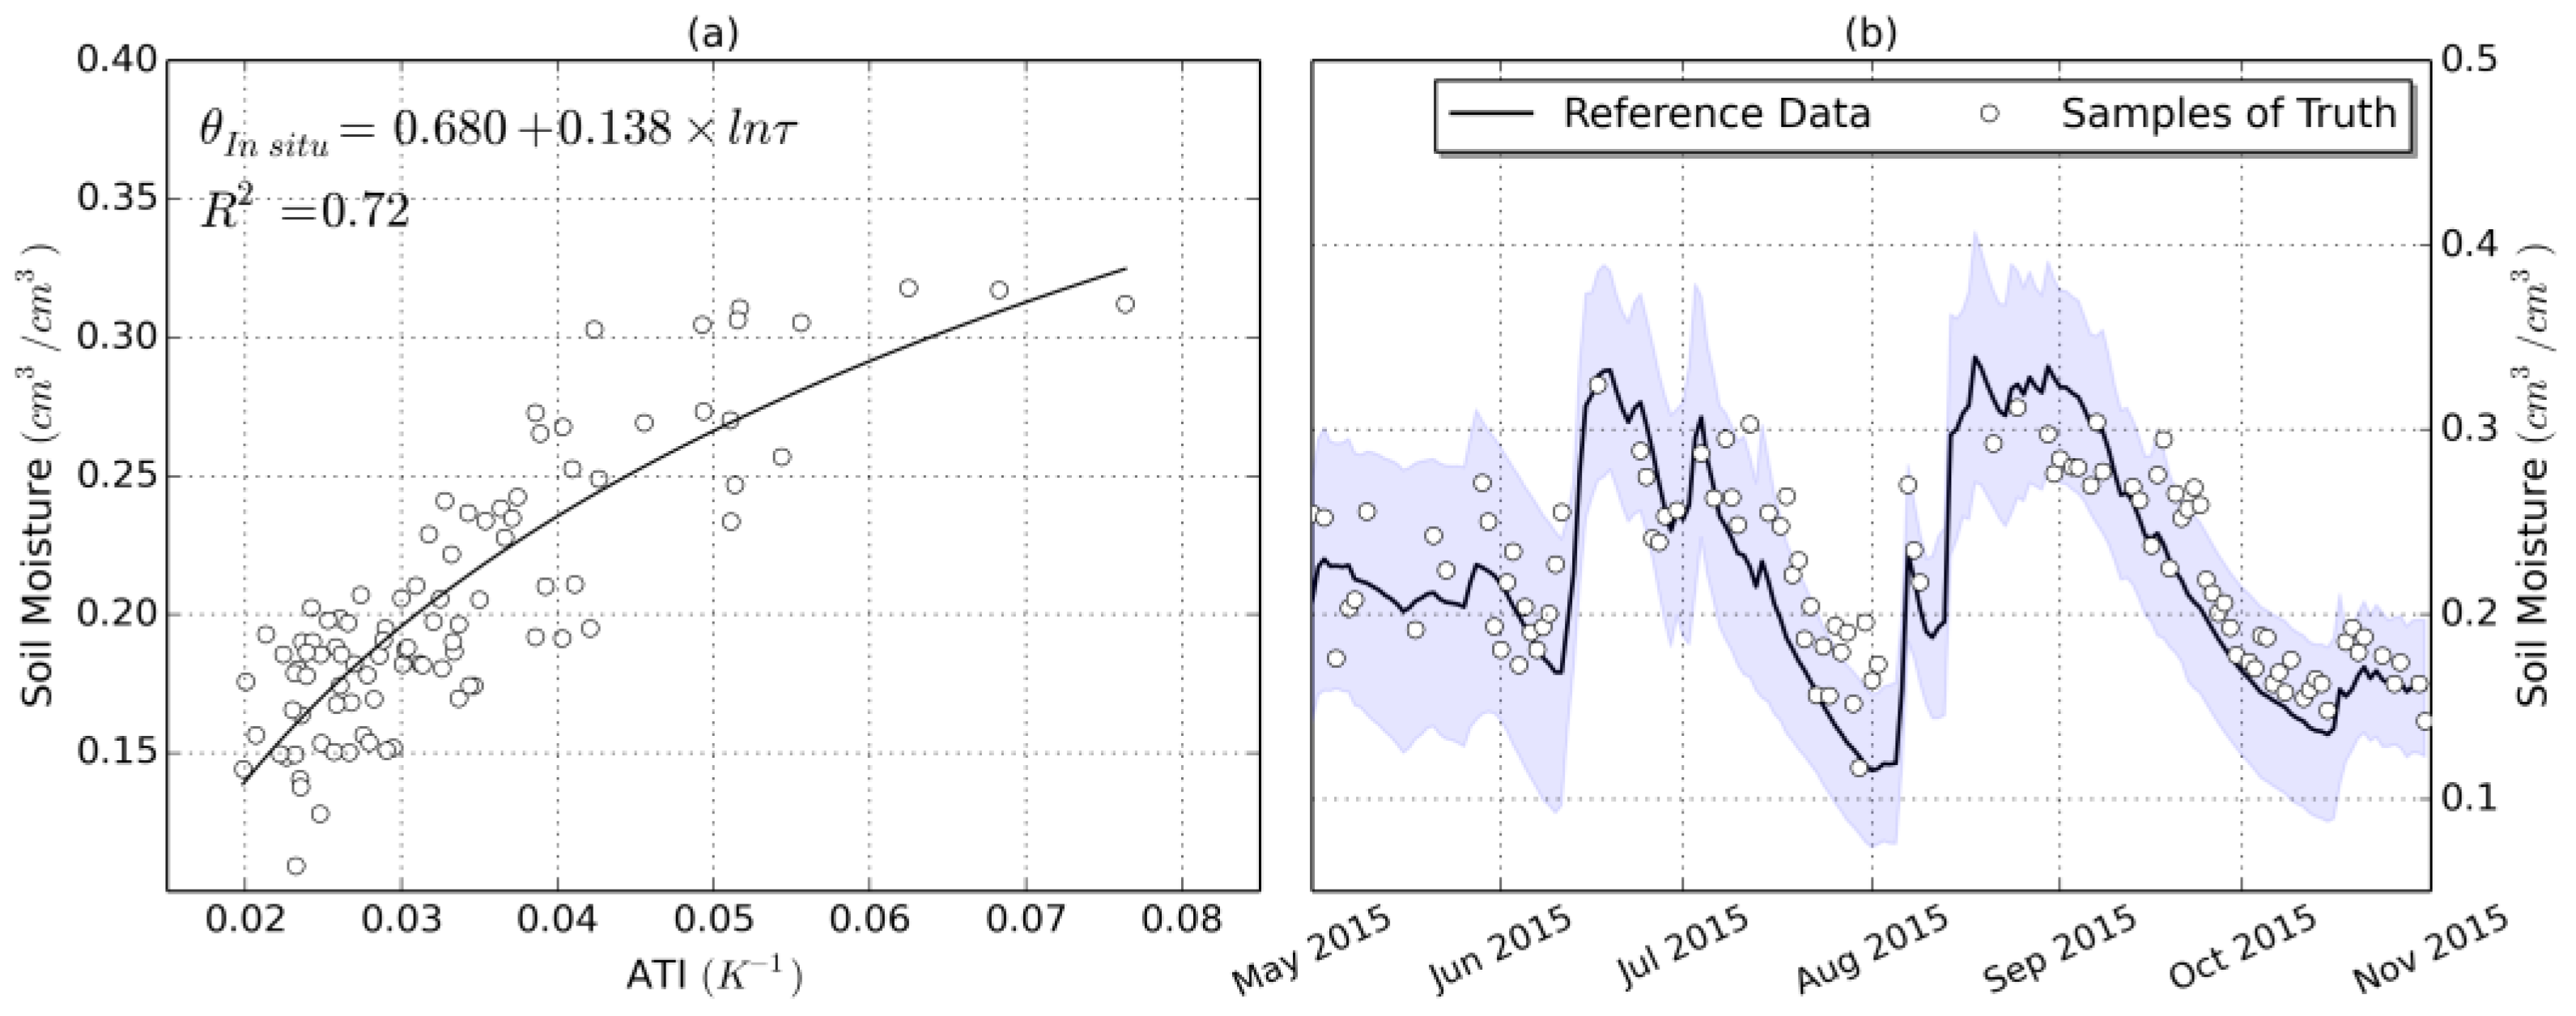
To obtain samples of true values at the validated pixel scale, a relationship between SM and the ATI is established using the nine ground-based sites labeled in
Figure 1. The monotonically increasing logarithm function is fitted well with a goodness of fit value of 0.72, as shown in
Figure 2a. The regression model is used to transform MODIS-derived ATI to SM at a 1 km resolution grid. The samples of the true values are calculated by averaging all SM values within the 0.3° × 0.3° grid. However, due to the presence of cloud cover, 106 samples are obtained from May 2015 to October 2015, and approximately half of the samples are completely covered by SM values with a resolution of 1 km. The root mean squared error (RMSE) and the correlation coefficient (
r) between the samples and the reference data are 0.030 cm
3/cm
3 and 0.867. The long-term trend and seasonal cycles of the true values at the upscaled pixel can roughly be captured by the samples, but the temporal amplitude of the samples displays obvious errors (see
Figure 2b). Thus, the samples cannot be overfitted; otherwise, a model with poor predictive performance will be generated.
3.2. Analysis of Multicollinearity
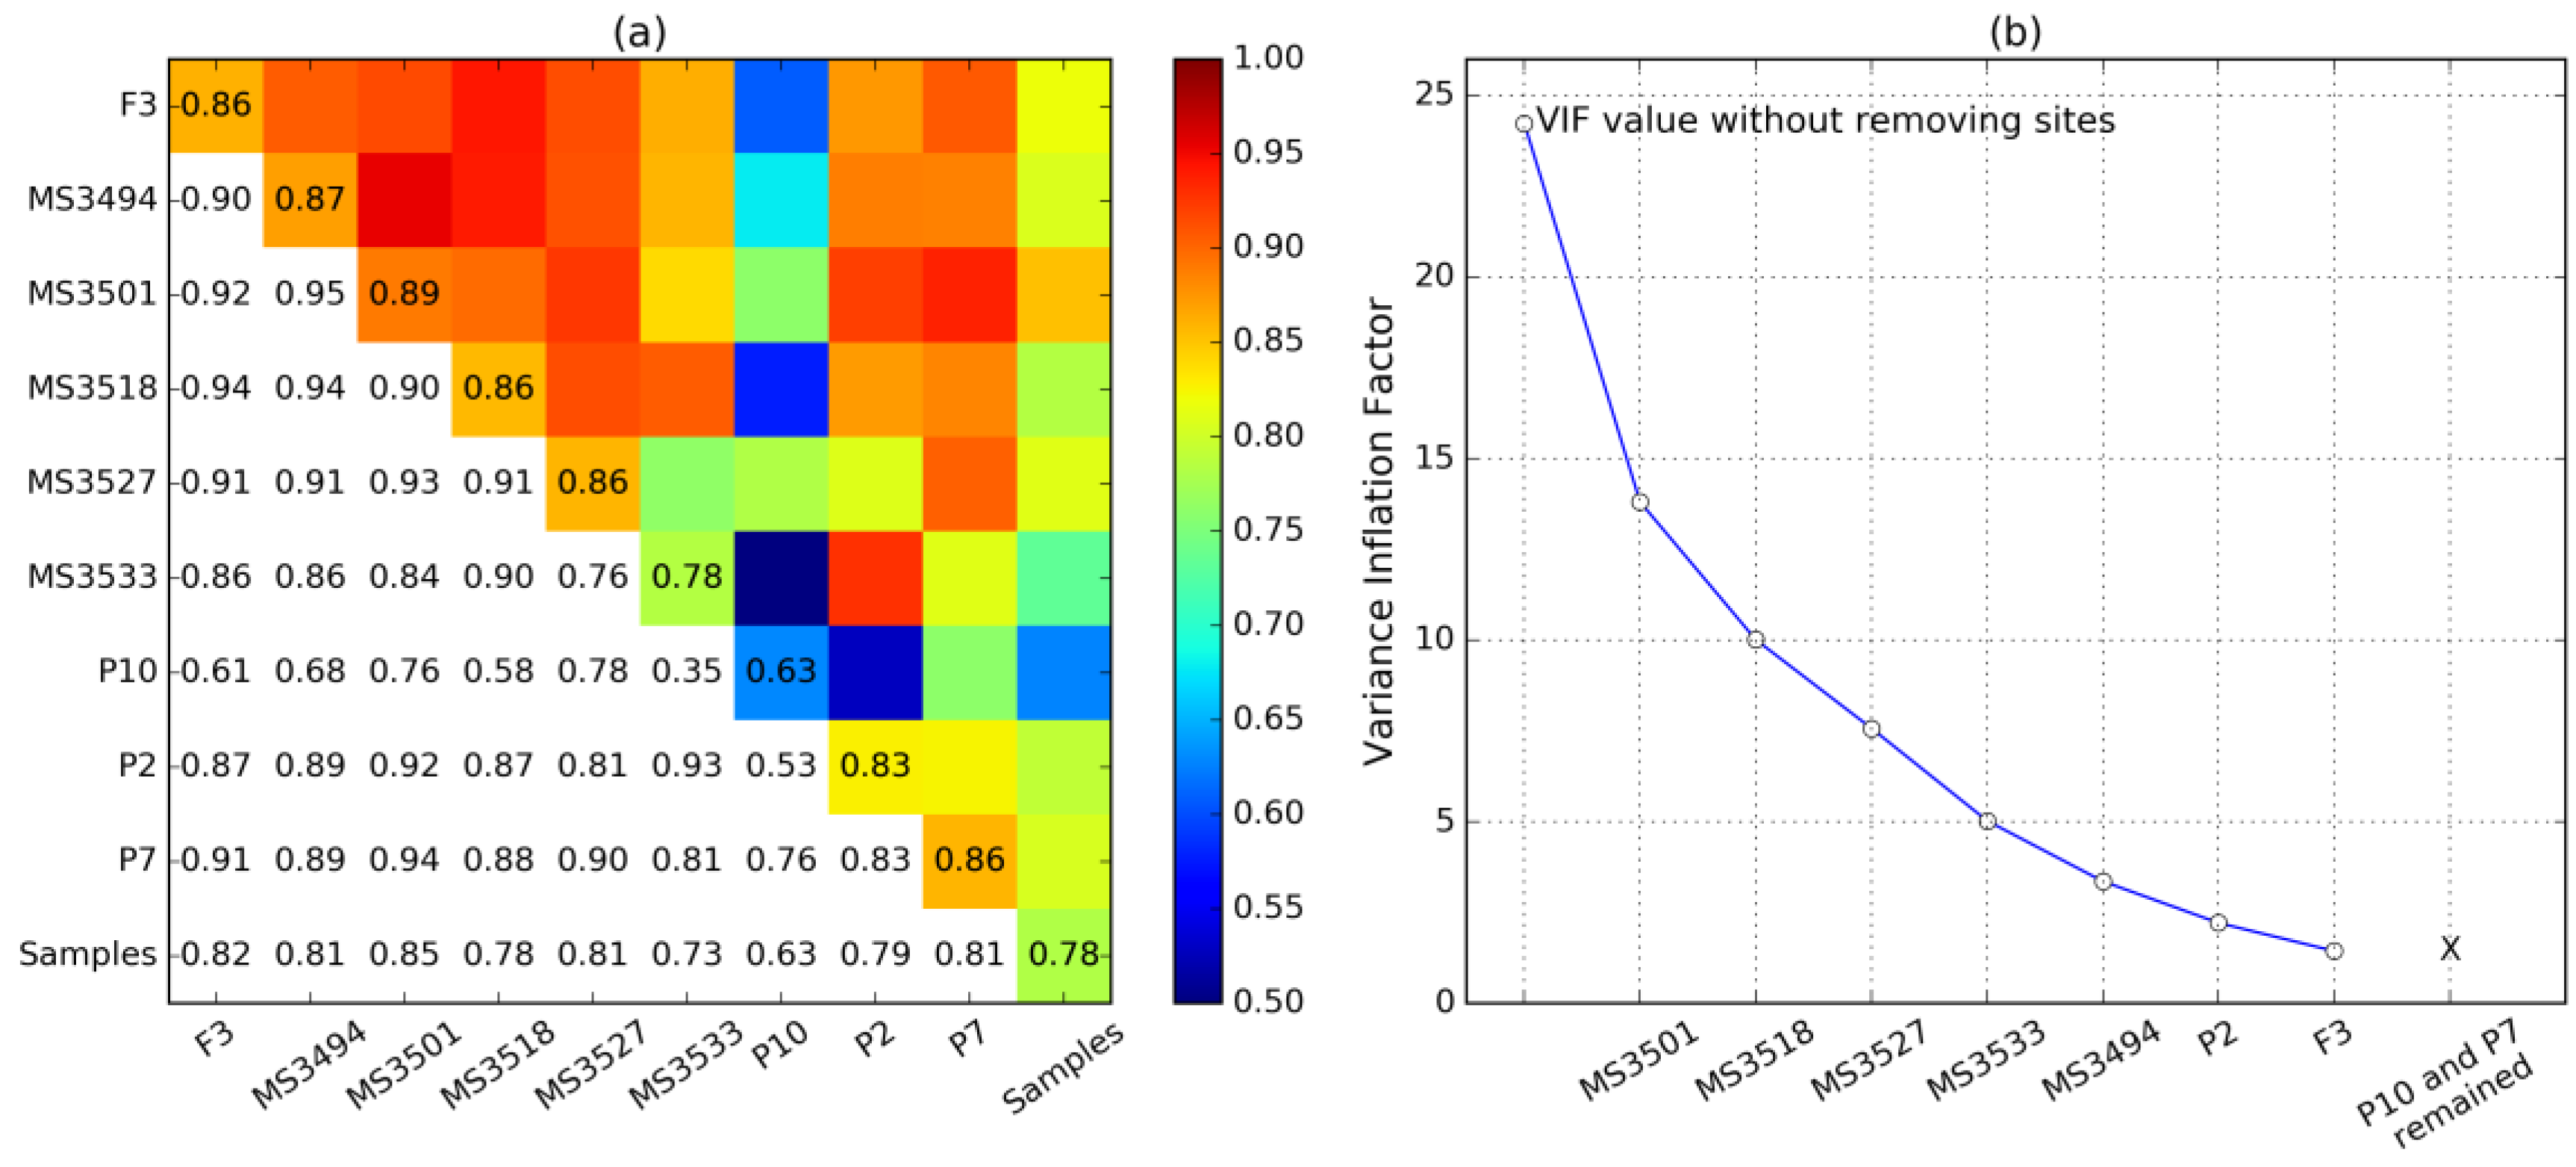
The correlations between the in situ measurements on a time series can cause multicollinearity. As shown in
Figure 3, except the sites MS3533 and P10 displaying moderate averaged correlations (
), the others have high averaged correlation coefficients (
), indicating the existence of multicollinearity. The variance inflation factor (VIF) is used to quantitatively evaluate the multicollinearity. If the OLS method is used, the multicollinearity usually needs to be solved when the VIF value is greater than 10; otherwise, the prediction model may fail. In this case, the averaged VIF is 24.2, reflecting strong multicollinearity. Without impacting the diversity of in situ measurements, the averaged VIF can be further decreased to 7.6 by eliminating the minimum number of sites including sites MS3501, MS3518, and MS3527. Although the RR method can improve the multicollinearity problem without dealing with sites, the complexity of the prediction model in Equation (2) can be reduced by removing these sites.
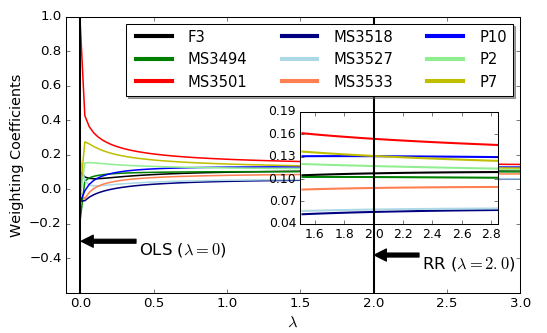
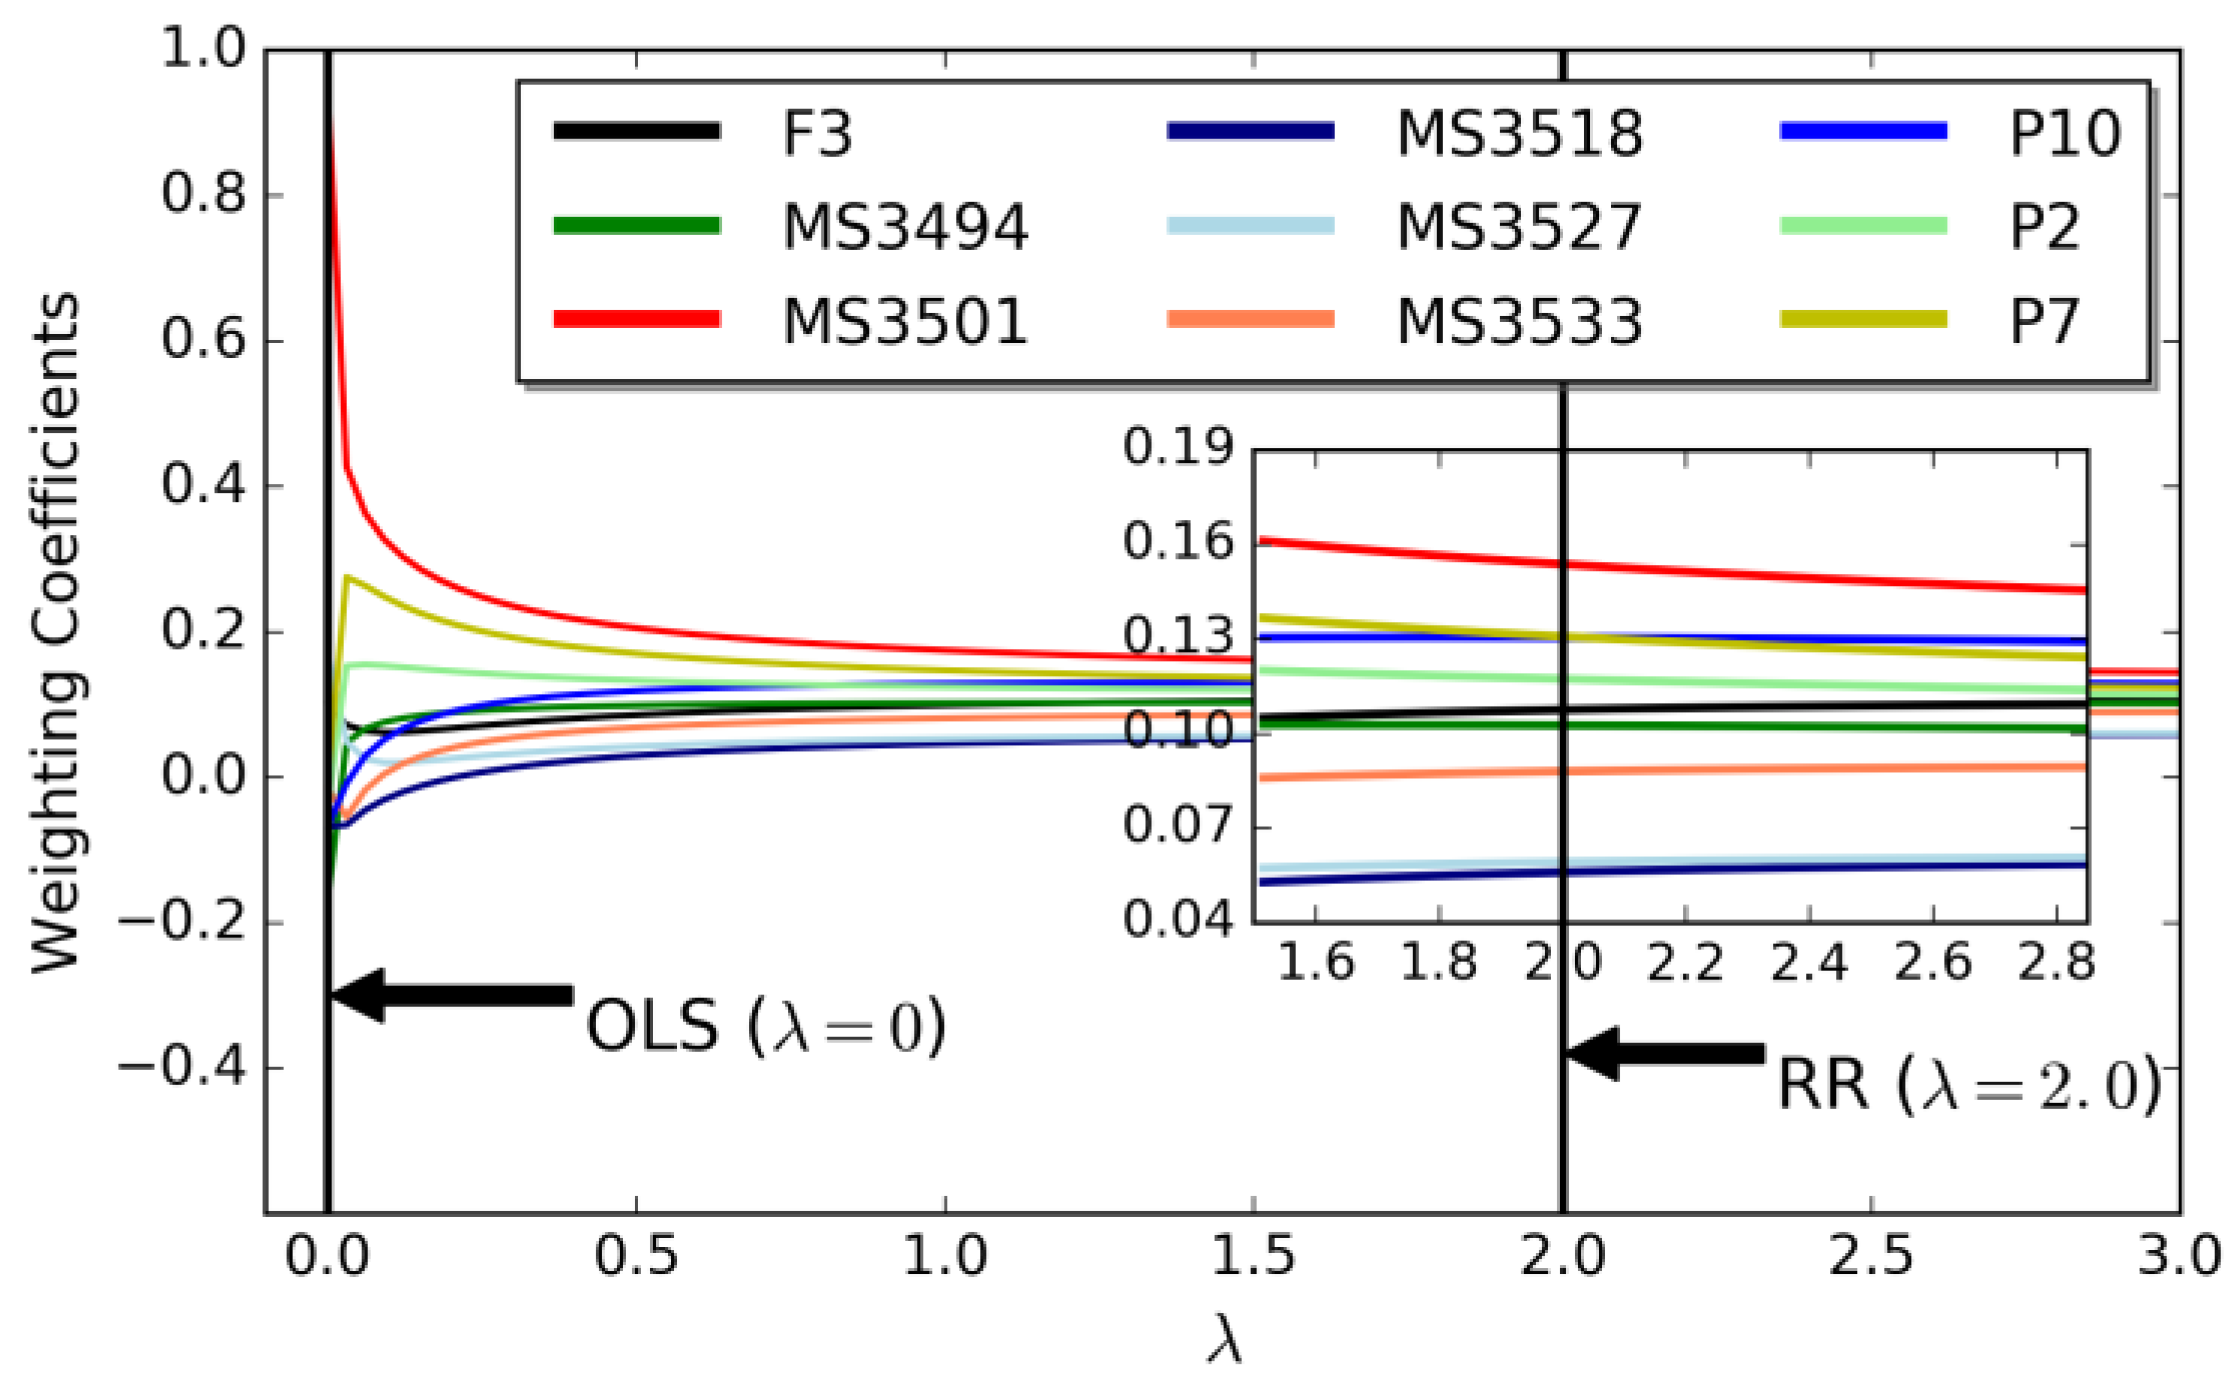
3.3. Analysis of the Ridge Trace
The RR algorithm provides a solution to the multicollinearity problem. To successfully implement the RR upscaling method, the parameter
in Equation (7) needs to be determined by analyzing the ridge traces. The curves of the WCs changing with
are presented in
Figure 4. The criterion determining
is that
in Equation (7) should be reasonable, which depends on the subjective judgment, e.g., avoiding negative WCs.
When is equal to 0 (same as OLS), shows a large standard deviation of 0.31, and the largest WC (0.96) is assigned to site MS3501, which causes some unrealistic negative coefficients to balance the over-contribution from site MS3501 to the upscaling results. With the growth of , the negative coefficients gradually trend positive, and all WCs become stable. In addition, the WC of the MS3501 site progressively decreases, meaning that the degree of over-contribution is reduced. Both sites MS3518 and MS3527, always having WCs close to 0, make small contributions to the upscaling results, indicating that they can be ignored in the upscaling process. When , all WCs become positive; when the curves no longer intersect with each other, the WCs have become stable. Thus, can be determined as 2.0 to perform the RR algorithm.
Through the analysis of the ridge trace, sites MS3501, MS3518, and MS3527 are confirmed to be the leading cause of multicollinearity, which is fully consistent with the analysis results of VIF. The analysis of ridge traces combined with VIF can be considered as a method to optimally select sites from the existing observation networks when the RR method is used in the validation of RS SM products.
3.4. Upscaling Algorithm
Under sparse ground-based sites, the RR, OLS, and AM methods are compared with each other in two cases with six sites and nine sites, respectively. The six optimally selected ground-based sites, excluding MS3501, MS3518, and MS3527, are also used to detect the ability of the RR method to improve the multicollinearity problem.
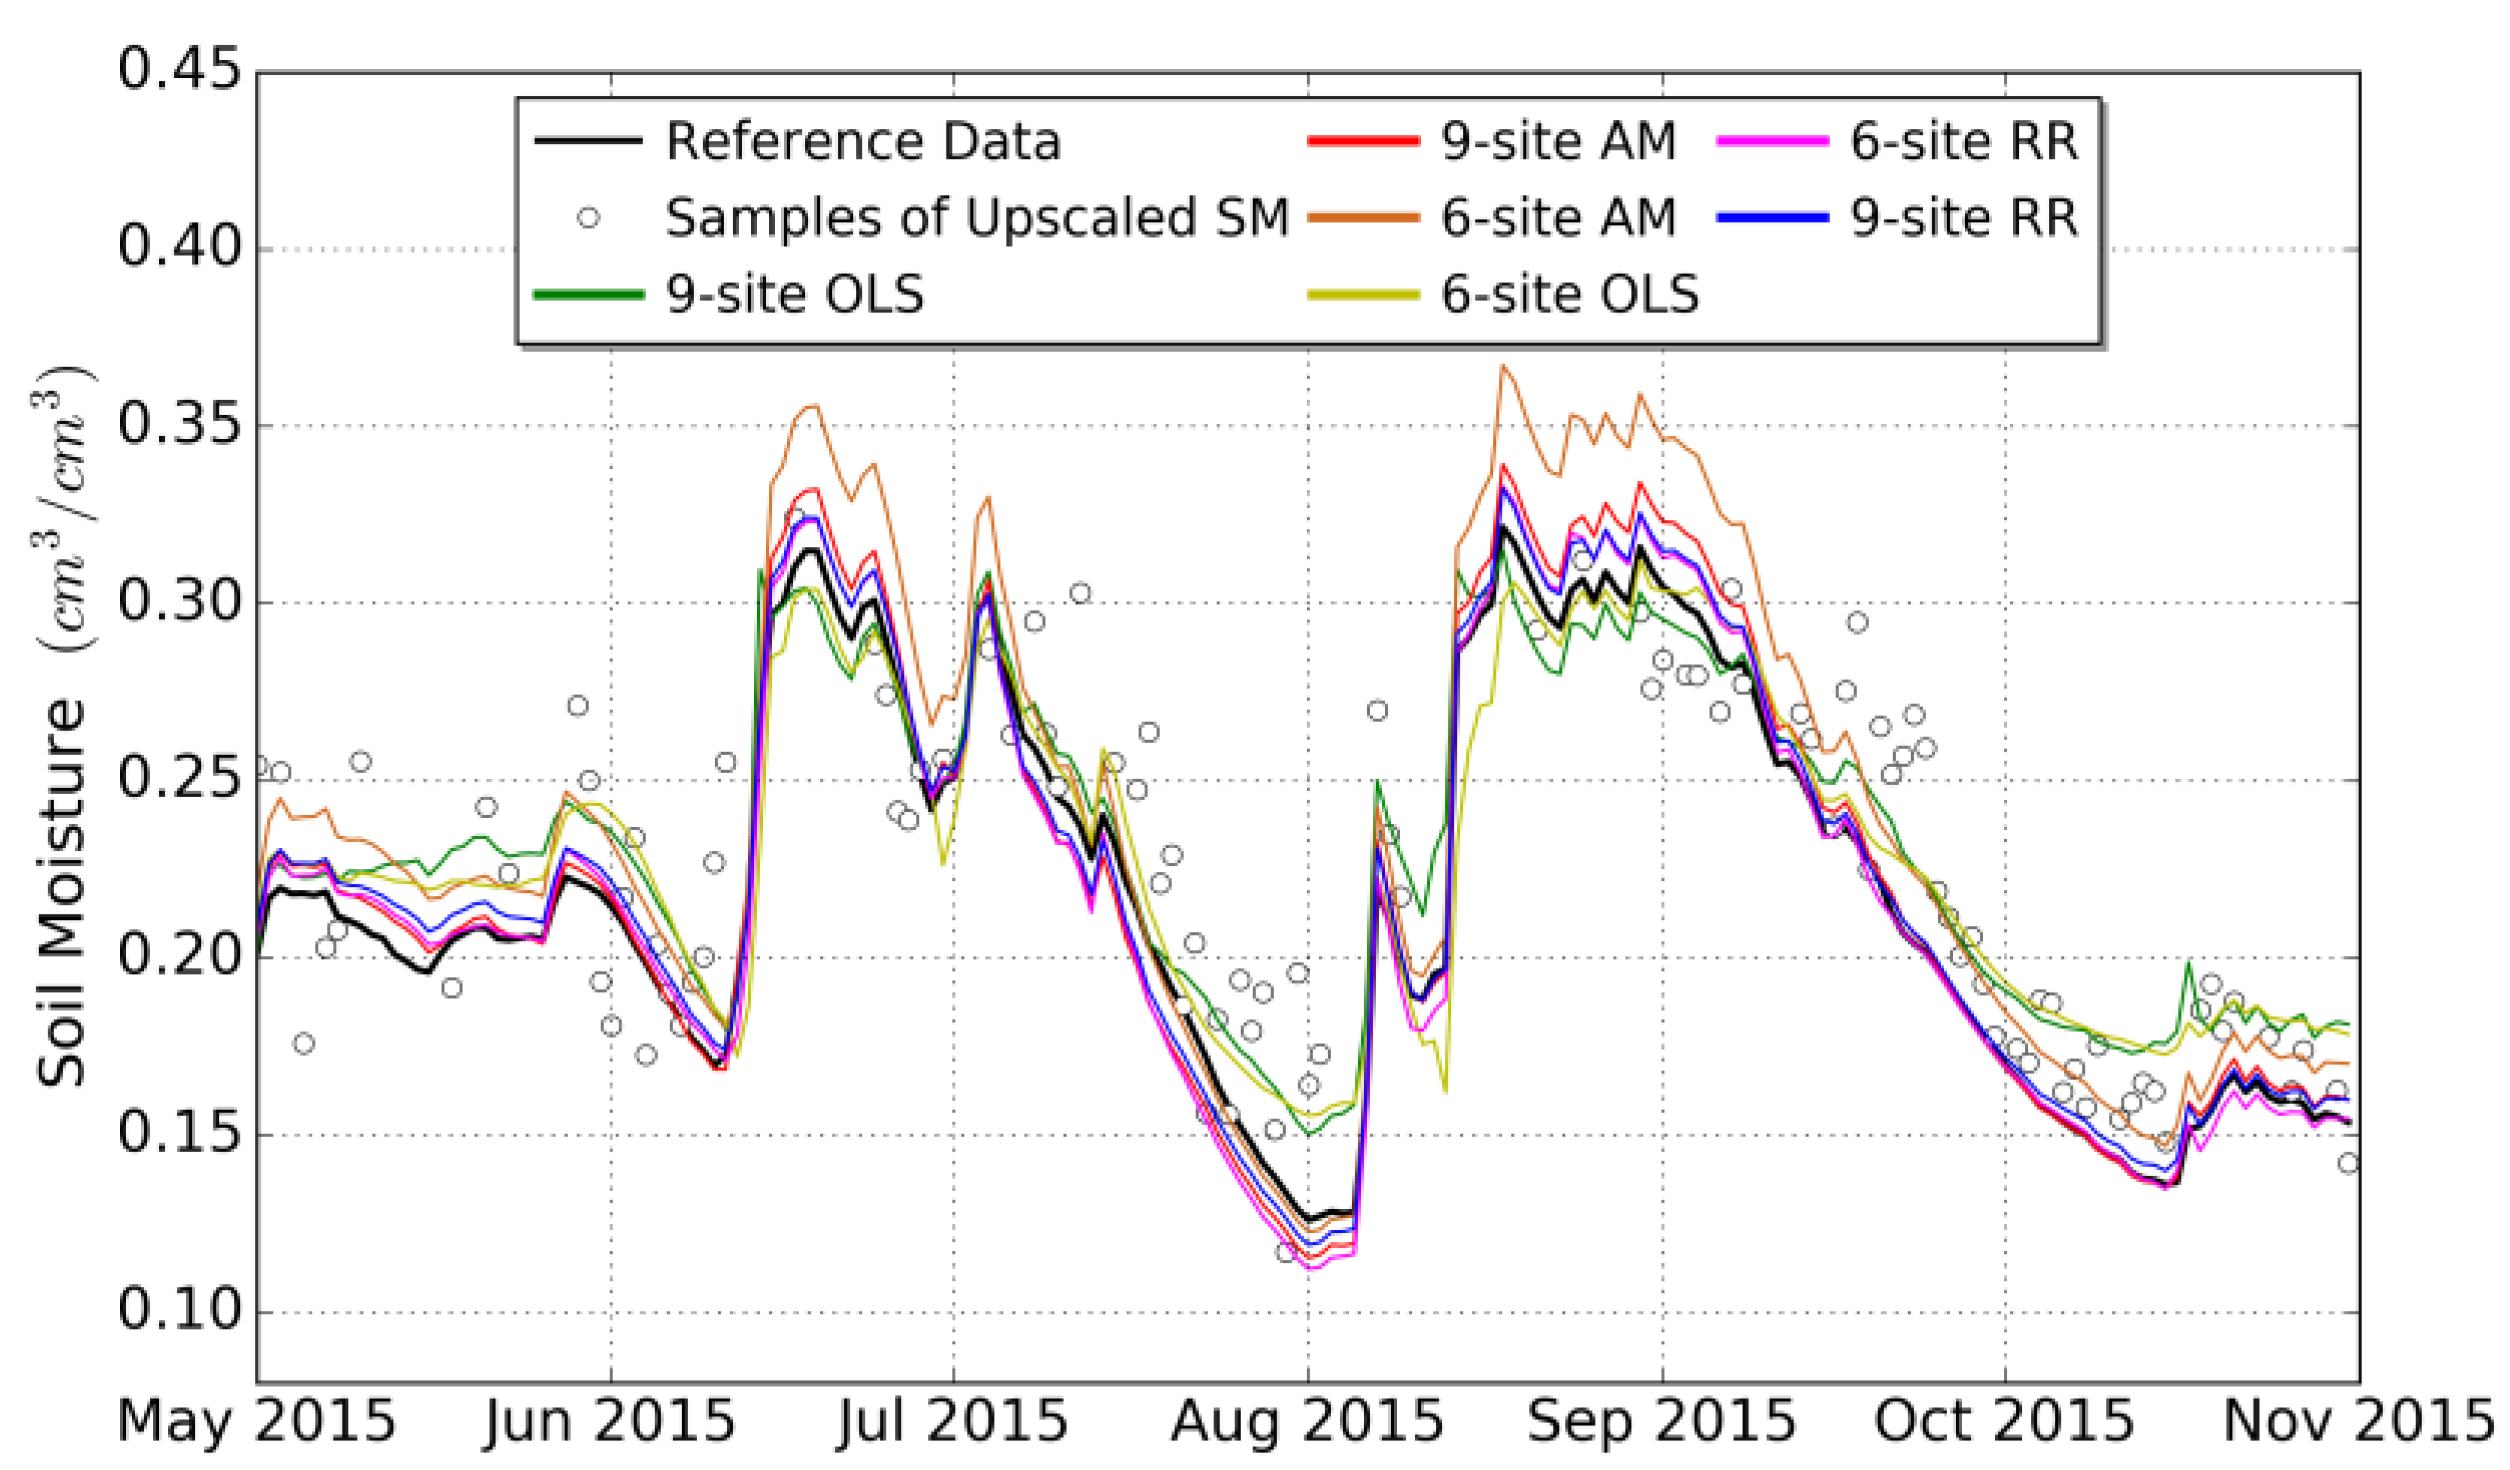
As shown in
Figure 5, the upscaling results of OLS are obviously close to the samples compared with those of the RR and AM methods. Due to the overfitting caused by the multicollinearity problem, the performance of OLS is determined by the accuracy of the samples. The RR method does not rely excessively on the samples by introducing a regularization parameter in Equation (7), and its upscaling results closely match the reference data. The AM method shows similar estimation accuracy to the RR method when nine sites are used. However, during the rainy season, the strong heterogeneity of SM caused by the non-uniformity of precipitation patterns is not accurately captured when six sites are used. When the soil is dry, the AM method does not clearly reduce the estimation accuracy as the number of sites decreases compared with the reference data.
Table 2 shows the accuracy of the upscaling results produced using the three methods before and after optimally selecting sites based on the analysis of ridge traces and VIF. The RR method has the highest estimation accuracies in the six-site and nine-site cases, and the performance of the OLS method is the worst of the three. For both the OLS and RR methods, the RMSEs of the six-site and nine-site cases are almost the same, indicating that the improvement in the multicollinearity by the optimal selection of sites maintains the estimation accuracy and reduces the complexity of the prediction models. For the AM method, the six-site case shows higher estimation errors than the nine-site case, indicating that the optimal selection of sites is ineffective to the AM method. The spatial distribution of sites capturing the spatial variability of SM is significant to the AM method [
31], but the analysis of ridge traces and VIF focuses on the diversity of ground observations. Although the case with six sites adverse to the AM method cannot explain the unsatisfactory performance of the AM method, the ability to represent the spatial variability of SM using six sites in the AM method is far less than that of remote sensing with highly spatial coverage in the RR method. The AM method is not suitable to upscale sparse in situ measurements with strong spatial heterogeneity.
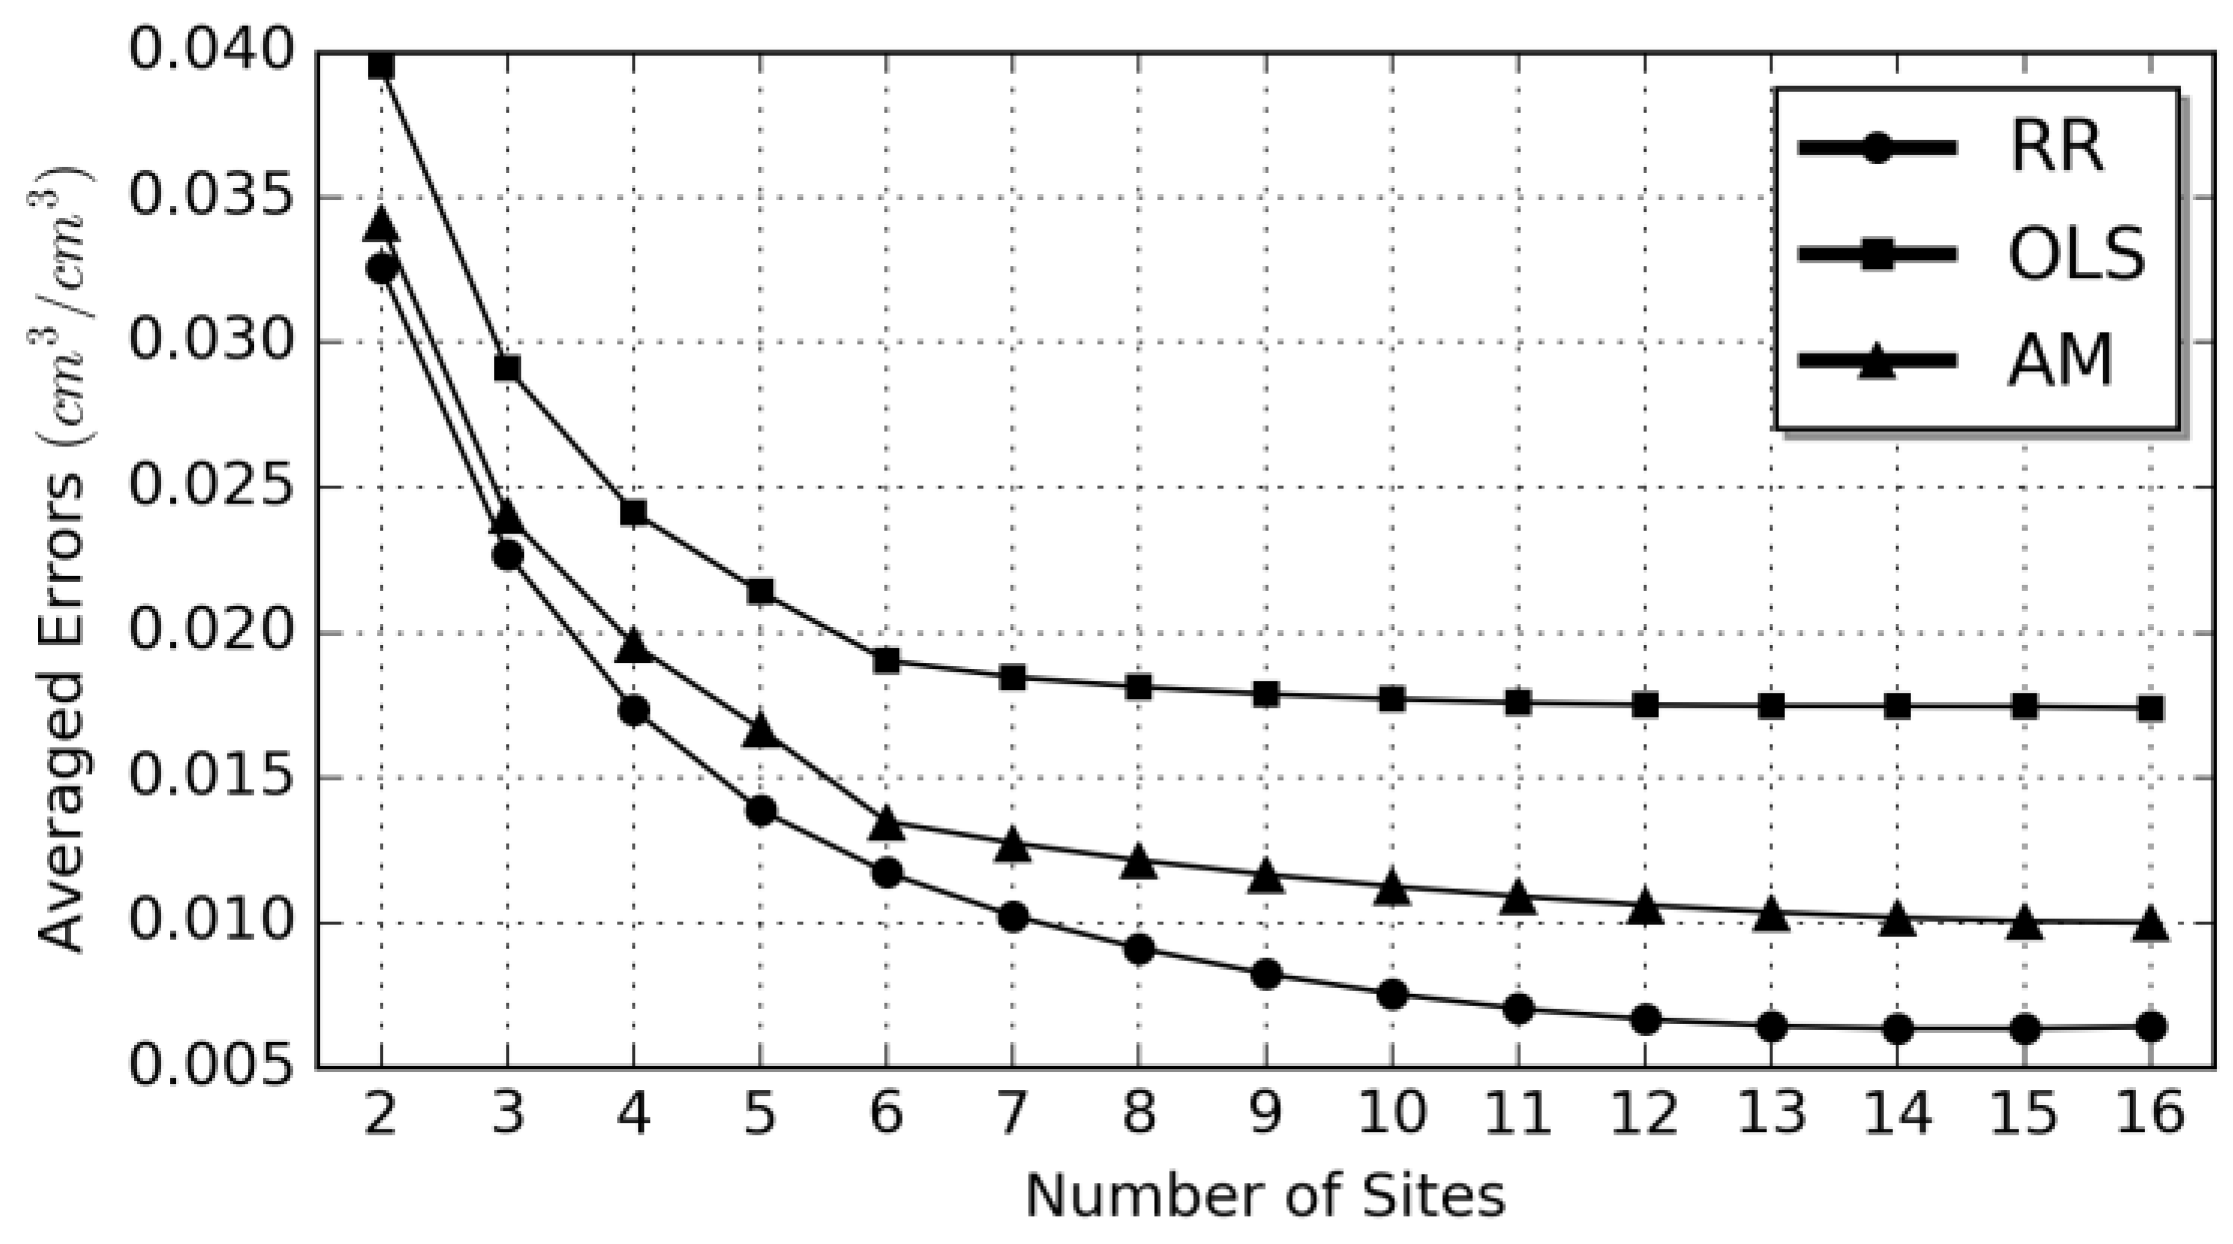
3.5. Impact of the Number of Sites on the Upscaling Accuracies
All of the upscaling cases employing combinations of two to 16 of the ground-based sites are performed using the three upscaling methods. The triple collocation method [
32] is used to evaluate each case, and the averaged errors of the upscaling results employing the same number of ground-based sites for each upscaling method are shown in
Figure 6.
The RR method always shows the optimal accuracy, followed by the AM method. The averaged accuracy of the seven-site cases obtained using the RR method is equivalent to that of the 16-site cases obtained using the AM method. The advantages of the RR method in upscaling the data from sparse sites is quite obvious compared with the AM method. The OLS method also has the potential to upscale the data from a limited number of sites because the averaged errors stabilize sooner than those of the RR and MA methods, but the accuracy of the samples remains an important problem, which is properly solved by the RR method. The estimation accuracy of the RR method becomes stable when the data from 10 sites are used, which can be considered as the optimal number of sites in this case. Although the RR method can accurately upscale sparse ground-based sites compared with OLS and AM, it is unrealistic to solve cases with too few sites e.g., one to four, to face the 0.04 cm3/cm3 accuracy requirement of SM RS products.
4. Conclusions
The time series of in situ SM measurements combined with the auxiliary data related to SM are used to estimate the WCs assigned to each in situ measurement by building temporal linear equations, which is a feasible solution to upscale the sparse observations for the validation of remote sensing products. However, the underlying correlations on time series between in situ measurements cause multicollinearity, which may lead to unreasonable (e.g., negative or too large) WCs, an overfitting problem, and redundant ground-based sites. By introducing a regularization parameter, the RR method excludes unreasonable WCs. Meanwhile, the RR method does not overly depend on the samples of ground truth at the upscaled pixel scale, as in the OLS method. The analysis of ridge traces as a necessary step before performing the RR method cannot only determine the regularization parameter but can also find the unnecessary sites.
The performance accuracy of the RR method is influenced by the diversity of temporal in situ measurements. Compared with the representativeness of ground-based sites, the diversity is more easily identified through the analysis of ridge traces and VIF. Especially for sparse ground-based sites, it is very difficult to evaluate the representativeness due to unobtainable ground truth. Under the selection of the RR method, the diversity can be used as a guide to the optimal selection of ground-based sites from the existing observation networks. Without obviously changing the diversity, the unnecessary sites can be removed based on the analysis of ridge traces and VIF, which minimally affects the upscaling accuracy of the RR method.
Given a different number of sites, the performance of the RR method is always superior to that of the OLS and AM methods. On the one hand, the RR method employs auxiliary data related to SM to compensate the lacking representation of the spatial heterogeneity of SM by sparse in situ measurements, but also introduces the uncertainty of auxiliary data. Unlike the OLS method, however, the RR method does not overly rely on the accuracy of auxiliary data. On the other hand, with the growth of the number of sites, the prediction accuracy of the RR method does not show sustained improvement as that of the AM method, which indicates that the RR method is not sensitive to the number of sites relative to the AM method. The RR method can employ a limited number of sites to complete what the AM method completes using a large number of sites. Thus, it is feasible to upscale sparse ground observations using the RR method.
The key to employing the RR method is to determine a value for the regularization parameter. Currently, the regularization parameter is artificially estimated. The objective estimation of the regularization parameter will be considered in future work.
Acknowledgments
This work was jointly supported by the Key Research Program of Frontier Sciences, CAS (QYZDY-SSW-DQC011), the National Natural Science Foundation of China (41531174 and 41701419), the Open Fund of State Key Laboratory of Remote Sensing Science (OFSLRSS201625), and the Foundation for Excellent Youth Scholars of NIEER, CAS.
Author Contributions
Jian Kang and Rui Jin designed the work, realized the idea, and analyzed the results. Jian Kang wrote this manuscript. Xin Li, Yang Zhang, and Zhongli Zhu provided suggestions.
Conflicts of Interest
The authors declare no conflict of interest.
References
- Saux-Picart, S.; Ottlé, C.; Decharme, B.; André, C.; Zribi, M.; Perrier, A.; Coudert, B.; Boulain, N.; Cappelaere, B.; Descroix, L.; et al. Water and energy budgets simulation over the amma-niger super-site spatially constrained with remote sensing data. J. Hydrol. 2009, 375, 287–295. [Google Scholar] [CrossRef]
- Entekhabi, D.; Njoku, E.G.; Neill, P.E.; Kellogg, K.H.; Crow, W.T.; Edelstein, W.N.; Entin, J.K.; Goodman, S.D.; Jackson, T.J.; Johnson, J. The soil moisture active passive (smap) mission. Proc. IEEE. 2010, 98, 704–716. [Google Scholar] [CrossRef]
- Barré, H.M.; Duesmann, B.; Kerr, Y.H. Smos: The mission and the system. IEEE Trans. Geosci. Remote Sens. 2008, 46, 587–593. [Google Scholar] [CrossRef]
- Gruber, A.; Dorigo, W.A.; Crow, W.; Wagner, W. Triple collocation-based merging of satellite soil moisture retrievals. IEEE Trans. Geosci. Remote Sens. 2017, 55, 6780–6792. [Google Scholar] [CrossRef]
- Liu, Y.Y.; Parinussa, R.; Dorigo, W.A.; De Jeu, R.A.; Wagner, W.; Van Dijk, A.; McCabe, M.F.; Evans, J. Developing an improved soil moisture dataset by blending passive and active microwave satellite-based retrievals. Hydrol. Earth Syst. Sci. 2011, 15, 425–436. [Google Scholar] [CrossRef]
- Tuttle, S.; Salvucci, G. Empirical evidence of contrasting soil moisture–precipitation feedbacks across the united states. Science 2016, 352, 825–828. [Google Scholar] [CrossRef] [PubMed]
- Lin, L.F.; Ebtehaj, A.M.; Flores, A.N.; Bastola, S.; Bras, R.L. Combined assimilation of satellite precipitation and soil moisture: A case study using trmm and smos data. Mon. Weather Rev. 2017, 145, 4997–5014. [Google Scholar] [CrossRef]
- Brocca, L.; Melone, F.; Moramarco, T.; Wagner, W.; Naeimi, V.; Bartalis, Z.; Hasenauer, S. Improving runoff prediction through the assimilation of the ascat soil moisture product. Hydrol. Earth Syst. Sci. 2010, 14, 1881–1893. [Google Scholar] [CrossRef]
- Ochsner, T.E.; Cosh, M.H.; Cuenca, R.H.; Dorigo, W.A.; Draper, C.S.; Hagimoto, Y.; Kerr, Y.H.; Njoku, E.G.; Small, E.E.; Zreda, M. State of the art in large-scale soil moisture monitoring. Soil Sci. Soc. Am. J. 2013, 77, 1888–1919. [Google Scholar] [CrossRef]
- Cosh, M.H.; Jackson, T.J.; Bindlish, R.; Prueger, J.H. Watershed scale temporal and spatial stability of soil moisture and its role in validating satellite estimates. Remote Sens. Environ. 2004, 92, 427–435. [Google Scholar] [CrossRef]
- Dorigo, W.; Wagner, W.; Hohensinn, R.; Hahn, S.; Paulik, C.; Xaver, A.; Gruber, A.; Drusch, M.; Mecklenburg, S.; Oevelen, P.v. The international soil moisture network: A data hosting facility for global in situ soil moisture measurements. Hydrol. Earth Syst. Sci. 2011, 15, 1675–1698. [Google Scholar] [CrossRef]
- Coopersmith, E.J.; Cosh, M.H.; Bell, J.E.; Kelly, V.; Hall, M.; Palecki, M.A.; Temimi, M. Deploying temporary networks for upscaling of sparse network stations. Int. J. Appl. Earth Obs. Geoinf. 2016, 52, 433–444. [Google Scholar] [CrossRef]
- Crow, W.T.; Berg, A.A.; Cosh, M.H.; Loew, A.; Mohanty, B.P.; Panciera, R.; Rosnay, P.; Ryu, D.; Walker, J.P. Upscaling sparse ground-based soil moisture observations for the validation of coarse-resolution satellite soil moisture products. Rev. Geophys. 2012, 50, RG2002. [Google Scholar] [CrossRef]
- Ma, C.; Li, X.; Wei, L.; Wang, W. Multi-scale validation of smap soil moisture products over cold and arid regions in northwestern china using distributed ground observation data. Remote Sens. 2017, 9, 327. [Google Scholar] [CrossRef]
- Zeng, J.; Li, Z.; Chen, Q.; Bi, H.; Qiu, J.; Zou, P. Evaluation of remotely sensed and reanalysis soil moisture products over the tibetan plateau using in-situ observations. Remote Sens. Environ. 2015, 163, 91–110. [Google Scholar] [CrossRef]
- Cosh, M.H.; Jackson, T.J.; Moran, S.; Bindlish, R. Temporal persistence and stability of surface soil moisture in a semi-arid watershed. Remote Sens. Environ. 2008, 112, 304–313. [Google Scholar] [CrossRef]
- Colliander, A.; Jackson, T.; Bindlish, R.; Chan, S.; Das, N.; Kim, S.; Cosh, M.; Dunbar, R.; Dang, L.; Pashaian, L. Validation of smap surface soil moisture products with core validation sites. Remote Sens. Environ. 2017, 191, 215–231. [Google Scholar] [CrossRef]
- Kerr, Y.H.; Al-Yaari, A.; Rodriguez-Fernandez, N.; Parrens, M.; Molero, B.; Leroux, D.; Bircher, S.; Mahmoodi, A.; Mialon, A.; Richaume, P. Overview of smos performance in terms of global soil moisture monitoring after six years in operation. Remote Sens. Environ. 2016, 180, 40–63. [Google Scholar] [CrossRef]
- Qin, J.; Yang, K.; Lu, N.; Chen, Y.; Zhao, L.; Han, M. Spatial upscaling of in-situ soil moisture measurements based on modis-derived apparent thermal inertia. Remote Sens. Environ. 2013, 138, 1–9. [Google Scholar] [CrossRef]
- Kang, J.; Jin, R.; Li, X.; Ma, C.; Qin, J.; Zhang, Y. High spatio-temporal resolution mapping of soil moisture by integrating wireless sensor network observations and modis apparent thermal inertia in the babao river basin, china. Remote Sens. Environ. 2017, 191, 232–245. [Google Scholar] [CrossRef]
- Qin, J.; Zhao, L.; Chen, Y.; Yang, K.; Yang, Y.; Chen, Z.; Lu, H. Inter-comparison of spatial upscaling methods for evaluation of satellite-based soil moisture. J. Hydrol. 2015, 523, 170–178. [Google Scholar] [CrossRef]
- Yang, K.; Qin, J.; Zhao, L.; Chen, Y.; Tang, W.; Han, M.; Chen, Z.; Lv, N.; Ding, B.; Wu, H. A multiscale soil moisture and freeze–thaw monitoring network on the third pole. Bull. Am. Meteorol. Soc. 2013, 94, 1907–1916. [Google Scholar] [CrossRef]
- Ran, Y.; Li, X.; Jin, R.; Kang, J.; Cosh, M.H. Strengths and weaknesses of temporal stability analysis for monitoring and estimating grid-mean soil moisture in a high-intensity irrigated agricultural landscape. Water Resour. Res. 2017, 53, 283–301. [Google Scholar] [CrossRef]
- Crow, W.T.; Ryu, D.; Famiglietti, J.S. Upscaling of field-scale soil moisture measurements using distributed land surface modeling. Adv. Water Res. 2005, 28, 1–14. [Google Scholar] [CrossRef]
- Coopersmith, E.J.; Cosh, M.H.; Petersen, W.A.; Prueger, J.; Niemeier, J.J. Soil moisture model calibration and validation: An ars watershed on the south fork iowa river. J. Hydrometeorol. 2015, 16, 1087–1101. [Google Scholar] [CrossRef]
- Pan, F. Estimating daily surface soil moisture using a daily diagnostic soil moisture equation. J. Irrig. Drain. Eng. 2011, 138, 625–631. [Google Scholar] [CrossRef]
- Pan, F.; Peters-Lidard, C.D.; Sale, M.J. An analytical method for predicting surface soil moisture from rainfall observations. Water Resour. Res. 2003, 39, 1314–1328. [Google Scholar] [CrossRef]
- Kang, J.; Jin, R.; Li, X. Regression kriging-based upscaling of soil moisture measurements from a wireless sensor network and multiresource remote sensing information over heterogeneous cropland. IEEE Geosci. Remote Sens. Lett. 2015, 12, 92–96. [Google Scholar] [CrossRef]
- Van doninck, J.; Peters, J.; De Baets, B.; De Clercq, E.M.; Ducheyne, E.; Verhoest, N.E.C. The potential of multitemporal aqua and terra modis apparent thermal inertia as a soil moisture indicator. Int. J. Appl. Earth Obs. Geoinf. 2011, 13, 934–941. [Google Scholar] [CrossRef]
- Hoerl, A.E.; Kennard, R.W. Ridge regression: Biased estimation for nonorthogonal problems. Technometrics 1970, 12, 55–67. [Google Scholar] [CrossRef]
- Liu, F.; Li, X. New spatial upscaling methods for multi-point measurements: From normal to p-normal. Comput. Geosci. 2017, 109, 247–257. [Google Scholar] [CrossRef]
- Scipal, K.; Dorigo, W.; de Jeu, R. Triple collocation—A new tool to determine the error structure of global soil moisture products. In Proceedings of the 2010 IEEE International Geoscience and Remote Sensing Symposium, Honolulu, HI, USA, 25–30 July 2010; pp. 4426–4429. [Google Scholar]
© 2018 by the authors. Licensee MDPI, Basel, Switzerland. This article is an open access article distributed under the terms and conditions of the Creative Commons Attribution (CC BY) license (http://creativecommons.org/licenses/by/4.0/).


