Article

Assessment and Correction of the PERSIANN-CDR Product in the Yarlung Zangbo River Basin, China

1
College of Water Sciences, Beijing Normal University, Beijing 100875, China
2
Beijing Key Laboratory of Urban Hydrological Cycle and Sponge City Technology, Beijing 100875, China
*
Author to whom correspondence should be addressed.
Remote Sens. 2018, 10(12), 2031; https://doi.org/10.3390/rs10122031
Submission received: 24 September 2018 / Revised: 9 December 2018 / Accepted: 11 December 2018 / Published: 13 December 2018
(This article belongs to the Special Issue Environmental and Geodetic Monitoring of the Tibetan Plateau)

Abstract

:
Satellite products can provide spatiotemporal data on precipitation in ungauged basins. It is essential and meaningful to assess and correct these products. In this study, the Precipitation Estimation from Remotely Sensed Information using Artificial Neural Networks-Climate Data Record (PERSIANN-CDR) product was evaluated and corrected using the successive correction method. A simple hydrological model was driven by the corrected PERSIANN-CDR data. The results showed that the accuracy of the original PERSIANN-CDR data was low on a daily scale, and the accuracy decreased gradually from the east to the west of the basin. With one correction step, the accuracy of the corrected PERSIANN-CDR data was significantly higher than that of the initial data. The correlation coefficient increased from 0.58 to 0.73, and the probability of detection (POD) value of the corrected product was 18.2% higher than the original product. The temporal-spatial resolution influenced the performance of the satellite product. As the resolution became coarser, the correlation coefficient between the corrected PERSIANN-CDR data and the gauged data gradually became lower. The Identification of unit Hydrographs and Component flows from Rainfall, Evapotranspiration, and Streamflow (IHACRES) model could be satisfactorily applied in the Lhasa River basin with corrected PERSIANN-CDR data. The successive correction method was an effective way to correct the bias of the PERSIANN-CDR product.

Graphical Abstract

1. Introduction

Precipitation plays a significant role in hydrological and material cycles and is an important input variable in hydrologic models [1,2]. On the Qinghai–Tibet Plateau, the meteorological stations are located in areas of lower altitude and are scarce, with a highly heterogeneous spatial distribution. Consequently, there are limited available and accessible high-quality precipitation data for the Qinghai–Tibet Plateau. Weather radar, satellite, and reanalysis products provide important supplementary data. Satellite-based data are especially useful. Satellite-based precipitation estimates (SPEs) can provide in situ data without geographical constraints and compensate for insufficient precipitation data from surface meteorological stations. In recent years, SPE products have been widely used in rainstorm analysis, drought evolution, and hydrological simulations [3,4,5,6]. However, the process of remote sensing image acquisition and data processing has led to many shortcomings in SPE products. These shortcomings include gaps in the revisit times, precipitation data captured by satellites disagreeing with the real precipitation data, and the complex underlying surface interfering with the remote sensing signals [7]. Therefore, the reliability of SPE products in certain areas can be poor. To improve the reliability of SPE products in water resource management and allocation, it is necessary to evaluate and correct the accuracy of SPE products to reduce system errors [8,9,10,11,12].
Meteorological satellites are equipped with various sensors, and SPE products retrieved from these sensors can be divided into visible (VIS), infrared (IR), microwave (MW), and integrated systems [13,14]. VIS-based algorithms use albedo to represent the radiation characteristics of real objects that are only measurable during the day. IR-based and MW-based algorithms use brightness and temperature to represent the radiation characteristics of real objects (blackbody equivalent temperature). IR-based algorithms derive precipitation information from cloud-top temperatures but are unable to detect precipitation information for low-level clouds. MW-based algorithms can penetrate clouds and water vapor and can provide precipitation information with a higher accuracy. Polar orbit satellites are commonly equipped with microwave sensors. Active MW has a higher time resolution and is more accurate than passive MW. Multiple sensors are more widely used for SPE products than single sensors area. Various categories of SPE products are available. These include the Tropical Rainfall Measuring Mission (TRMM), Multi-Satellite Precipitation Analysis (TMPA), Climate Hazards Group Infrared Precipitation with Station data (CHIRPS), the Global Precipitation Measurement Mission (GPM), Precipitation Estimation from Remotely Sensed Information using Artificial Neural Networks (PERSIANN), and PERSIANN-Climate Data Record (CDR) [15,16,17,18,19]. These products have been widely applied in various regions throughout the world. Jiang et al. [20] evaluated TMPA 3B42 V6, TMPA 3B42RT, and CPC MORPHing technique (CMORPH) for South China using a Bayesian model averaging method. Their research indicated that TMPA 3B42RT was best for simulating streamflow, and it effectively reduced streamflow simulation errors in the Mishui basin. They concluded that all three satellite precipitation products had great potential for application in hydrological process simulation, especially for ungauged basins. Hirpa et al. [21] validated TRMM 3B42RT, CMORPH, and PERSIANN across a large river basin in Ethiopia. The authors concluded that 3B42RT and CMORPH produced similar spatial distributions, deviations, and elevation-dependent trends for precipitation statistics. The authors also concluded that the PERSIANN data produced spatial distributions of precipitation that were different to those of 3B42RT and CMORPH and that PERSIANN underestimated precipitation at high altitudes. Ma et al. [14] conducted an evaluation of the Ensemble Multi-Satellite Precipitation Dataset (EMSPD-DBMA) for the Qinghai–Tibet Plateau. EMSPD-DBMA data integrate TRMM 3B42RT, TRMM 3B42 V7, CMORPH, and PERSIANN-CDR datasets. They found that EMSPD-DBMA data could better reflect the spatial distribution characteristics of precipitation in the Qinghai–Tibet Plateau than the other data products could. Their accuracy of moderate rain and heavy rain using EMSPD-DBMA data was better than that using the Integrated Multi-satellite Retrievals for GPM (IMERG) and Global Satellite Mapping of Precipitation-AMVK (GSMAP-AMVK) data sets. The GPM is a new-generation satellite remote sensing precipitation observation plan based on the TRMM. The GPM data have a larger coverage range and higher temporal and spatial resolution and enhance the detection capacity for light and solid precipitation. However, the time range of its data is relatively short. Therefore, GMP data were not selected in this study. PERSIANN-CDR datasets are widely used because they integrate the Global Precipitation Climatology Project (GPCP) gauged data and are obtained using IR-based and MW-based algorithms. Therefore, the PERSIANN-CDR product was chosen for the present study.
SPE products inevitably have certain errors, especially in the case of the Qinghai–Tibet Plateau. The high altitude and complex topography generate problems for the remote sensing image acquisition process and precipitation data inversion. To improve water resource management in the Qinghai–Tibet Plateau, it is necessary to evaluate and correct the accuracy of SPE products and thus improve the quality of SPE products driving hydrological models. The correction methods can include successive correction (SC), optimum interpolation, probability density functions, and linear models [22,23]. Habib et al. [24] and Bhatti [25] estimated the accuracy of CMORPH in the Gilgel Abbay basin and concluded that there was a large bias between CMORPH and gauged data and that the bias was related to rain generation mechanisms and sampling and retrieval errors. They chose three methods: Fixed space-time, variable time, and variable space-time bias factors, to correct CMORPH. They found that the temporal variation was the most important factor in the correction process for comprehensively reducing the precipitation deviation. Worqlul et al. [26] compared Estimated–Geostationary (MPEG) data with gauged data in the Gilgel Abbay basin. They concluded that MPEG underestimated the gauged data by 60%. In addition, they used a linear bias correction method to reduce the bias between the MPEG and gauged data. Their results indicated that the linear bias correction method significantly reduced the bias and maintained the coefficient of correlation value (Ccoef). The linear bias correction method assumes that the ratios of the satellite data to the gauged data for both monthly and daily scales are the same. However, this assumption cannot be used for the high-altitude Qinghai–Tibet Plateau, which has a limited number of gauging stations and a complex topography. In this study, the SC method was used to correct the satellite deviations. In the SC method, the deviation between the gauged data and the SPE data is gradually reduced via linear iteration. The SC method is often used to correct radar precipitation data, because it requires less computation and does not need to rely on any assumptions [10,22].
Recently, hydrological evaluation (HE) of SPE products has received a significant amount of attention, especially for sparsely gauged or ungauged areas. The accuracy of SPE products is evaluated by comparing measured runoff data with simulation data from hydrological models driven by SPE products [27]. Using the HE method to evaluate the accuracy of satellite precipitation data reduces the uncertainties caused by the scarcity of gauges in large-scale basins, as well as adds the runoff data to the accuracy assessment of SPE products. Runoff data are used to cross-validate the accuracy of SPEs [11,28]. Poméon et al. [27] found that it was difficult to obtain high-quality and complete time-series meteorological data in West Africa, and therefore gauged data could not be used to verify the accuracy of the satellite data. The authors used CHIRPS, CMORPHv1.0 CRT, CMORPHv1.0 RAW, PERSIANN-CDR, TMPA 3B42v7, and TMPA 3B42 RTv7 data to drive a Hydrologiska Byråns Vattenbalansavdelning (HBV) model and compared the measured and simulated data for six basins in West Africa. The authors’ research indicated that the HE method was suitable for evaluating SPE products in sparsely gauged or ungauged regions. Because data in the Qinghai–Tibet Plateau are scarce and difficult to obtain, a simplified hydrological model requiring less input data was chosen. As a result, the problem of excessive parameter requirements for the model was avoided. The Identification of unit Hydrographs and Component flows from Rainfall, Evapotranspiration, and Streamflow (IHACRES) hydrological model was used to estimate the accuracy of the original and corrected SPE data in the Yarlung Zangbo River basin. IHACRES is a lumped conceptual model with a simple structure, few parameters, and a high robustness [29]. The IHACRES model has been successfully applied in various basins [30,31,32].
The objective of this study was to test whether a corrected SPE product could improve the accuracy of an available SPE product for the Yarlung Zangbo River basin. PERSIANN-CDR was selected as the SPE product, and basic statistical indices and probabilistic statistical indices were used as statistical indicators. The PERSIANN-CDR data were compared with meteorological station data at the daily scale. The SC method was chosen to correct the accuracy of the PERSIANN-CDR satellite data. The meteorological station data, the original SPE data, and the corrected SPE data were used as input data for the IHACRES model. The simulated discharge and measured discharge data were compared in a sub-basin (Lhasa River basin) of the Yarlung Zangbo River basin. This paper is organized as follows. The SC method for reducing the bias between the SPE and gauged data is introduced. The structure of the hydrological model and the simulation evaluation method is then outlined (Section 2). Evaluation results for the SPE and corrected SPE products using the IHACRES hydrological model for the Lhasa River basin are presented (Section 3). The uncertainties in the SPE data accuracy assessment and hydrological simulation are discussed (Section 4). Finally, conclusions are drawn in Section 5.

2. Materials and Methods

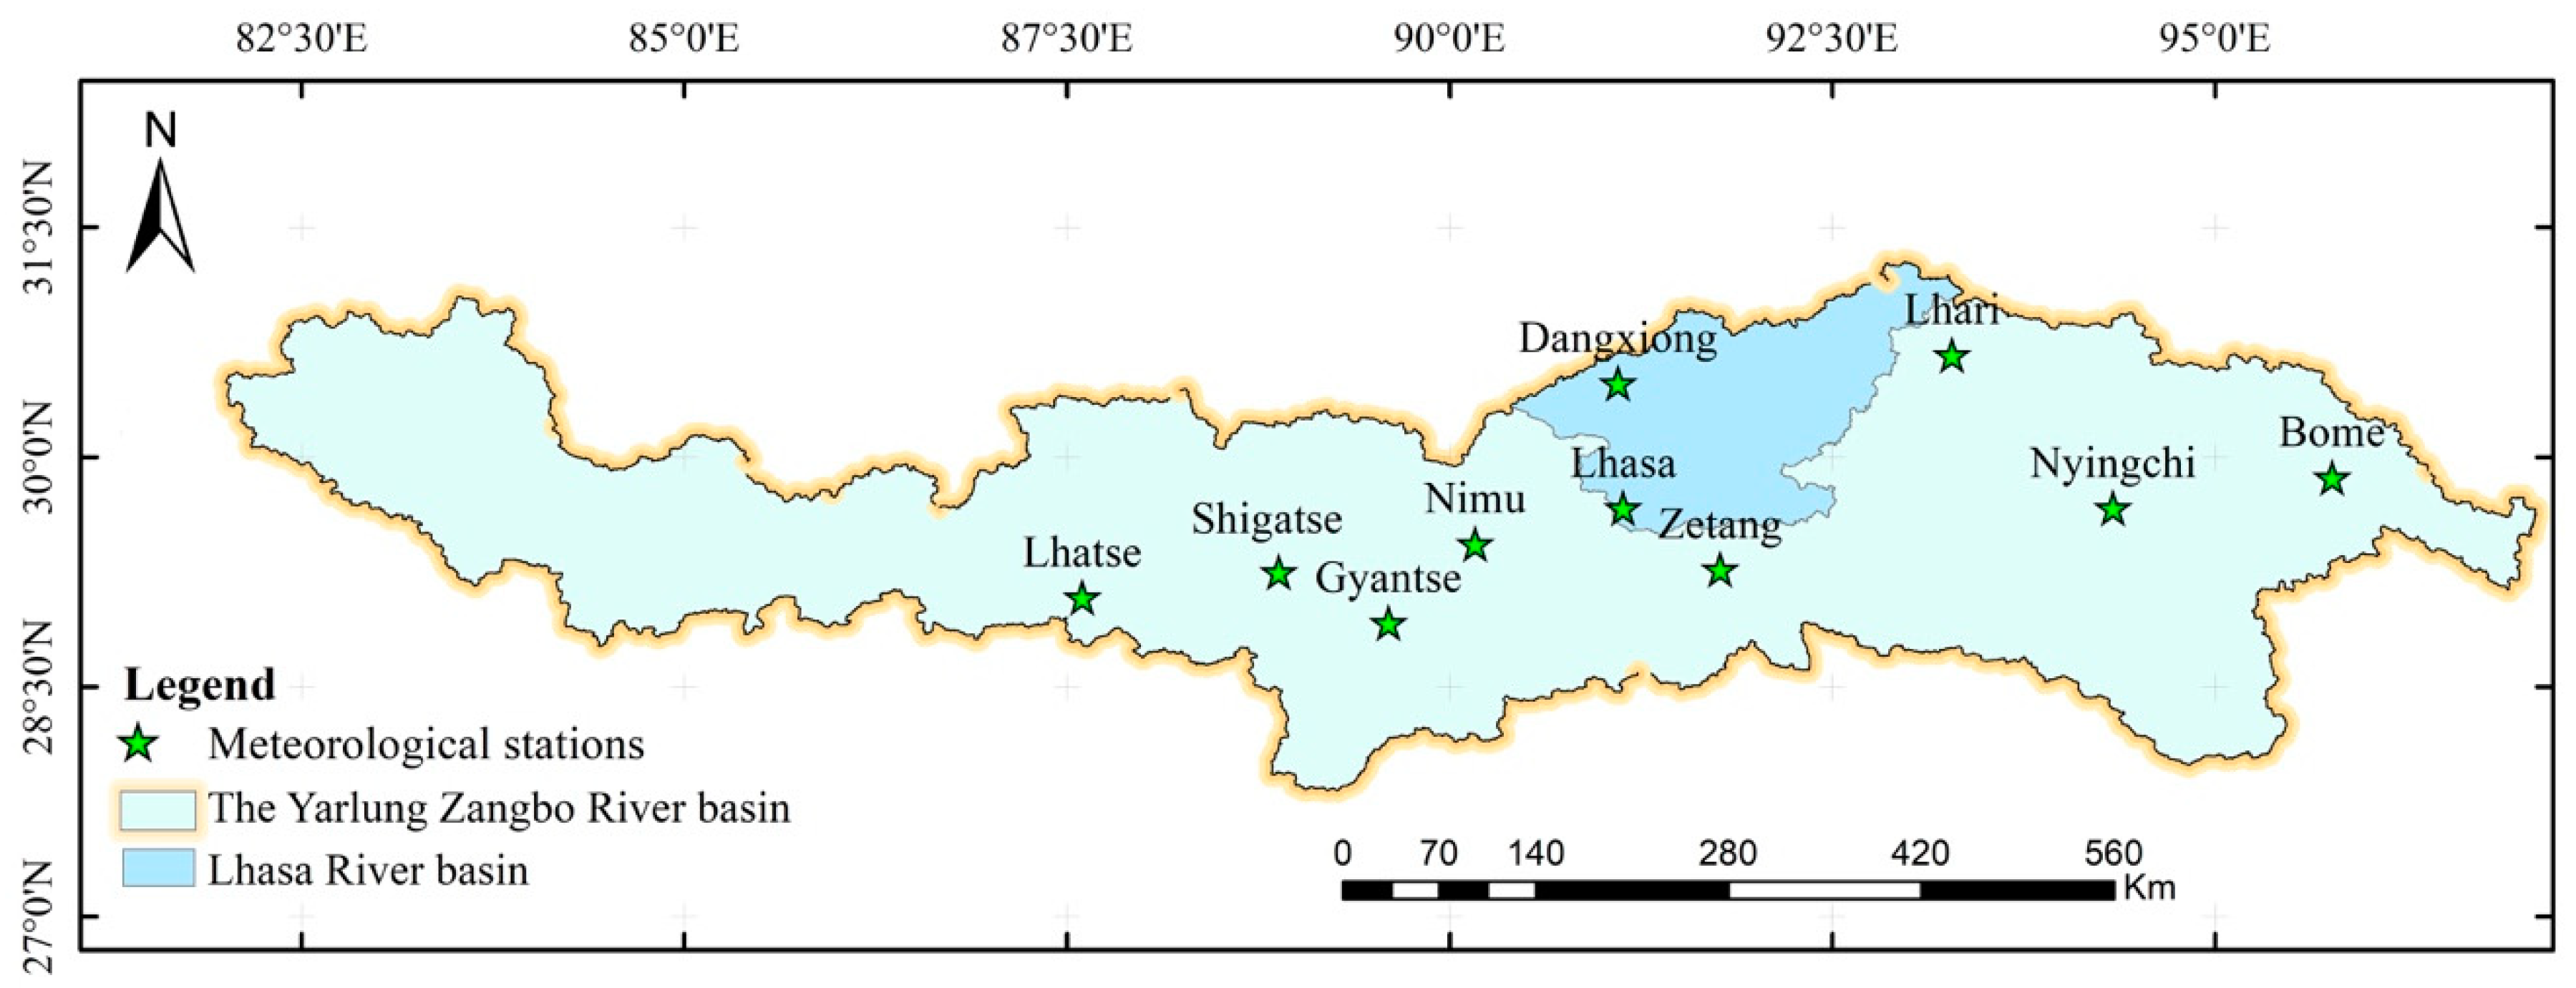
2.1. Study Area and Gauged Data

The Yarlung Zangbo River basin is situated in the southeast of the Qinghai–Tibet plateau (Figure 1) between latitudes 26°–39.8°N and longitudes 73.5°–104.7°E. The Yarlung Zangbo River is one of the highest plateau rivers in this basin. The average altitude of the basin is 4000 m. The Yarlung Zangbo River has numerous tributaries and an abundant supply of water and is the main freshwater resource for Tibet and other countries downstream of China. The Yarlung Zangbo River basin experiences many different climatic patterns, including alpine temperate semiarid, plateau temperate semiarid, and tropical and subtropical monsoon. The annual average precipitation over the basin is 428.7 mm. Because of the irregular topography and climate, the spatial precipitation distribution is very uneven.
Daily scale meteorological data from 1998 to 2014, downloaded from the National Meteorological Data Center of China (http://data.cma.cn), were used in this study. The data passed homogeneity and quality control tests, including (1) checking for extreme values of the gauged data, (2) checking the continuity of the gauged data, and (3) checking the spatial consistency of the gauged data [14]. These tests indicated that the quality of the data from the meteorological stations was high and could therefore be used in the accuracy evaluation of the Yarlung Zangbo River basin SPE data. There are only ten meteorological stations in the Yarlung Zangbo River basin. The meteorological gauges are mainly distributed in the middle of the basin, and there are only a few unevenly distributed gauges in the western region. Therefore, to fully reflect the spatial and temporal distribution of the SPE product in the Yarlung Zangbo River basin, 40 meteorological gauging stations from inside and outside the basin were selected for the accuracy correction of the SPE product, and 10 gauging stations from inside the basin were selected for verifying the accuracy of the SPE product. The stations in the Yarlung Zangbo River basin are referred to as S1–S10 in this study. The station names are shown in Table 1.

2.2. PERSIANN-CDR

In our study, we selected the PERSIANN-CDR product as the SPE product for the accuracy assessment and correction. The precipitation values of the PERSIANN-CDR that were developed from the PERSIANN product were obtained from IR and MW sensors. Bias in the precipitation data was corrected by incorporating the GPCP data. These data are maintained by the University of California and National Oceanic and Atmospheric Administration (NOAA) [19]. PERSIANN-CDR data have been available since 1983 at a 0.25° × 0.25° spatial resolution and a daily temporal resolution. These resolutions make the data suitable for precipitation research and hydrological simulation. In this study, the PERSIANN-CDR product covered the period from 1998 to 2014. Monthly and seasonal-scale precipitation data were calculated by summing the daily data.

2.3. Evaluation Indicators

In the evaluation, the SPE product was compared with the gauged data. Two sets of statistical indices were used (Table 2). Three basic statistical indices—correlation coefficient (Ccoef), root mean square error (RMSE), and standard deviation (SDEV)—were used to describe the consistency between the SPE data and the gauged data. Three probabilistic statistical indices—POD, false alarm ration (FAR), and critical success index (CSI)—were used to describe the probability of precipitation detection by the SPE product based on the gauged data [17,33].
In the above equations, n is the number of days with precipitation. OBS (mm) is the measured precipitation data. SIM (mm) is the precipitation data retrieved from satellite sensing for the same location as the gauged data. O B S ¯ (mm) is the average value of OBS. S I M ¯ (mm) is the average value of SIM, hit_num are the events captured by the satellite and the gauged station, false_num are the events captured by the satellite and missed by the gauged station, and miss_num are the events captured by the gauged station and missed by the satellite.

2.4. Bias Correction

The SC method was used in this study to correct the PERSIANN-CDR product. The SC method calculates the deviation between the gauged data and SPE data and interpolates the deviation into the PERSIANN-CDR grid data through a weighting function. Through a continuous iterative calculation, the corrected data with relatively small deviations are obtained. Determining the weighting function is essential when using the SC method. The steps in the SC method are as follows:
  • Determining the initial field: The initial field of the precipitation data to be corrected is extracted from the SPE data. In this study, the rectangular range [L, W] of the study area was determined, and the satellite precipitation grid data in this range was the initial field Γ0. When the precipitation field is corrected, the position of the meteorological stations may not match with the SPE grid data. In this study, the bilinear interpolation method was used to obtain the precipitation satellite data value at the station position.
  • Determining the interpolation function: The initial field Γ0, obtained from the PERSIANN-CDR grid, was calculated based on the difference between the measured value Mk of the kth gauged station and the value Γ0k at the same position. The first-guess field Γ1 was obtained by interpolating the difference into the initial field using the weighting function, and then repeating the above steps with Γ1 as the initial field until the difference was sufficiently small:
    Γ 1 = Γ 0 + k = 1 k W i j k 2 ( M k Γ 0 k ) k = 1 k W i j k ,
    where Γ1 is the first-guess value at the position of the grid coordinates (i,j) of the first-guess field, Γ0 represents the initial value at the position (i,j) of the initial field, Mk is the observed value at the kth gauged station, Γ0k represents the initial SPE value at the position of the kth gauged station, and Wijk is the weighting factor, which ranges from 0 to 1. The number of gauged stations in the search radius is given by k.
  • Determining the weighting function: The weighting function Wijk has different forms (e.g., circle, ellipse, and curvature ellipse). In this study, the circular form was chosen as the weighting function:
    W i j k = { R 2 d i j k 2 R 2 + d i j k 2 , d i j k < R 0 , d i j k R ,
    where R indicates the search radius with a value of 2°. The length of the grid (i,j) to the kth station is represented by dijk.

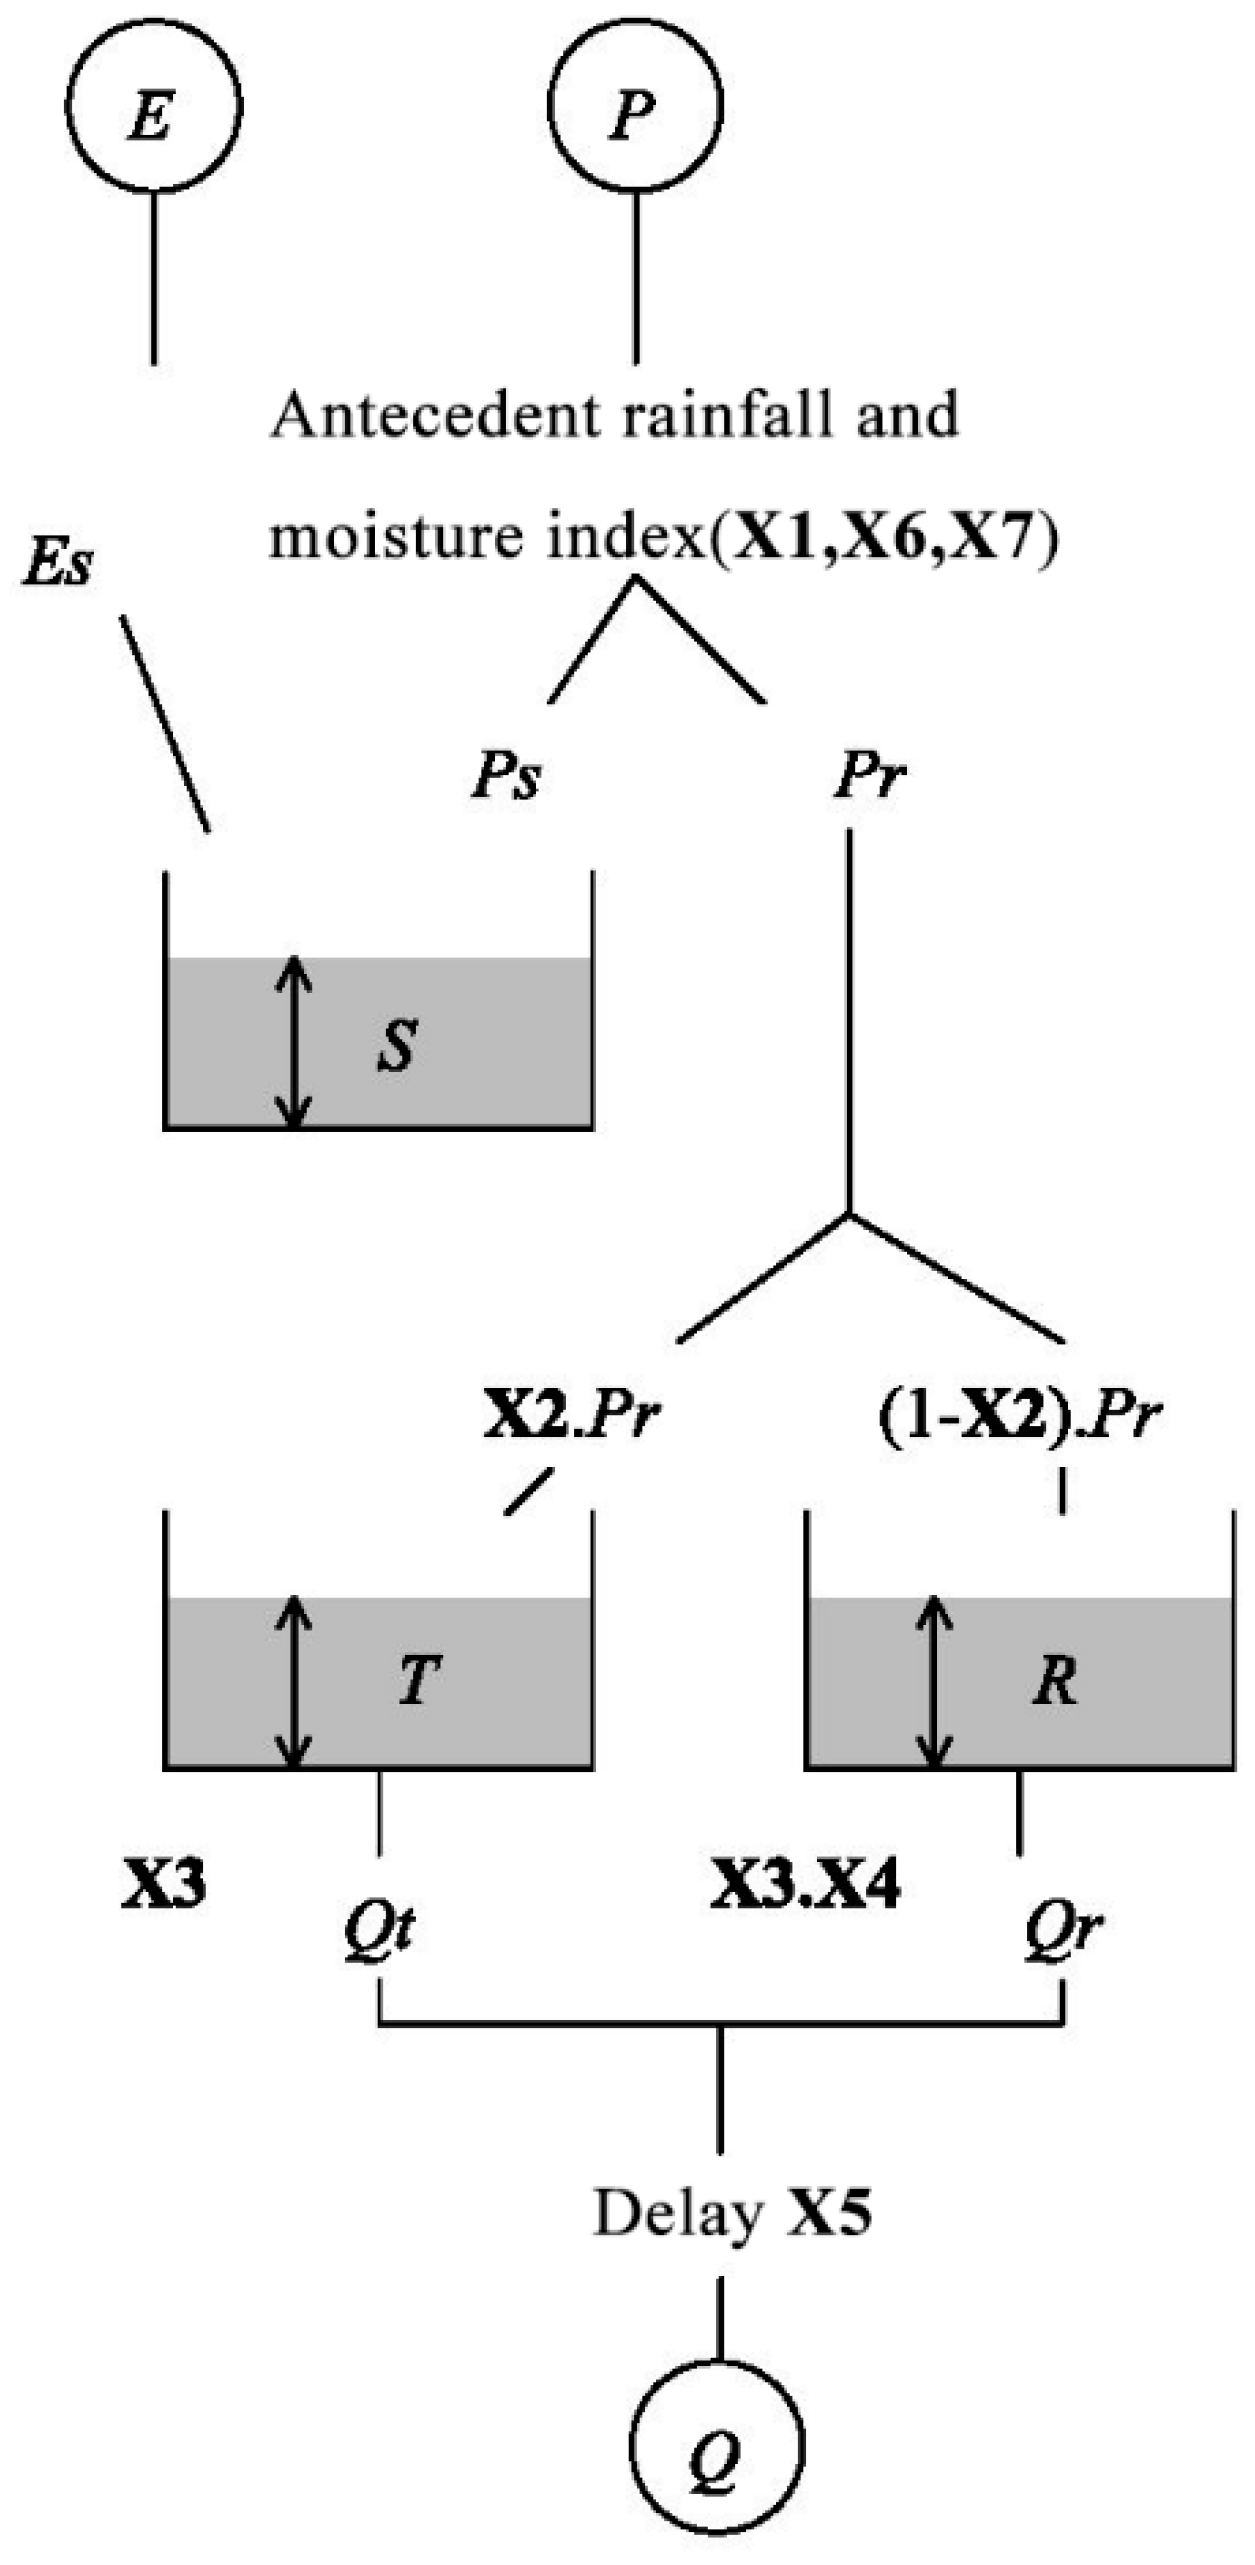
2.5. IHACRES Rainfall Runoff Model

A modified IHACRES model (https://github.com/TBenkHyd2/IHACRES_Model_Matlab) was used for the hydrological assessments of the uncorrected PERSIANN-CDR (UCPC) and the corrected PERSIANN-CDR (CPC) products. The IHACRES model is a lumped conceptual rainfall-runoff model based on the unit hydrograph concept and has been widely used to simulate runoff in sparsely gauged or ungauged areas. The IHACRES model requires fewer parameters than other hydrological models. The input data include precipitation, discharge, air temperature, and drainage area. The model is constructed from a series of nonlinear and linear modules. The nonlinear modules convert rainfall into effective rainfall (the rainfall that flows out of the basin in the form of runoff), and the linear modules convert the effective rainfall into runoff. All the water loss occurs in the nonlinear modules (Figure 2). In our study, the shuffled complex evolution method developed at the University of Arizona (SCE-UA) method was used to calibrate the IHACRES model [34,35]. The calibration period was 2009–2011, and the verification period was 2012–2014.

Model Performance Evaluation

In this study, the Nash–Sutcliffe coefficient of efficiency (NSE) and the percent bias (PBIAS) were chosen as indicators to evaluate the performance of the hydrological simulation [37]:
N S E = 1 i = 1 n ( Q i Q i ) 2 i = 1 n ( Q i Q ¯ ) 2 ,
where Qi (m3/s) is the daily measured discharge, Q i (m3/s) is the daily simulated discharge, and Q ¯ (m3/s) is the average daily simulated runoff. The integer n is the number of simulation days. The range of possible NSE values is −∞ to 1. The closer the NSE value is to 1, the higher the accuracy of the model simulation. If 0 < NSE < 1, then the model has some ability to simulate the streamflow. If NSE ≤ 0, then the model has no ability to simulate the streamflow. If NSE ≤ 0.5, then the simulation results of the model are unsatisfactory. If 0.5 < NSE ≤ 0.65, then the results of the model are satisfactory. Values of 0.65 < NSE ≤ 0.75 indicate that the results of the model are good. Values of 0.75 < NSE ≤ 1 indicate that the results of the model are very good [38].
The function of PBIAS is given by the following:
P B I A S = i = 1 n ( Q i Q i ) 100 i = 1 n Q i ,
where the variables in the formula have the same meanings as in Equation (3). The closer PBIAS is to 0, the higher the accuracy of the model. A PBIAS > 0 indicates the model underestimates the runoff, while PBIAS < 0 indicates that the model overestimates the runoff.

3. Results

3.1. Accuracy Assessment for the Original SPE Product

3.1.1. Basic Statistical Indices

Readings from meteorological stations are affected by altitude, topography, and spatial distribution. The accuracy of data from each station can be different. To better evaluate the accuracy difference at each station, the values of Ccoef, RMSE, and SDEV for the ten stations in the Yarlung Zangbo River basin were calculated. The Taylor diagram [39] can visually represent the statistical relationship between PERSIANN-CDR and gauged data. The length of the radius from the origin to a point in the Taylor diagram represents the SDEV, the angle with the ordinate indicates the Ccoef, and the distance from the observation point indicates the RMSE. Therefore, the deviation of the PERSIANN-CDR data from the gauged data in the Taylor chart is assessed as follows: The closer the SPE simulation value is to the gauged position on the x axis, the larger the correlation coefficient between the SPE data and the gauged data. The smaller the value of the RMSE is, the higher the accuracy of the SPE product. Figure 3 shows that the PERSIANN-CDR data had some instability in gauged precipitation data inversion. In the Yarlung Zangbo River basin, the Ccoef ranged from 0.33 to 0.48. The Shigatse station had the maximum Ccoef value (0.48), and the Jiali station had the minimum Ccoef value (0.33). The Ccoef values for the satellite data in the midstream were slightly higher than the upstream and downstream values. The values for the RMSE ranged from 3.90 to 6.07 mm. The Dangxiong station had the smallest RMSE value (3.90 mm), while the Jiali station had the highest value (6.07 mm). The values of SDEV ranged from 3.57 to 5.91 mm. The Dangxiong station had the smallest value (3.57 mm), while the Jiali station had the largest value (5.91 mm). On the Taylor diagram, point S10 (Lhari) is located in the upper left corner of the figure, which was the farthest from the gauged point, indicating that the PERSIANN-CDR product had the worst accuracy at the S10 point. The S9 (Dangxiong) station was closest to the gauged point, indicating that the accuracy at the S9 position was the highest. The accuracy of the PERSIANN-CDR product in the midstream was relatively high, and the accuracy in the upstream and downstream was slightly worse.

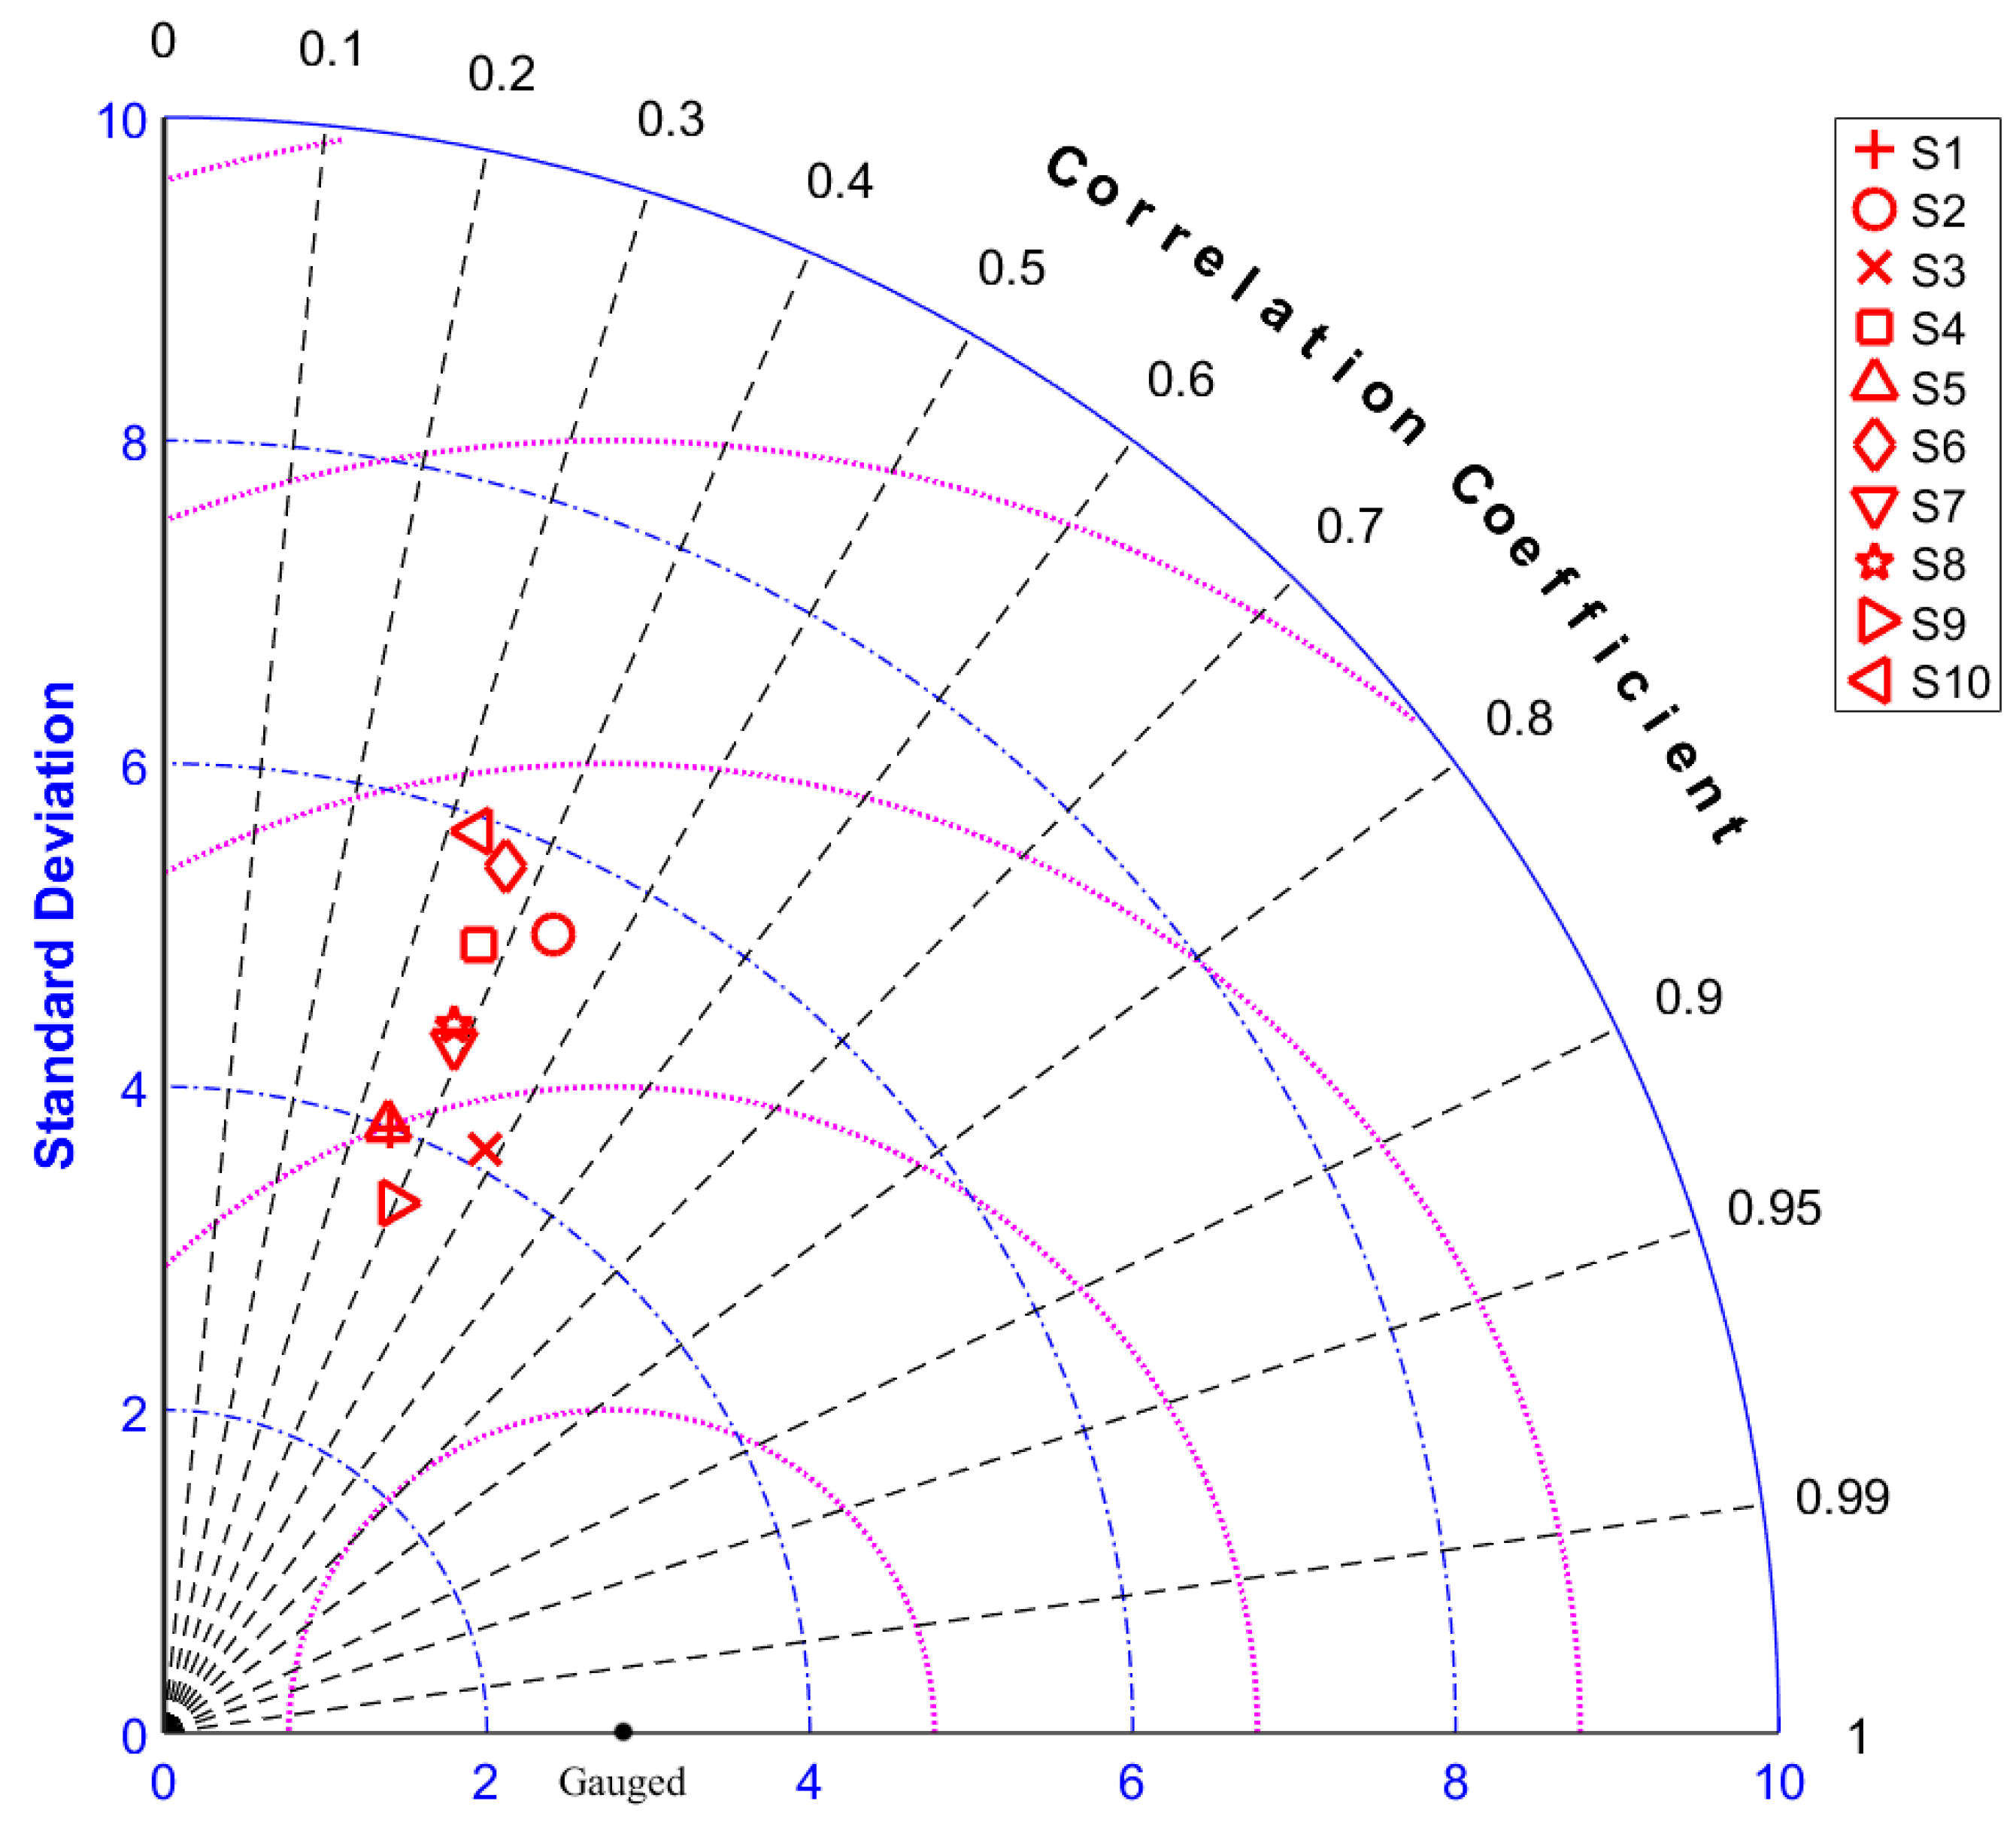
3.1.2. Probabilistic Statistical Indices

The probabilistic statistical indices of the original SPE data and gauge observation data are shown in Figure 4. Of the entire basin, the average value of the POD of the uncorrected SPE product was 0.77, which indicated that the detection of some precipitation events must have been missed in the Yarlung Zongbo River basin. There were differences in the spatial distribution of probabilistic statistical indices. The POD values in the western Yarlung Zangbo River basin were the smallest, with a range of 0.54 to 0.57, especially in the Shigatse station, where the value was 0.54. The POD values in the central part of the Yarlung Zangbo River basin ranged from 0.73 to 0.86, and the values in the northeastern part ranged from 0.88 to 0.94. The original PERSIANN-CDR data had a certain ability to capture precipitation events in the Yarlung Zangbo River basin. However, this ability decreased gradually from the east to the west of the basin.
Of the entire basin, the average value of the FAR of the uncorrected SPE product was 0.65. The POD values in the western Yarlung Zangbo River basin were the largest with a range of 0.76 to 0.77, while those in the eastern region of the basin were the smallest, ranging from 0.46 to 0.69. The values in the central part of the basin were between that of the eastern part and the western part. The original PRSIANN-CDR satellite data missed more precipitation events on a daily scale, and from the east to the west of the basin, the missed precipitation events by satellite data gradually increased.
The value of the CSI showed the ability of the SPE product to capture all precipitation events, including the missed and false events. Of the entire basin, the CSI value of the original SPE was 0.32. The CSI and the POD had the same spatial distribution characteristics. In the eastern part of the basin, the values of the CSI ranged from 0.3 to 0.49, while in the western part, it was only 0.2. In the central part of the basin, the values of CSI ranged from 0.22 to 0.28.
Overall, the original SPE product had the ability to detect precipitation events, but missed 23% and falsely detected 65% of the precipitation events. A density scatter plot of the original SPE product shows the area of precipitation concentration and the trend of precipitation change (Figure 5a). The daily precipitation of the PERSIANN-CDR product was mainly between 0 and 0.45 mm, the majority of which were small precipitation events, constituting 32% of all precipitation events. There was a certain correlation between the uncorrected PRESIANN-CDR product and the gauged station data, but there was a large deviation between the original PRESIANN-CDR product and the gauged station data. The accuracy of the original PRESIANN-CDR product in the basin gradually decreased from the eastern to western regions of the basin.

3.2. Accuracy Assessment for the Corrected SPE Product

The SPE product has a wide geographical scope, high speed, good continuity, and can effectively supplement data for alpine regions where gauged data are sparse. The SPE product has limitations in its image acquisition algorithm and precipitation inversion and should be corrected before its application in alpine regions. In this study, the PERSIANN-CDR product was corrected using the SC method. A PERSIANN-CDR data grid, covering forty stations within and outside of the Yarlung Zangbo River basin, was selected as the initial field to be corrected. The search radius was set at 2°. The calibration results are shown in Table 3. It can be seen from the table that with one correction step, the PERSIANN-CDR data corrected by the SC method had a significant accuracy improvement. The value of Ccoef increased from 0.58 to 0.73, and the values of SDEV and RMSE decreased. Thus, the accuracy of the SPE product was greatly improved. However, as the number of correction steps was increased, the Ccoef values began to decrease, and the Ccoef was less than that of the UCPC product. The RMSE and SDEV values of the CPC product were also much higher than the RMSE and SDEV values of the UCPC product. This indicated that with an increase in the number of correction steps, the accuracy of the PERSIANN-CDR product initially increased and subsequently decreased and that the CPC had the highest accuracy when only one correction step was used. Therefore, this study selected the results from one correction step as the final correction result.
A scatter density map for the CPC products is shown in Figure 5b. It can be seen that the data of stations in the Yarlung Zangbo River basin from 1998 to 2015 mainly represent small precipitation events. These events accounted for 94.68% of all events and were mainly in the 0–5 mm range. From the fitting line of the scatter density map, it can be seen that, overall, the PERSIANN-CDR product overestimated the stations’ precipitation data, especially for small precipitation events. With the CPC product, the scatter points were closer to the fitting curve, especially in the case of slight precipitation, and the overestimates were reduced. After the SPE product was corrected, the value of Ccoef increased from 0.585 to 0.727, the scatter of the PERSIANN-CDR product showed clear convergence, and the bias was reduced.
The probabilistic statistical indices of the corrected SPE data and gauge observation data are shown in Figure 6. The average POD value of the original SPE product was 0.91 in the entire basin, and the POD value of the corrected SPE product was 18.2% higher than the uncorrected SPE product, which indicated that the ability to detect precipitation events of the SPE product was improved by the SC method. There also existed some differences in the spatial distribution of the SPE product in the Yarlung Zangbo River basin. The POD values of the corrected SPE product in the eastern region of the Yarlung Zangbo River basin ranged from 0.77 to 0.90, and in the western region from 0.94 to 0.95, while in the central region, the POD values ranged from 0.94 to 0.96. The performance of the corrected SPE improved the capacity of detecting precipitation events, especially in the western region of the basin.
The value of the corrected SPE product was 0.58 in the entire basin and 10.8% lower than the original SPE product, which indicated that the condition of the missed SPE product was relieved to a certain extent. The POD values in the central region were the smallest, with a range of 0.65 to 0.71. The values of FAR in the eastern part of the basin had a low range from 0.38 to 0.64, while the values in the western basin were between that of the eastern region and the central region, which indicated that the performance of the corrected SPE product in FAR was improved in the western region of the Yarlung Zangbo River basin, while the improvements in FAR were not as significant as that of POD.
The CSI value of the corrected SPE was 0.39 in the entire basin. The CSI of the corrected SPE product showed the same spatial distribution characteristics as the uncorrected product. In the eastern part of the basin, the values of CSI ranged from 0.52 to 0.53, while in the central region, the values ranged from 0.29 to 0.35. In the western part of the basin, the values of CSI ranged from 0.32 to 0.35.
In conclusion, the accuracy of the corrected PERSIANN-CDR product by the SC method and the capacity of detecting precipitation events improved in the daily scale. The correlation coefficient between the corrected and original SPE product improved. From the perspective of spatial distribution, the SC method mainly improved the accuracy of the SP product in the central and western regions of the basin.

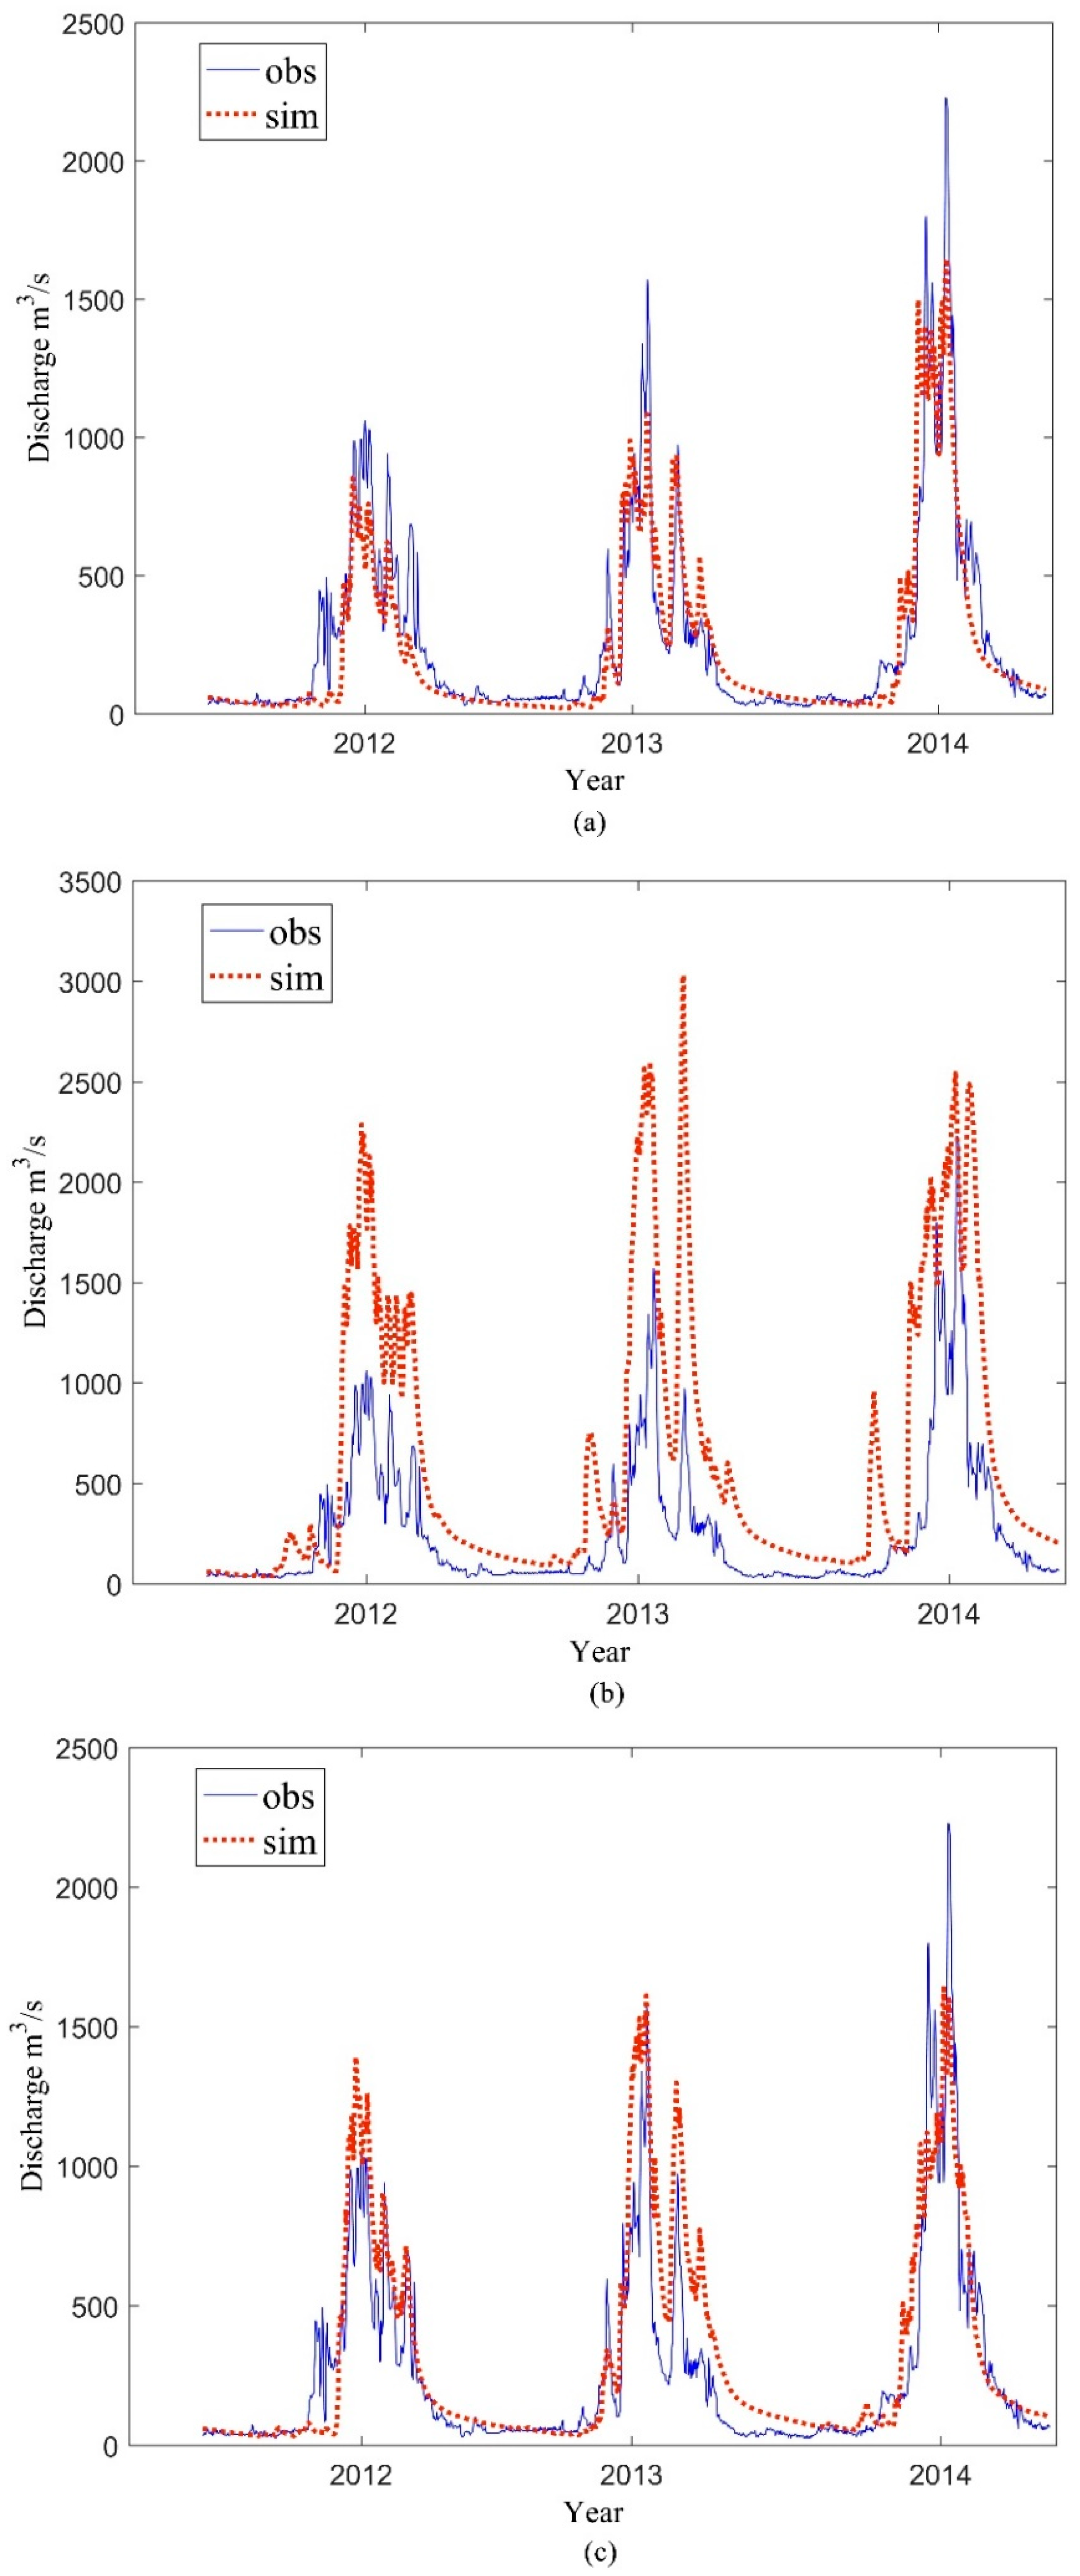
3.3. Discharge Simulation with Gauged Data, Uncorrected SPE Data, and Corrected SPE Data

The Lhasa River basin, a typical sub-basin of the Yarlung Zangbo River basin, was selected as the CPC verification area. The gauged data, UCPC data, and CPC data were used to drive the IHACRES model, and the model was validated in the Lhasa River basin. The NSE for the model, determined using the SCE-UA algorithm calibration, reached 0.836 for the calibration period (2009–2011). The model performance was very good. This indicated that the calibrated IHACRES model could be applied in the Lhasa River basin. In the verification period (2012–2014), the IHACRES model was driven using gauged, UCPC, and CPC data. The simulation results are shown in Figure 7. The NSE for the gauged data simulation was 0.816, and the PBIAS was 9.79%. The model simulation achieved very good results: The gauged precipitation data generated simulations with a relatively high accuracy that better reflected the runoff in the basin. When the UCPC was used to drive the IHACRES model, the NSE was −1.673, and the PBIAS was −135.32%. This indicates that the simulation performance of the model was very poor when using UCPC. The simulated runoff value was much higher than the actual runoff value in the Lhasa River basin, especially in the summer and autumn seasons (Figure 7b). Therefore, the UCPC data increased the uncertainties in the model and reduced the accuracy of the simulation results. In contrast, when the CPC product was used to drive the IHACRES model, the resulting NSE value was 0.702, and the BPIAS value was −23.24%. This indicates that the simulation provided by the model was generally good. Compared to the UCPC simulation results, the CPC data greatly improved the runoff simulation results.
The IHACRES simulations using the CPC data for the Lhasa River basin were superior to the simulations performed using the UCPC data. The simulated values using the CPC data overestimated the peak measured runoff, especially during the 2012 season, which had abundant rainfall. Possible reasons for the poor peak runoff simulation include the following: (1) The model used the gauged data to calibrate the parameters, the calibrated parameters favored good simulation results for the gauged data, and the runoff simulated by the SPE was inadequate for capturing the peak capture runoff; and (2) the precipitation was still overestimated as a whole, even though the PERSIANN-CDR product was corrected. The IHACRES simulated runoff results were highly dependent on precipitation values, and thus the corrected data still overestimated peak runoff.

4. Discussion

The sparseness of precipitation stations in the Qinghai–Tibet Plateau has brought serious challenges for local water resource management and sustainable use. SPE products can provide precipitation data with a relatively high spatial resolution, which can serve as effective supplementary gauged data in the Qinghai–Tibet Plateau. Because of local topography and climatic effects, there are uncertainties associated with the SPE data for the Qinghai-Tibet Plateau. Therefore, the accuracy of SPE products should be evaluated and corrected before the data are applied to analyze local precipitation characteristics and drive hydrological models. There are significant temporal and spatial differences of the precipitation in the Yarlung Zangbo River basin, and the differences have a profound impact on the applicability and correction effect of the SPE product in the basin. In this study, the monthly and seasonal precipitation data were calculated by accumulating the daily precipitation data, and 0.15°, 0.25°, 0.35°, and 0.45° spatial resolution were used by downscaling and upscaling methods to discuss the impacts of the temporal-spatial resolution on the accuracy performance and effect of the SC method.

4.1. Effect of Temporal Resolution on the Accuracy of Corrected and Uncorrected SPEs

The statistical indices between the original and corrected SPE product were calculated on a monthly scale (Table 4). The monthly Ccoef values (0.96 and 0.97) between the original and corrected PERSIANN-CDR data and the gauged data were much higher than those on the daily scale (0.58 and 0.73). This showed that the original and corrected PERSIANN-CDR product had a good consistency with the gauged data on a monthly scale, with a high accuracy. The average RMSE values were 34.57 mm and 33.47 mm, respectively, and the average SDEV values were 77.25 mm and 77.01 mm, respectively. The values of the probabilistic statistical indices on the monthly scale were much higher than the values of indices on the daily scale. The values of the monthly scale were higher than those of the daily scale, which indicated that the deviation of the PERSIANN-CDR product was higher on the monthly scale. Thus, the correlation between the PERSIANN-CDR data and gauged data was better on the monthly scale than on the daily time scale, but the deviation also increased. Overall, the original and corrected PERSIANN-CDR product had a better performance on the monthly scale. In addition, the effect of the SC method on the accuracy improvement of SPE data was not obvious on the monthly scale: The correlation coefficient increased by only 0.01 on the monthly scale, and FAR and CSI changed only by 0.01.

4.2. Effect of Spatial Resolution on the Accuracy of Original and Uncorrected SPEs

It is important and essential to discuss the impact of spatial resolution of the SPE product in the process of correction and evaluation. We calculated the basic statistical indices and probabilistic statistical indices in different spatial resolutions (Table 4) [18]. With a decrease in the resolution from 0.15° to 0.45°, the original SPE product changed little in the various indices, while the value of the correlation coefficient of the corrected SPE product decreased gradually from 0.7 to 0.54, and the value of the RMSE and SDEV increased gradually. Therefore, the spatial resolution of the SPE product mainly affected the basic statistical indicators of the corrected SPE product. The correlation between the SPE data and gauged station data decreased and the deviation increased with a gradual reduction of the resolution. Omranian [17] assessed the impact of the spatial resolution on the satellite effect evaluation. He believed that almost all of the performance measures were sensitive to changes in the spatial resolution. However, the conclusion of this study was that only the CPC product had an impact on the spatial resolution. This may be related to the calculation method in this study. In this study, the bilinear interpolation method was used to obtain the satellite values at the site location. The site was close to the grid points after upscaling and downscaling and was insensitive to the spatial resolution.
In terms of the spatial distribution, the Ccoef was relatively small in the western region. This might be because the western region of the Yarlung Zangbo River basin is located in the northwest of the plateau, which is seldom impacted by warm and humid air masses and has very low precipitation. Consequently, the correlation between the SPE data and gauged data was relatively poor. Small values of Ccoef were also obtained for the eastern and southeastern parts of the Yarlung Zangbo River basin. There are two possible reasons for this: (1) The meteorological stations in this area are sparse, especially at the outlet of the basin; and (2) the inversion of satellite data for light and heavy precipitation was relatively poor.

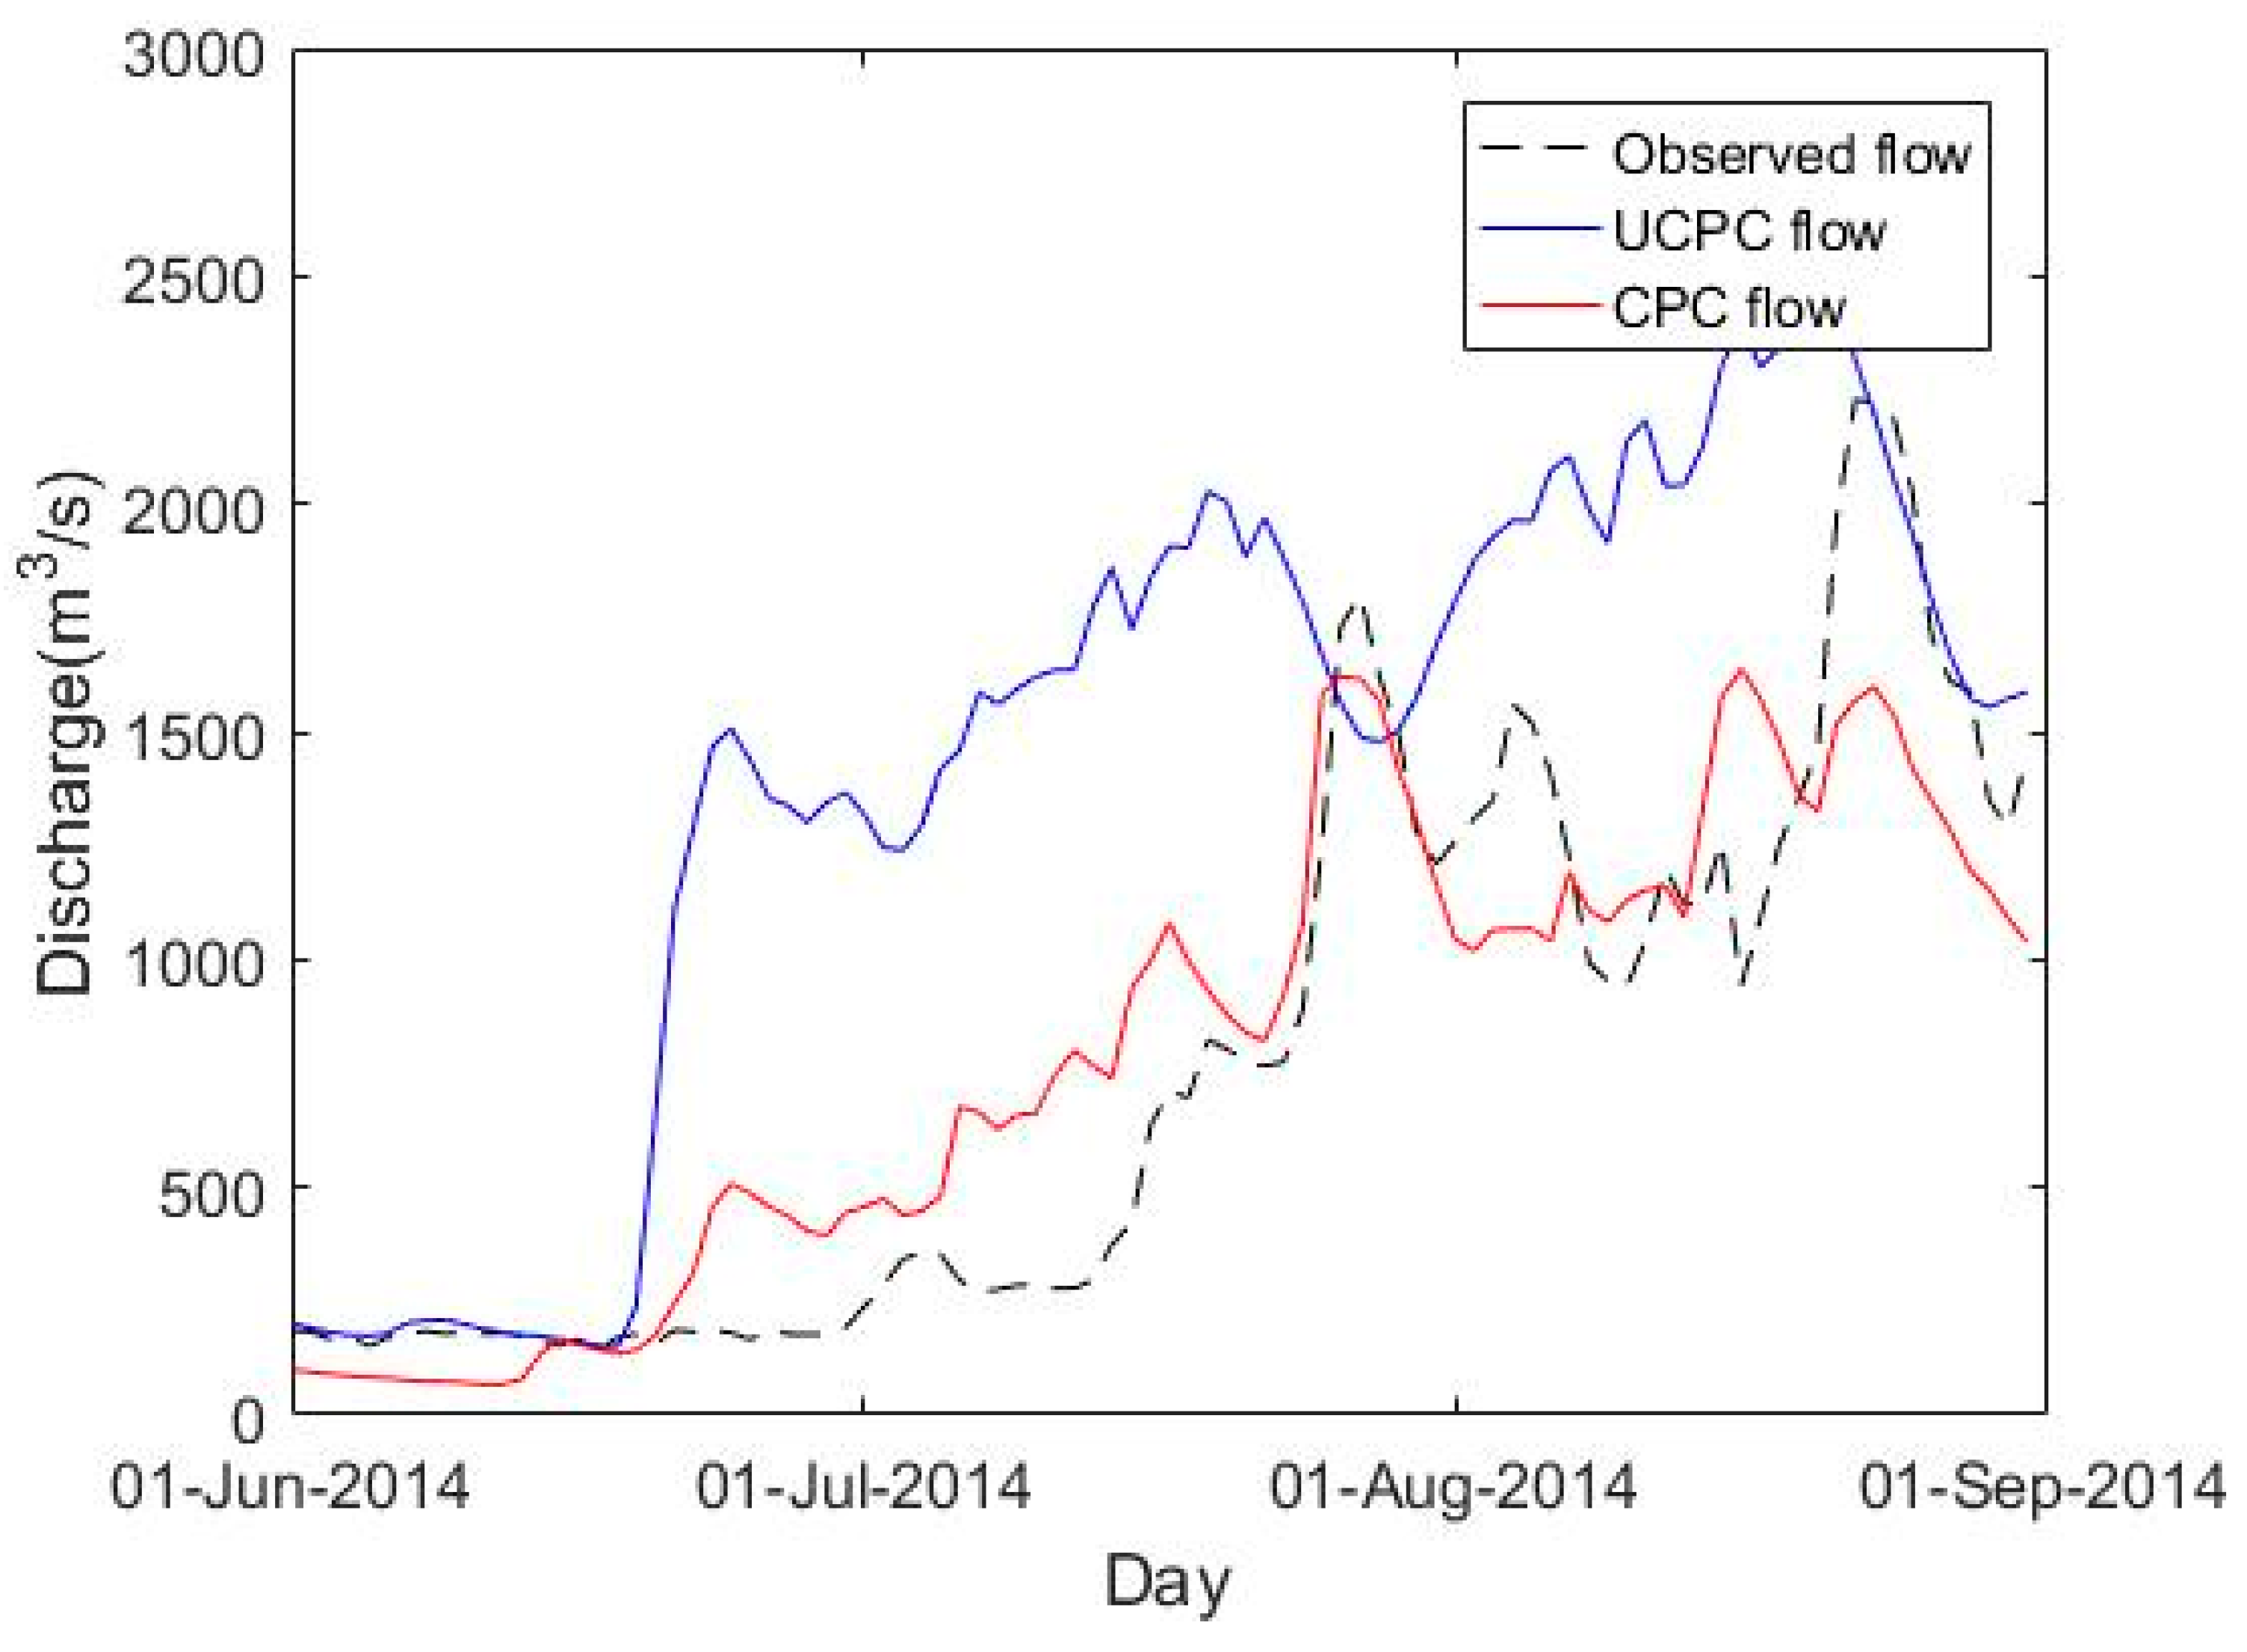
4.3. Assessment of Extreme Storm Events by the Corrected SPE Product Data

Tong et al. [12] verified the performance of TRMM 3B42, TRMM 3B RT, CMORPH, and PERSIANN in the Qinghai–Tibet Plateau. The Variable Infiltration Capacity (VIC) model was used to simulate streamflow at the Tangnaihai and Zhimenda stations on the Yellow and Yangtze Rivers, respectively. The authors observed that CMORPH exhibited the best performance of the four SPE products for streamflow simulations. The precipitation satellite has the advantages of a wide coverage and strong timeliness, which can make up for the insufficiency of the incomplete coverage of ground stations and radar. Therefore, it plays a very important role in the monitoring of floods and disasters [40]. In July 2014, continuous precipitation occurred in Lhasa. On 23 July, a medium-sized mudslide occurred in Nimu county in Lhasa. Houses were damaged, roofs collapsed, roads were washed away, and farmland was flooded, with more than 800 people affected. The original and corrected SPE data were used to simulate the summer 2014 runoff of the Lhasa River (Figure 8). The runoff of the Lhasa River continued to increase in mid-to-late July 2014, reaching a peak around 23 July, 2014. The runoff data simulated by the original product were always overestimated, while the corrected product could fit the trend of the runoff data well, especially in mid-to-late July. Therefore, the satellite precipitation data corrected by the SC method could better simulate the flood disaster, which is of great significance for disaster prevention and mitigation.

5. Conclusions

Using the PERSIANN-CDR product, the IHACRES model, and gauged data, a variety of statistical indicators were selected to evaluate the performance of the PERSIANN-CDR product for the Yarlung Zangbo River basin at various time scales. The accuracy of the PERSIANN-CDR product was corrected at a daily scale using the SC method. UCPC data and CPC data were used to drive the IHACRES model. The main conclusions are as follows:
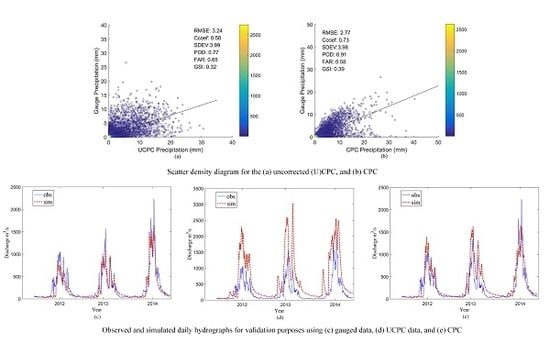
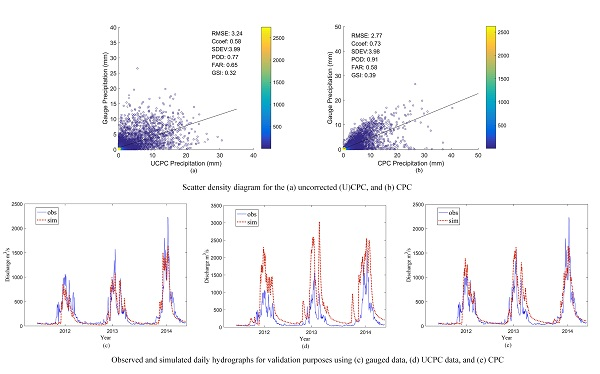
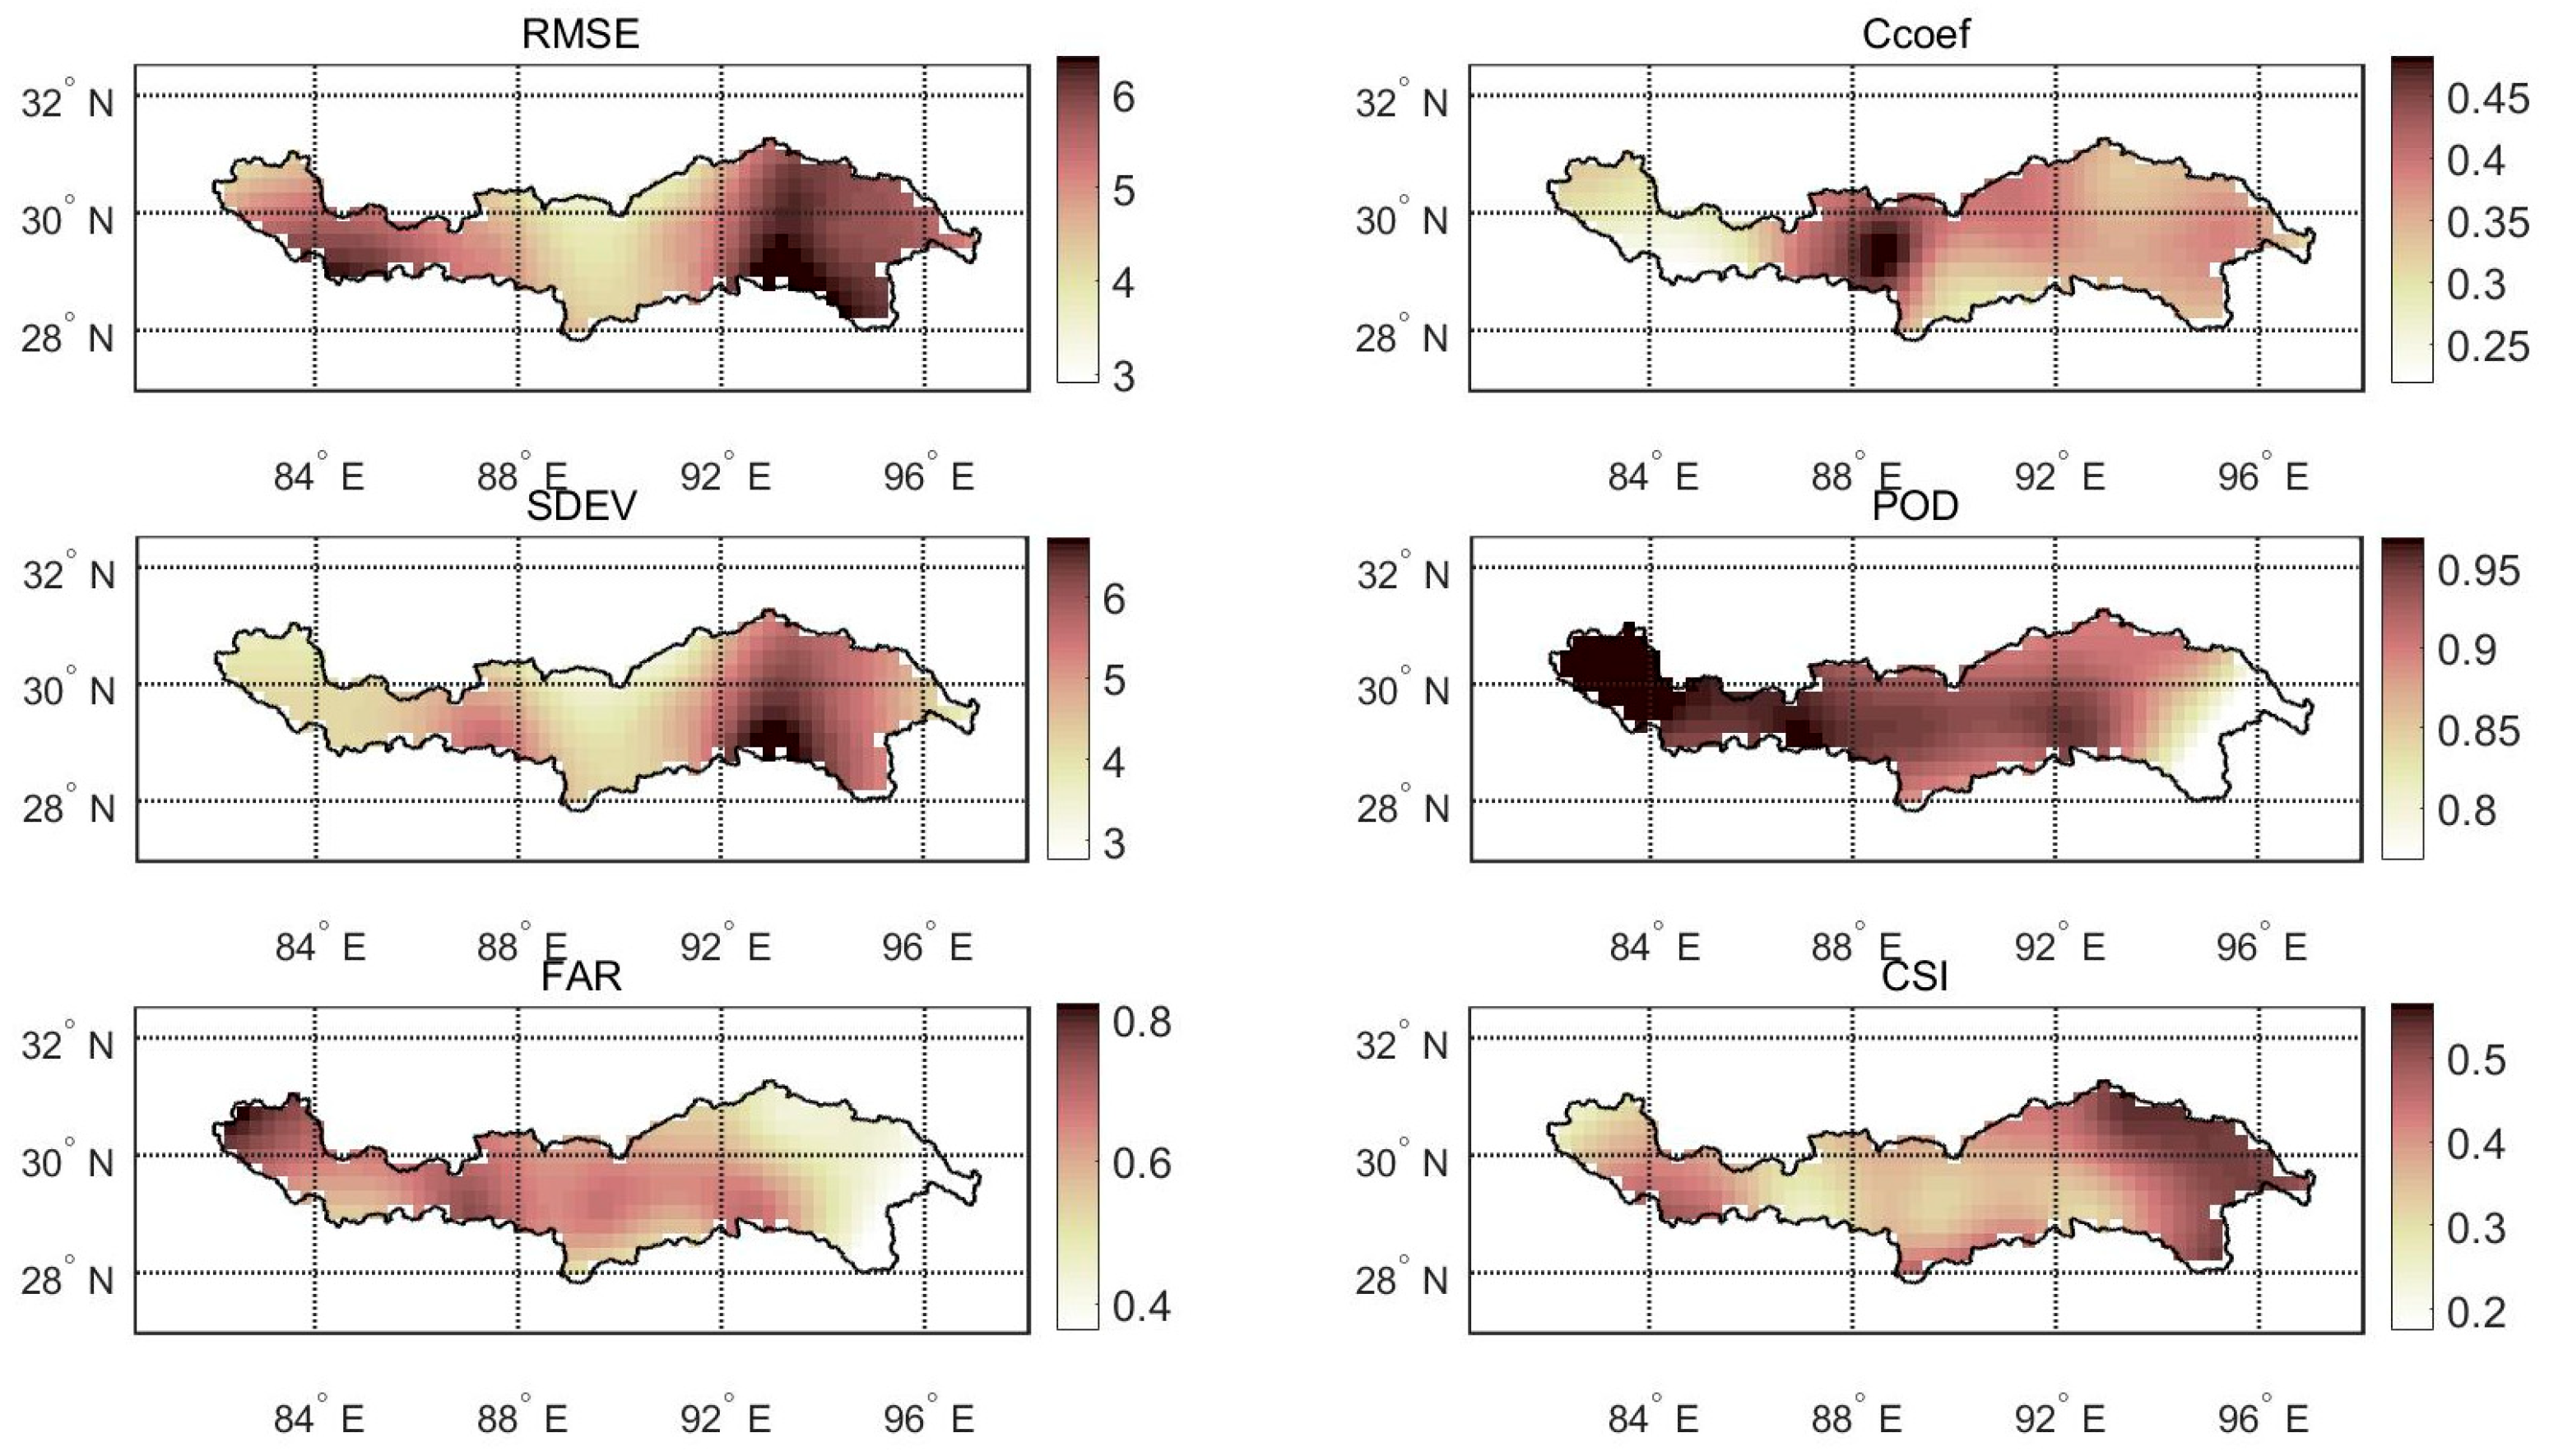
  • The correlation between the uncorrected SPE data and gauged observation data was low on a daily scale, and the deviation was large. The original PERSIANN-CDR data could detect precipitation events to a certain extent, but 23% of the precipitation events were not captured, and 65% of the precipitation events were missed. The accuracy of the SPE product decreased gradually from the east to the west of the basin.
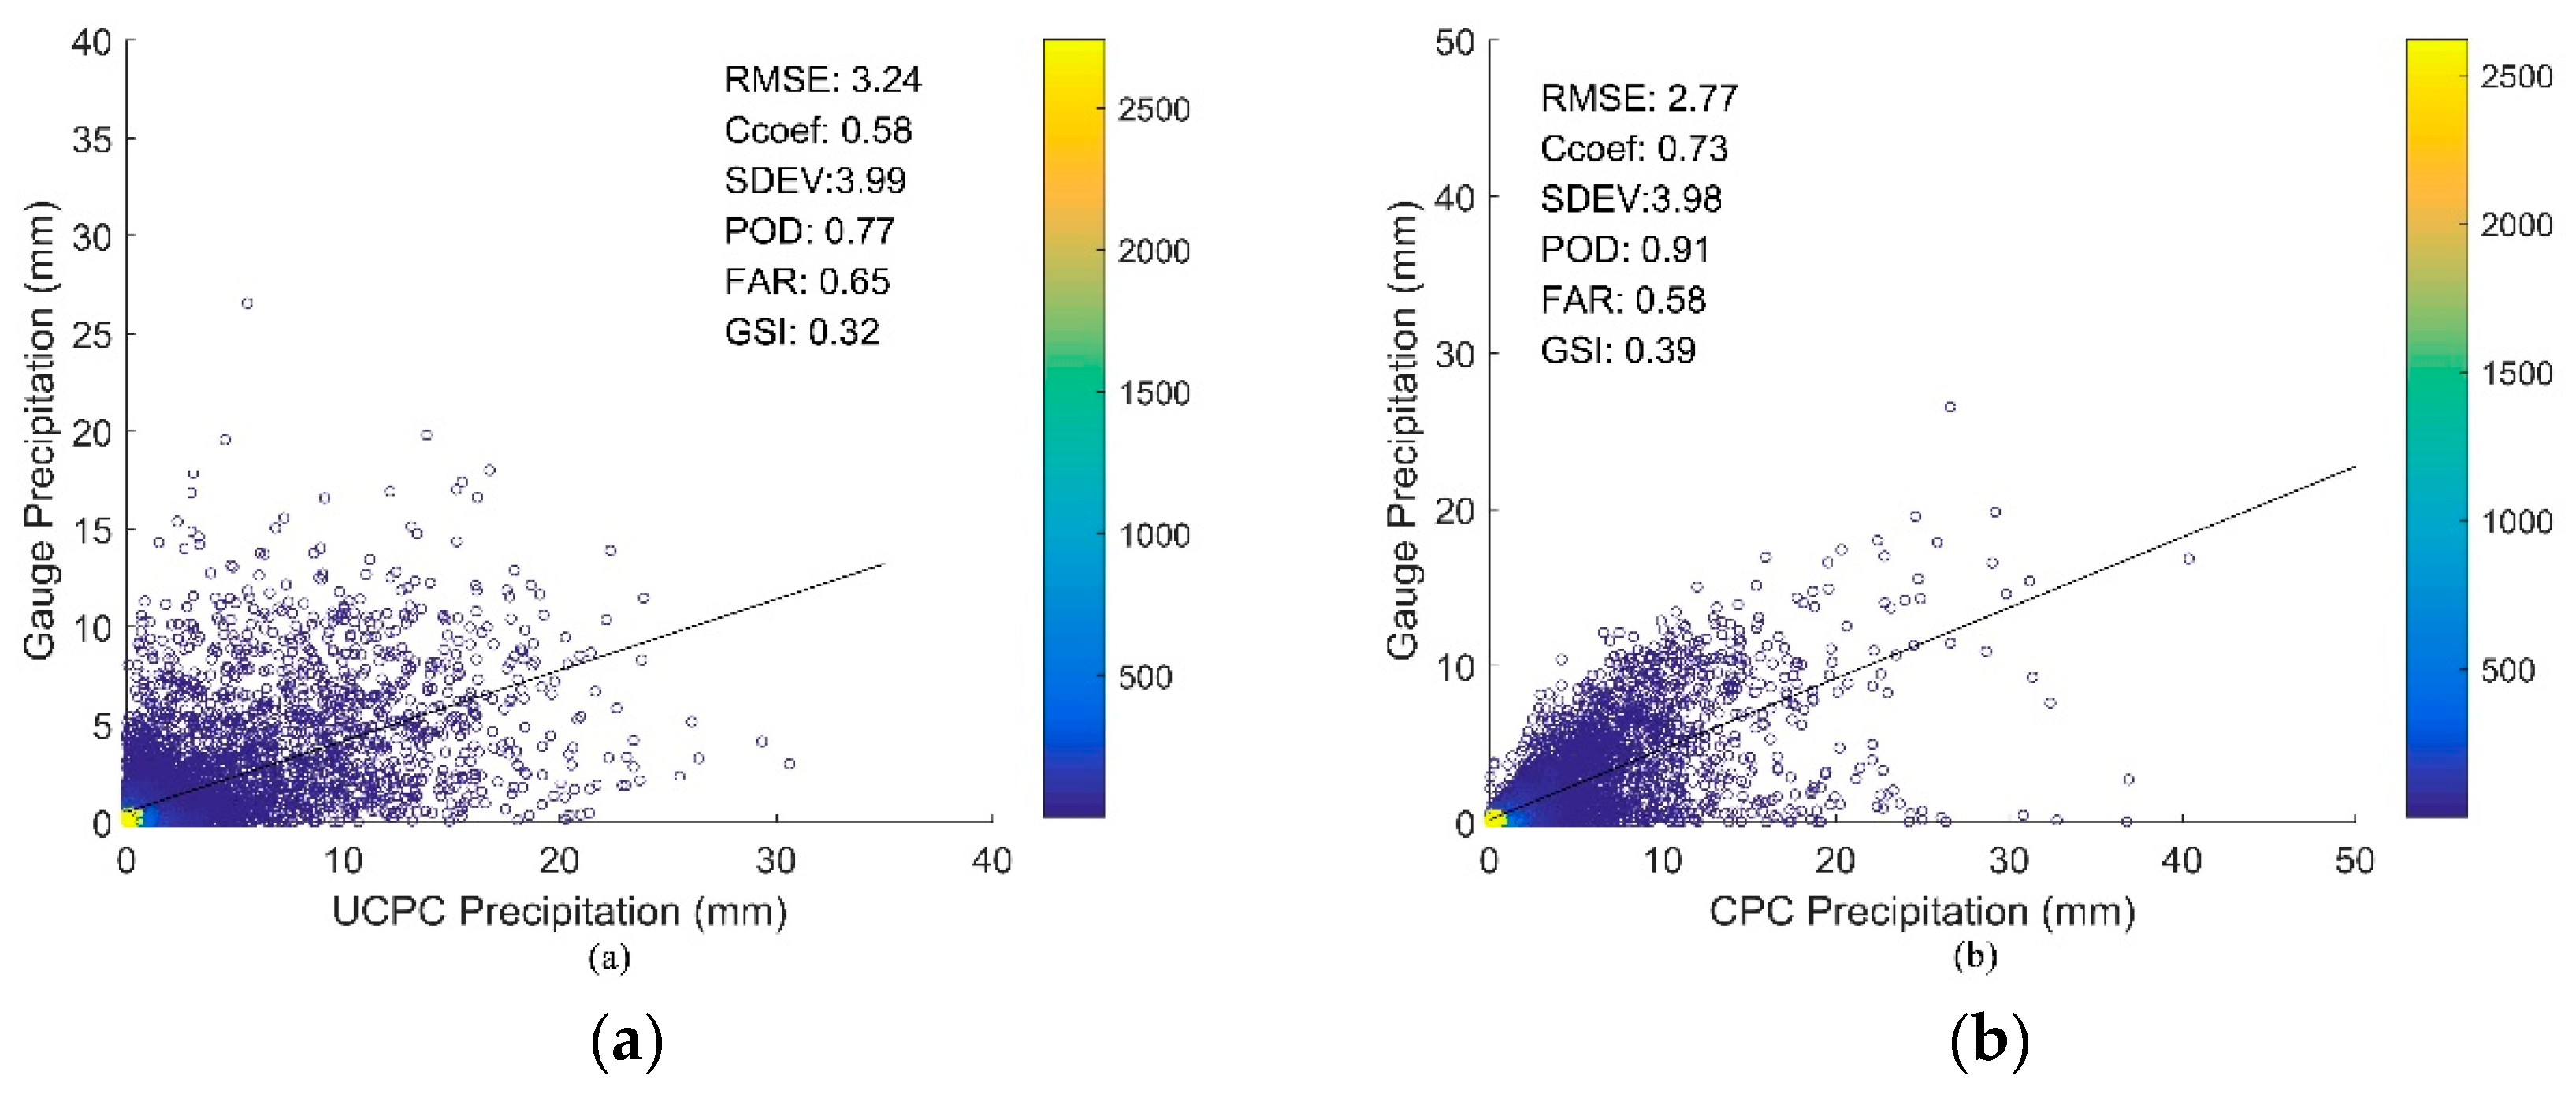
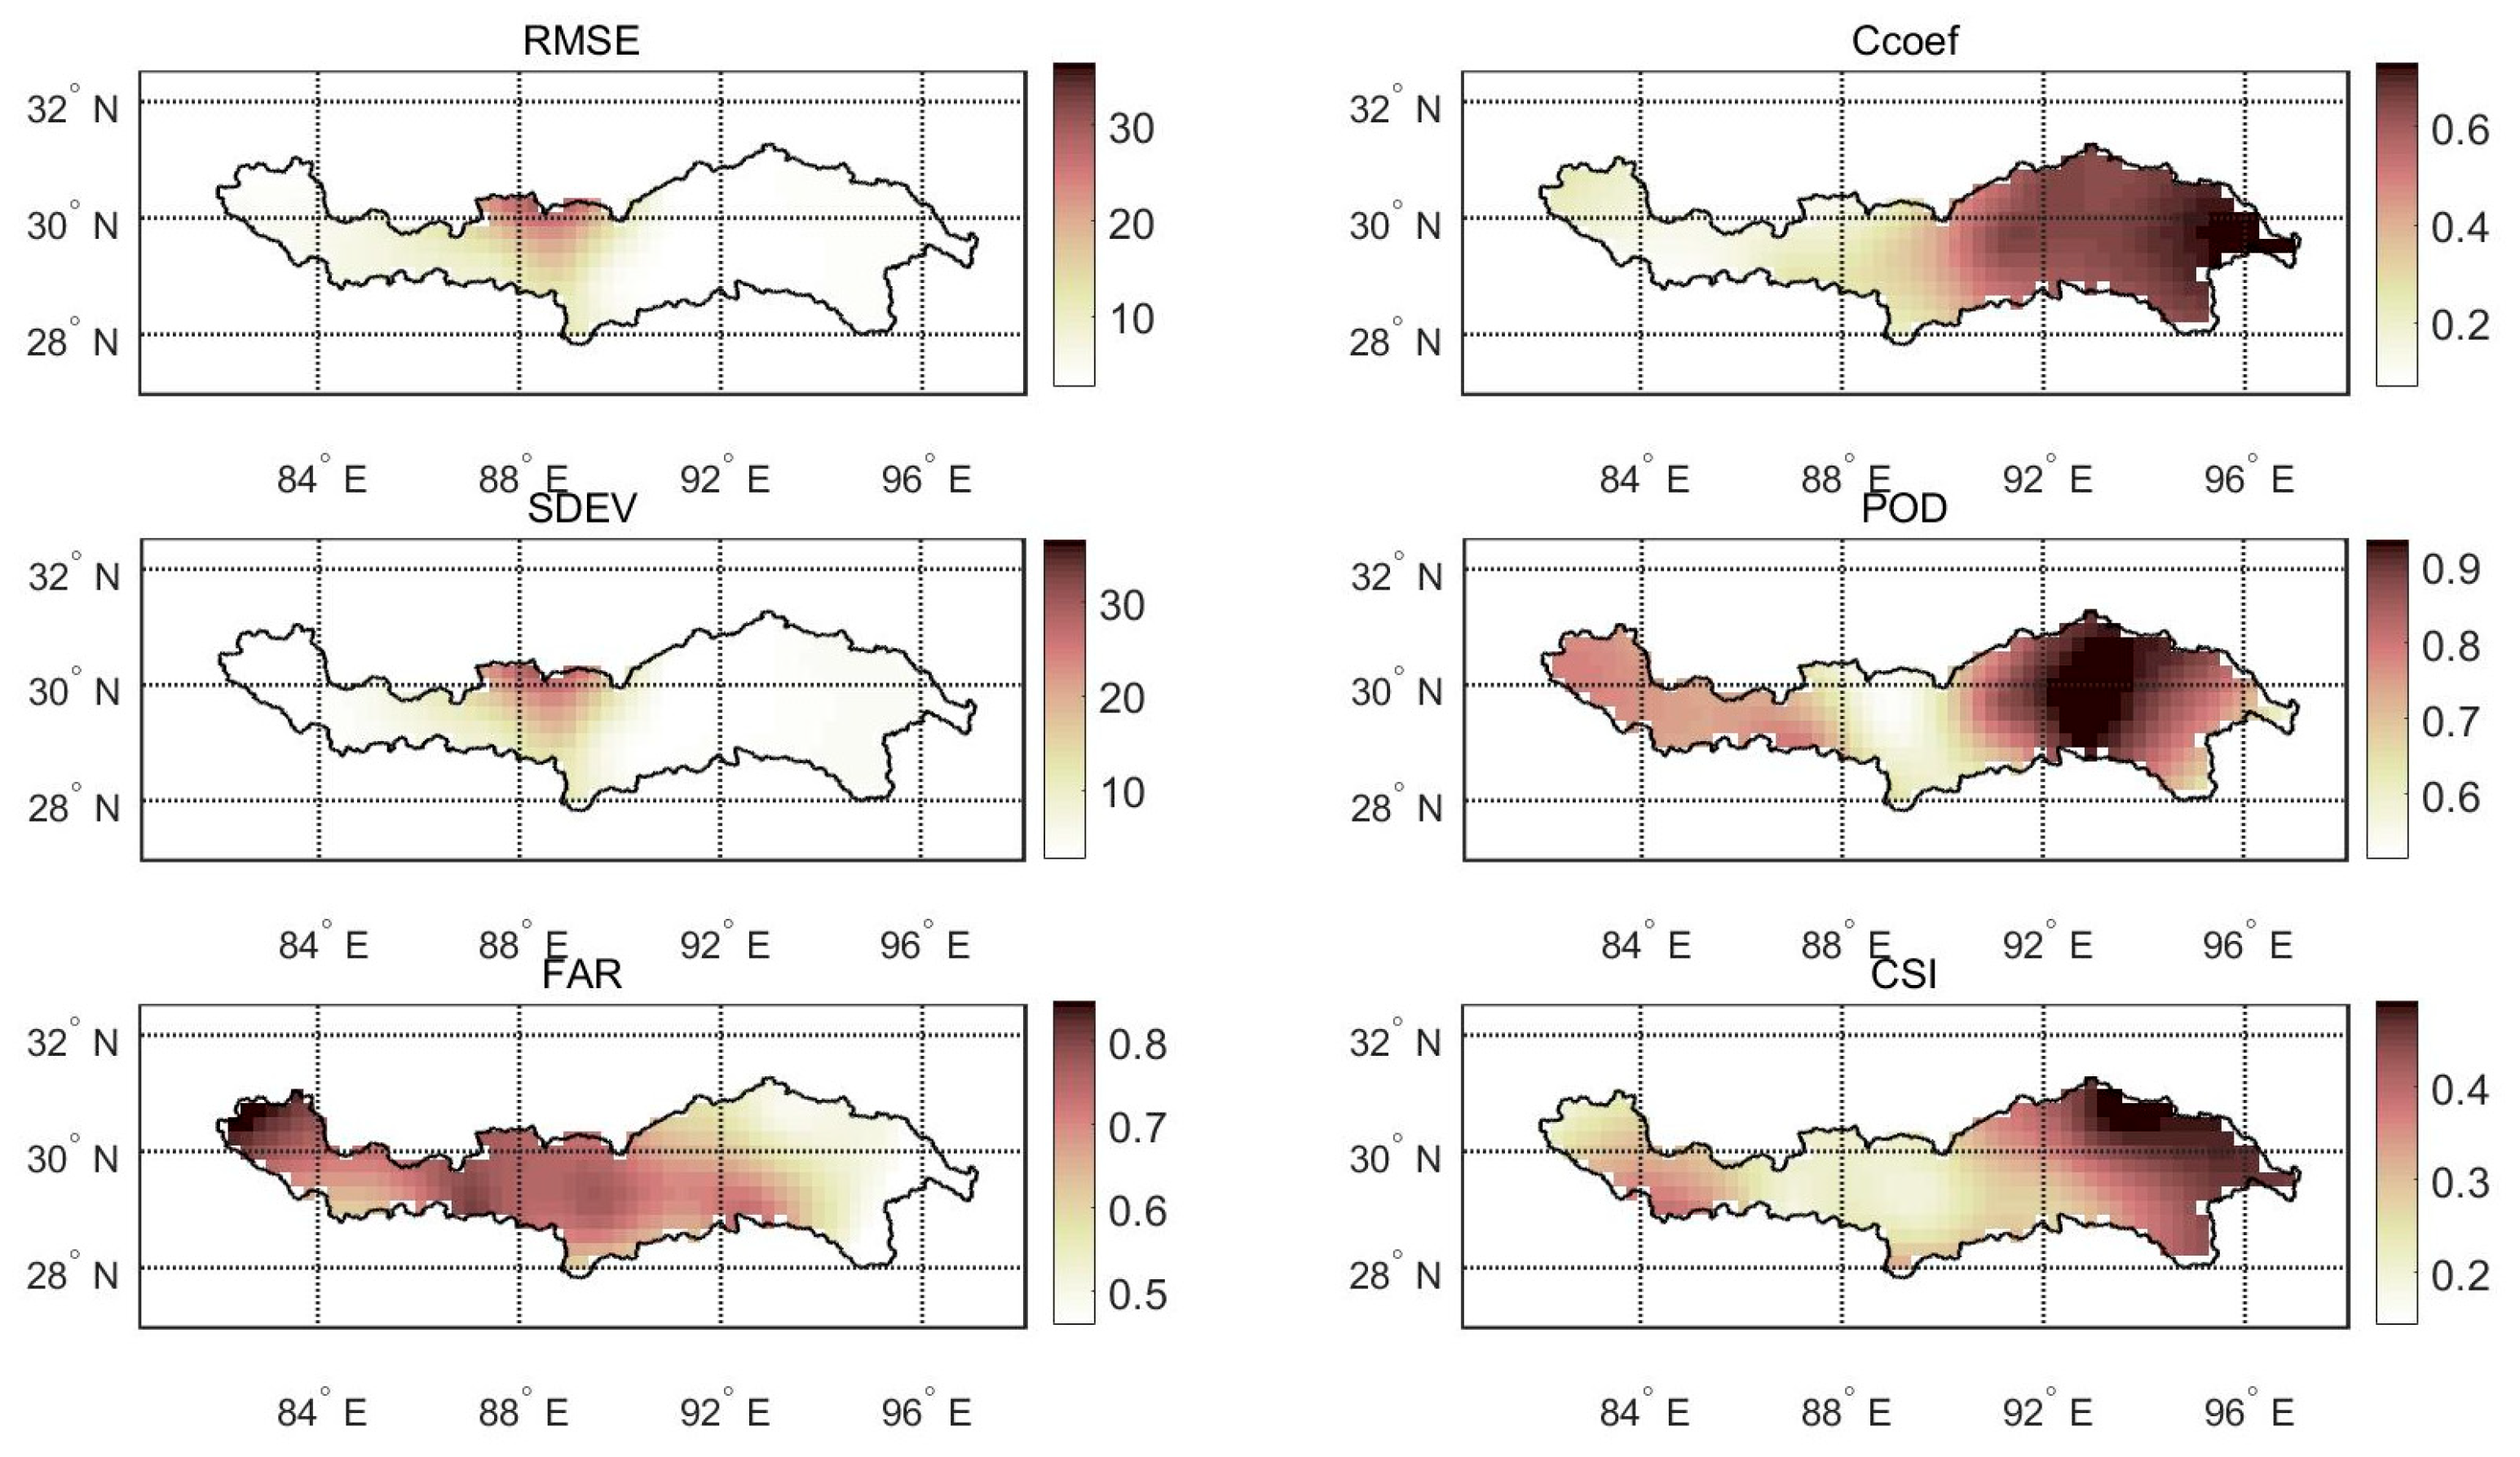
  • The precipitation satellite data corrected by the SC method using one step showed a clear improvement at the daily scale, as well as a notable bias range convergence. The Ccoef increased from 0.58 to 0.73, and the values of SDEV and RMSE declined. The CPC product data moved toward the direction of the fitting curve, especially in the case of light precipitation. The overestimation by satellite precipitation data of the gauged data was reduced. The POD value of the corrected SPE product was 18.2% higher than the uncorrected SPE product, which indicated that the capability of detecting precipitation events improved. The SC method mainly improved the accuracy of the SPE product in the central and western regions of the basin.
  • The temporal-spatial resolution influenced the performance of the SPE product in the Yarlung Zangbo River basin. When the temporal resolution changed from day to month and season, the values of statistical indices greatly improved, especially on the monthly scale. The SC method was not sensitive to the time scale, and the variations of the indices before and after correction on the monthly and seasonal scales were not obvious (except the variation of the correlation coefficient on the seasonal scale). With a change in the spatial resolution of the SPE data through downscaling and upscaling, only the corrected data were sensitive to the correlation coefficient. As the resolution became coarser, the correlation coefficient between the corrected SPE data and the ground station data gradually became lower.
  • The IHACRES Model was calibrated using the SCE-UA algorithm and could be satisfactorily applied in the Lhasa River basin. The NSE values for models driven by gauged, UCPC, and CPC data were 0.816, −1.673, and 0.702, respectively. The UCPC product provided poor runoff simulations, while the CPC product provided greatly improved runoff simulations. The corrected product data were sufficiently accurate to fit the trend of the debris flow disaster in the Lhasa river in mid-to-late July 2014, which plays a very important role in flood disaster monitoring and prevention.

Author Contributions

Conceptualization, J.L. and Z.X.; data curation, D.P.; formal analysis, J.L.; methodology, J.L. and Z.X.; visualization, M.R.; writing—original draft, J.L.; writing—review and editing, J.B.

Funding

This work was supported by the National Natural Science Foundation of China (91647202).

Acknowledgments

The authors extend their thanks to the Center for Hydrometeorology and Remote Sensing (CHRS) at the University of California, Irvine (UCI), for providing the PERSIANN-CDR data. The authors extend their thanks to Tarik Benkaci for providing the IHACRES rainfall runoff model. The authors wish to thank the China Meteorological Administration and the Tibet Autonomous Region Hydrology and Water Resources Survey for contributing their hydrological and meteorological data. The authors thank Paul Seward, PhD, from Liwen Bianji, Edanz Group China (www.liwenbianji.cn/ac), for editing the English text of a draft of this manuscript. The authors also thank American Journal Experts (https://www.aje.com/) for editing the revised version of this manuscript.

Conflicts of Interest

The manuscript has not been published elsewhere, and it has not been submitted simultaneously for publication elsewhere. We also have no conflicts of interest to disclose. All authors have seen and approved the manuscript and have contributed significantly to the paper.

Glossary

CcoefCorrelation Coefficient
CPCCorrected PERSIANN-CDR
GPCPGlobal Precipitation Climatology Project
SCSuccessive correction
SPESatellite-based precipitation estimate
HEHydrological evaluation
IHACRESIdentification of unit Hydrographs and Component flows from Rainfall, Evapotranspiration, and Streamflow data
IRInfrared
MWMicrowave
NSENash–Sutcliffe coefficient of efficiency
PBIASPercent bias
PERSIANN-CDRPrecipitation Estimation from Remotely Sensed Information using Artificial Neural Networks-Climate Data Record
RMSERoot mean square error
SDEVStandard deviation
UCPCUncorrected PERSIANN-CDR
VISVisible

References

  1. Xu, Z.X.; Takeuchi, K.; Ishidaira, H.; Li, J.Y. Long-term trend analysis for precipitation in Asian Pacific FRIEND river basins. Hydrol. Process. Int. J. 2005, 19, 3517–3532. [Google Scholar] [CrossRef]
  2. Xu, Z.X.; Gong, T.L.; Li, J.Y. Decadal trend of climate in the Tibetan Plateau—Regional temperature and precipitation. Hydrol. Process. Int. J. 2008, 22, 3056–3065. [Google Scholar] [CrossRef]
  3. Chen, C.; Chen, Q.; Duan, Z.; Zhang, J.; Mo, K.; Li, Z.; Tang, G. Multiscale comparative evaluation of the GPM IMERG v5 and TRMM 3B42 v7 precipitation products from 2015 to 2017 over a climate transition area of China. Remote Sens. 2018, 10, 944. [Google Scholar] [CrossRef]
  4. Satgé, F.; Xavier, A.; Pillco Zolá, R.; Hussain, Y.; Timouk, F.; Garnier, J.; Bonnet, M.-P. Comparative assessments of the latest GPM mission’s spatially enhanced satellite rainfall products over the main Bolivian watersheds. Remote Sens. 2017, 9, 369. [Google Scholar] [CrossRef]
  5. Souza, A.G.S.S.; Neto, A.R.; Rossato, L.; Alvalá, R.C.S.; Souza, L.L. Use of SMOS L3 soil moisture data: Validation and drought assessment for Pernambuco State, Northeast Brazil. Remote Sens. 2018, 10, 1314. [Google Scholar] [CrossRef]
  6. Su, J.; Lü, H.; Wang, J.; Sadeghi, A.M.; Zhu, Y. Evaluating the applicability of four latest satellite–gauge combined precipitation estimates for extreme precipitation and streamflow predictions over the upper Yellow River basins in China. Remote Sens. 2017, 9, 1176. [Google Scholar] [CrossRef]
  7. Bellerby, T.J.; Sun, J. Probabilistic and ensemble representations of the uncertainty in an IR/microwave satellite precipitation product. J. Hydrometeorol. 2005, 6, 1032–1044. [Google Scholar] [CrossRef]
  8. Bitew, M.M.; Gebremichael, M. Assessment of satellite rainfall products for streamflow simulation in medium watersheds of the Ethiopian highlands. Hydrol. Earth Syst. Sci. 2011, 15, 1147–1155. [Google Scholar] [CrossRef] [Green Version]
  9. Bitew, M.M.; Gebremichael, M. Evaluation of satellite rainfall products through hydrologic simulation in a fully distributed hydrologic model. Water Resour. Res. 2011, 47, 1–11. [Google Scholar] [CrossRef]
  10. Benjamin, S.O.; Seaman, N.L. A simple scheme for objective analysis in curved flow. Mon. Weather Rev. 1985, 113, 1184–1198. [Google Scholar] [CrossRef]
  11. Behrangi, A.; Khakbaz, B.; Jaw, T.C.; AghaKouchak, A.; Hsu, K.; Sorooshian, S. Hydrologic evaluation of satellite precipitation products over a mid-size basin. J. Hydrol. 2011, 397, 225–237. [Google Scholar] [CrossRef]
  12. Tong, K.; Su, F.; Yang, D.; Hao, Z. Evaluation of satellite precipitation retrievals and their potential utilities in hydrologic modeling over the Tibetan Plateau. J. Hydrol. 2014, 519, 423–437. [Google Scholar] [CrossRef]
  13. Hou, A.Y.; Kakar, R.K.; Neeck, S.; Azarbarzin, A.A.; Kummerow, C.D.; Kojima, M.; Oki, R.; Nakamura, K.; Iguchi, T. The global precipitation measurement mission. Bull. Am. Meteorol. Soc. 2014, 95, 701–722. [Google Scholar] [CrossRef]
  14. Ma, Y.; Yang, Y.; Han, Z.; Tang, G.; Maguire, L.; Chu, Z.; Hong, Y. Comprehensive evaluation of ensemble multi-satellite precipitation dataset using the dynamic bayesian model averaging scheme over the Tibetan Plateau. J. Hydrol. 2018, 556, 634–644. [Google Scholar] [CrossRef]
  15. Huffman, G.J.; Bolvin, D.T.; Nelkin, E.J.; Wolff, D.B.; Adler, R.F.; Gu, G.; Hong, Y.; Bowman, K.P.; Stocker, E.F. The TRMM multisatellite precipitation analysis (TMPA): Quasi-global, multiyear, combined-sensor precipitation estimates at fine scales. J. Hydrometeorol. 2007, 8, 38–55. [Google Scholar] [CrossRef]
  16. Funk, C.; Peterson, P.; Landsfeld, M.; Pedreros, D.; Verdin, J.; Shukla, S.; Husak, G.; Rowland, J.; Harrison, L.; Hoell, A.; et al. The climate hazards infrared precipitation with stations—A new environmental record for monitoring extremes. Sci. Data 2015, 2, 150066. [Google Scholar] [CrossRef] [PubMed]
  17. Omranian, E.; Sharif, H.O. Evaluation of the global precipitation measurement (GPM) satellite rainfall products over the lower Colorado River basin, Texas. J. Am. Water Resour. Assoc. 2018, 54, 882–898. [Google Scholar] [CrossRef]
  18. Sorooshian, S.; Hsu, K.L.; Gao, X.; Gupta, H.V.; Imam, B.; Braithwaite, D. Evaluation of PERSIANN system satellite-based estimates of tropical rainfall. Bull. Am. Meteorol. Soc. 2000, 81, 2035–2046. [Google Scholar] [CrossRef]
  19. Ashouri, H.; Hsu, K.L.; Sorooshian, S.; Braithwaite, D.K.; Knapp, K.R.; Cecil, L.D.; Nelson, B.R.; Prat, O.P. PERSIANN-CDR: Daily precipitation climate data record from multisatellite observations for hydrological and climate studies. Bull. Am. Meteorol. Soc. 2015, 96, 69–83. [Google Scholar] [CrossRef]
  20. Jiang, S.; Ren, L.; Hong, Y.; Yong, B.; Yang, X.; Yuan, F.; Ma, M. Comprehensive evaluation of multi-satellite precipitation products with a dense rain gauge network and optimally merging their simulated hydrological flows using the Bayesian model averaging method. J. Hydrol. 2012, 452, 213–225. [Google Scholar] [CrossRef]
  21. Hirpa, F.A.; Mekonnen, G.; Hopson, T. Evaluation of high-resolution satellite precipitation products over very complex terrain in Ethiopia. J. Appl. Meteorol. Climatol. 2010, 49, 1044–1051. [Google Scholar] [CrossRef]
  22. Chen, M.; Xie, P.; Janowiak, J.E.; Arkin, P.A. Global land precipitation: A 50-yr monthly analysis based on gauge observations. J. Hydrometeorol. 2002, 3, 249–266. [Google Scholar] [CrossRef]
  23. Terink, W.; Hurkmans, R.T.W.L.; Torfs, P.J.J.F.; Uijlenhoet, R. Evaluation of a bias correction method applied to downscaled precipitation and temperature reanalysis data for the Rhine basin. Hydrol. Earth Syst. Sci. 2010, 14, 687–703. [Google Scholar] [CrossRef] [Green Version]
  24. Habib, E.; Haile, A.T.; Sazib, N.; Zhang, Y.; Rientjes, T. Effect of bias correction of satellite-rainfall estimates on runoff simulations at the source of the upper Blue Nile. Remote Sens. 2014, 6, 6688–6708. [Google Scholar] [CrossRef]
  25. Bhatti, H.A.; Rientjes, T.; Haile, A.T.; Habib, E.; Verhoef, W. Evaluation of bias correction method for satellite-based rainfall data. Sensors 2016, 16, 884. [Google Scholar] [CrossRef] [PubMed]
  26. Worqlul, A.W.; Ayana, E.K.; Maathuis, B.H.; MacAlister, C.; Philpot, W.D.; Leyton, J.M.O.; Steenhuis, T.S. Performance of bias corrected MPEG rainfall estimate for rainfall-runoff simulation in the upper Blue Nile Basin, Ethiopia. J. Hydrol. 2018, 556, 1182–1191. [Google Scholar] [CrossRef]
  27. Poméon, T.; Jackisch, D.; Diekkrüger, B. Evaluating the performance of remotely sensed and reanalysed precipitation data over West Africa using HBV light. J. Hydrol. 2017, 547, 222–235. [Google Scholar] [CrossRef]
  28. Thiemig, V.; Rojas, R.; Zambrano-Bigiarini, M.; De Roo, A. Hydrological evaluation of satellite-based rainfall estimates over the Volta and Baro-Akobo basin. J. Hydrol. 2013, 499, 324–338. [Google Scholar] [CrossRef]
  29. Jakeman, A.J.; Littlewood, I.G.; Whitehead, P.G. Computation of the instantaneous unit hydrograph and identifiable component flows with application to two small upland catchments. J. Hydrol. 1990, 117, 275–300. [Google Scholar] [CrossRef]
  30. Dye, P.J.; Croke, B.F. Evaluation of streamflow predictions by the IHACRES rainfall-runoff model in two South African catchments. Environ. Model. Softw. 2003, 18, 705–712. [Google Scholar] [CrossRef]
  31. Oyerinde, G.T.; Hountondji, F.C.; Lawin, A.E.; Odofin, A.J.; Afouda, A.; Diekkrüger, B. Improving hydro-climatic projections with bias-correction in Sahelian Niger basin, West Africa. Climate 2017, 5, 8. [Google Scholar] [CrossRef]
  32. Liu, G.; He, Z.; Luan, Z.; Qi, S. Intercomparison of a lumped model and a distributed model for streamflow simulation in the Naoli River watershed, Northeast China. Water 2018, 10, 1004. [Google Scholar] [CrossRef]
  33. AghaKouchak, A.; Mehran, A. Extended contingency table: Performance metrics for satellite observations and climate model simulations. Water Resour. Res. 2013, 49, 7144–7149. [Google Scholar] [CrossRef]
  34. Duan, Q.Y.; Gupta, V.K.; Sorooshian, S. Shuffled complex evolution approach for effective and efficient global minimization. J. Optim. Theory Appl. 1993, 76, 501–521. [Google Scholar] [CrossRef]
  35. Chu, W.; Gao, X.; Sorooshian, S. A new evolutionary search strategy for global optimization of high-dimensional problems. Inf. Sci. 2011, 181, 4909–4927. [Google Scholar] [CrossRef]
  36. Perrin, C. Vers Une Amélioration d’un Modèle Global Pluie-Débit au Travers d’une Approche Comparative. Ph.D. Thesis, Institut National Polytechnique De Grenoble, Grenoble, France, October 2000; 530p. [Google Scholar]
  37. Nash, J.E.; Sutcliffe, J.V. River flow forecasting through conceptual models part I—A discussion of principles. J. Hydrol. 1970, 10, 282–290. [Google Scholar] [CrossRef]
  38. Moriasi, D.N.; Arnold, J.G.; Van Liew, M.W.; Bingner, R.L.; Harmel, R.D.; Veith, T.L. Model evaluation guidelines for systematic quantification of accuracy in watershed simulations. Trans. ASABE 2007, 50, 885–900. [Google Scholar] [CrossRef]
  39. Taylor, K.E. Summarizing multiple aspects of model performance in a single diagram. J. Geophys. Res.-Atmos. 2001, 106, 7183–7192. [Google Scholar] [CrossRef] [Green Version]
  40. Omranian, E.; Sharif, H.; Tavakoly, A. How well can global precipitation measurement (GPM) capture hurricanes? Case study: Hurricane Harvey. Remote Sens. 2018, 10, 1150. [Google Scholar] [CrossRef]
Figure 1. Map of the Yarlung Zangbo River basin. The green stars represent meteorological gauges inside the basin.
Remotesensing 10 02031 g001
Figure 2. Identification of unit Hydrographs and Component flows from Rainfall, Evapotranspiration, and Streamflow (IHACRES) model structure [36].
Remotesensing 10 02031 g002
Figure 3. Taylor diagram illustrating statistical indicators relating the corrected Precipitation Estimation from Remotely Sensed Information using Artificial Neural Networks (PERSIANN)-Climate Data Record (CDR) (CPC) and gauged data at a daily scale. The azimuth angle represents the correlation coefficient, the radial distance represents the standard deviation of the precipitation time series (mm/day), and the dotted line represents the RMSE (mm/day).
Remotesensing 10 02031 g003
Figure 4. Spatial patterns for statistical indices between the gauge observations and the uncorrected SPE product.
Remotesensing 10 02031 g004
Figure 5. Scatter density diagram for the (a) uncorrected (U)CPC, and (b) CPC. The navy blue to yellow colors of the scatter points indicate the number of occurrences of precipitation events from low to high.
Remotesensing 10 02031 g005
Figure 6. Spatial patterns for statistical indices between gauge observations and the corrected SPE product.
Remotesensing 10 02031 g006
Figure 7. Observed and simulated daily hydrographs for validation purposes using (a) gauged data, (b) UCPC data, and (c) CPC.
Remotesensing 10 02031 g007
Figure 8. Observed and simulated daily hydrographs for the Lhasa River using gauged data, UCPC data, and CPC.
Remotesensing 10 02031 g008
Table 1. Station IDs and names used in this study.
IDStationIDStation
S1GyangzS6Nyingchi
S2LhatseS7Lhasa
S3ShigatseS8Bome
S4ZetangS9Dangxiong
S5NimuS10Lhari
Table 2. Statistical indices used in evaluating the performance of the satellite-based precipitation estimate (SPE) product.
IndicesFormulaRangePerfect Value
Cagegory1 (Basic Statistical Indices)
Correlation coefficient (Ccoef) C c o e f = i = 1 n ( S I M i S I M ¯ ) ( O B S i O B S ¯ ) i = 1 n ( S I M i S I M ¯ ) 2 · i = 1 n ( O B S i O B S ¯ ) 2 −1~11
Root mean square error (RMSE) R M S E = 1 n i = 1 n ( S I M i O B S i ) 2 0~∞0
Standard deviation (SDEV) S D E V = 1 n 1 i = 1 n ( S I M i S I M ¯ ) 2 0~∞0
Category2 (Probabilistic Statistical Indices)
Probability of detection (POD) P O D = h i t _ n u m h i t _ n u m + m i s s _ n u m 0~11
False alarm ration (FAR) F A R = f a l s e _ n u m f a l s e _ n u m + h i t _ n u m 0~10
Critical success index (CSI) C S I = h i t _ n u m h i t _ n u m + m i s s _ n u m + f a l s e _ n u m 0~11
Table 3. PERSIANN-CDR satellite precipitation data correction results.
SDEV (mm)CcoefRMSE (mm)
UCPC3.990.583.24
Step 13.980.732.77
Step 216.160.3515.46
Step 3174.190.26173.56
Table 4. The values of statistical indices for four temporal resolutions.
Spatial ResolutionRMSE (mm)CcoefSDEV (mm)PODFARCSI
UCPC0.153.240.594.000.840.660.32
0.253.240.583.990.770.650.32
0.353.240.593.990.860.660.32
0.453.240.594.000.870.660.32
CPC0.153.710.705.020.930.600.39
0.252.770.733.980.910.580.39
0.355.140.646.370.950.610.38
0.459.220.5410.310.960.620.37

