Article

Rapid Invasion of Spartina alterniflora in the Coastal Zone of Mainland China: New Observations from Landsat OLI Images

1
Key Laboratory of Wetland Ecology and Environment, Northeast Institute of Geography and Agroecology, Chinese Academy of Sciences, Changchun 130102, China
2
College of Mining Engineering, North China University of Science and Technology, Tangshan 063210, China
3
Department of Earth Sciences, Indiana University-Purdue University, Indianapolis, IN 46202, USA
4
Chinese University of Hong Kong, Center for Housing Innovations, Shatin, New Territories, Hong Kong, China
5
Chinese Academy of Sciences, Key Lab of Lunar Science and Deep-exploration, National Astronomical Observatories, Beijing 100101, China
*
Authors to whom correspondence should be addressed.
Remote Sens. 2018, 10(12), 1933; https://doi.org/10.3390/rs10121933
Submission received: 1 November 2018 / Revised: 23 November 2018 / Accepted: 28 November 2018 / Published: 1 December 2018

Abstract

:
Plant invasion imposes significant threats to biodiversity and ecosystem function. Thus, monitoring the spatial pattern of invasive plants is vital for effective ecosystem management. Spartina alterniflora (S. alterniflora) has been one of the most prevalent invasive plants along the China coast, and its spread has had severe ecological consequences. Here, we provide new observation from Landsat operational land imager (OLI) images. Specifically, 43 Landsat-8 OLI images from 2014 to 2016, a combination of object-based image analysis (OBIA) and support vector machine (SVM) methods, and field surveys covering the whole coast were used to construct an up-to-date dataset for 2015 and investigate the spatial variability of S. alterniflora in the coastal zone of mainland China. The classification results achieved good estimation, with a kappa coefficient of 0.86 and 96% overall accuracy. Our results revealed that there was approximately 545.80 km2 of S. alterniflora distributed in the coastal zone of mainland China in 2015, from Hebei to Guangxi provinces. Nearly 92% of the total area of S. alterniflora was distributed within four provinces: Jiangsu, Shanghai, Zhejiang, and Fujian. Seven national nature reserves invaded by S. alterniflora encompassed approximately one-third (174.35 km2) of the total area of S. alterniflora over mainland China. The Yancheng National Nature Reserve exhibited the largest area of S. alterniflora (115.62 km2) among the reserves. Given the rapid and extensive expansion of S. alterniflora in the 40 years since its introduction and its various ecological effects, geospatially varied responding decisions are needed to promote sustainable coastal ecosystems.

Graphical Abstract

1. Introduction

Plant invasion, as an important type of biological invasion, has emerged as a serious ecological issue, which threatens native species and affects the structure and function of ecosystems [1,2,3,4]. In coastal zones, widespread invasive plants have strong impacts on biogeochemical cycles and thus have severe environmental consequences [5,6,7]. Thus, particular attention to the invasive plants in coastal area is necessary to ensure ecological security and maintain sustainable ecosystems.
Spartina alterniflora (S. alterniflora) has been categorized as one of the most serious invasive plants by the State Environmental Protection Administration of China. The invasion of this exotic species has had vast negative consequences, including threatening native wetland plants and waterfowls, and imposing negative effects on fishing, water transportation, mariculture activities, and tourism development [8,9,10]. S. alterniflora was first introduced from the Atlantic coast of the United States (U.S.) to China in 1979 for the purpose of tidal land reclamation, seashore stabilization, and saline soil amelioration [10,11,12]. Previous studies have documented that the area of invasive S. alterniflora in coastal China exceeds that of mangroves [12,13,14]. China has been the largest country invaded by exotic S. alterniflora. Although S. alterniflora has great potential for carbon sequestration and biofuel due to its high productivity and strong adaptability [10,15], the sustainable management of China’s coastal zone requires the acquisition of additional quantitative data to effectively respond to the expansion of S. alterniflora and its consequences. In particular, the up-to-date spatial information of S. alterniflora at the national scale, 40 years since its introduction, is necessary for coastal ecosystem conservation and economic development.
Remote sensing has been identified as an effective tool for detecting invasive plants [16,17,18,19]. The selection of a suitable data source and a classification method is commonly case-specific and largely depends on the target plant and research goals [20,21]. For example, synoptic aerial photographs from 1945 to 2000 were used to characterize the spatiotemporal patterns of S. alterniflora in Willapa Bay in the U.S. [22]. High/ultra-high spatial resolution images, such as SPOT 6 and unmanned aerial vehicle (UAV) images, were used to obtain detailed distributions of S. alterniflora in China’s Yueqing Bay [11] and Beihai city [23], respectively. Freely available Google Earth images with high spatial resolution were employed to identify S. alterniflora invasion to mangroves in Zhangjiang Estuary [24]. Generally, satellite images with moderate spatial resolution, such as Landsat and China–Brazil Earth Resource Satellite (CBERS) images, are suitable data sources for mapping the distribution of invasive S. alterniflora at large scales [10,12,25]. Compared to the currently accessible data sources, the newly launched Landsat 8, which carries the operational land imager (OLI) sensor, provides more easy-to-access, high-quality images due to its intensive image acquisition capability and improved duty cycle [26]. Thus, Landsat 8 allows the possibility of mapping the distribution of S. alterniflora along the 18,000 km of China’s coast [27] for a specific time period. Moreover, an increasing number of studies have adopted object-based image analysis (OBIA) to identify S. alterniflora [23,24,28,29], and the OBIA and support vector machine (SVM) have been proven promising for mapping the invasion of S. alterniflora [11]. These data source and image classification method developments could greatly contribute to updating the invasion information of S. alterniflora.
In mainland China, most of the previous studies of S. alterniflora invasion have focused on local regions, and thus failed to update the spatial distribution S. alterniflora in a timely manner, even though this information is critical for supporting land management, protecting important habitats of endangered species, and ensuring ecological security in response to global change. The resulting information deficiency has limited decision-making regarding the sustainable ecosystem management of coastal wetlands and the socioeconomic development of coastal cities. To address this deficiency, this study aimed to provide a new observation using Landsat OLI images and the integration of OBIA and SVM. Specifically, this study mapped the up-to-date distribution of S. alterniflora at the national scale, and documented the spatial variation in invasion status. The finding in this study could provide important quantified areal data for the ecological studies of S. alterniflora, and is also a baseline dataset for documenting the spatiotemporal dynamics of S. alterniflora invasion.

2. Materials and Methods
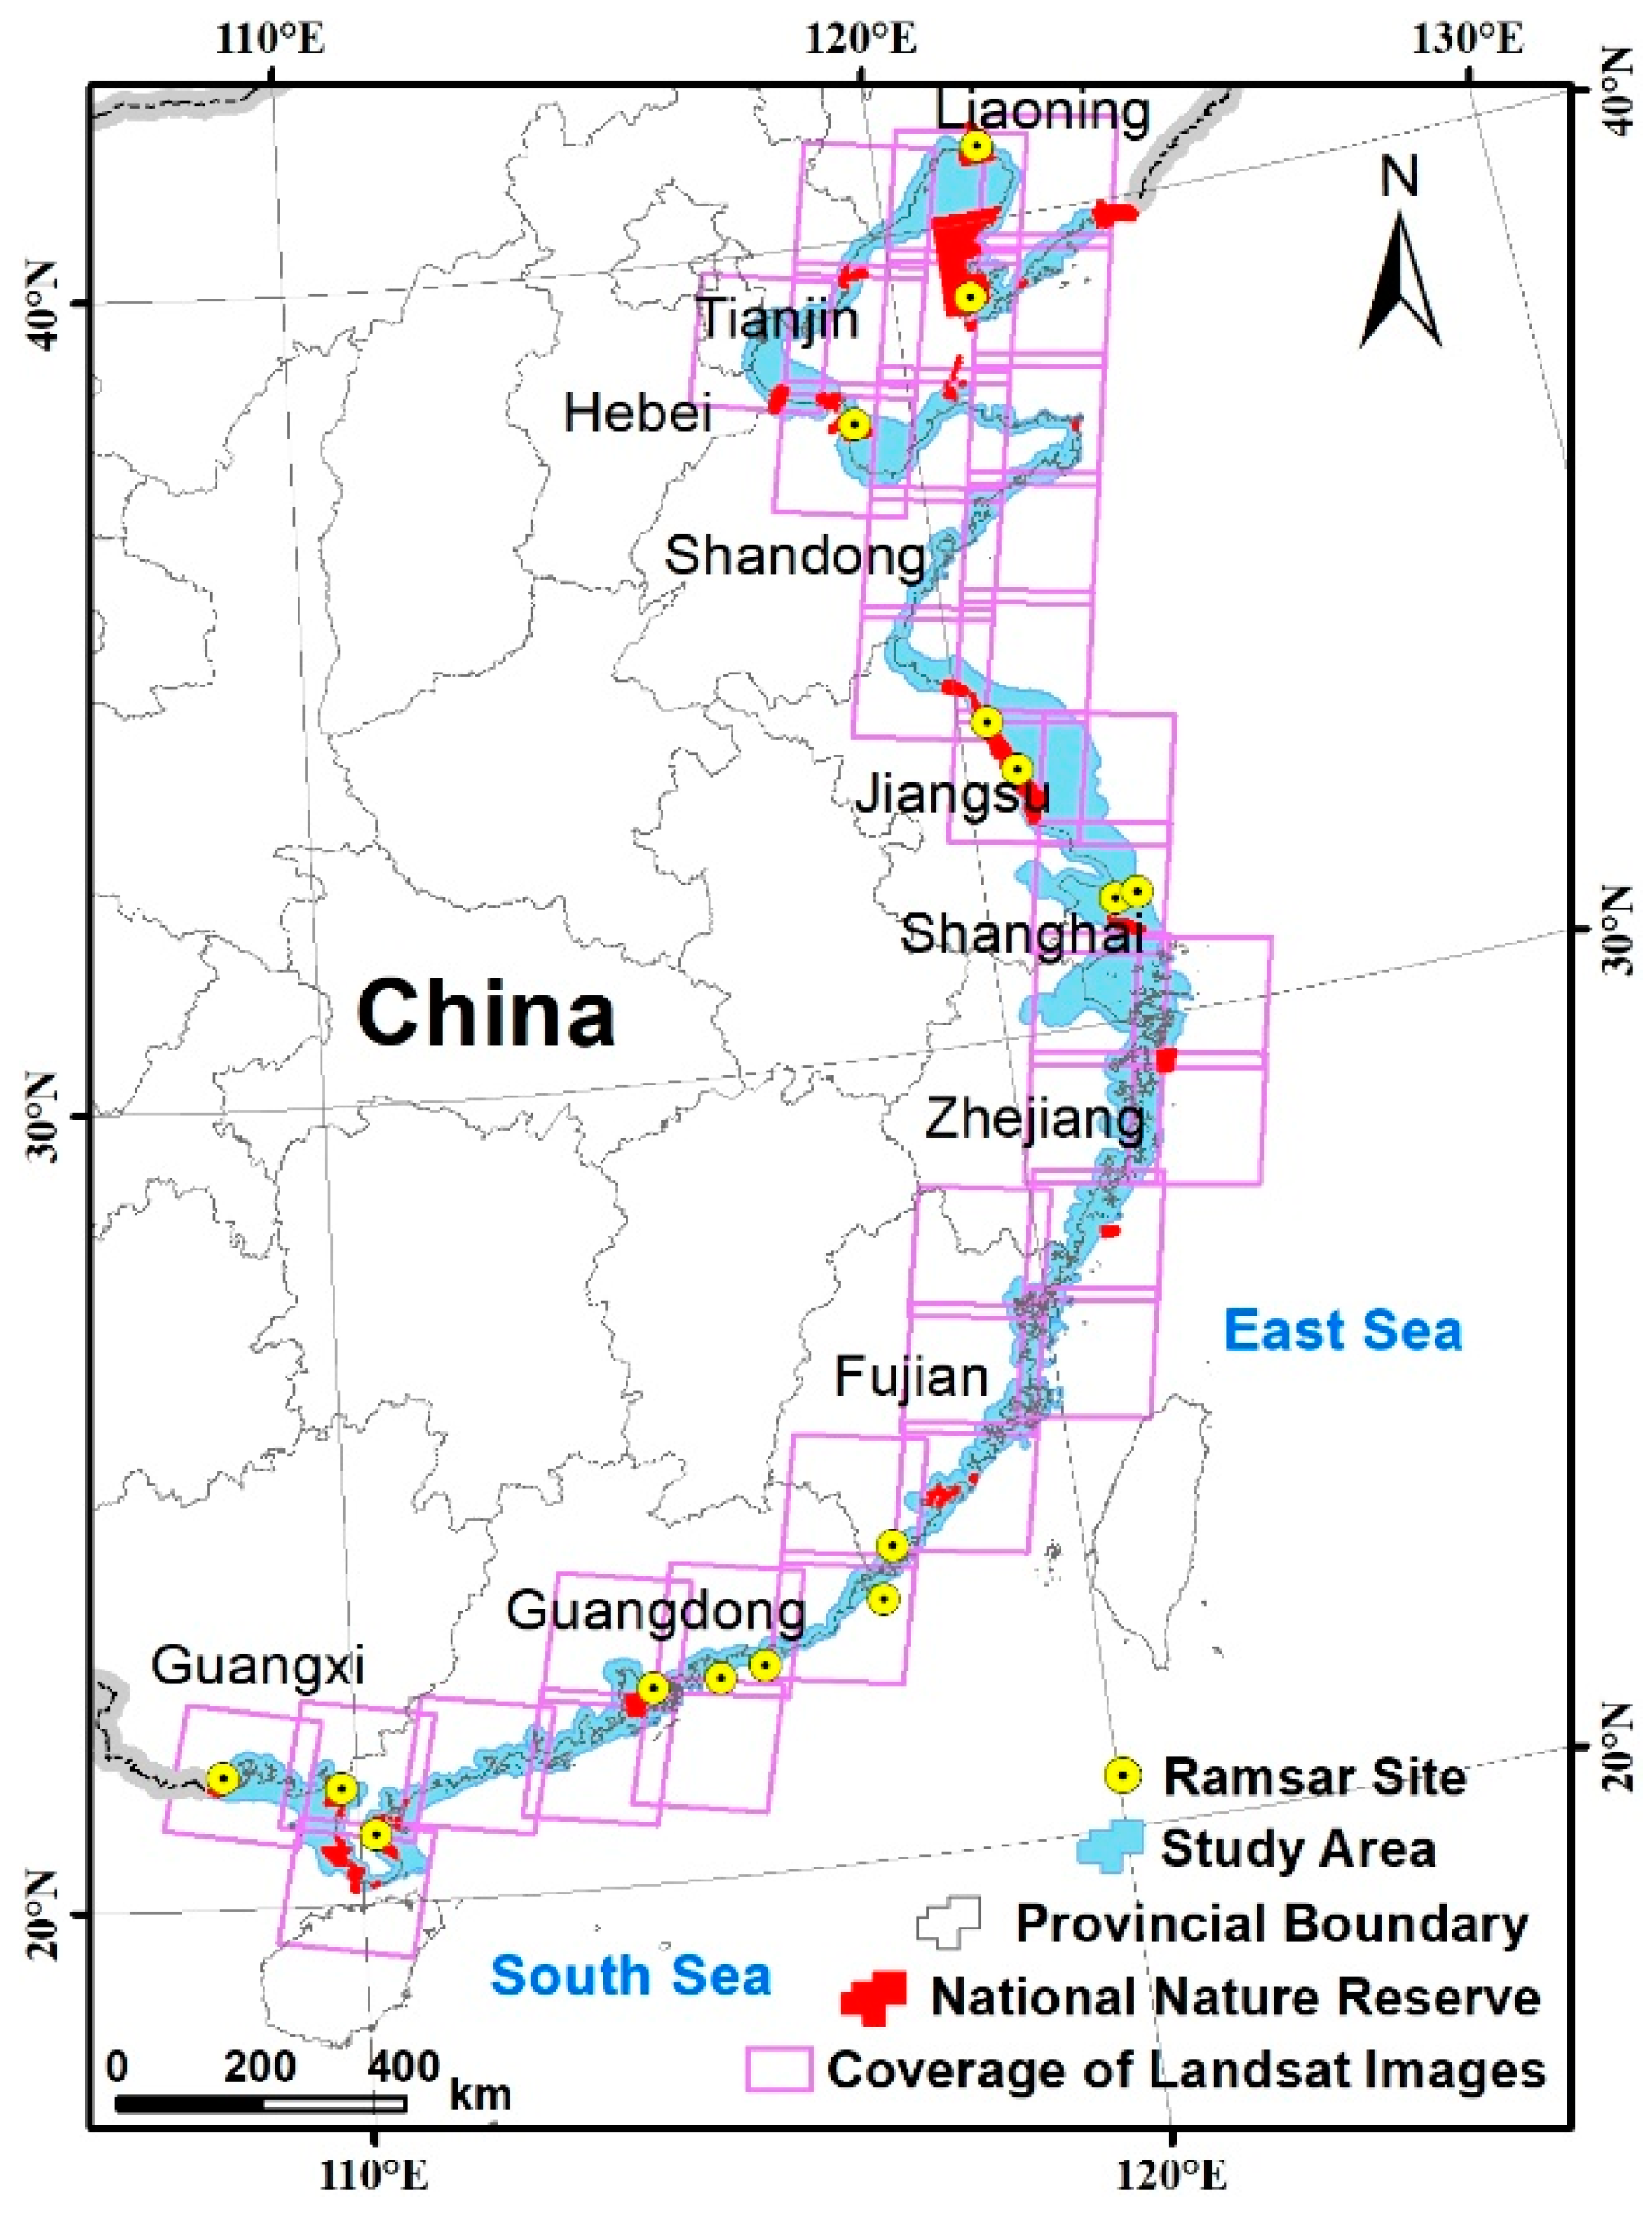
2.1. Study Area

Considering the ecological niche of S. alterniflora and the common definition of coastal zone in China, we defined the contiguous region extending from the landward 10-km buffer line of the coastline over mainland China to the first continuous contour of 15-m water depth, which was derived from the global relied model, as the study area. The study area is located in the coastal zone of mainland China (Figure 1), which spans 10 provinces (Liaoning, Hebei, Tianjin, Shandong, Jiangsu, Shanghai, Zhejiang, Fujian, Guangdong, and Guangxi). This zone covers the warm temperate zone, subtropical zone, and tropical zone from north to south. Wetland is the dominant ecosystem type, while the common wetland plants include Phragmites australis, S. alterniflora, Suaeda salsa, Tamarix chinensis, Scirpus mariquete, Cyperus malaccensis, and mangrove forests. S. alterniflora grows widely in the intertidal zone, and tends to spread parallel to and continuous along shorelines. This alien species can colonize a variety of substrates, ranging from sand and silt to loose cobbles, clay, and gravel.

2.2. Data and Preprocessing

2.2.1. Landsat Imagery

In this study, 43 scenes of Landsat 8 OLI images from 2014 to 2016 were selected to delineate S. alterniflora in the coastal zone of mainland China. These images were downloaded from the United States Geological Survey (USGS, https://glovis.usgs.gov/). An optimal acquisition time is important to accurately discriminate S. alterniflora from other salt marsh plants. For this study, OLI images were selected by considering the phenological divergence of local species. Generally, vegetation in the peak growing period may show significant spectral similarity. Therefore, OLI images acquired in the spring and autumn are generally preferred to use for S. alterniflora identification in the northern provinces, whereas those in early spring and winter are used for identification in the southern provinces [10,30,31]. Multiple scenes of images were also used to enhance the separation of S. alterniflora from other species by considering the phenological stages and tidal level. A total of 33 scenes of Landsat images could cover the whole study area. We used an additional 10 images to support the image classification. For example, the images in spring or autumn could be used for separating the S. alterniflora from mangrove, because the mangrove is an evergreen species.

2.2.2. DEM and ETOPO 1 Data

Digital elevation model (DEM) tiles derived from the Advanced Spaceborne Thermal Emission and Reflection Radiometer Global DEM version2 (ASTER GDEM v2) at approximately 30-m resolution were downloaded from the USGS site. ETOPO1 is a one arc-minute global relief model of the Earth’s surface that integrates land topography and ocean bathymetry, which was obtained from the National Oceanic and Atmospheric Administration (NOAA, http://dx.doi.org/10.7289/V5C8276M).

2.2.3. National Nature Reserves

For protecting coastal wetland ecosystems and endangered animals, to date, 15 wetland sites with international importance (Ramsar sites) and 32 national nature reserves (NNRs) have been established in the coastal zone of mainland China (Figure 1). In this study, the NNR boundary dataset was obtained to document the invasive status in NNRs and compare the difference among the different functional zones (core zone, buffer zone, and experimental zone) of NNRs. Based on the administrative regulations of national nature reserves in China, the experimental zone of a national reserve can develop activities of breeding rare and endangered animal or plant species, teaching practice, and tourism. The buffer zone could have only limited scientific research activities, while the core zone should not have any human activity.

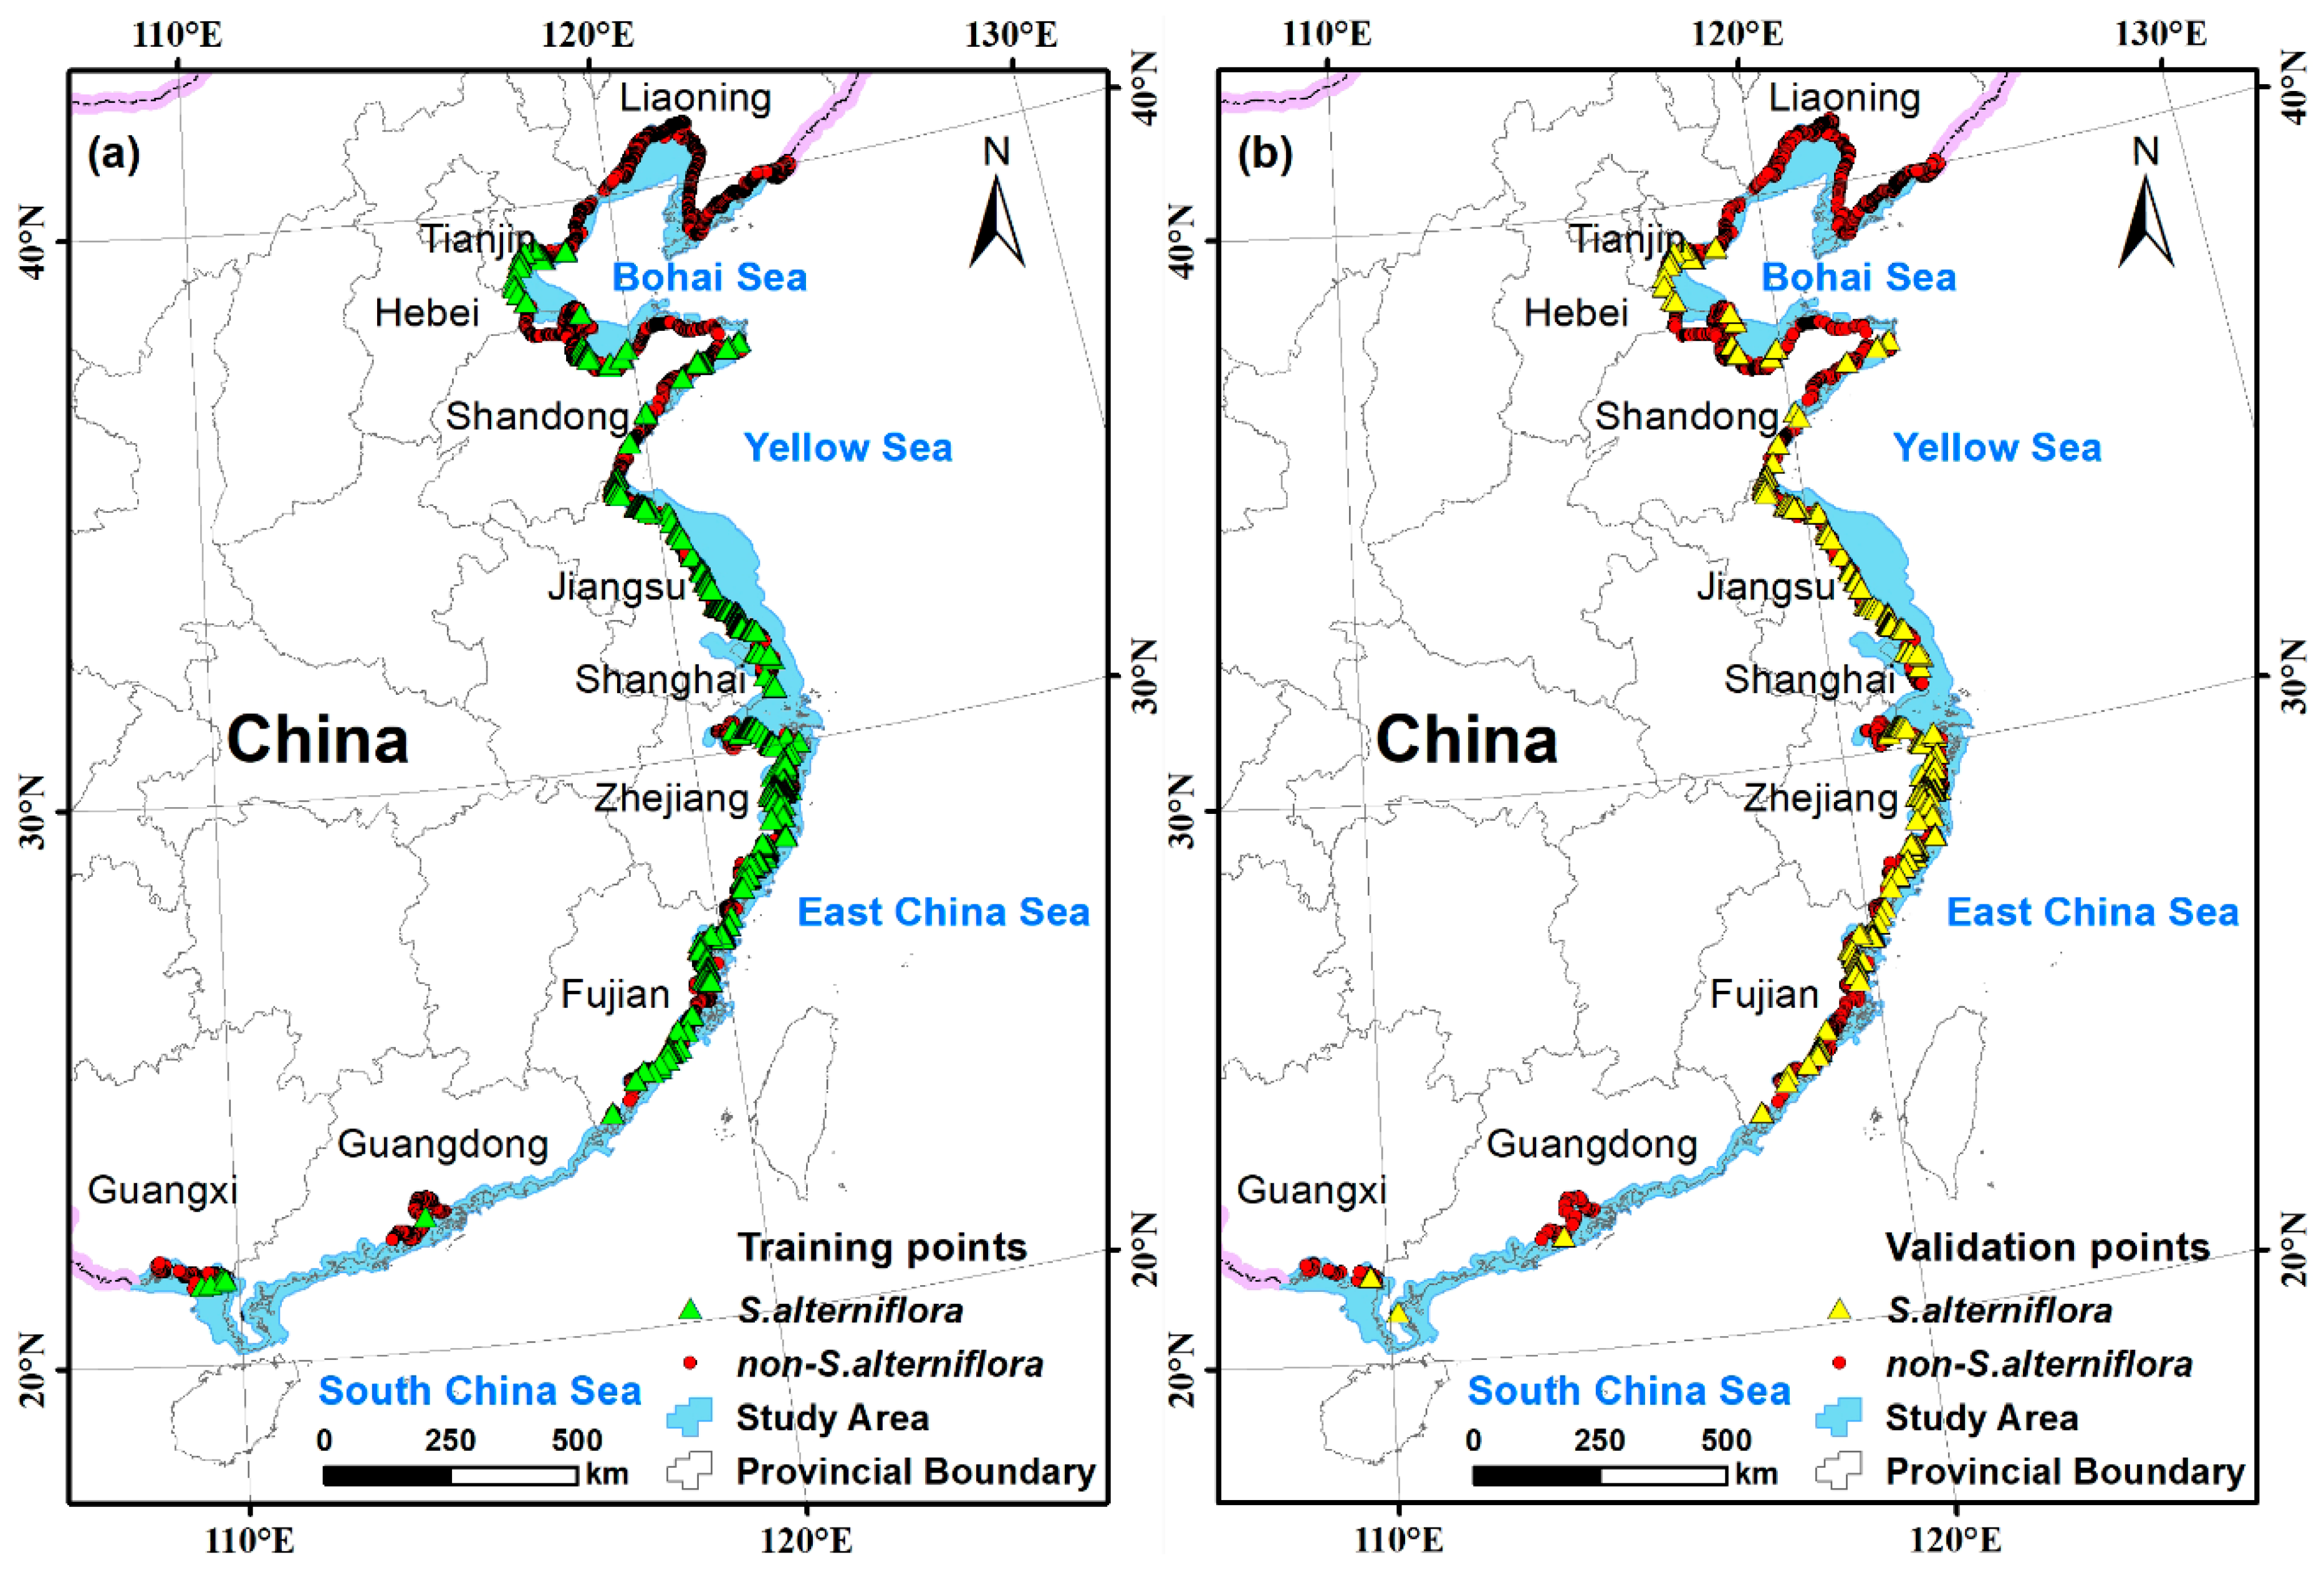
2.2.4. Field Surveys

Field surveys were conducted between September and November from 2014 to 2016 along the shoreline of mainland China (Figure 2) to collect ground truth points. Some sites were investigated by unmanned aerial vehicle due to road inaccessibility. A total of 11085 of land cover points were recorded using a hand-held geographic positioning system, of which 1716 were of S. alterniflora. We randomly collected 70% of the ground truth points as training samples, and another 30% as validation samples. Specifically, 1201 S. alterniflora and 6558 other land cover points were randomly selected as training samples, and 515 S. alterniflora and 2811 non-S. alterniflora points were used as validation samples in the image classification.
Due to road inaccessibility and bad weather when we carried out the field investigation in Guangdong Province, limited field truth samples were obtained in this province. Previous studies have revealed that there were only a few areas of S. alterniflora in Guangdong Province. Therefore, we collected 34 samples of S. alterniflora from the high-resolution images of Google Earth and other published papers for the training process of object identification in five scenes of Landsat images.

2.2.5. Data Preprocessing

In this study, all of the images were processed for atmospheric correction using the Fast Line-of-sight Atmospheric Analysis of Hypercubes (FLAASH) model and georectified to 1:100,000 topographic maps using ground control points (GCPs) in the ENVI 5.0 image processing software package. To improve classification accuracy, the OLI panchromatic band with a spatial resolution of 15 m was used together with seven multispectral bands with a spatial resolution of 30 m in the process of image segmentation. All of the images, reference data, and field survey shapefiles were projected to the Albers equal area conic projection with the datum WGS 84 coordinate system. Before we performed the image segmentation, all of the images were clipped using the boundary of study area.

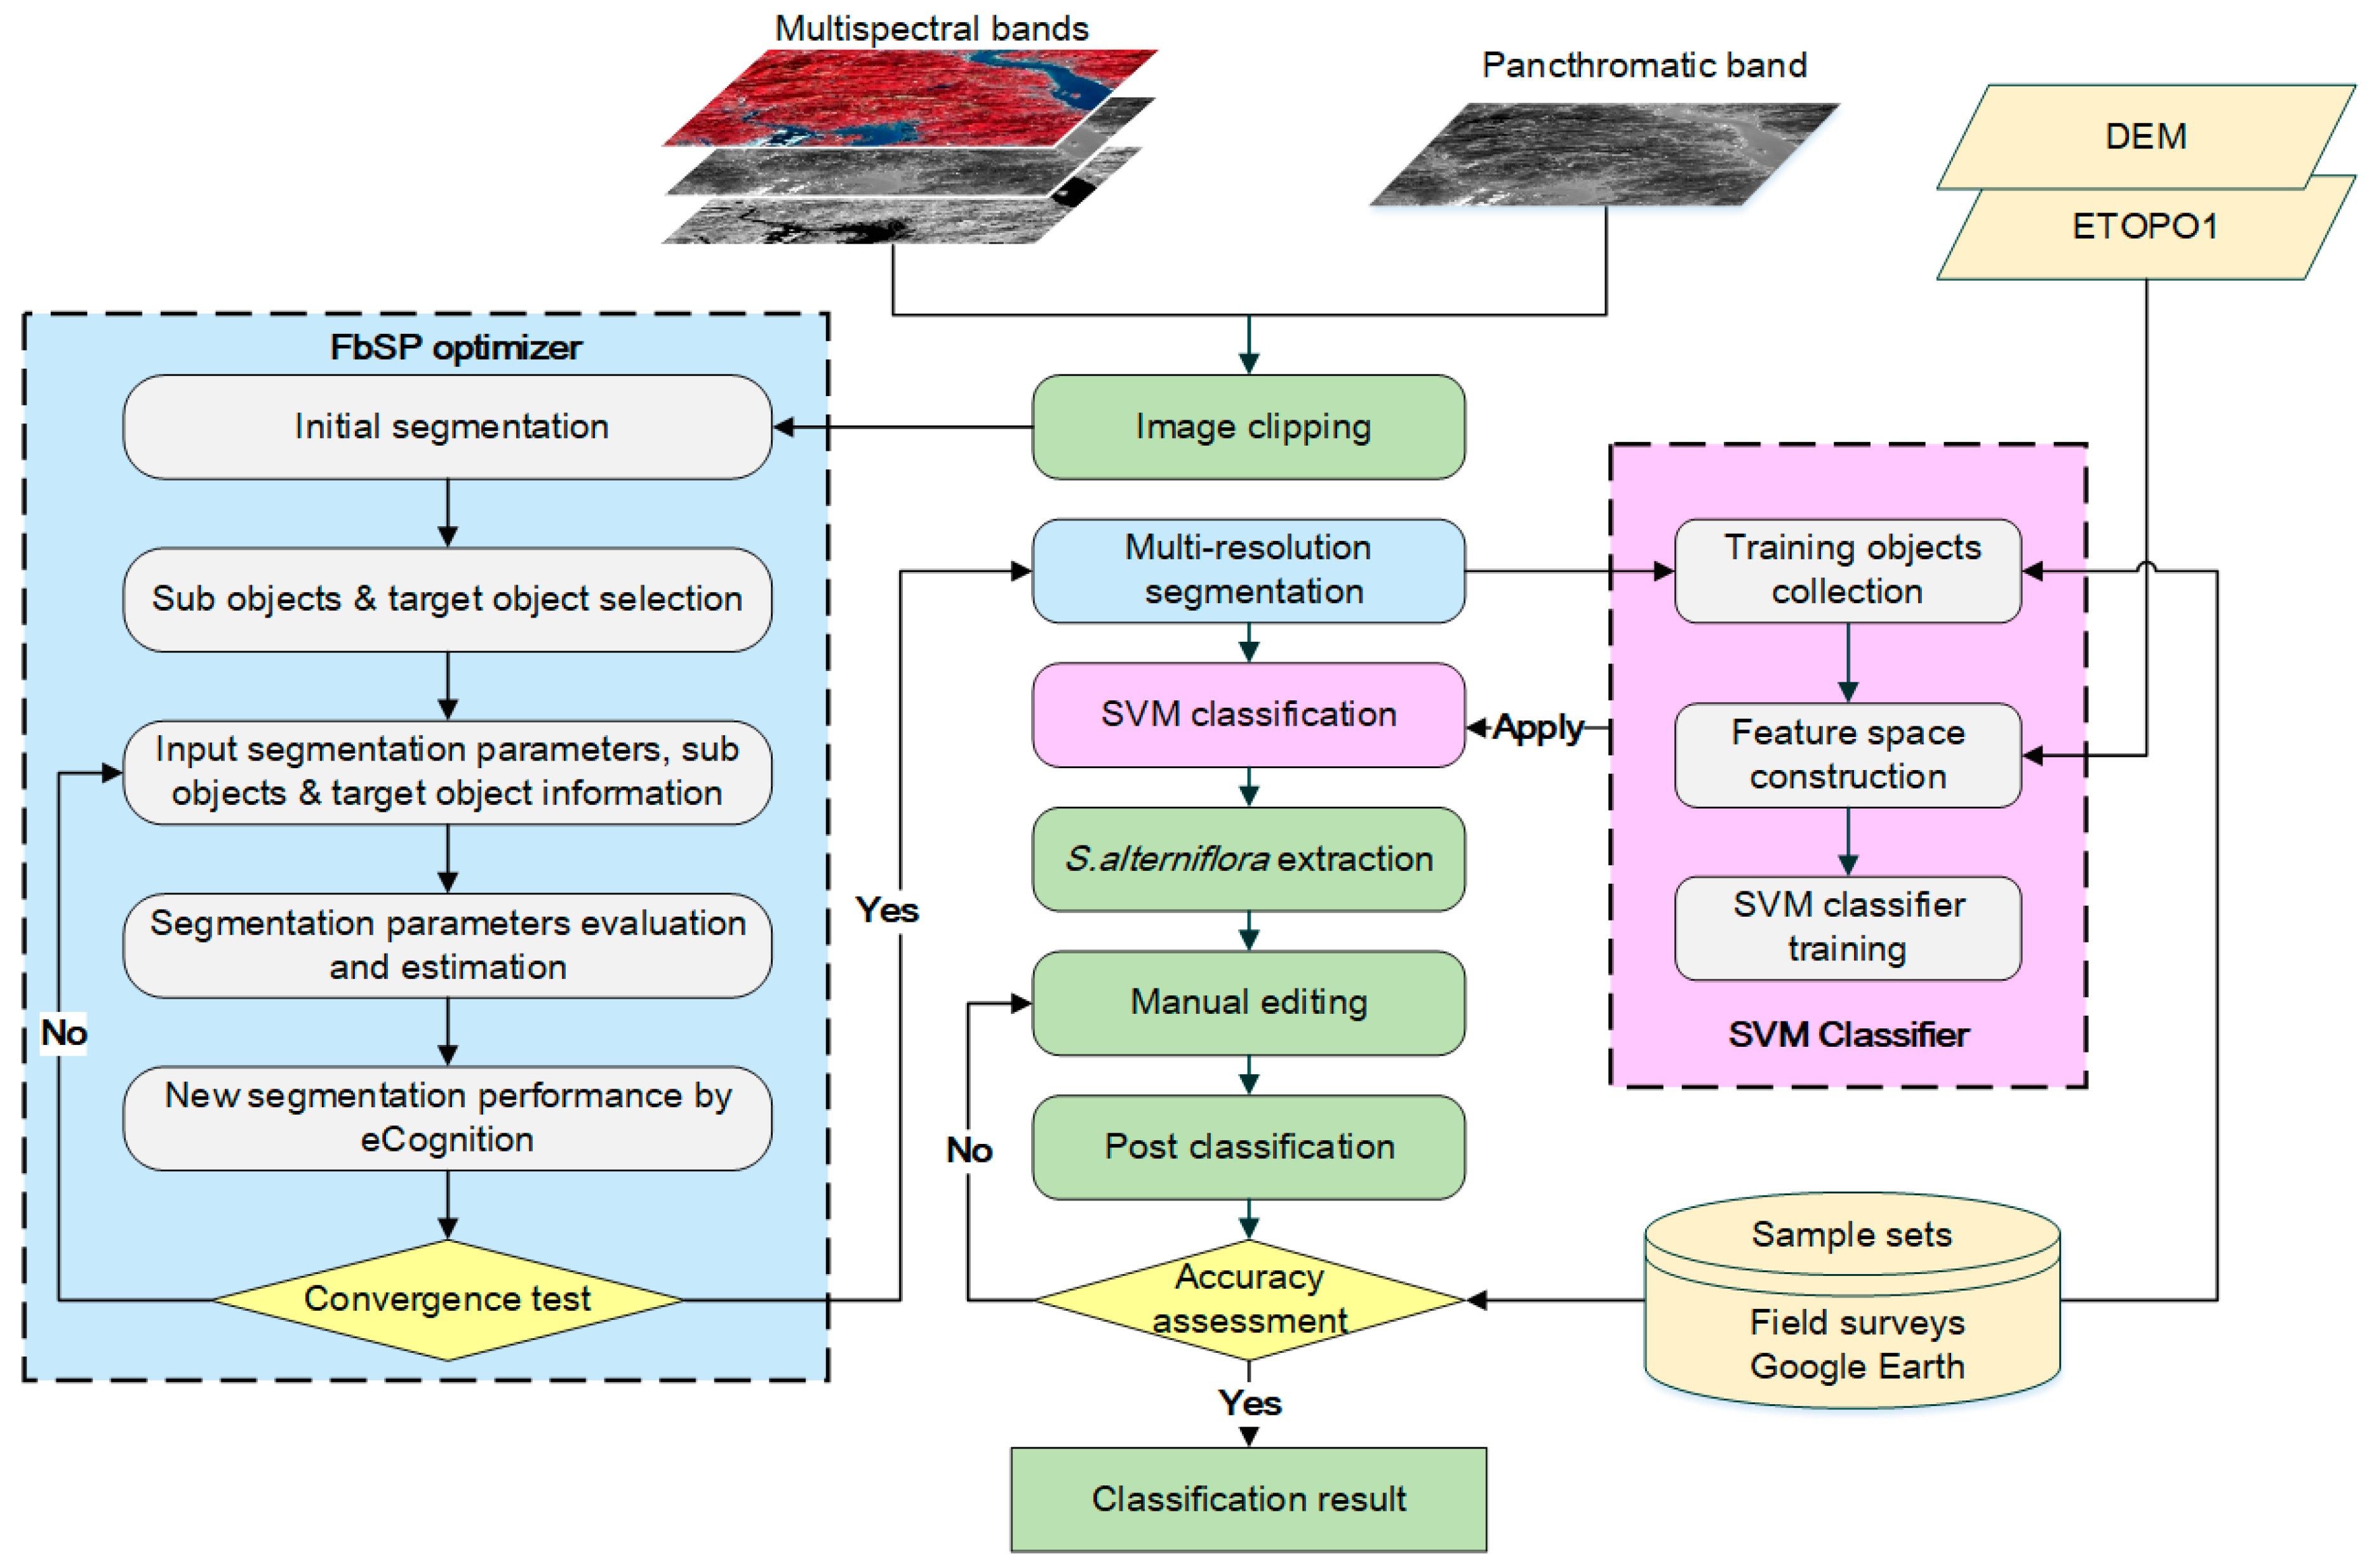
2.3. Extracting the Distribution of S. alterniflora

In this study, we combined OBIA and SVM methods to extract the S. alterniflora. In the process of OBIA, textural, geometric, and contextual features at the object level, as well as spectral information, were combined to provide a rich pool of candidate variables for classification [32,33]. SVM is a supervised non-parametric statistical learning technique that is suitable for performing non-linear, high-dimensional space classifications of remote sensing imagery [34,35]. These two functions built in the eCognition Developer 9 software were used to extract S. alterniflora. The input image layers were composed of the panchromatic and multispectral bands of the OLI image, DEM, and ETOPO1 data. In addition, the shapefile of the training samples was imported as a thematic layer to identify object samples for training the SVM classifier. The Fuzzy-based Segmentation Parameter (FbSP) optimizer was used to determine the optimal parameters for multi-resolution segmentation instead of employing the traditional trial and error method. Figure 3 is the flowchart for extracting S. alterniflora.

2.3.1. Multiscale Segmentation

Segmentation is the first key step in the OBIA process, and its outputs provide the foundation for subsequent classification that directly influences the classification accuracy. The FbSP optimizer, a commonly used multi-resolution segmentation algorithm [36,37], was applied to objectively determine the optimal segmentation parameters (scale, shape/color, and smoothness/compactness). The FbSP optimizer was developed based on the idea of discrepancy evaluation to control the merging process of sub-objects and work through a supervised training process and fuzzy logic analysis [36]. Specifically, an initial segmentation of input images, which achieves an excessive segmentation result, was performed. The default eCognition settings for the shape and compactness parameters, and a small value of scale parameter, were normally used to generate sub-objects, which are smaller than the target object. Sub-objects were then selected from the initial segmentation result as training objects, and their values of related features, including texture, stability, brightness, and area were collected. Further, the training objects were merged, and the feature values of merged objects were collected. Both the feature values of sub-objects and merged objects were imported into the FbSP optimizer to generate new segmentation parameters. The parameters provided by the FbSP optimizer were used to segment images again using eCognition software. Such a training process was iteratively performed to reach a convergence between segmentation and the target object until they match each other. The optimal segmentation parameters are thus obtained. This training process was performed for each scene of image. Figure 4 shows an example of the segmentation process based on the FbSP optimizer.

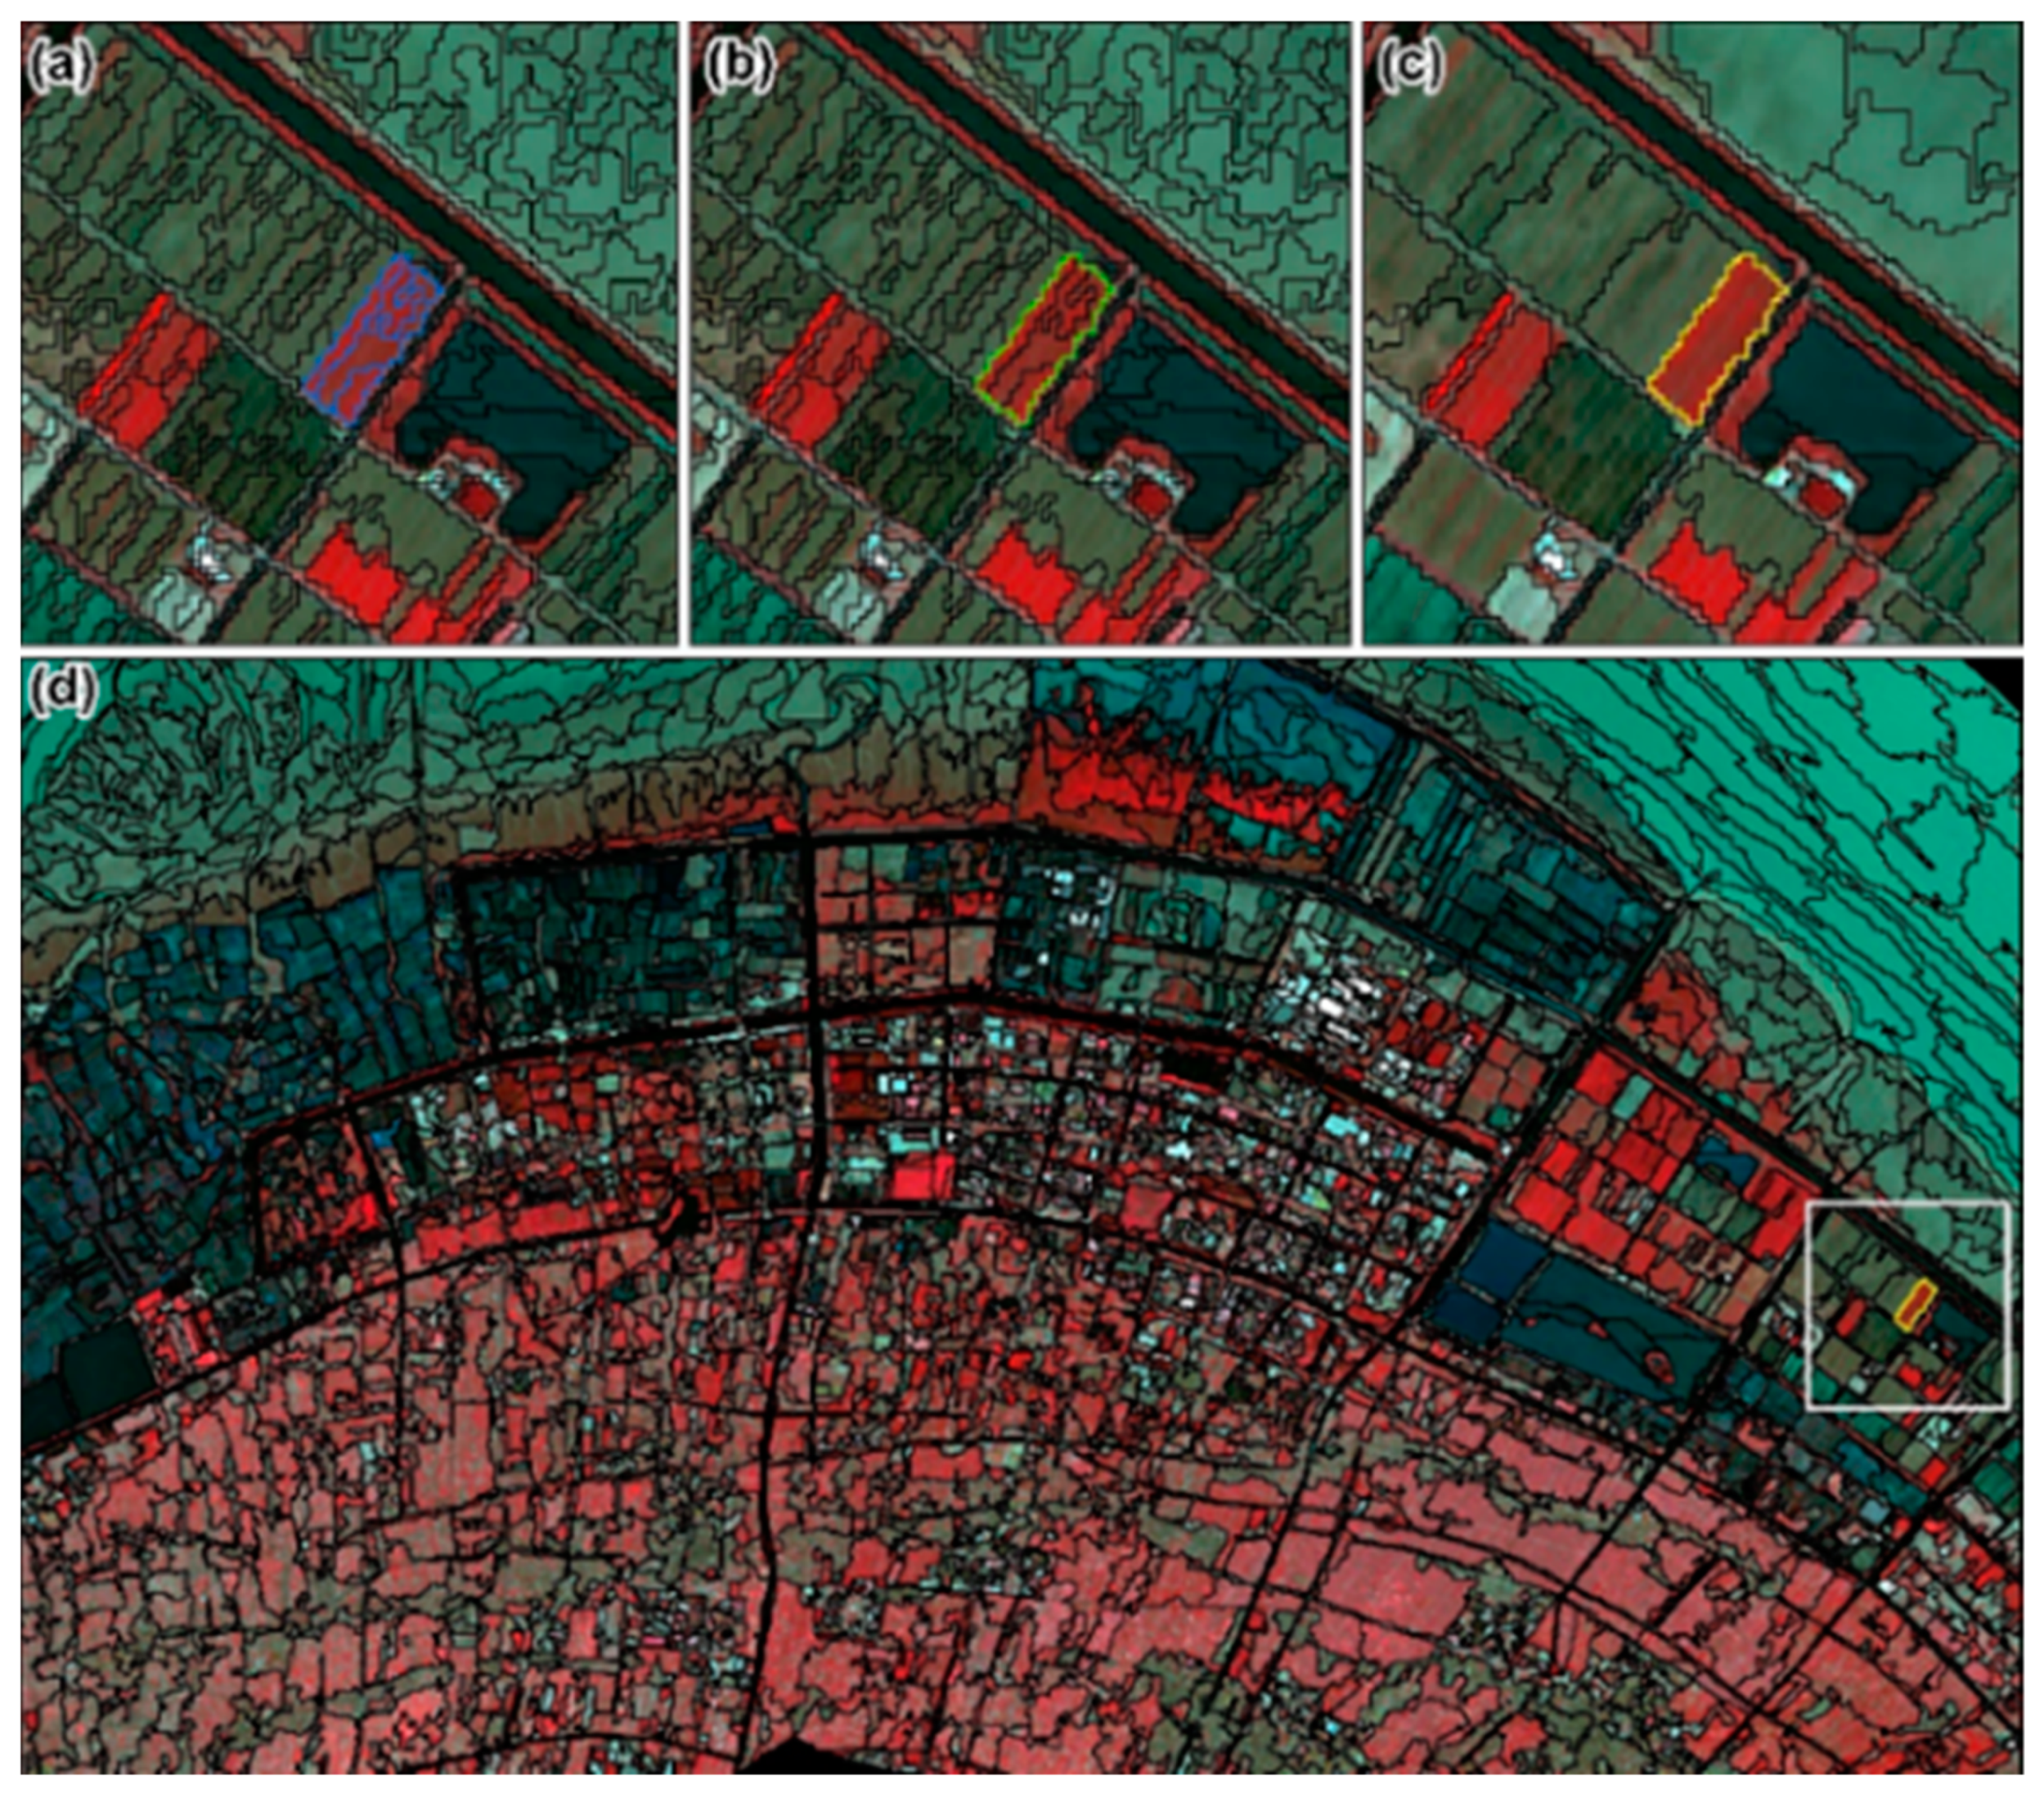
2.3.2. Object Identification and Accuracy Assessment

The first step of object identification was to collect training objects. We assigned land cover classes to the objects fully containing the training samples based on their land cover types. In the second step, we constructed a feature space by making reference to literature reviews, expert knowledge, and visual examination. The feature space was composed of spectral, texture, and shape features, as described in Table 1. For example, the mean NDVI, NDWI, and LSWI values of all the pixels in an object were calculated, and were further used in the process of classification. In addition, DEM and ETOPO1 data were used to set the threshold for a specific region where the terrain feature should be considered. Generally, the thresholds for the coasts in different regions were different. For example, the value of two meters for DEM was used over the coast of the Dandou Sea. Next, the SVM classifier was trained with the collected training objects, the constructed feature space, and the algorithm parameters (radial basis function, RBF kernel) [38]. In this process, we visually compared the classification results from multiple groups of the RBF parameters, and found that the default values (C = 2 and γ = 0) of RBF in eCognition software are optimal for the SVM classifier. We then applied the trained SVM classifier to obtain an initial land cover classification. Subsequently, manual editing was performed to correct some misclassifications based on previous knowledge and field survey data, especially for patches near the boundaries of different vegetation types.
Final classification results was assessed using ground truth samples. A confusion matrix consisting of the overall accuracy, user accuracy, producer accuracy, and kappa coefficient was created to measure the consistency between our classification results and the validation samples. The generated results were used to construct a new dataset on the S. alterniflora invasion, which was called the Chinese Academy of Sciences S. alterniflora dataset (CAS S. alterniflora).

3. Results

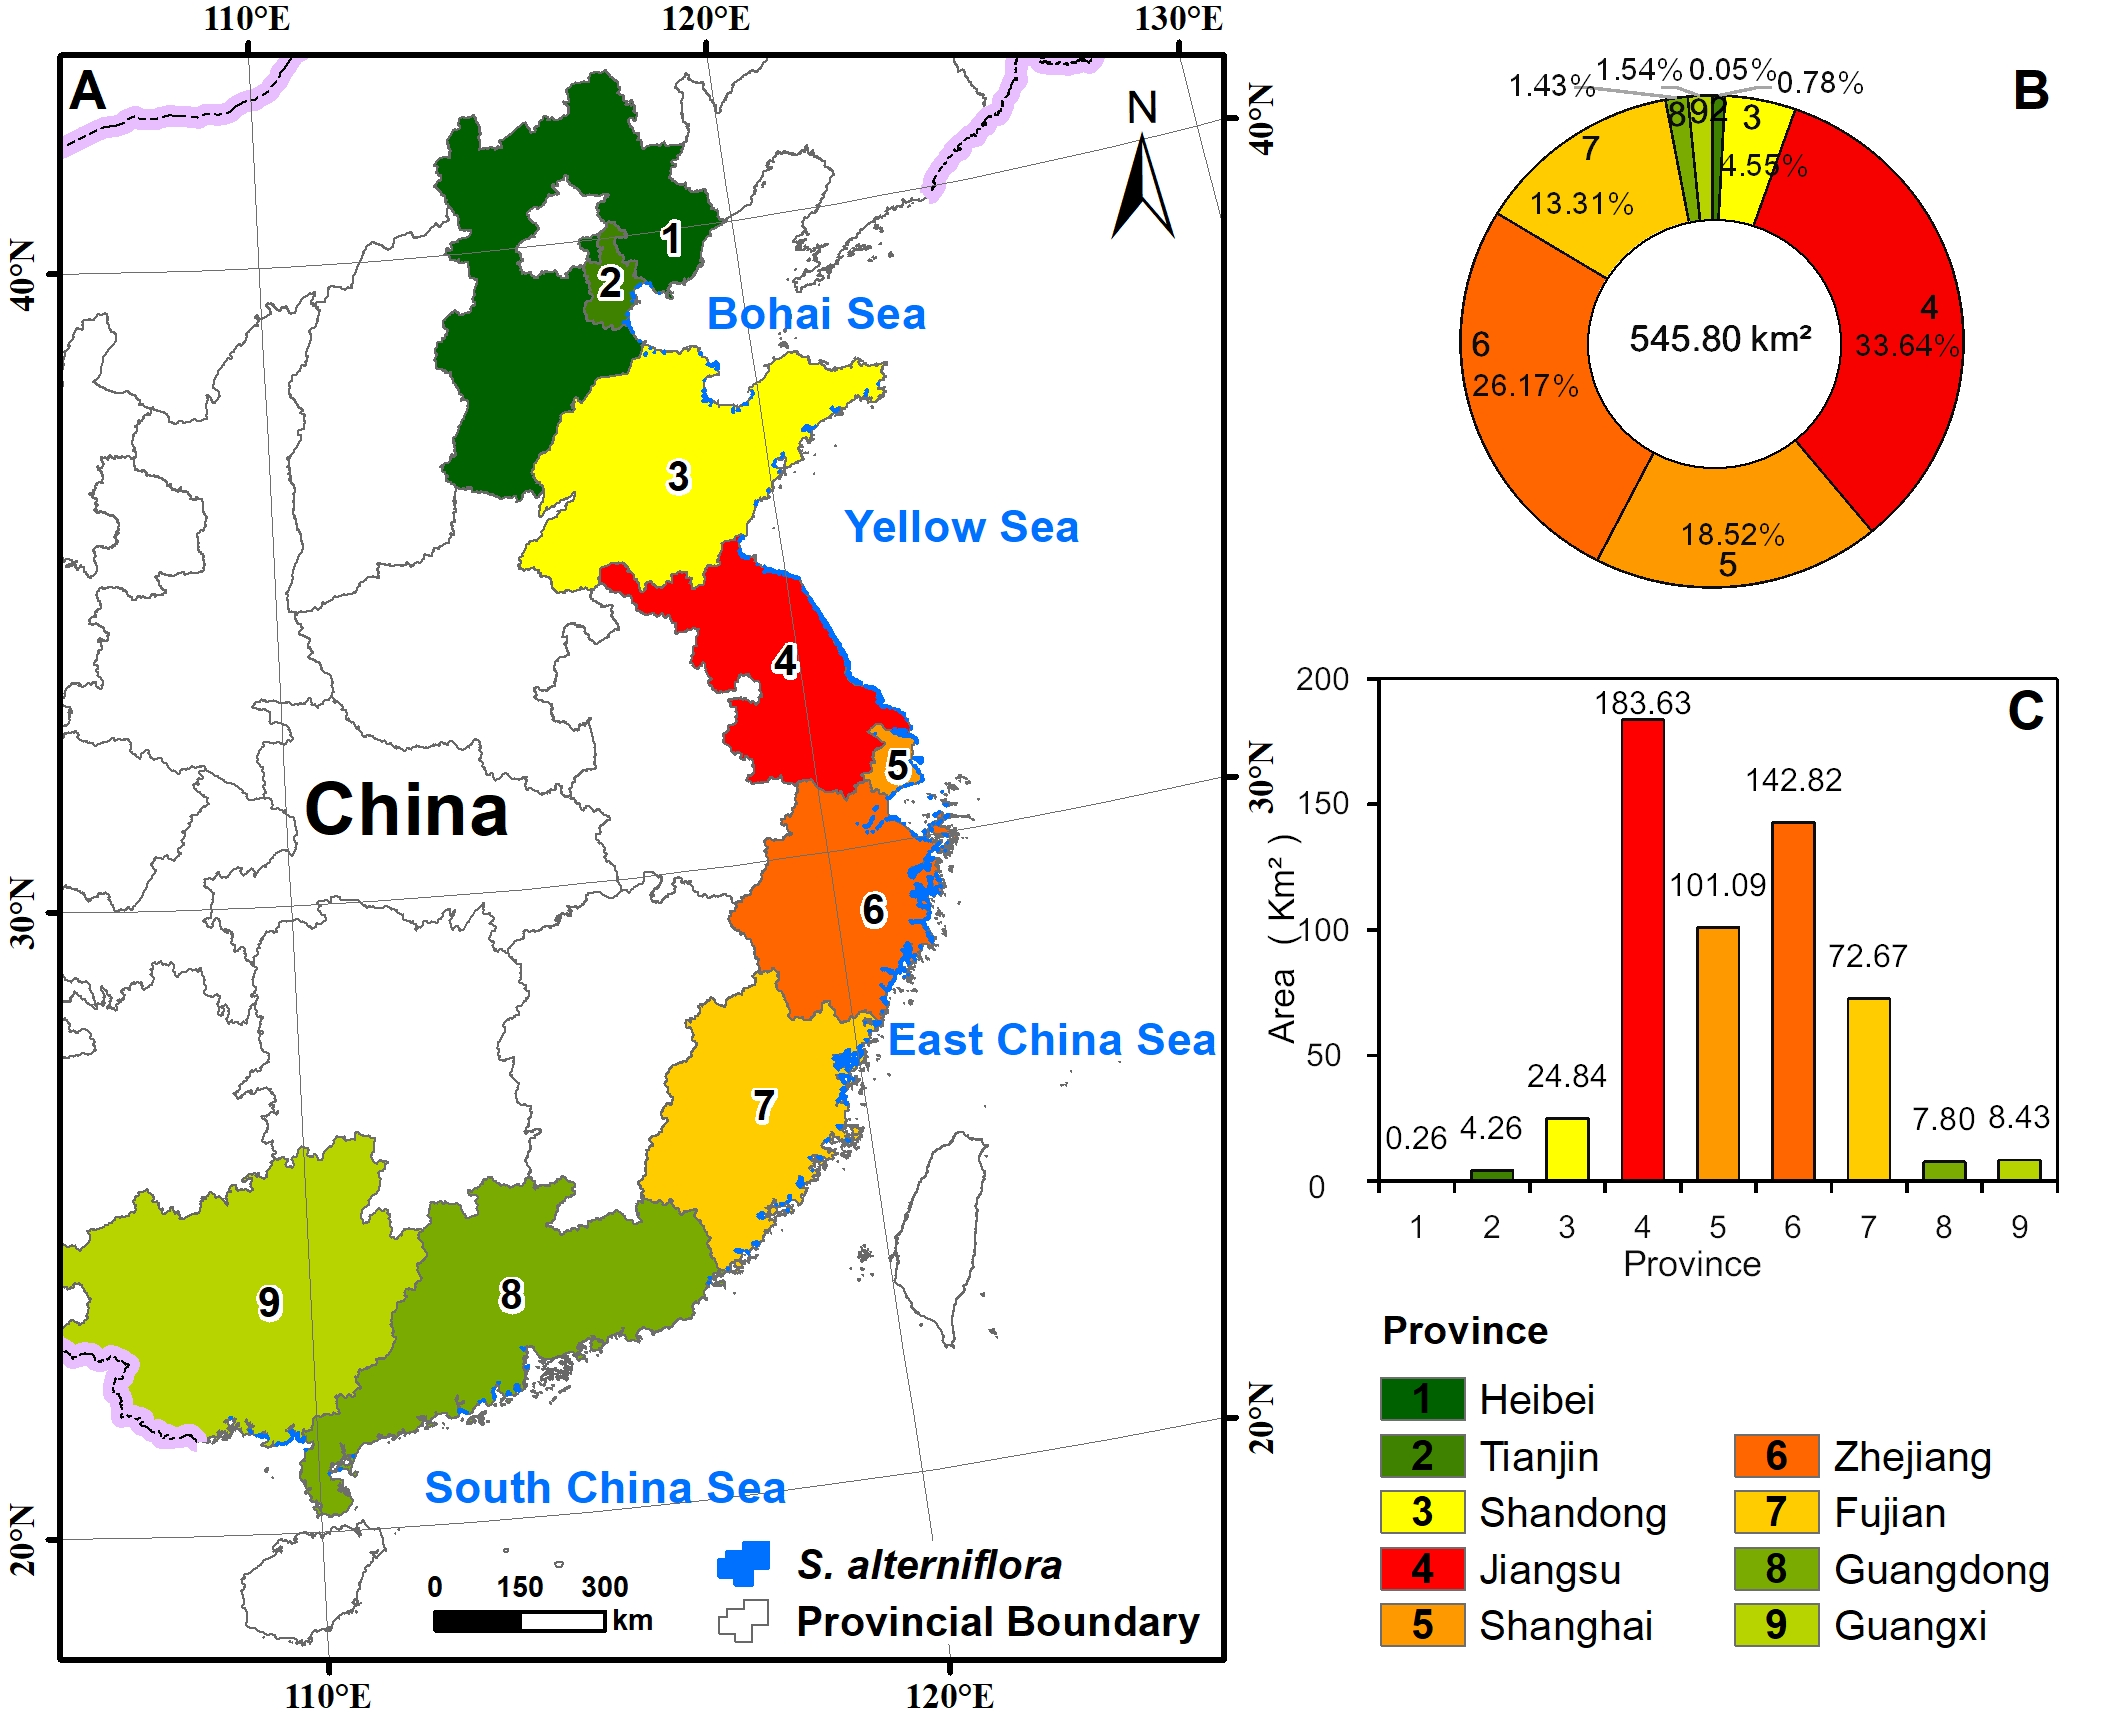
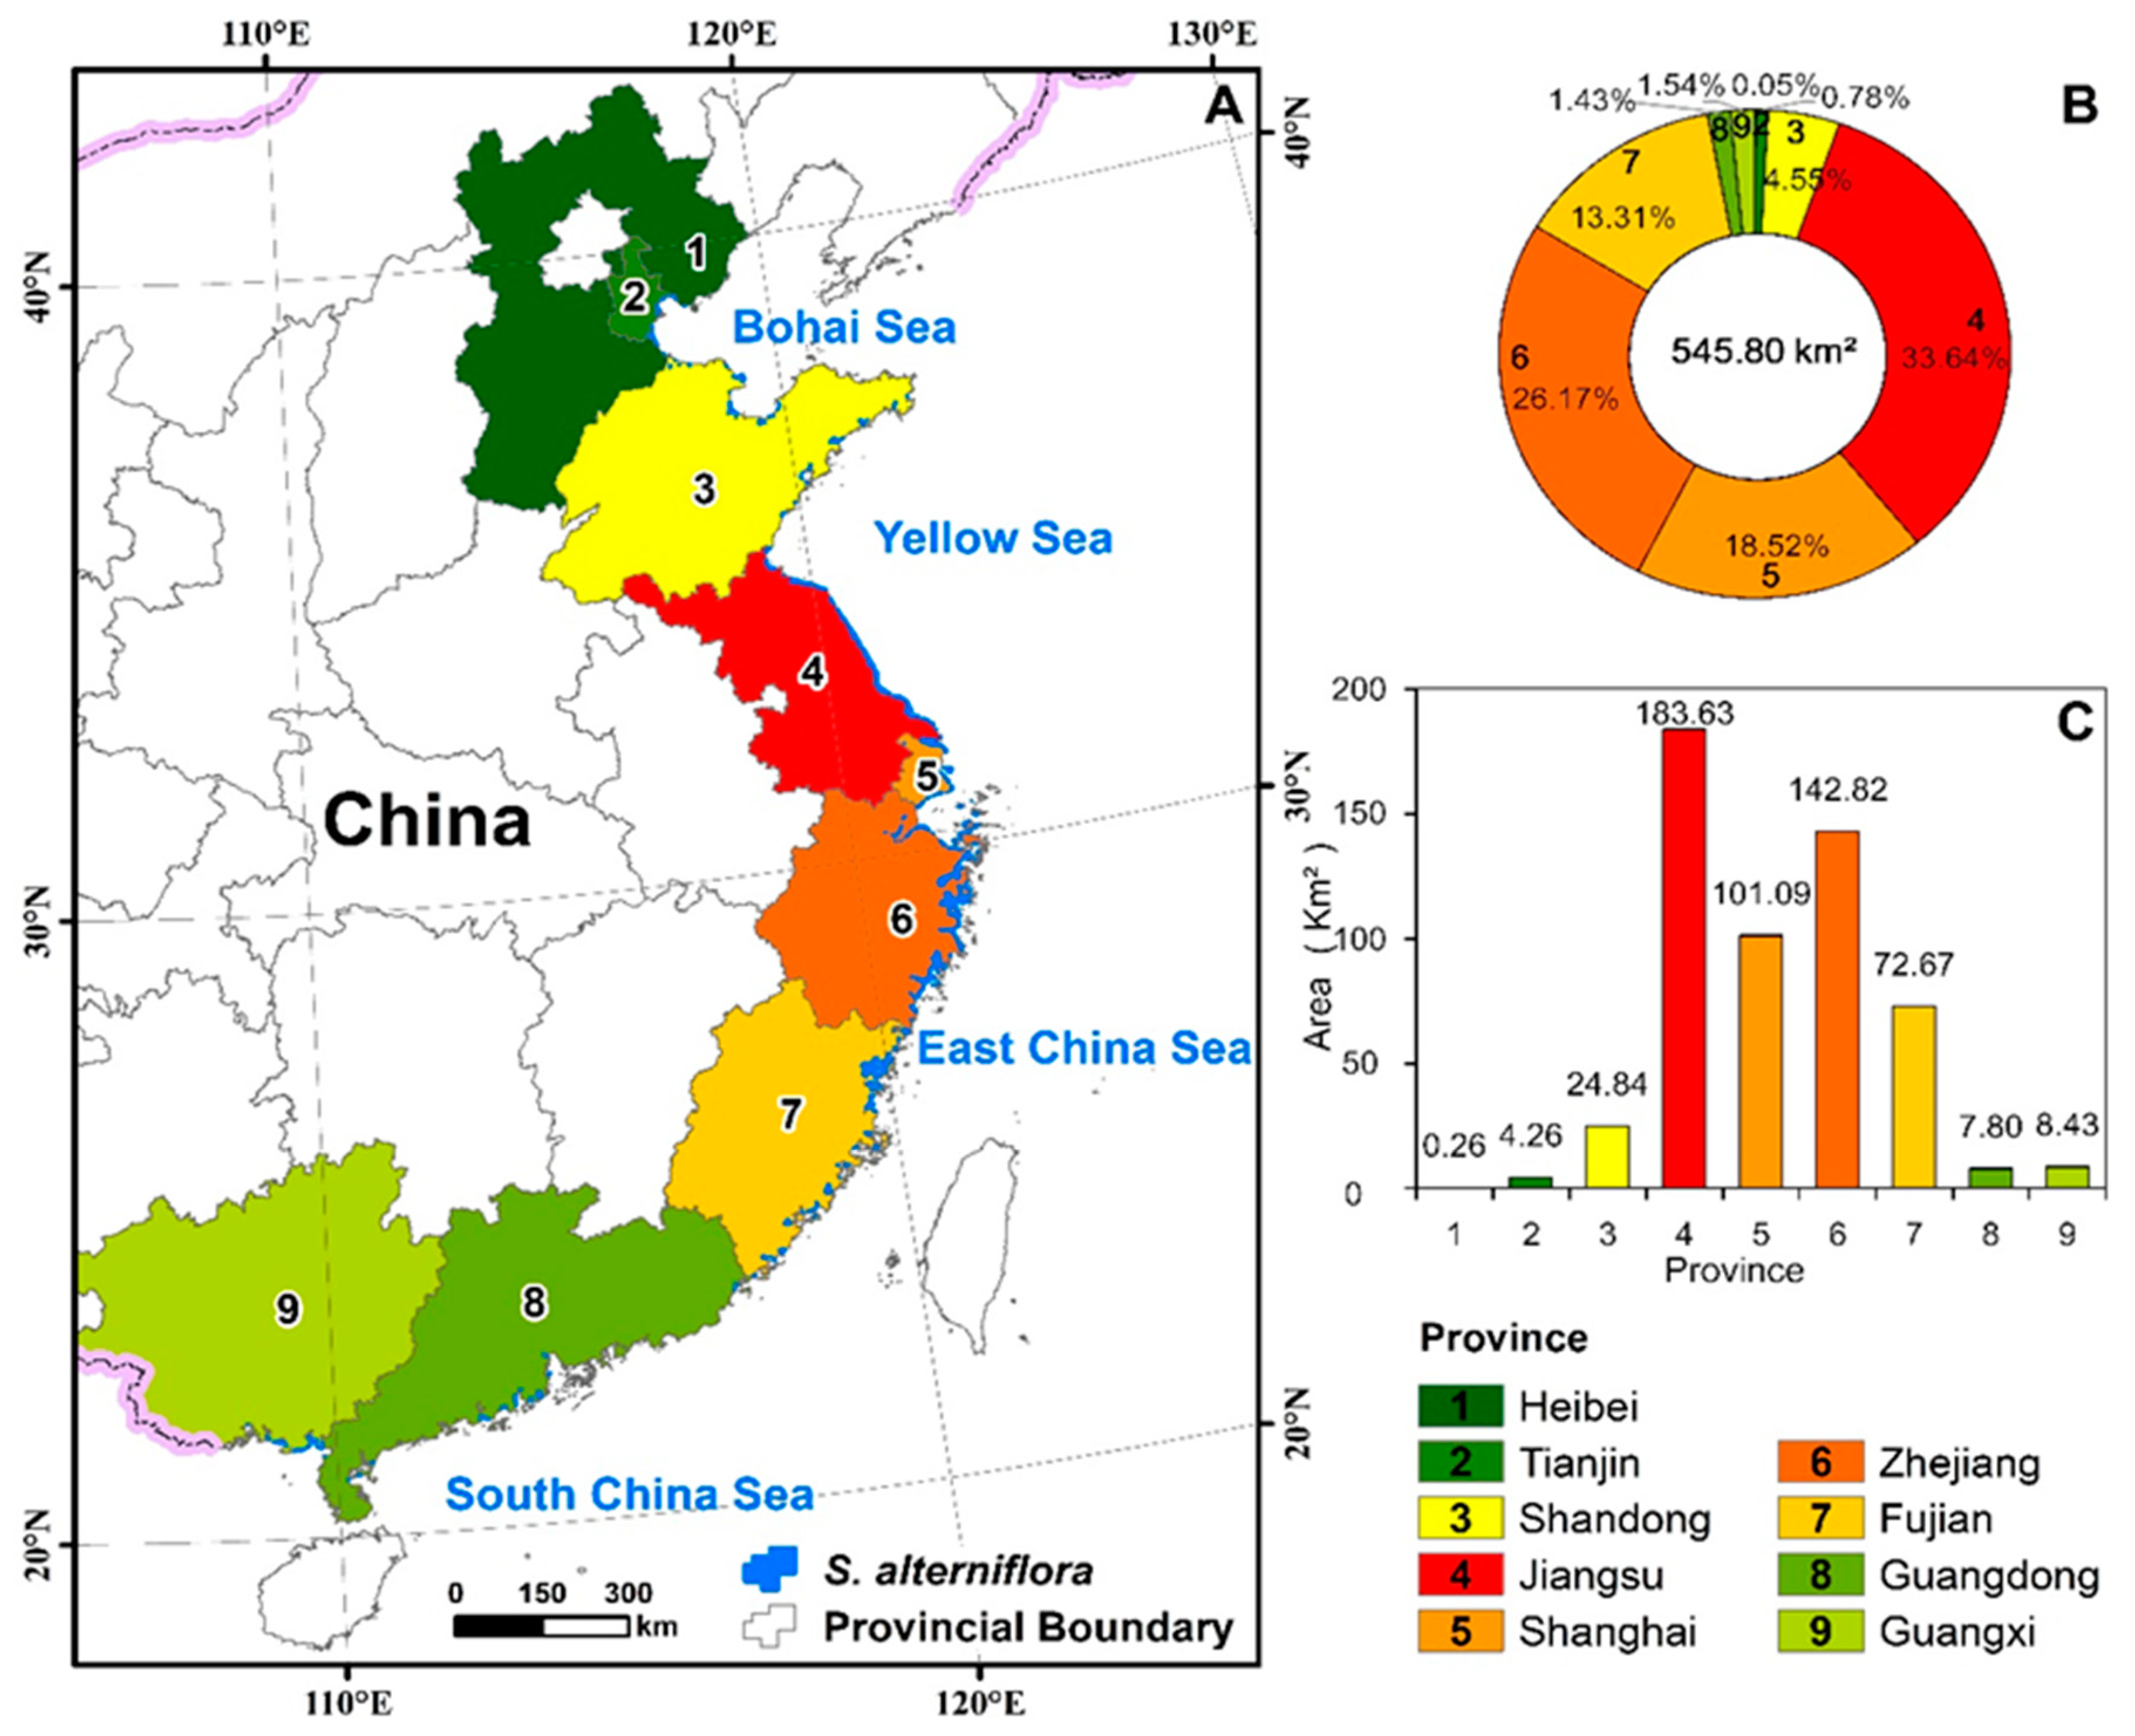
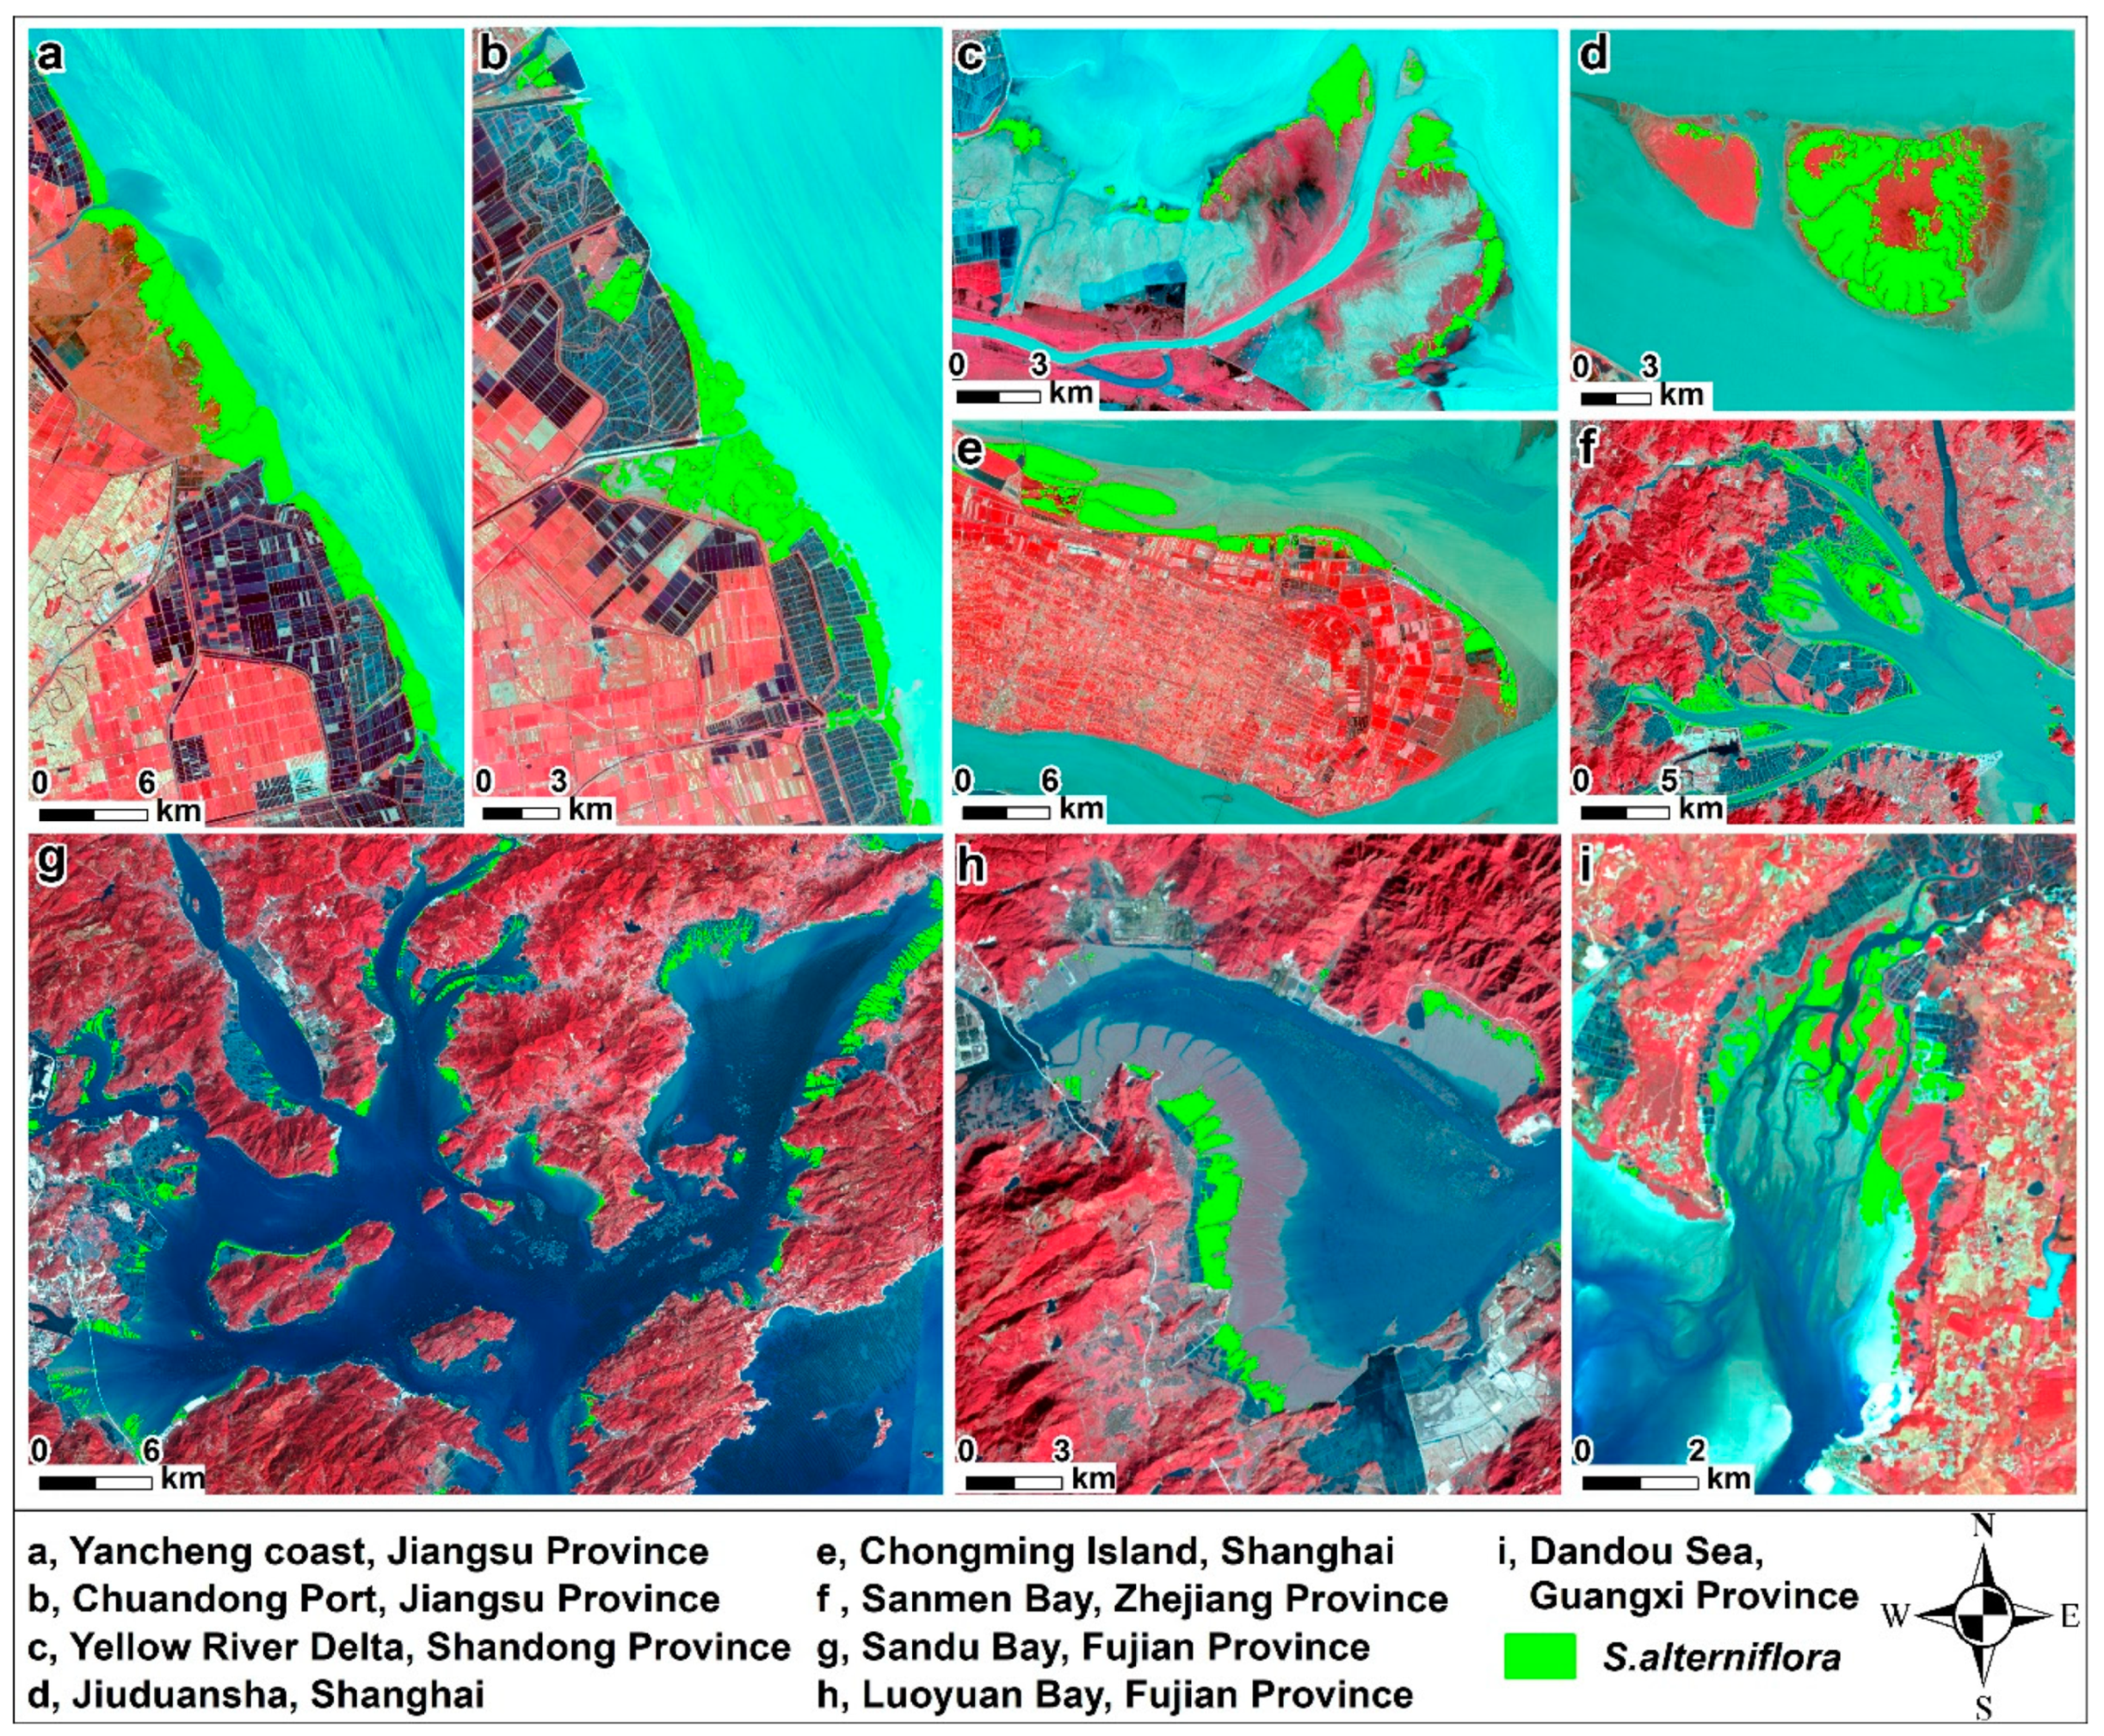
3.1. The Spatial Pattern of S. alterniflora in the Coastal Zone of Mainland China

The performed classification resulted in an overall accuracy of 96% and a kappa coefficient of 0.86, and producer and user accuracies greater than 0.85 (Table 2). These accurate classification results gave us confidence to describe the spatial pattern of S. alterniflora in the coastal zone of mainland China.
S. alterniflora was estimated to cover 545.80 km2, and was found along the shoreline from the Nanpu coast in Tangshan, Hebei Province to Dafengjiang Estuary, Guangxi Province with a latitude from 39°13′N to 20°55′N. The spread of S. alterniflora is commonly by vegetative propagation after its artificial planting; S. alterniflora was thus found to present in clusters in most of the intertidal zones and estuaries of Jiangsu, Shanghai, Zhejiang, and Fujian provinces, and occupied a total area of 500.21 km2 in these regions, accounting for nearly 92% of the total area of S. alterniflora in mainland China (Figure 5). However, S. alterniflora was scarce in the other five coastal provinces: Hebei, Tianjin, Shandong, Guangdong, and Guangxi, and was not observed in the northernmost coastal province, Liaoning.

3.2. Geospatially Varied Distributions of S. alterniflora in Coastal Provinces

Figure 6 illustrates the geospatially varied distributions of S. alterniflora in hotspot regions. S. alterniflora was found to be 0.26 km2 in Hebei. Most of the S. alterniflora was distributed in patches along riverbanks, and grew parallel to the shoreline of Huanghua City. S. alterniflora in Tianjin was sporadically distributed from the Hangu coast in the north to Ziya River Estuary in the south, whereas the largest area of S. alterniflora was identified in Ziya River Estuary. S. alterniflora in Shandong was determined to be 24.84 km2, and was mainly observed in the estuaries of this province such as the Yellow River Delta, Xiaoqing River Estuary, Dingzi Bay, Laizhou Bay, Jiaozhou Bay, and Rushan Bay in the areal order from large to small.
Jiangsu suffered the greatest invasion of S. alterniflora among all of the coastal provinces. The area of S. alterniflora in Jiangsu was estimated to be 183.63 km2, accounting for 33.64% of the total invasion area in mainland China. S. alterniflora extended from the Xiuzhen River Estuary in the north to the Qidong coast in the south, mainly in the intertidal zones of Dafeng and Rudong counties. Almost all of the major ports and estuaries were invaded by S. alterniflora. In Shanghai, the exotic plant was mainly identified in the northeast part of Chongming Island and Jiuduansha Shoals, and also found as narrow strips along the Nanhui coast. In Zhejiang Province, a considerable proportion of S. alterniflora was detected in the bay areas and major ports, with Sanmen Bay having the largest—32.21 km2—and Yueqing Bay having the second largest with 25.13 km2. Ningbo had the largest area of S. alterniflora (74.61 km2) among the prefecture-level cities, accounting for over half of the total area in Zhejiang Province, followed by Taizhou and Wenzhou cities. Additionally, some patches of S. alterniflora were found in the coastal reclamation districts. The distribution of S. alterniflora in Fujian Province extended from Yacheng Bay in the north to Zhangjiang Estuary in the south, and covered most of the main estuaries and bay areas. Sandu Bay showed the largest areal extent of S. alterniflora (33.28 km2), representing 45.80% of the total invasion area of Fujian Province, followed by Luoyuan Bay (8.60 km2), Quanzhou Bay (7.53 km2), Minjiang Estuary (3.25 k km2), and Funing Bay (2.38 km2).
In Guangdong Province, most of the patches of S. alterniflora were observed along the shoreline and in the estuaries of Taishan and Zhuhai. The northernmost location covered by S. alterniflora was Yifengxi River Estuary, whereas the southernmost S. alterniflora patches were distributed along the Beishangang coast in Zhanjiang City. In Guangxi Province, the area of S. alterniflora was estimated to be 8.43 km2, and the distribution of this exotic plant was concentrated in Yingluo Bay, followed by the Shatian coast, Dandou Sea, Tieshan Port, Yingpan Port, Lianzhou Bay, Nanliujiang Estuary, and Dafengjiang Estuary.

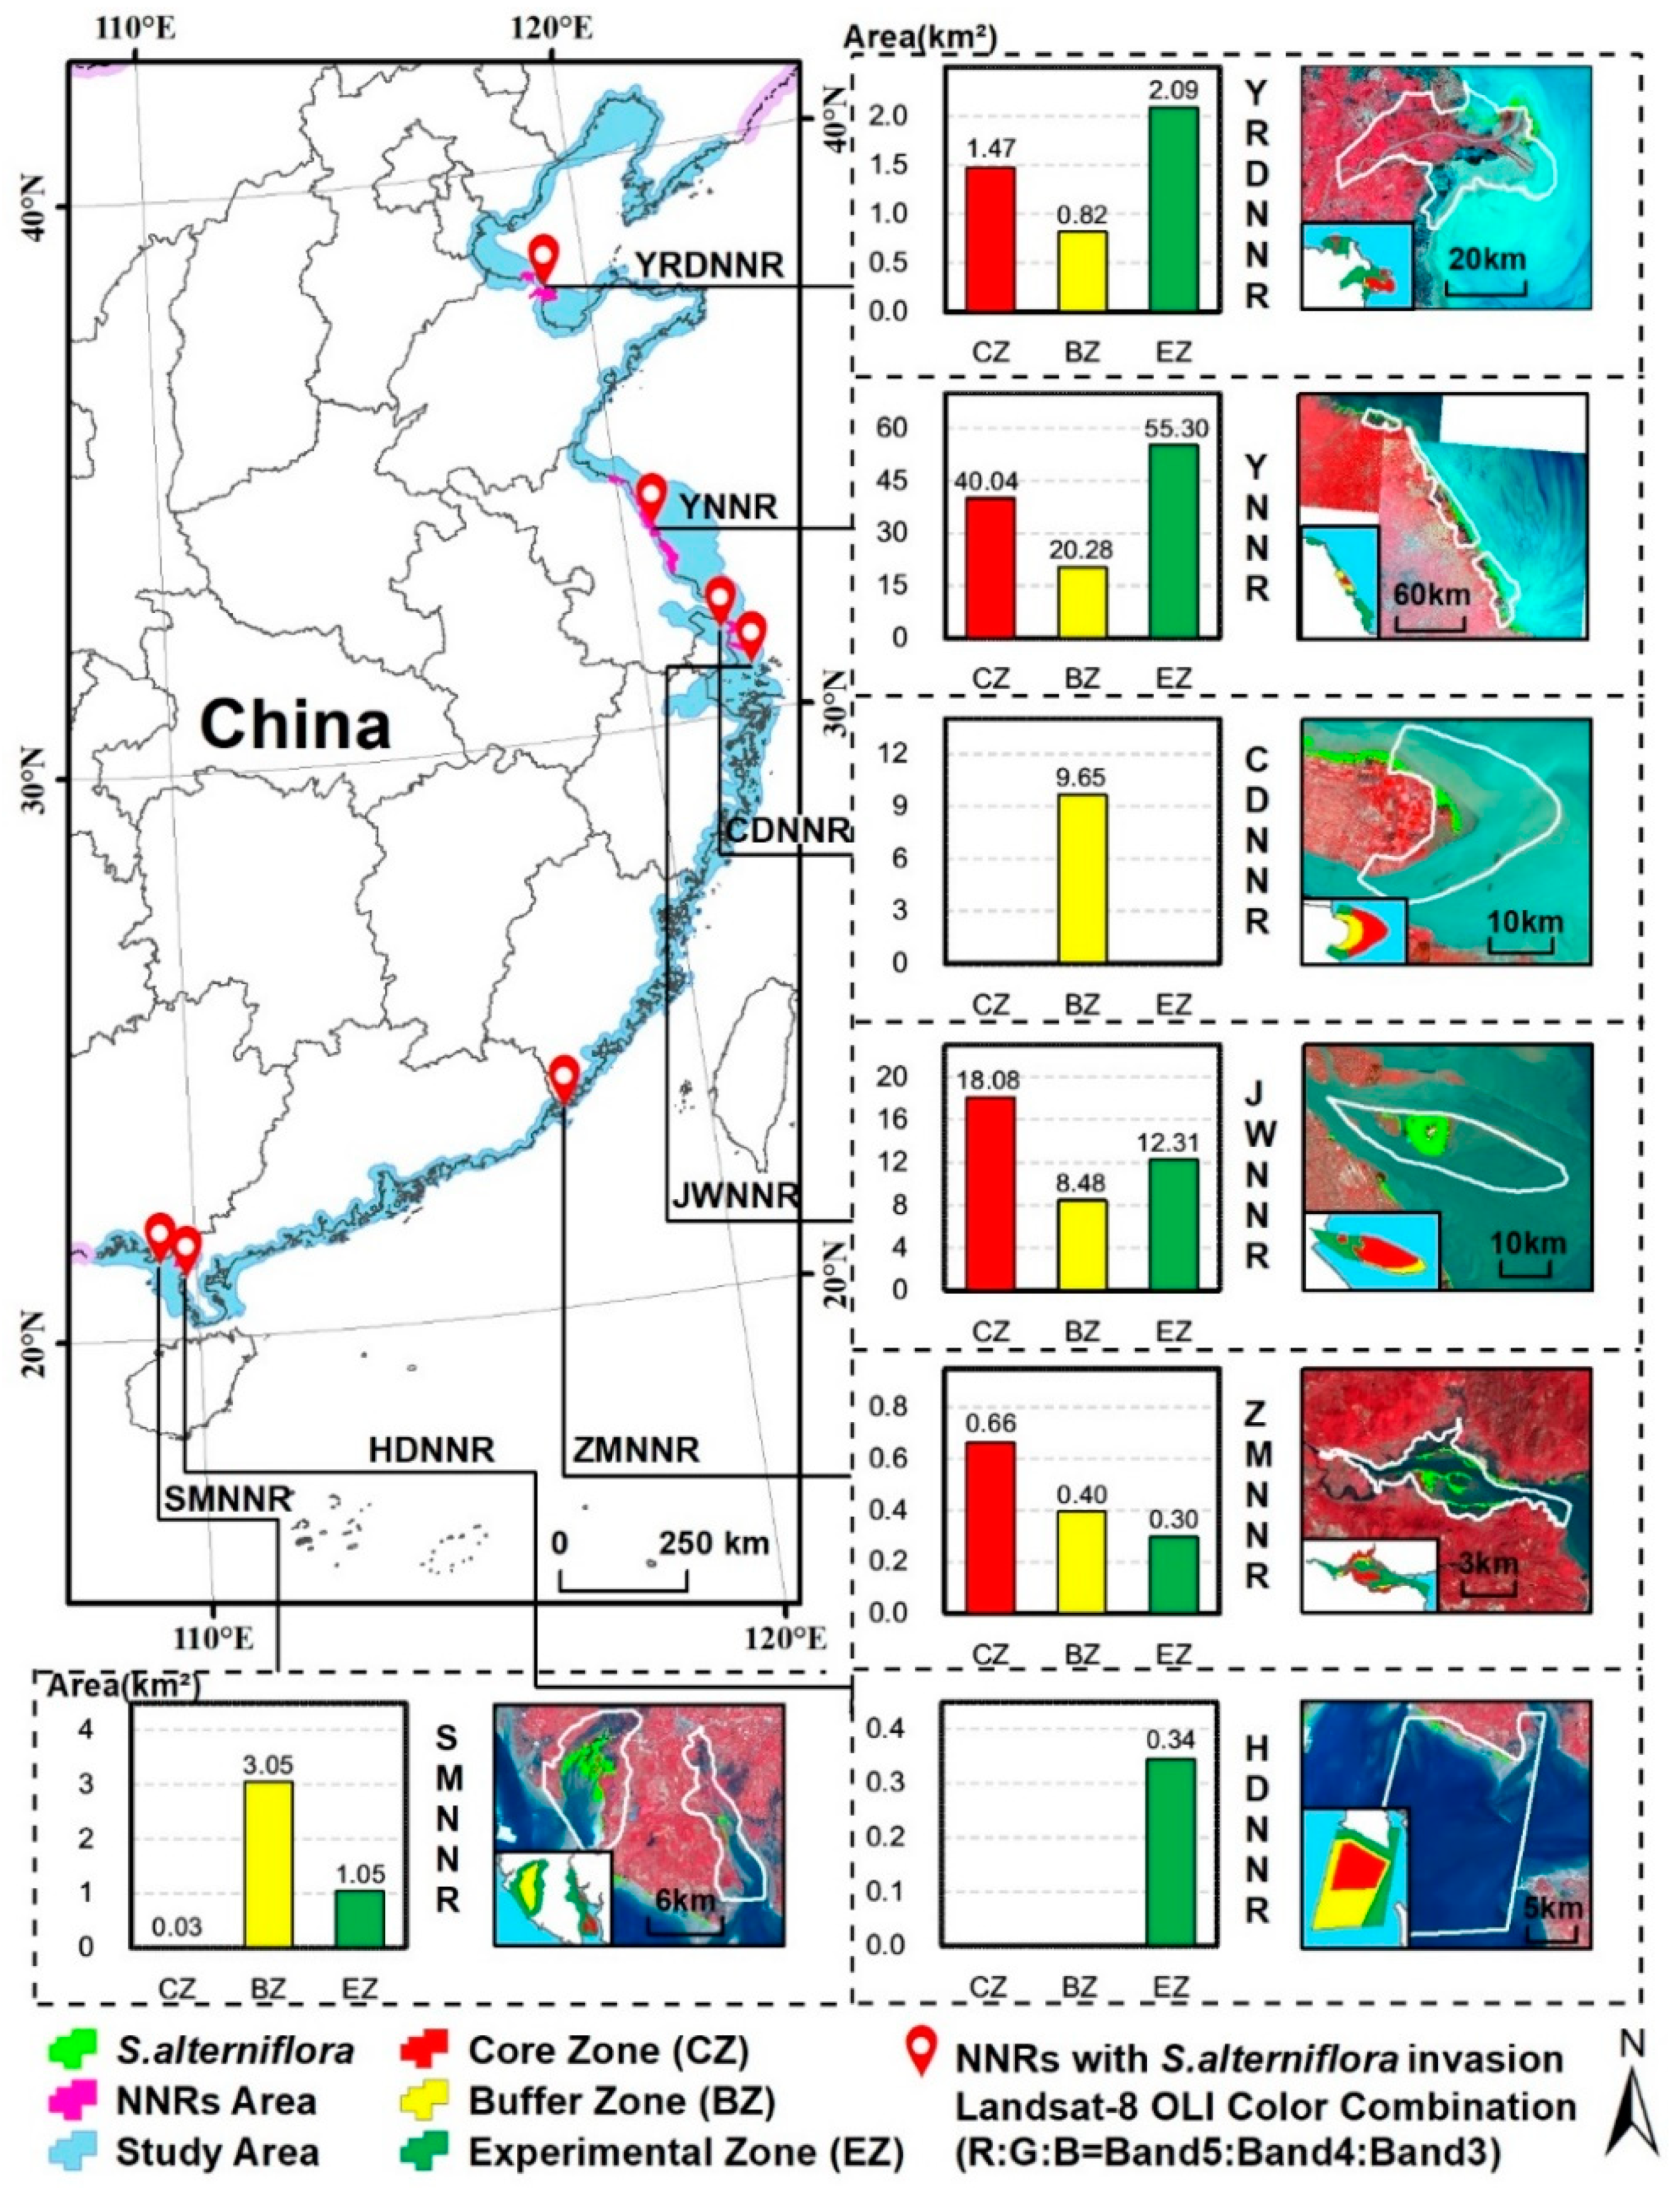
3.3. S. Alterniflora Invasion in Coastal NNRs

To specifically investigate the invasion of S. alterniflora to native ecosystems, the distribution of S. alterniflora within the coastal NNRs of mainland China was identified (Figure 7). Seven NNRs were markedly invaded by S. alterniflora: the Yellow River Delta NNR (YRDNNR), Yancheng NNR (YNNR), Chongming Dongtan NNR (CDNNR), Jiuduansha Wetland NNR (JWNNR), Zhangjiangkou Mangrove NNR (ZMNNR), Shankou Mangrove NNR (SMNNR), and Hepu Dugong NNR (HDNNR). A total area of 174.35 km2 of S. alterniflora was mapped in these seven NNRs, accounting for 31.9% of the total area of S. alterniflora in mainland China. The area and proportional area of S. alterniflora were calculated for each NNR with respect to the different functional zones, varied significantly among the NNRs. Overall, the experimental zone had the largest area of S. alterniflora (71.39 km2), while the core zone displayed the highest coverage of S. alterniflora (5.25%).
The YRDNNR was the northernmost NNR invaded by S. alterniflora. There was 4.38 km2 of S. alterniflora dispersed along the seaward boundary of the intertidal zone in the southern part, and the experimental zone had the largest area of S. alterniflora. The YNNR, which was designed for protecting rare waterfowls, had the widest distribution of S. alterniflora with an area of 115.62 km2, accounting for 66.31% of the total area of S. alterniflora in the NNRs. In this reserve, the species was distributed in strips almost parallel to the shoreline, and occupied the largest area in the experimental zone, followed by the core zone and buffer zone. In the CDNNR, 9.65 km2 of S. alterniflora occurred as a strip in the intertidal mudflat of the buffer zone, whereas S. alterniflora were not observed in the core zone and experimental zone. Approximately 9.35% of the JWNNR was covered by S. alterniflora, which was mainly distributed in the core zone, followed by the experimental and buffer zones. In the ZMNNR, 1.36 km2 of S. alterniflora was dispersed along the riverbanks as well as in the intertidal mudflats and shoals, and the invasive plant formed a strip in the southeast–northwest direction. S. alterniflora in the SMNNR was patchy in the mudflats of the Dandou Sea, occupying the largest area in the buffer zone, followed by the experimental zone. The area of S. alterniflora in the HDNNR was less than 1 km2, and the invasive plant was patchy along the coast of the experimental zone.

4. Discussion

4.1. Landsat-Based Detection of S. Alterniflora Invasion

Remote sensing has been widely used in previous studies of S. alterniflora invasion to observe population development, detect spatiotemporal patterns, and characterize landscape dynamics [11,14,39,40]. However, an up-to-date dataset of S. alterniflora invasion at the national scale has been lacking in China. The CAS S. alterniflora dataset developed in this study achieved an updated and reliable mapping result of S. alterniflora invasion in mainland China from multiple aspects. This dataset documents the newest areas and current distribution of S. alterniflora (2015), the knowledge of which is crucial for dealing with the rapid and extensive expansion of S. alterniflora 40 years after its introduction. The OLI images from the newly launched Landsat 8 ensured improved mapping results superior to previous ones due to the greater number of spectral bands, superior spectral information, and greater availability of images compared with previous data sources with moderate spatial resolution [26]. In addition, Landsat series’ satellites can provide long-term images to reconstruct the historical patterns of S. alterniflora, which can ensure data consistency. Furthermore, the OBIA method presents great advantages with respect to utilizing textural, geometric, and contextual features, avoiding salt-and-pepper noise, and accordingly improving classification accuracy and efficiency [32,33,41]. The FbSP optimizer developed for automatically determining optimal segmentation parameters can improve segmentation accuracy and reduce the operation time, and it is operator-independent [36,37]. The SVM classifier provides advantages for OBIA because the number of object samples tend to be fewer than that used by pixel-based approaches [42], and generally achieves higher classification accuracy than other traditional classification methods [11,43,44]. This combination is very effective for the classification of S. alterniflora. Additionally, a large number of training and validation samples from field surveys, which covered the whole coast of mainland China, greatly ensured the classification accuracy. Repetitive manual interpretation and comparison with previous reports at various regions and scales also contributed greatly to the reliability of this dataset.
Due to the variation in data sources, classification methods, and dataset dates among previous studies, there are many uncertainties in the assessments of the invasion mechanism and rates of S. alterniflora. Thus, it is necessary and important to develop multi-temporal datasets to continuously characterize the historical patterns and processes of S. alterniflora invasion. The approach used in this study is suitable to be generalized to build such a database. Remote sensing data of moderate spatial resolution are of limited utility for the detection of objects at fine or detailed scales. Definitely for S. alterniflora, Landsat images are of limited value for delimitating small and narrow patches due to their spectral uniformity, e.g., areas smaller than 1000 m2, especially where S. alterniflora has not gained dominance [3,11]. High-resolution satellite data or the fusion of multiple data sources that cover the long coast of mainland China, combined with new classification methods such as machine learning, are thus needed to be assessed for a more accurate monitoring of S. alterniflora invasion.

4.2. Expansion Dynamics of S. Alterniflora

Monitoring the distribution of S. alterniflora has received extensive attention in China [3,14,23,45,46]. For mainland China, there were three studies investigated the distribution of S. alterniflora along the coast [10,12,14]. Specifically, two studies reported the estimated area and distribution of S. alterniflora around 2007 over the coast of mainland China (Table 3). Zuo et al. [12] generated the first mapping results of the distribution of S. alterniflora around 2007 using Landsat Thematic Mapper (TM) and CBERS images and categorization threshold methods. Subsequently, Lu and Zhang [10] investigated the spatial distribution of S. alterniflora around 2007 again based on CBERS images and a combination of supervised classification and visual interpretation. These two studies obtained similar results in the area of S. alterniflora. However, there was a pronounced difference between these studies in the distribution of S. alterniflora; the former study found S. alterniflora in Liaoning Province, whereas the latter did not (Table 3). Recently, Zhang et al. [14] examined the temporal change of S. alterniflora and identified S. alterniflora in Huludao, Liaoning Province, which was not validated by field investigation. Our mapping results confirmed that there was no S. alterniflora invasion in Liaoning as of 2015. During our field surveys, we found only some small patches of Spartina anglica (S. anglica) along the coasts of Jinzhou and Xingcheng in this province (Figure 8). The spectral and phenological similarity between S. alterniflora and S. anglica may led to the misclassification of S. alterniflora in Liaoning. In the future, it is necessary to investigate the possibility for the accurately differentiating S. alterniflora from S. anglica by the fusion of Landsat images and other data sources with finer resolution, such as Sentinel-2 or hyperspectral data [47,48].
The spread of S. alterniflora is commonly by vegetative propagation after its artificial planting, which makes the S. alterniflora present in clusters in most of the coasts. In this study, the total area of S. alterniflora was estimated to be 545.80 km2, which indicates a mean expansion rate of 137 km2 per decade from its introduction in China. Our finding and the previous estimates at the mainland China scale suggest that S. alterniflora expanded rapidly over a total area greater than 200 km2 during the intervening decade. We also observed a northward expansion of S. alterniflora in mainland China. In our study, we identified S. alterniflora in northern Hebei, whereas the northern limit of the distribution reported by Lu and Zhang [10] was in Tianjin. Previous studies documented that S. alterniflora has strong adaptability in a variety of substrates [8,9]. Thus, although artificial planting has played a role, climate warming is probably the main driving force for the northward expansion of S. alterniflora, as the warming temperature meeting the ecological niche requirements for S. alterniflora growth. Considering the apparent consequences of S. alterniflora invasion in southern areas and the warming climate, there is a need to respond to this plant invasion in Hebei, and even in Liaoning Province, in spite of no S. alterniflora being identified at present.

4.3. Potential Effects of S. alterniflora Invasion

S. alterniflora was originally introduced in China to protect dikes and promote silting for land reclamation [9,11,12]. In some areas along China’s coast, S. alterniflora played vital roles in achieving these goals. The deep root systems and high salt and wave tolerance of S. alterniflora have greatly reduced the influences of wind waves and typhoons along the coast. For example, the distribution of S. alterniflora over the coast of Winzhou of Zhejiang had significantly protected the coastal environment against typhoon in 1990 and 1994 [9]. Moreover, S. alterniflora has apparently contributed to land reclamation in some areas, especially on the coast of Jiangsu Province, where the shoreline has obviously extended seaward [49]. The high biomass and coverage of S. alterniflora not only significantly traps the sediment from seawater, but also has great potential for carbon sequestration and the production of animal fodder and biofuels [9,10,50]. In addition, S. alterniflora provides important shelter and food for many terrestrial animal, waterfowl, and fish communities [51,52]. Given the high productivity, extensive distribution, and rapid expansion of S. alterniflora, it is worth deeply studying the scientific utilization S. alterniflora.
Even so, the negative consequences of S. alterniflora expansion were being increasingly recognized. High-density areas of S. alterniflora can cause microtopographical changes in ports and block waterways. Furthermore, they can threaten coastal water quality by affecting the exchange capacity of seawater and impede coastal economic development [9]. Thus, effective control of the S. alterniflora invasion in such regions is necessary. Although the extensive areas of S. alterniflora have high carbon sequestration potential, they also have high levels of methane emission [14,53,54]. Therefore, their capacity to mitigate global warming requires further assessments. Owing to its high adaptability, S. alterniflora has encroached upon large mudflat areas, which has reduced the foraging habitat for waterfowls, such as the Larus saundersi [5,55]. Moreover, the invasive S. alterniflora has replaced numerous native plants, including Phragmites australis, Suaeda glauca, mangroves, and Scirpus planiculmis, which has affected ecosystem structures and processes [11,23], habitat suitability for endangered waterfowl [56,57], and regional tourism [9]. As found in our field investigation, the encroachment of S. alterniflora to Suaeda glauca noticeably affected the original beautiful landscape “red beach”. Meanwhile, extensive S. alterniflora were identified in the NNRs (Figure 7), which were designed for protecting native species. Therefore, the potential effects of S. alterniflora invasion should be objectively evaluated at local scales to allow scientific and region-specific decisions to promote sustainable coastal ecosystems and economic development.

5. Conclusions

In this study, we have mapped the spatial distribution of S. alterniflora invasion in 2015 by applying OBIA and SVM approaches to multiple scenes of Landsat 8 OLI images over the coast zone of mainland China. The classification method and data source yielded reliable spatial information for S. alterniflora in 2015 with high accuracy, which was validated by a large number of ground truth samples. This dataset and related analyses are expected to guide scientific management regarding S. alterniflora invasion to promote sustainable coastal ecosystems. The up-to-date observation revealed that the total area of S. alterniflora was about 545.80 km2; this exotic species was identified from the Nanpu coast of Hebei in the northernmost region to Dafengjiang Estuary of Guangxi Province in the southernmost area. Nearly 92% of the total area of S. alterniflora was distributed within four provinces, including Jiangsu, Shanghai, Zhejiang, and Fujian (500.21 km2), which need particular attention. In addition, seven of 32 NNRs that were established to protect native animal or plant species over the coast of mainland China have been markedly invaded by S. alterniflora, with the total area accounting for about one-third of the total invasion area in mainland China. Given the rapid expansion of S. alterniflora since its introduction and the serious ecological effects, effective response decisions are urgently needed.

Author Contributions

M.L. conceived and designed the research, processed the data, and wrote the manuscript draft. D.M. helped design the research and revise the manuscript. Z.W., L.L. and Y.Z. helped conceive the research and review the manuscript. W.M. conducted the fieldwork and analyzed the data. M.J. and C.R. contributed materials.

Funding

This study is jointly supported by the National Key R&D Program of China (2016YFC0500201), the Science &Technology Basic Resources Investigation Program of China (2017FY100706), the Strategic Priority Research Program of the Chinese Academy of Sciences (XDA19040503), and the National Natural Science Foundation of China (41771383).

Acknowledgments

We would like to thank the USGS for providing satellite images and thank the three anonymous reviewers for the constructive comments on our manuscript.

Conflicts of Interest

The authors declare no conflict of interest.

References

  1. Alvarez-Taboada, F.; Paredes, C.; Julián-Pelaz, J. Mapping of the invasive species Hakea sericea using unmanned aerial vehicle (UAV) and WorldView-2 imagery and an object-oriented approach. Remote Sens. 2017, 9, 913. [Google Scholar] [CrossRef]
  2. MacDougall, A.S.; Boucher, J.; Turkington, R.; Bradfield, G.E. Patterns of plant invasion along an environmental stress gradient. J. Veg. Sci. 2009, 17, 47–56. [Google Scholar] [CrossRef]
  3. Liu, C.; Jiang, H.; Zhang, S.; Li, C.; Pan, X.; Lu, J.; Hou, Y. Expansion and Management Implications of Invasive Alien Spartina alterniflora in Yancheng Salt Marshes, China. Open J. Ecol. 2016, 6, 113–128. [Google Scholar] [CrossRef]
  4. Mack, R.N.; Simberloff, D.; Lonsdale, W.M.; Evans, H.; Clout, M.; Bazzaz, F.A. Biotic invasions: Causes, epidemiology, global consequences, and control. Ecol. Appl. 2000, 10, 689–710. [Google Scholar] [CrossRef]
  5. Gan, X.; Cai, Y.; Choi, C.Y.; Ma, Z.; Chen, J.; Li, B. Potential impacts of invasive Spartina alterniflora on spring bird communities at Chongming Dongtan, a Chinese wetland of international importance. Estuar. Coast. Shelf Sci. 2009, 83, 211–218. [Google Scholar] [CrossRef]
  6. Levin, L.A.; Neira, C.; Grosholz, E.D. Invasive cordgrass modifies wetland trophic function. Ecology 2006, 87, 419–432. [Google Scholar] [CrossRef] [PubMed]
  7. Zhang, Y.; Huang, G.; Wang, W.; Chen, L.; Lin, G. Interactions between mangroves and exotic Spartina in an anthropogenically disturbed estuary in southern China. Ecology 2012, 93, 588–597. [Google Scholar] [CrossRef] [PubMed]
  8. An, S.; Gu, B.; Zhou, C.; Wang, Z.; Deng, Z.; Zhi, Y.; Li, H.; Chen, L.; Yu, D.; Liu, Y. Spartina invasion in China: Implications for invasive species management and future research. Weed Res. 2007, 47, 183–191. [Google Scholar] [CrossRef]
  9. Chung, C.H. Forty years of ecological engineering with Spartina plantations in China. Ecol. Eng. 2006, 27, 49–57. [Google Scholar] [CrossRef]
  10. Lu, J.; Zhang, Y. Spatial distribution of an invasive plant Spartina alterniflora and its potential as biofuels in China. Ecol. Eng. 2013, 52, 175–181. [Google Scholar] [CrossRef]
  11. Wang, A.; Chen, J.; Jing, C.; Ye, G.; Wu, J.; Huang, Z.; Zhou, C. Monitoring the invasion of Spartina alterniflora from 1993 to 2014 with Landsat TM and SPOT 6 Satellite Data in Yueqing Bay, China. PLoS ONE 2015, 10, e0135538. [Google Scholar] [CrossRef] [PubMed]
  12. Zuo, P.; Zhao, S.; Liu, C.; Wang, C.; Liang, Y. Distribution of Spartina spp. along China’s coast. Ecol. Eng. 2012, 40, 160–166. [Google Scholar] [CrossRef]
  13. Jia, M.; Wang, Z.; Zhang, Y.; Mao, D.; Wang, C. Monitoring loss and recovery of mangrove forests during 42 years: The achievements of mangrove conservation in China. Int. J. Appl. Obs. 2018, 73, 535–545. [Google Scholar] [CrossRef]
  14. Zhang, D.; Hu, Y.; Liu, M.; Chang, Y.; Yan, X.; Bu, R.; Zhao, D.; Li, Z. Introduction and spread of an exotic plant, Spartina alterniflora, along coastal marshes of China. Wetlands 2017, 37, 1181–1193. [Google Scholar] [CrossRef]
  15. Chen, Y.; Chen, G.; Ye, Y. Coastal vegetation invasion increases greenhouse gas emission from wetland soils but also increases soil carbon accumulation. Sci. Total Environ. 2015, 526, 19–28. [Google Scholar] [CrossRef] [PubMed]
  16. Bradley, B.A. Remote detection of invasive plants: A review of spectral, textural and phenological approaches. Biol. Invasions 2014, 16, 1411–1425. [Google Scholar] [CrossRef]
  17. Lawrence, R.L.; Wood, S.D.; Sheley, R.L. Mapping invasive plants using hyperspectral imagery and Breiman Cutler classifications (Random Forest). Remote Sens. Environ. 2006, 100, 356–362. [Google Scholar] [CrossRef]
  18. Niphadkar, M.; Nagendra, H. Remote sensing of invasive plants: Incorporating functional traits into the picture. Int. J. Remote Sens. 2016, 37, 3074–3085. [Google Scholar] [CrossRef]
  19. Underwood, E.; Ustin, S.; DiPietro, D. Mapping nonnative plants using hyperspectral imagery. Remote Sens. Environ. 2003, 86, 150–161. [Google Scholar] [CrossRef]
  20. Huang, C.; Asner, G.P. Applications of remote sensing to alien invasive plant studies. Sensors 2009, 9, 4869–4889. [Google Scholar] [CrossRef]
  21. Müllerová, J.; Pergl, J.; Pyšek, P. Remote sensing as a tool for monitoring plant invasions: Testing the effects of data resolution and image classification approach on the detection of a model plant species Heracleum mantegazzianum (giant hogweed). Int. J. Appl. Obs. 2013, 25, 55–65. [Google Scholar] [CrossRef]
  22. Civille, J.C.; Sayce, K.; Smith, S.D.; Strong, D.R. Reconstructing a century of Spartina alterniflora invasion with historical records and contemporary remote sensing. Ecoscience 2005, 12, 330–338. [Google Scholar] [CrossRef]
  23. Wan, H.; Wang, Q.; Jiang, D.; Fu, J.; Yang, Y.; Liu, X. Monitoring the invasion of Spartina alterniflora using very high resolution unmanned aerial vehicle imagery in Beihai, Guangxi (China). Sci. World J. 2014, 2014, 638296. [Google Scholar] [CrossRef] [PubMed]
  24. Liu, M.; Li, H.; Li, L.; Man, W.; Jia, M.; Wang, Z.; Lu, C. Monitoring the invasion of spartina alterniflora using multi-source high-resolution imagery in the Zhangjiang Estuary, China. Remote Sens. 2017, 9, 539. [Google Scholar] [CrossRef]
  25. O’Donnell, J.; Schalles, J. Examination of abiotic drivers and their influence on Spartina alterniflora biomass over a twenty-eight year period using Landsat 5 TM Satellite Imagery of the Central Georgia Coast. Remote Sens. 2016, 8, 477. [Google Scholar] [CrossRef]
  26. Roy, D.P.; Wulder, M.A.; Loveland, T.R.; Woodcock, C.E.; Allen, R.G.; Anderson, M.C.; Helder, D.; Irons, J.R.; Johnson, D.M.; Kennedy, R.; et al. Landsat-8: Science and product vision for terrestrial global change research. Remote Sens. Environ. 2014, 145, 154–172. [Google Scholar] [CrossRef]
  27. Ma, Z.; Melville, D.S.; Liu, J.; Chen, Y.; Yang, H.; Ren, W.; Zhang, Z.; Piersma, T.; Li, B. Rethinking China’s new great wall. Science 2014, 346, 912–914. [Google Scholar] [CrossRef] [PubMed]
  28. Ouyang, Z.; Zhang, M.; Xie, X.; Shen, Q.; Guo, H.; Zhao, B. A comparison of pixel-based and object-oriented approaches to VHR imagery for mapping saltmarsh plants. Ecol. Inform. 2011, 6, 136–146. [Google Scholar] [CrossRef]
  29. Yu, Q.; Gong, P.; Clinton, N.; Biging, G.; Kelly, M.; Schirokauer, D. Object-based detailed vegetation classification with airborne high spatial resolution remote sensing imagery. Photogramm. Eng. Rem. Sci. 2006, 72, 799–811. [Google Scholar] [CrossRef]
  30. Ouyang, Z.; Gao, Y.; Xie, X.; Guo, H.; Zhang, T.; Zhao, B. Spectral discrimination of the invasive plant spartina alterniflora at multiple phenological stages in a saltmarsh wetland. PLoS ONE 2013, 8, e67315. [Google Scholar] [CrossRef] [PubMed]
  31. Gao, Z.; Zhang, L. Multi-seasonal spectral characteristics analysis of coastal salt marsh vegetation in Shanghai, China. Estuar. Coast. Shelf Sci. 2006, 69, 217–224. [Google Scholar] [CrossRef]
  32. Dronova, I. Object-based image analysis in wetland research: A review. Remote Sens. 2015, 7, 6380–6413. [Google Scholar] [CrossRef]
  33. Jawak, S.D.; Devliyal, P.; Luis, A.J. A comprehensive review on pixel oriented and object oriented methods for information extraction from remotely sensed satellite images with a special emphasis on cryospheric applications. Adv. Remote Sens. 2015, 4, 177–195. [Google Scholar] [CrossRef]
  34. Mountrakis, G.; Im, J.; Ogole, C. Support vector machines in remote sensing: A review. ISPRS J. Photogramm. 2011, 66, 247–259. [Google Scholar] [CrossRef]
  35. Pal, M.; Mather, P.M. Support vector machines for classification in remote sensing. Int. J. Remote Sens. 2005, 26, 1007–1011. [Google Scholar] [CrossRef]
  36. Tong, H.; Maxwell, T.; Zhang, Y.; Dey, V. A supervised and fuzzy-based approach to determine optimal multi-resolution image segmentation parameters. Photogramm. Eng. Rem. Sci. 2012, 78, 1029–1044. [Google Scholar] [CrossRef]
  37. Zhang, Y.; Maxwell, T.; Tong, H.; Dey, V. Development of supervised software tool for automated determination of optimal segmentation parameters for eCognition. In Proceedings of the ISPRS TC VII symposium-100 Years ISPRS, Vienna, Austria, 5–7 July 2010. [Google Scholar]
  38. Huang, C.; Davis, L.S.; Townshend, J.R.G. An assessment of support vector machines for land cover classification. Int. J. Remote Sens. 2002, 23, 725–749. [Google Scholar] [CrossRef]
  39. Huang, H.; Zhang, L. A study of the population dynamics of Spartina alterniflora at Jiuduansha shoals, Shanghai, China. Ecol. Eng. 2007, 29, 164–172. [Google Scholar] [CrossRef]
  40. Long, X.; Liu, L.; Shao, T.; Shao, H.; Liu, Z. Developing and sustainably utilize the coastal mudflat areas in China. Sci. Total Environ. 2016, 569, 1077–1086. [Google Scholar] [CrossRef] [Green Version]
  41. Whiteside, T.G.; Boggs, G.S.; Maier, S.W. Comparing object-based and pixel-based classifications for mapping savannas. Int. J. Appl. Obs. 2011, 13, 884–893. [Google Scholar] [CrossRef]
  42. Tzotsos, A.; Argialas, D.A. Support vector machine approach for object based image analysis. In Object-Based Image Analysis; Springer: Berlin/Heidelberg, Germany, 2008; pp. 663–677. [Google Scholar]
  43. Heumann, B.W. An object-based classification of mangroves using a hybrid decision tree-support vector machine approach. Remote Sens. 2011, 3, 2440–2460. [Google Scholar] [CrossRef]
  44. Mantero, P.; Moser, G.; Serpico, S.B. Partially supervised classification of remote sensing images through SVM-based probability density estimation. IEEE T. Geosci. Remote Sens. 2005, 43, 559–570. [Google Scholar] [CrossRef]
  45. Liu, X.; Liu, H.; Gong, H.; Lin, Z.; Lv, S. Appling the one-class classification method of maxent to detect an invasive plant Spartina alterniflora with time-series analysis. Remote Sens. 2017, 9, 1120. [Google Scholar] [CrossRef]
  46. Zhang, W.; Zeng, C.; Tong, C.; Zhang, Z.; Huang, J. Analysis of the expanding process of the Spartina alterniflora salt marsh in Shanyutan wetland, Minjiang River Estuary by remote sensing. Procedia Environ. Sci. 2011, 10, 2472–2477. [Google Scholar] [CrossRef]
  47. Griffiths, P.; Nendel, C.; Hostert, P. Intra-annual reflectance composites from Sentinel-2 and Landsat for national-scale crop and land cover mapping. Remote Sens. Environ. 2019, 220, 135–151. [Google Scholar] [CrossRef]
  48. Villa, P.; Pinardi, M.; Bolpagni, R.; Gillier, J.; Zinke, P.; Nedelcut, F.; Bresciani, M. Assessing macrophyte seasonal dynamics using dense time series of medium resolution satellite data. Remote Sens. Environ. 2018, 216, 230–244. [Google Scholar] [CrossRef]
  49. Hou, X.; Wu, T.; Hou, W.; Chen, Q.; Wang, Y.; Yu, L. Characteristics of coastline changes in mainland China since the early 1940s. Sci. China Earth Sci. 2016, 59, 1791–1802. [Google Scholar] [CrossRef]
  50. Liu, J.; Han, R.; Su, H.; Wu, Y.; Zhang, L.; Richarson, C.J.; Wang, G. Effects of exotic Spartina alterniflora on vertical soil organic carbon distribution and storage amount in coastal salt marshes in Jiangsu, China. Ecol. Eng. 2017, 106, 132–139. [Google Scholar] [CrossRef] [Green Version]
  51. Cai, B.; He, Q.; An, Y. Spartina alterniflora invasions and effects on crab com-munities in a western Pacific estuary. Ecol. Eng. 2011, 37, 1920–1924. [Google Scholar] [CrossRef]
  52. Feng, J.; Huang, Q.; Qi, F.; Guo, J.; Lin, G. Utilization of exotic Spartina alterniflora by fish community in the mangrove ecosystem of Zhangjiang Estuary: Evidence from stable isotope analyses. Biol. Invasions 2015, 17, 2113–2121. [Google Scholar] [CrossRef]
  53. Gao, G.; Li, P.; Shen, Z.; Qin, Y.; Zhang, X.; Ghoto, K.; Zhu, X.; Zheng, H. Exotic Spartina alterniflora invasion increases CH4 while reduces CO2 emissions from mangrove wetland soils in southeastern China. Sci. Rep. 2018, 8, 9243. [Google Scholar] [CrossRef] [PubMed]
  54. Xiang, J.; Liu, D.; Ding, W.; Yuan, J.; Lin, Y. Invasion chronosequence of Spartina alterniflora on methane emission and organic carbon sequestration in a coastal salt marsh. Atmos. Environ. 2015, 112, 72–80. [Google Scholar] [CrossRef]
  55. Ma, Z.; Gan, X.; Cai, Y.; Chen, J.; Li, B. Effects of exotic Spartina alterniflora on the habitat patch associations of breeding saltmarsh birds at Chongming Dongtan in the Yangtze River estury, China. Biol. Invasions 2011, 13, 1673–1686. [Google Scholar] [CrossRef]
  56. Liu, C.; Jiang, H.; Hou, Y.; Zhang, S.; Su, L.; Li, X.; Pan, X.; Wen, Z. Habitat changes for breeding waterbirds in Yancheng national nature reserve, China: A remote sensing study. Wetlands 2010, 30, 879–888. [Google Scholar] [CrossRef]
  57. Tian, B.; Zhou, Y.; Zhang, L.; Yuan, L. Analyzing the habitat suitability for migratory birds at the Chongming Dongtan nature reserve in Shanghai, China. Estuar. Coast. Shelf Sci. 2008, 80, 296–302. [Google Scholar] [CrossRef]
Figure 1. Location of the study area and the distribution of Ramsar sites and national nature reserves.
Remotesensing 10 01933 g001
Figure 2. Distribution of field survey observations: (a) training samples; (b) validation samples.
Remotesensing 10 01933 g002
Figure 3. Flowchart of the processing scheme for identifying S. alterniflora.
Remotesensing 10 01933 g003
Figure 4. An example of the segmentation process and final segmentation result using the Fuzzy-based Segmentation Parameter (FbSP) optimizer (image path/row: 118/39). (a) Initial segmentation and sub-objects of vegetation (blue); (b) target object (green) formed by the sub-objects (the blue in (a)) for training the FbSP optimizer; (c) the object (yellow) resulting from the second segmentation iteration generated by using the parameters estimated by the FbSP optimizer that achieved convergence with the target object (the green in (b)); (d) final segmentation result yielded by using the parameters estimated in (c); the white rectangle shows the extent of (ac).
Remotesensing 10 01933 g004
Figure 5. Spatial distribution (A), areal proportion (B), and total area (C) of S. alterniflora in the coastal provinces of mainland China in 2015.
Remotesensing 10 01933 g005
Figure 6. S. alterniflora invasion over the hotspot regions in coastal provinces of Mainland China (Landsat-8 operational land imager (OLI) color combination: band 5 = red, band 4 = green, and band 3 = blue).
Remotesensing 10 01933 g006
Figure 7. Spatial distribution of S. alterniflora and statistics of invasive areas at different functional zones within these coastal national nature reserves (NNRs) of Mainland China in 2015.
Remotesensing 10 01933 g007
Figure 8. Photos for S. anglica observed along the coast in Jinzhou (a1,a2) and Xingcheng (b1,b2), Liaoning Province, and the S. alterniflora over the coast of Tangshan, Hebei Province (c1,c2) from the field investigation in 2016.
Remotesensing 10 01933 g008
Table 1. Description of the feature space constructed for image classification.
No.FeatureAttributeCalculation FormulaDescription
1Mean value of each bandSpectral feature C L = 1 n i = 1 n C L i C L i represents the value of pixel i in band L, n is the number of pixels constructing an object, i = 1, 2, n ,   n L is the number of bands and L = 1, 2, n L ,   C ¯ L is the mean value of each band
2BrightnessSpectral feature B r i g h t n e s s = 1 n L i = 1 n L C ¯ L
3Standard deviation of each bandSpectral feature S t d v L = 1 n 1 · i = 1 n ( C L i C ¯ L ) 2
4GLCM homogeneityTexture feature H o m o g e n e i t y = i , j = 0 N 1 P i j 1 + ( i j ) 2 P i j denotes element i , j of the normalized symmetrical GLCM, and N is the number of gray levels in the image. Homogeneity is a feature related to the heterogeneity of pixels within an object. The values range from 0 to 1, and a higher value indicates a smoother texture feature.
5Length–width ratioShape featureLength-width ratio = Length /WidthThe length-width ratio is useful for extracting linear features such as roads, dikes, and ditches.
6Shape indexShape feature S I = P 4 · A P is the object perimeter, and A is the object area.
7NDVISpectral index N D V I = N I R R e d N I R + R e d NDVI utilizes the differential reflection of green vegetation in the red and near-infrared (NIR) portion to characterize vegetation condition.
8NDWISpectral index N D W I = G r e e n N I R G r e e n + N I R The NDWI value of water is positive. In contrast, soil and vegetation on the ground have zero or negative NDWI values.
9LSWISpectral index L S W I = N I R S W I R 1 N I R + S W I R 1 LSWI is sensitive to the total amount of liquid water in vegetation and the soil background.
Table 2. Confusion matrix of S. alterniflora classification result in the coastal zone of Mainland China.
Field Survey PointsClassification Result
S. alternifloraNon-S. alternifloraIn Total
S. alterniflora46759515
Non-S. alterniflora7627352811
Total54327943337
Producer accuracy91%97%
User accuracy86%98%
Overall accuracy96%
Kappa coefficient0.86
Table 3. Characteristics of S. alterniflora distribution at the scale of mainland China from this study and previous studies.
DatasetsEstimated Area (km2)Spatial ExtentsData SourceDataset Date
Zuo et al., 2012 [12]344.51>40°N–~21°27′NLandsat TM & CBERS2007
Lu and Zhang, 2013 [10]341.7839°05′N–21°27′NCBERS2007
Zhang et al., 2017 [14]551.8140°47′N–19°46′NLandsat TM/ETM+2014
This study545.8039°13′N–20°55′NLandsat 8 OLI2015

