Freshwater Fish Habitat Complexity Mapping Using Above and Underwater Structure-From-Motion Photogrammetry

 ,
, 
 and
and
Abstract
1. Introduction
2. Materials and Methods
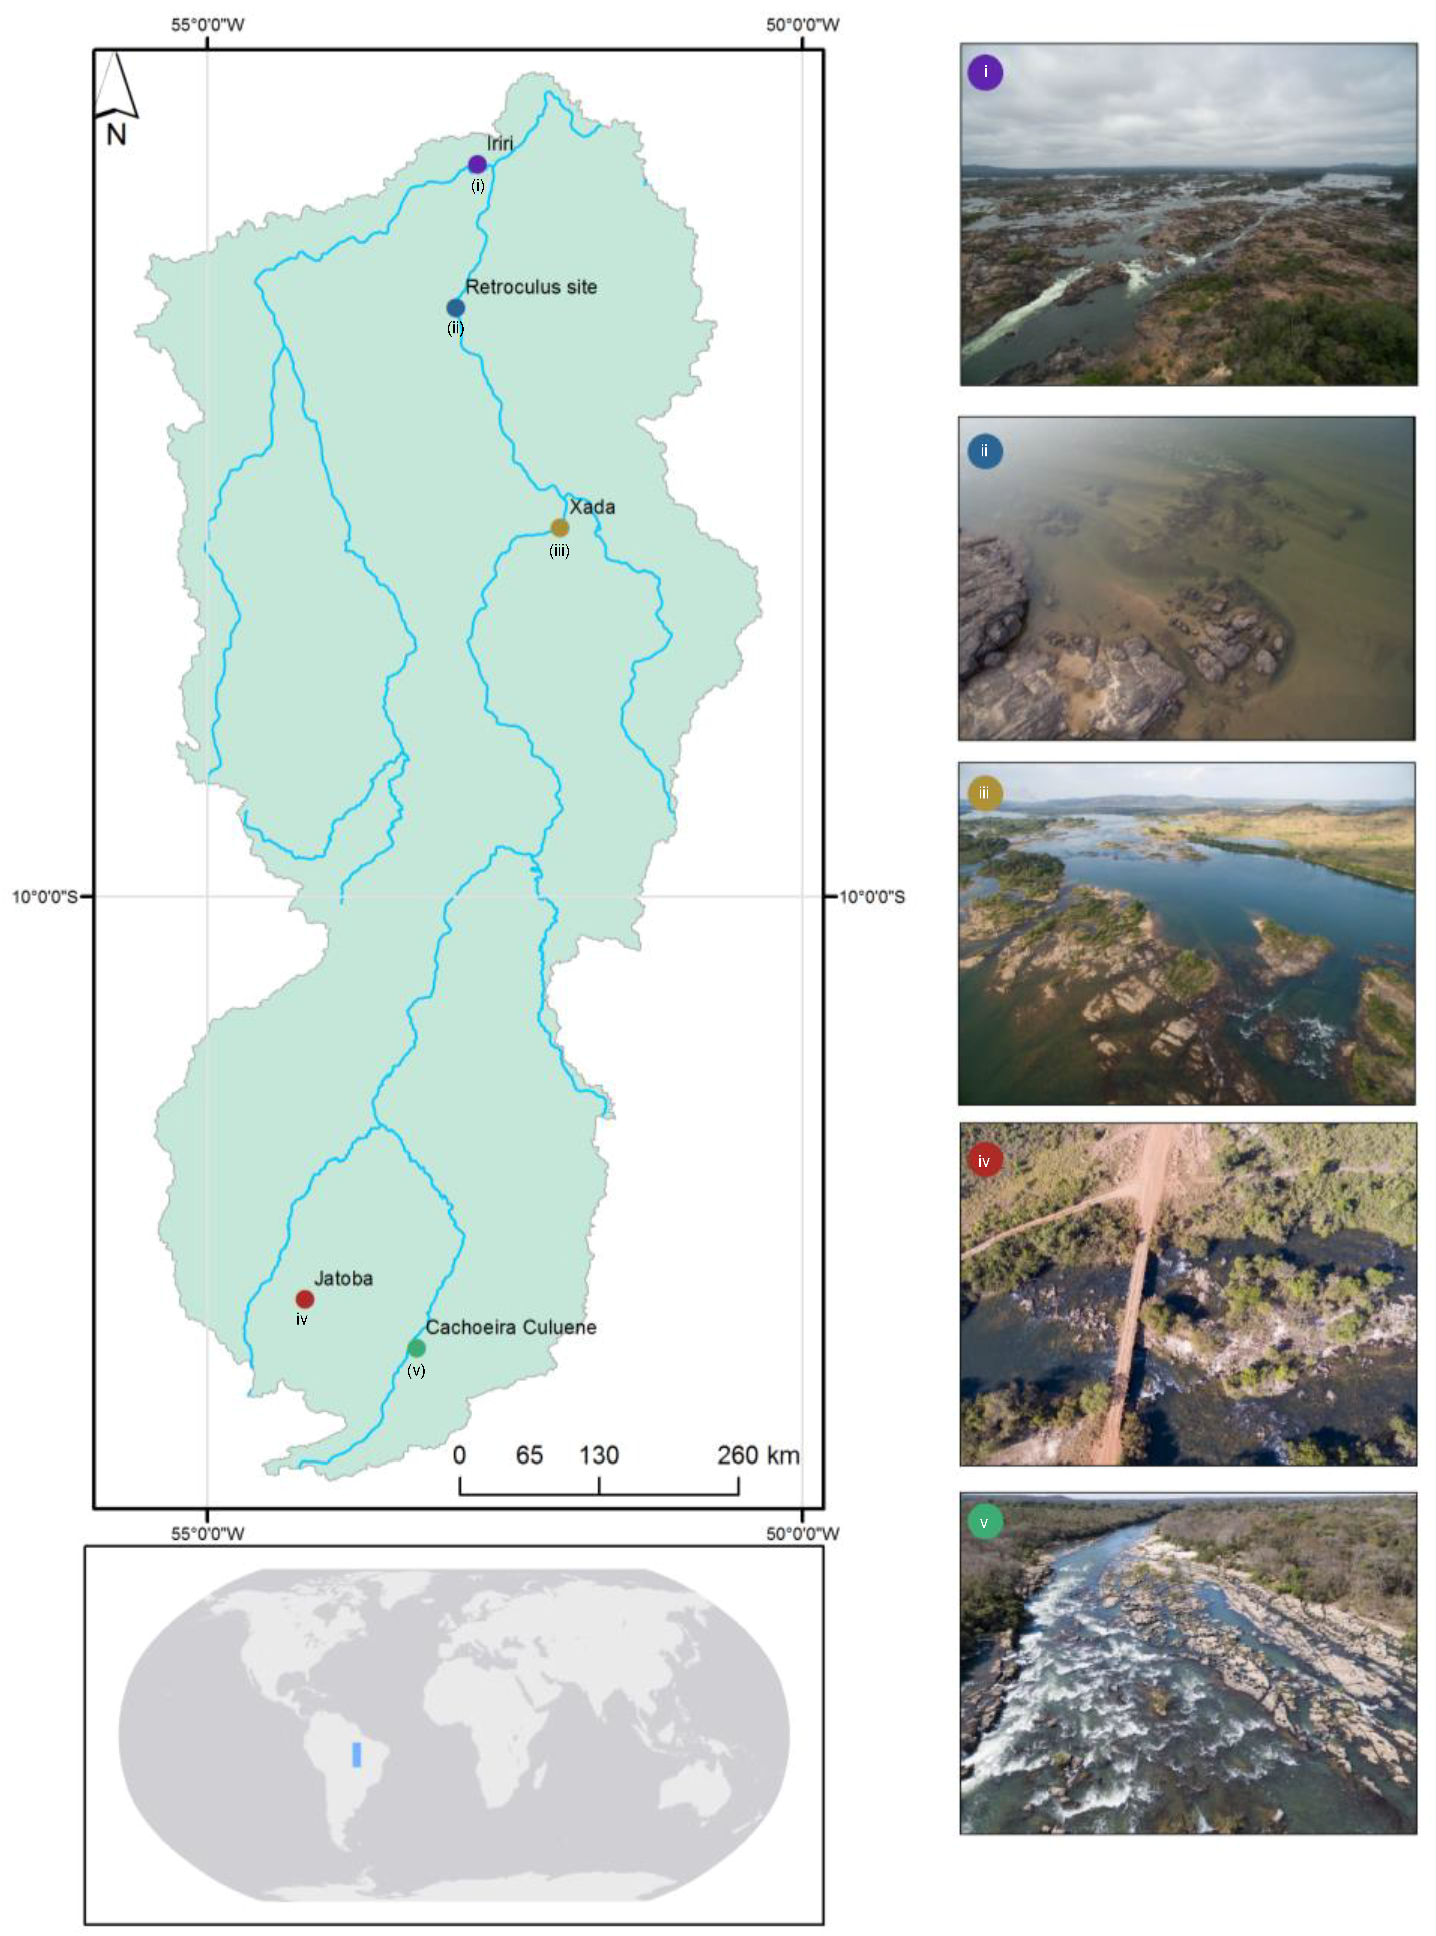
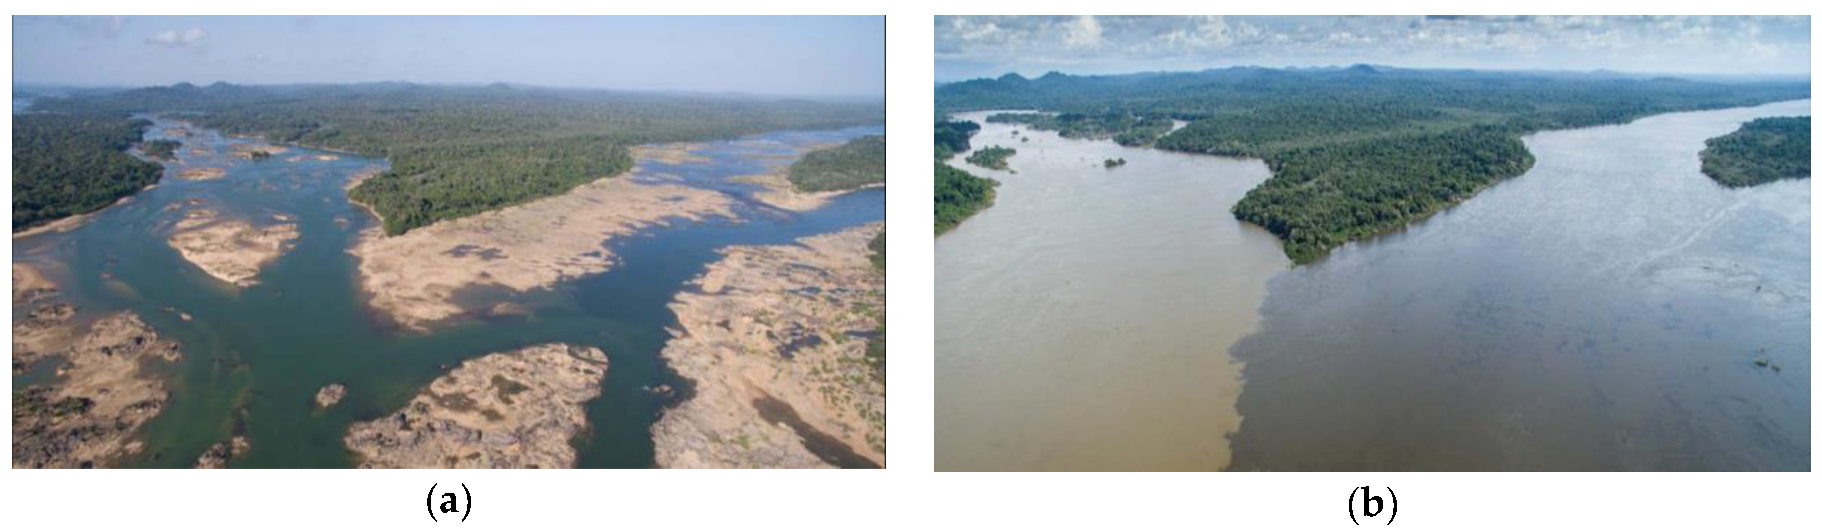
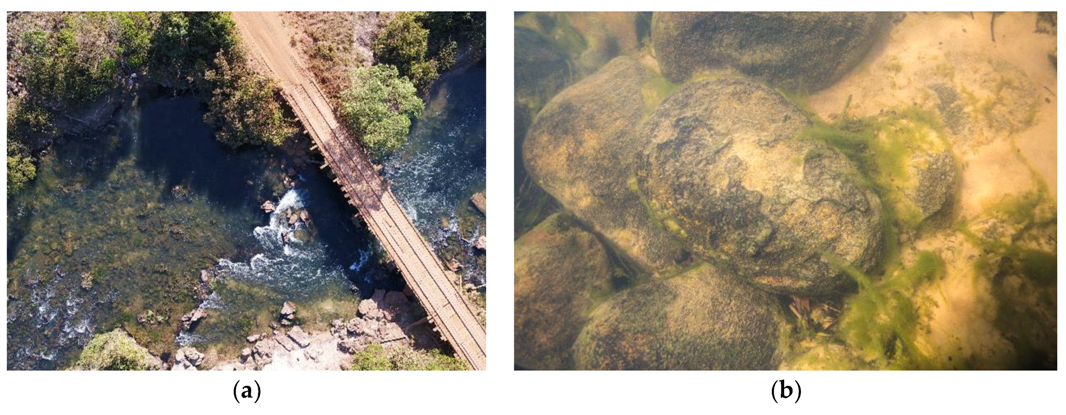
2.1. Study Area
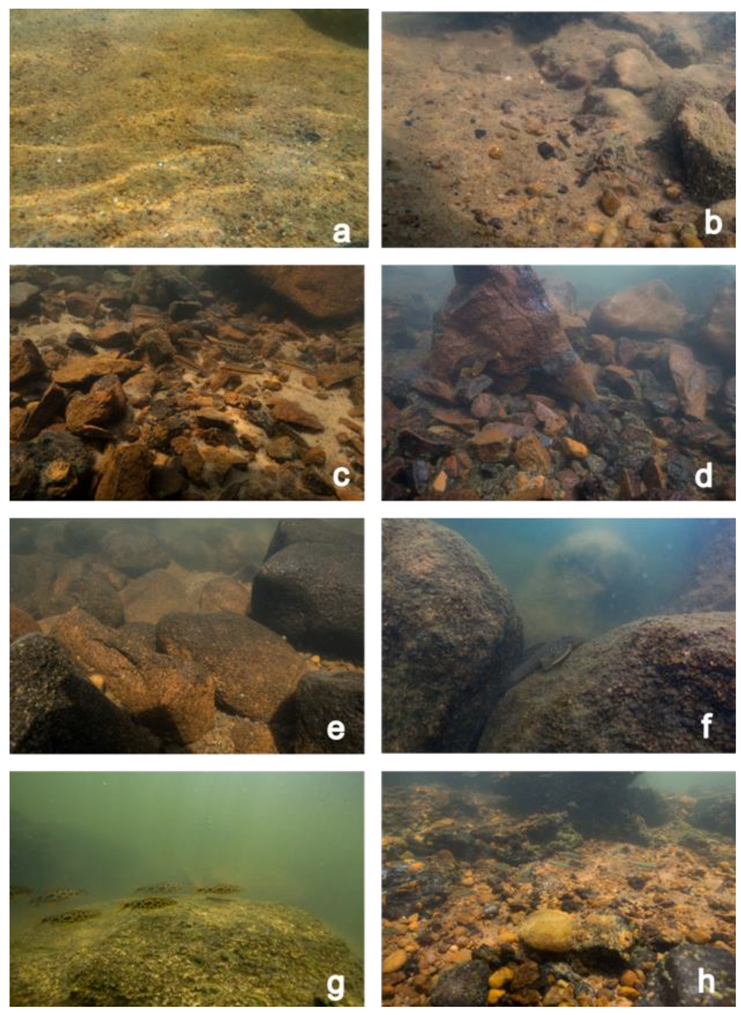
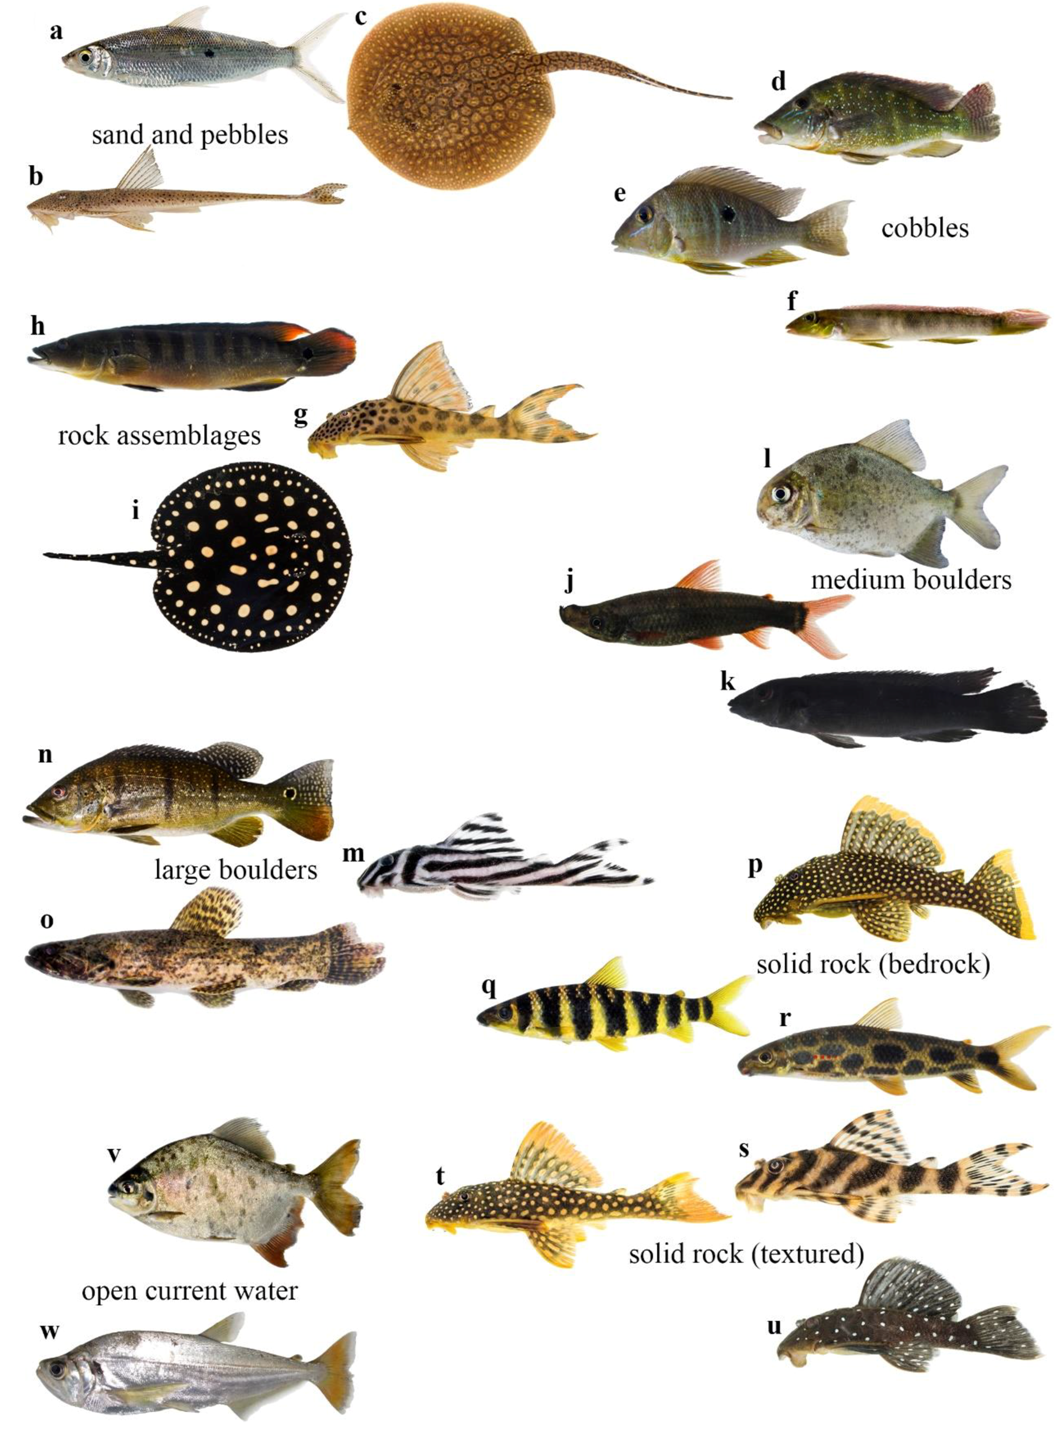
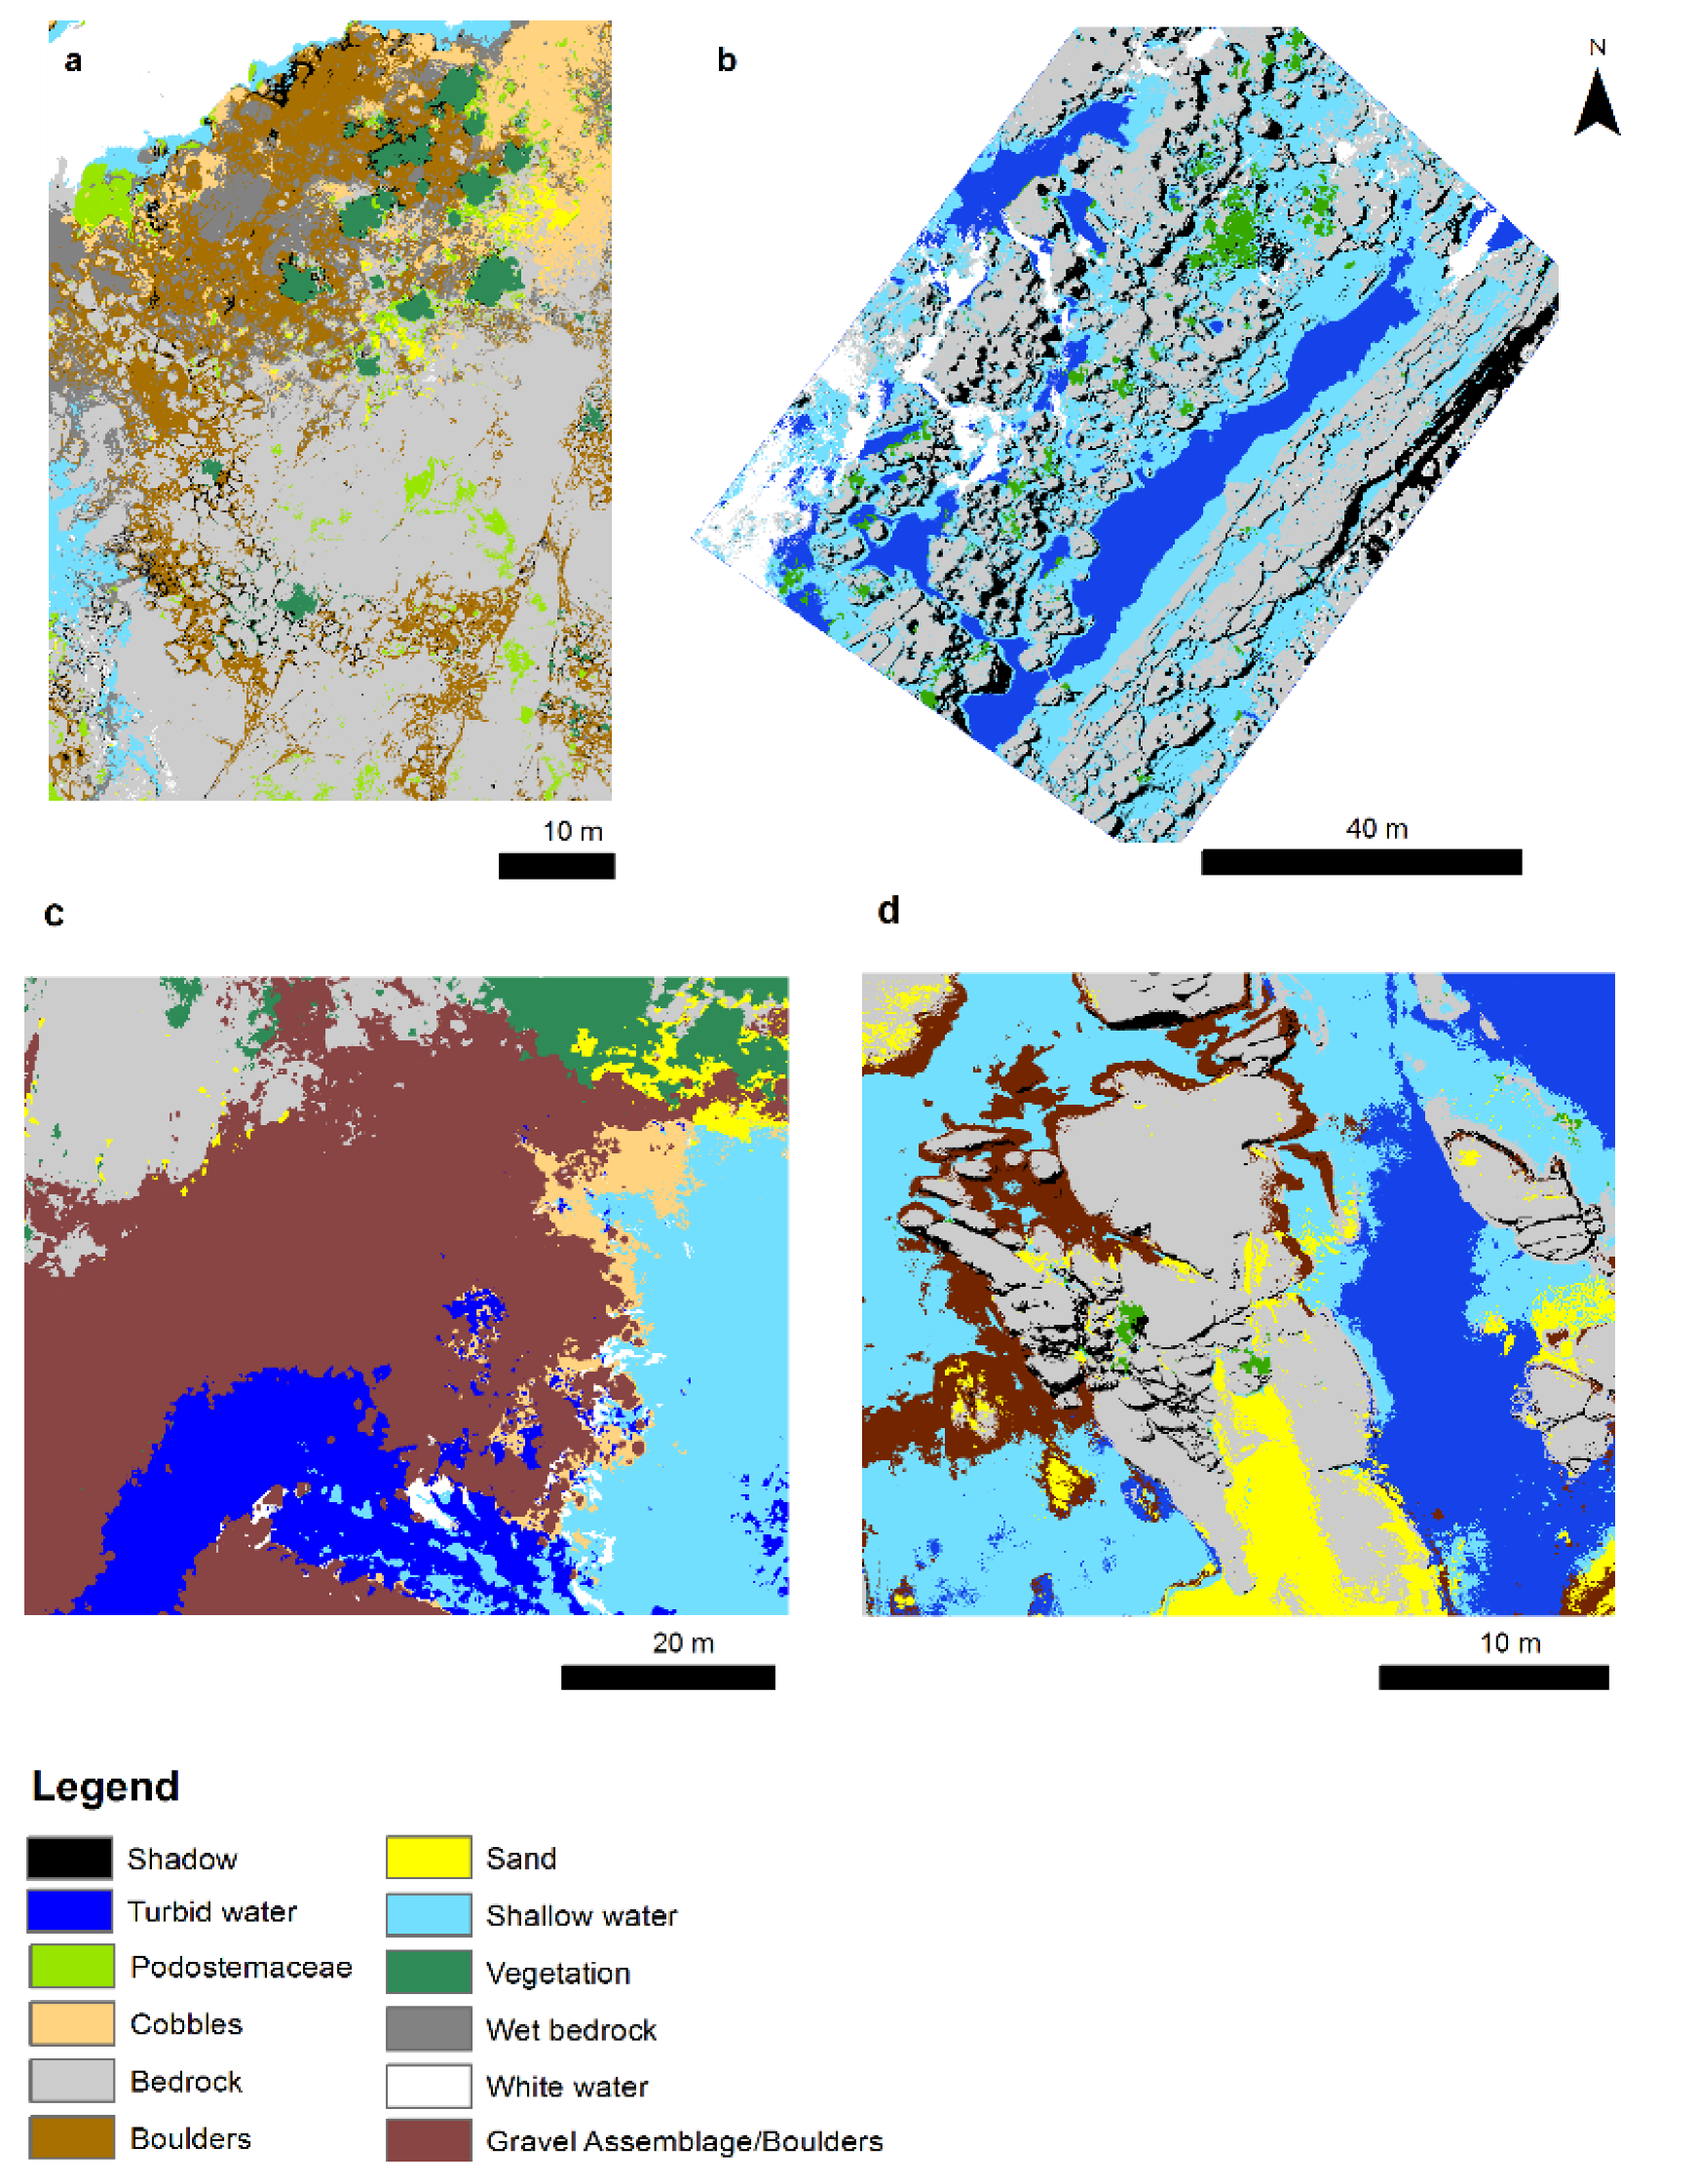
2.2. Habitat Class Descriptions
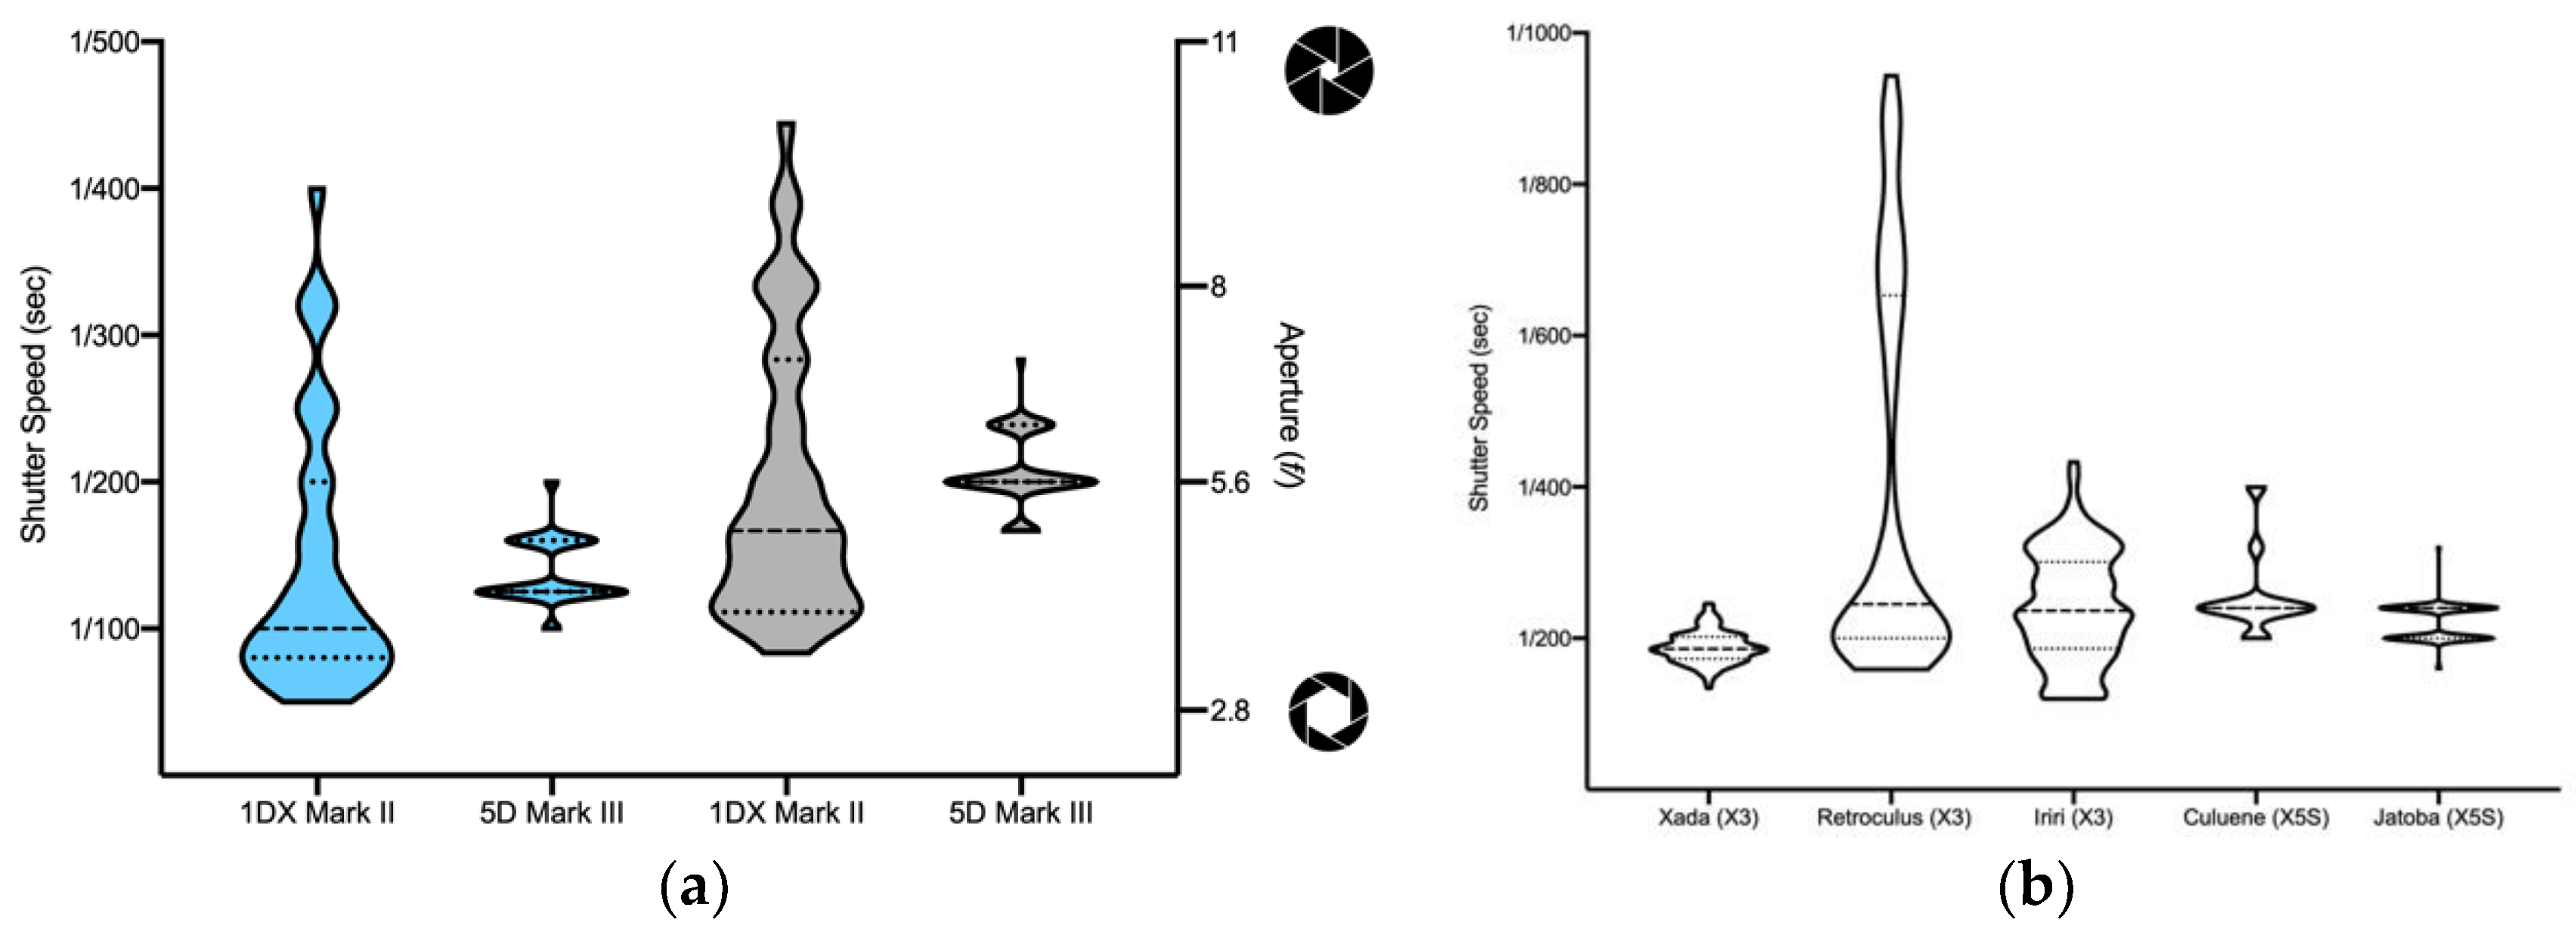
2.3. Unmanned Aerial Vehicle (UAV) and Underwater Photographs
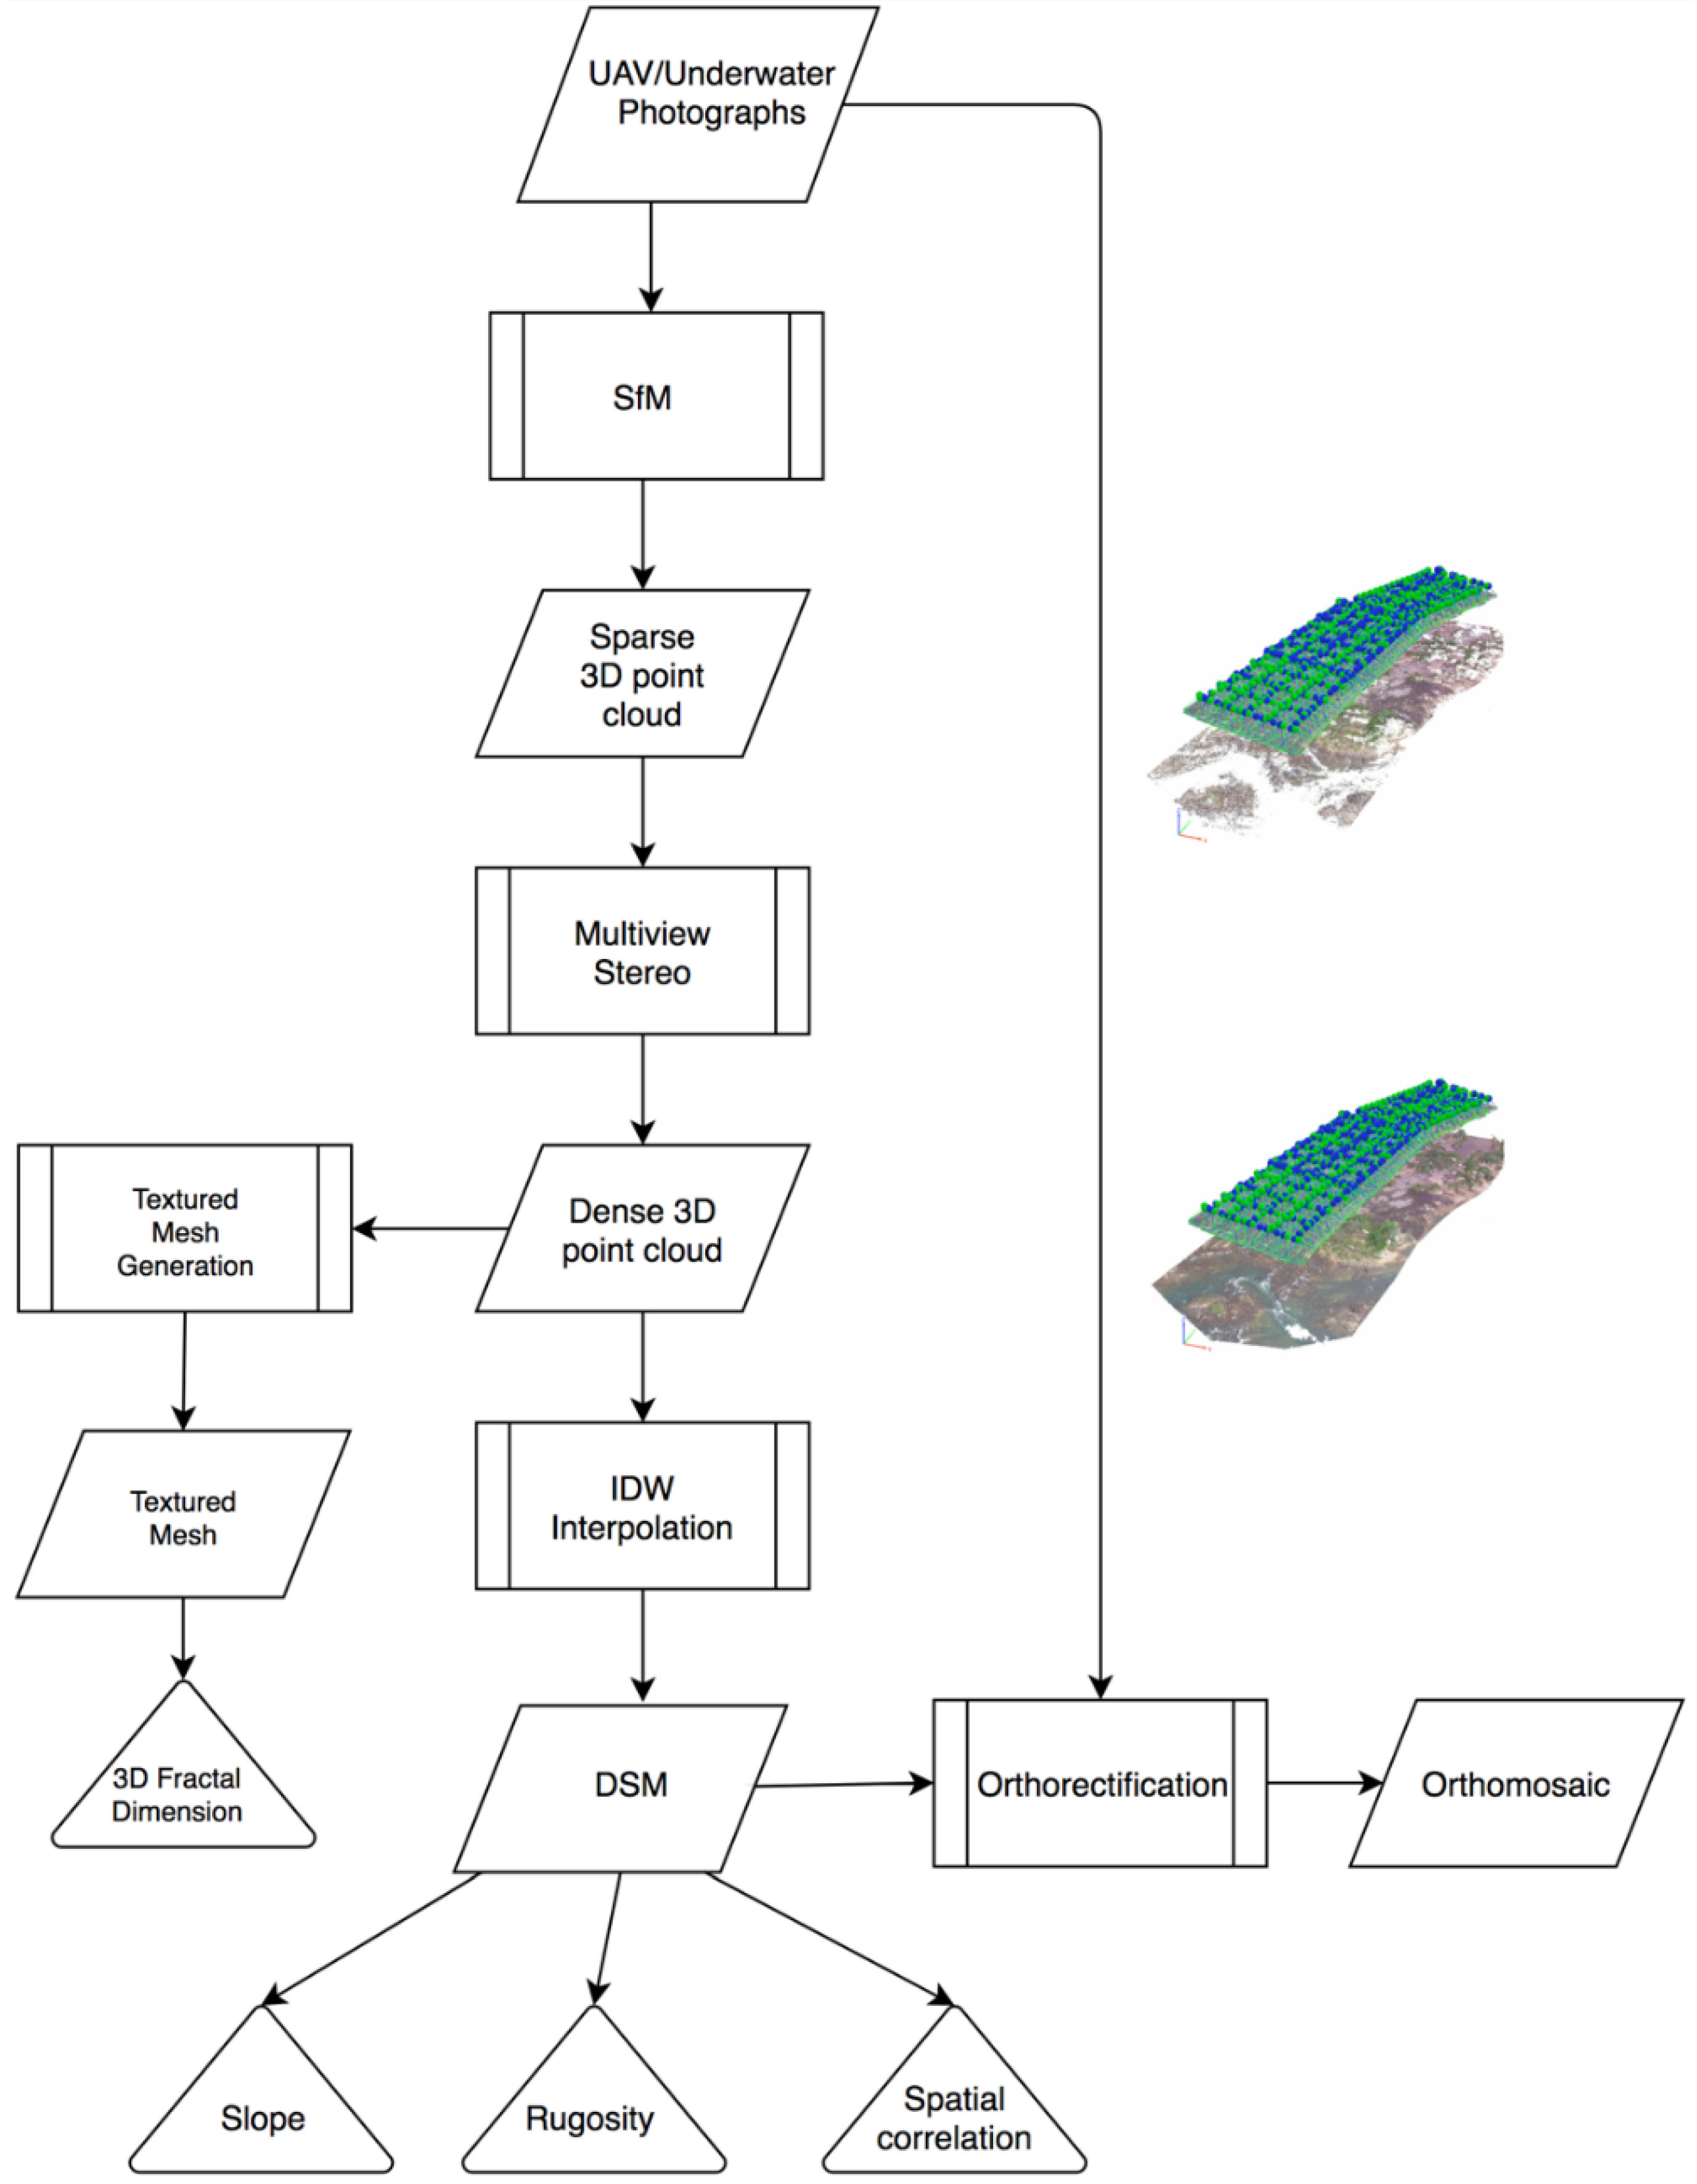
2.4. Structure from Motion (SfM)-Multi-View Stereo (MVS) Photogrammetry Products
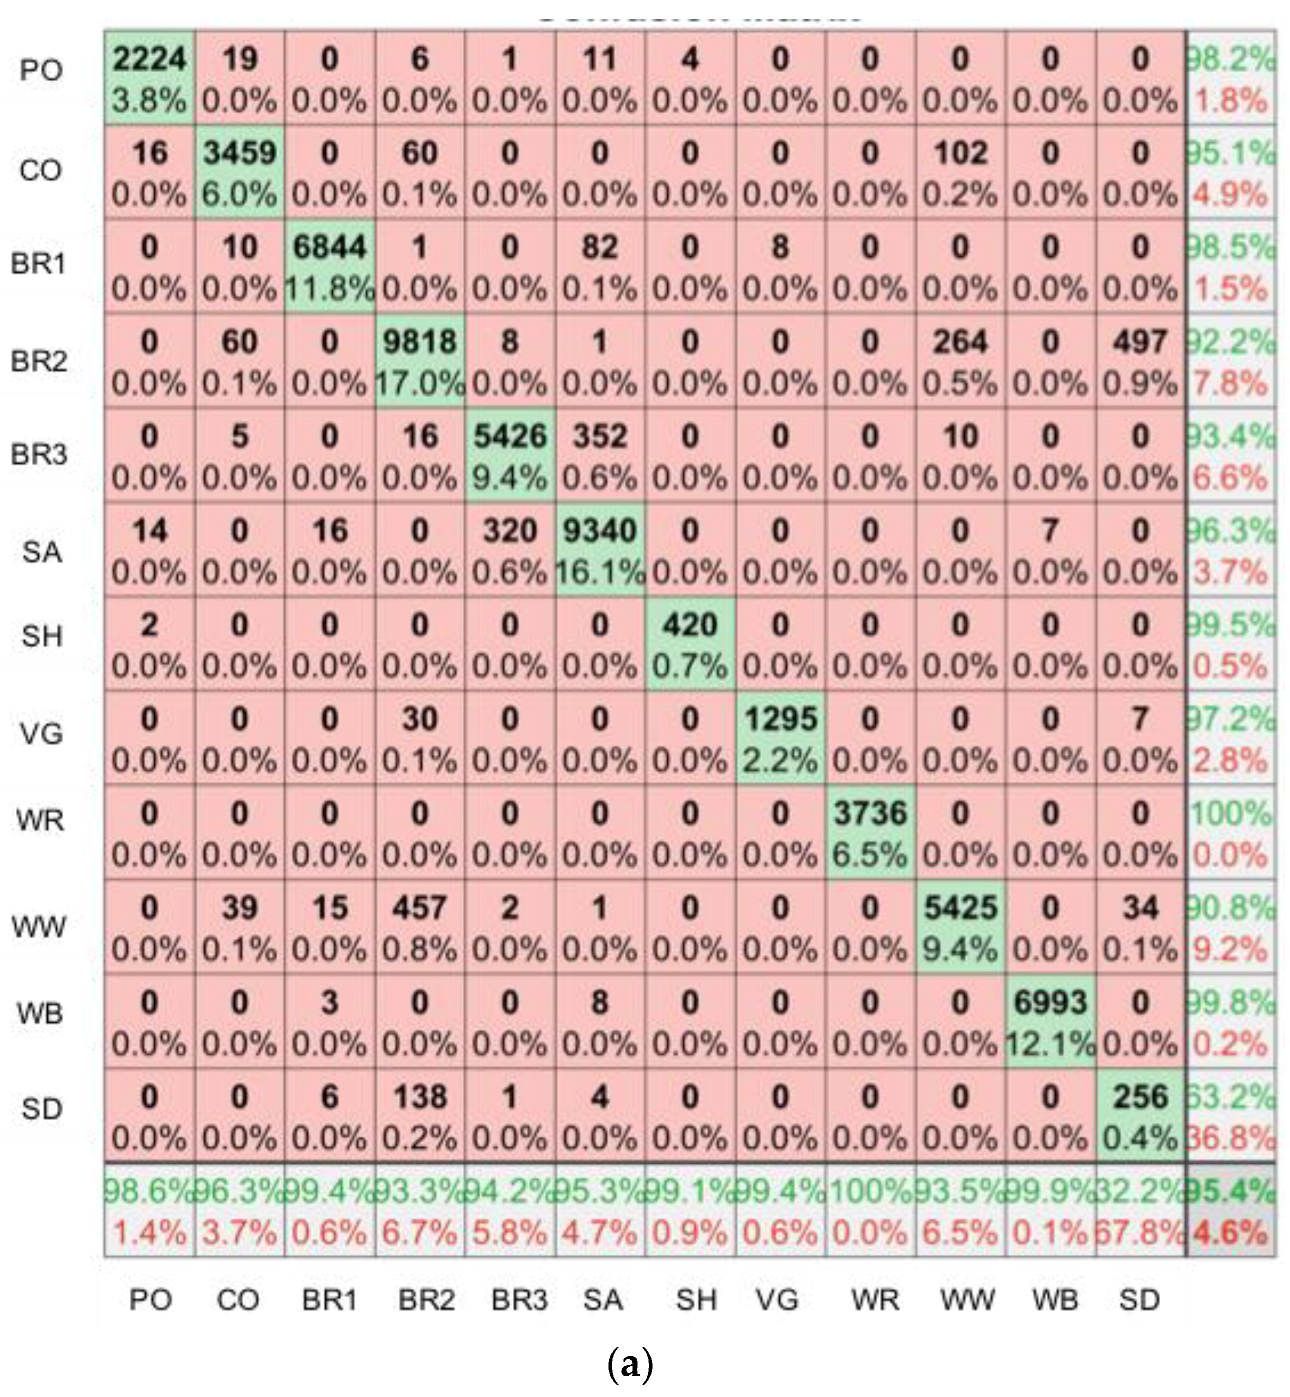
2.5. Habitat Complexity Metrics and Classification
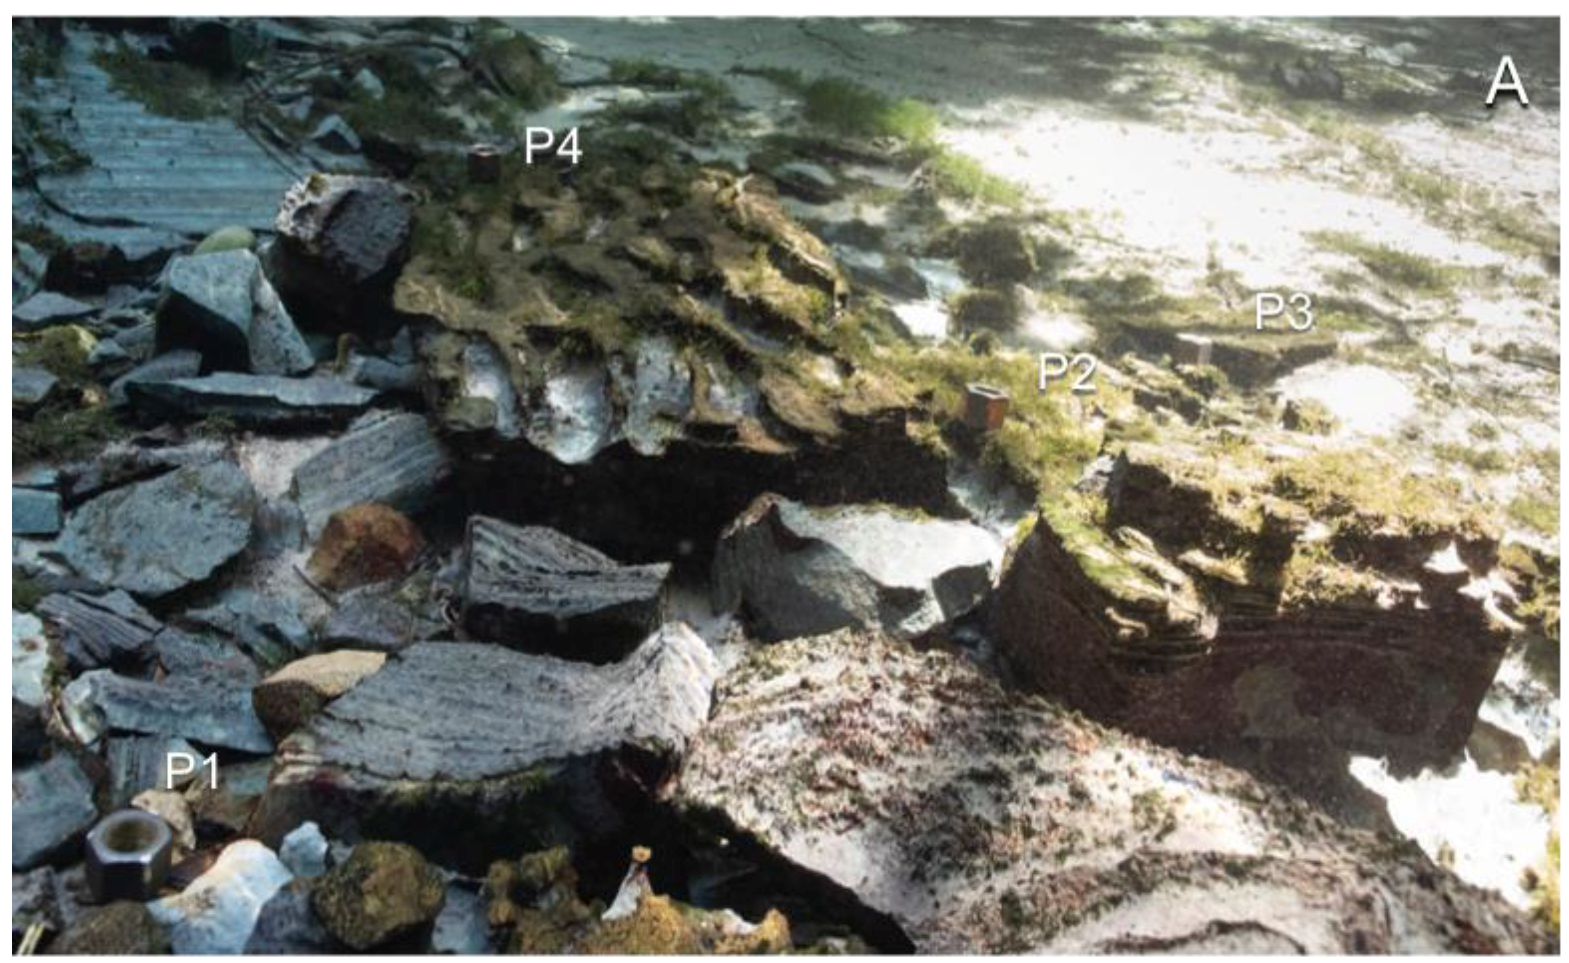
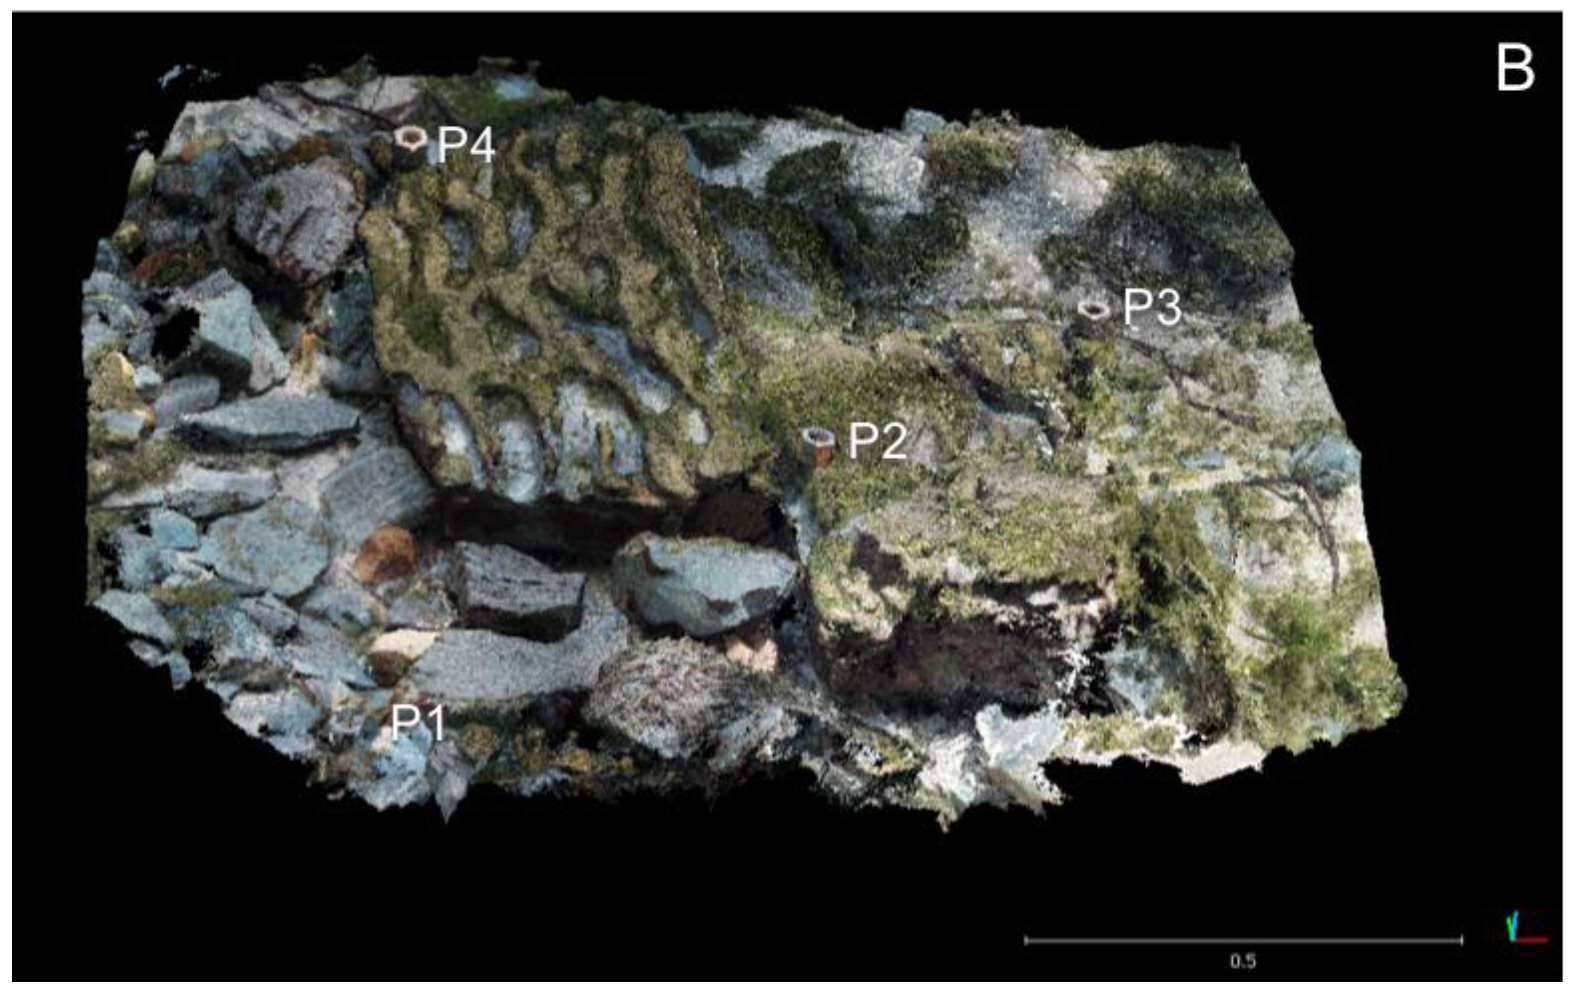
2.6. SfM-MVS Model Assessment
3. Results
4. Discussion
5. Conclusions
Author Contributions
Funding
Acknowledgments
Conflicts of Interest
Appendix A


References
- Hutchinson, G.E. Population studies—Animal ecology and demography—Concluding remarks. Cold Spring Harb. Symp. Quant. Boil. 1957, 22, 415–427. [Google Scholar] [CrossRef]
- Vandermeer, J.H. Niche Theory. Annu. Rev. Ecol. Syst. 1972, 3, 107–132. [Google Scholar] [CrossRef]
- Yamazaki, D.; Trigg, M.A.; Ikeshima, D. Development of a global similar to 90 m water body map using multi-temporal Landsat images. Remote Sens. Environ. 2015, 171, 337–351. [Google Scholar] [CrossRef]
- Gleason, C.J.; Smith, L.C. Toward global mapping of river discharge using satellite images and at-many-stations hydraulic geometry. Proc. Natl. Acad. Sci. USA 2014, 111, 4788–4791. [Google Scholar] [CrossRef] [PubMed]
- Pajares, G. Overview and current Status of remote sensing applications based on unmanned aerial vehicles (UAVs). Photogramm. Eng. Remote Sens. 2015, 81, 281–329. [Google Scholar] [CrossRef]
- Pimm, S.L.; Alibhai, S.; Bergl, R.; Dehgan, A.; Giri, C.; Jewell, Z.; Joppa, L.; Kays, R.; Loarie, S. Emerging Technologies to Conserve Biodiversity. Trends Ecol. Evol. 2015, 30, 685–696. [Google Scholar] [CrossRef] [PubMed]
- Sanchez-Azofeifa, A.; Guzman, J.A.; Campos, C.A.; Castro, S.; Garcia-Millan, V.; Nightingale, J.; Rankine, C. Twenty-first century remote sensing technologies are revolutionizing the study of tropical forests. Biotropica 2017, 49, 604–619. [Google Scholar] [CrossRef]
- Anderson, K.; Gaston, K.J. Lightweight unmanned aerial vehicles will revolutionize spatial ecology. Front. Ecol. Environ. 2013, 11, 138–146. [Google Scholar] [CrossRef]
- Baxter, P.W.J.; Hamilton, G. Learning to fly: Integrating spatial ecology with unmanned aerial vehicle surveys. Ecosphere 2018, 9. [Google Scholar] [CrossRef]
- Linchant, J.; Lisein, J.; Semeki, J.; Lejeune, P.; Vermeulen, C. Are unmanned aircraft systems (UASs) the future of wildlife monitoring? A review of accomplishments and challenges. Mamm. Rev. 2015, 45, 239–252. [Google Scholar] [CrossRef]
- Fonstad, M.A.; Dietrich, J.T.; Courville, B.C.; Jensen, J.L.; Carbonneau, P.E. Topographic structure from motion: A new development in photogrammetric measurement. Earth Surf. Process. Landf. 2013, 38, 421–430. [Google Scholar] [CrossRef]
- Micheletti, N.; Chandler, J.H.; Lane, S.N. Structure from Motion (SfM) Photogrammetry. In Geomorphological Techniques; British Society for Geomorphology: London, UK, 2015; pp. 2–12. [Google Scholar]
- Kalacska, M.; Chmura, G.L.; Lucanus, O.; Bérubé, D.; Arroyo-Mora, J.P. Structure from motion will revolutionize analyses of tidal wetland landscapes. Remote Sens. Environ. 2017, 199, 14–24. [Google Scholar] [CrossRef]
- Aguera-Vega, F.; Carvajal-Ramirez, F.; Martinez-Carricondo, P.; Lopez, J.S.H.; Mesas-Carrascosa, F.J.; Garcia-Ferrer, A.; Perez-Porras, F.J. Reconstruction of extreme topography from UAV structure from motion photogrammetry. Measurement 2018, 121, 127–138. [Google Scholar] [CrossRef]
- Cunliffe, A.M.; Brazier, R.E.; Anderson, K. Ultra-fine grain landscape-scale quantification of dryland vegetation structure with drone-acquired structure-from-motion photogrammetry. Remote Sens. Environ. 2016, 183, 129–143. [Google Scholar] [CrossRef]
- Harwin, S.; Lucieer, A. Assessing the accuracy of georeferenced point clouds produced via multi-view stereopsis from unmanned aerial vehicle (UAV) imagery. Remote Sens. 2012, 4, 1573–1599. [Google Scholar] [CrossRef]
- James, M.R.; Robson, S. Straightforward reconstruction of 3D surfaces and topography with a camera: Accuracy and geoscience application. J. Geophys. Res. Earth Surf. 2012, 117. [Google Scholar] [CrossRef]
- House, J.E.; Brambilla, V.; Bidaut, L.M.; Christie, A.P.; Pizarro, O.; Madin, J.S.; Dornelas, M. Moving to 3D: Relationships between coral planar area, surface area and volume. PeerJ 2018, 6, e4280. [Google Scholar] [CrossRef] [PubMed]
- Bryson, M.; Ferrari, R.; Figueira, W.; Pizarro, O.; Madin, J.; Williams, S.; Byrne, M. Characterization of measurement errors using structure-from-motion and photogrammetry to measure marine habitat structural complexity. Ecol. Evol. 2017, 7, 5669–5681. [Google Scholar] [CrossRef] [PubMed]
- Palma, M.; Casado, M.R.; Pantaleo, U.; Cerrano, C. High resolution orthomosaics of African coral reefs: A tool for wide-scale benthic monitoring. Remote Sens. 2017, 9, 705. [Google Scholar] [CrossRef]
- Raoult, V.; Reid-Anderson, S.; Ferri, A.; Williamson, J.E. How reliable is structure from motion (SfM) over time and between observers? A case study using coral reef bommies. Remote Sens. 2017, 9, 740. [Google Scholar] [CrossRef]
- Young, G.C.; Dey, S.; Rogers, A.D.; Exton, D. Cost and time-effective method for multiscale measures of rugosity, fractal dimension, and vector dispersion from coral reef 3D models. PLoS ONE 2017, 12, e0175341. [Google Scholar] [CrossRef] [PubMed]
- Leon, J.X.; Roelfsema, C.M.; Saunders, M.I.; Phinn, S.R. Measuring coral reef terrain roughness using ‘Structure-from-Motion’ close-range photogrammetry. Geomorphology 2015, 242, 21–28. [Google Scholar] [CrossRef]
- Robert, K.; Huvenne, V.A.I.; Georgiopoulou, A.; Jones, D.O.B.; Marsh, L.; Carter, G.D.O.; Chaumillon, L. New approaches to high-resolution mapping of marine vertical structures. Sci. Rep. 2017, 7, 9005. [Google Scholar] [CrossRef] [PubMed]
- Singh, H.; Roman, C.; Pizarro, O.; Eustice, R.; Can, A. Towards high-resolution imaging from underwater vehicles. Int. J. Robot. Res. 2007, 26, 55–74. [Google Scholar] [CrossRef]
- Tamminga, A.; Hugenholtz, C.; Eaton, B.; Lapointe, M. Hyperspatial remote sensing of channel reach morphology and hydraulic fish habitat using an unmanned aerial vehicle (UAV): A first assessment in the context of river research and management. River Res. Appl. 2015, 31, 379–391. [Google Scholar] [CrossRef]
- Tamminga, A.D.; Eaton, B.C.; Hugenholtz, C.H. UAS-based remote sensing of fluvial change following an extreme flood event. Earth Surf. Process. Landf. 2015, 40, 1464–1476. [Google Scholar] [CrossRef]
- Ferrari, R.; Bryson, M.; Bridge, T.; Hustache, J.; Williams, S.B.; Byrne, M.; Figueira, W. Quantifying the response of structural complexity and community composition to environmental change in marine communities. Glob. Chang. Boil. 2016, 22, 1965–1975. [Google Scholar] [CrossRef] [PubMed]
- Fonseca, V.P.; Pennino, M.G.; de Nobrega, M.F.; Oliveira, J.E.L.; Mendes, L.D. Identifying fish diversity hot-spots in data-poor situations. Mar. Environ. Res. 2017, 129, 365–373. [Google Scholar] [CrossRef] [PubMed]
- Gonzalez-Rivero, M.; Harborne, A.R.; Herrera-Reveles, A.; Bozec, Y.M.; Rogers, A.; Friedman, A.; Ganase, A.; Hoegh-Guldberg, O. Linking fishes to multiple metrics of coral reef structural complexity using three-dimensional technology. Sci. Rep. 2017, 7, 13965. [Google Scholar] [CrossRef] [PubMed]
- Nolan, E.T.; Barnes, D.K.A.; Brown, J.; Downes, K.; Enderlein, P.; Gowland, E.; Hogg, O.T.; Laptikhovsky, V.; Morley, S.A.; Mrowicki, R.J.; et al. Biological and physical characterization of the seabed surrounding Ascension Island from 100–1000 m. J. Mar. Boil. Assoc. UK 2017, 97, 647–659. [Google Scholar] [CrossRef]
- Shumway, C.A.; Hofmann, H.A.; Dobberfuhl, A.P. Quantifying habitat complexity in aquatic ecosystems. Freshw. Biol. 2007, 52, 1065–1076. [Google Scholar] [CrossRef]
- St Pierre, J.I.; Kovalenko, K.E. Effect of habitat complexity attributes on species richness. Ecosphere 2014, 5, 1–10. [Google Scholar] [CrossRef]
- Taniguchi, H.; Tokeshi, M. Effects of habitat complexity on benthic assemblages in a variable environment. Freshw. Biol. 2004, 49, 1164–1178. [Google Scholar] [CrossRef]
- Tokeshi, M.; Arakaki, S. Habitat complexity in aquatic systems: Fractals and beyond. Hydrobiologia 2012, 685, 27–47. [Google Scholar] [CrossRef]
- Lassau, S.A.; Hochuli, D.F. Effects of habitat complexity on ant assemblages. Ecography 2004, 27, 157–164. [Google Scholar] [CrossRef]
- McCormick, M.I. Comparison of field methods for measuring surface-topography and their associations with a tropical reef fish assemblage. Mar. Ecol. Prog. Ser. 1994, 112, 87–96. [Google Scholar] [CrossRef]
- Dustan, P.; Doherty, O.; Pardede, S. Digital reef rugosity estimates coral reef habitat complexity. PLoS ONE 2013, 8, e57386. [Google Scholar] [CrossRef] [PubMed]
- Gleason, A.C.R. Recovery of coral reef rugosity from stereo image pairs. In Proceedings of the Oceans 2003 Mts/IEEE: Celebrating the Past...Teaming toward the Future, San Diego, CA, USA, 22–26 September 2003; p. 451. [Google Scholar]
- Shurin, J.B.; Cottenie, K.; Hillebrand, H. Spatial autocorrelation and dispersal limitation in freshwater organisms. Oecologia 2009, 159, 151–159. [Google Scholar] [CrossRef] [PubMed]
- Reichert, J.; Backes, A.R.; Schubert, P.; Wilke, T. The power of 3D fractal dimensions for comparative shape and structural complexity analyses of irregularly shaped organisms. Methods Ecol. Evol. 2017, 8, 1650–1658. [Google Scholar] [CrossRef]
- Willis, S.C.; Winemiller, K.O.; Lopez-Fernandez, H. Habitat structural complexity and morphological diversity of fish assemblages in a Neotropical floodplain river. Oecologia 2005, 142, 284–295. [Google Scholar] [CrossRef] [PubMed]
- Gorman, O.T.; Karr, J.R. Habitat structure and stream fish communities. Ecology 1978, 59, 507–515. [Google Scholar] [CrossRef]
- Buhl-Mortensen, L.; Buhl-Mortensen, P.; Dolan, M.F.J.; Dannheim, J.; Bellec, V.; Holte, B. Habitat complexity and bottom fauna composition at different scales on the continental shelf and slope of northern Norway. Hydrobiologia 2012, 685, 191–219. [Google Scholar] [CrossRef]
- Du Preez, C. A new arc-chord ratio (ACR) rugosity index for quantifying three-dimensional landscape structural complexity. Landsc. Ecol. 2015, 30, 181–192. [Google Scholar] [CrossRef]
- Ahrenstorff, T.D.; Sass, G.G.; Helmus, M.R. The influence of littoral zone coarse woody habitat on home range size, spatial distribution, and feeding ecology of largemouth bass (Micropterus salmoides). Hydrobiologia 2009, 623, 223–233. [Google Scholar] [CrossRef]
- Dias, R.M.; da Silva, J.C.B.; Gomes, L.C.; Agostinho, A.A. Effects of macrophyte complexity and hydrometric level on fish assemblages in a Neotropical floodplain. Environ. Biol. Fish. 2017, 100, 703–716. [Google Scholar] [CrossRef]
- Dionne, M.; Folt, C.L. An experimental-analysis of macrophyte growth forms as fish foraging habitat. Can. J. Fish. Aquat. Sci. 1991, 48, 123–131. [Google Scholar] [CrossRef]
- Gois, K.S.; Antonio, R.R.; Gomes, L.C.; Pelicice, F.M.; Agostinho, A.A. The role of submerged trees in structuring fish assemblages in reservoirs: Two case studies in South America. Hydrobiologia 2012, 685, 109–119. [Google Scholar] [CrossRef]
- Storlazzi, C.D.; Dartnell, P.; Hatcher, G.A.; Gibbs, A.E. End of the chain? Rugosity and fine-scale bathymetry from existing underwater digital imagery using structure-from-motion (SfM) technology. Coral Reefs 2016, 35, 889–894. [Google Scholar] [CrossRef]
- Pais, M.P.; Henriques, S.; Costa, M.J.; Cabral, H.N. Improving the “chain and tape” method: A combined topography index for marine fish ecology studies. Ecol. Indic. 2013, 25, 250–255. [Google Scholar] [CrossRef]
- Getzin, S.; Wiegand, K.; Schoning, I. Assessing biodiversity in forests using very high-resolution images and unmanned aerial vehicles. Methods Ecol. Evol. 2012, 3, 397–404. [Google Scholar] [CrossRef]
- Goulding, M.; Barthem, R.; Ferreira, E.J.G. The Smithsonian Atlas of the Amazon; Smithsonian Books: Washington, DC, USA, 2003; p. 253. [Google Scholar]
- Zuluaga-Gomez, M.A.; Fitzgerald, D.B.; Giarrizzo, T.; Winemiller, K.O. Morphologic and trophic diversity of fish assemblages in rapids of the Xingu River, a major Amazon tributary and region of endemism. Environ. Biol. Fish. 2016, 99, 647–658. [Google Scholar] [CrossRef]
- Fitzgerald, D.B.; Winemiller, K.O.; Perez, M.H.S.; Sousa, L.M. Using trophic structure to reveal patterns of trait-based community assembly across niche dimensions. Funct. Ecol. 2017, 31, 1135–1144. [Google Scholar] [CrossRef]
- Sabaj Perez, M. Where the Xingu bends and will soon break. Am. Sci. 2015, 103, 395–403. [Google Scholar] [CrossRef]
- Varella, H.R.; Ito, P.M.M. Crenicichla dandara, new species: The black jacundá from the Rio Xingu (Teleostei: Cichlidae). Proc. Acad. Nat. Sci. Phila. 2018, 166, 1–12. [Google Scholar] [CrossRef]
- Dandois, J.P.; Olano, M.; Ellis, E.C. Optimal altitude, overlap, and weather conditions for computer vision UAV estimates of forest structure. Remote Sens. 2015, 7, 13895–13920. [Google Scholar] [CrossRef]
- Westaway, R.M.; Lane, S.N.; Hicks, D.M. The development of an automated correction procedure for digital photogrammetry for the study of wide, shallow, gravel-bed rivers. Earth Surf. Process. Landf. 2000, 25, 209–226. [Google Scholar] [CrossRef]
- Woodget, A.S.; Carbonneau, P.E.; Visser, F.; Maddock, I.P. Quantifying submerged fluvial topography using hyperspatial resolution UAS imagery and structure from motion photogrammetry. Earth Surf. Process. Landf. 2015, 40, 47–64. [Google Scholar] [CrossRef]
- Lowe, D.G. Distinctive image features from scale-invariant keypoints. Int. J. Comput. Vis. 2004, 60, 91–110. [Google Scholar] [CrossRef]
- Strecha, C.; von Hansen, W.; Van Gool, L.; Fua, P.; Thoennessen, U. On Benchmarking camera calibration and multi-view stereo for high resolution imagery. In Proceedings of the IEEE Conference on Computer Vision and Pattern Recognition, Anchorage, AK, USA, 23–28 June 2008. [Google Scholar]
- Strecha, C.; Bronstein, A.M.; Bronstein, M.M.; Fua, P. LDAHash: Improved matching with smaller descriptors. IEEE Trans. Pattern Anal. Mach. Intell. 2012, 34, 66–78. [Google Scholar] [CrossRef] [PubMed]
- Walbridge, S.; Slocum, N.; Pobuda, M.; Wright, D.J. Unified geomorphological analysis workflows with benthic terrain modeler. Geosciences 2018, 8, 94. [Google Scholar] [CrossRef]
- Zawada, D.G.; Piniak, G.A.; Hearn, C.J. Topographic complexity and roughness of a tropical benthic seascape. Geophys. Res. Lett. 2010, 37. [Google Scholar] [CrossRef]
- Moller, M.F. A scaled conjugate-gradient algorithm for fast supervised learning. Neural Netw. 1993, 6, 525–533. [Google Scholar] [CrossRef]
- Chirayath, V.; Earle, S.A. Drones that see through waves—Preliminary results from airborne fluid lensing for centimetre-scale aquatic conservation. Aquat. Conserv. Mar. Freshw. Ecosyst. 2016, 26, 237–250. [Google Scholar] [CrossRef]
- Brodu, N.; Lague, D. 3D terrestrial lidar data classification of complex natural scenes using a multi-scale dimensionality criterion: Applications in geomorphology. ISPRS J. Photogramm. Remote Sens. 2012, 68, 121–134. [Google Scholar] [CrossRef]
- Smith, M.W.; Carrivick, J.L.; Quincey, D.J. Structure from motion photogrammetry in physical geography. Prog. Phys. Geogr. 2016, 40, 247–275. [Google Scholar] [CrossRef]
- Fitzgerald, D.B.; Winemiller, K.O.; Perez, M.H.S.; Sousa, L.M. Seasonal changes in the assembly mechanisms structuring tropical fish communities. Ecology 2017, 98, 21–31. [Google Scholar] [CrossRef] [PubMed]
- Winemiller, K.O.; McIntyre, P.B.; Castello, L.; Fluet-Chouinard, E.; Giarrizzo, T.; Nam, S.; Baird, I.G.; Darwall, W.; Lujan, N.K.; Harrison, I.; et al. Balancing hydropower and biodiversity in the Amazon, Congo, and Mekong. Science 2016, 351, 128–129. [Google Scholar] [CrossRef] [PubMed]
- Andrade, M.C.; Winemiller, K.O.; Barbosa, P.S.; Fortunati, A.; Chelazzi, D.; Cincinelli, A.; Giarrizzo, T. First account of plastic pollution impacting freshwater fishes in the Amazon: Ingestion of plastic debris by piranhas and other serrasalmids with diverse feeding habits. Environ. Pollut. 2019, 244, 766–773. [Google Scholar] [CrossRef] [PubMed]


| Class * | Grain Size | Description and Importance |
|---|---|---|
| Sand and pebbles | <0.5 cm | Preferred by species that feed on invertebrates sifted from the sand but relatively few fishes are consistently found in this class. |
| Cobbles | 0.5–2.5 cm | Several endemics have specialized to feed in this class. |
| Gravel Assemblage | 2.5–15 cm | Affords protection against predators because caves are too small for larger fishes to enter. |
| Medium boulders | 15–50 cm | Affords cover to many species and forms caves large enough to be used as breeding sites. In shallow sections of the river this is the most biodiverse class. |
| Large boulders | 50–300 cm | Many mid-sized fishes prefer shadows created by the large boulders. For the large loricariids, caves must be large enough for adults up to 45 cm TL to protect the nest and brood. Narrow fissures in the large boulders shelter fish assemblages that rarely leave their safety. The compressed body shapes allow species to reside inside the fissures safe from predators (e.g., Ancistrus ranunculus, H. zebra). |
| Solid rock (bedrock) | N/A | Few fishes are consistently found in this class. The biocover and algae on the surface provides food to specialized species. |
| Solid rock (textured) | N/A | The shapes and surfaces characteristic of this substrate are ideal hiding places for smaller loricariids. |
| White water | N/A | Photographs (aerial or underwater) cannot be used to determine the substrate in areas of very high flow where the white water of the rapids obscures the river bottom. Some of the most rheophile fishes are consistently found in this class. |
| Deep turbid water | N/A | Adults of the largest fishes of the river (e.g., Brachyplatystoma tigrinum, Phractocephalus hemioliopterus) are not commonly seen in water shallower than 200 cm. Due to the turbidity and/or depth, aerial photographs cannot be used to characterize the substrate in this class. |
| Location | River | Date | UAV | Camera | Area (ha) | GSD (cm) | No. Photographs |
|---|---|---|---|---|---|---|---|
| Jatobá | Jatobá | 2 August 2017 | Inspire 2 | X5S | 2.80 | 1.20 | 375 |
| Cachoeira Culuene | Culuene | 1 August 2017 | Inspire 2 | X5S | 4.54 | 1.75 | 283 |
| Retroculus site | Xingu | 8 August 2016 | Inspire 1 | X3 | 0.52 | 1.43 | 208 |
| Cachoeira Xada | Xingu | 11 August 2016 | Inspire 1 | X3 | 4.62 | 2.38 | 420 |
| Cachoeira Iriri | Iriri | 6 August 2016 | Inspire 1 | X3 | 2.77 | 1.46 | 425 |
| Measurement | Model | In-Situ | Absolute Difference |
|---|---|---|---|
| Tape Measure | |||
| P1-P2 | 68.4 | 66.5 | 1.9 |
| P2-P3 | 42.4 | 41.0 | 1.4 |
| P3-P4 | 76.9 | 75.5 | 1.4 |
| P2-P4 | 59.3 | 57.0 | 2.3 |
| P1-P4 | 85.0 | 82.5 | 2.5 |
| Digital Calliper | |||
| Width | 3.61 | 3.57 | 0.04 |
| Thickness | 0.67 | 0.68 | 0.01 |
| Height | 3.02 | 3.01 | 0.01 |
© 2018 by the authors. Licensee MDPI, Basel, Switzerland. This article is an open access article distributed under the terms and conditions of the Creative Commons Attribution (CC BY) license (http://creativecommons.org/licenses/by/4.0/).
Share and Cite
Kalacska, M.; Lucanus, O.; Sousa, L.; Vieira, T.; Arroyo-Mora, J.P. Freshwater Fish Habitat Complexity Mapping Using Above and Underwater Structure-From-Motion Photogrammetry. Remote Sens. 2018, 10, 1912. https://doi.org/10.3390/rs10121912
Kalacska M, Lucanus O, Sousa L, Vieira T, Arroyo-Mora JP. Freshwater Fish Habitat Complexity Mapping Using Above and Underwater Structure-From-Motion Photogrammetry. Remote Sensing. 2018; 10(12):1912. https://doi.org/10.3390/rs10121912
Chicago/Turabian StyleKalacska, Margaret, Oliver Lucanus, Leandro Sousa, Thiago Vieira, and Juan Pablo Arroyo-Mora. 2018. "Freshwater Fish Habitat Complexity Mapping Using Above and Underwater Structure-From-Motion Photogrammetry" Remote Sensing 10, no. 12: 1912. https://doi.org/10.3390/rs10121912
APA StyleKalacska, M., Lucanus, O., Sousa, L., Vieira, T., & Arroyo-Mora, J. P. (2018). Freshwater Fish Habitat Complexity Mapping Using Above and Underwater Structure-From-Motion Photogrammetry. Remote Sensing, 10(12), 1912. https://doi.org/10.3390/rs10121912