Fire Activity and Fuel Consumption Dynamics in Sub-Saharan Africa
Abstract
:1. Introduction
1.1. Significance of African Landscape Fires
1.2. Remote Sensing of African Landscape Fires
2. Materials
2.1. Fire Radiative Power (METEOSAT FRP-PIXEL Product)
2.2. Gross and Net Primary Productivity (MODIS MOD17A2H/MOD17A3)
2.3. Burned Area (MODIS MCD64A1) and Land Cover (MODIS MCD12)
3. Methodology
4. Results
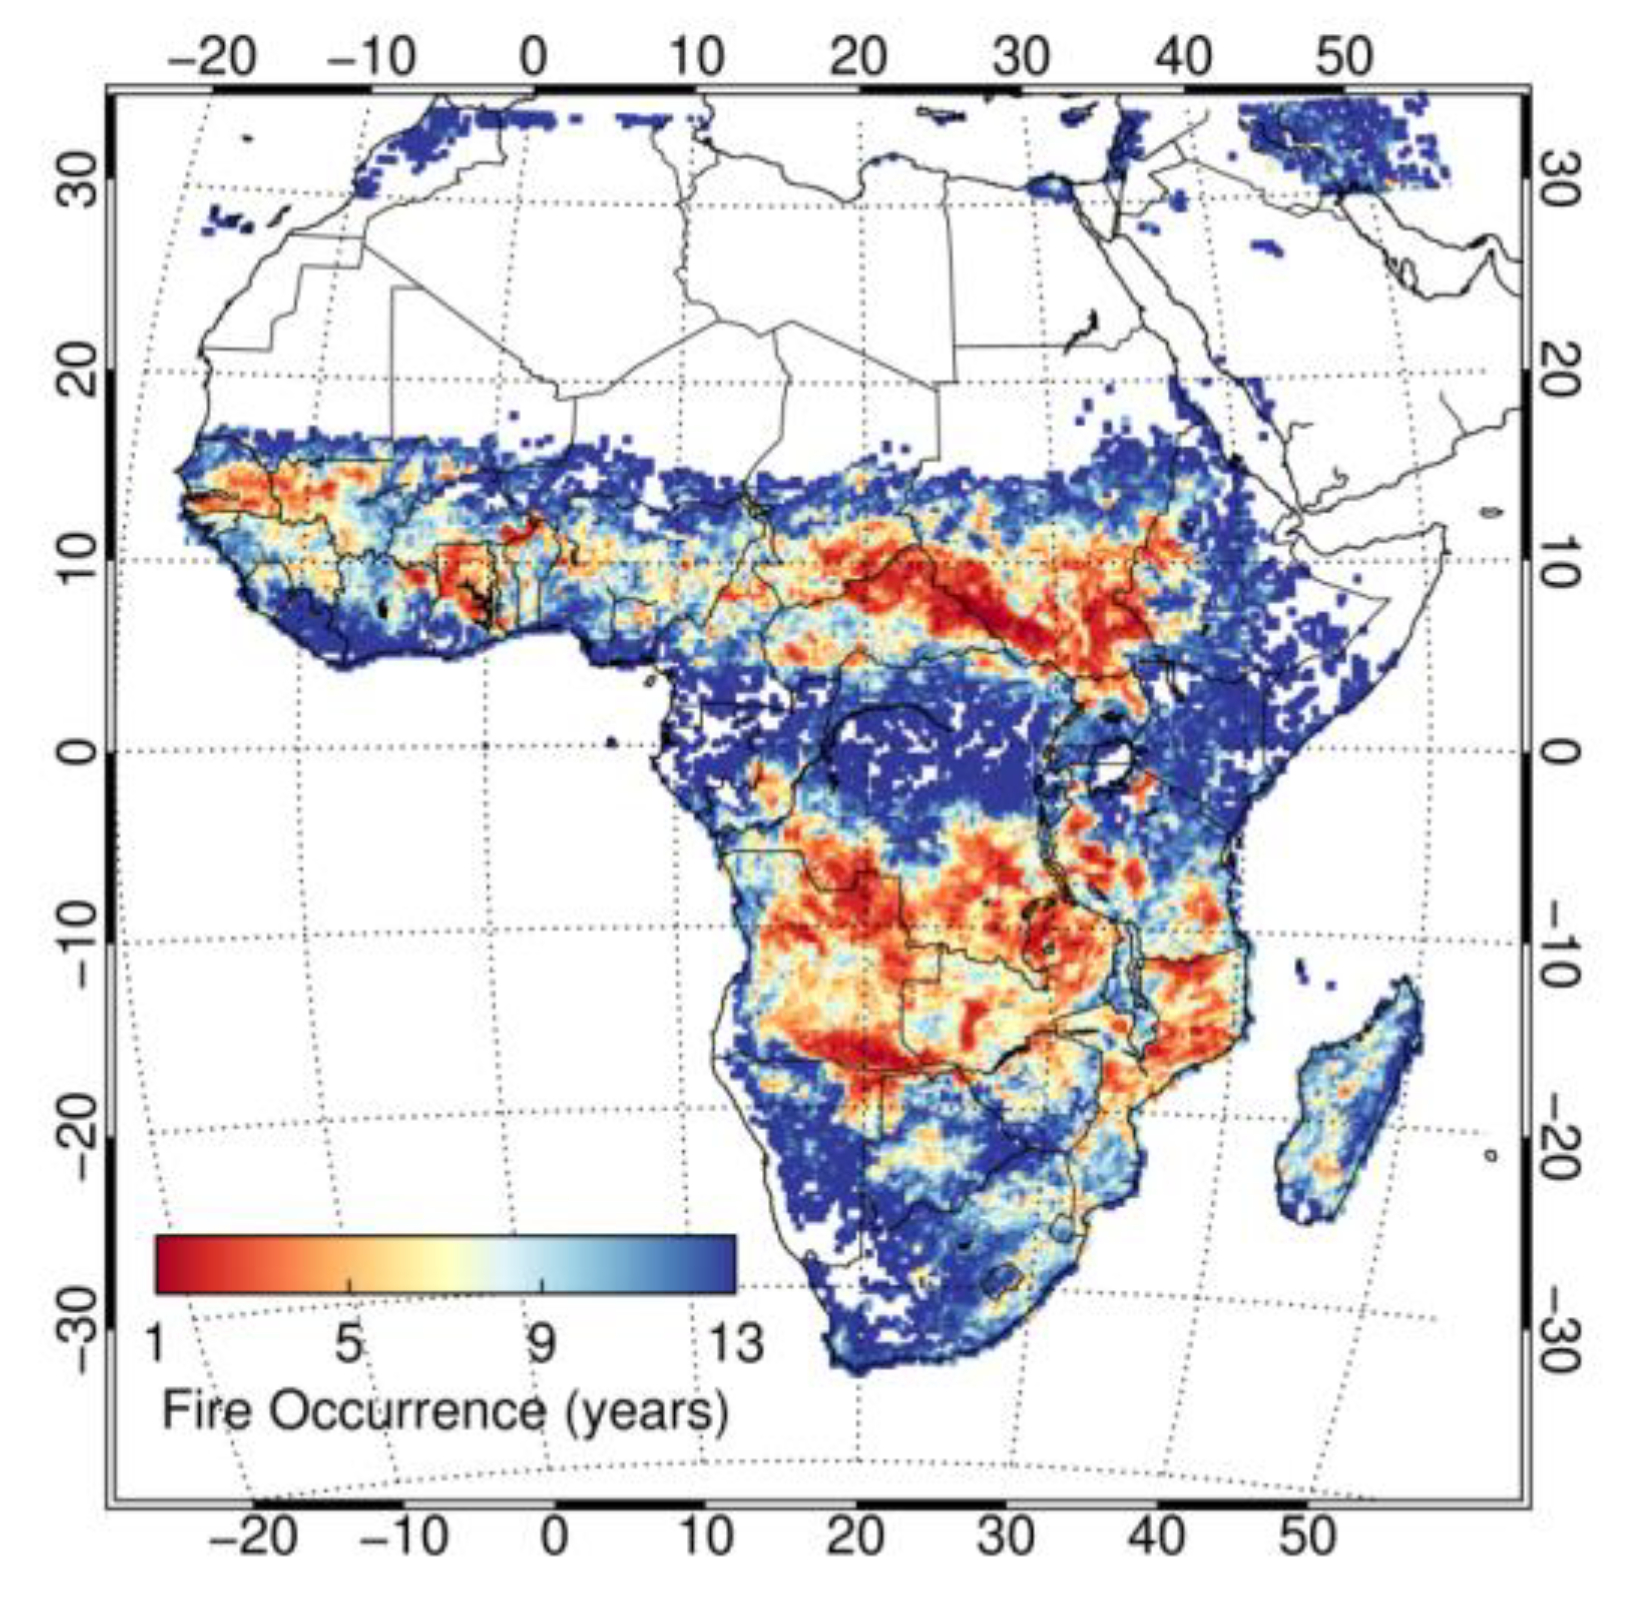
4.1. Annual and Seasonal Fire Dynamics
4.2. MOD17 Productivity Assessment
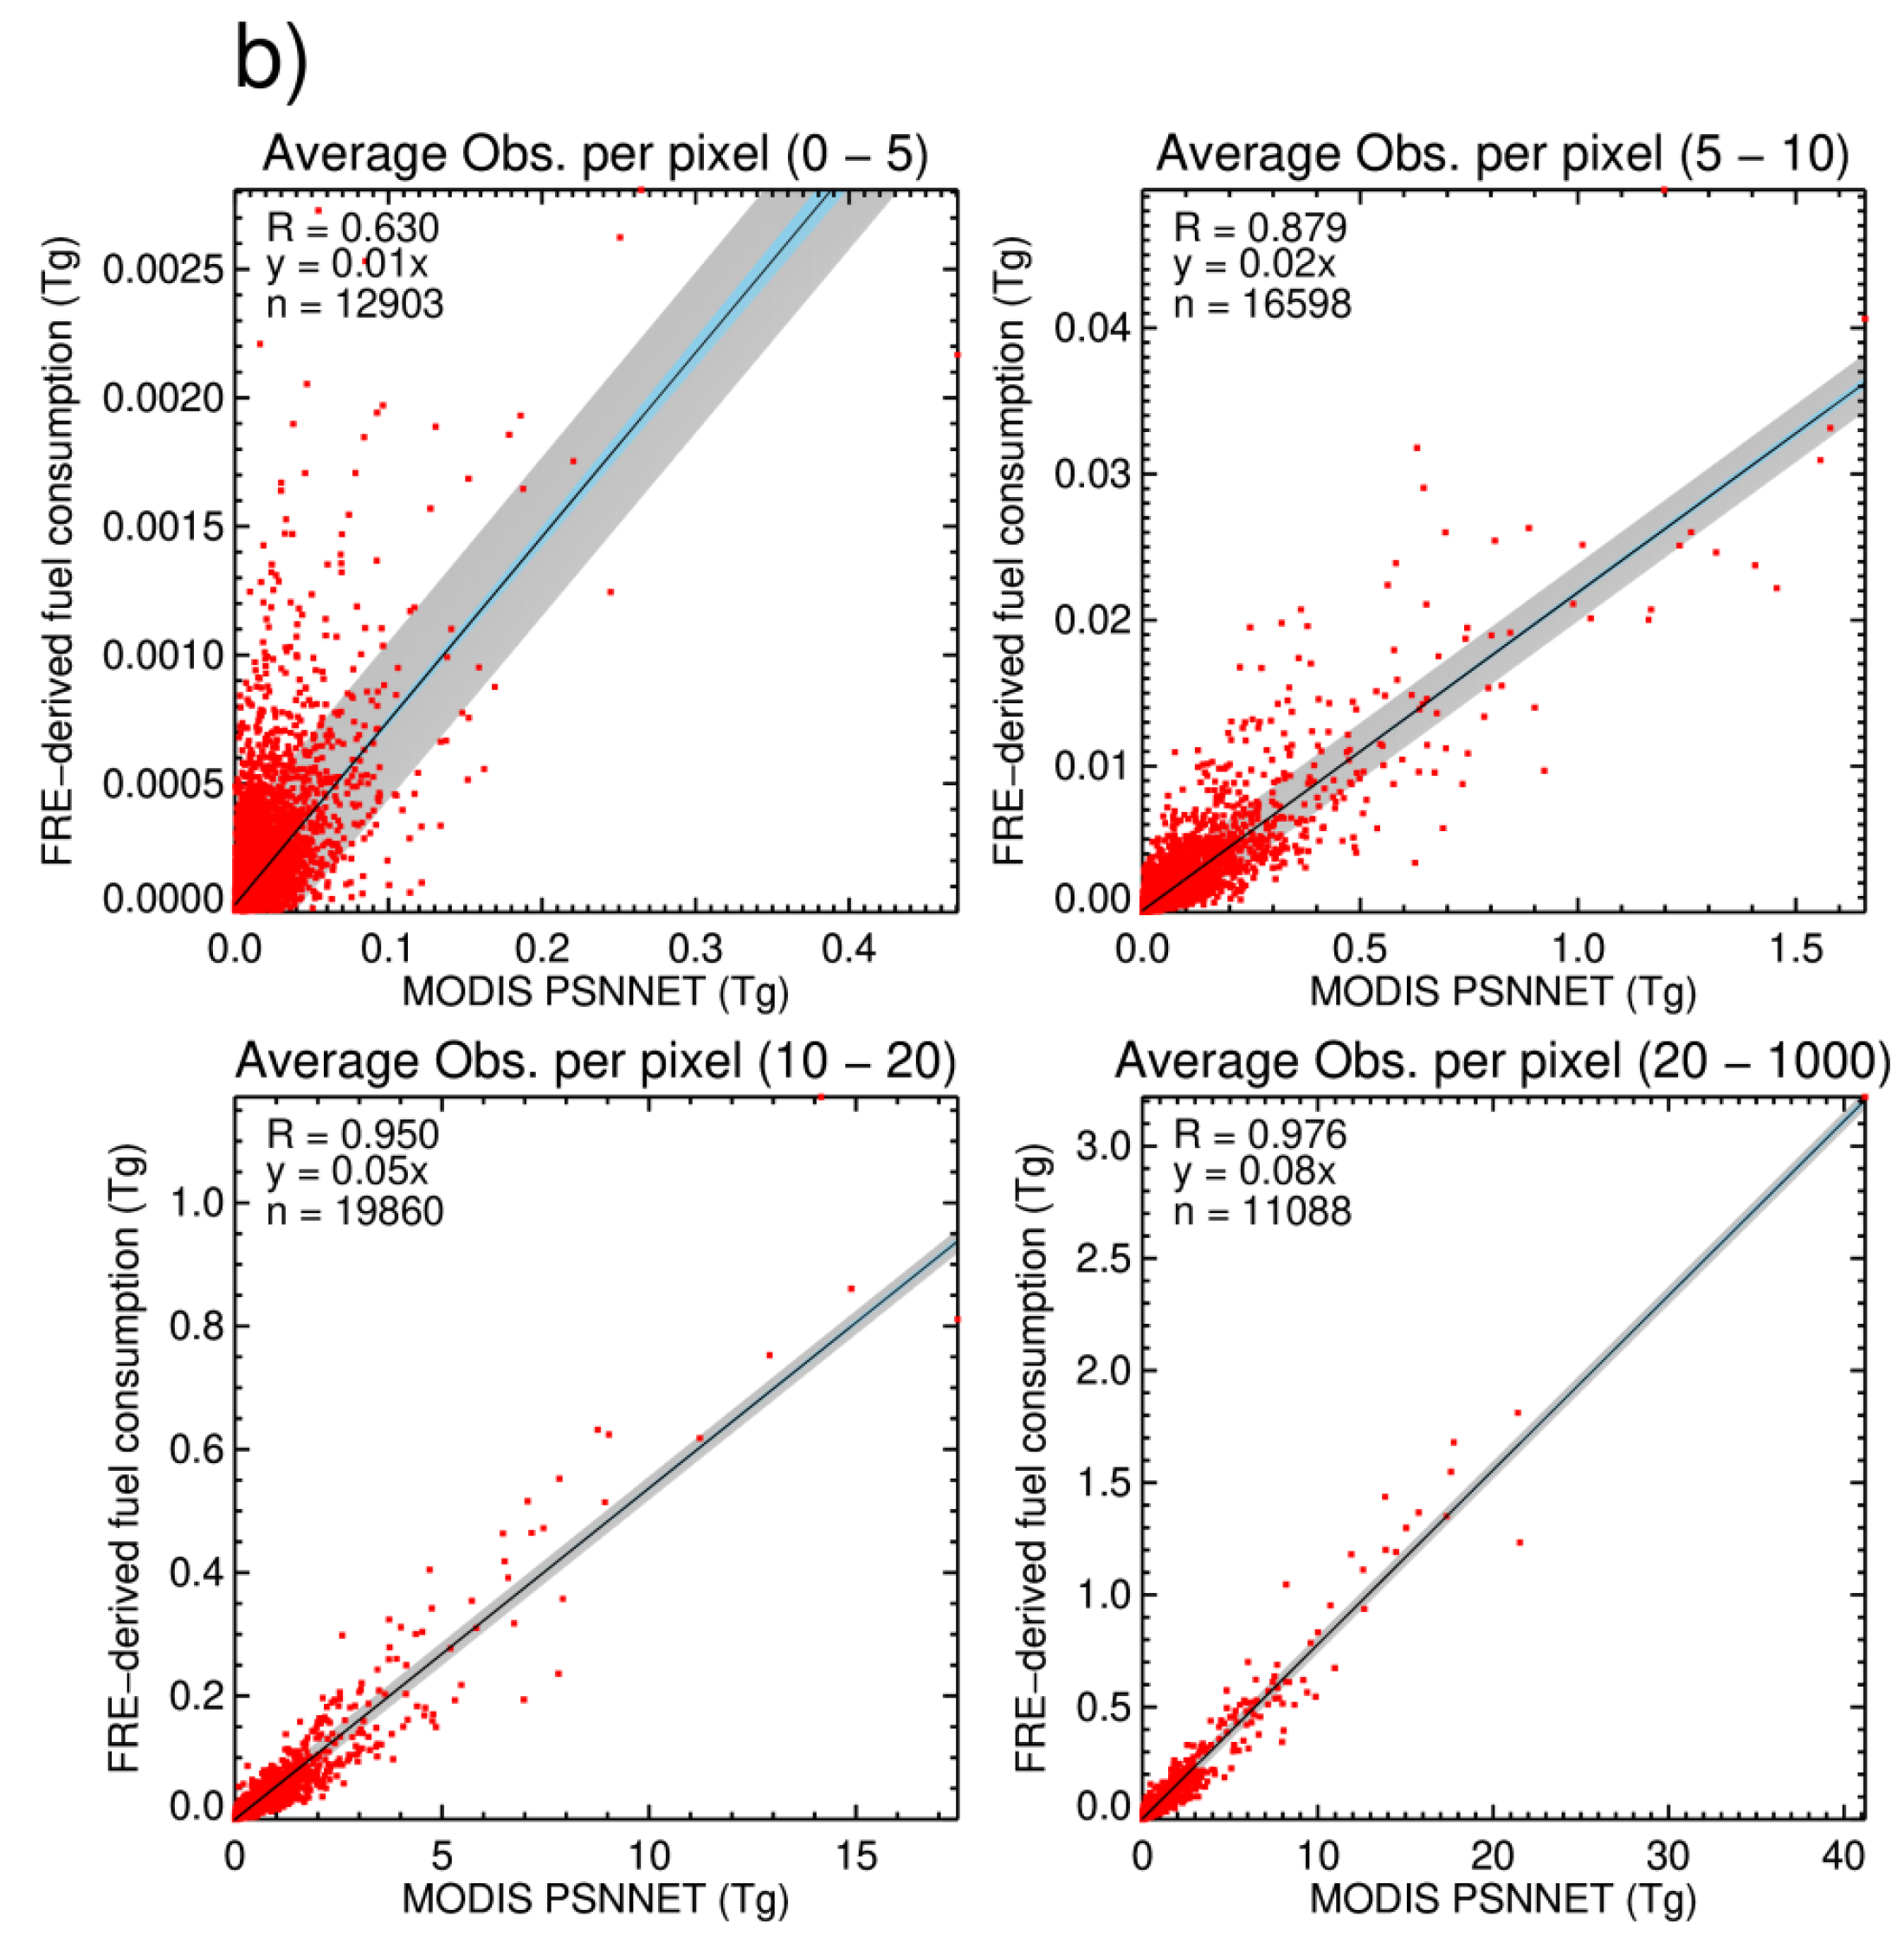
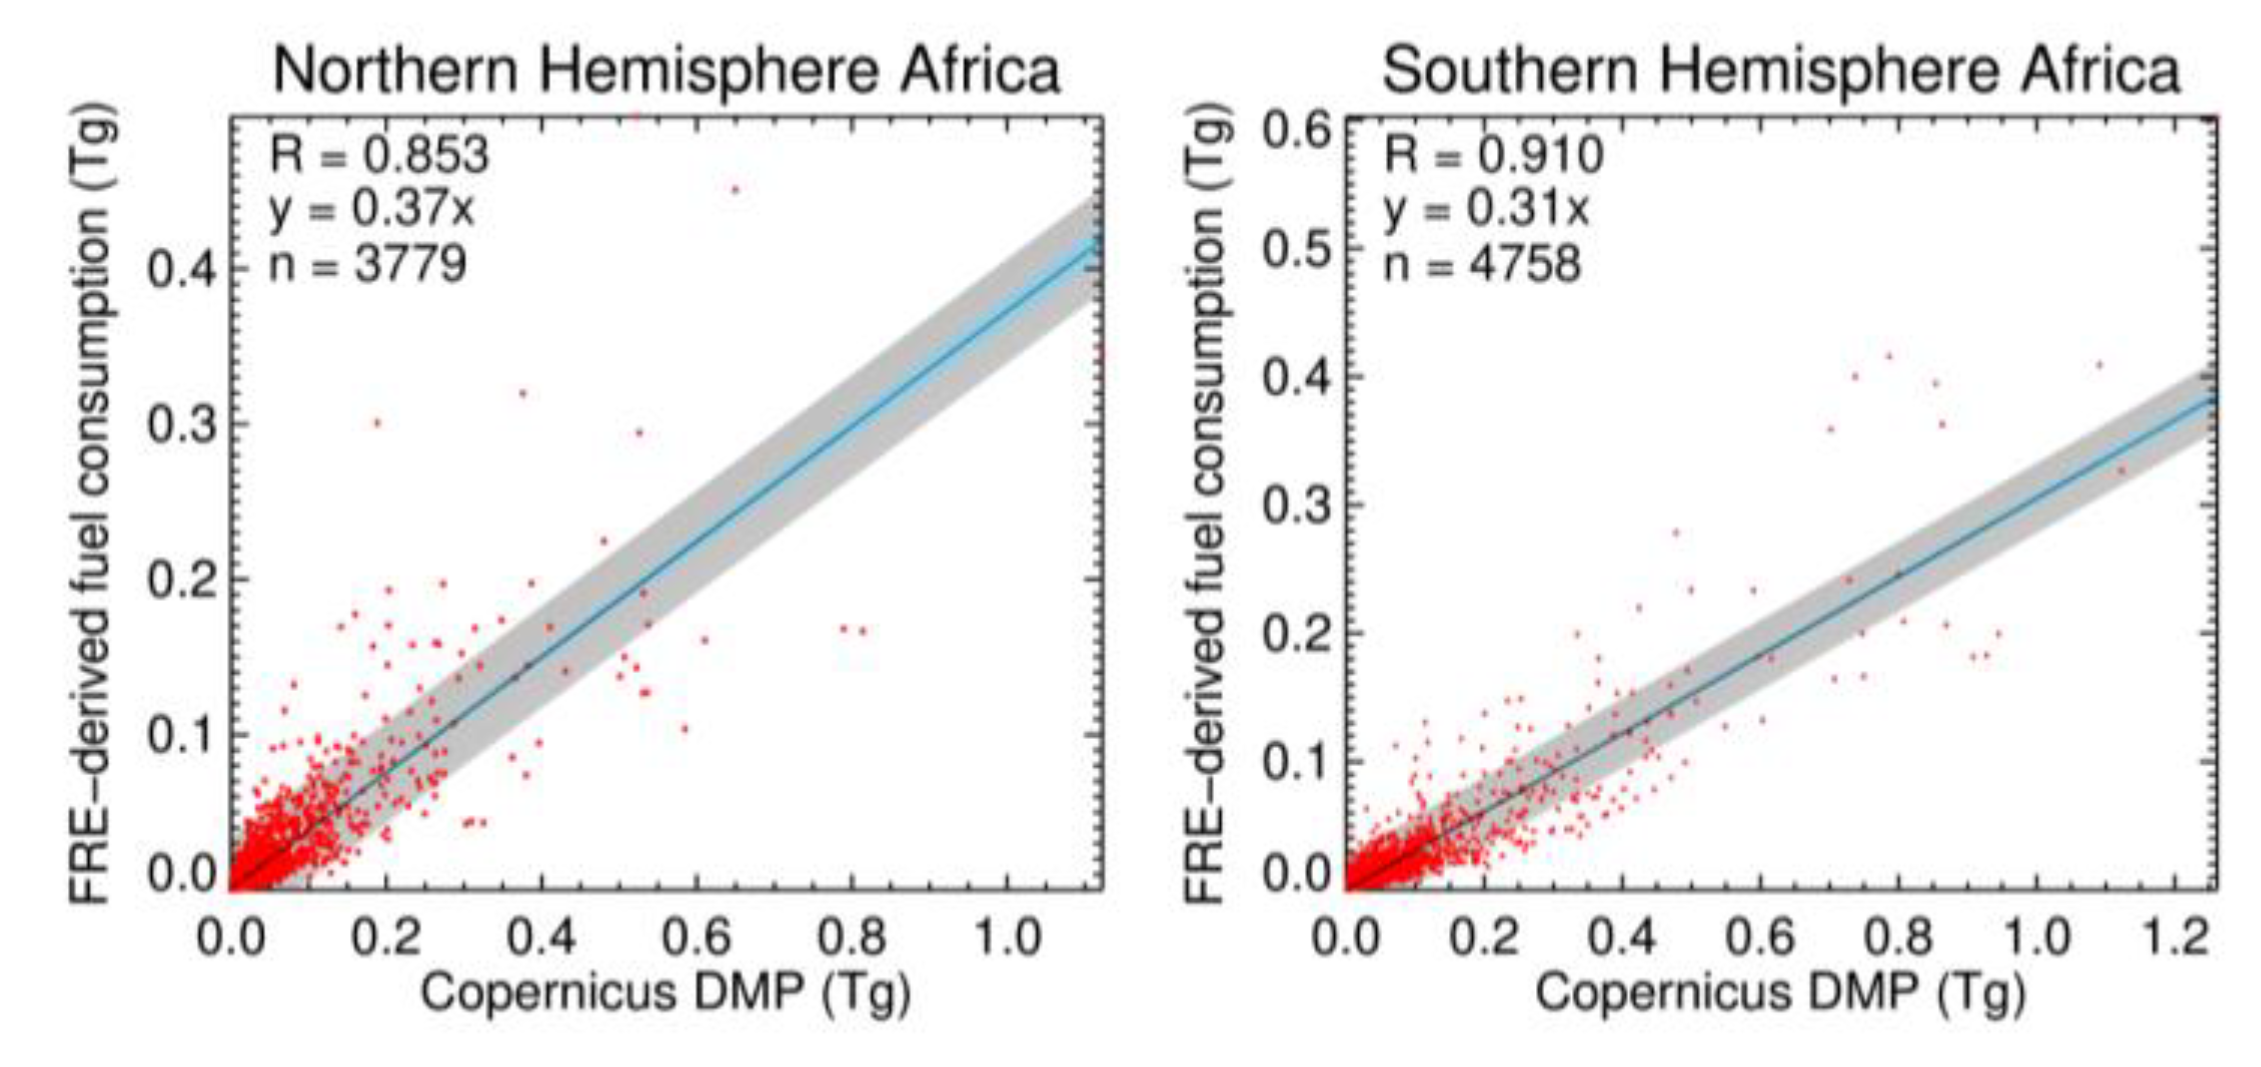
4.3. Comparison between FRE-Derived Fuel Consumption and MODIS Accumulated PSN and Copernicus Dry Matter Productivity (DMP)
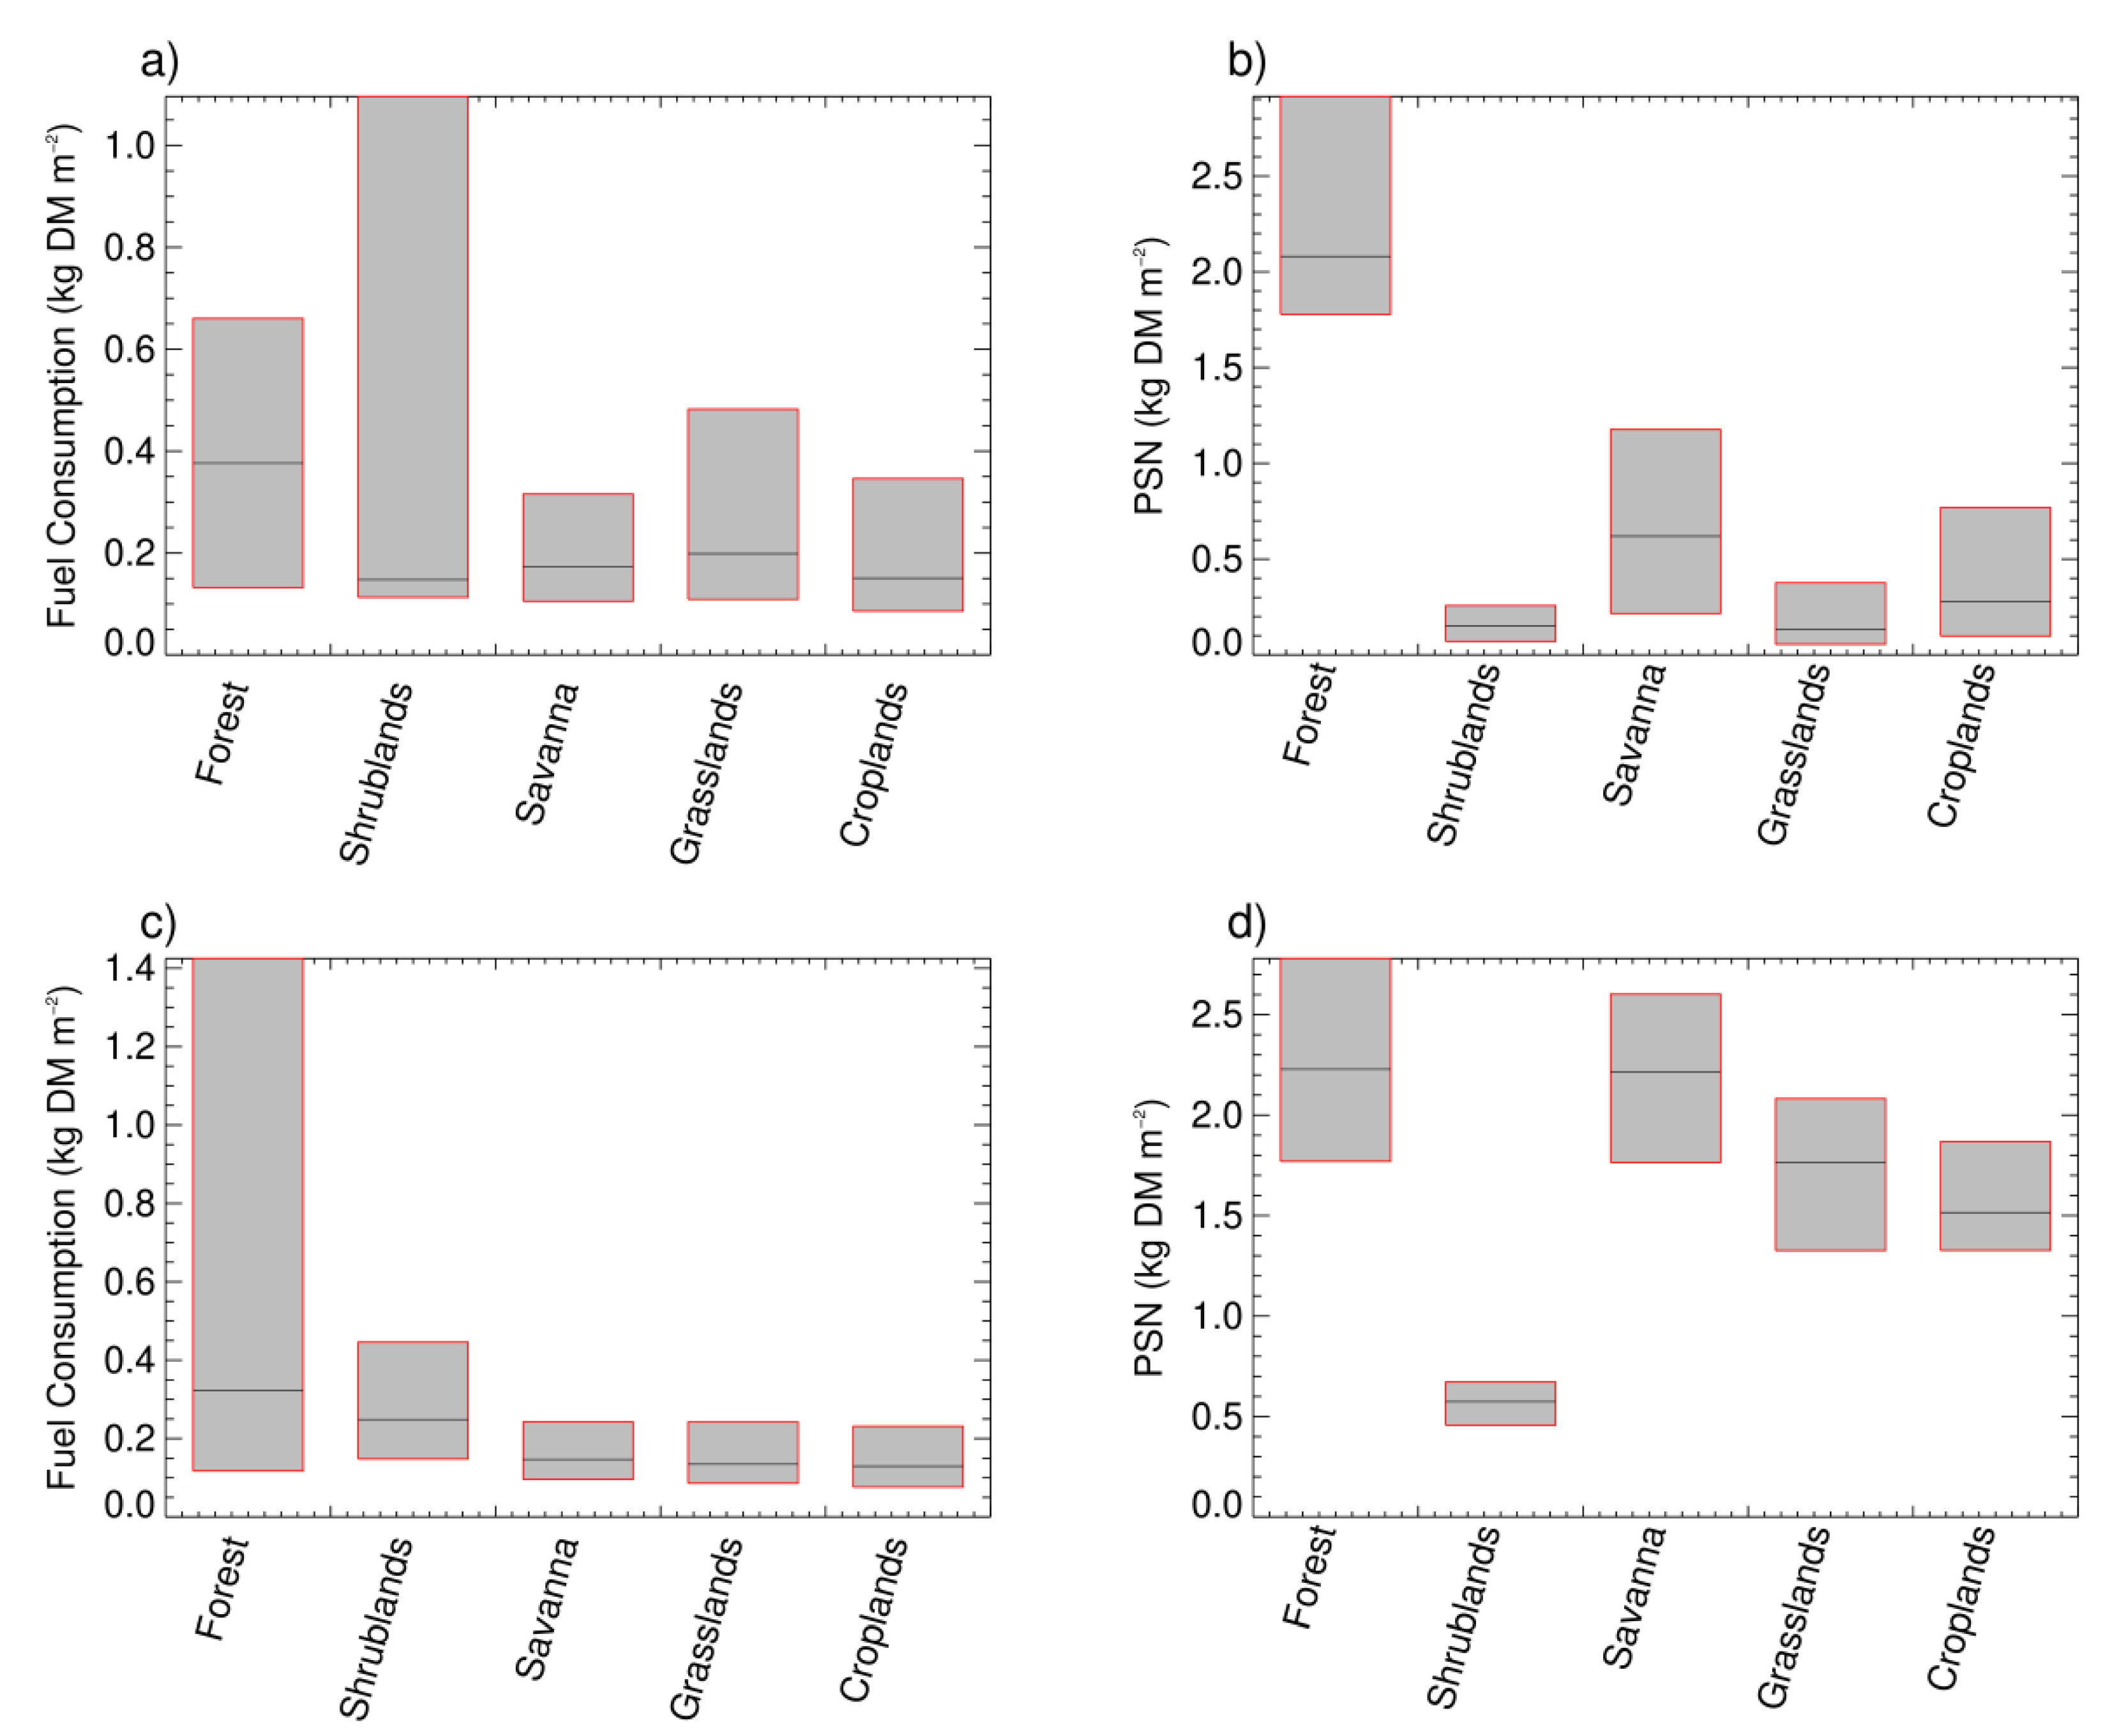
Fuel Consumption Per Unit Area (m−2)
5. Conclusions
Author Contributions
Funding
Acknowledgments
Conflicts of Interest
References
- Bowman, D.M.J.S.; Balch, J.K.; Artaxo, P.; Bond, W.J.; Carlson, J.M.; Chcorane, M.A.; D’Antonio, C.A.; DeFries, R.R.; Doyle, J.C.; Harrison, S.P.; et al. Fire in the Earth System. Science 2009, 234, 481–484. [Google Scholar] [CrossRef] [PubMed]
- Arora, A.K.; Boer, G.J. Fire as an interactive component of dynamics vegetation models. J. Geophys. Res. 2005, 110, G02008. [Google Scholar] [CrossRef]
- Hao, W.M.; Ward, D.E.; Olbu, G.; Baker, S.P. Emissions of CO2, CO and hydrocarbons from fires in diverse African savanna ecosystems. J. Geophys. Res. 1996, 101, 23577–23584. [Google Scholar] [CrossRef]
- Gatebe, C.K.; Ichoku, C.M.; Poudyal, R.; Roman, M.O.; Wilcox, E. Surface albedo darkening from wildfires in northern sub-Saharan Africa. Environ. Res. Lett. 2014, 9, 6. [Google Scholar] [CrossRef]
- Van der Werf, G.R.; Randerson, J.T.; Giglio, L.; Collatz, G.J.; Mu, M.; Kasib-hatla, P.S.; Morton, D.C.; DeFries, R.S.; Jin, Y.; van Leeuwen, T.T. Global fire emissions and the contribution of deforestation, savanna, forest, agricultural, and peat fires (1997–2009). Atmos. Chem. Phys. 2010, 10, 11707–11735. [Google Scholar] [CrossRef] [Green Version]
- Valentini, R.; Arneth, A.; Bombelli, A.; Castaldi, S.; Cazzolla Gatti, R.; Chevallier, F.; Ciais, P.; Grieco, E.; Hartmann, J.; Henry, M.; et al. A full greenhouse gases budget of Africa: Synthesis, uncertainties, and vulnerabilities. Biogeosciences 2014, 11, 381–407. [Google Scholar] [CrossRef] [Green Version]
- Williams, C.A.; Hanan, N.P.; Neff, J.C.; Scholes, R.J.; Berry, R.J.; Denning, A.S.; Baker, D.F. Africa and the global carbon cycle. Carbon Balance Manag. 2007, 2, 1–13. [Google Scholar] [CrossRef] [PubMed]
- Cais, P.; Piau, S.-L.; Cadule, P.; Friedlingstein, P.; Chedin, A. Variability and recent trends in the African carbon balance. Biogeosciences 2009, 5, 3497–3532. [Google Scholar] [CrossRef]
- Giglio, L.; Descloitres, J.; Justice, C.O.; Kaufman, Y.J. An enhanced contextural fire detection algorithm for MODIS. Remote Sens. Environ. 2003, 87, 273–282. [Google Scholar] [CrossRef]
- Giglio, L.; Schroeder, W.; Justice, C.O. The collection 6 MODIS active fire detection algorithm and fire products. Remote Sens. Environ. 2016, 178, 31–41. [Google Scholar] [CrossRef] [PubMed]
- Csiszar, I.; Schroeder, W.; Giglio, L.; Ellicott, E.; Vadrevu, K.P.; Justice, C.O.; Wind, B. Active fires from Suomi NPP Visible Infrared Imaging Radiometer Suite: Product status and fire evaluation results. J. Geophys. Res. Atmos. 2014, 119, 803–816. [Google Scholar] [CrossRef]
- Roy, D.P.; Jin, Y.; Lewis, P.E.; Justice, C.O. Prototyping a global algorithm for systematic fire-affected area mapping using MODIS time series data. Remote Sens. Environ. 2005, 97, 137–162. [Google Scholar] [CrossRef]
- Van der Werf, G.R.; Randerson, J.T.; Giglio, L.; Collatz, G.J.; Kasibhatla, P.S.; Arellano, A.F., Jr. Interannual variability of global biomass burning emissions from 1997–2004. Atmos. Chem. Phys. 2006, 6, 3423–3441. [Google Scholar] [CrossRef] [Green Version]
- Van der Werf, G.R.; Randerson, J.T.; Giglio, L.; van Leeuwen, T.T.; Chen, Y.; Roger, B.M.; Mu, M.; van Marle, M.J.E.; Morton, D.C.; Collatz, G.J.; et al. Global fire emissions estimates during 1997–2015. Earth Sci. Data Discuss. 2017, 9, 697–720. [Google Scholar] [CrossRef]
- Giglio, L.; Randerson, J.T.; van der Werf, G.R. Kasibhatla Analysis of daily, monthly and annual burned area using the fourth-generation global fire emissions database (GFED4). J. Geophys. Res. Biogeosci. 2013, 118, 317–328. [Google Scholar] [CrossRef]
- Andela, N.; van der Werf, G.R. Recent trends in African fires driven by cropland expansion and El Nino to La Nina transition. Nat. Clim. Chang. 2014, 4, 791–795. [Google Scholar] [CrossRef]
- Kaufman, Y.J.; Justice, C.O.; Flynn, L.P.; Kendall, J.D.; Prins, E.M.; Giglio, L.; Ward, D.E.; Menzel, W.P.; Setzer, A.W. Potential global fire monitoring from EOS-MODIS. J. Geophys. Res. 1998, 103, 32215–32238. [Google Scholar] [CrossRef] [Green Version]
- Wooster, M.J.; Zhukov, B.; Oertel, D. Fire radiative energy for quantitative study of biomass burning: Derivation from the BIRD experimental satellite and comparison to MODIS fire products. Remote Sens. Environ. 2003, 86, 83–107. [Google Scholar] [CrossRef]
- Zhukov, B.; Lorenz, E.; Oertel, D.; Wooster, M.; Roberts, G. Spaceborne detection and characterisation of fires during the bi-spectral infrared detection (BIRD) experimental small satellite mission (2001–2004). Remote Sens. Environ. 2006, 100, 29–51. [Google Scholar] [CrossRef]
- Wooster, M.J.; Roberts, G.; Perry, G.L.W.; Kaufman, Y.J. Retrieval of biomass combustion rates and totals from fire radiative power observations: FRP derivation and calibration relationships between biomass consumption and fire radiative energy release. J. Geophys. Res. 2005, 110, D24311. [Google Scholar] [CrossRef]
- Oliveira, S.L.J.; Maier, S.W.; Pereira, J.M.C.; Russell-Smith, J. Seasonal differences in fire activity and intensity in tropical savannas of northern Australia using satellite measurements of fire radiative power. Int. J. Wildland Fire 2015, 24, 249–260. [Google Scholar] [CrossRef]
- Sparks, A.M.; Kolden, C.A.; Smith, A.M.S.; Boschetti, L.; Johnson, D.M.; Cochrane, M.A. Fire intensity impacts on post-fire temperate coniferous forest net primary productivity. Biogeosciences 2018, 15, 1173–1183. [Google Scholar] [CrossRef]
- Archibald, S.; Lehmann, C.E.R.; Gomez-Dans, J.L.; Bradstock, R.A. Defining pyromes and global syndromes of fire regimes. Proc. Natl. Acad. Sci. USA 2012, 110, 6442–6447. [Google Scholar] [CrossRef] [PubMed]
- Wooster, M.J.; Zhang, Y.H. Boreal forest fires burn less intensely in Russia than in North America. Geophys. Res. Lett. 2004, 31, L20505. [Google Scholar] [CrossRef]
- Ellicott, E.; Vermote, E.; Giglio, L.; Roberts, G. Estimating biomass consumed from fire using MODIS FRE. Geophys. Res. Lett. 2009, 36, L13401. [Google Scholar] [CrossRef]
- Roberts, G.; Wooster, M.J.; Freeborn, P.H.; Xu, W. Integration of geostationary FRP and polar-orbiting burned area datasets for an enhanced emissions inventory. Remote Sens. Environ. 2011, 115, 2047–2061. [Google Scholar] [CrossRef]
- Andela, N.; van der Werf, G.R.; Kaiser, J.W.; van Leeuwen, T.T.; Wooster, M.J.; Lehmann, C.E.R. Biomass burning fuel consumption dynamics in the tropics and subtropics assessed from satellite. Biogeosciences 2016, 13, 3717–3734. [Google Scholar] [CrossRef] [Green Version]
- Li, F.; Zhang, X.; Kondragunta, S.; Roy, D.P. Investigation of the fire radiative energy biomass combustion coefficient: A comparison of polar and geostationary satellite retrievals over the Conterminous United States. J. Geophys. Res. Biogeosci. 2018, 123, 722–739. [Google Scholar] [CrossRef]
- Zhang, X.; Kondragunta, S.; Ram, J.; Schmidt, C.; Hung, H.-C. Near-real-time global biomass burning emissions product from geostationary satellite constellation. J. Geophys. Res. Atmos. 2012, 117, D14201. [Google Scholar] [CrossRef]
- Vermote, E.; Ellicott, E.; Dubovik, O.; Lapyonok, T.; Chin, M.; Giglio, G.; Roberts, G. An approach to estimate global biomass burning emissions of Organic and Black Carbon from MODIS Fire Radiative Power. J. Geophys. Res. 2009, 114, D18205. [Google Scholar] [CrossRef]
- Kaiser, J.W.; Heil, A.; Andrae, M.O.; Benedettie, A.; Chubarova, N.; Jones, L.; Morcrette, J.-J.; Razinger, M.; Schultz, M.G.; Suttie, M.; et al. Biomass burning emissions estimates with a global fire assimilation system based on observed fire radiative power. Biogeosciences 2012, 9, 5125–5142. [Google Scholar] [CrossRef] [Green Version]
- Mota, B.; Wooster, M.J. A new top-down approach for directly estimating biomass burning emissions and fuel consumption rates and totals from geostationary satellite fire radiative power (FRP). Remote Sens. Environ. 2018, 206, 45–62. [Google Scholar] [CrossRef]
- Zhang, T.; Wooster, M.J.; Xu, W. Approaches for synergistically exploiting VIIRS I- and M-Band data in regional active fire detection and FRP assessment: A demonstration with respect to agricultural residue burning in Eastern China. Remote Sens. Environ. 2017, 198, 407–424. [Google Scholar] [CrossRef]
- Roberts, G.; Wooster, M.J.; Lauret, N.; Gastellu-Etchegorry, J.P.; Lynham, T.; McRae, D. Investigating the impact of overlying vegetation canopy structures on fire radiative power (FRP) retrieval through simulation and measurement. Remote Sens. Environ. 2018, 217, 158–171. [Google Scholar] [CrossRef]
- Kremens, R.L.; Dickinson, M.B.; Bova, A.S. Radiant flux density, energy density and fuel consumption in mixed-oak forest surface fires. Int. J. Wildland Fire 2012, 21, 722–730. [Google Scholar] [CrossRef]
- Van Leeuwen, T.T.; der Werf, G.R.; Hoffmann, A.A.; Detmers, R.G.; Rucker, G.; French, N.H.F.; Archibald, S.; Carvalho, J.A., Jr.; Cook, G.D.; de Groot, W.J.; et al. Biomass burning fuel consumption rates: A field measurement database. Biogeosciences 2014, 11, 7305–7329. [Google Scholar] [CrossRef]
- Freeborn, P.H.; Wooster, M.J.; Roberts, G. Addressing the spatiotemporal sampling design of MODIS to provide estimates of the fire radiative energy emitted from Africa. Remote Sens. Environ. 2011, 115, 475–489. [Google Scholar] [CrossRef]
- Xu, W.; Wooster, M.J.; Roberts, G.; Freeborn, P. New GOES imager algorithms for cloud and active fire detection and fire radiative power assessment across North, South and Central America. Remote Sens. Environ. 2010, 114, 1876–1895. [Google Scholar] [CrossRef]
- Roberts, G.; Wooster, M.J.; Lagoudakis, E. Annual and diurnal African biomass burning temporal dynamics. Biogeosciences 2009, 6, 849–866. [Google Scholar] [CrossRef]
- Zhang, X.; Kondragunta, S. Temporal and spatial variability in biomass burned areas across the USA derived from the GOES fire product. Remote Sens. Environ. 2008, 112, 2886–2897. [Google Scholar] [CrossRef]
- Wooster, M.J.; Roberts, G.; Freeborn, P.H.; Xu, W.; Govaerts, Y.; Beeby, R.; He, J.; Lattanzio, A.; Mullen, R. Meteosat SEVIRI Fire Radiative Power (FRP) products from the Land Surface Analysis Satellite Applications Facility (LSA SAF)—Part 1: Algorithms, product contents and analysis. Atmos. Chem. Phys. 2015, 15, 9815–9895. [Google Scholar] [CrossRef]
- Roberts, G.; Wooster, M.J.; Xu, W.; Freeborn, P.H.; Morcrette, J.-J.; Jones, L.; Benedetti, A.; Kaiser, J. LSA SAF Meteosat FRP Products: Part 2—Evaluation and demonstration of use in the Copernicus Atmosphere Monitoring Service (CAMS). Atmos. Chem. Phys. 2015, 15, 13241–13267. [Google Scholar] [CrossRef] [Green Version]
- Aminou, D.M.A.; Jacquet, B.; Pasternak, F. Characteristics of the Meteosat Second Generation (MSG) radiometer/imager: SEVIRI. Proc. SPIE 1997, 3221. [Google Scholar] [CrossRef]
- Roberts, G.; Wooster, M.J. Fire Detection and Fire Characterization over Africa using Meteosat SEVIRI. IEEE Trans. Geosci. Remote Sens. 2008, 48, 1200–1219. [Google Scholar] [CrossRef]
- Freeborn, P.H.; Wooster, M.J.; Roy, D.P.; Cochrane, M.A. Quantification of MODIS fire radiative power (FRP) measurement uncertainty for use in satellite-active fire characterisation and biomass burning estimation. Geophys. Res. Lett. 2014, 41, 1988–1994. [Google Scholar] [CrossRef]
- Zhao, M.; Heinsch, F.A.; Nemaniu, R.R.; Running, S.W. Improvements of the MODIS terrestrial gross and net primary production global data set. Remote Sens. Environ. 2005, 95, 164–176. [Google Scholar] [CrossRef]
- Knyazikhin, Y.; Martonchik, J.V.; Myneni, R.B.; Diner, D.J.; Running, S.W. Synergistic algorithm for estimating vegetation canopy leaf area index and fraction of absorbed photosynthetically active radiation from MODIS and MISR data. J. Geophys. Res. 1998, 103, 3225–32274. [Google Scholar] [CrossRef]
- Friedl, M.A.; McIver, D.K.; Hodges, J.C.F.; Zhang, X.Y.; Muchoney, D.; Strahler, A.H.; Woodcock, C.E.; Gopal, S.; Schneider, A.; Cooper, A.; et al. Global land cover mapping from MODIS: Algorithms and early results. Remote Sens. Environ. 2002, 83, 287–302. [Google Scholar] [CrossRef]
- Montieth, J.L. Solar radiation and productivity in tropical ecosystems. J. Appl. Ecol. 1972, 9, 747–766. [Google Scholar] [CrossRef]
- Running, S.W.; Nemani, R.R.; Heinsch, N.A.; Zhao, M.; Reeves, M.; Hashimoto, H. A continuous satellite-derived measure of global terrestrial primary production: Future science and applications. Biosciences 2005, 56, 547–560. [Google Scholar]
- Wang, X.; Ma, M.; Li, X.; Song, Y.; Tan, J.; Huang, G.; Zhang, Z.; Zhao, T.; Feng, J.; Ma, Z.; et al. Validation of MODIS GPP product at 10 flux sites in northern China. Int. J. Remote Sens. 2013, 34, 587–599. [Google Scholar] [CrossRef]
- Sjostrom, M.; Zhao, M.; Archibald, S.; Arneth, A.; Cappelaere, B.; Falk, U.; de Grandcourt, A.; Hanan, N.; Kergoat, L.; Kutsch, W.; et al. Evaluation of MODIS gross primary productivity for Africa using eddy covariance data. Remote Sens. Environ. 2013, 131, 275–285. [Google Scholar] [CrossRef]
- Fensholt, R.; Sandholt, I.; Rasmussen, M.S.; Stisen, S.; Diouf, A. Evaluation of satellite based primary production modelling in the semi-arid Sahel. Remote Sens. Environ. 2006, 105, 173–188. [Google Scholar] [CrossRef]
- Giglio, L.; Loboda, T.; Roy, D.P.; Quayle, B.; Justice, C.O. An active-fire based burned area mapping algorithm for the MODIS sensor. Remote Sens. Environ. 2009, 113, 408–420. [Google Scholar] [CrossRef]
- Tsela, P.; Wessels, K.; Botai, J.; Achibald, S.; Swanepoel, D.; Steenkamp, K.; Frost, P. Validation of the two standard MODIS satellite burned area products and an empirically derived merged product in South Africa. Remote Sens. 2014, 6, 1275–1293. [Google Scholar] [CrossRef]
- Padilla, M.; Stehman, S.V.; Ramo, R.; Corti, D.; Hantson, S.; Oliva, P.; Alonso-Canas, I.; Bradley, A.V.; Tansey, K.; Mota, B.; et al. Comparing the accuracies of remote sensing global burned area products using stratified random sampling and estimation. Remote Sens. Environ. 2015, 160, 114–121. [Google Scholar] [CrossRef] [Green Version]
- Townshend, J.R.G.; Justice, C.O.; Skole, D.; Malingreau, J.-P.; Cihlar, J.; Teillet, P.; Sadowski, F.; Ruttenberg, S. The 1-km AVHRR global data set: Needs of the International Geosphere Biosphere Program. Int. J. Remote Sens. 1994, 15, 3319–3332. [Google Scholar] [CrossRef]
- Randerson, J.T.; Chen, Y.; van der Werf, G.R.; Rogers, B.M.; Morton, D.C. Global burned area and biomass burning emissions from small fires. Biogeosciences 2012, 117. [Google Scholar] [CrossRef] [Green Version]
- Smith, A.M.S.; Tinkham, W.T.; Roy, D.P.; Boschetti, L.; Kremens, R.L.; Kumar, S.S.; Sparks, A.M.; Falkowski, M.J. Quantification of fuel moisture effects on biomass consumed derived from fire radiative energy retrievals. Geophys. Res. Lett. 2013, 40, 6298–6302. [Google Scholar] [CrossRef] [Green Version]
- Dube, O.P. Challenges of wildland fire management in Botswana: Towards a community inclusive fire management approach. Weather Clim. Extremes 2013, 1, 26–41. [Google Scholar] [CrossRef]
- Govender, N.; Trollope, W.; van Wilgen, B.W. The effect of fire season, fire frequency, rainfall and management on fire intensity in savanna vegetation in South Africa. J. Appl. Ecol. 2006, 43, 748–758. [Google Scholar] [CrossRef] [Green Version]
- Korontzi, S.; Ward, D.E.; Susott, R.A.; Yokelson, R.J.; Justice, C.O.; Hobbs, P.V.; Smithwick, E.A.H.; Hao, W.M. Seaonal variation and ecosystem dependence of emission factors for selected trace gases and PM2.5 for southern Africa savanna fires. J. Geophys. Res. 2003, 108, D24. [Google Scholar] [CrossRef]
- Meyer, C.P.; Cook, G.D.; Reisen, C.F.; Smith, T.; Tattaris, M.; Russell-Smith, J.; Maier, S.W.; Yates, C.P.; Wooster, M.J. Direct measurement f seasonality of emission factors from savanna fires in northern Australia. J. Geophys. Res. Atmos. 2012, 117, D20. [Google Scholar] [CrossRef]
- Swinnen, E.; Van Hools, R.; Eerens, H. Algorithm Theoretical Basis Document: Dry Matter Productivity (DMP). In Gio Global Land Component—Lot, I. “Operation of the Global Land Component”; Copernicus; VITO: Boeretang, Belgium, 2015; pp. 1–37. [Google Scholar]
- Freeborn, P.H.; Cochrane, M.A.; Wooster, M.J. A decade long, multi-scale map comparison of fire regime parameters derived from three publically available satellite-based fire products: A case study in the Central African Republic. Remote Sens. 2014, 6, 4061–4089. [Google Scholar] [CrossRef]
- Ryan, C.M.; Williams, M.; Grace, J. Above and below ground carbon stocks in a Miombo woodland landscape in Mozambique. Biotropica 2011, 43, 423–432. [Google Scholar] [CrossRef]
- Roy, D.P.; Boschetti, L.; Justice, C.O.; Ju, J. The collection 5 MODIS burned area product—Global evaluation by comparison to the MODIS active fire product. Remote Sens. Environ. 2008, 112, 3690–3707. [Google Scholar] [CrossRef]
- Boschetti, L.; Roy, D.; Justice, C.; Giglio, L. Global assessment of the temporal reporting accuracy and precision of the MODIS burned area product. Int. J. Wildland Fire 2010, 19, 705–709. [Google Scholar] [CrossRef]
- Freeborn, P.H.; Wooster, M.J.; Roberts, G.; Xu, W. Evaluating the SEVIRI Fire Thermal Anomaly Detection Algorithm across the Central African Republic Using the MODIS Active Fire Product. Remote Sens. 2014, 6, 1890–1917. [Google Scholar] [CrossRef] [Green Version]
- Mathews, B.J.; Strand, E.K.; Smith, A.M.; Hudak, A.T.; Dickinson, B.; Kremens, R.L. Laboratory experiments to estimate interception of infrared radiation by tree canopies. Int. J. Wildland Fire 2016, 25, 1009–1014. [Google Scholar] [CrossRef]
- Johnston, J.M.; Wooster, M.J.; Lynham, T.J. Experimental confirmation of the MWIR and LWIR grey body assumption for vegetation fire flame emissivity. Int. J. Wildland Fire 2014, 23, 463–479. [Google Scholar] [CrossRef]
- Sjostrom Ardo, J; Arneth, A.; Boulain, N.; Cappelaere, B.; Eklundh, L.; de Grandcourt, A.; Kutsch, W.L.; Merbold, L.; Nouvellon, Y.; Scholes, R.J.; et al. Exploring the potential of MODIS EVI for modelling gross primary production across African ecosystems. Remote Sens. Environ. 2011, 131, 1081–1089. [Google Scholar] [CrossRef]
- Shea, R.W.; Shea, B.W.; Kauffman, J.B.; Ward, D.E.; Haskins, C.I.; Scholes, M.C. Fuel biomass and combustion factors associated with fires in savanna ecosystems of South Africa and Zambia. J. Geophys. Res. 1996, 101, 23551–23568. [Google Scholar] [CrossRef]
- Scholes, R.J.; Archer, S.R. Tree-grass interactions in savannas. Annu. Rev. Ecol. Syst. 1997, 28, 517–544. [Google Scholar] [CrossRef]
- Sa, A.C.L.; Pereira, J.M.C.; Silva, J.M.N. Estimation of combustion completeness based on fire-induced spectral reflectance changed in a dambo grassland (Western Province, Zambia). Int. J. Remote Sens. 2005, 26, 4185–4195. [Google Scholar] [CrossRef]
- Hoffa, E.A.; Ward, D.A.; Hao, W.-M.; Susott, R.A.; Walimoto, R.H. Seasonality of carbon emissions from biomass burning in a Zambian savanna. J. Geophys. Res. 1999, 104, 13841–13853. [Google Scholar] [CrossRef] [Green Version]
- Hely, C.; Alleaume, S.; Swap, R.J.; Shugart, H.H.; Justice, C.O. SAFRAI-2000 characterisation of fuels, fire behaviour, combustion completeness and emissions from experimental burns in infertile grass savanna in western Zambia. J. Arid Environ. 2003, 54, 381–394. [Google Scholar] [CrossRef]
- Ward, D.E.; Hao, W.M.; Susott, R.A.; Babbitt, R.E.; Shea, R.W.; Kauffman, J.B. Effects of fuel composition on combustion efficiency and emission factors for Africa savanna ecosystems. J. Geophys. Res. Atmos. 1996, 101, 23569–23576. [Google Scholar] [CrossRef]
- Calle, A.; Casanova, J.-L.; Gonzales-Alonso, F. Impact of point spread function of MSG SEVIRI on active fire detections. Int. J. Remote Sens. 2009, 30, 4567–4579. [Google Scholar] [CrossRef]
- Roberts, G.; Wooster, M.J. Development of a multi-temporal Kalman filter approach to geostationary active fire detection and fire radiative power (FRP) estimation. Remote Sens. Environ. 2014, 152, 392–412. [Google Scholar] [CrossRef]
- Dietenberger, M. Update for combustion properties of wood components. Fire Mater. 2002, 26, 255–267. [Google Scholar] [CrossRef] [Green Version]
- Schroeder, W.; Ellicott, E.; Ichoku, C.; Ellison, L.; Dickinson, M.B.; Ottmar, R.D.; Clements, C.; Hall, D.; Ambrosia, V.; Kremens, R. Integrated active fire retrievals and biomass burning emissions using complementary near-coincident ground, airborne and spaceborne sensor data. Remote Sens. Environ. 2014, 140, 719–730. [Google Scholar] [CrossRef]
- Frankman, D.; Webb, B.W.; Butler, B.W.; Jiminez, D.; Forthofer, J.M.; Sopko, P.; Shannon, K.S.; Hiers, J.K.; Ottmar, R.D. Measurements of convective and radiative heating in wildland fires. Int. J. Wildland Fire 2012, 22, 157–167. [Google Scholar] [CrossRef]
- Pereira, G.; Shimabukuro, Y.E.; Moraes, E.C.; Freitas, S.R.; Cardozo, F.S.; Longo, K.M. Monitoring the transport of biomass burning emission in South America. Atmos. Pollut. Res. 2011, 3, 247–254. [Google Scholar] [CrossRef]
- Dickinson, M.B.; Hudak, A.T.; Zajkowski, T.; Loudermilk, E.L.; Schroeder, W.; Ellison, L.; Kremens, R.J.; Holley, W.; Martinez, O.; Paxton, A.; et al. Measuring radiant emissions from entire prescribed fires with ground, airborne, and satellite sensors—RxCADRE 2012. Int. J. Wildland Fire 2015, 25, 48–61. [Google Scholar] [CrossRef]
- Xu, W.; Wooster, M.J.; Kaneko, T.; He, J.; Zhang, T.; Fisher, D. Major advances in geostationary fire radiative power (FRP) retrieval over Asia and Australia stemming from use of Himarawi-8 AHI. Remote Sens. Environ. 2017, 193, 138–149. [Google Scholar] [CrossRef]




© 2018 by the authors. Licensee MDPI, Basel, Switzerland. This article is an open access article distributed under the terms and conditions of the Creative Commons Attribution (CC BY) license (http://creativecommons.org/licenses/by/4.0/).
Share and Cite
Roberts, G.; Wooster, M.J.; Xu, W.; He, J. Fire Activity and Fuel Consumption Dynamics in Sub-Saharan Africa. Remote Sens. 2018, 10, 1591. https://doi.org/10.3390/rs10101591
Roberts G, Wooster MJ, Xu W, He J. Fire Activity and Fuel Consumption Dynamics in Sub-Saharan Africa. Remote Sensing. 2018; 10(10):1591. https://doi.org/10.3390/rs10101591
Chicago/Turabian StyleRoberts, Gareth, Martin J. Wooster, Weidong Xu, and Jiangping He. 2018. "Fire Activity and Fuel Consumption Dynamics in Sub-Saharan Africa" Remote Sensing 10, no. 10: 1591. https://doi.org/10.3390/rs10101591
APA StyleRoberts, G., Wooster, M. J., Xu, W., & He, J. (2018). Fire Activity and Fuel Consumption Dynamics in Sub-Saharan Africa. Remote Sensing, 10(10), 1591. https://doi.org/10.3390/rs10101591


