Article

Fire Activity and Fuel Consumption Dynamics in Sub-Saharan Africa

1
Geography and Environment, University of Southampton, Southampton, SO17 1BJ, UK
2
Department of Geography, Kings College London, Strand, London, WC2R 2LS, UK
3
NERC National Centre for Earth Observation (NCEO), Kings College London, Strand, London, WC2R 2LS, UK
*
Author to whom correspondence should be addressed.
Remote Sens. 2018, 10(10), 1591; https://doi.org/10.3390/rs10101591
Submission received: 13 July 2018 / Revised: 10 September 2018 / Accepted: 30 September 2018 / Published: 5 October 2018
(This article belongs to the Special Issue Remote Sensing of Biomass Burning)

Abstract

:
African landscape fires are widespread, recurrent and temporally dynamic. They burn large areas of the continent, modifying land surface properties and significantly affect the atmosphere. Satellite Earth Observation (EO) data play a pivotal role in capturing the spatial and temporal variability of African biomass burning, and provide the key data required to develop fire emissions inventories. Active fire observations of fire radiative power (FRP, MW) have been shown to be linearly related to rates of biomass combustion (kg s−1). The Meteosat FRP-PIXEL product, delivered in near real-time by the EUMETSAT Land Surface Analysis Satellite Applications Facility (LSA SAF), maps FRP at 3 km resolution and 15-min intervals and these data extend back to 2004. Here we use this information to assess spatio-temporal variations in fire activity across sub-Saharan Africa, and identify an overall trend of decreasing annual fire activity and fuel consumption, agreeing with the widely-used Global Fire Emissions Database (GFEDv4) based on burned area measures. We provide the first comprehensive assessment of relationships between per-fire FRE-derived fuel consumption (Tg dry matter, DM) and temporally integrated Moderate Resolution Imaging Spectroradiometer (MODIS) net photosynthesis (PSN) (Tg, which can be converted into pre-fire fuel load estimates). We find very strong linear relationships over southern hemisphere Africa (mean r = 0.96) that are partly biome dependent, though the FRE-derived fuel consumptions are far lower than those derived from the accumulated PSN, with mean fuel consumptions per unit area calculated as 0.14 kg DM m−2. In the northern hemisphere, FRE-derived fuel consumption is also far lower and characterized by a weaker linear relationship (mean r = 0.76). Differences in the parameterization of the biome look up table (BLUT) used by the MOD17 product over Northern Africa may be responsible but further research is required to reconcile these differences. The strong relationship between fire FRE and pre-fire fuel load in southern hemisphere Africa is encouraging and highlights the value of geostationary FRP retrievals in providing a metric that relates very well to fuel consumption and fire emission variations. The fact that the estimated fuel consumed is only a small fraction of the fuel available suggests underestimation of FRE by Spinning Enhanced Visible and Infrared Imager (SEVIRI) and/or that the FRE-to-fuel consumption conversion factor of 0.37 MJ kg−1 needs to be adjusted for application to SEVIRI. Future geostationary imaging sensors, such as on the forthcoming Meteosat Third Generation (MTG), will reduce the impact of this underestimation through its ability to detect even smaller and shorter-lived fires than can the current second generation Meteosat.

1. Introduction

1.1. Significance of African Landscape Fires

Landscape fires modify the physical and radiative properties of the surface, and the chemical composition of the atmosphere [1,2,3,4]. Africa contributes on average almost half of all carbon emitted by landscape fires [5], around 1.0 (±0.22) Pg C yr−1 annually [6], though the continent is generally considered a small carbon sink [7,8], because assimilation of carbon by the growing vegetation is of a similar magnitude to the respiration, and because of its low fossil fuel emissions (4% of global total). Satellite remote sensing is key to better understanding the magnitude of fire on African landscapes, and we here use this technique to investigate the temporal dynamics of fuel consumption across sub-Saharan Africa, and its relationship to the available fuel load.

1.2. Remote Sensing of African Landscape Fires

Data from the Moderate Resolution Imaging Spectroradiometer (MODIS) onboard the Terra and Aqua polar orbiting satellites is used to provide burned area products [9,10,11,12]. These data feed into so-called ‘bottom-up’ fire emissions inventories, such as the widely-used Global Fire Emissions Database (GFED; [13,14]). Using MODIS burned area data plus model-based estimates of vegetation productivity (kg C m−2 d−1) and combustion completeness (unitless), total fuel consumption is estimated by GFED on a monthly, 0.25° grid-cell basis. African landscape fires, on average, are estimated to burn a mean of 242 Mha annually from these analyses, equivalent to around 70% of global annual burned area [15]. The inter-annual variability of African burned area is considered small compared to other continents [15], though there are significant spatial and temporal variations in intra-African patterns of landscape fire which are captured well by the burned area data. Andela and van der Werf [16] indicates that over roughly the last decade, annual burned area in southern hemisphere Africa has been on a generally slightly upward trajectory (possibly driven by climate anomalies occurring over this period) whilst a decreasing trend is observed in northern hemisphere Africa which is attributed to the expansion of cropland into savanna.
Fire activity can also be quantified using retrievals of the fire radiative power (FRP; [17,18,19,20]), which describes the rate of radiative energy release from the fires when they are actively burning. FRP retrievals have been used to describe ‘fire intensity’ in characterising fire regimes, investigating climate-fire-vegetation interactions and in quantifying the ecological impacts of fire such as post-fire vegetation regrowth and changes in vegetation composition [21,22,23,24]. FRP retrievals also provide a measure of the rate of fuel consumption (kg−1 s−1) by reverse-calculating the amount of fuel required to combust in order to produce the measured energy output. The increased availability of near real time FRP products has seen these data used to estimate fuel consumption and smoke emissions at continental [25,26,27,28] and global scales [29,30,31,32]. However, FRE-derived fuel consumption estimates are typically lower than those provided by ‘bottom up’ emissions inventories such as GFED [26,27]. A number of environmental factors contribute to this underestimation including the omission of small and/or low intensity active fires [33], FRP interception by overstory vegetation [34] and differences in the FRE to fuel consumption coefficient values which may result from different fuel and fire characteristics [28,35]. Validation remains a key challenge in quantifying regional and continental scale fuel consumption as very few field observations exist (e.g., reference [36]) and fuel consumption estimates per unit area (e.g., kg DM m2) may not fully capture the spatial variability of fuel consumption within a burned area.
Whilst polar orbiting sensors such as MODIS can also quantify FRP, their limited temporal resolution hampers their ability to estimate FRE [25,37]. Geostationary sensors, such as the Geostationary Operational Environmental Satellite (GOES) Imager and Advanced Himawari Imager (AHI) can provide data for very high temporal resolution FRP retrievals that is very beneficial for estimation of FRE, albeit their coarser pixel areas compared to polar-orbiting sensors, such as MODIS, results in a failure to detect more of the smaller and/or lower intensity fires [38,39,40].
The geostationary Meteosat FRP-PIXEL product [41] delivered in near real-time by the EUMETSAT Land Surface Analysis Satellite Applications Facility (LSA SAF) was the first operational geostationary FRP product. It uses data from Meteosat’s Spinning Enhanced Visible and Infrared Imager (SEVIRI) to retrieve FRP signals at 3 km resolution and 15-min intervals, and these data now extend back to 2004. The product’s performance, in terms of active fire detection omission errors, has been demonstrated to be significantly better than all other tested operational active fire products generated from SEVIRI [42] and we use this data here to assess spatio-temporal variations in fire activity across sub-Saharan Africa from 2004 onwards. We also use temporally integrated SEVIRI FRP data to estimate fire radiative energy (FRE), from which we calculate the landscape fire fuel consumption, and we compare these estimates to those related to the accumulated fuel available to burn, which we derive from MODIS vegetation productivity and burned area products. Overall, our aim is to investigate the temporal dynamics of FRP-derived fuel consumption and its relationship to the available fuel load. This will increase our knowledge of fire behaviour and impacts across sub-Saharan Africa.

2. Materials

2.1. Fire Radiative Power (METEOSAT FRP-PIXEL Product)

Meteosat’s SEVIRI acquires multispectral imagery every 15-min across the full Earth disk, extending to Europe, North and South Africa and part of South America. The ground sampling distance (GSD) is 3 km at the sub-satellite point (SSP), and grows larger as the viewing zenith angle increases away from this location [43]. The FRP-PIXEL product provided by the LSA SAF is generated via an operational version of the Fire Thermal Anomaly (FTA) geostationary active fire detection algorithm of reference [44] and the middle-wave infrared (MWIR) radiance FRP retrieval approach of references [18,20]. Comparisons to 1 km MODIS FRP data collected concurrently with the SEVIRI data indicates that the SEVIRI product suffers from major omission errors for fires with an FRP less than ≈40 MW compared to MODIS due to SEVIRI’s much coarser pixel area. However, for higher FRP fires detected by SEVIRI near simultaneously with MODIS, 76% had a SEVIRI retrieved FRP within 30% of the matching MODIS measure [42]. Given the rapidly changing nature of fire activity, the up to 6 min time difference between the two sensors views, and the fact that even absolutely simultaneous MODIS views of the same fire indicate a ±24% uncertainty exists in the MODIS FRP measures [45], this comparison exemplifies the strong performance of the SEVIRI FRP-PIXEL product. Thus, whilst SEVIRI underestimates regional fire activity through the omission of small or low intensity fires, it is capable of reliably measuring FRP from fires that are sufficiently large and/or intense enough to be above the 40 MW detection threshold, and indeed, the inter-comparison to other SEVIRI-based active fire products [42] over southern Africa indicates the FRP-PIXEL product has the best active fire detection performance of any such product.

2.2. Gross and Net Primary Productivity (MODIS MOD17A2H/MOD17A3)

A variety of MODIS primary productivity datasets were considered for derivation of pre-fire fuel availability. The MODIS MOD17A2 and A3 products quantify gross primary productivity (GPP; kg C m-2 day−1), whilst the MODIS MOD17A3 product describes the net primary productivity (NPP; kg C m-2 yr−1) which is the fraction of the GPP remaining after accounting for autotrophic respiration [46].
The MODIS GPP data are delivered via the MOD17A2 algorithm on an 8-day basis at 0.5 km, using the MODIS-derived leaf area index (LAI), fPAR (MCD15A2H; [47]) and land cover (MOD12; reference [48]) data products as inputs. Meteorological information and biome-specific physiological parameters are also used, and estimates of NPP and net photosynthesis (PSN; kg C m-2 day−1) are also provided.
P S N = G P P R m l     R m r
where G P P is gross primary productivity (kg C m-2 day−1), and R m l   and R m r are the maintenance respiration by leaves and fine roots respectively (kg C kg C−1 day−1). The PSN product does not include live wood maintenance or growth respiration costs, which are removed when calculating the annual NPP (MOD17A3) using:
N P P =   i = 1 365 P S N ( R m o + R g )
where R m o is the maintenance respiration of all living matter except leaves and fine roots (kg C kg C−1 day−1) and R g is the growth respiration (kg C kg C−1 day−1).
In contrast to the relatively high temporal resolution GPP data, the MODIS NPP products delivered via the MOD17 algorithm are produced only on an annual basis (at 0.5 km resolution). They are based on the light use efficiency (LUE) approach originally developed in reference [49], where NPP is expressed as a function of the plants LUE (ε) and the amount of absorbed photosynthetically active radiation (aPAR) [46,50]. Due to its very limited temporal information, we chose to focus on the 8-day MODIS GPP product and the derived parameter of PSN.
Processing refinements applied to mitigate the impact of residual cloud contamination on the MODIS data, along with improved spatial interpolation of the air temperature, vapour pressure deficit, and incoming solar radiation have improved the temporal consistency of the MOD17 GPP product [46]. Wang et al., [51] evaluated these data at ten eddy covariance sites in China, predominantly covering croplands and grasslands, and found that the product captured temporal dynamics very well, but underestimated GPP by around 70% compared to the eddy covariance method. Similar evaluations in Africa also showed significant GPP underestimation, particularly at arid sites in the Sahel [52], and this was attributed to the parameterisation of the LUE term and to residual noise in the MODIS fPAR product. Fensholt et al., [53] compared MODIS (Collection 4 and 4.5) annual NPP and annually integrated PSN data against field measurements of above ground biomass (AGB) at semi-arid open shrubland and savanna sites in the Sahel, and found integrated PSN to be far better related to AGB (r2 = 0.77; slope of linear best fit = 0.59) than was annual NPP (r2 = 0.37; slope of linear best fit = 0.37). We selected to use the MODIS PSN (MOD17A2H) product because it is available on an 8-day basis, facilitating temporal integration between successive fires. The apparent better performance of the MOD17 product in southern hemisphere Africa relative to that in northern hemisphere Africa, adds a degree of uncertainty to our analysis in the northern hemisphere.

2.3. Burned Area (MODIS MCD64A1) and Land Cover (MODIS MCD12)

Since a SEVIRI-detected active fire may fill only a very small fraction of the SEVIRI pixel (e.g., down to 10−4 of the ≈10 km2 pixel area; reference [41]) we used the 500 m MCD64A1 MODIS burned area product [54] to identify the actual area burned by each discrete fire event. The MCD64A1 product maps burned area using time-series of burn-sensitive vegetation indices, along with active fire (AF) detections to seed the algorithm and help identify the date of burning [54]. The MCD64A1 product performs well in Africa [55], is used within GFED, and has shown reasonable agreement with far higher spatial resolution burned area estimates derived from 30 m Landsat data [56]. It does however show a tendency to underestimate burned area, typically by between 5 and 41% depending on tree canopy cover [54].
To identify the land cover affected by each fire we used the 500 m spatial resolution MODIS land cover product (MCD12Q1, reference [48]), which was updated annually until 2012. Five different classification schemes are available, and we selected the 16 class International Geosphere-Biosphere Programme (IGBP) land cover scheme [57]. Similar to reference [32], we simplified the number of classes into five broad fire-relevant types (closed canopy forest, shrubland, woodland savanna, grassland savannah and cropland/managed lands). The majority land cover type present within each SEVIRI active fire pixel was identified using these data.

3. Methodology

We used the SEVIRI FRP-PIXEL product to identify fire-affected pixels, which were grouped into individual fires using the spatio-temporal cluster-based procedures of reference [42] and then had their FRE estimated. To relate the FRE to pre-fire fuel load we narrowed the focus to fires in areas which burned in two successive years according to MCD61A1, enabling us to constrain the duration of the pre-fire period over which the MOD17A2H vegetation productivity information was temporally integrated to estimate fuel load. We assume that in these predominantly herbaceous burns the burnable material is removed during the first burn, so following reference [39], the total above ground biomass present and available to burn in the second burn was calculated via the MOD17A2H vegetation productivity information integrated over the duration of the pre-fire fuel build-up and across the burned area identified by the MCD64A1 product. This pre-fire fuel was then compared to the fires FRE taken from the FRP-PIXEL product integration. Full details of this calculation are included in reference [39], albeit they are applied to only a handful of fires and using an alternative to the MODIS-derived vegetation productivity information.

4. Results

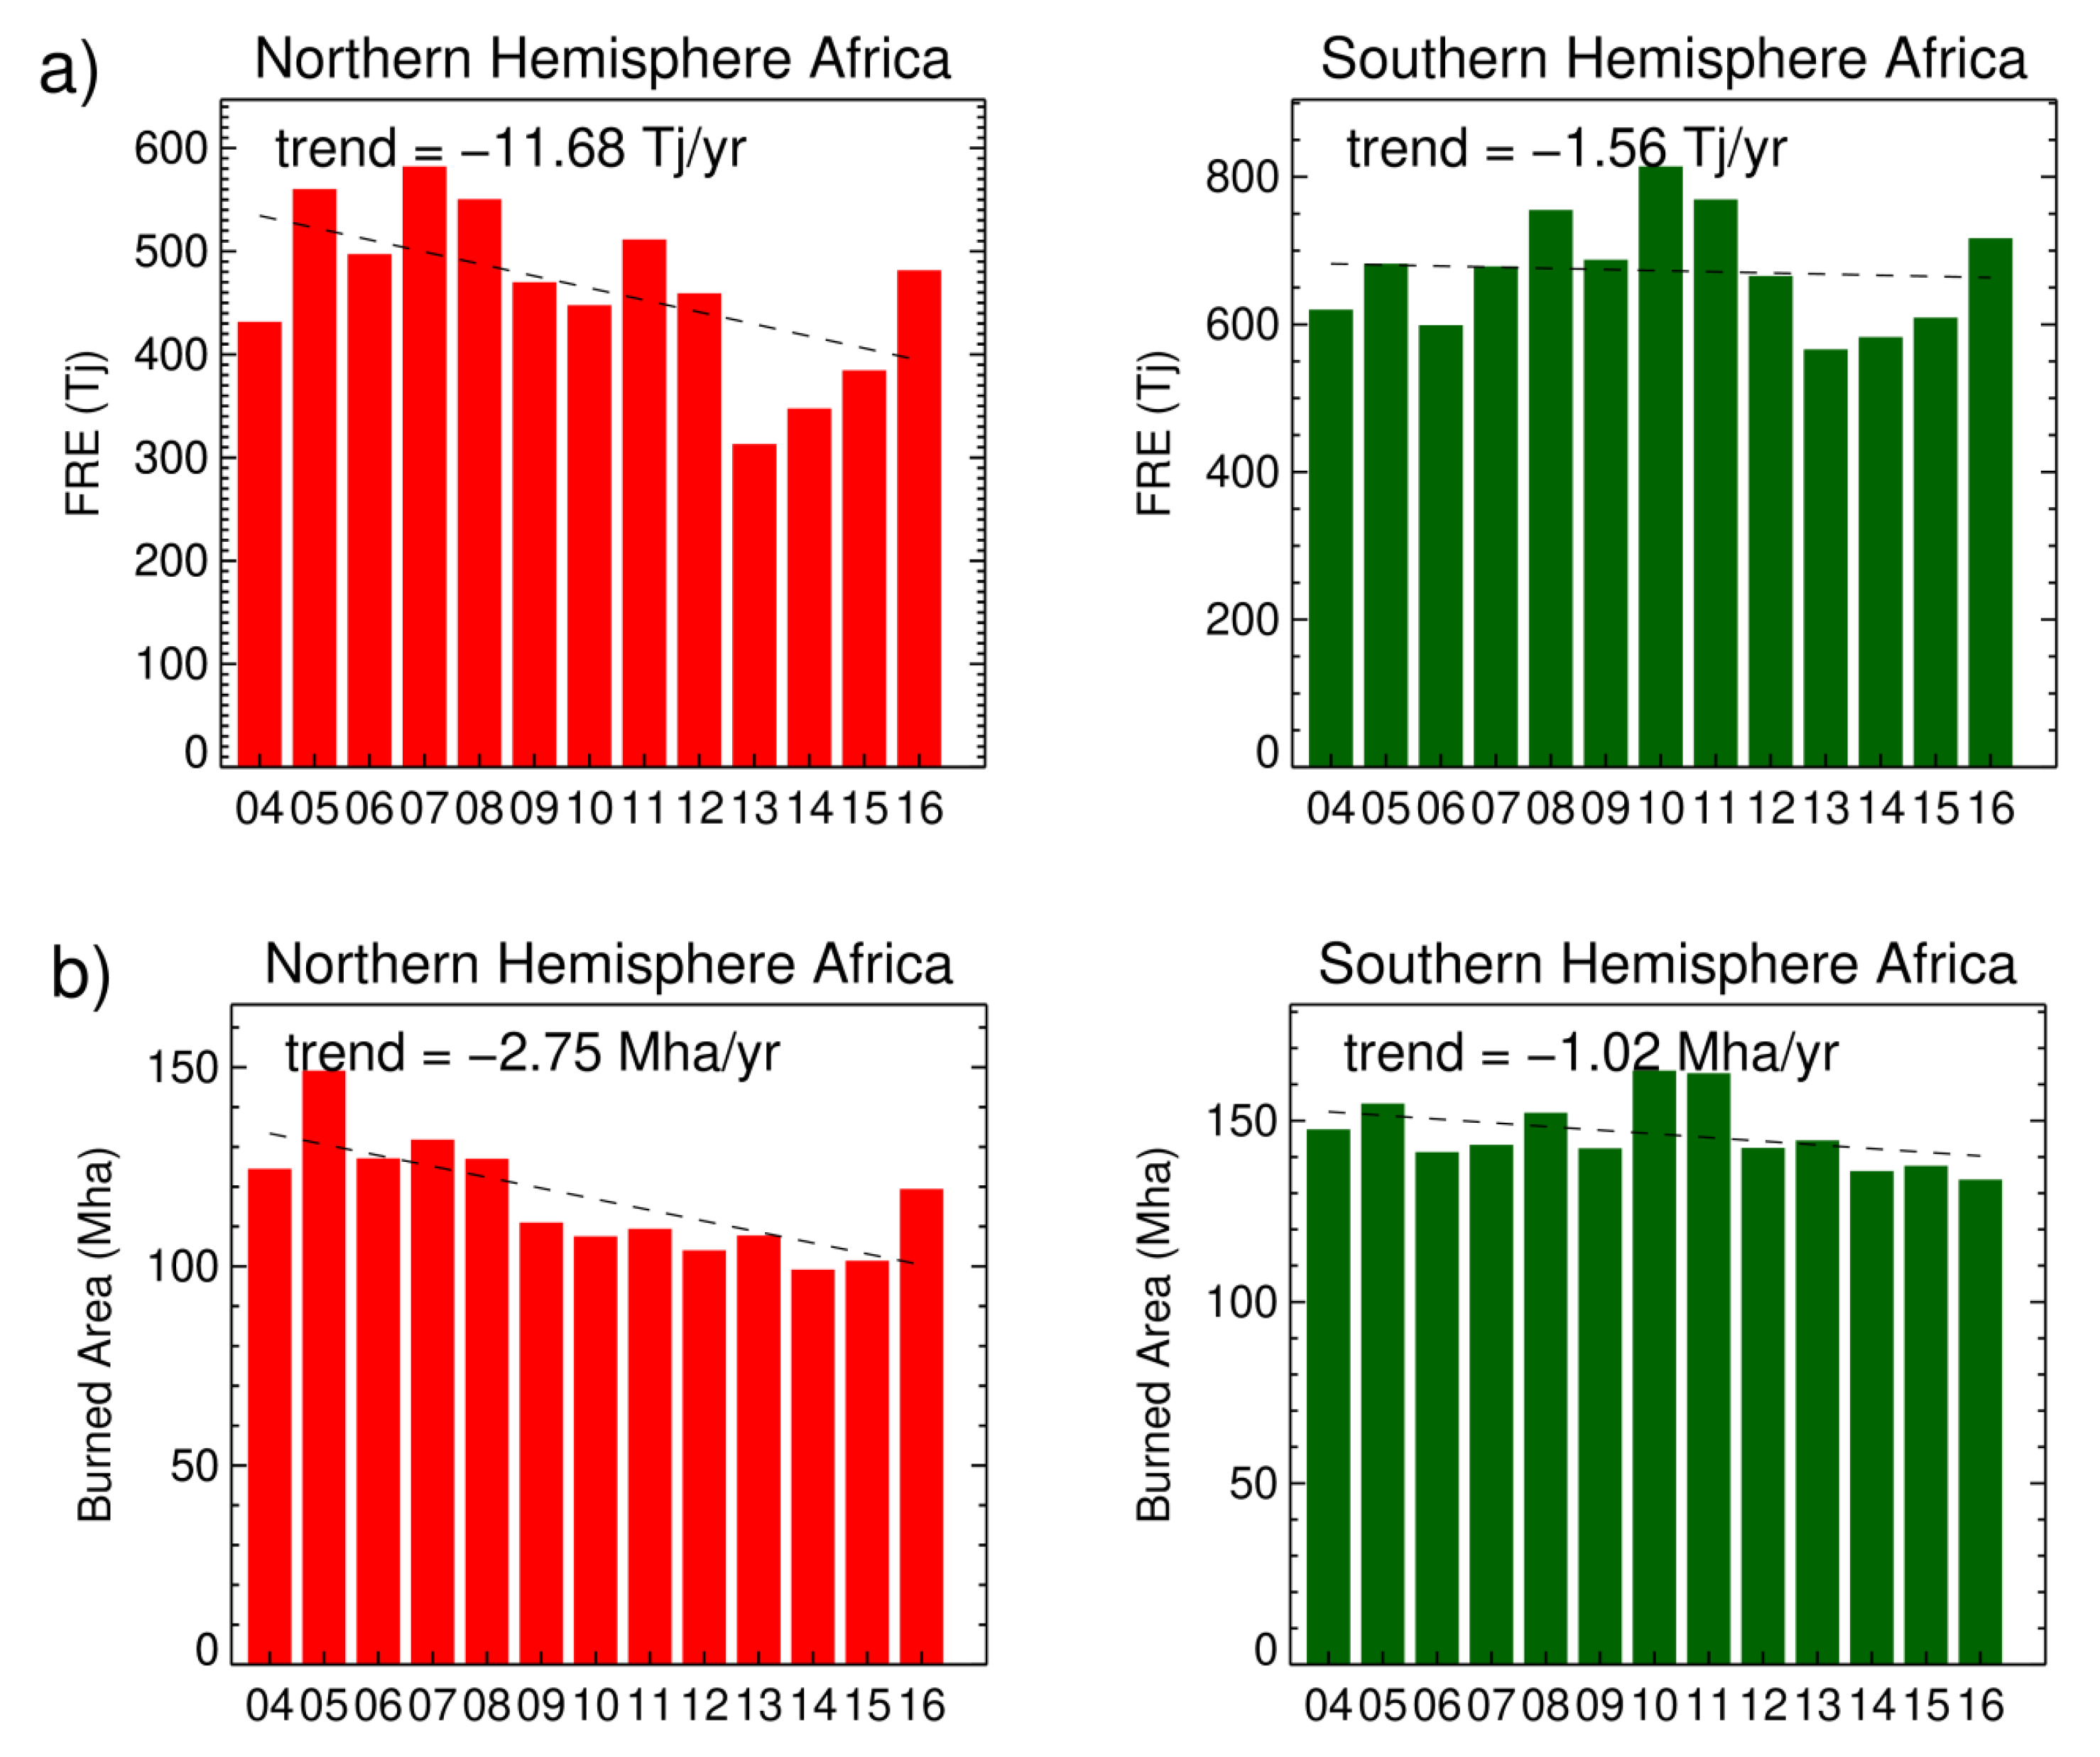
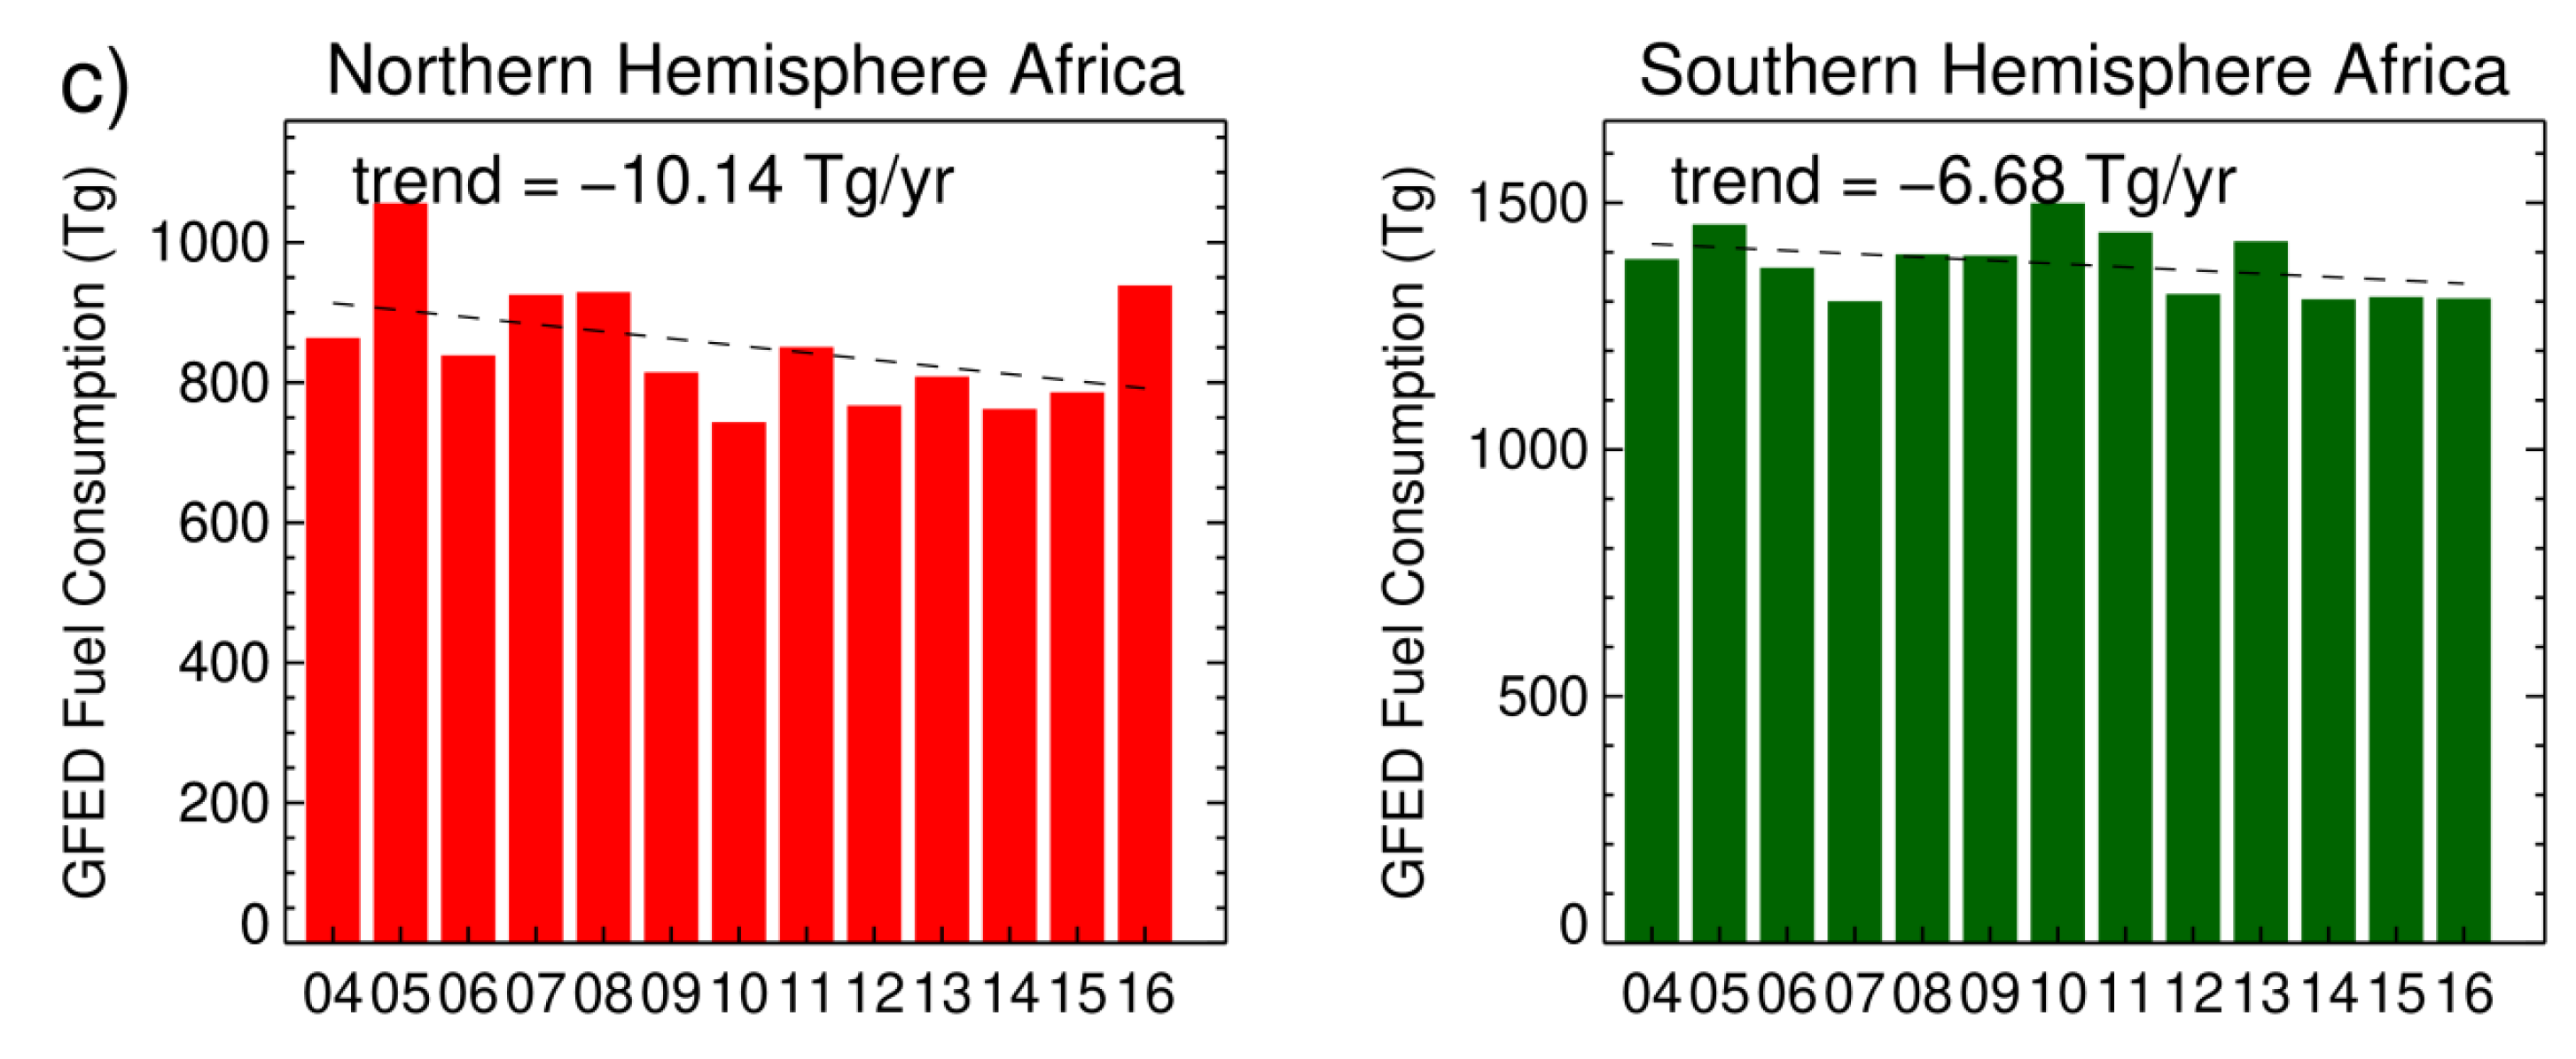
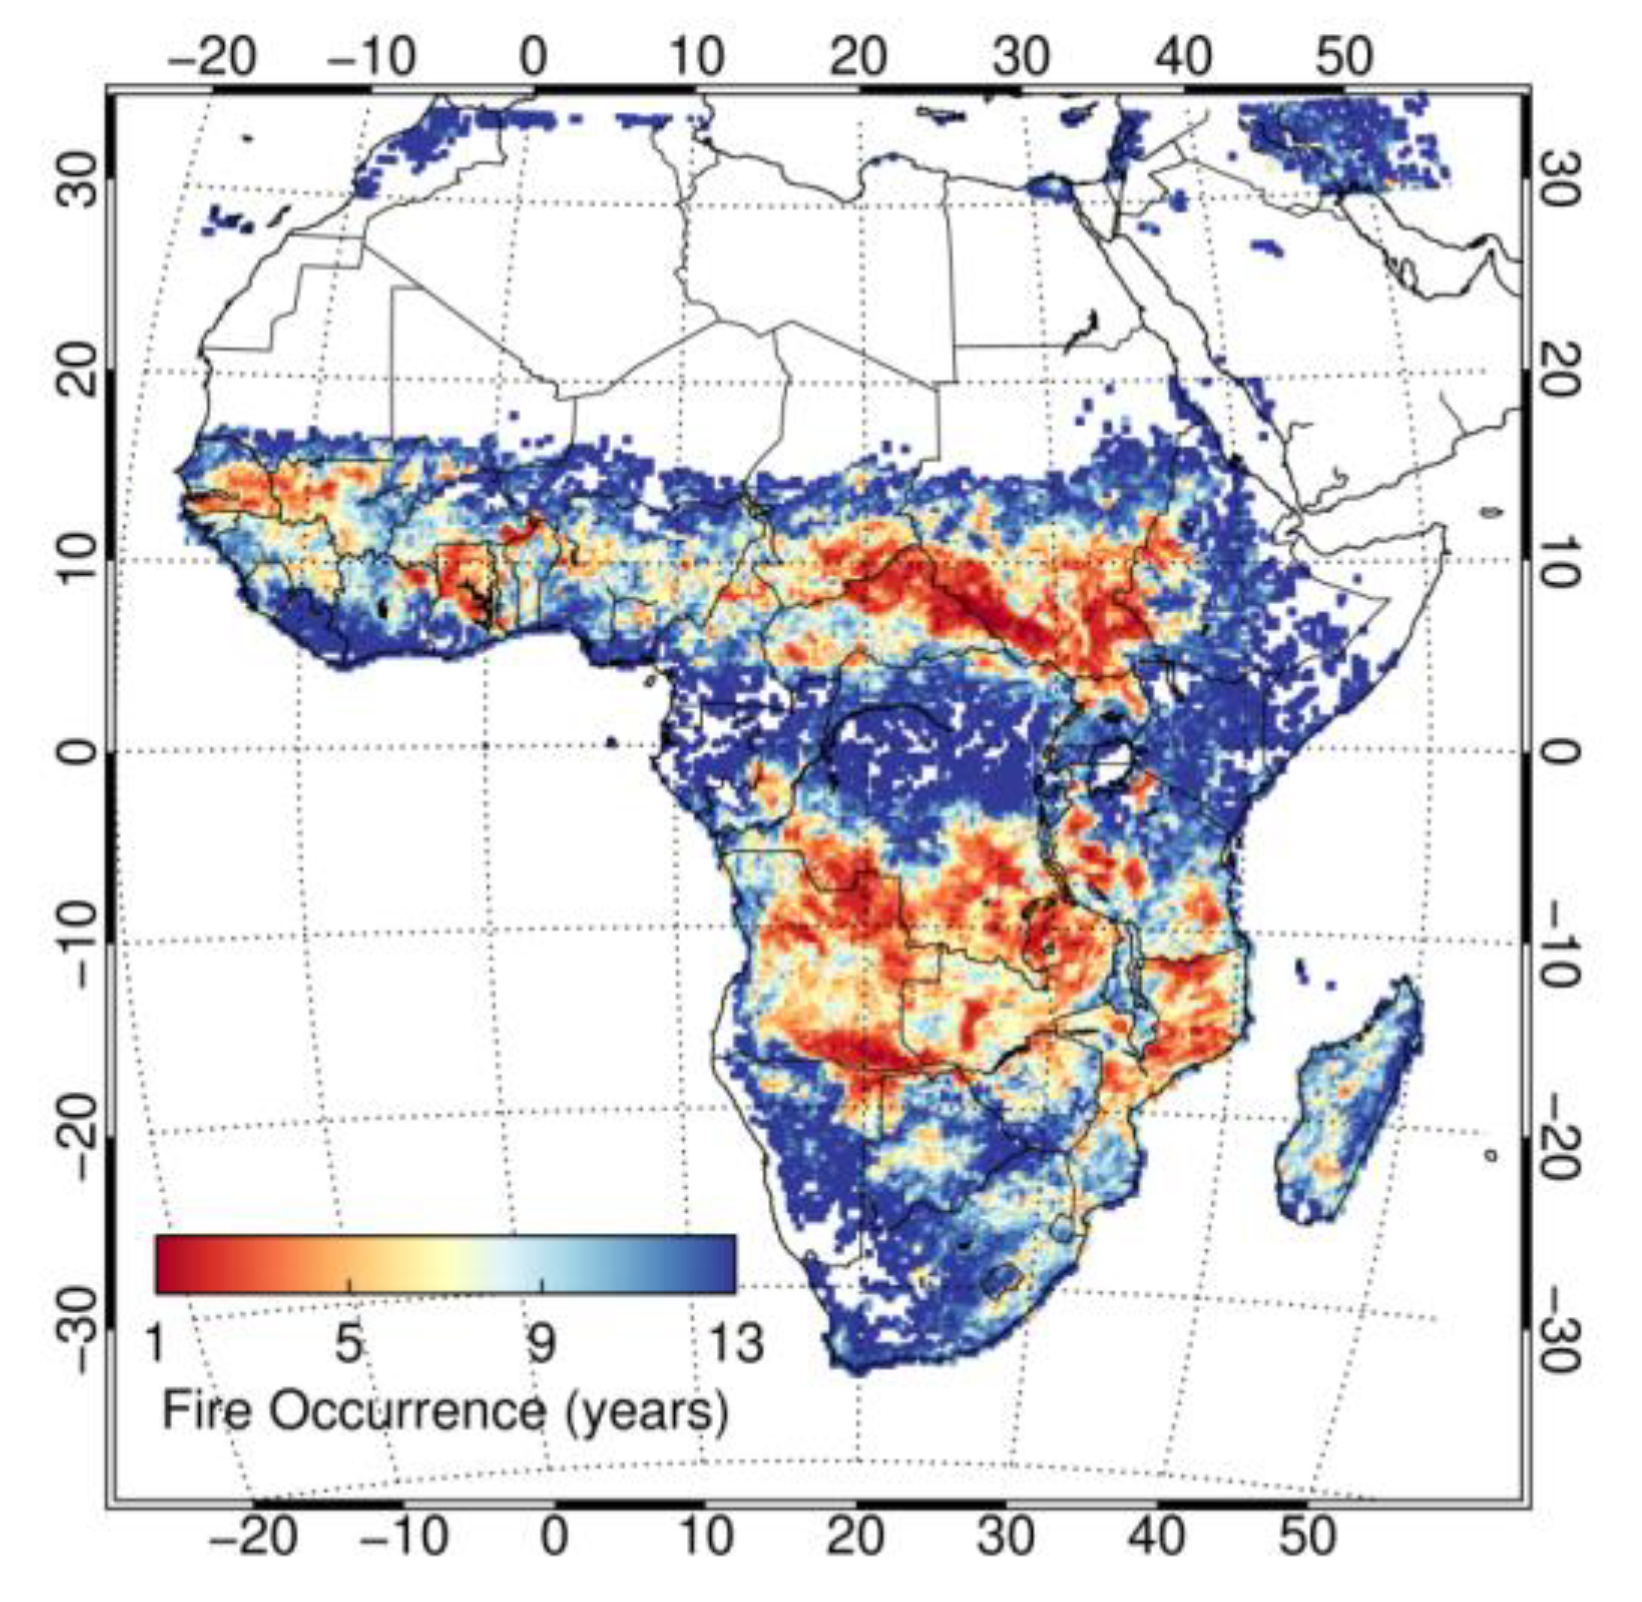
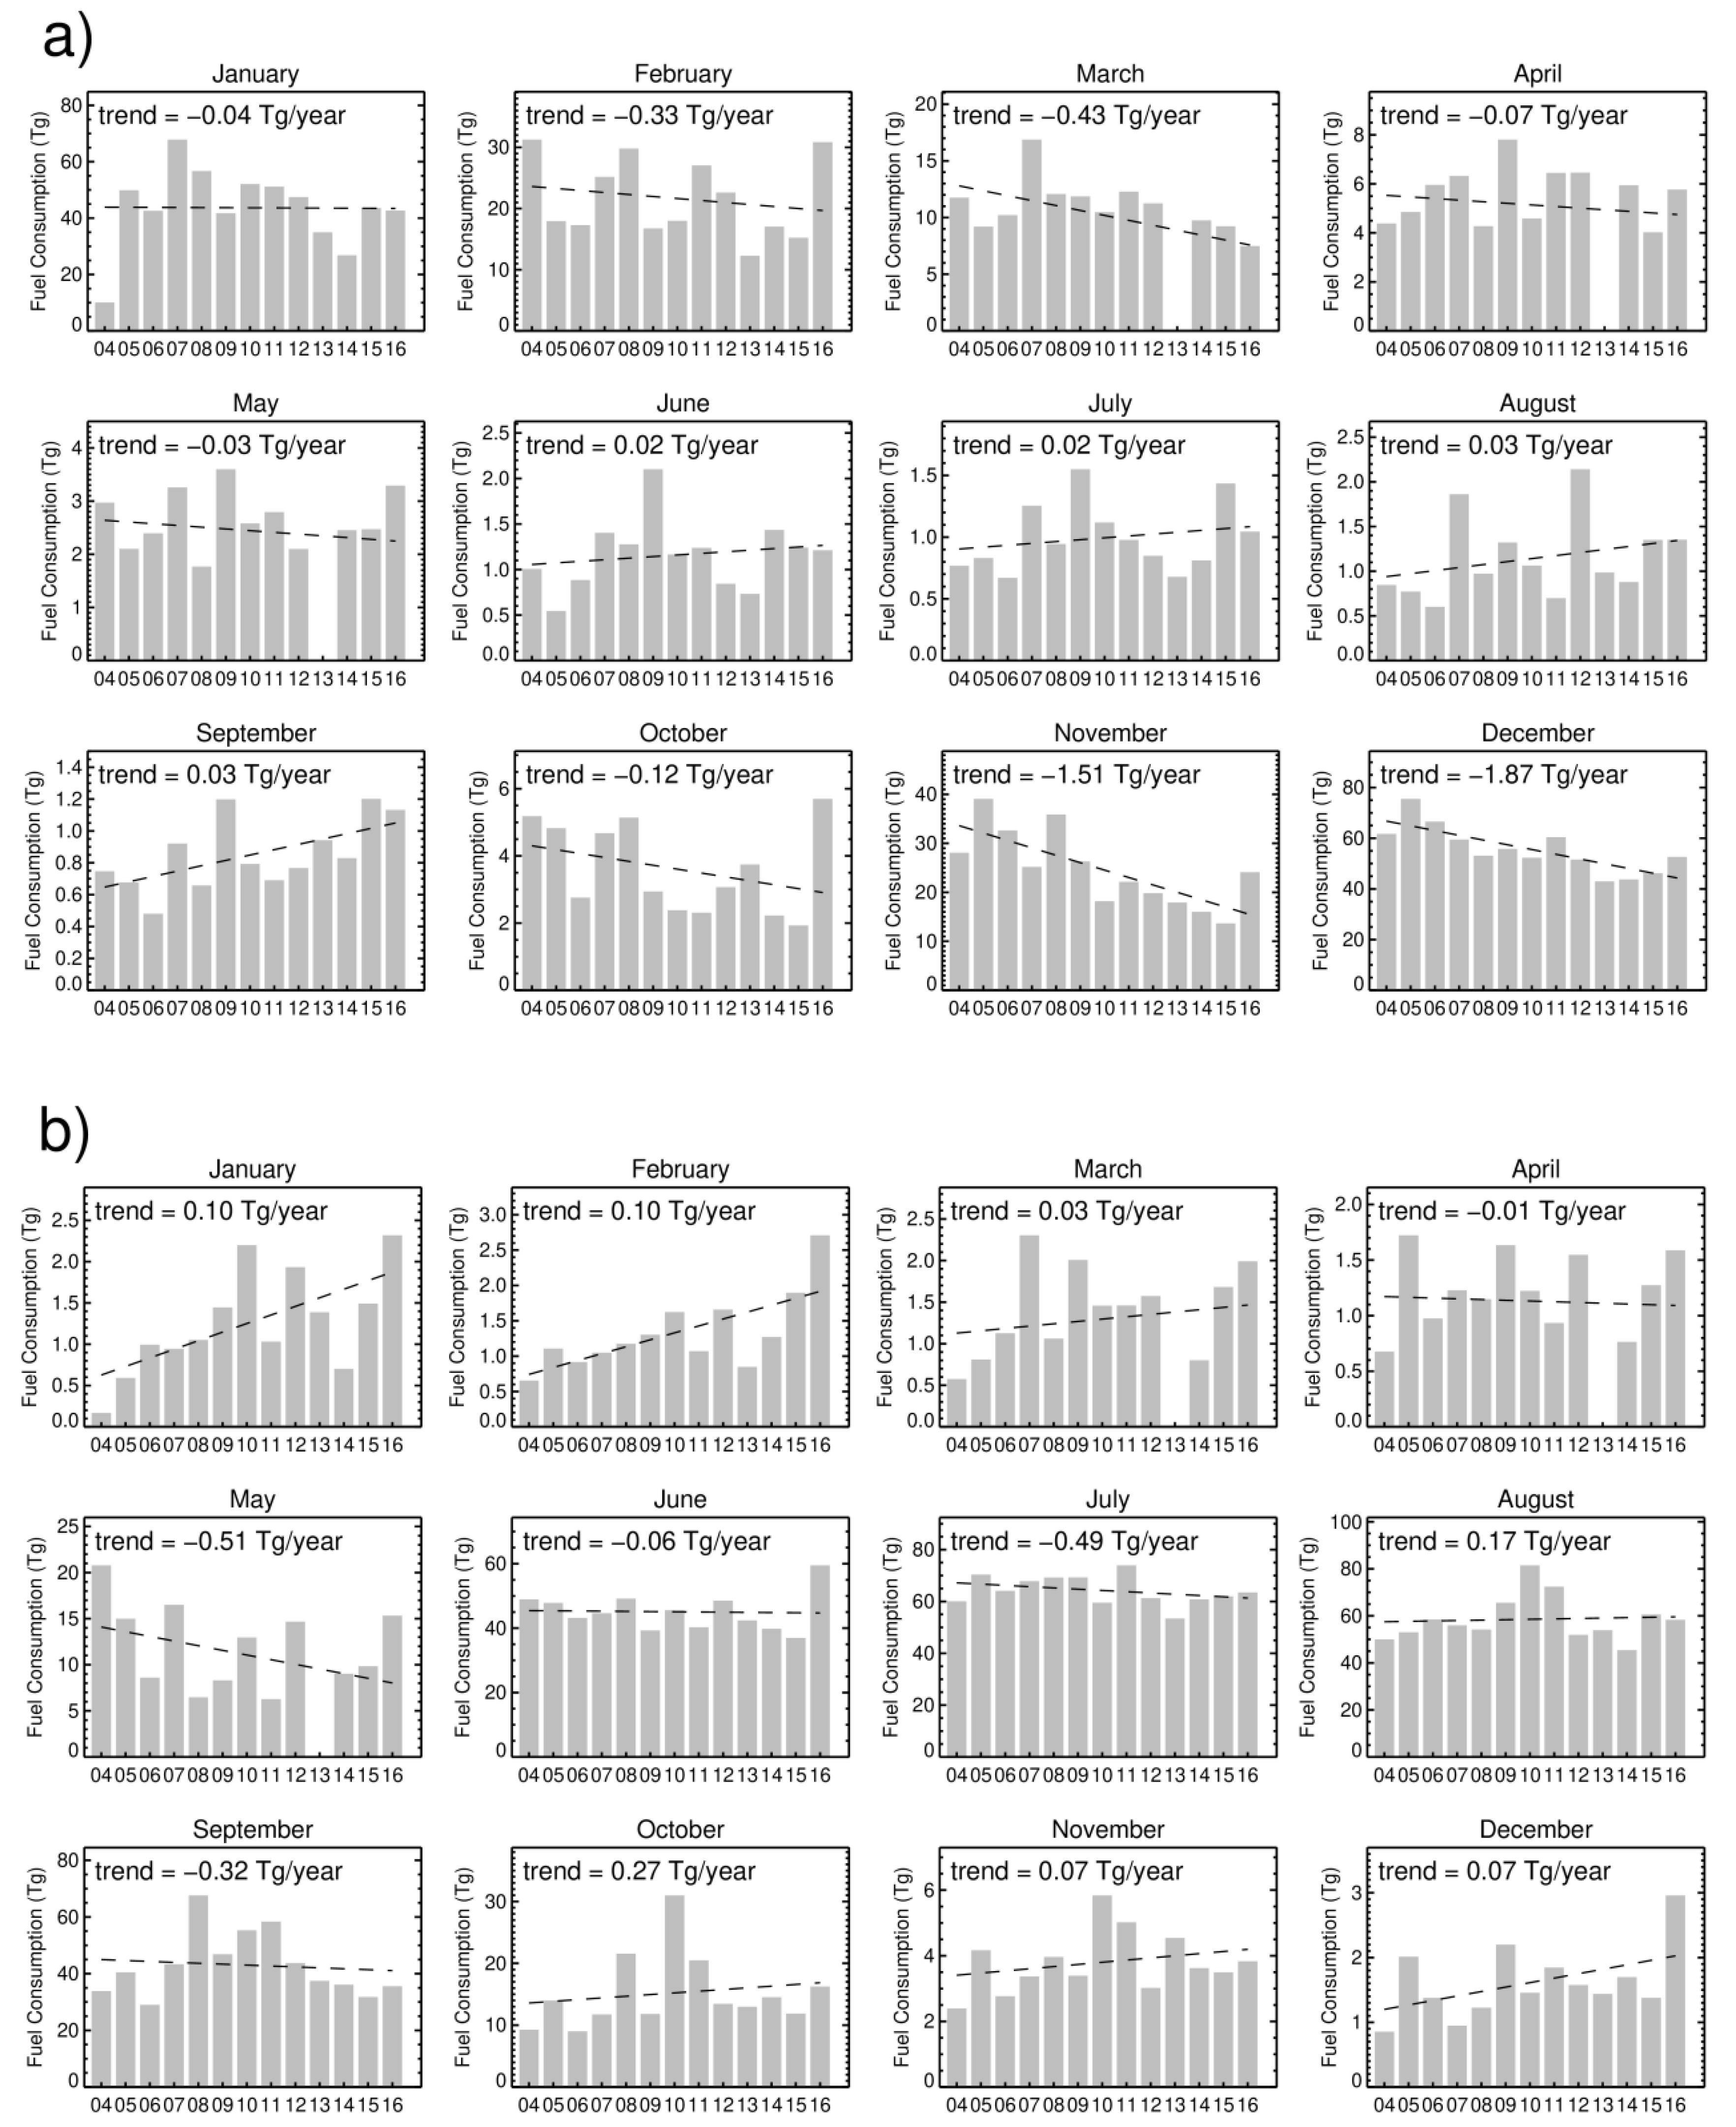
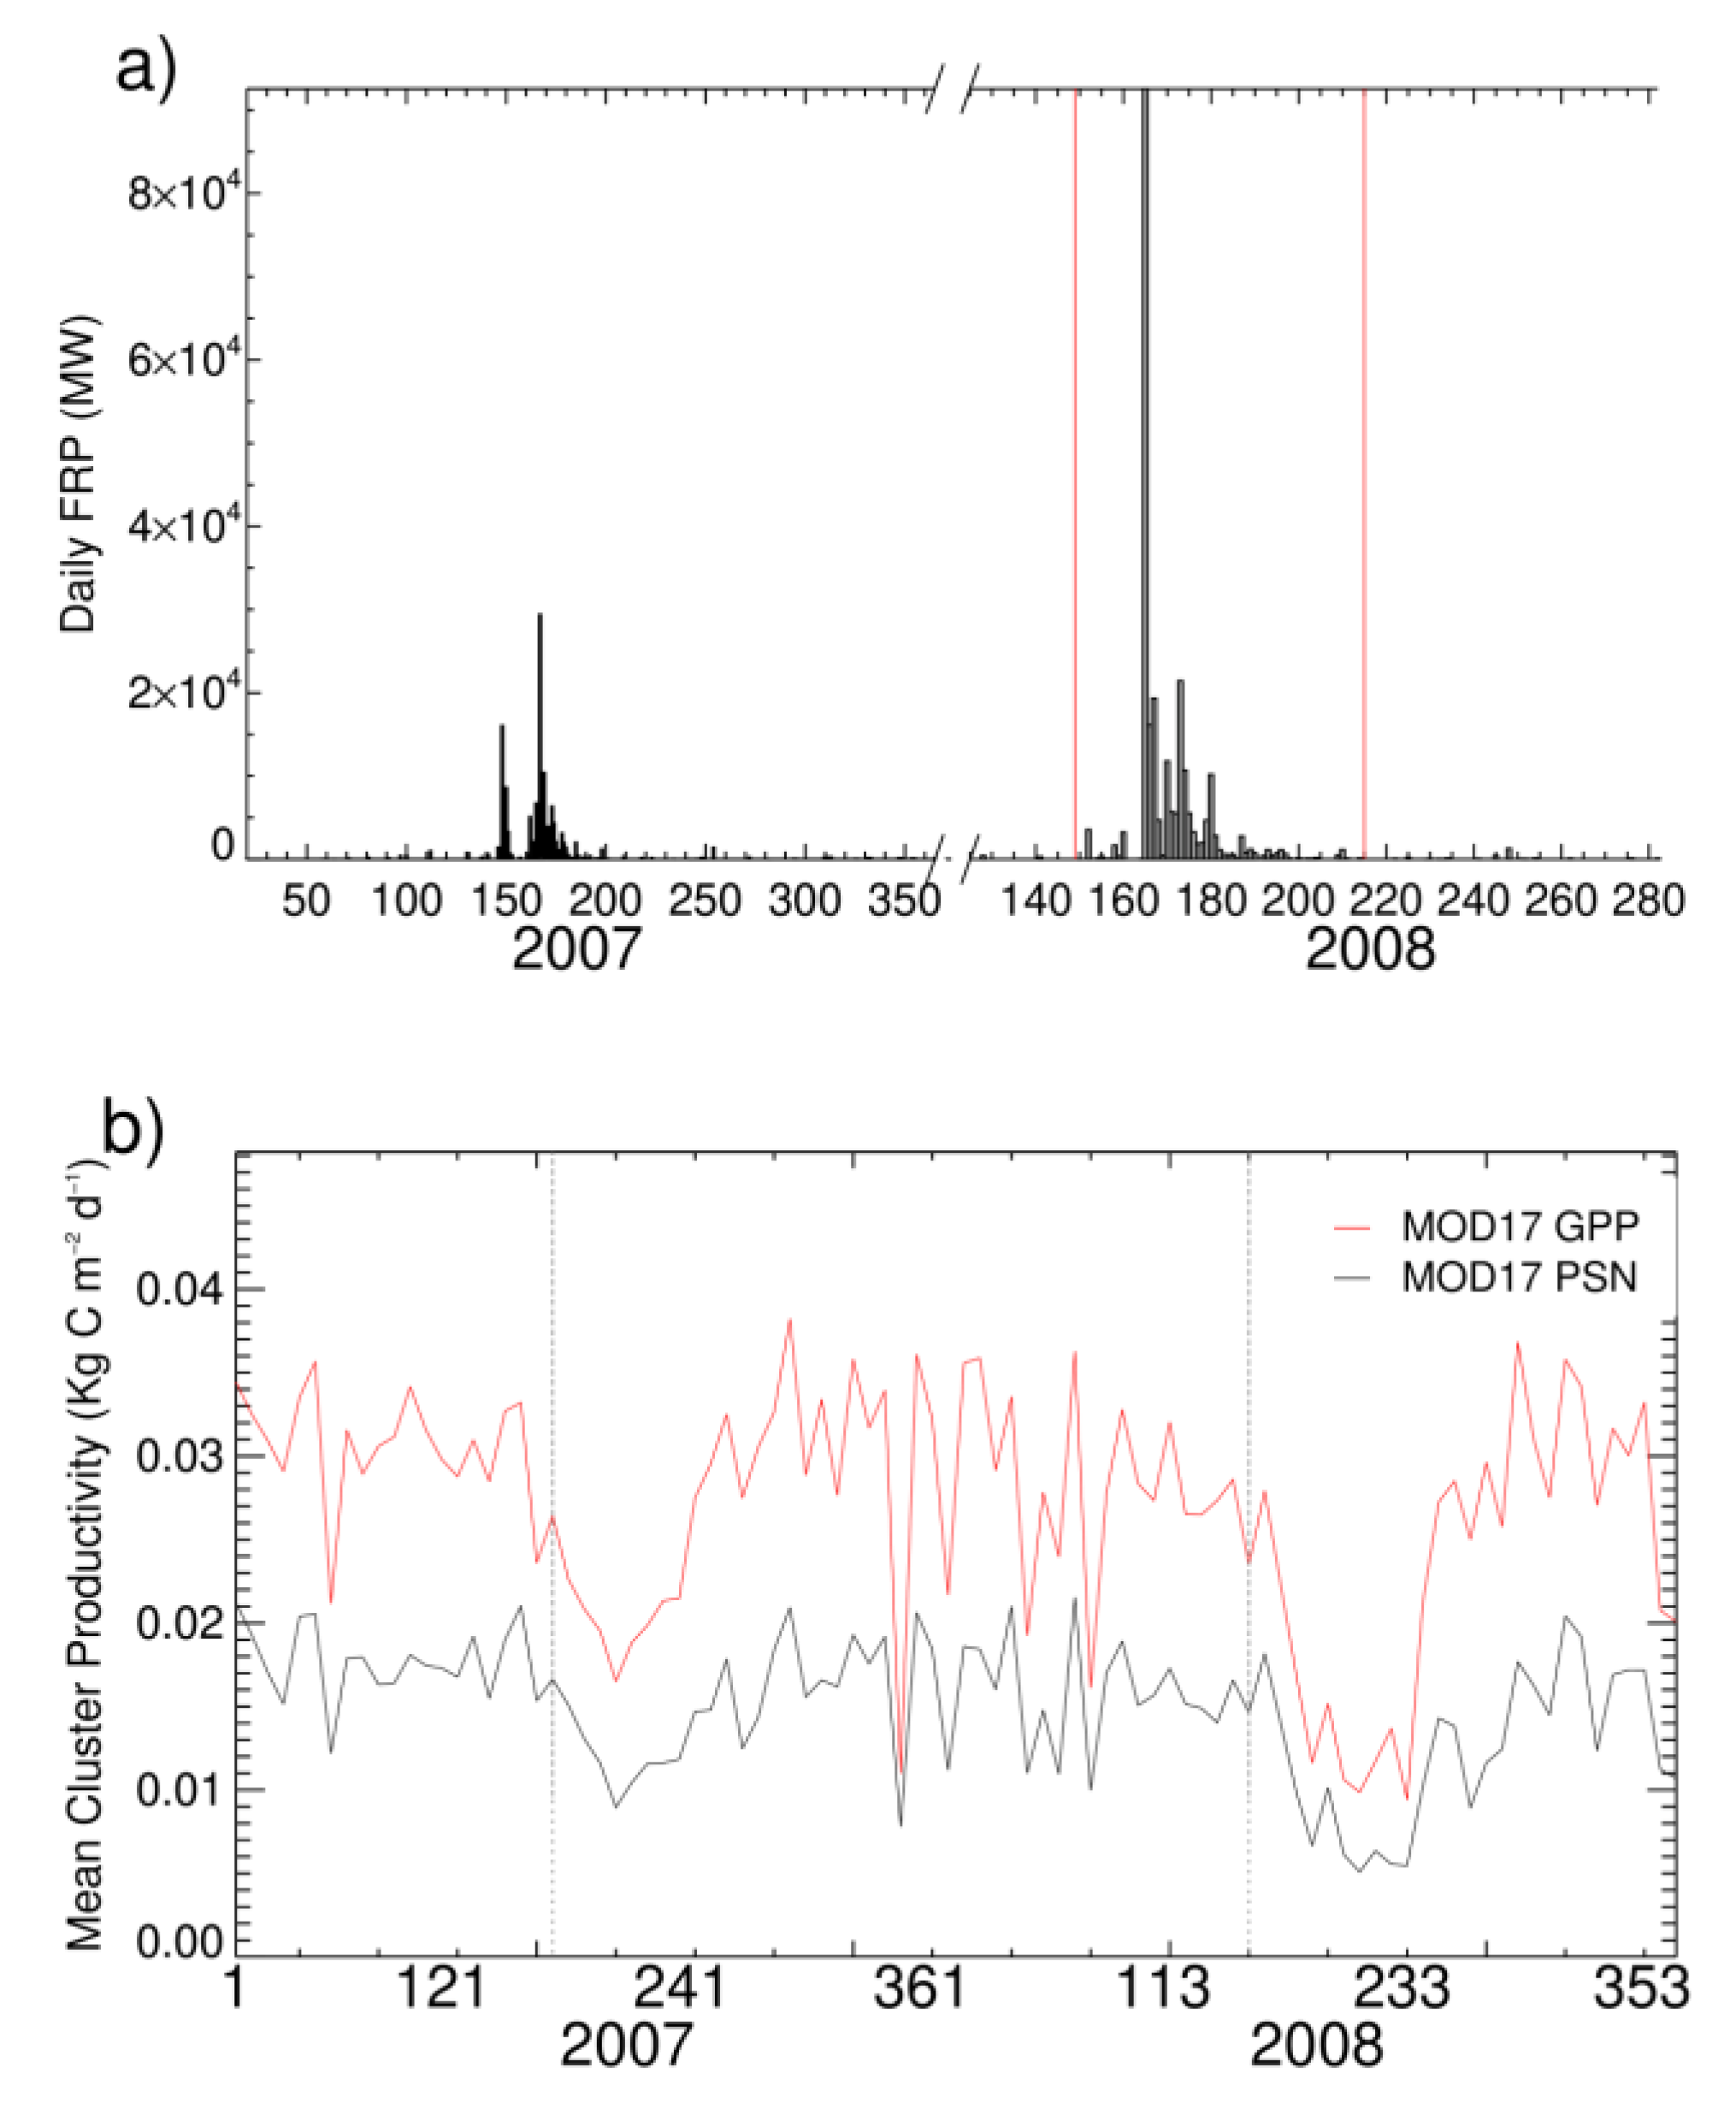
4.1. Annual and Seasonal Fire Dynamics

The interannual dynamics of the SEVIRI-derived FRE estimates for the northern and southern African hemispheres (shown in Figure 1a) match quite closely those of the MODIS burned area measurements (Figure 1b) and GFED total fuel consumption estimates (Figure 1c), though in general somewhat greater interannual variability is seen in the FRE data. The annual variation in SEVIRI FRE indicates that, in the northern hemisphere, fire activity peaked in 2007 and is decreasing by 11 Tj/year. A decreasing trend in also evident in the annual burned area (−2.75 Mha/year) although it is less pronounced than that of the FRE. Using the same burned area product although a different time-series (2001–2012), reference [16] found a decreasing trend in burned area in the northern hemisphere which was attributed to the expansion of cropland into savanna reducing the occurrence of fire. In the southern hemisphere, trends in these parameters are similar and are rather weak but slightly negative over the thirteen years examined and with local peaks around 2010/11. Over a different time frame, reference [16] found an increasing burned area trend in southern hemisphere Africa which was attributed to El Nino Southern Oscillation (ENSO) climate anomalies leading to increased fire activity. Figure 1b clearly demonstrates a fall in burned area since 2012, however. As evident from Figure 1a,b, annual dry matter (DM) fuel consumption estimates from GFED (version 4; not yet including the unvalidated small fire correction of reference [58]; Figure 1c), follow a similar trend to burned area and FRE, but do exhibit some different dynamics.
Using the conversion factor (0.37 kg DM MJ−1) described in reference [20] and whose magnitude has recently been confirmed as valid for satellite data retrievals by reference [28], SEVIRI-derived FRE retrievals deliver annual fuel consumption estimates ranging from 127–214 Tg and 208–299 Tg in northern and southern hemisphere Africa respectively, far lower than the GFED fuel consumption estimates (by 77 to 85%). Cloud obscuration, tree cover obscuration of surface fire FRP, and the inability of SEVIRI to detect fires burning below ≈40 MW very likely contribute to these low totals, but the relatively consistent ratio between the FRE-derived and GFED estimates (0.14–0.23 between 2004–2016) shown in Figure 1a,c suggests a relationship between these two approaches which apply quite different methods to estimate landscape fire fuel consumption. Despite the findings of reference [28], other relatively recent research suggests that the relationship between FRE and fuel consumption might not be the same for larger fires, which contain propagating fire fronts and greater fuel moisture variability [35,59].
The annual dynamics of monthly FRE-derived fuel consumption in northern and southern hemisphere Africa (Figure 2a,b) indicates that the months in which fuel consumption is greatest are broadly consistent on an annual basis, whilst fuel consumption outside of the fire season is more variable albeit much lower in magnitude. June, July, August and September are the peak months of fuel consumption in the southern hemisphere although annual variations of 25–50% are evident in the latter two months. The peak months of fuel consumption (June–September) are characterised by very weak trends over time (both positive and negative). Fire activity during the biomass burning season, which in the northern hemisphere occurs between November–March and May–October in the southern hemisphere, drive the interannual trends observed in Figure 1a. The large increases in southern hemisphere fuel consumption in August and September in 2008 and 2010 coincide with the extensive fire activity that occurred in Botswana in these two years, where 11 and 13 Mha burned, respectively [60]. The peak fire season in the northern hemisphere extends between November and March which, as evident in the southern hemisphere, has large annual variations in monthly fuel consumption of 20–30% and typically display negative trends. Note that some SEVIRI data was missing in 2004 (January) and 2013 (March, April, May). A noticeable feature in Figure 2b is that several months outside of the biomass burning season (e.g., November–March) have strong positive trends in fuel consumption albeit at low magnitudes, which may have implications for emissions mitigation schemes employing early season burning as fires at these times tend to be low intensity due to higher fuel moisture content and relative humidity [61]. Korontzi et al., [62] found the modified combustion efficiency (MCE) to vary seasonally over southern African grassland and woodland, which can have a significant impact on the chemical composition of the smoke emissions although similar seasonality was not found by reference [63] in Australian savanna fires. In the northern hemisphere, a weak positive trend in fuel consumption in months outside of the fire season is evident although the large variability makes the interpretation of these dynamics more uncertain than those in the southern hemisphere.

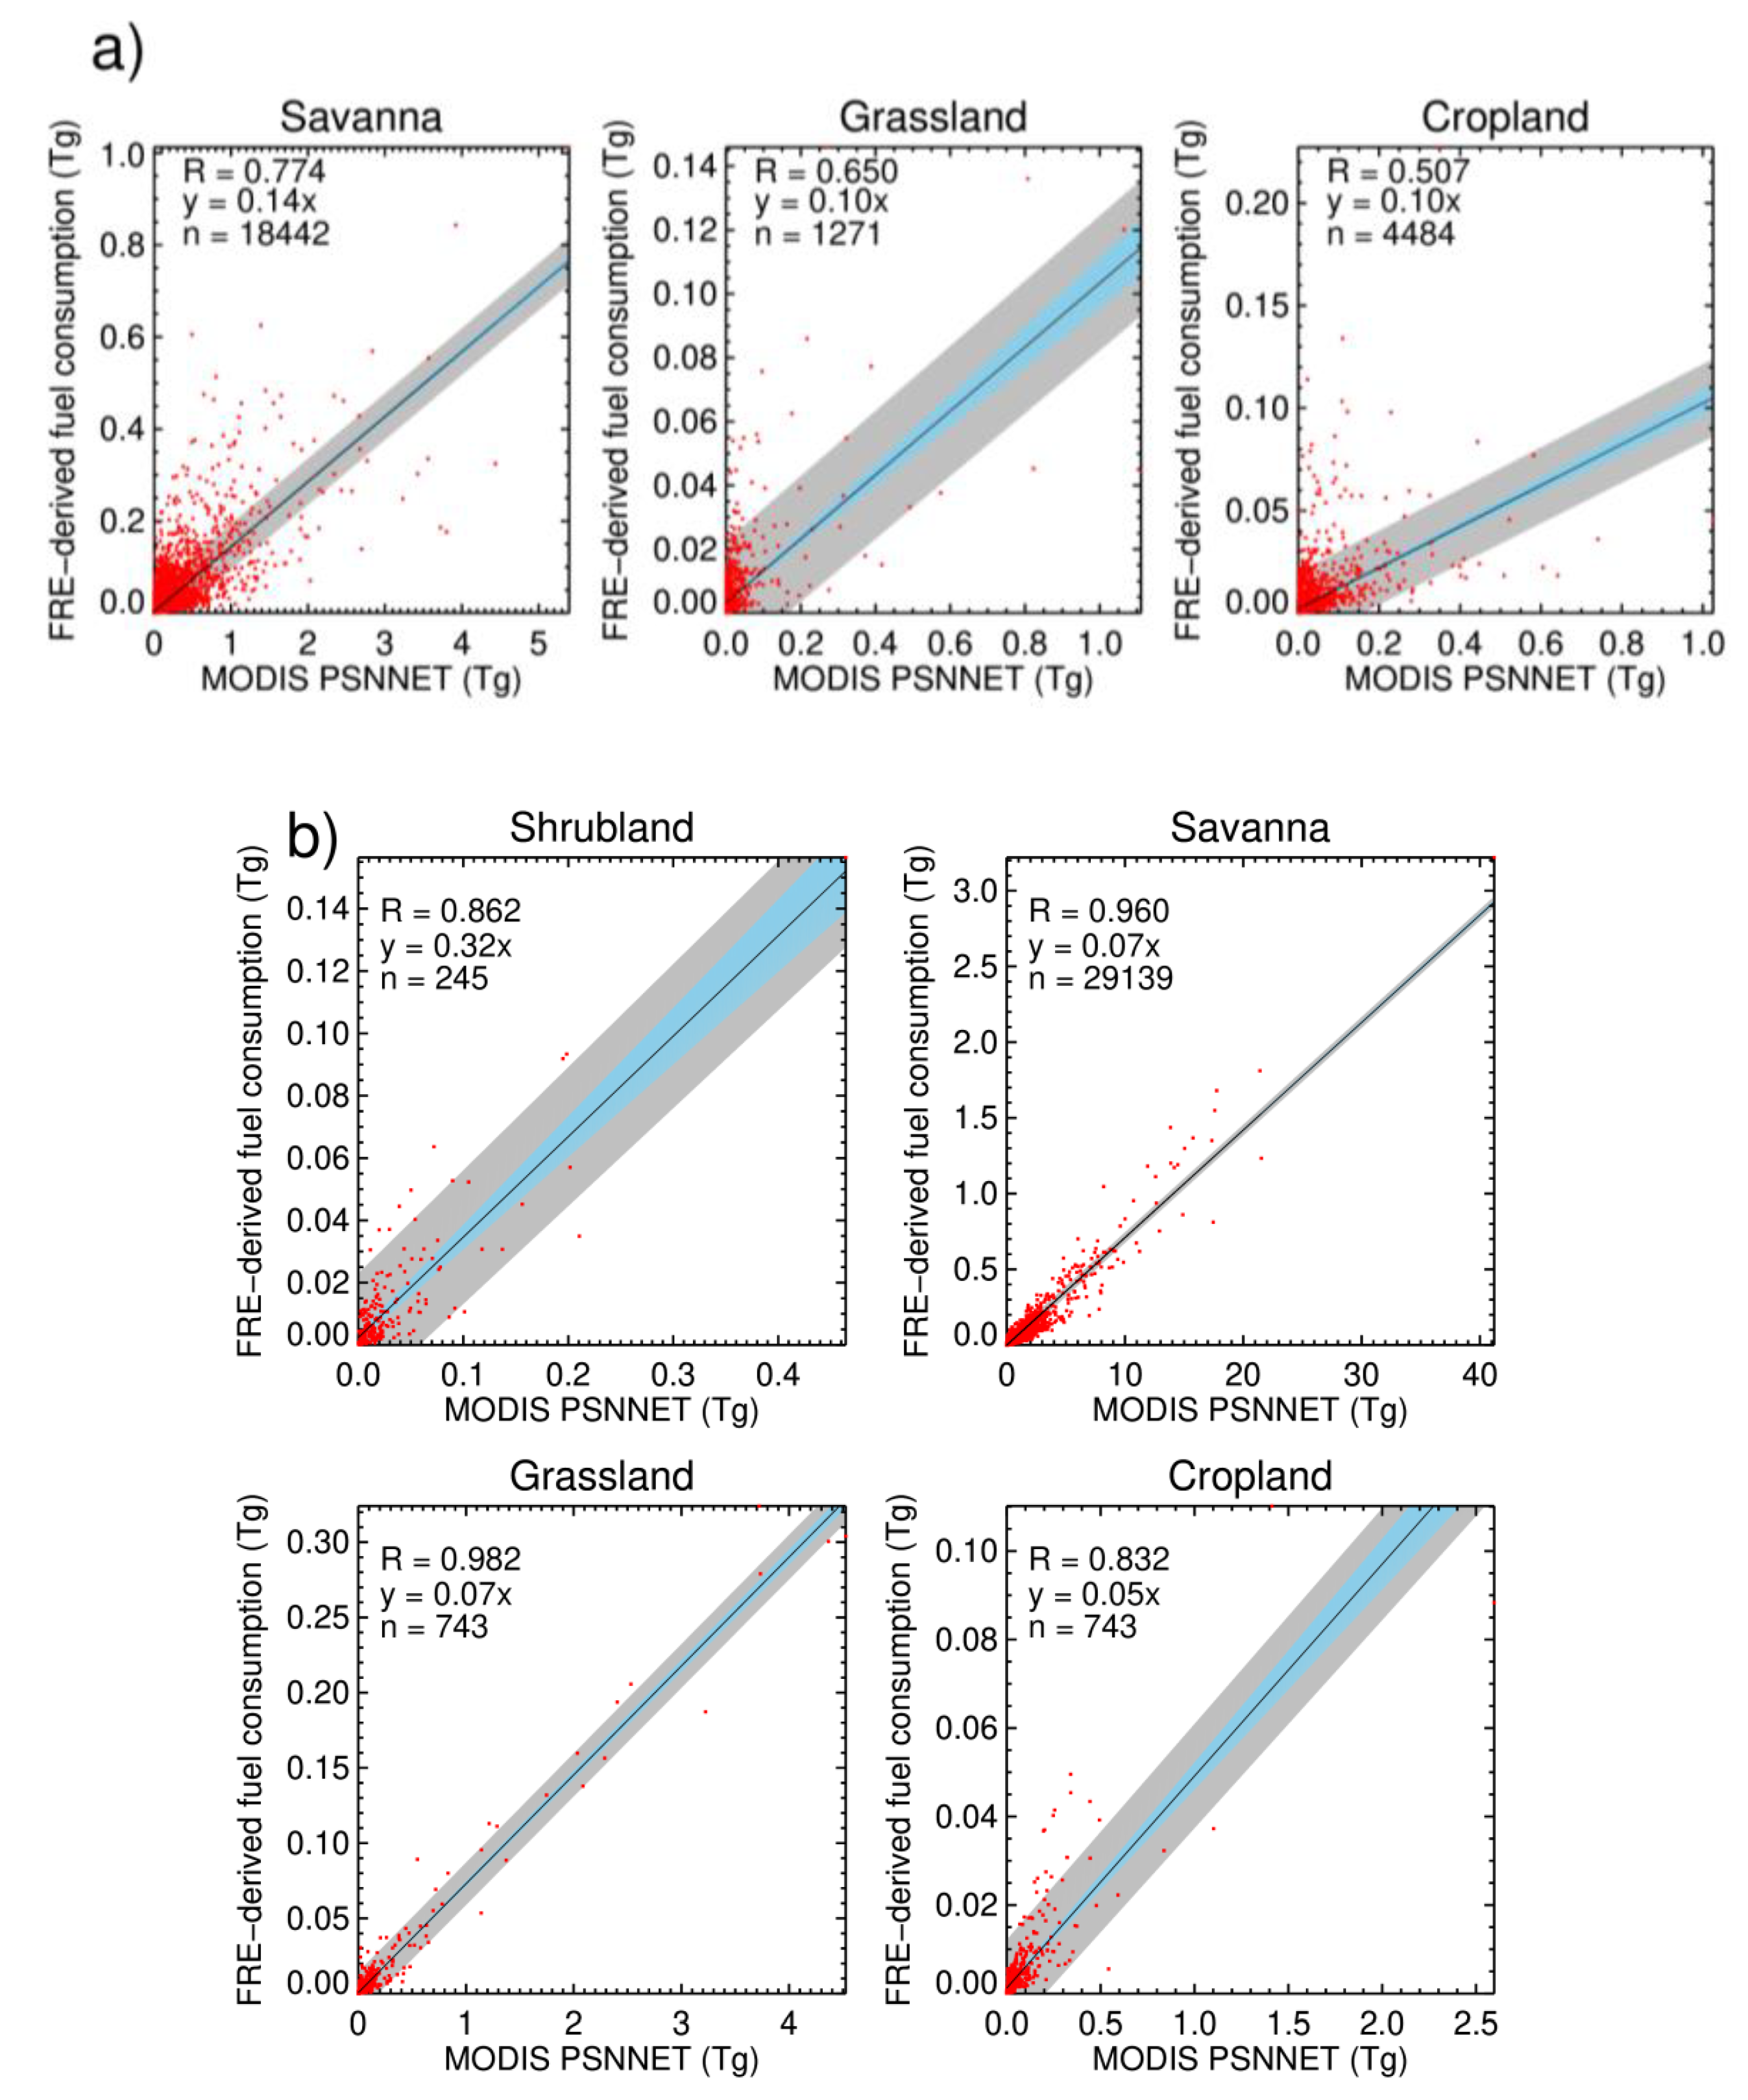
4.2. MOD17 Productivity Assessment

Prior to their use in fuel load estimation, an assessment of the MODIS productivity estimates (which include both growth and maintenance respiration terms) was carried out using the Copernicus dry matter productivity (DMP) product of reference [64] which is driven by Proba-V data and available from the Copernicus Global Land Service at 10-day temporal resolution and 1 km spatial resolution. Using three years of data (2013–2016), the productivity estimates were integrated over the MODIS burned areas (e.g., ‘fire clusters’) which burned in successive years, as described in Section 3. The results shown in Figure 3 indicate a stronger relationship between both datasets in southern hemisphere Africa (r = 0.96) than in the northern hemisphere (r = 0.8). A difference in magnitude is also evident between the MODIS and Copernicus products, with the former lower (albeit the latter does not account for below ground biomass or the costs associated with growth and maintenance respiration in woody tissue).
To assess the impact of these respiration terms, the average ratio between annual MODIS NPP and annually accumulated MODIS PSN was calculated and reveals that, over Africa, 88% of pixels have a NPP/PSN ratio between 0.7–0.8 and that 40% of the pixels have a value of 0.79. The annual NPP/PSN ratio is more variable in northern hemisphere Africa where lower ratios occur in the tropical forests of central and west Africa (0.68–0.75) and the parts of Sahel and CAR (<0.65). The basis for comparing FRE-derived fuel consumption estimates to MODIS PSN estimates, which includes maintenance respiration and growth respiration of woody material, rather than the Copernicus DMP estimates is that these data only cover 2013–present whilst a longer time-series is available from MODIS.

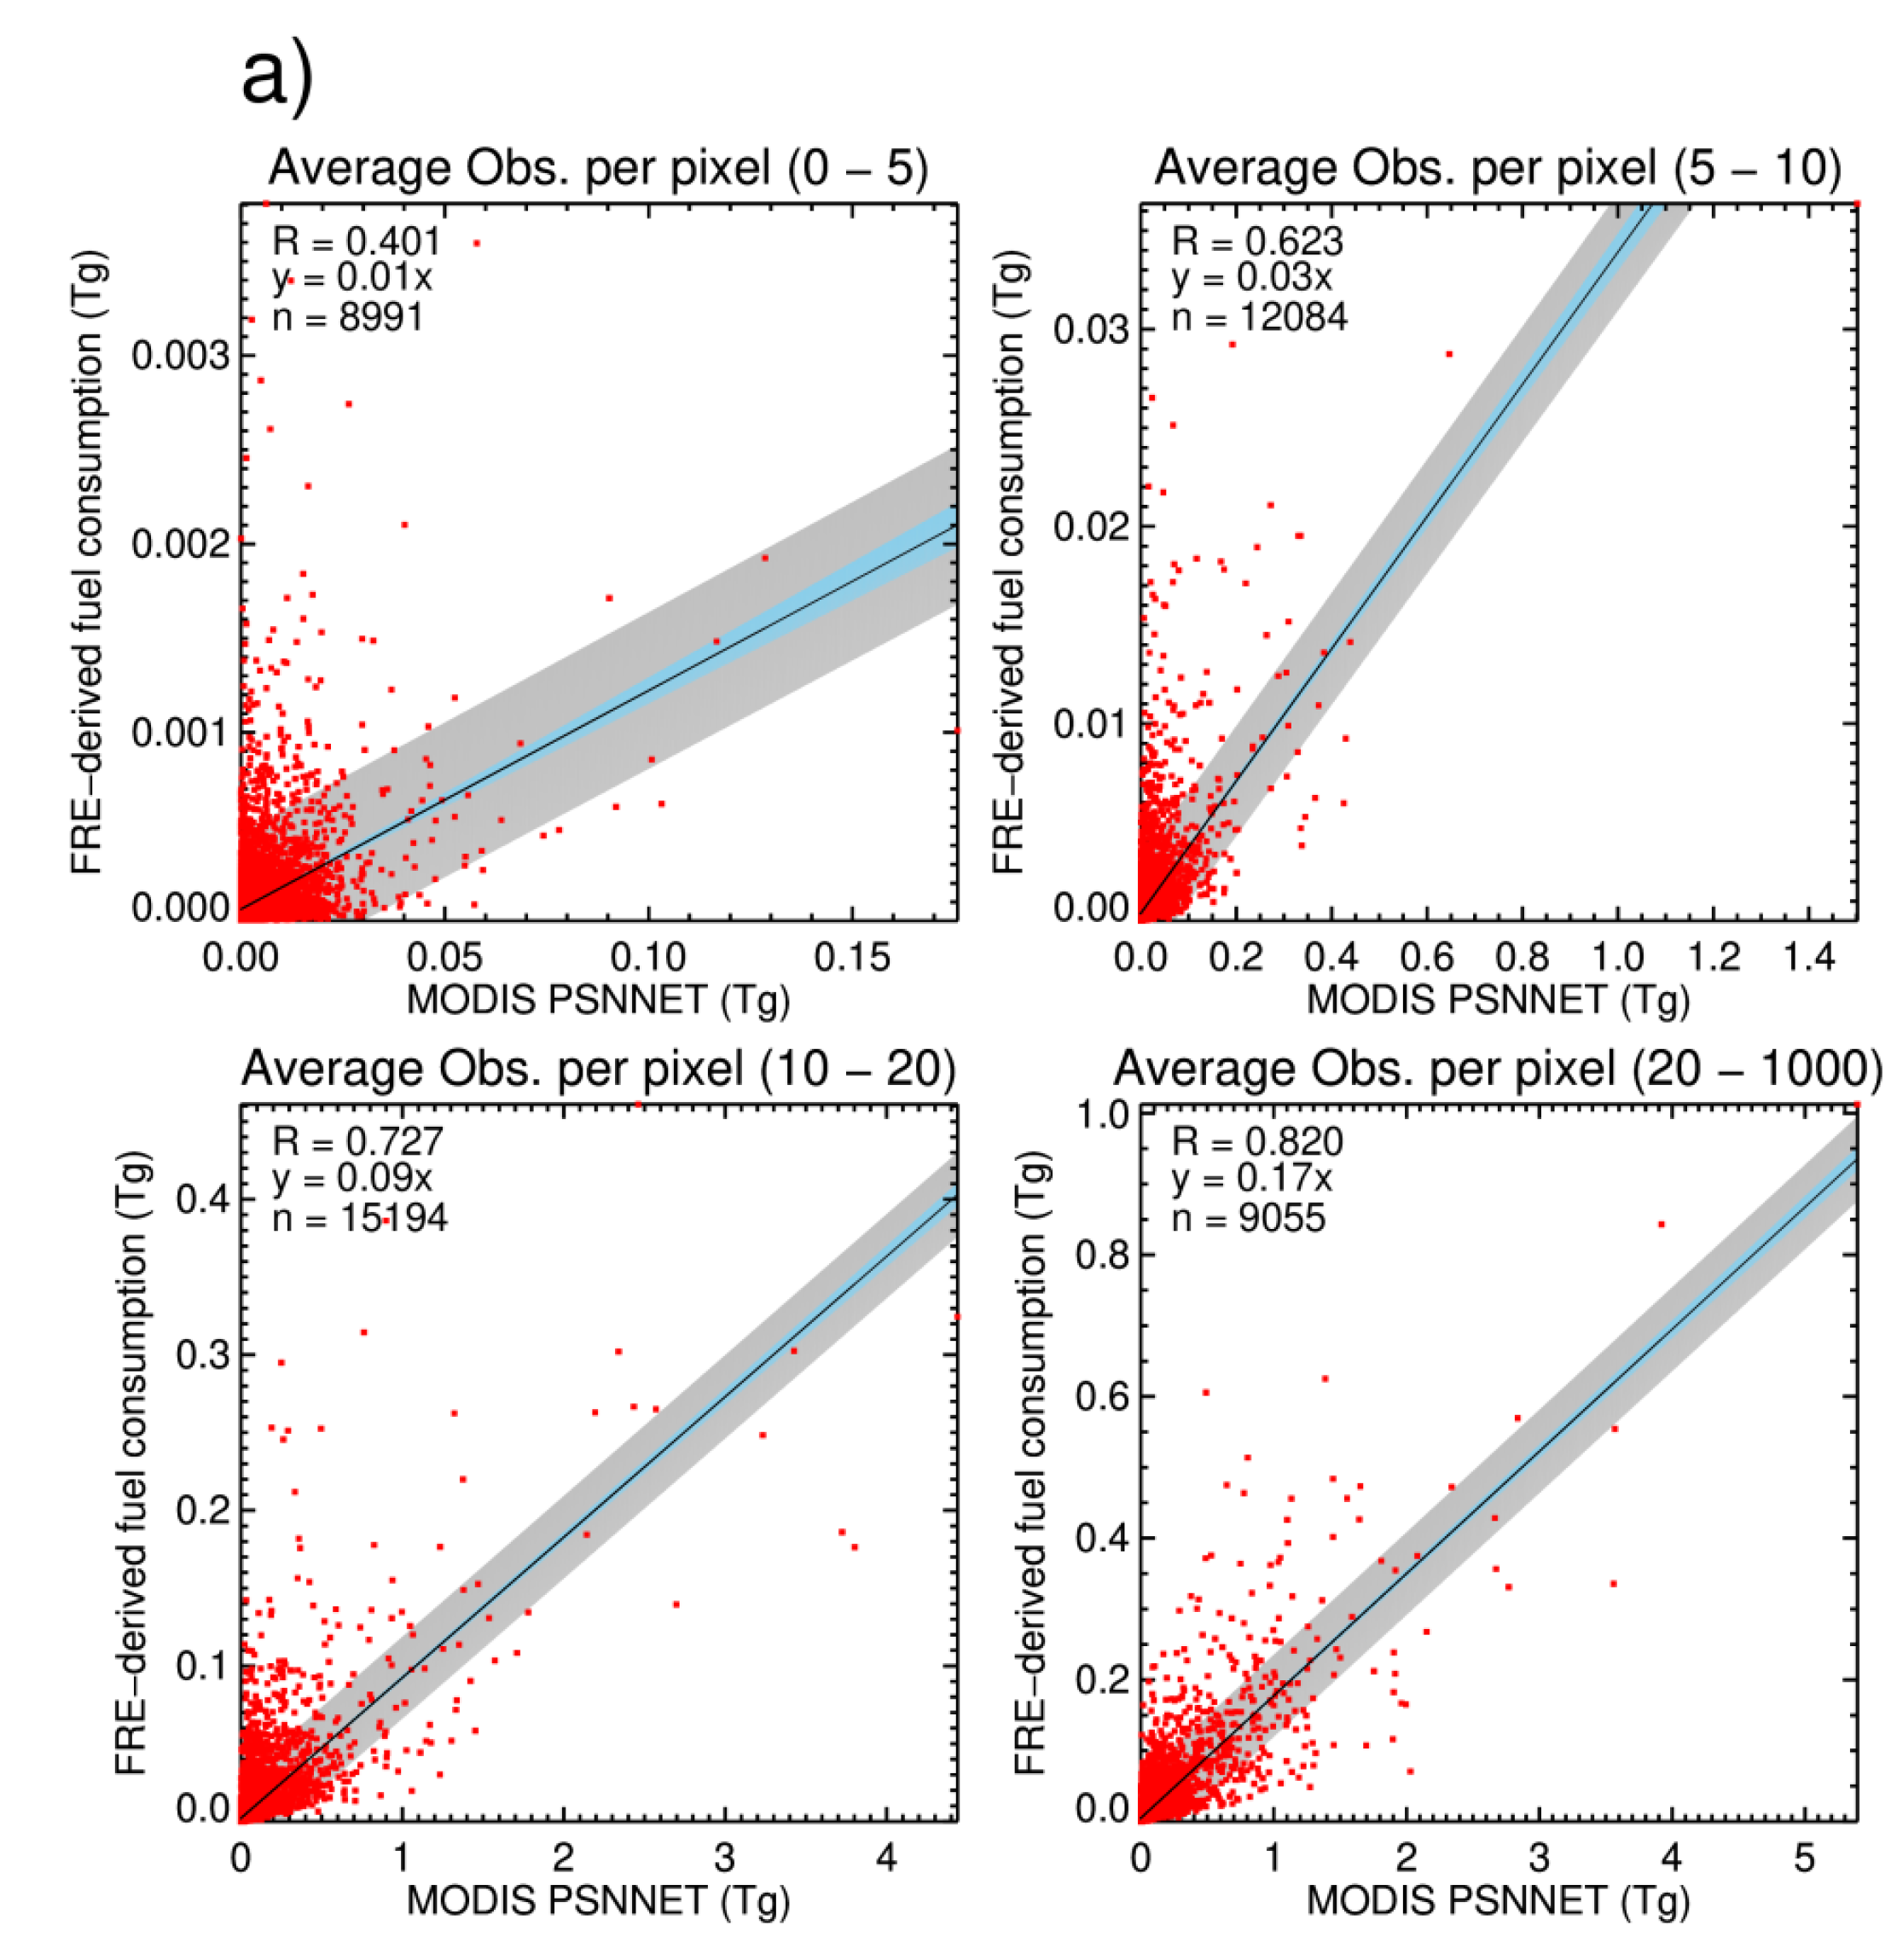
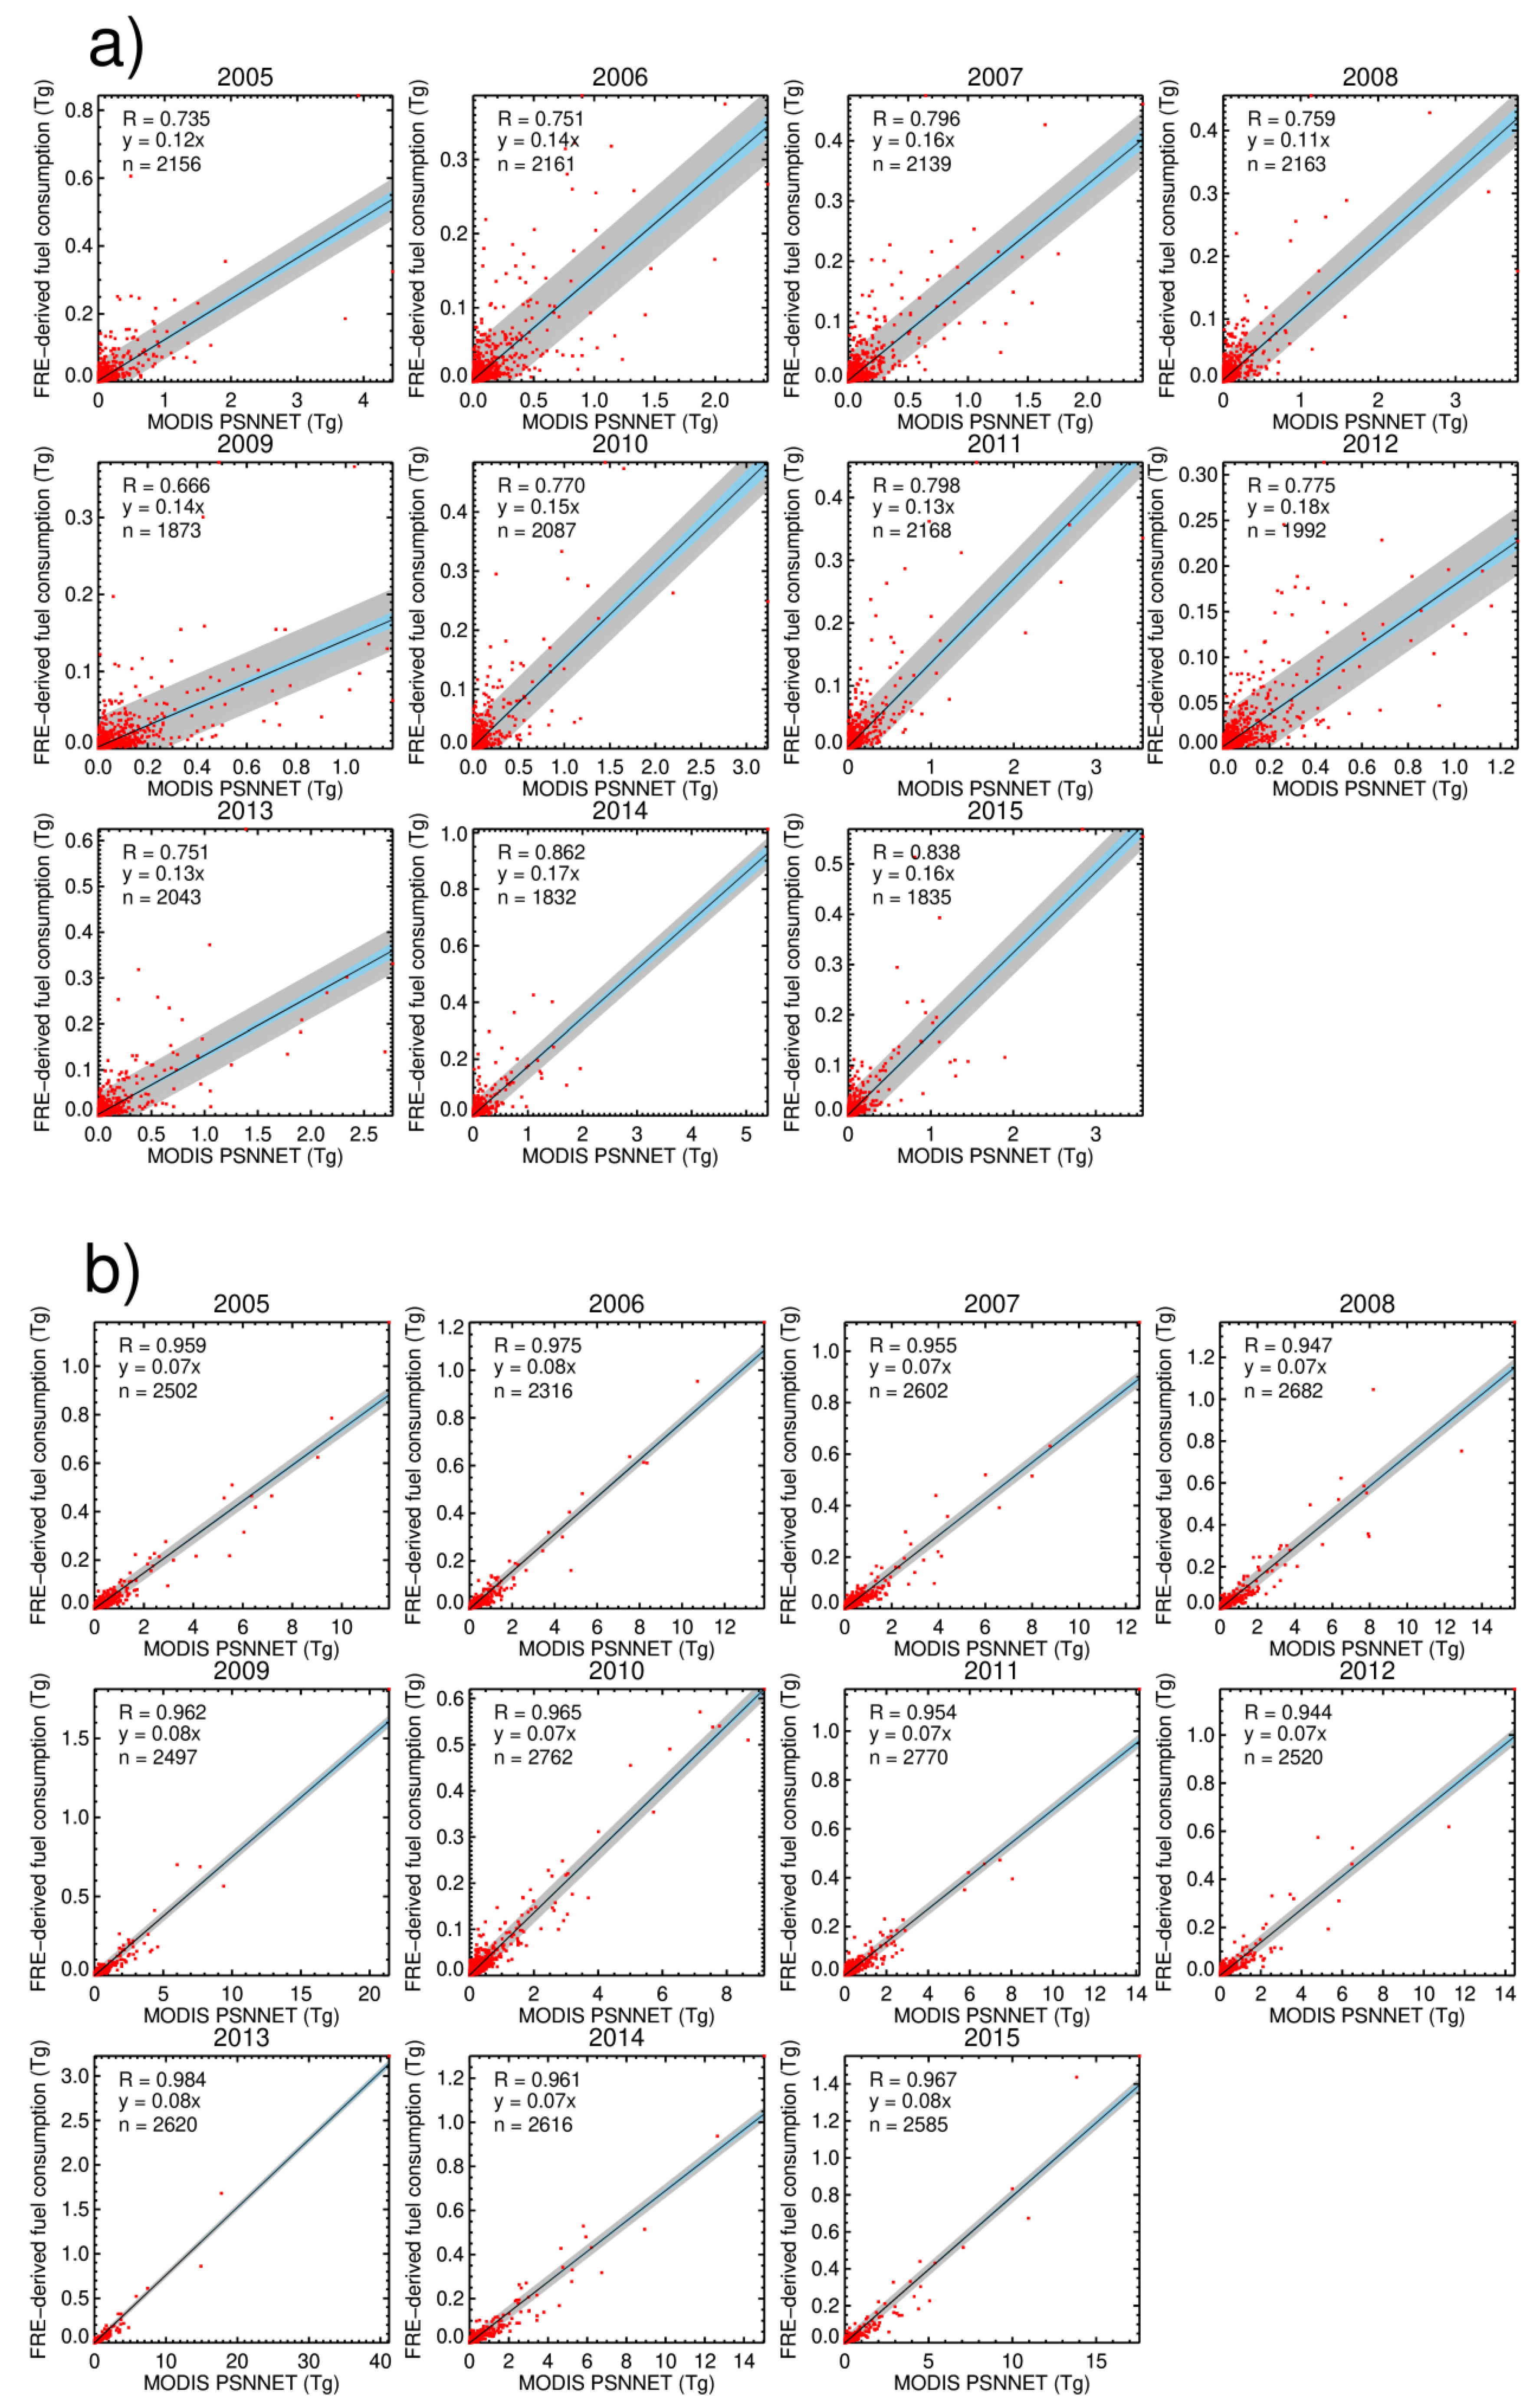
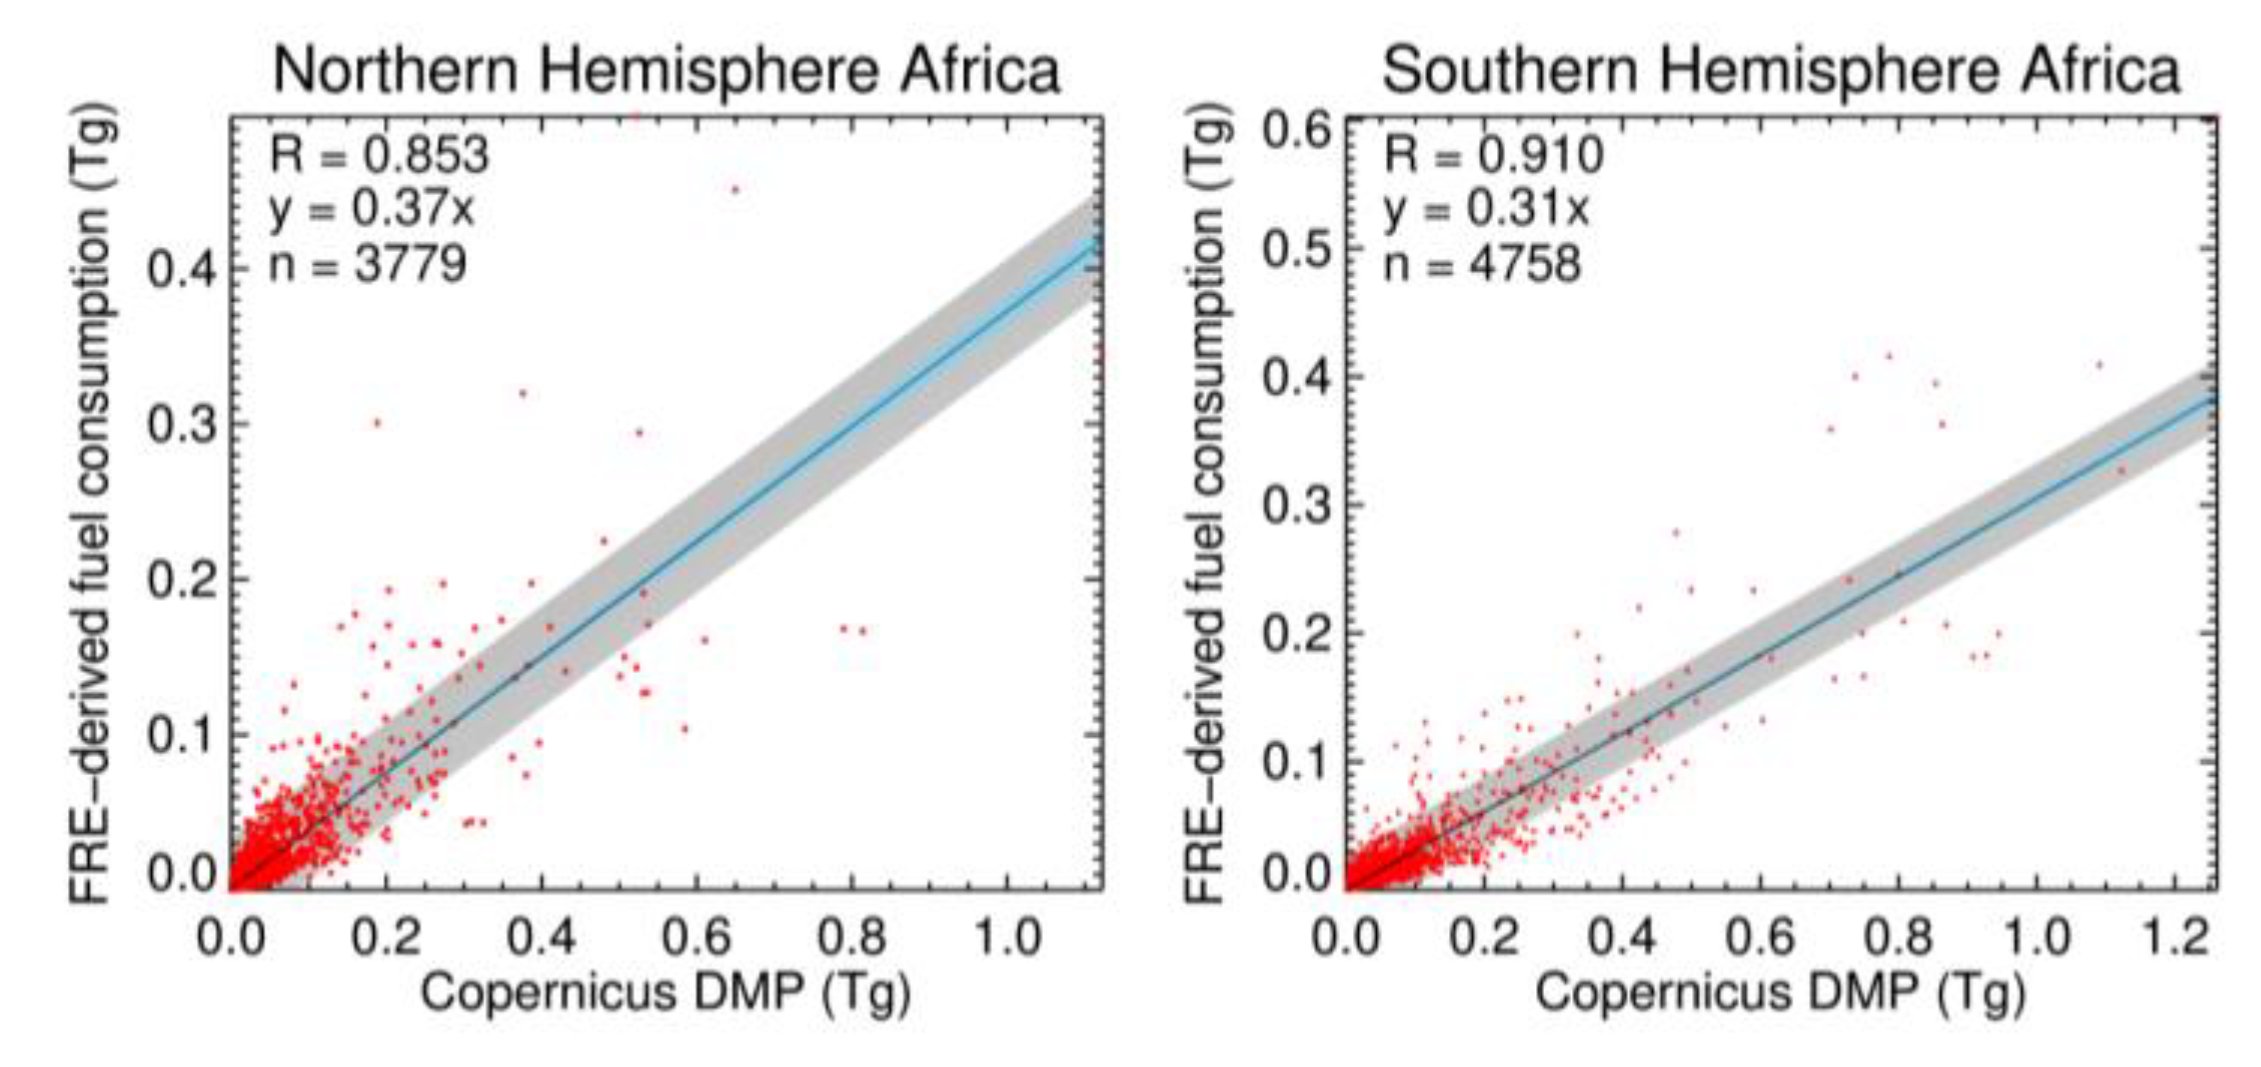
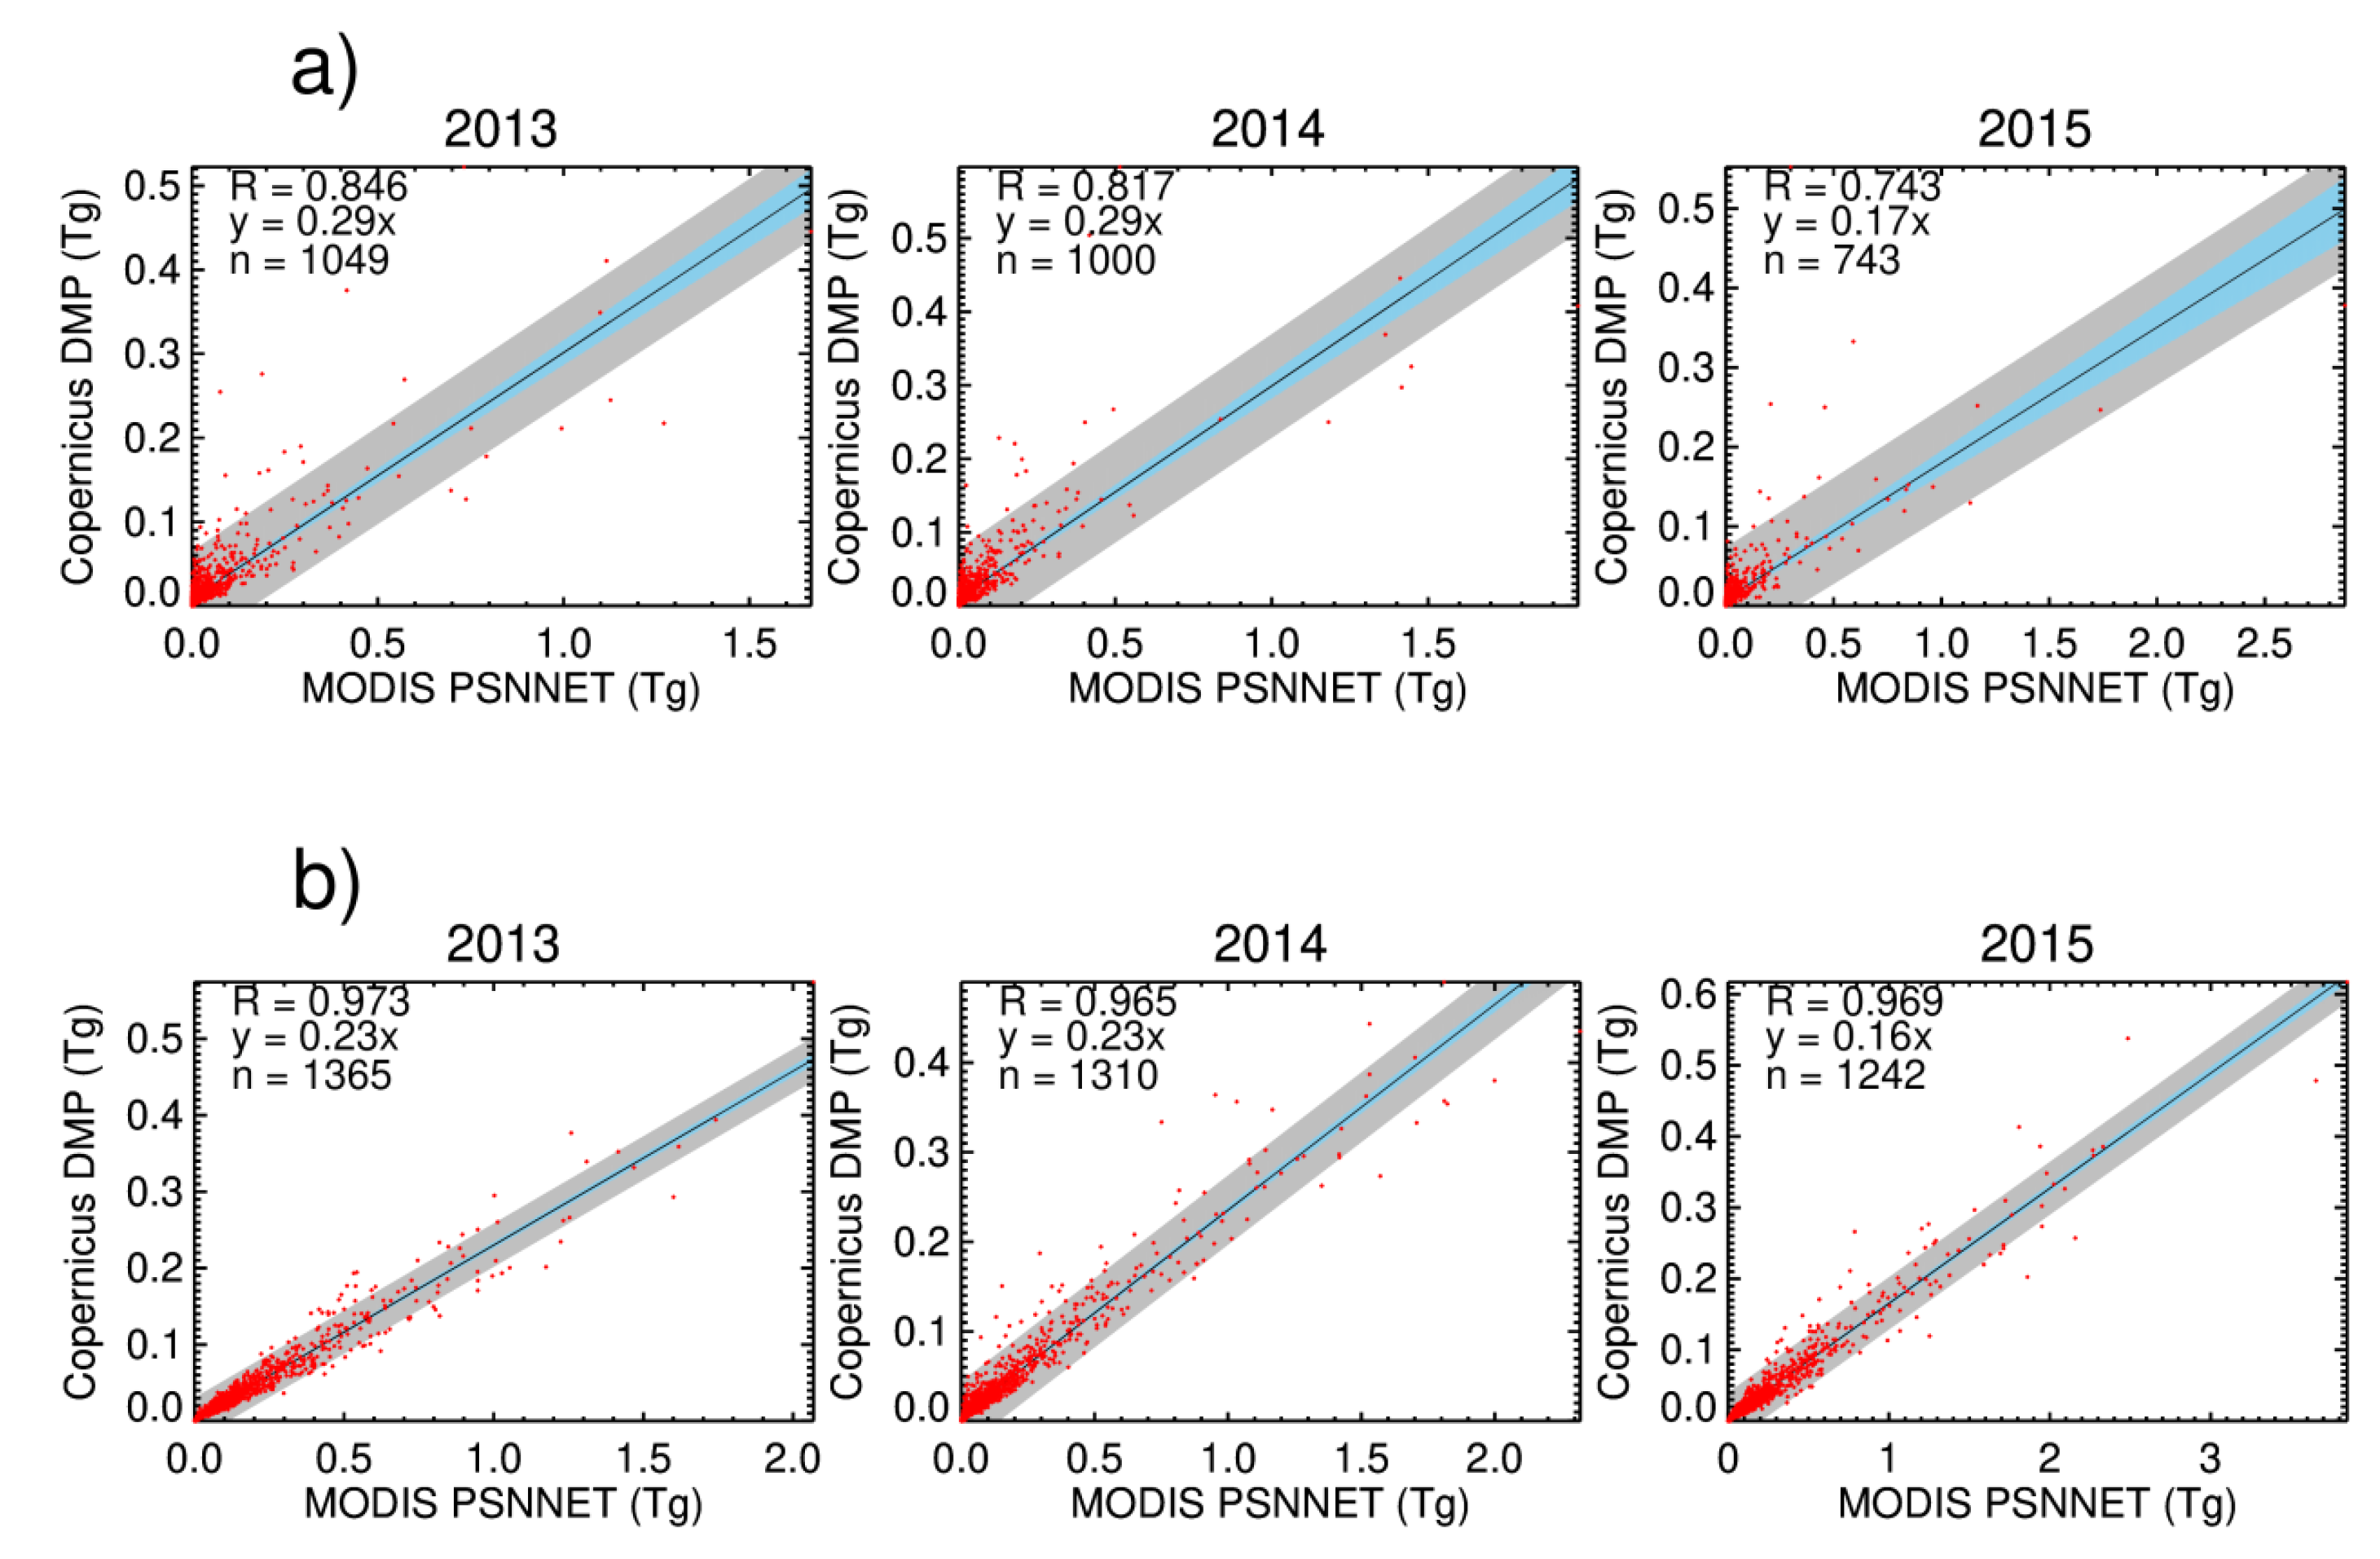
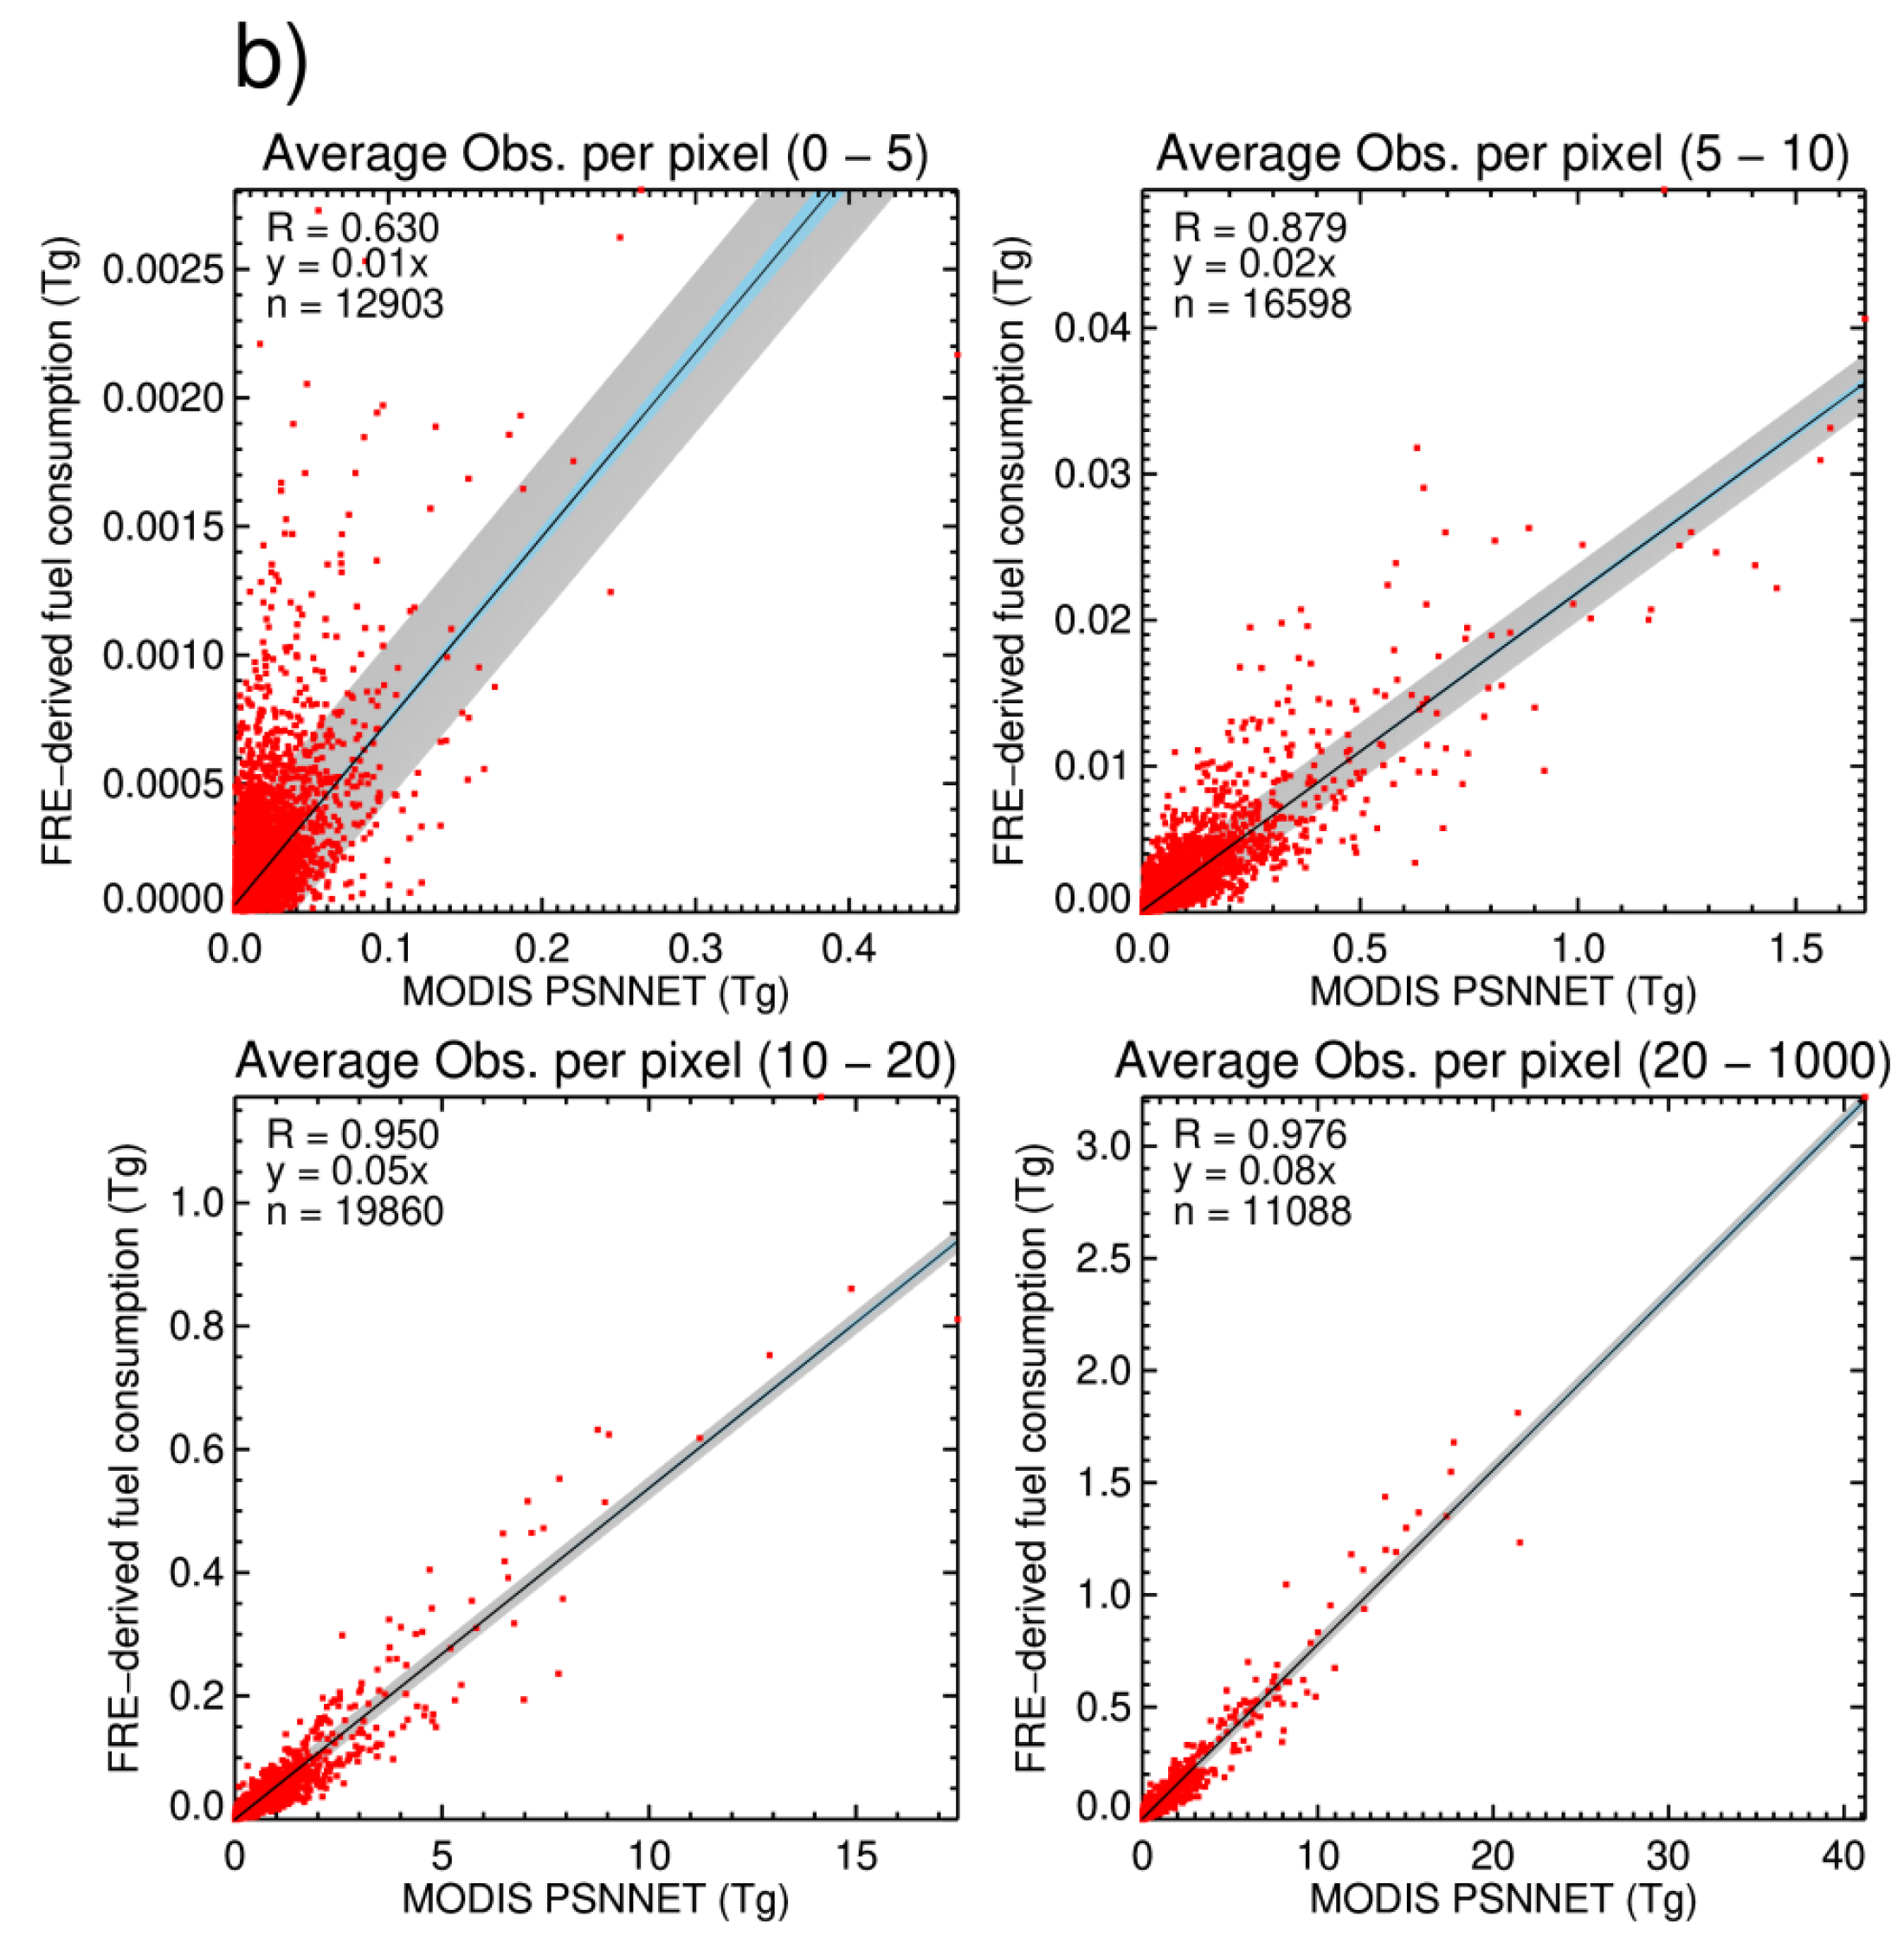
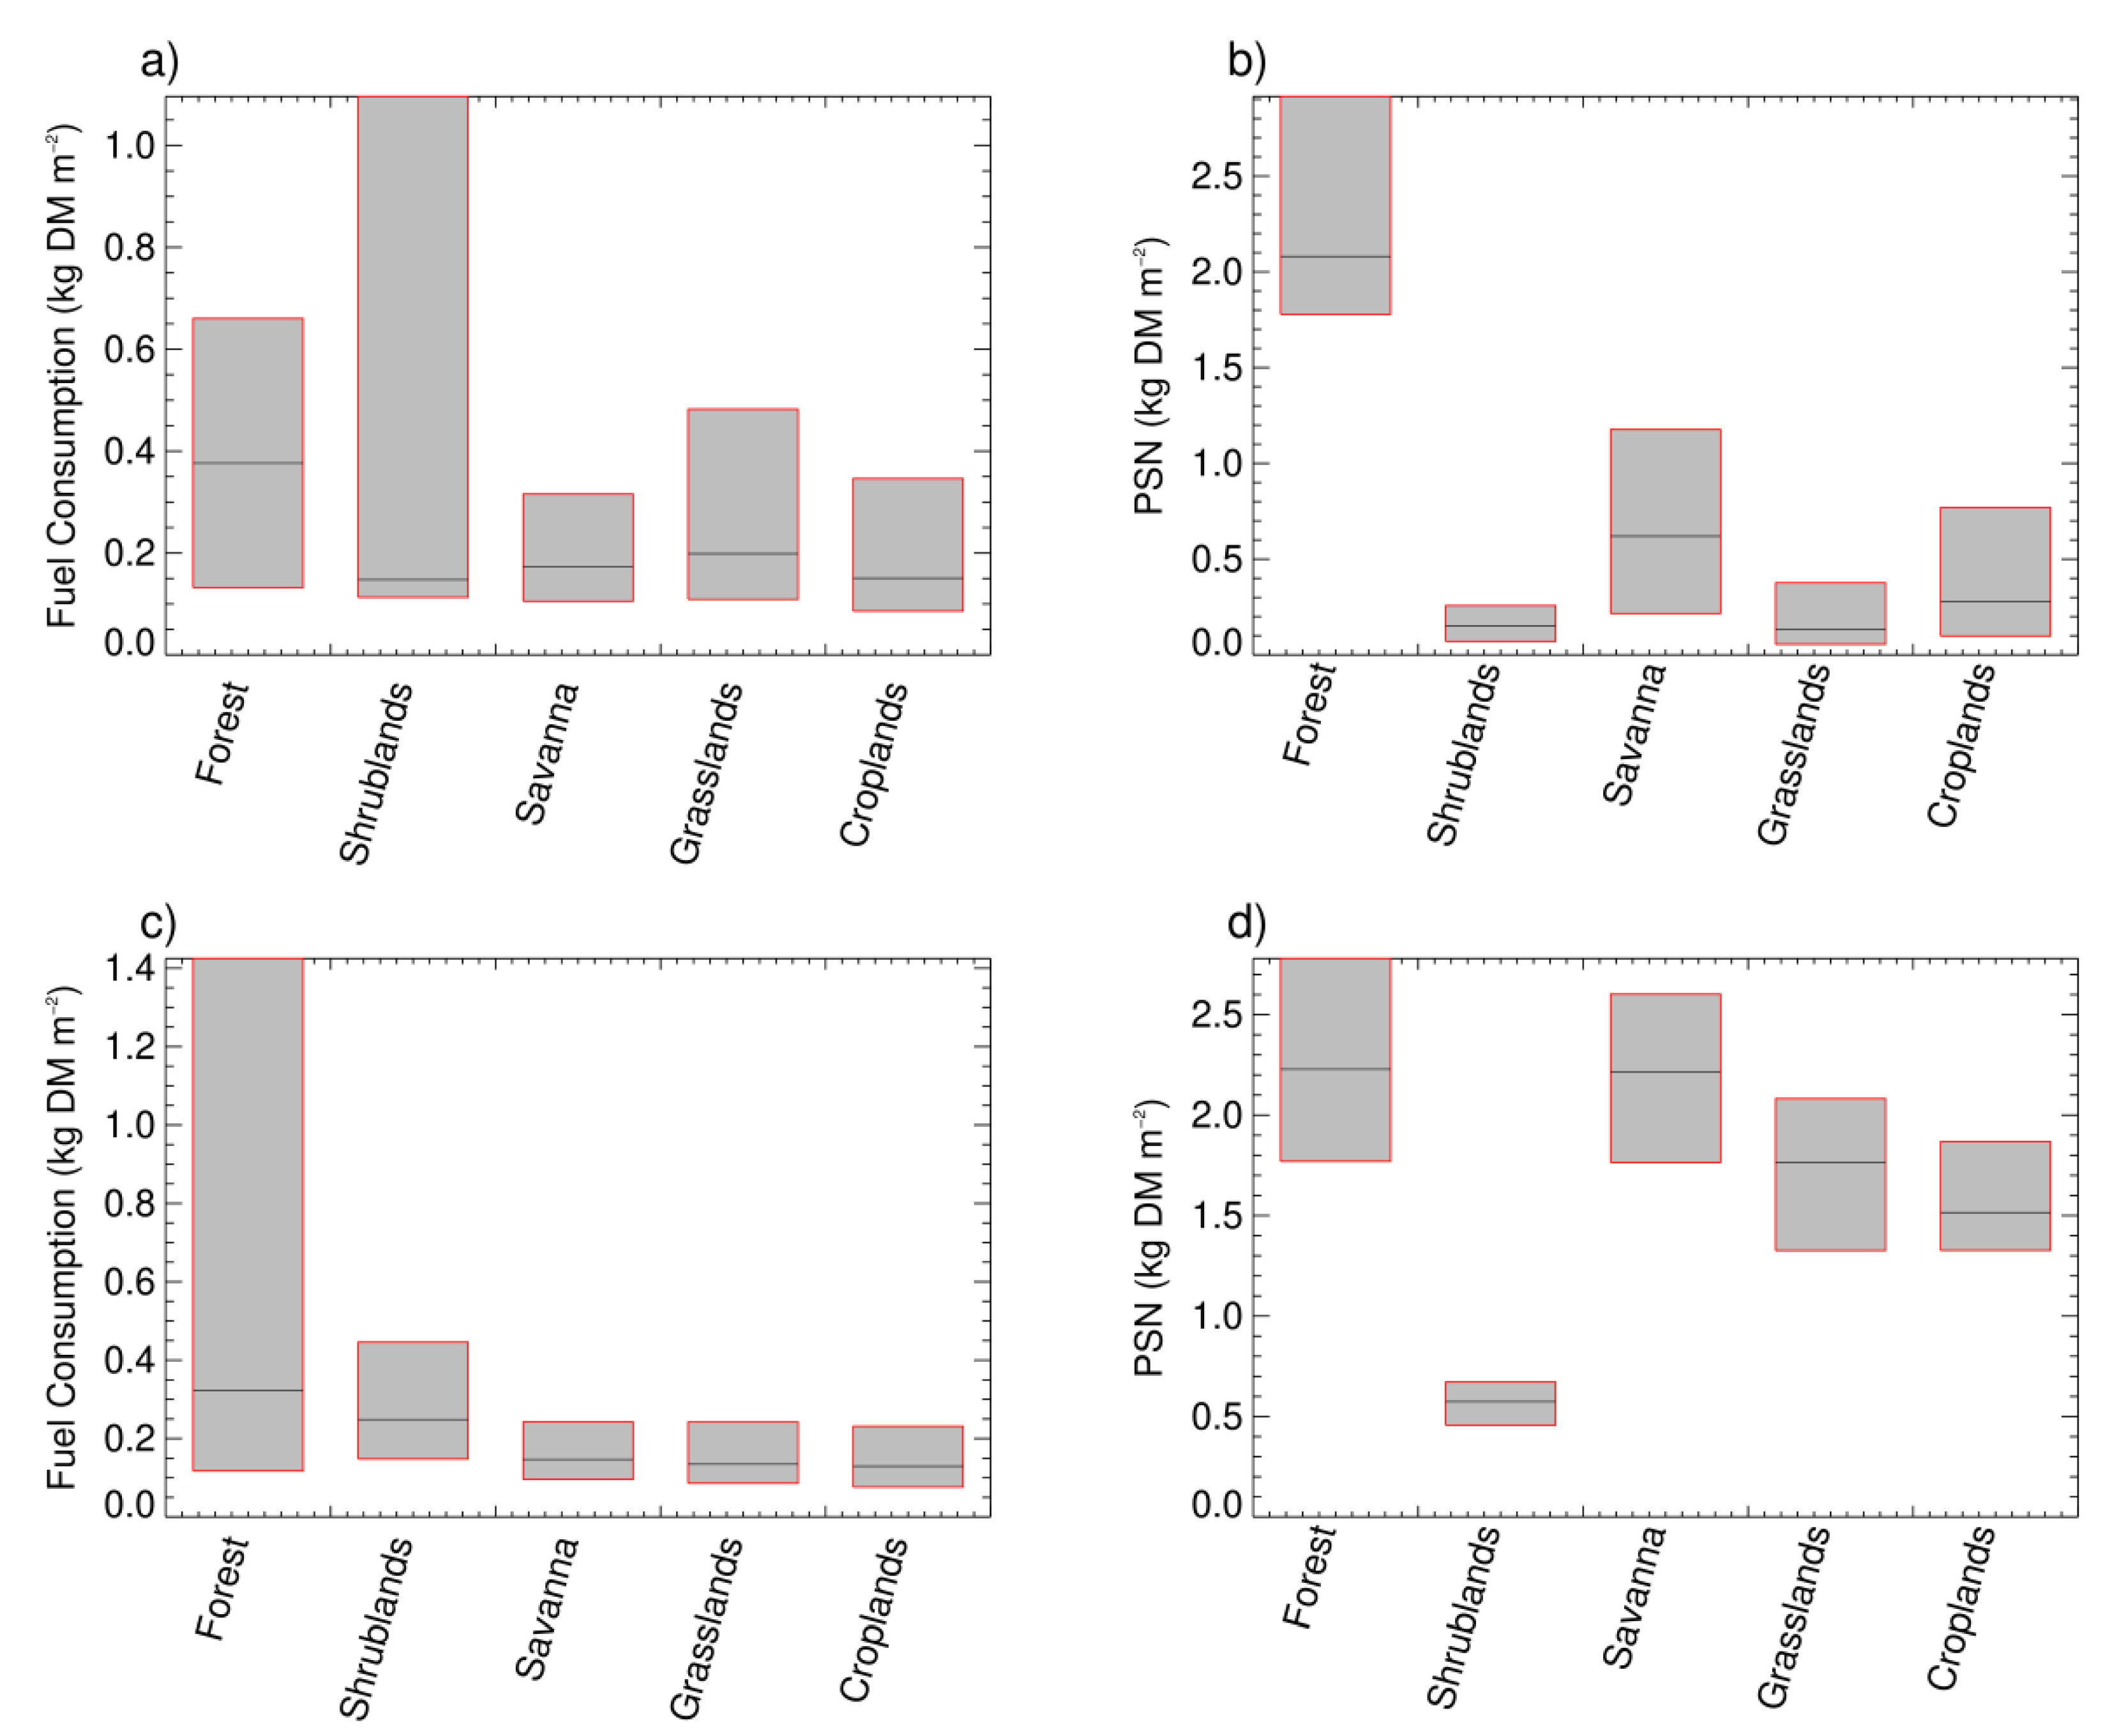
4.3. Comparison between FRE-Derived Fuel Consumption and MODIS Accumulated PSN and Copernicus Dry Matter Productivity (DMP)

Here we provide the first comprehensive assessment of the relationship between FRE-derived fuel consumption (Tg DM) and temporally integrated MODIS PSN productivity (Tg) and Copernicus DMP (Tg DM) estimates. MODIS PSN estimates (2004–2016) are used as a surrogate for NPP since the latter is only available on an annual basis, which is inconsistent with the seasonal dynamics of landscape fires. It is acknowledged that FRE-derived fuel consumption is not directly comparable to PSN, since the latter contains contributions from woody material maintenance, growth respiration and below ground biomass. Therefore, irrespective of variations in the combustion completeness, the temporally integrated PSN value should be greater than the FRE-derived fuel consumption estimates.
The focus was on areas whose burning encompassed twenty or more MCD64A1 MODIS 500 m burned area pixels, thus omitting the smaller fires which SEVIRI finds harder to identify [41,65]. The accumulated productivity estimates between the two years of burning were remapped into SEVIRI’s grid and the total available fuel per burned area ‘fire cluster’, or contiguous cluster of pixels, calculated using the burned area (m2) measurements (assuming 47% fuel carbon content; reference [66]). The matching FRE estimates were calculated via temporal integration of the SEVIRI FRP data between the first and last day the pixel was detected as being burned in the current year, with a 10-day buffer added to account for any offset between the burned area and active fire observations (e.g., due to cloud cover or differences in fire detectability using the burned area and active fire approaches; references [26,67,68]). FRE-derived fuel consumption for each fire cluster was then estimated using the conversion coefficient of 0.37 kg MJ−1 found by reference [20], which provided good relations between fuel availability and FRE-derived fuel consumption metrics in reference [39]. A timeseries of SEVIRI FRP retrievals and the mean MODIS PSN and GPP estimates from a single 57.7 km2 fire which burned in an area of woody savanna are shown in Figure 4 (a and b respectively). This fire affected an area of 18 discrete SEVIRI pixels over its lifetime (with a mean of 22 FRP observations per pixel), and the accumulated PSN and total fuel consumed over the 57.7 km2 burned area were calculated as 96,950 and 13,700 tonnes respectively. The FRE-derived fuel consumption per unit area is 0.23 kg DM m−2 which is somewhat lower than field measurements made in African savannas which ranges between 0.29–0.45 kg DM m−2 [36].
Active fire detection and FRP retrievals are influenced by a number of factors including sensor characteristics, obscuration due to cloud/smoke or an upper canopy, fire size, fuel moisture content and flame emissivity [59,69,70,71]. One approach to mitigate for certain of these issues is to focus analyses on “well-observed” active fire clusters. Using data between 2005 and 2016, Figure 5 illustrates the relationship between FRE-derived fuel consumption (Tg DM) and accumulated MODIS PSN (Tg) for fire clusters in the northern (Figure 5a) and southern (Figure 5b) African hemispheres as a function of the mean number of per-pixel SEVIRI FRP retrievals in each cluster. Clusters with, on average, fewer than 10 FRP retrievals per-pixel exhibit greater variability whilst fires observed with an average of >10 observations display a much stronger relationship. This is clear in the northern hemisphere which displays a weaker relationship and greater variability than found in the southern hemisphere. For the remainder of the analyses presented, only fire clusters where pixels are observed on average ≥10 times are retained, omitting 46% and 48% of the fire clusters in the northern and southern hemispheres respectively.
Figure 6 shows scatterplots between FRE-derived fuel consumption and integrated PSN in the northern and southern African hemispheres for the remaining fire clusters for each year (2005–2015). In the northern and southern hemispheres, the average annual number of fire clusters per year is 2040 and 2588 respectively. Overall, there is little interannual variation in terms of changes in the correlation and slope of the relation between FRE-derived fuel consumption and accumulated PSN. The relationship in the northern hemisphere is weak (mean r = 0.76) and the slope indicates that the FRE-derived fuel consumption estimates are between 11 and 18% of the accumulated PSN. Of 24,249 fire clusters that cover the full time-series, 99% of the clusters have a lower FRE-derived fuel consumption estimates, with an average relative difference of −73% (mode of 92%) and the average scatter (0.13 Tg), bias (−0.03 Tg) and RMSD (0.004 Tg) are also high. In contrast, a strong relationship is evident in the southern hemisphere (mean r = 0.96) with the fuel consumption being 7–8% of the accumulated PSN. Of 30,948 fire clusters, 99% have a lower fuel consumption estimate, with an average percentage difference of −88% (mode of −96%) and the average annual scatter (0.57 Tg), bias (−0.12 Tg) and RMSD (0.07 Tg) are also relatively high.
The FRE-derived fuel consumption and Copernicus DMP in northern and southern hemisphere Africa (Figure 7) also display a strong relationship although the fuel consumption is 37% (northern hemisphere) and 31% (southern hemisphere) of the accumulated DMP. Accounting for the difference in the ratio between MODIS NPP and MODIS PSN discussed in Section 4.2, which indicates PSN estimates were ≈21% greater than NPP over southern hemisphere Africa, suggests FRE-derived fuel consumption is between 29–31% of the primary productivity estimate. Roberts et al., [39] compared SEVIRI fuel consumption estimates with integrated SPOT VGT NPP estimates over 18 fires and found closer agreement (i.e., higher combustion completeness) than found here, albeit across a far smaller number of samples (and using NPP data derived from SPOT VGT using a process similar to that used for the Copernicus DMP product). This difference in primary production data may help to explain the difference in slope between the analysis conducted here and that of reference [39].
Unlike the comparison between accumulated MODIS PSN and SEVIRI FRE-derived fuel consumption (Figure 6a,b), where the correlation between the datasets differed in northern and southern hemisphere Africa, the relationship shown in Figure 7 is similar in both hemispheres. The comparison between the MODIS PSN and Copernicus DMP (Figure 3), also shows good agreement in the southern hemisphere but a weaker relationship in the northern hemisphere. Studies have found MOD17 productivity estimates to be underestimated in the Sahel region (e.g., references [52,72]) which may explain the closer agreement in magnitude between FRE-derived fuel consumption and the accumulated MODIS productivity in the northern hemisphere. Fensolt et al., [53] suggests the underestimation of MODIS productivity estimates may result from uncertainty in the parameterisation of the Biome specific lookup-table (BLUT). Sjostrom et al., [52] highlights the importance of meteorological input data (e.g., vapour pressure deficit and photosynthetic active radiation) on GPP estimation and found that replacing the National Center for Environmental Prediction Department of Energy (NCEP-DOE) reanalysis data with tower measured meteorological data improved the correlation between eddy covariance and MODIS GPP at sites in northern and southern hemisphere Africa. Northern hemisphere Africa has been subject to increased land cover change since 2001 [16] which may influence MODIS productivity estimates if this change is not adequately captured in the MOD17 algorithm. The similar ratio between FRE-derived and GFED v4 fuel consumption estimates in both hemispheres suggests there is little bias in the SEVIRI FRE data. Further assessment of MODIS productivity dataset over Africa is needed to elucidate the apparent differences observed between the northern and southern hemispheres.

Fuel Consumption Per Unit Area (m−2)

Despite the consistency in the relationship between the FRE-derived fuel consumption and accumulated PSN, it is clear that SEVIRI FRE-derived fuel consumption is underestimated. Here we assess the agreement between fuel consumption and productivity as a function of land cover type and fuel consumption per unit area (kg DM m−2). The land cover type for a given fire cluster is assigned on the basis of the dominant land cover within the fire cluster.
Figure 8 illustrates the relationship between FRE-derived fuel consumption and accumulated PSN for fire clusters in northern and southern hemisphere Africa for land cover types with >50 fire clusters. Similar to that shown in Figure 6, the correlation between fuel consumption and integrated PSN is strong in the southern hemisphere (the northern hemisphere delivers a weaker relationship), although there is also limited variation in the proportion of fuel consumed as a function of land cover type. Savanna, cropland and grassland are the dominant cover types in both hemispheres, and demonstrate similar slopes between FRE-derived fuel consumption (Tg DM) and MODIS PSN (Tg). This may result from grass and litter comprising the largest fraction of combusted fuel in African savanna fires, with relatively little of the woody material being consumed by comparison [73,74]. The fuel moisture content of these fine fuels is also typically low during the peak fire season, which leads to high (a mean of ≈0.93) combustion completeness [36,73,74,75].
The fire clusters in this analysis were selected on the basis that they burned in consecutive years, and this frequent fire occurrence may help explain the similarity in the relationship between fuel consumption and integrated PSN between land cover types. Savanna fuel loads, principally grasses, tend to be greater in areas where fires occur on a biennial or longer timescale due to fuel build up (e.g., in moribund and unpalatable grass), which is influenced by the fire return interval, precipitation patterns, productivity and grazing pressure [61]. Large areas of Africa burn frequently (Figure 9) and the majority (81%) of the pixels in the fire clusters used in this analysis burned every three years or fewer between 2005 and 2016. Differences in fire occurrence may lead to variations in fuel build up within each fire cluster, since the accumulated PSN only accounts for the contribution of productive vegetation through fPAR measurements. Variations in the build-up of senescent fuel are not represented, and could increase the variability between fuel consumption and accumulated PSN measures.
The similarity in the proportion of fuel consumed relative to the accumulated productivity as a function of land cover type is reflected in Figure 10, which presents the FRE-derived fuel consumption per unit area (kg DM m-2) and the integrated PSN (kg m-2) for northern (Figure 10a,b) and southern (Figure 10c,d) hemisphere Africa. The upper and lower bounds of the bars depict the 25th and 75th percentiles and the black line is the 50th percentile. As with many natural phenomena, the fuel consumption estimates are best described by a power law where the 25th percentile is close to the highest frequency.
The average fuel consumption estimates are approximately 0.1 and 0.2 kg DM m−2 at 25th and 50th percentiles respectively. Savanna, grassland and croplands show similar fuel consumption estimates, which lends support to the notion that herbaceous fuel is the primary material burned. In the southern hemisphere, the MODIS PSN estimates for forest, savanna and croplands are higher than the fuel consumption estimates at all percentile ranges, whilst shrublands and grasslands are lower in most cases. The FRE-derived fuel consumption estimates should be lower than the accumulated PSN since combustion completeness is rarely 100% and the PSN estimates contain contributions from woody respiration and maintenance and below ground biomass. The average accumulated PSN estimates are 1.32 and 1.65 (kg m−2) at 25th and 50th percentiles respectively and are greater than those of the northern hemisphere. The FRE-derived fuel consumption estimates for savanna, which is the dominant land cover type, is 89% and 70% lower at the 25th and 75th percentiles, respectively, which is close to the slope shown in Figure 8.
Fuel consumption per unit area estimates for dambo grassland (0.22–0.29 kg DM m−2), savanna (0.35 kg DM m−2) and miombo woodland (0.42–0.45 kg DM m−2) contained in references [27,74,76,77] are typically around twice those of the FRE-derived estimates. Despite constraining the fire clusters to those which are best observed (i.e., ≥10 observations on average per-pixel), the FRE-derived fuel consumption estimates appear underestimated. Roberts et al., [26] compared MODIS and SEVIRI FRE-derived fuel consumption estimates (g DM m−2) and found those from SEVIRI were around three times lower than those from spatially coincident ground measurements. Applying this adjustment to fire cluster fuel consumption estimates for savanna, grassland and cropland in southern hemisphere Africa increases it to 0.33 (kg DM m−2) at the 25th percentile. This is closer to the range of fuel consumption estimates found in African grassland savanna (0.21–0.65 kg DM m−2) and woody savanna (0.29–0.73 kg DM m−2; reference [36]), though the slope characterising the relationship between FRE-derived fuel consumption and accumulated PSN for fire clusters in southern hemisphere Africa in savanna, grassland and cropland remains far below unity (at 0.23, 0.23 and 0.15 respectively).
A number of factors contribute to the underestimation of FRE-derived fuel consumption including FRP retrieval, fire detection bias and fuel characteristics. SEVIRI FRP has been compared to spatially and temporally coincident MODIS FRP for fire clusters >50 MW where over half (57%) were within 20% of the corresponding MODIS FRP [42]. However, whilst good agreement is found on sufficiently intense fires, SEVIRI underestimates fire activity over a wider area due to the omission of small and/or low intensity fire which fall below its detection limit [41,42], or are omitted due to cloud mask over efficiency for example [69]. Sensor imaging characteristics can also impact the retrieved FRP. For example, the point spread function (PSF) distributes fire emitted radiance into neighbouring pixels, and may result in these not being detected or falling outside of the MODIS burned area [78,79]. Vegetation structure can also reduce the retrieved FRP through preventing the detection of actively burning pixels [65,69] and intercepting the fire emitted radiance from fires beneath an upper canopy [34]. Fuel moisture content also has an impact since energy is lost to vapourisation which reduces the potential for combustion and, should combustion occur, the retrieved FRP [59,80]. In this study, the majority of the fires were detected in the dry season, and account for 91% and 88% of all fire clusters in the northern and southern hemisphere respectively. The fuel moisture content of herbaceous fuels is typically low in the dry season but does vary over time and with the proportion of green grass. These factors are typically at a minimum at the peak of the dry season [73,81]. Recent studies have also found different FRE to fuel consumption coefficient values to that found by reference [20] which could be caused by differences in sensor characteristics, fuel moisture, fuel type and fire size [35,79,82,83,84].

5. Conclusions

This study has used a variety of remotely sensed datasets to investigate the spatial and temporal variations in fire activity and fuel consumption across sub-Saharan Africa, focusing on years between 2004 and 2016. For the first time, an extensive comparison between FRE-derived fuel consumption and temporally integrated MODIS productivity data (PSN) on a fire cluster basis has been conducted, and it has indicated strong correlations between the two in the southern hemisphere. This is encouraging given the very different methods used to characterise fuel load and fuel consumption. The agreement in the southern hemisphere (r >= 0.9) is stronger than that found in the northern hemisphere (r > 0.66) and is consistent on an annual basis, but it is clear that the FRE-derived fuel consumptions are underestimated.
Annual SEVIRI FRE-derived fuel consumption estimates are consistently far lower than those from GFED when the standard 0.37 MJ kg−1 conversion factor is used. However, the annual dynamics of FRE and GFED burned area do show similar trends over time. The data used in this study indicates that FRE-derived annual fuel consumption has decreased in both northern (mean of −4.3 Tg/year) and southern (mean of −0.57 Tg/year) hemisphere Africa across the 2004–2016 period. However, analysis of the monthly dynamics reveals that large shifts in fuel consumption of 20–50% can occur even during the peak biomass burning season, and that temporal trends are stronger outside the fire season albeit much lower in magnitude. The latter may have implications for emissions mitigation schemes that employ early season burning to reduce fire impacts on the environment.
Further research is needed to reconcile differences found in the relationship between FRE and fuel consumption. A key difficulty in fire emissions estimation concerns validation and, to date, there have been limited opportunities to do so. The RxCADRE field campaign [85] validated ground, airborne and spaceborne FRP retrievals but, despite incorporating 10 prescribed fires, concluded that a greater number of experiments were required to adequately assess FRP retrievals made from different platforms. Validation of fuel consumption is equally challenging due to the logistics involved in measuring fuel load and fuel consumption. Surface measurements of fuel consumption per unit area (kg DM m−2) are useful but may not fully capture the heterogeneity of fuel distribution and consumption, whilst estimating this metric using satellite data requires integrating different data products which each introduce their own uncertainties. Xu et al., [86] highlights the benefits that the improved temporal and spatial resolution of the next generation of geostationary sensors (e.g., the Advanced Himawari Imager, AHI) will bring with regards to fire characterisation. The Meteosat Third Generation (MTG) series of satellites, proposed for launch in 2021, will provide enhanced capabilities over Africa, and thereby further improve FRE-derived fuel combustion estimates.

Author Contributions

G.R. designed and performed the experiments. G.R., W.X. and J.H. processed the data. The manuscript was written and prepared by G.R., M.J.W., W.X. and J.H.

Funding

This research was funded by NERC via grants NE/M017958/1 and NE/M017729/1 and NERC’s National Centre for Earth Observation (NCEO).

Acknowledgments

The MODIS primary productivity (MOD17), burned area (MCD64) and land cover (MCD12) data were obtained through the NASA Reverb service (http://reverb.echo.nasa.gov/reverb/). The LSA-SAF FRP-PIXEL data were provided by the EUMETSAT Land Surface Analysis Satellite Application Facility (LSA SAF; http://landsaf.ipma.pt/). The Copernic Dry Matter Productivity data were made available via the Copernicus Global Land Service (http://land.copernicus.vgt.vito.be). We would like to thank the reviewers for their constructive comments which helped improve this manuscript. Funding for parts of this research was provided by NERC grants (NE/M017958/1 and NE/M017729/1) and NERC’s National Centre for Earth Observation (NCEO).

Conflicts of Interest

The authors declare no conflict of interest.

References

  1. Bowman, D.M.J.S.; Balch, J.K.; Artaxo, P.; Bond, W.J.; Carlson, J.M.; Chcorane, M.A.; D’Antonio, C.A.; DeFries, R.R.; Doyle, J.C.; Harrison, S.P.; et al. Fire in the Earth System. Science 2009, 234, 481–484. [Google Scholar] [CrossRef] [PubMed]
  2. Arora, A.K.; Boer, G.J. Fire as an interactive component of dynamics vegetation models. J. Geophys. Res. 2005, 110, G02008. [Google Scholar] [CrossRef]
  3. Hao, W.M.; Ward, D.E.; Olbu, G.; Baker, S.P. Emissions of CO2, CO and hydrocarbons from fires in diverse African savanna ecosystems. J. Geophys. Res. 1996, 101, 23577–23584. [Google Scholar] [CrossRef]
  4. Gatebe, C.K.; Ichoku, C.M.; Poudyal, R.; Roman, M.O.; Wilcox, E. Surface albedo darkening from wildfires in northern sub-Saharan Africa. Environ. Res. Lett. 2014, 9, 6. [Google Scholar] [CrossRef]
  5. Van der Werf, G.R.; Randerson, J.T.; Giglio, L.; Collatz, G.J.; Mu, M.; Kasib-hatla, P.S.; Morton, D.C.; DeFries, R.S.; Jin, Y.; van Leeuwen, T.T. Global fire emissions and the contribution of deforestation, savanna, forest, agricultural, and peat fires (1997–2009). Atmos. Chem. Phys. 2010, 10, 11707–11735. [Google Scholar] [CrossRef] [Green Version]
  6. Valentini, R.; Arneth, A.; Bombelli, A.; Castaldi, S.; Cazzolla Gatti, R.; Chevallier, F.; Ciais, P.; Grieco, E.; Hartmann, J.; Henry, M.; et al. A full greenhouse gases budget of Africa: Synthesis, uncertainties, and vulnerabilities. Biogeosciences 2014, 11, 381–407. [Google Scholar] [CrossRef] [Green Version]
  7. Williams, C.A.; Hanan, N.P.; Neff, J.C.; Scholes, R.J.; Berry, R.J.; Denning, A.S.; Baker, D.F. Africa and the global carbon cycle. Carbon Balance Manag. 2007, 2, 1–13. [Google Scholar] [CrossRef] [PubMed]
  8. Cais, P.; Piau, S.-L.; Cadule, P.; Friedlingstein, P.; Chedin, A. Variability and recent trends in the African carbon balance. Biogeosciences 2009, 5, 3497–3532. [Google Scholar] [CrossRef]
  9. Giglio, L.; Descloitres, J.; Justice, C.O.; Kaufman, Y.J. An enhanced contextural fire detection algorithm for MODIS. Remote Sens. Environ. 2003, 87, 273–282. [Google Scholar] [CrossRef]
  10. Giglio, L.; Schroeder, W.; Justice, C.O. The collection 6 MODIS active fire detection algorithm and fire products. Remote Sens. Environ. 2016, 178, 31–41. [Google Scholar] [CrossRef] [PubMed]
  11. Csiszar, I.; Schroeder, W.; Giglio, L.; Ellicott, E.; Vadrevu, K.P.; Justice, C.O.; Wind, B. Active fires from Suomi NPP Visible Infrared Imaging Radiometer Suite: Product status and fire evaluation results. J. Geophys. Res. Atmos. 2014, 119, 803–816. [Google Scholar] [CrossRef]
  12. Roy, D.P.; Jin, Y.; Lewis, P.E.; Justice, C.O. Prototyping a global algorithm for systematic fire-affected area mapping using MODIS time series data. Remote Sens. Environ. 2005, 97, 137–162. [Google Scholar] [CrossRef]
  13. Van der Werf, G.R.; Randerson, J.T.; Giglio, L.; Collatz, G.J.; Kasibhatla, P.S.; Arellano, A.F., Jr. Interannual variability of global biomass burning emissions from 1997–2004. Atmos. Chem. Phys. 2006, 6, 3423–3441. [Google Scholar] [CrossRef] [Green Version]
  14. Van der Werf, G.R.; Randerson, J.T.; Giglio, L.; van Leeuwen, T.T.; Chen, Y.; Roger, B.M.; Mu, M.; van Marle, M.J.E.; Morton, D.C.; Collatz, G.J.; et al. Global fire emissions estimates during 1997–2015. Earth Sci. Data Discuss. 2017, 9, 697–720. [Google Scholar] [CrossRef]
  15. Giglio, L.; Randerson, J.T.; van der Werf, G.R. Kasibhatla Analysis of daily, monthly and annual burned area using the fourth-generation global fire emissions database (GFED4). J. Geophys. Res. Biogeosci. 2013, 118, 317–328. [Google Scholar] [CrossRef]
  16. Andela, N.; van der Werf, G.R. Recent trends in African fires driven by cropland expansion and El Nino to La Nina transition. Nat. Clim. Chang. 2014, 4, 791–795. [Google Scholar] [CrossRef]
  17. Kaufman, Y.J.; Justice, C.O.; Flynn, L.P.; Kendall, J.D.; Prins, E.M.; Giglio, L.; Ward, D.E.; Menzel, W.P.; Setzer, A.W. Potential global fire monitoring from EOS-MODIS. J. Geophys. Res. 1998, 103, 32215–32238. [Google Scholar] [CrossRef] [Green Version]
  18. Wooster, M.J.; Zhukov, B.; Oertel, D. Fire radiative energy for quantitative study of biomass burning: Derivation from the BIRD experimental satellite and comparison to MODIS fire products. Remote Sens. Environ. 2003, 86, 83–107. [Google Scholar] [CrossRef]
  19. Zhukov, B.; Lorenz, E.; Oertel, D.; Wooster, M.; Roberts, G. Spaceborne detection and characterisation of fires during the bi-spectral infrared detection (BIRD) experimental small satellite mission (2001–2004). Remote Sens. Environ. 2006, 100, 29–51. [Google Scholar] [CrossRef]
  20. Wooster, M.J.; Roberts, G.; Perry, G.L.W.; Kaufman, Y.J. Retrieval of biomass combustion rates and totals from fire radiative power observations: FRP derivation and calibration relationships between biomass consumption and fire radiative energy release. J. Geophys. Res. 2005, 110, D24311. [Google Scholar] [CrossRef]
  21. Oliveira, S.L.J.; Maier, S.W.; Pereira, J.M.C.; Russell-Smith, J. Seasonal differences in fire activity and intensity in tropical savannas of northern Australia using satellite measurements of fire radiative power. Int. J. Wildland Fire 2015, 24, 249–260. [Google Scholar] [CrossRef]
  22. Sparks, A.M.; Kolden, C.A.; Smith, A.M.S.; Boschetti, L.; Johnson, D.M.; Cochrane, M.A. Fire intensity impacts on post-fire temperate coniferous forest net primary productivity. Biogeosciences 2018, 15, 1173–1183. [Google Scholar] [CrossRef]
  23. Archibald, S.; Lehmann, C.E.R.; Gomez-Dans, J.L.; Bradstock, R.A. Defining pyromes and global syndromes of fire regimes. Proc. Natl. Acad. Sci. USA 2012, 110, 6442–6447. [Google Scholar] [CrossRef] [PubMed]
  24. Wooster, M.J.; Zhang, Y.H. Boreal forest fires burn less intensely in Russia than in North America. Geophys. Res. Lett. 2004, 31, L20505. [Google Scholar] [CrossRef]
  25. Ellicott, E.; Vermote, E.; Giglio, L.; Roberts, G. Estimating biomass consumed from fire using MODIS FRE. Geophys. Res. Lett. 2009, 36, L13401. [Google Scholar] [CrossRef]
  26. Roberts, G.; Wooster, M.J.; Freeborn, P.H.; Xu, W. Integration of geostationary FRP and polar-orbiting burned area datasets for an enhanced emissions inventory. Remote Sens. Environ. 2011, 115, 2047–2061. [Google Scholar] [CrossRef]
  27. Andela, N.; van der Werf, G.R.; Kaiser, J.W.; van Leeuwen, T.T.; Wooster, M.J.; Lehmann, C.E.R. Biomass burning fuel consumption dynamics in the tropics and subtropics assessed from satellite. Biogeosciences 2016, 13, 3717–3734. [Google Scholar] [CrossRef] [Green Version]
  28. Li, F.; Zhang, X.; Kondragunta, S.; Roy, D.P. Investigation of the fire radiative energy biomass combustion coefficient: A comparison of polar and geostationary satellite retrievals over the Conterminous United States. J. Geophys. Res. Biogeosci. 2018, 123, 722–739. [Google Scholar] [CrossRef]
  29. Zhang, X.; Kondragunta, S.; Ram, J.; Schmidt, C.; Hung, H.-C. Near-real-time global biomass burning emissions product from geostationary satellite constellation. J. Geophys. Res. Atmos. 2012, 117, D14201. [Google Scholar] [CrossRef]
  30. Vermote, E.; Ellicott, E.; Dubovik, O.; Lapyonok, T.; Chin, M.; Giglio, G.; Roberts, G. An approach to estimate global biomass burning emissions of Organic and Black Carbon from MODIS Fire Radiative Power. J. Geophys. Res. 2009, 114, D18205. [Google Scholar] [CrossRef]
  31. Kaiser, J.W.; Heil, A.; Andrae, M.O.; Benedettie, A.; Chubarova, N.; Jones, L.; Morcrette, J.-J.; Razinger, M.; Schultz, M.G.; Suttie, M.; et al. Biomass burning emissions estimates with a global fire assimilation system based on observed fire radiative power. Biogeosciences 2012, 9, 5125–5142. [Google Scholar] [CrossRef] [Green Version]
  32. Mota, B.; Wooster, M.J. A new top-down approach for directly estimating biomass burning emissions and fuel consumption rates and totals from geostationary satellite fire radiative power (FRP). Remote Sens. Environ. 2018, 206, 45–62. [Google Scholar] [CrossRef]
  33. Zhang, T.; Wooster, M.J.; Xu, W. Approaches for synergistically exploiting VIIRS I- and M-Band data in regional active fire detection and FRP assessment: A demonstration with respect to agricultural residue burning in Eastern China. Remote Sens. Environ. 2017, 198, 407–424. [Google Scholar] [CrossRef]
  34. Roberts, G.; Wooster, M.J.; Lauret, N.; Gastellu-Etchegorry, J.P.; Lynham, T.; McRae, D. Investigating the impact of overlying vegetation canopy structures on fire radiative power (FRP) retrieval through simulation and measurement. Remote Sens. Environ. 2018, 217, 158–171. [Google Scholar] [CrossRef]
  35. Kremens, R.L.; Dickinson, M.B.; Bova, A.S. Radiant flux density, energy density and fuel consumption in mixed-oak forest surface fires. Int. J. Wildland Fire 2012, 21, 722–730. [Google Scholar] [CrossRef]
  36. Van Leeuwen, T.T.; der Werf, G.R.; Hoffmann, A.A.; Detmers, R.G.; Rucker, G.; French, N.H.F.; Archibald, S.; Carvalho, J.A., Jr.; Cook, G.D.; de Groot, W.J.; et al. Biomass burning fuel consumption rates: A field measurement database. Biogeosciences 2014, 11, 7305–7329. [Google Scholar] [CrossRef]
  37. Freeborn, P.H.; Wooster, M.J.; Roberts, G. Addressing the spatiotemporal sampling design of MODIS to provide estimates of the fire radiative energy emitted from Africa. Remote Sens. Environ. 2011, 115, 475–489. [Google Scholar] [CrossRef]
  38. Xu, W.; Wooster, M.J.; Roberts, G.; Freeborn, P. New GOES imager algorithms for cloud and active fire detection and fire radiative power assessment across North, South and Central America. Remote Sens. Environ. 2010, 114, 1876–1895. [Google Scholar] [CrossRef]
  39. Roberts, G.; Wooster, M.J.; Lagoudakis, E. Annual and diurnal African biomass burning temporal dynamics. Biogeosciences 2009, 6, 849–866. [Google Scholar] [CrossRef]
  40. Zhang, X.; Kondragunta, S. Temporal and spatial variability in biomass burned areas across the USA derived from the GOES fire product. Remote Sens. Environ. 2008, 112, 2886–2897. [Google Scholar] [CrossRef]
  41. Wooster, M.J.; Roberts, G.; Freeborn, P.H.; Xu, W.; Govaerts, Y.; Beeby, R.; He, J.; Lattanzio, A.; Mullen, R. Meteosat SEVIRI Fire Radiative Power (FRP) products from the Land Surface Analysis Satellite Applications Facility (LSA SAF)—Part 1: Algorithms, product contents and analysis. Atmos. Chem. Phys. 2015, 15, 9815–9895. [Google Scholar] [CrossRef]
  42. Roberts, G.; Wooster, M.J.; Xu, W.; Freeborn, P.H.; Morcrette, J.-J.; Jones, L.; Benedetti, A.; Kaiser, J. LSA SAF Meteosat FRP Products: Part 2—Evaluation and demonstration of use in the Copernicus Atmosphere Monitoring Service (CAMS). Atmos. Chem. Phys. 2015, 15, 13241–13267. [Google Scholar] [CrossRef] [Green Version]
  43. Aminou, D.M.A.; Jacquet, B.; Pasternak, F. Characteristics of the Meteosat Second Generation (MSG) radiometer/imager: SEVIRI. Proc. SPIE 1997, 3221. [Google Scholar] [CrossRef]
  44. Roberts, G.; Wooster, M.J. Fire Detection and Fire Characterization over Africa using Meteosat SEVIRI. IEEE Trans. Geosci. Remote Sens. 2008, 48, 1200–1219. [Google Scholar] [CrossRef]
  45. Freeborn, P.H.; Wooster, M.J.; Roy, D.P.; Cochrane, M.A. Quantification of MODIS fire radiative power (FRP) measurement uncertainty for use in satellite-active fire characterisation and biomass burning estimation. Geophys. Res. Lett. 2014, 41, 1988–1994. [Google Scholar] [CrossRef]
  46. Zhao, M.; Heinsch, F.A.; Nemaniu, R.R.; Running, S.W. Improvements of the MODIS terrestrial gross and net primary production global data set. Remote Sens. Environ. 2005, 95, 164–176. [Google Scholar] [CrossRef]
  47. Knyazikhin, Y.; Martonchik, J.V.; Myneni, R.B.; Diner, D.J.; Running, S.W. Synergistic algorithm for estimating vegetation canopy leaf area index and fraction of absorbed photosynthetically active radiation from MODIS and MISR data. J. Geophys. Res. 1998, 103, 3225–32274. [Google Scholar] [CrossRef]
  48. Friedl, M.A.; McIver, D.K.; Hodges, J.C.F.; Zhang, X.Y.; Muchoney, D.; Strahler, A.H.; Woodcock, C.E.; Gopal, S.; Schneider, A.; Cooper, A.; et al. Global land cover mapping from MODIS: Algorithms and early results. Remote Sens. Environ. 2002, 83, 287–302. [Google Scholar] [CrossRef]
  49. Montieth, J.L. Solar radiation and productivity in tropical ecosystems. J. Appl. Ecol. 1972, 9, 747–766. [Google Scholar] [CrossRef]
  50. Running, S.W.; Nemani, R.R.; Heinsch, N.A.; Zhao, M.; Reeves, M.; Hashimoto, H. A continuous satellite-derived measure of global terrestrial primary production: Future science and applications. Biosciences 2005, 56, 547–560. [Google Scholar]
  51. Wang, X.; Ma, M.; Li, X.; Song, Y.; Tan, J.; Huang, G.; Zhang, Z.; Zhao, T.; Feng, J.; Ma, Z.; et al. Validation of MODIS GPP product at 10 flux sites in northern China. Int. J. Remote Sens. 2013, 34, 587–599. [Google Scholar] [CrossRef]
  52. Sjostrom, M.; Zhao, M.; Archibald, S.; Arneth, A.; Cappelaere, B.; Falk, U.; de Grandcourt, A.; Hanan, N.; Kergoat, L.; Kutsch, W.; et al. Evaluation of MODIS gross primary productivity for Africa using eddy covariance data. Remote Sens. Environ. 2013, 131, 275–285. [Google Scholar] [CrossRef]
  53. Fensholt, R.; Sandholt, I.; Rasmussen, M.S.; Stisen, S.; Diouf, A. Evaluation of satellite based primary production modelling in the semi-arid Sahel. Remote Sens. Environ. 2006, 105, 173–188. [Google Scholar] [CrossRef]
  54. Giglio, L.; Loboda, T.; Roy, D.P.; Quayle, B.; Justice, C.O. An active-fire based burned area mapping algorithm for the MODIS sensor. Remote Sens. Environ. 2009, 113, 408–420. [Google Scholar] [CrossRef]
  55. Tsela, P.; Wessels, K.; Botai, J.; Achibald, S.; Swanepoel, D.; Steenkamp, K.; Frost, P. Validation of the two standard MODIS satellite burned area products and an empirically derived merged product in South Africa. Remote Sens. 2014, 6, 1275–1293. [Google Scholar] [CrossRef]
  56. Padilla, M.; Stehman, S.V.; Ramo, R.; Corti, D.; Hantson, S.; Oliva, P.; Alonso-Canas, I.; Bradley, A.V.; Tansey, K.; Mota, B.; et al. Comparing the accuracies of remote sensing global burned area products using stratified random sampling and estimation. Remote Sens. Environ. 2015, 160, 114–121. [Google Scholar] [CrossRef] [Green Version]
  57. Townshend, J.R.G.; Justice, C.O.; Skole, D.; Malingreau, J.-P.; Cihlar, J.; Teillet, P.; Sadowski, F.; Ruttenberg, S. The 1-km AVHRR global data set: Needs of the International Geosphere Biosphere Program. Int. J. Remote Sens. 1994, 15, 3319–3332. [Google Scholar] [CrossRef]
  58. Randerson, J.T.; Chen, Y.; van der Werf, G.R.; Rogers, B.M.; Morton, D.C. Global burned area and biomass burning emissions from small fires. Biogeosciences 2012, 117. [Google Scholar] [CrossRef] [Green Version]
  59. Smith, A.M.S.; Tinkham, W.T.; Roy, D.P.; Boschetti, L.; Kremens, R.L.; Kumar, S.S.; Sparks, A.M.; Falkowski, M.J. Quantification of fuel moisture effects on biomass consumed derived from fire radiative energy retrievals. Geophys. Res. Lett. 2013, 40, 6298–6302. [Google Scholar] [CrossRef] [Green Version]
  60. Dube, O.P. Challenges of wildland fire management in Botswana: Towards a community inclusive fire management approach. Weather Clim. Extremes 2013, 1, 26–41. [Google Scholar] [CrossRef]
  61. Govender, N.; Trollope, W.; van Wilgen, B.W. The effect of fire season, fire frequency, rainfall and management on fire intensity in savanna vegetation in South Africa. J. Appl. Ecol. 2006, 43, 748–758. [Google Scholar] [CrossRef] [Green Version]
  62. Korontzi, S.; Ward, D.E.; Susott, R.A.; Yokelson, R.J.; Justice, C.O.; Hobbs, P.V.; Smithwick, E.A.H.; Hao, W.M. Seaonal variation and ecosystem dependence of emission factors for selected trace gases and PM2.5 for southern Africa savanna fires. J. Geophys. Res. 2003, 108, D24. [Google Scholar] [CrossRef]
  63. Meyer, C.P.; Cook, G.D.; Reisen, C.F.; Smith, T.; Tattaris, M.; Russell-Smith, J.; Maier, S.W.; Yates, C.P.; Wooster, M.J. Direct measurement f seasonality of emission factors from savanna fires in northern Australia. J. Geophys. Res. Atmos. 2012, 117, D20. [Google Scholar] [CrossRef]
  64. Swinnen, E.; Van Hools, R.; Eerens, H. Algorithm Theoretical Basis Document: Dry Matter Productivity (DMP). In Gio Global Land Component—Lot, I. “Operation of the Global Land Component”; Copernicus; VITO: Boeretang, Belgium, 2015; pp. 1–37. [Google Scholar]
  65. Freeborn, P.H.; Cochrane, M.A.; Wooster, M.J. A decade long, multi-scale map comparison of fire regime parameters derived from three publically available satellite-based fire products: A case study in the Central African Republic. Remote Sens. 2014, 6, 4061–4089. [Google Scholar] [CrossRef]
  66. Ryan, C.M.; Williams, M.; Grace, J. Above and below ground carbon stocks in a Miombo woodland landscape in Mozambique. Biotropica 2011, 43, 423–432. [Google Scholar] [CrossRef]
  67. Roy, D.P.; Boschetti, L.; Justice, C.O.; Ju, J. The collection 5 MODIS burned area product—Global evaluation by comparison to the MODIS active fire product. Remote Sens. Environ. 2008, 112, 3690–3707. [Google Scholar] [CrossRef]
  68. Boschetti, L.; Roy, D.; Justice, C.; Giglio, L. Global assessment of the temporal reporting accuracy and precision of the MODIS burned area product. Int. J. Wildland Fire 2010, 19, 705–709. [Google Scholar] [CrossRef]
  69. Freeborn, P.H.; Wooster, M.J.; Roberts, G.; Xu, W. Evaluating the SEVIRI Fire Thermal Anomaly Detection Algorithm across the Central African Republic Using the MODIS Active Fire Product. Remote Sens. 2014, 6, 1890–1917. [Google Scholar] [CrossRef] [Green Version]
  70. Mathews, B.J.; Strand, E.K.; Smith, A.M.; Hudak, A.T.; Dickinson, B.; Kremens, R.L. Laboratory experiments to estimate interception of infrared radiation by tree canopies. Int. J. Wildland Fire 2016, 25, 1009–1014. [Google Scholar] [CrossRef]
  71. Johnston, J.M.; Wooster, M.J.; Lynham, T.J. Experimental confirmation of the MWIR and LWIR grey body assumption for vegetation fire flame emissivity. Int. J. Wildland Fire 2014, 23, 463–479. [Google Scholar] [CrossRef]
  72. Sjostrom Ardo, J; Arneth, A.; Boulain, N.; Cappelaere, B.; Eklundh, L.; de Grandcourt, A.; Kutsch, W.L.; Merbold, L.; Nouvellon, Y.; Scholes, R.J.; et al. Exploring the potential of MODIS EVI for modelling gross primary production across African ecosystems. Remote Sens. Environ. 2011, 131, 1081–1089. [Google Scholar] [CrossRef]
  73. Shea, R.W.; Shea, B.W.; Kauffman, J.B.; Ward, D.E.; Haskins, C.I.; Scholes, M.C. Fuel biomass and combustion factors associated with fires in savanna ecosystems of South Africa and Zambia. J. Geophys. Res. 1996, 101, 23551–23568. [Google Scholar] [CrossRef]
  74. Scholes, R.J.; Archer, S.R. Tree-grass interactions in savannas. Annu. Rev. Ecol. Syst. 1997, 28, 517–544. [Google Scholar] [CrossRef]
  75. Sa, A.C.L.; Pereira, J.M.C.; Silva, J.M.N. Estimation of combustion completeness based on fire-induced spectral reflectance changed in a dambo grassland (Western Province, Zambia). Int. J. Remote Sens. 2005, 26, 4185–4195. [Google Scholar] [CrossRef]
  76. Hoffa, E.A.; Ward, D.A.; Hao, W.-M.; Susott, R.A.; Walimoto, R.H. Seasonality of carbon emissions from biomass burning in a Zambian savanna. J. Geophys. Res. 1999, 104, 13841–13853. [Google Scholar] [CrossRef] [Green Version]
  77. Hely, C.; Alleaume, S.; Swap, R.J.; Shugart, H.H.; Justice, C.O. SAFRAI-2000 characterisation of fuels, fire behaviour, combustion completeness and emissions from experimental burns in infertile grass savanna in western Zambia. J. Arid Environ. 2003, 54, 381–394. [Google Scholar] [CrossRef]
  78. Ward, D.E.; Hao, W.M.; Susott, R.A.; Babbitt, R.E.; Shea, R.W.; Kauffman, J.B. Effects of fuel composition on combustion efficiency and emission factors for Africa savanna ecosystems. J. Geophys. Res. Atmos. 1996, 101, 23569–23576. [Google Scholar] [CrossRef]
  79. Calle, A.; Casanova, J.-L.; Gonzales-Alonso, F. Impact of point spread function of MSG SEVIRI on active fire detections. Int. J. Remote Sens. 2009, 30, 4567–4579. [Google Scholar] [CrossRef]
  80. Roberts, G.; Wooster, M.J. Development of a multi-temporal Kalman filter approach to geostationary active fire detection and fire radiative power (FRP) estimation. Remote Sens. Environ. 2014, 152, 392–412. [Google Scholar] [CrossRef]
  81. Dietenberger, M. Update for combustion properties of wood components. Fire Mater. 2002, 26, 255–267. [Google Scholar] [CrossRef] [Green Version]
  82. Schroeder, W.; Ellicott, E.; Ichoku, C.; Ellison, L.; Dickinson, M.B.; Ottmar, R.D.; Clements, C.; Hall, D.; Ambrosia, V.; Kremens, R. Integrated active fire retrievals and biomass burning emissions using complementary near-coincident ground, airborne and spaceborne sensor data. Remote Sens. Environ. 2014, 140, 719–730. [Google Scholar] [CrossRef]
  83. Frankman, D.; Webb, B.W.; Butler, B.W.; Jiminez, D.; Forthofer, J.M.; Sopko, P.; Shannon, K.S.; Hiers, J.K.; Ottmar, R.D. Measurements of convective and radiative heating in wildland fires. Int. J. Wildland Fire 2012, 22, 157–167. [Google Scholar] [CrossRef]
  84. Pereira, G.; Shimabukuro, Y.E.; Moraes, E.C.; Freitas, S.R.; Cardozo, F.S.; Longo, K.M. Monitoring the transport of biomass burning emission in South America. Atmos. Pollut. Res. 2011, 3, 247–254. [Google Scholar] [CrossRef]
  85. Dickinson, M.B.; Hudak, A.T.; Zajkowski, T.; Loudermilk, E.L.; Schroeder, W.; Ellison, L.; Kremens, R.J.; Holley, W.; Martinez, O.; Paxton, A.; et al. Measuring radiant emissions from entire prescribed fires with ground, airborne, and satellite sensors—RxCADRE 2012. Int. J. Wildland Fire 2015, 25, 48–61. [Google Scholar] [CrossRef]
  86. Xu, W.; Wooster, M.J.; Kaneko, T.; He, J.; Zhang, T.; Fisher, D. Major advances in geostationary fire radiative power (FRP) retrieval over Asia and Australia stemming from use of Himarawi-8 AHI. Remote Sens. Environ. 2017, 193, 138–149. [Google Scholar] [CrossRef]
Figure 1. (a) Annual estimates of Spinning Enhanced Visible and Infrared Imager (SEVIRI) fire radiative energy (FRE, Tj); (b) Moderate Resolution Imaging Spectroradiometer (MODIS) MCD64 burned area (Mha) and (c) Global Fire Emissions Database (GFED, version 4) fuel consumption (Tg, DM) in the northern and southern hemisphere Africa. A least-squares linear trend line is shown. Note that in 2013, three months of SEVIRI data (March, April and May) were unavailable which will have a greater impact in the northern hemisphere where fire activity is higher during these months.
Remotesensing 10 01591 g001aRemotesensing 10 01591 g001b
Figure 2. Monthly estimates of SEVIRI Fire Radiative Energy (FRE)-derived fuel consumption (Tg DM) over northern (a) and southern (b) hemisphere Africa between 2004 and 2012. A least-squares linear trend line is shown. Note that the y-axis range differs among plots.
Remotesensing 10 01591 g002
Figure 3. Comparison between MODIS net photosynthesis (PSN) (Tg) and Copernicus dry matter productivity (DMP, Tg DM) estimates that have been temporally integrated over MODIS burned areas that burned in successive years in the northern (a) and southern (b) African hemispheres. The grey shaded area represents the prediction interval and the blue shaded area is the slopes 95% confidence interval. Note that the x- and y-axis range differs among plots.
Remotesensing 10 01591 g003
Figure 4. (a) Daily fire radiative power (FRP, MW) timeseries from a fire cluster that first burned in 2007 and then again in 2008 in an area of woody savanna in southern hemisphere Africa. The red vertical lines indicate the time period between which FRP retrievals are integrated to estimate the FRE and fuel consumption on the basis of the burned area detection dates. Note that only the time periods where fire activity was detected in each year are shown. (b) Mean fire cluster productivity (MODIS Gross Primary Productivity (GPP) and PSN; kg C m-2 day−1). The dashed grey lines indicate the DOY where the fire cluster was last detected as burning in 2007 and first detected as burning in 2008 (according to the MCD64 product), between which the PSN were accumulated.
Remotesensing 10 01591 g004
Figure 5. The relationship between FRE-derived fuel consumption (Tg DM) and accumulated MODIS PSN (Tg) on a per-fire cluster basis in the northern (a) and southern (b) hemisphere Africa as a function of the average number of SEVIRI fire detections per pixel within each fire cluster. The grey shaded area represents the prediction interval and the blue shaded area is the slopes 95% confidence interval. Note that the x- and y-axis range differs among plots.
Remotesensing 10 01591 g005aRemotesensing 10 01591 g005b
Figure 6. The relationship between FRE-derived fuel consumption (Tg DM) and accumulated PSN (Tg) per-fire cluster basis for the northern (a) and southern (b) hemisphere Africa between 2005 and 2015. The grey shaded area represents the prediction interval and the blue shaded area is the slopes 95% confidence interval. Note that the x- and y-axis range differs among plots.
Remotesensing 10 01591 g006
Figure 7. Relationship between FRE-derived fuel consumption (Tg DM) and accumulated Copernicus dry matter productivity (DMP, Tg DM) for fire clusters that burned between 2013 and 2016 in northern and southern hemisphere Africa. The grey shaded area represents the prediction interval and the blue shaded area is the slopes 95% confidence interval. Note that the x- and y-axis range differs among plots.
Remotesensing 10 01591 g007
Figure 8. Relationship between FRE-derived fuel consumption (Tg DM) and accumulated MODIS PSN (Tg) on a fire cluster basis as a function of land cover type in northern (a) and southern (b) hemisphere Africa. The grey shaded area represents the prediction interval and the blue shaded area is the slopes 95% confidence interval. Note that the x- and y-axis range differs among plots.
Remotesensing 10 01591 g008
Figure 9. MCD64A1 burned area derived fire occurrence (2004–2016) at 0.25° resolution using MCD64 A1 burned area product between 2004 and 2016.
Remotesensing 10 01591 g009
Figure 10. FRE-derived fuel consumption (a,c; kg DM m−2) and integrated MODIS PSN (b,d; kg m−2) estimates for five land cover types found in northern (a,b) and southern (c,d) hemisphere Africa. The upper and lower bounds of the bars are the 75th and 25th percentiles and the black horizontal line is the 50th percentile.
Remotesensing 10 01591 g010

