1. Introduction
Agricultural land abandonment (ALA) represents one of the major land use and land cover (LULC) changes in Europe that particularly affects marginal mountain areas [
1]. Accurately mapping ALA patterns and timing is important for understanding its spatial determinants [
2], as well as its environmental and socio-economic consequences [
3].
ALA is defined as a cessation of agricultural management for more than two or five years [
4,
5]. The land is first colonized by annual and biennial plant species and grasses, which, after three to four years, accede to perennial herbs and shrubs [
6]. Five years after abandonment, nearly 30% of trees germinate [
7]. However, natural forest development is slow, and the height of vegetation increases quite slowly during the early succession stages [
6].
The Polish Carpathians have experienced a gradual decline in agriculture, at least since World War II [
8,
9]. Two breakthrough events contributed to the dynamics of this process since the 1990s and a substantial land use transition: the collapse of socialism and the introduction of the open-market economy instead of the centrally-planned economy in 1989 [
9,
10,
11] and Poland joining the European Union and implementing the Common Agricultural Policy (CAP) in 2004 [
12]. The highest rates of abandonment occurred between 1990 and 2000 [
9]. Previous research highlighted widespread ALA in the region. Kolecka et al. [
13] reported that nearly 14% of agricultural land underwent forest succession on average since the 1990s, but locally, the values exceeded 30%.
Timing of land use transitions has been detected using Landsat [
3] and the Moderate Resolution Imaging Spectroradiometer (MODIS) [
14,
15] time series that date back to the 1970s and 2000s, respectively. Spatial resolutions of 30 m and 250 m for Landsat and MODIS, respectively, have been sufficient for large area mapping. However, these resolutions are too coarse for detecting and monitoring subtle land use changes in such highly fragmented agricultural landscapes with small-scale farming, such as in the Polish Carpathians [
16], and they do not allow the retrieval of vegetation height. The latter can be successfully derived from airborne laser scanning (ALS, LiDAR—light detection and ranging) point clouds [
17], or from fine resolution aerial photographs [
18].
Depending on site conditions (e.g., elevation, slope, aspect, proximity to trees and shrubs, and soil quality [
19]), the first signs of vegetation succession on abandoned fields, such as change in the types of plant species that occupy a given area, become visible with a variable time lag. However, given similar site conditions and species composition, plant growth should be alike, and successional vegetation height is assumed to be a possible indicator of ALA timing. Therefore, the main aim of this study was to determine the relationship between successional vegetation height and the timing of agricultural land abandonment in the Budzów community in the Polish Carpathians. The goals were to determine how the vegetation height differs depending of the time of its growth and how the vegetation height depends on the local topographic conditions. The drivers of land abandonment were beyond the scope of this study.
2. Materials and Methods
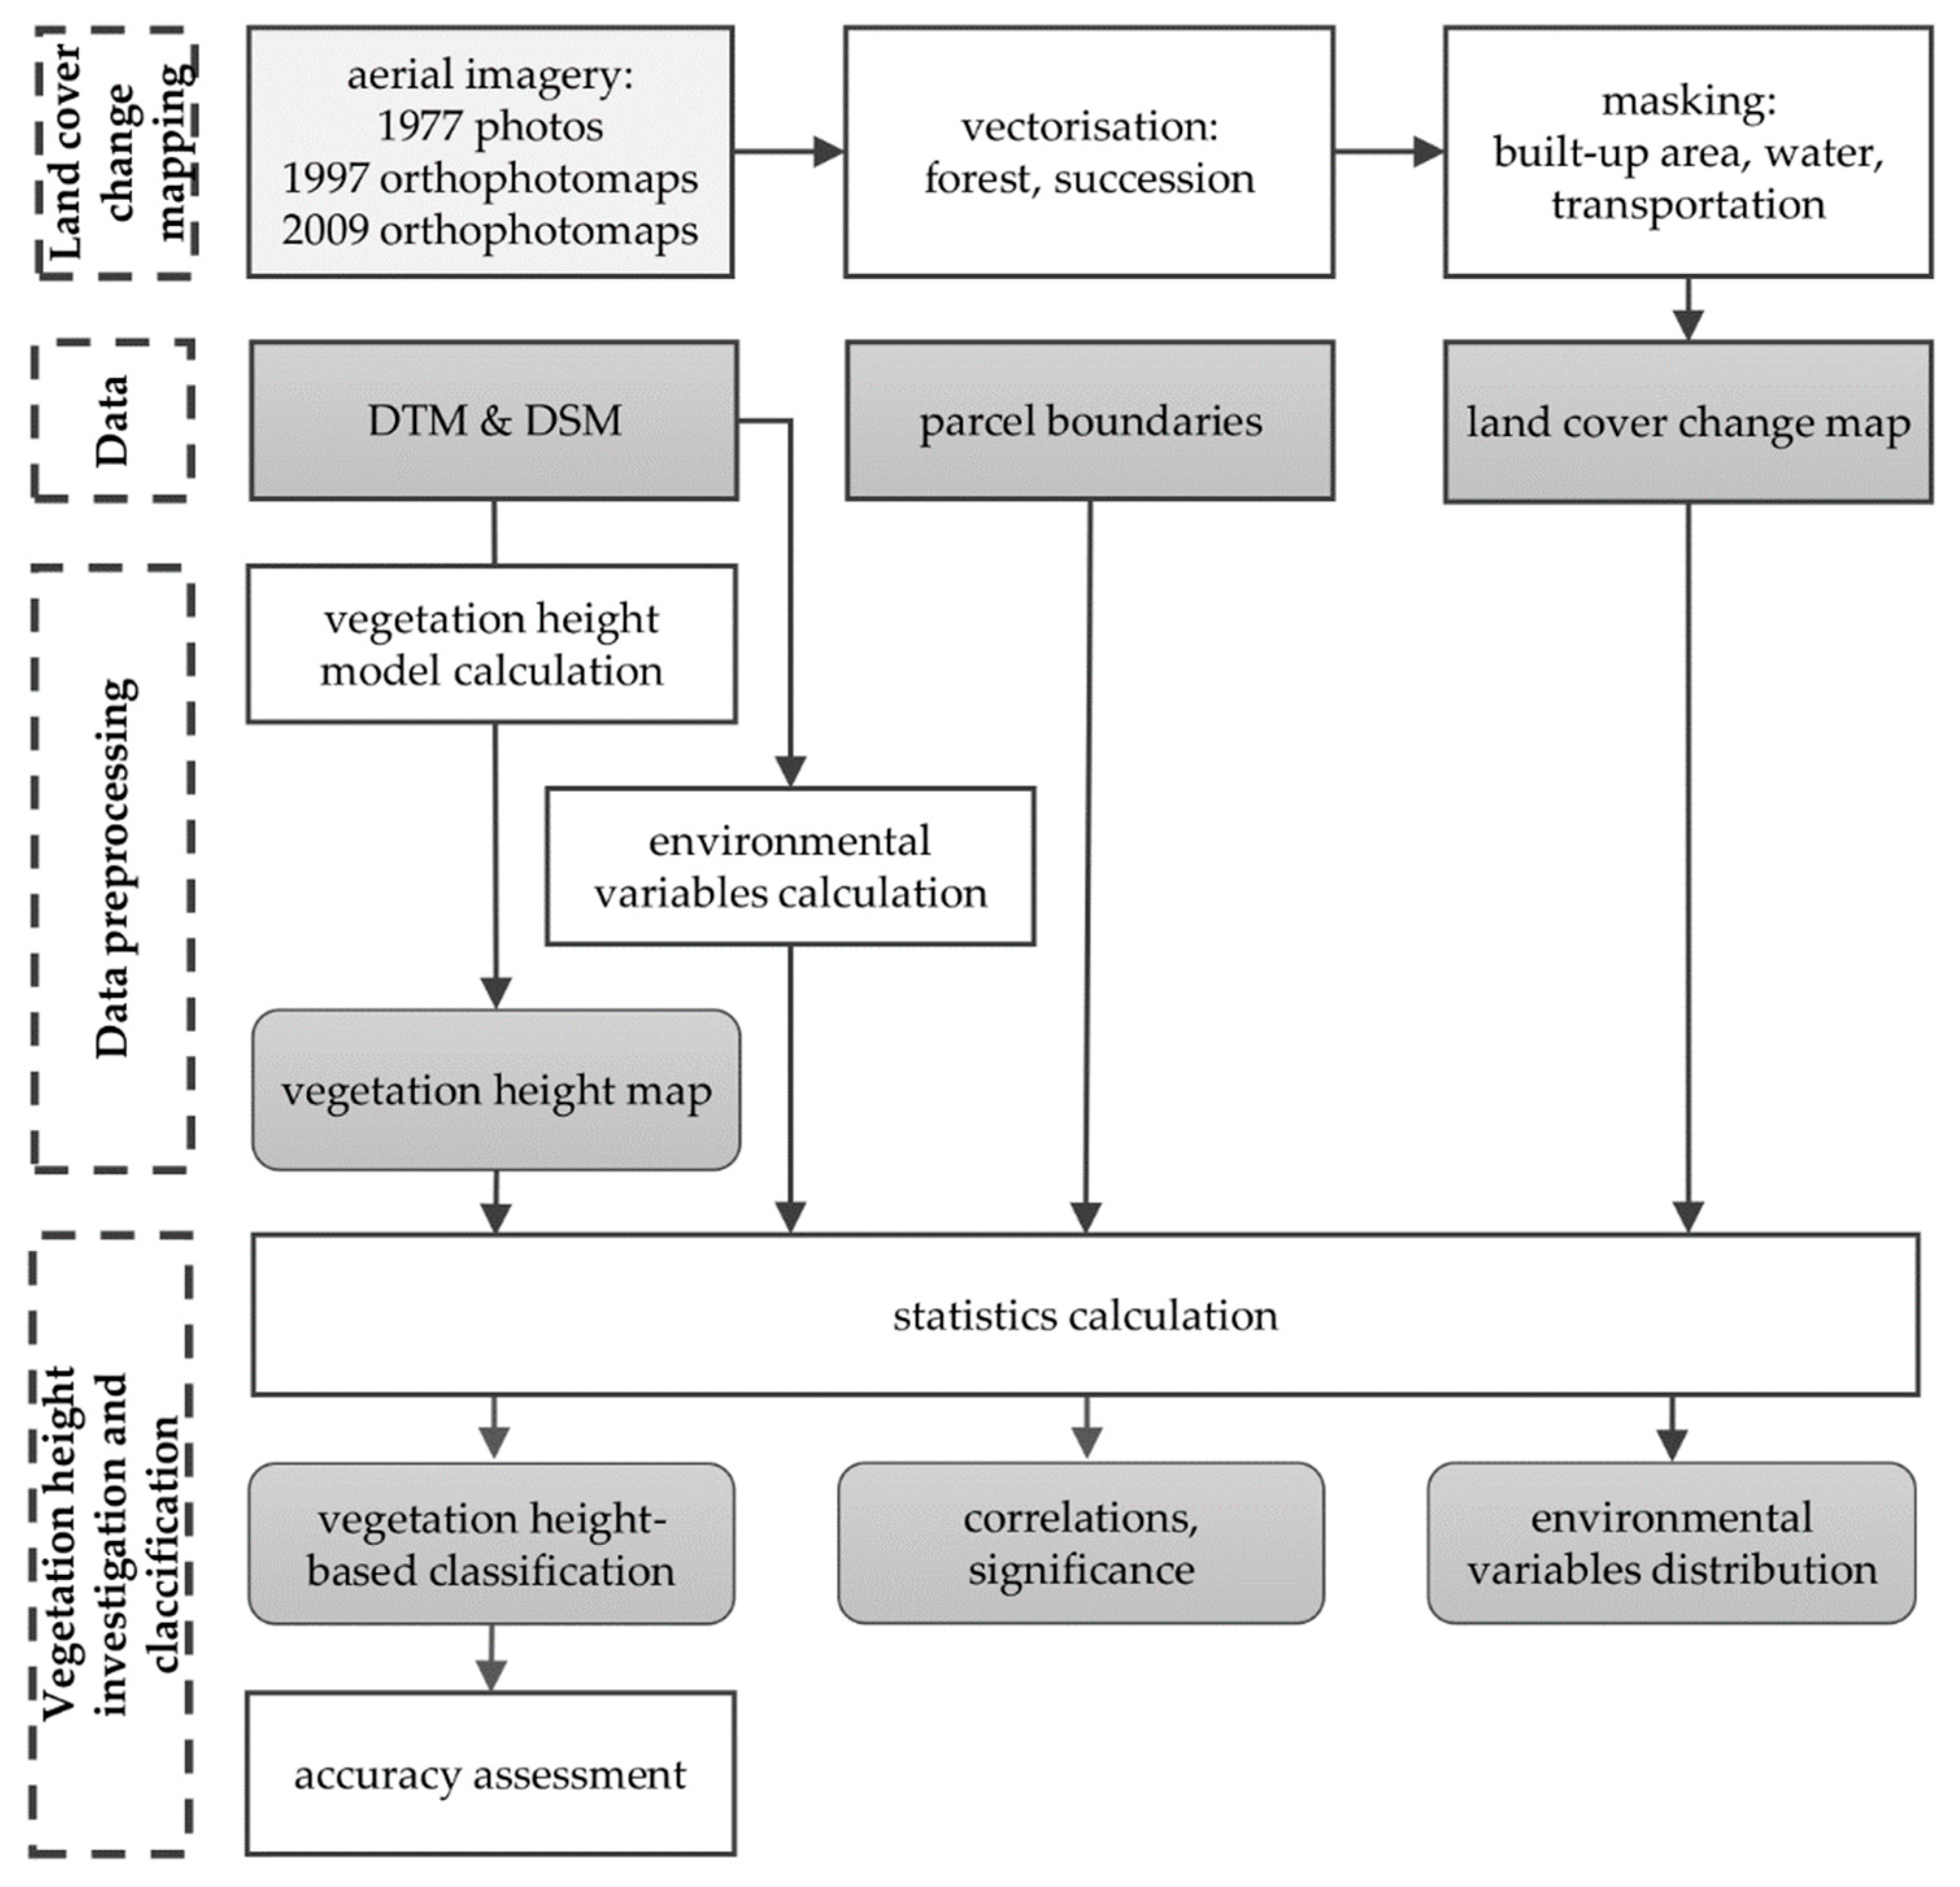
The approach was as follows: results of a prior study in the Budzów community were utilized [
20] by manually vectorized successional vegetation areas from two periods: 1977–1997 and 1997–2009. Detailed mapping of the contemporary height of the vegetation was performed while using products derived from airborne laser scanning. Finally, vegetation height was related to environmental conditions that might have triggered land abandonment and influenced plant development.
2.1. Study Area
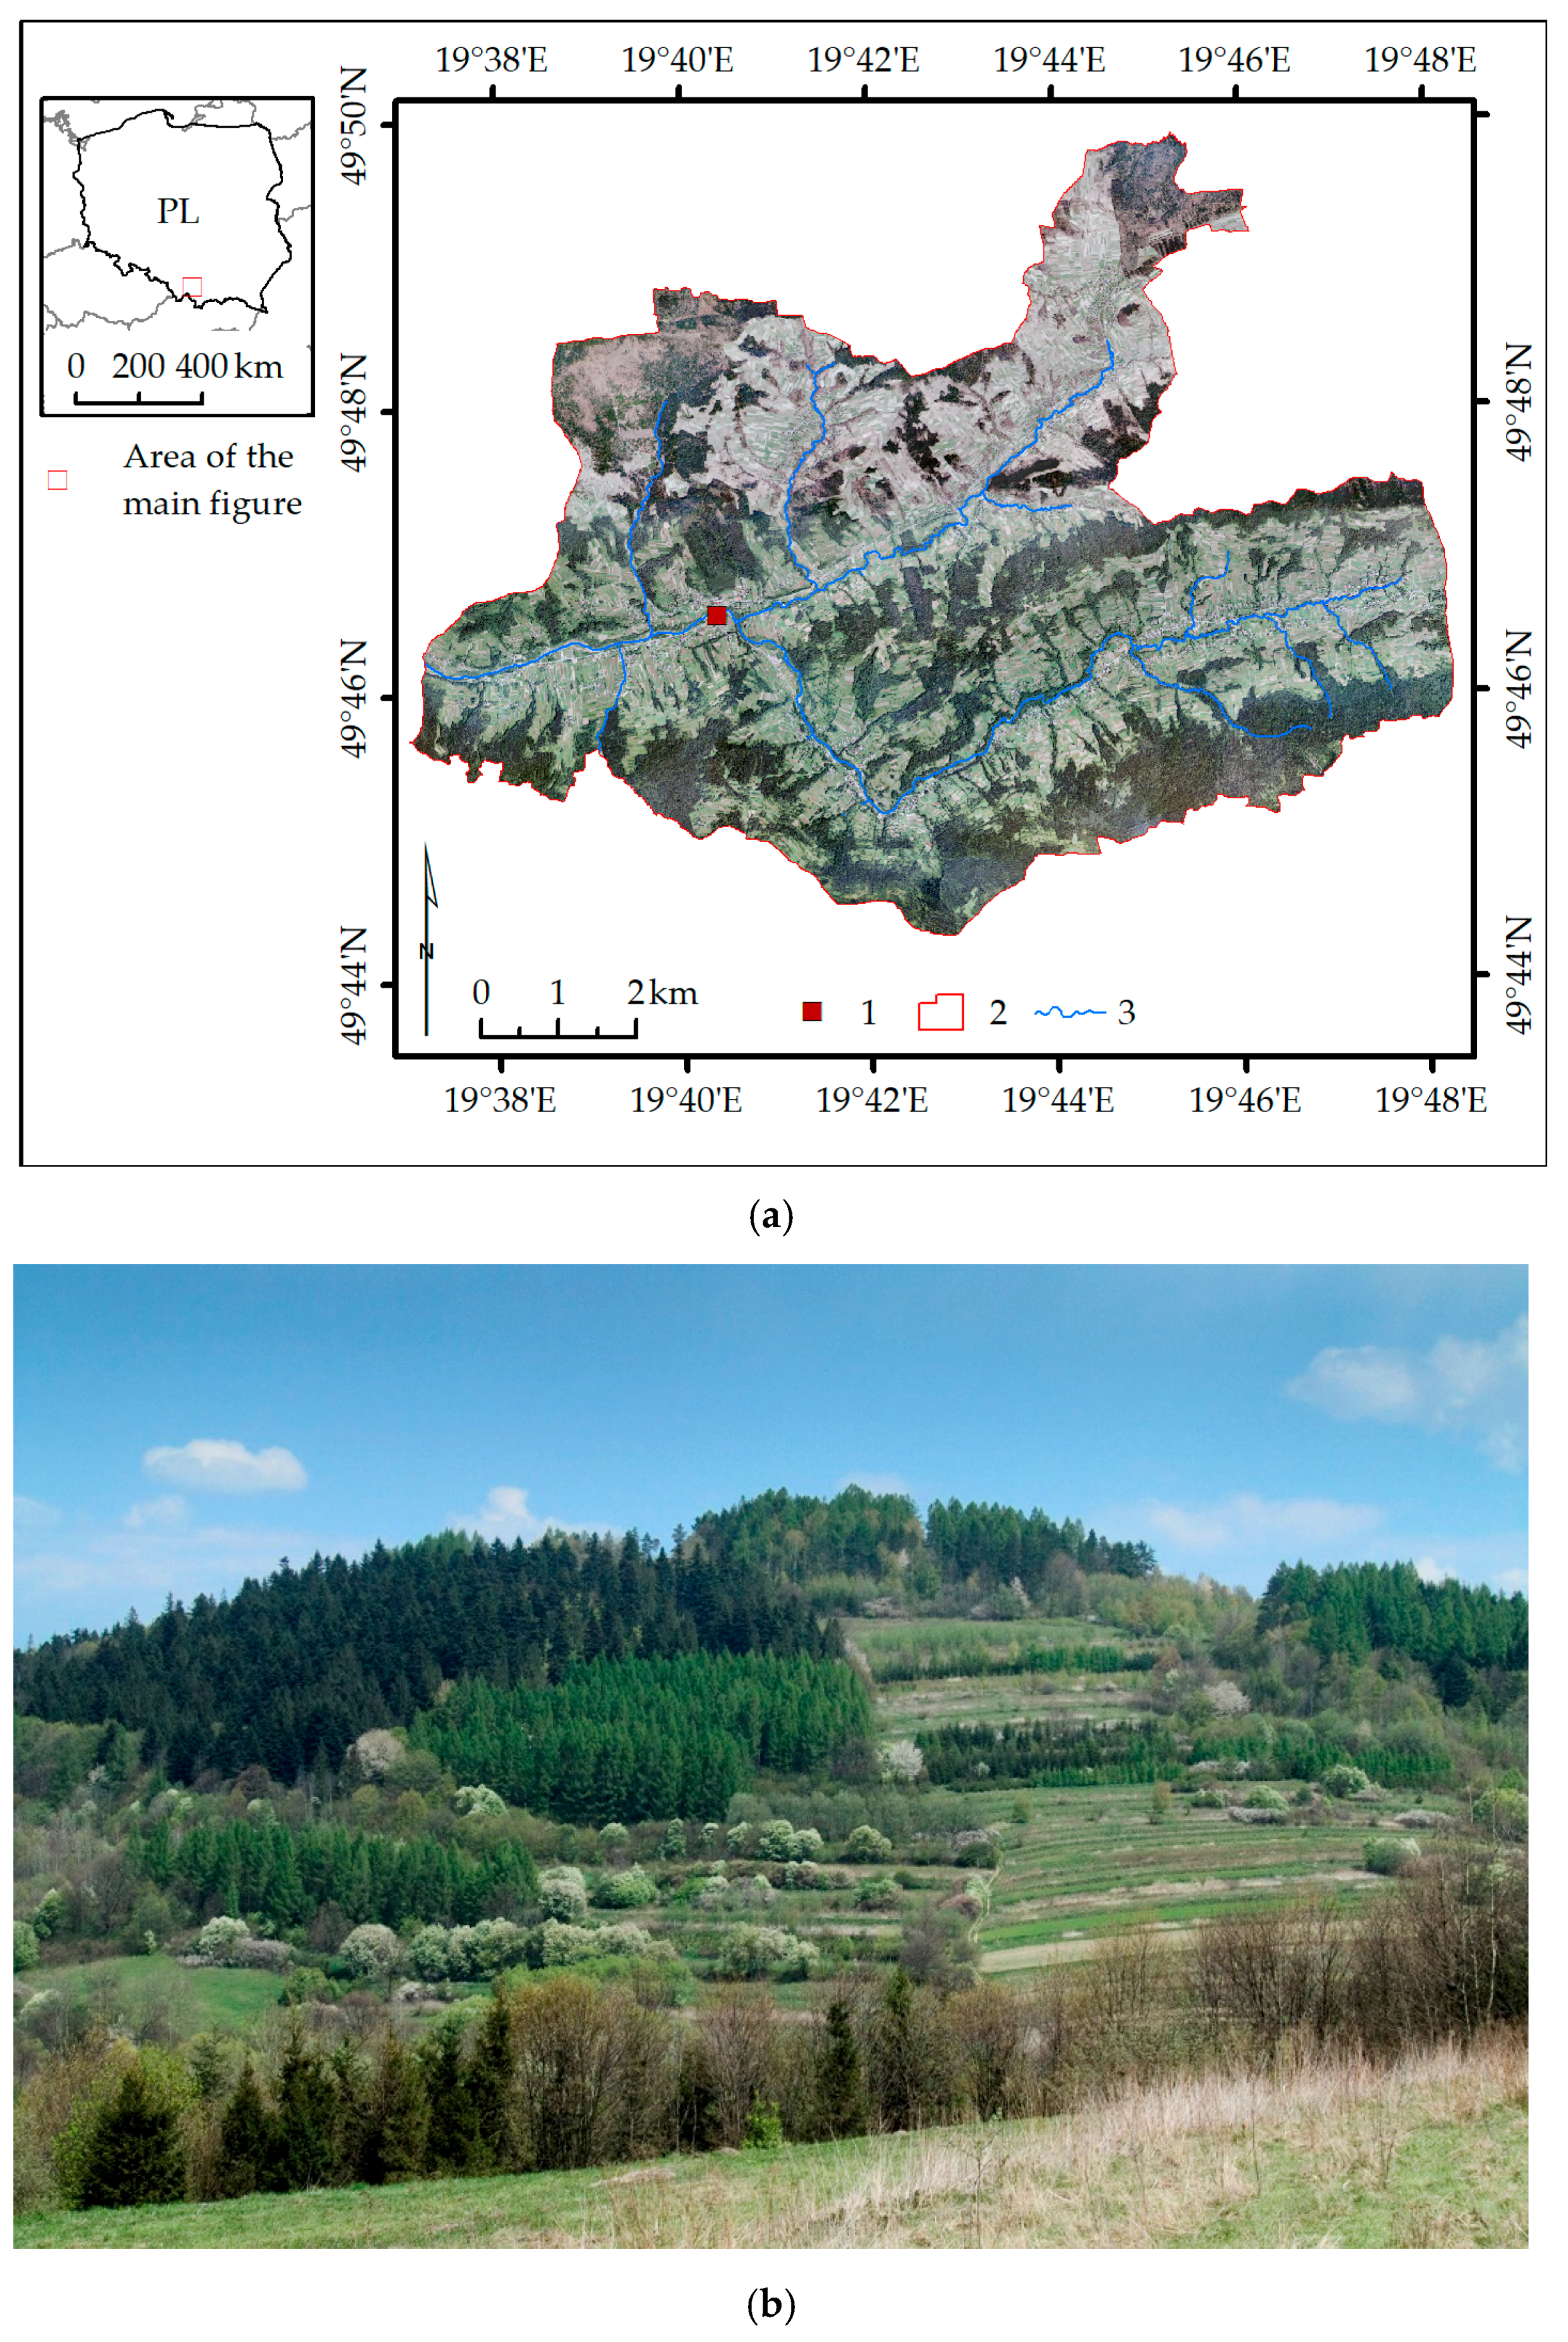
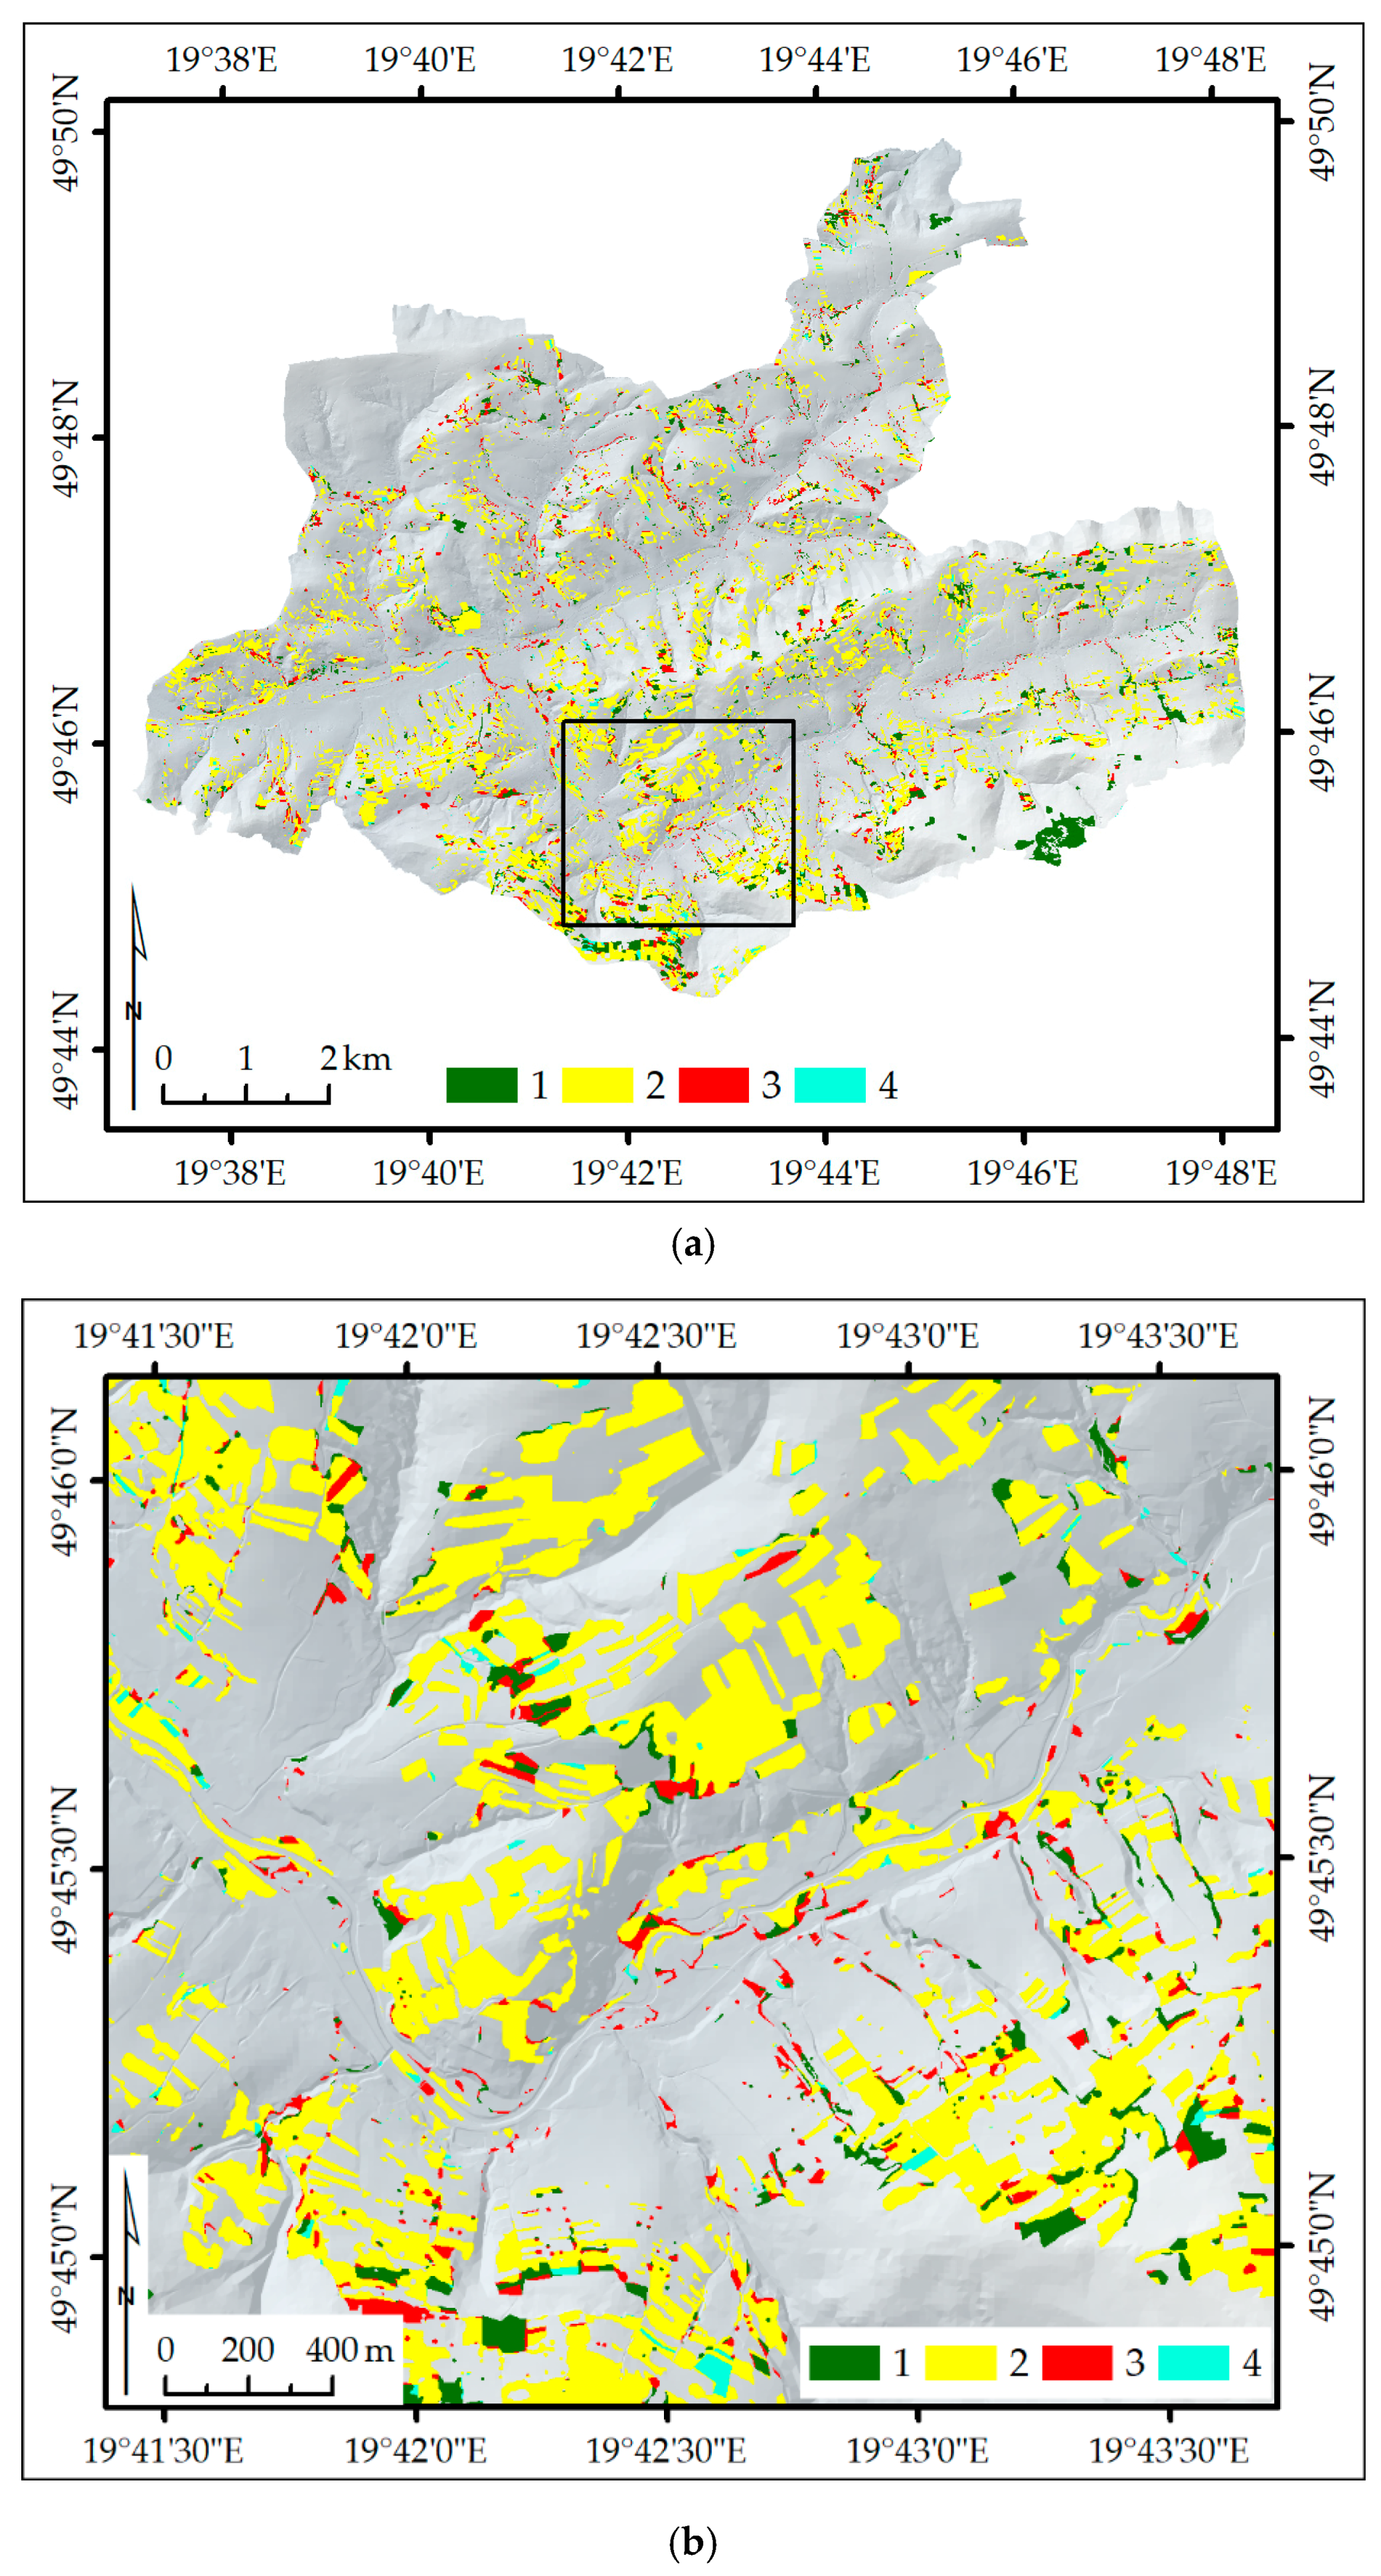
The Budzów community (73.4 km
2) is located in the Polish Carpathians, Małopolska Voivodeship (
Figure 1). Elevation ranges from 300 m a.s.l. to 820 m a.s.l. and the mean slope is 12°. The main valleys run in the east–west direction and most slopes are exposed to the north and south. According to the national statistical data, the dominating land use is a mixture of agricultural land (45%) and forest (40%) [
21]. Forest is the dominant land cover on mountain ridges, and much of the farmland is located below the so-called forest-agricultural boundary [
22]. The majority of forests (73%) belong to private owners and the rest belongs to the State Forests National Forest Holding (SF NFH). Much of the agricultural land in the community has been fallow [
22], while only 20 ha were afforested since 1996 [
21]. The state-owned forests are mainly concentrated in the outskirts of the community [
23] and they include about 300 large parcels. The entire community is divided into 60,000 cadastral parcels with the mean area of 0.12 ha [
24]. The population density is 120 inhabitants per square kilometer.
2.2. Data
The primary data used in this study included: (1) digital terrain model (DTM) and digital surface model (DSM) and (2) land cover maps from 1977, 1997, and 2009. The DTM and DSM data, with a ground sampling distance of 1.0 m and vertical root mean square error (RMSE) lower than 0.2 m, were derived from ALS point clouds of density not less than four points per square meter, acquired between 2012 and 2014. The datasets were provided by the Main Centre of Geodetic and Cartographic Documentation in Poland (Centralny Ośrodek Dokumentacji Geodezyjnej i Kartograficznej; CODGiK). The DTM and DSM were used for measuring vegetation height.
The land cover maps were produced in a prior study [
20] that aimed to map forest cover change and vegetation succession in detail in the Budzów community over two periods: 1977–1997 and 1997–2009 (
Figure 2). The particular dates were determined by data availability, e.g., acquisition of aerial photographs in southern Poland. In brief, orthorectified aerial photographs from 1977 and orthophotomaps from 1997 and 2009 were used to manually vectorize forest in the three moments: 1977, 1997, and 2009, and vegetation succession in 1977–1997 and 1997–2009 (referred to as succession). The backdating approach [
25,
26] was used to avoid small (up to 2 m) discrepancies between forest and succession extents that might be due to orthoimagery misalignments. Forest masks included tree cover, which includes all the patches of closed and open forest, and groups of trees, tree lines, and mature single trees. Succession masks included young vegetation, low trees, and shrubs that appeared on arable land and grassland used formerly by agriculture. The age interpretation was performed visually and considered height, length of shadows, span of tree crowns, and the presence in an older image. Water, transport, and built-up areas (5.6% of the community) were eliminated using additional information about formal and functional land use and land cover from the national database of topographic objects (Baza Danych Obiektów Topograficznych; BDOT10k). The land cover map from 1977 included forest class, and maps from 1997 and 2009 included forest and succession classes.
In this study, the three land cover maps were reclassified into three binary maps, including vegetation and no-vegetation classes (where vegetation refers to vectorized forest and succession), to avoid the possible misinterpretations that might arise from the visual interpretation of the vegetation age. The three maps were then aggregated into the following classes: patches of agricultural land that experienced successional and woody vegetation encroachment in the first period (1977–1997, subsequently referred to as old succession); the second period (1997–2009, subsequently called the new succession); and, the stable forest class, to provide reference vegetation heights for succession mapping.
The secondary data were the cadastral parcels boundaries from the Land-Parcel Identification System (LPIS) data [
24]. The entire community included 60,111 parcels, with mean area of 0.12 ha ranging from 1 m
2 to over 153 ha. The parcel boundaries were used as a basic spatial unit for vegetation analysis.
2.3. Methods
This study included four main steps (
Figure 2). First, the vegetation height model (VHM) was calculated as a difference between DSM and DTM, and constrained to the areas of old and new succession and stable forest. The VHM was then analyzed for each vegetation patch within each cadastral parcel, by intersection of the respective polygons. In order to ensure a representative number of VHM pixels, only parcels that were larger than 100 m
2 and vegetation patches larger than 1 m
2 were considered. In the second step, for each vegetation patch within a cadastral parcel, mean vegetation height, and percentage of covered parcel area were calculated. Moreover, the patches were assigned the following environmental characteristics calculated based on DTM and forest mask: mean elevation, mean slope, dominant aspect, and proximity to forest at each period. The environmental indices were reported by several authors as influencing vegetation development. For instance, higher elevations and northern aspect create unfavorable climatic conditions and limit sun exposure, and thus may impede vegetation development [
5,
7], and fields that are located in the neighborhood or closer to forest receive more seeds and thus are more prone to natural reforestation [
7].
Third, the influence of the site-specific environmental variables on successional vegetation development was assessed. For the old and new succession and stable forest patches, vegetation height, elevation, slope, aspect (categorized into northern, eastern, southern-, and western), proximity to forest, and parcel size were analyzed. Moreover, the relations between vegetation height and the other environmental characteristics were tested using Pearson’s correlations separately computed for the old and new succession and stable forest patches, and a multiple linear regression was calculated to predict vegetation height based on mean elevation, mean slope, dominant aspect, proximity to forest at each period, parcel area and percent of overgrown parcel area, with the time-period and aspect as categorized variables.
Fourth, the applicability of successional vegetation height as an indicator of land abandonment timing was investigated. Vegetation height was thresholded to discriminate between the two classes: low successional vegetation representing the new succession class, and high successional vegetation representing the old succession class. Based on vegetation height distribution for the old and new succession, a threshold vegetation height was set in the middle of the overlapping interquartile boxes to evenly distribute the non-evident vegetation patches. The threshold-based classification of all the studied successional patches was then compared to the real occurrence of successional vegetation (referred to as actual data). Correspondence between the classification results and the actual data was expressed in terms of overall, user’s, and producer’s accuracy, including their 95% confidence intervals [
27].
The in situ investigations aided in the analysis and interpretation of the results. They focused on the not cultivated agricultural land, and they included mainly observation, conversation with locals, and making photographic documentation.
3. Results
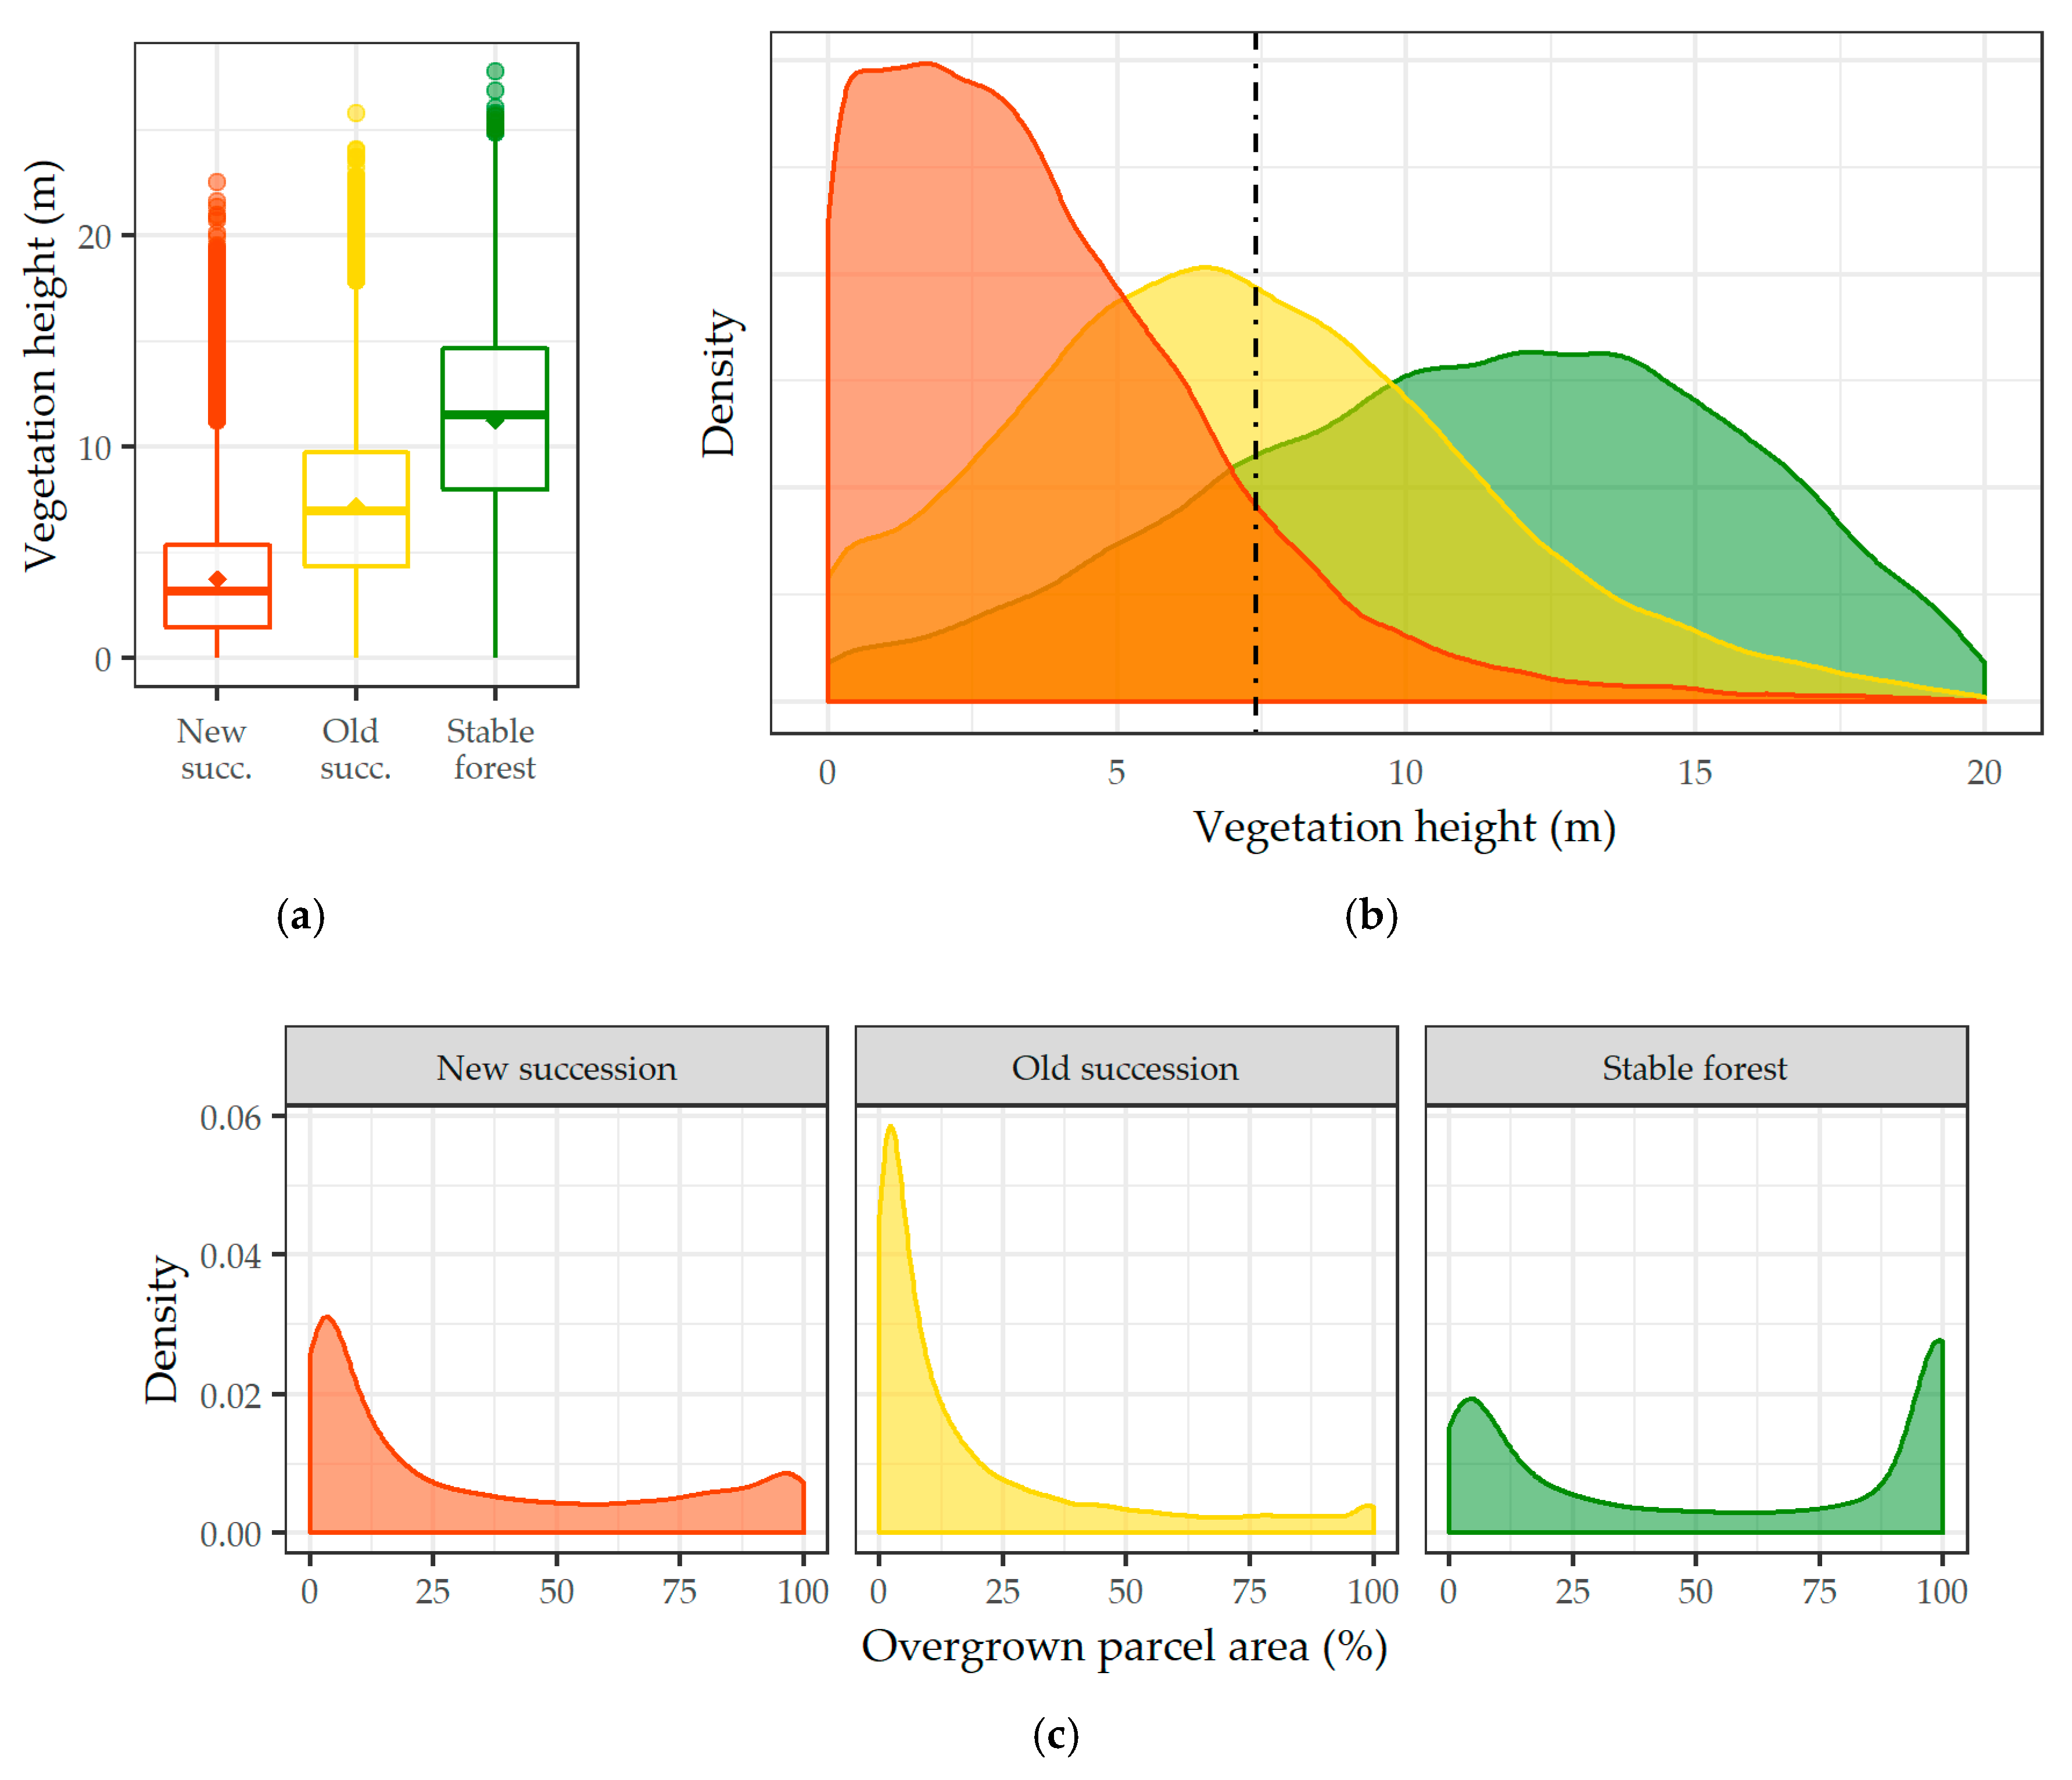
By 1997, successional vegetation had encroached on 7.5% (328.97 ha) of the total agricultural land in 1977 in the Budzów community. By 2009, succession was found to occupy 18.3% (797.22 ha) of the 1977 agricultural land. Additionally, 25.8% of 1977 agricultural land was overgrown by 2009. According to the number of patches, proportions of the old and new vegetation succession in the community were 41.8% (13,756 patches) and 58.2% (19,172 patches), respectively. Vegetation height distribution varied between new and old succession and stable forest (
Figure 3a,b). Successional vegetation of the 1997–2009 period showed the lowest heights among the investigated classes. Median vegetation height within patches was 3.2 m, with an interquartile range between 1.5 m and 5.4 m, with a maximum height of 22.5 m. Successional vegetation that occurred earlier, before 1997, was generally higher. Median height was 6.9 m, with an interquartile range between 4.4 m to 9.8 m and a maximum of 25.8 m. Stable forest patches were characterized by the highest vegetation, with a median height of 11.5 m, interquartile range between 8.0 m and 14.7 m, and the maximum of 27.7 m. Based on interquartile ranges and variance, the height of the new succession vegetation was more uniform than the old succession and stable forest showed the largest variety in height.
Surprisingly, old succession occupied smaller proportions of cadastral parcels than the new succession, at 20% and 34% on average, respectively (
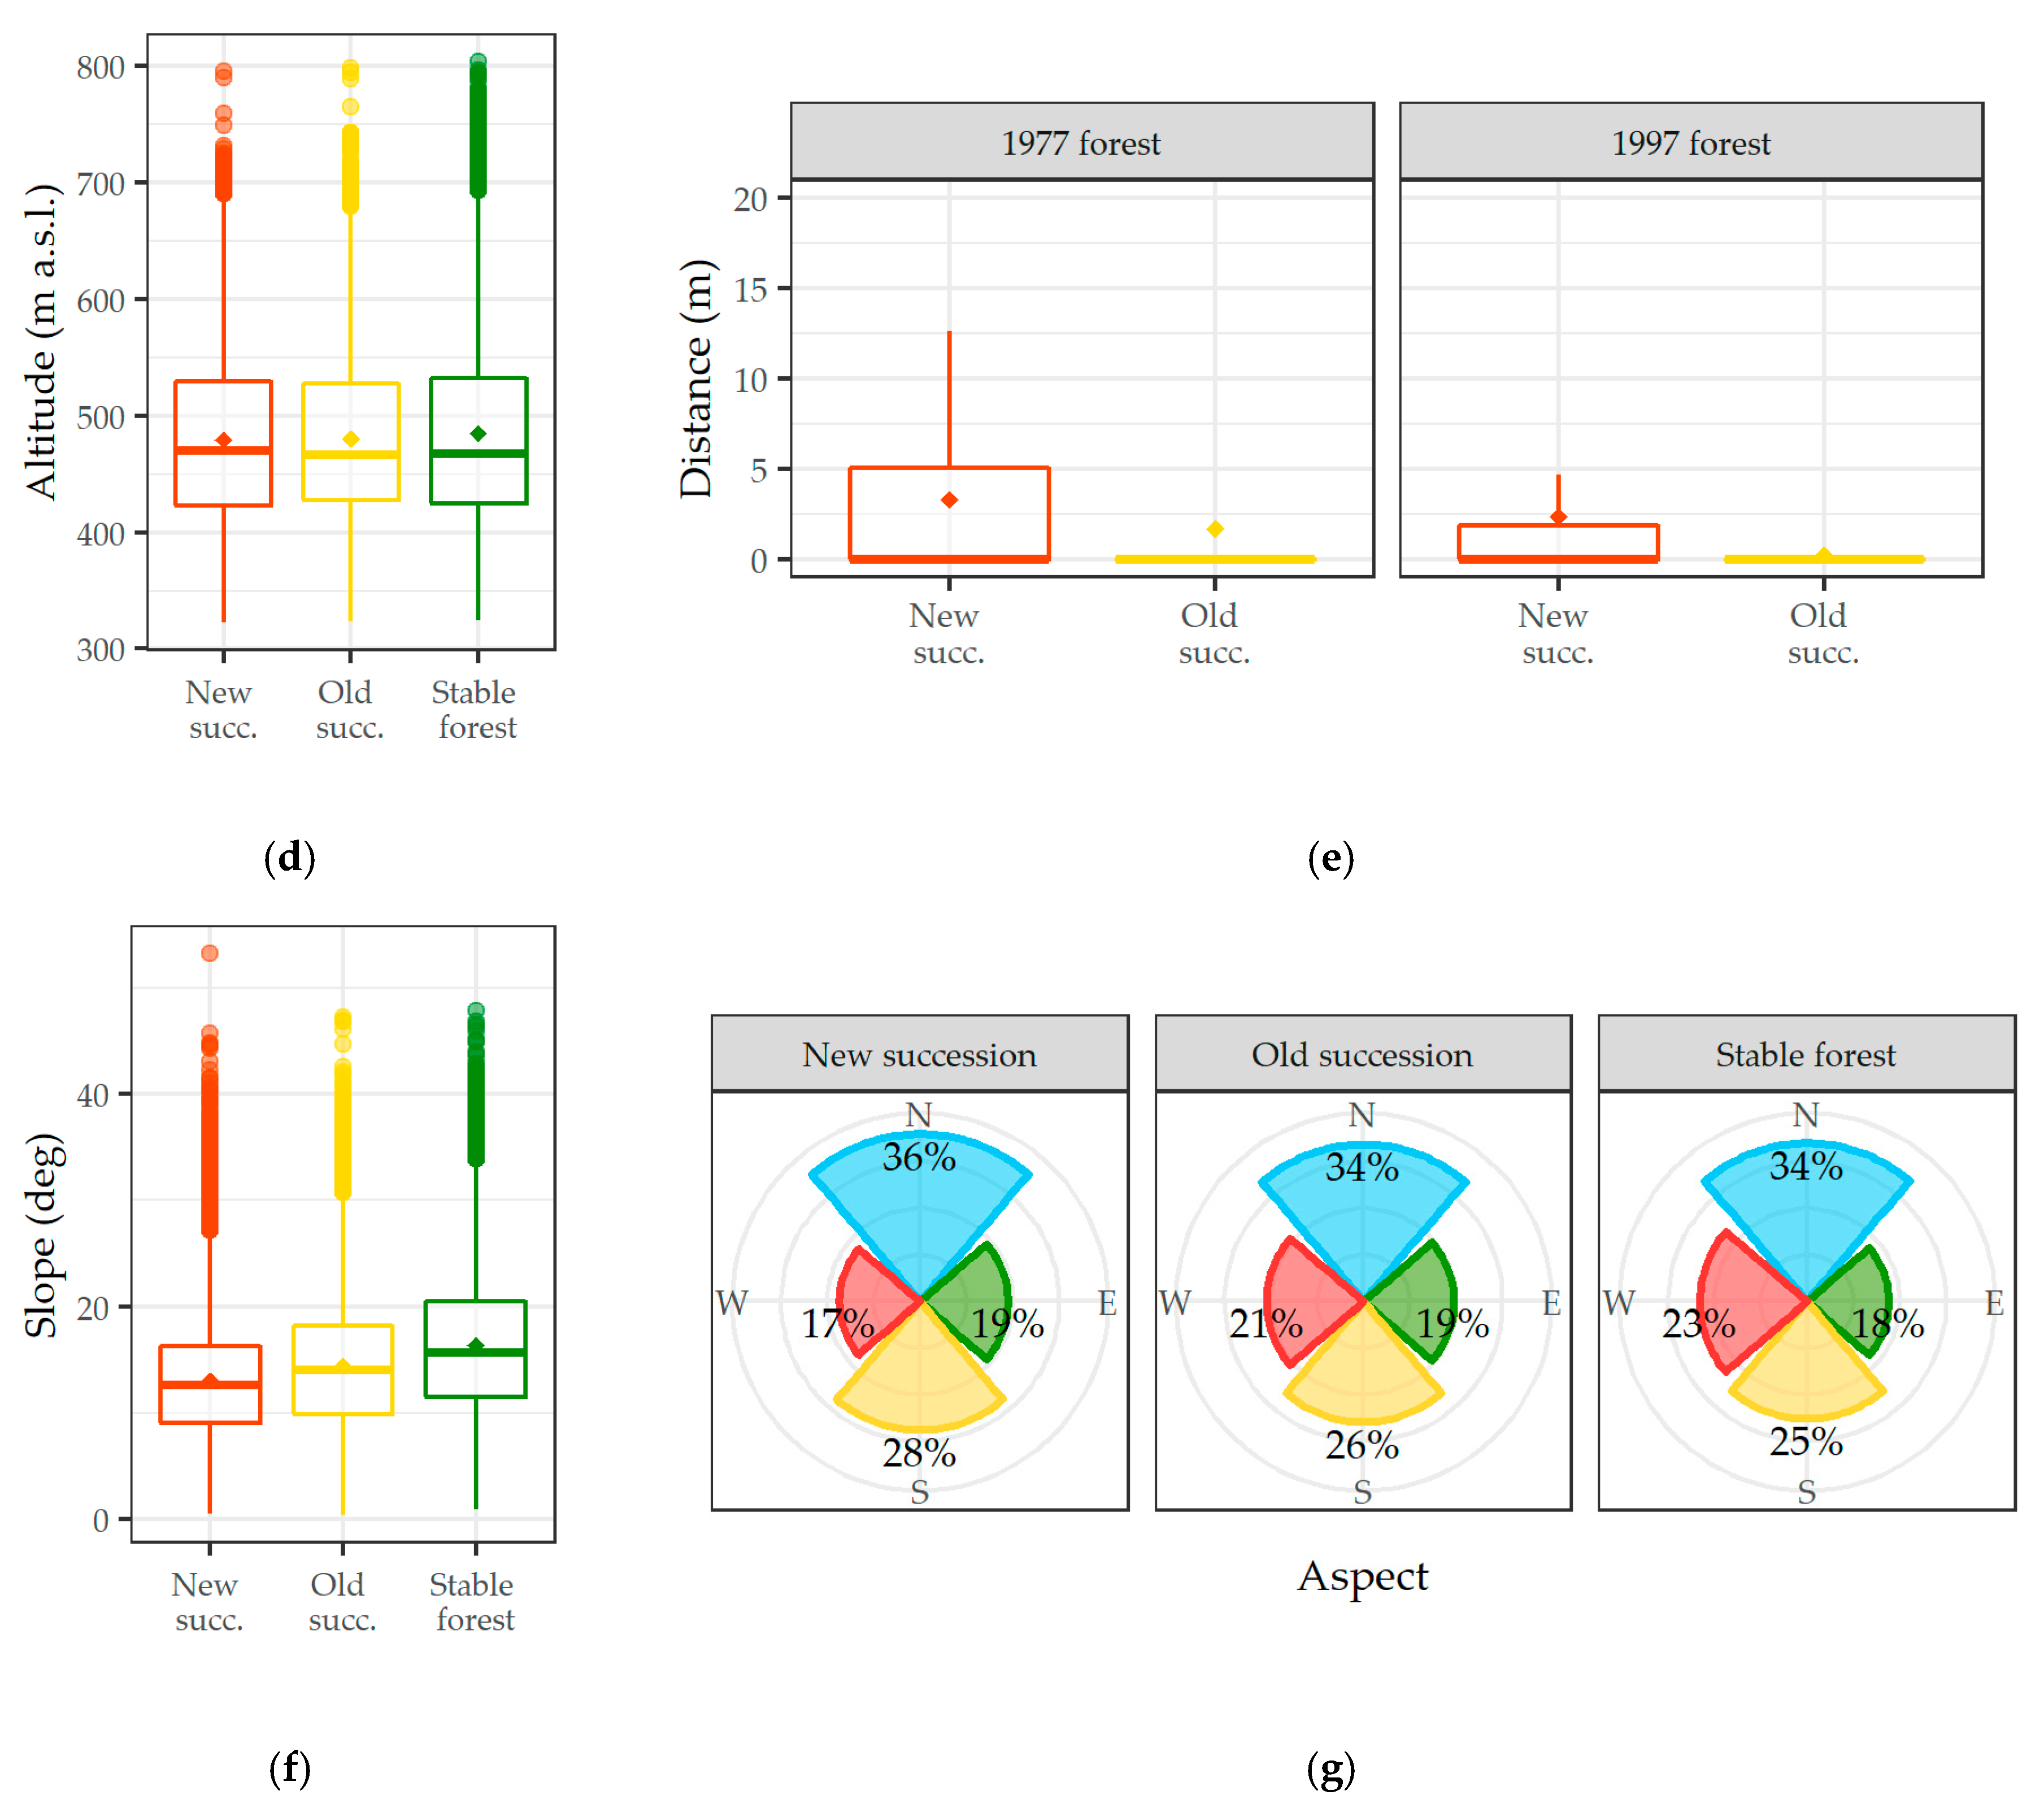
Figure 3c). Forest covered either very large or small portions of parcels. The vegetation patches of the new and old succession and stable forest were located on similar elevations (means of 479 m, 480 m, and 485 m a.s.l., respectively), and they occupied mainly northern and southern slopes. Stable forest covered the steepest pieces of land (16.4°), whereas the old and new succession patches occupied more gentle slopes (14.1° and 13.1°, respectively;
Figure 3d,f,g). In both periods, nearly half of the succession patches were adjacent to the forest boundary: 58.5% for 1977–1997 and 52.0% for 1997–2009 (
Figure 3e). The remaining patches of the old and new succession had a median distance (interquartile range) from the forest edge of 22.6 m (6.1 m to 54.0 m) and 16.6 m (5.1 m to 39.4 m), respectively.
For patches of stable forest, and old and new succession, vegetation height was positively correlated with elevation (r = (0.15, 0.05, 0.16),
p = (0.96, 0.73, 0.96), respectively) and slope (r = (0.22, 0.14, 0.16),
p = (0.81, 0.66, 0.56), respectively), and almost zero correlation was observed with cadastral parcel size (r = (0.04, 0.04, 0.02),
p = (0.54, 0.77, 0.99), respectively). Vegetation height in old and new succession were negatively correlated with distance to the 1977 (r = (−0.15, −0.07),
p = (0.35, 0.21)), and 1997 (r = (−0.18, −0.08),
p = (0.32, 0.19)) forest edges. The old succession showed low negative and the new succession low positive correlations between vegetation height and percent of overgrown parcel area (r = −0.10,
p = 0.94 and r = 0.10,
p = 0.52, respectively). None of the correlations were significant. Multiple regression analysis indicated that approximately 45.9% of variance in vegetation height is explained by environmental variables. A significant regression equation was found (F(11, 53,996) = 4161,
p < 0.000), with an R
2 of 0.459 (
Table 1). The regression coefficients showed that the northern slopes were covered by the lowest, and the western slopes by the highest vegetation. However, the T-test results showed that only the differences between vegetation height on northern and eastern slopes are significant. Vegetation heights within the old and new succession were much lower than that of the stable forest, 2.8 m and 6.3 m, respectively.
The vegetation height threshold discriminating the old and new succession classes was found to be 7.6 m. The new succession class delimited based on vegetation height showed much better producer accuracy than the old succession class (89.4 ± 1.0% and 43.8 ± 0.8%, respectively), but slightly lower user accuracy (68.9 ± 0.6% and 74.8 ± 0.4%, respectively) (
Table 2 and
Figure 4). The overall classification accuracy was 70.4%. According to the classification results, vegetation occurred on 20.4% and 79.6% of total succession area before and after 1997, respectively. For the actual data, the respective values were 29.2% and 70.8%, respectively. In relation to agricultural land that was not overgrown at the beginning of the analyzed period (e.g., in 1977 for old succession and 1997 for new succession), classification results showed that the overgrown area constituted 5.3% and 22.3%, and the actual data reported 7.5% and 19.8%, respectively (
Table 3).
4. Discussion
This study investigated the relationship of the height of successional vegetation to the date the vegetation started to develop. The index was proven to be effective in estimating the timing of agricultural land abandonment for three main reasons. First, the successional vegetation that started development before and after 1997 differed in terms of their heights. The old succession was more than twice as high as the new succession and the heights were more varied. Moreover, the vegetation height was much lower than the stable (mature) forest (
Figure 3). At the initial succession stages, the height of vegetation increases quite slowly, as the pioneer species consist of annual plants and grasses [
6]. Over time, vegetation development accelerates as the site is colonized by shrubs and trees, which may grow higher. In the Polish Carpathians, frequent pioneer shrubs include hazel, sloe, and azarole, which grow up to four meters. Frequent pioneer trees include pine, birch, oak, and spruce, which, by the age of 20, reach heights of 5.1 m, 7.7 m, 5.4 m, and less than 2 m, respectively [
28,
29,
30,
31]. The abundance of species that encroach on unmanaged arable land and pastures creates a composition of various plant heights, sizes, and distribution that is more uniform during the early stages and more varied at time progresses
Second, the study showed that environmental characteristics were not related to successional vegetation height. No influence on vegetation height or abandonment timing was found, even though the northern aspect is assumed to create unfavorable climatic conditions and limit sun exposure, and thus may impede plant development [
5,
7]. In Budzów, agricultural land ranges mostly from valley bottoms up to the forest-agricultural boundary. Thus, altitude varies little, which does not change climatic conditions to the degree that could affect the rate of growth. The large valleys in the Budzów community have an east–west orientation, so most of the slopes have northern or southern exposure. The distribution of succession and forest patches in relation to aspect follows the communal statistics. The positive correlation between vegetation height and slope may be attributed to the spatial distribution of the three investigated vegetation classes. Stable forests, characterized by the highest plants, occupied the steepest slopes. New succession, which included the lowest plants, covered the gentlest slopes. The relation is, however, weak, as the correlation is low and not significant. Regardless, the low positive correlation between vegetation height and altitude and slope might suggest that agricultural cultivation on less favorable land was stopped earlier.
In both periods, more than half of the succession occurred in the vicinity of forests; however, new succession was more widespread and occupied many parcels surrounded by agricultural land. Contrary to expectations, old succession occupied a smaller fraction of parcels than new succession (
Figure 3). This finding was initially surprising, as it was presumed that plants could spread further from the starting locations, e.g., forest edge, adult trees, and shrubs, over longer periods. However, the in situ investigation showed that two types of vegetation regrowth are dominant in the Budzów community (
Figure 1b). The first type has a wide variety of plant species, heights, and ages, unevenly distributed over parcels, which may result from natural forest succession. This is more frequent within old succession, and can be linked to the ceasing agricultural activities after 1989 due to major socio-economic transformations in Central and Eastern Europe [
9]. The other, less frequent type, includes land plots or cadastral parcels fully covered by plants (mostly trees) of one species, and homogeneous height and age, which is likely due to afforestation. After 1990, the afforestation practices in Poland were regulated by the National Programme for Expanding of Forest Cover, introduced in 1995 and updated in 2003 [
32,
33]. The government subsidies encouraged private owners to afforest low-quality agricultural land. The process reached a peak in 2003, and rapidly declining after 2006, due to amended criteria for the allocation of private agricultural land for afforestation and the introduction of direct payments to active farmers after accession to the European Union in 2004 [
33,
34]. For that reason, many afforested parcels were detected in this study as vegetation regrowth between 1997 and 2009. The trees were usually planted on entire parcels, accounting for a higher proportion of the overgrown parcel area than the old succession. The afforested parcels, however, cover only a marginal area of Budzów the commune (20.5 ha according to [
21]), and thus only had a negligible impact on the results. In communes with more uniform proportion between the afforested parcels and the parcels that experienced succession, the two cases should be distinguished first. A possible solution to that problem is the careful analysis of the vegetation structure, e.g., using LiDAR point clouds [
35,
36].
The third point, which confirms the usability of successional vegetation height for estimating agricultural land abandonment timing, was the satisfactory overall accuracy (70%) of old and new succession threshold-based classification, despite the significant overlap in vegetation height ranges within the two classes (
Figure 3). This finding provides some support for the conceptual premise that successional vegetation height is an appropriate indicator of agricultural land abandonment timing. However, this result must be interpreted with caution for the two reasons. First, the study covered a relatively small area, and the results cannot be extrapolated to larger regions, such as the Polish Carpathians, without further investigation of how various environmental conditions influence vegetation height. Second, the input data were available only for three time moments and the in-between periods had very different lengths. Thus, there was a large variation in ages and height within each class, which could impede an accurate prediction when basing the classification on an exact threshold value.
Certainly, the heights resulting from this study should not be used literally, for example, to determine the exact age of plants by their height using linear interpolation. The results can be, however, used as a proof that, in homogeneous conditions, successional vegetation height may be used to estimate when agricultural land was abandoned and to compare the timing for other locations in the region. As the development of shrubs and saplings requires about five years [
7], the approximate abandonment date is circa five years earlier than the date the first successional shrubs and trees occur. More precise abandonment timing would be possible with denser and more uniform imagery time series of sufficient resolution that enables the detection and monitoring of subtle land use changes in highly fragmented agricultural landscapes with small scale farming, such as in the Polish Carpathians.
5. Conclusions
This study illustrated that vegetation height can potentially be used to estimate agricultural land abandonment timing. During the initial succession stages, the height of vegetation increases quite slowly and is more uniform. The development accelerates over time as shrubs and trees encroach on annual plants and grasses, creating a composition of various plant heights, sizes, and distributions. In areas of similar environmental characteristics, successional vegetation height was not related to environmental characteristics, such as elevation, slope, aspect, and proximity to forest. However, slope was a possible trigger for earlier abandonment due to hindering agricultural management, and a half of the succession patches occurred in the neighborhood of an existing forest. Prior to this study, the relationship between successional vegetation height and the timing of agricultural land abandonment in mountainous regions has not been discussed deeply enough. This study indicated that, in homogeneous conditions, the proposed method may be useful to estimate when agricultural land was abandoned. Future studies should focus on the application of the developed method to several mountain areas.


