The Reduction of CO2 Emissions by Application of High-Strength Reinforcing Bars to Three Different Structural Systems in South Korea

Abstract
:1. Introduction
2. Literature Review
3. Research Method
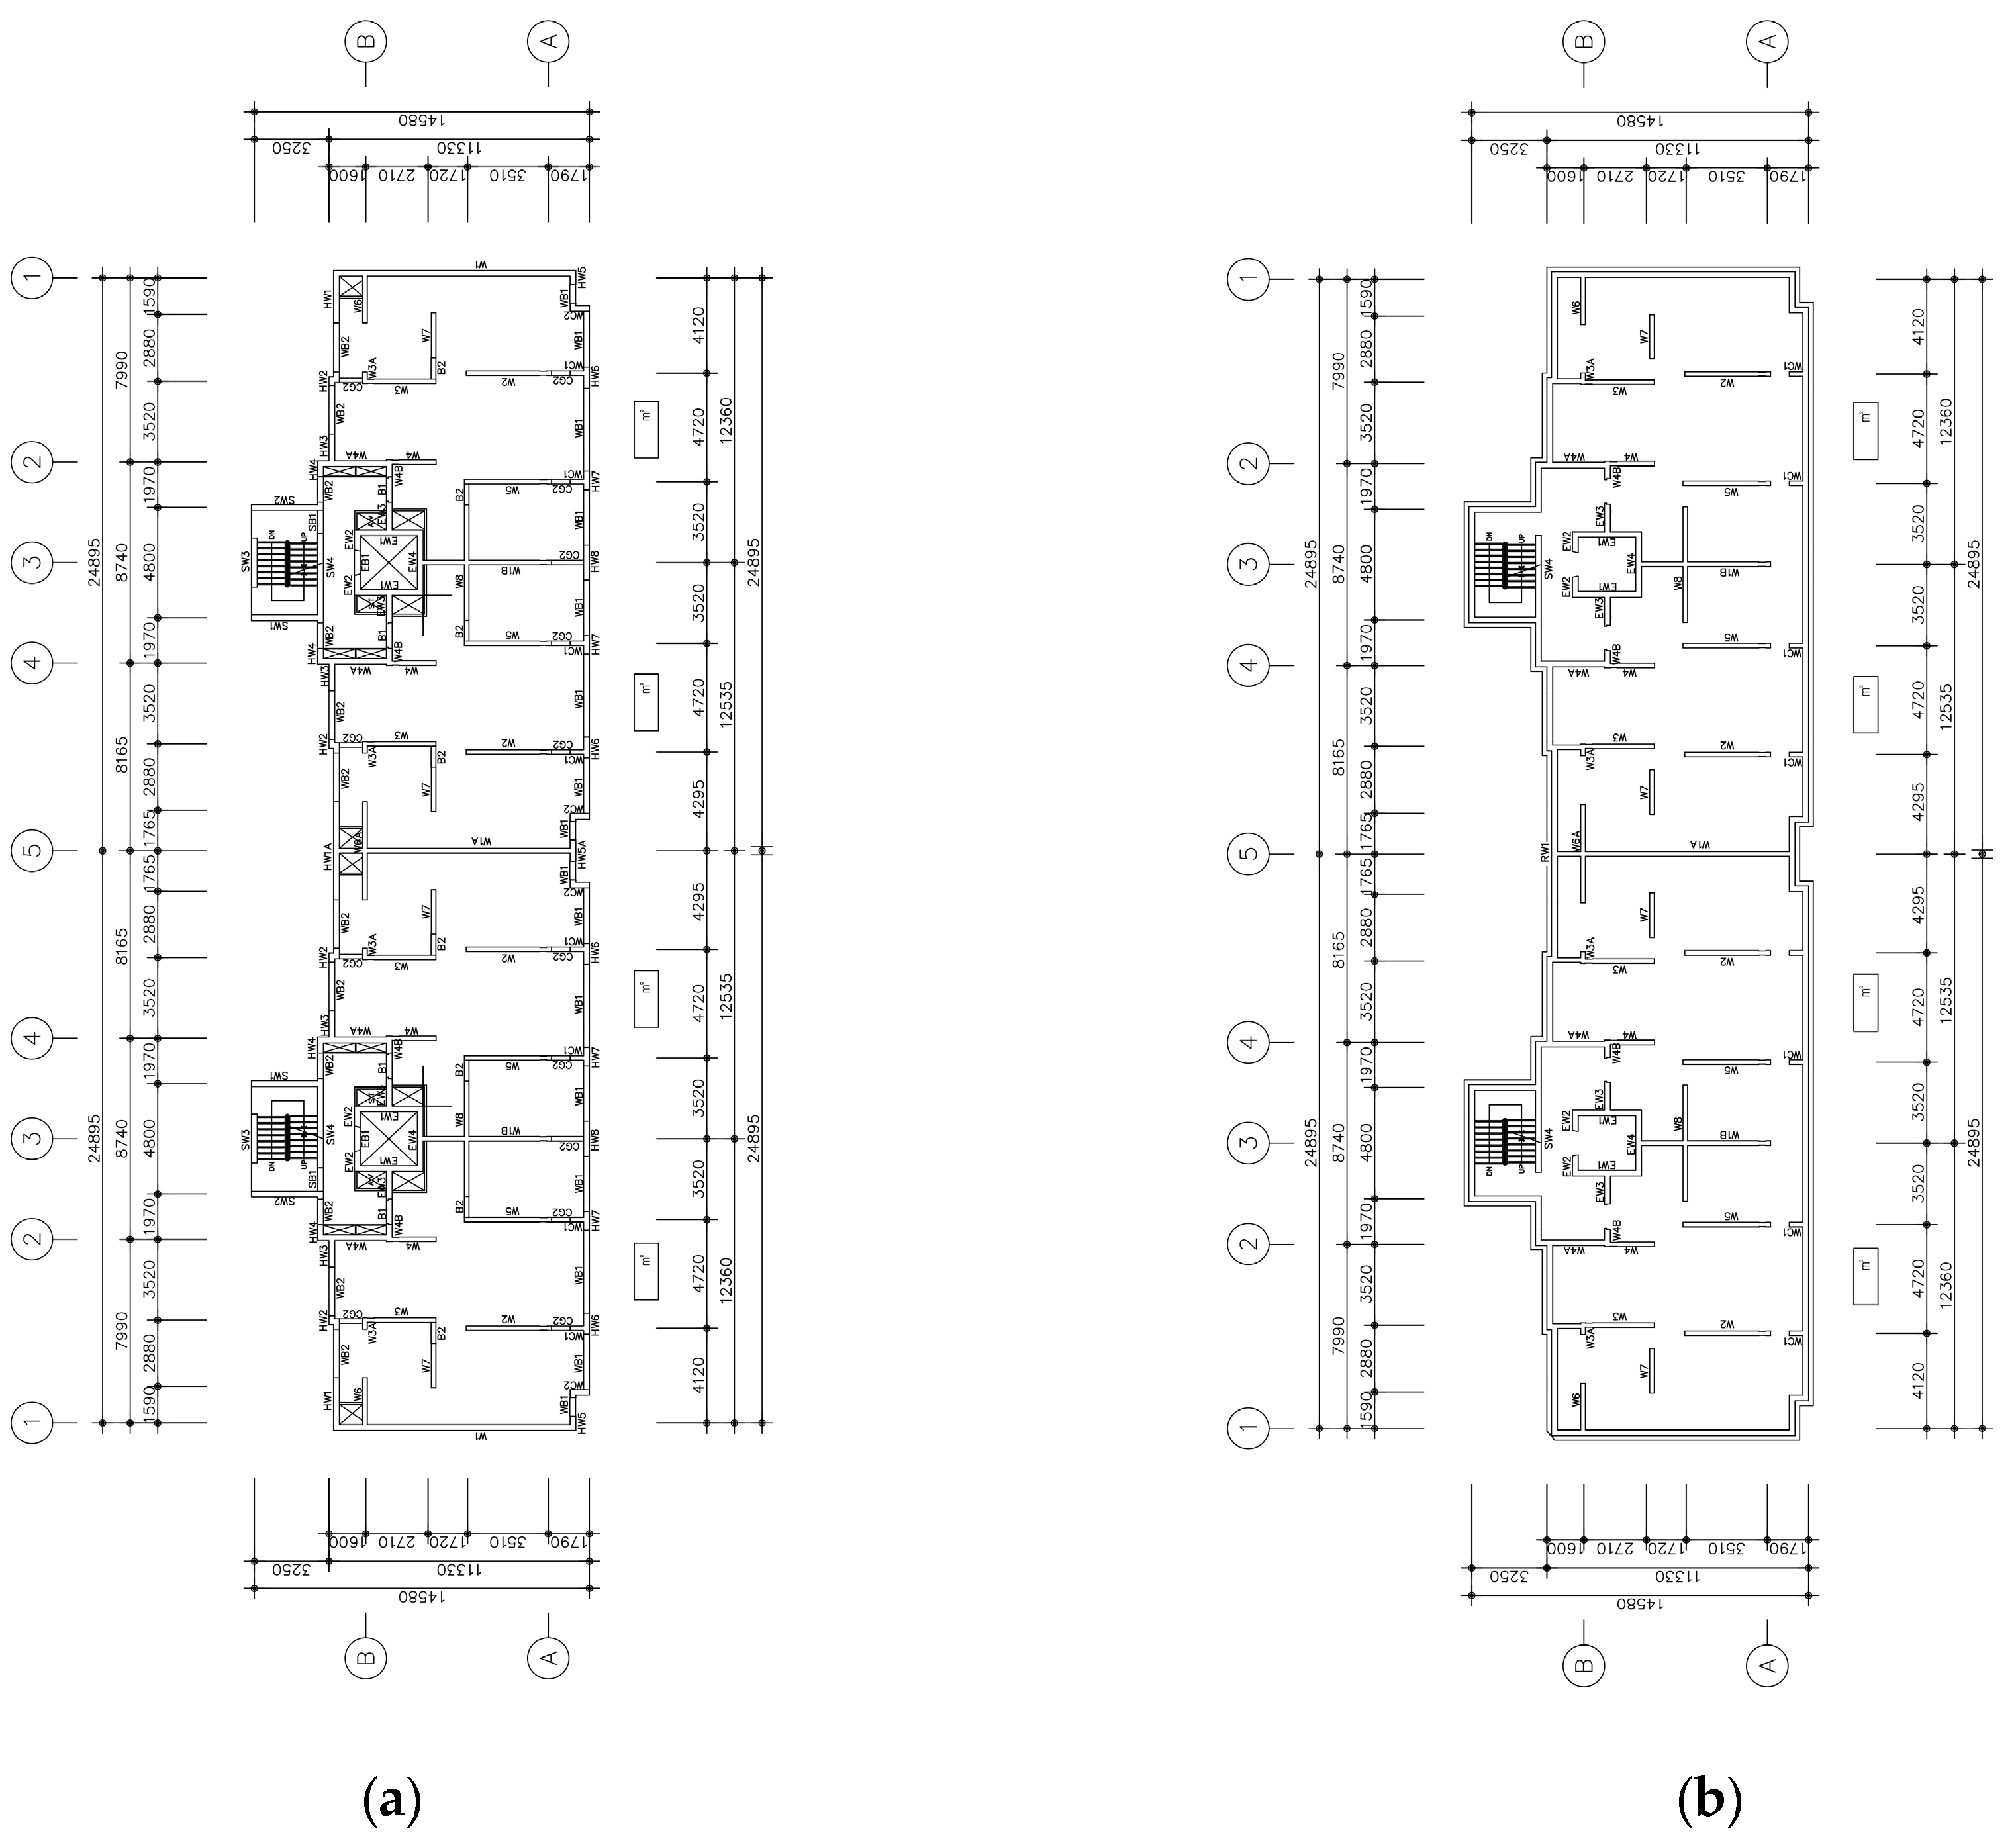
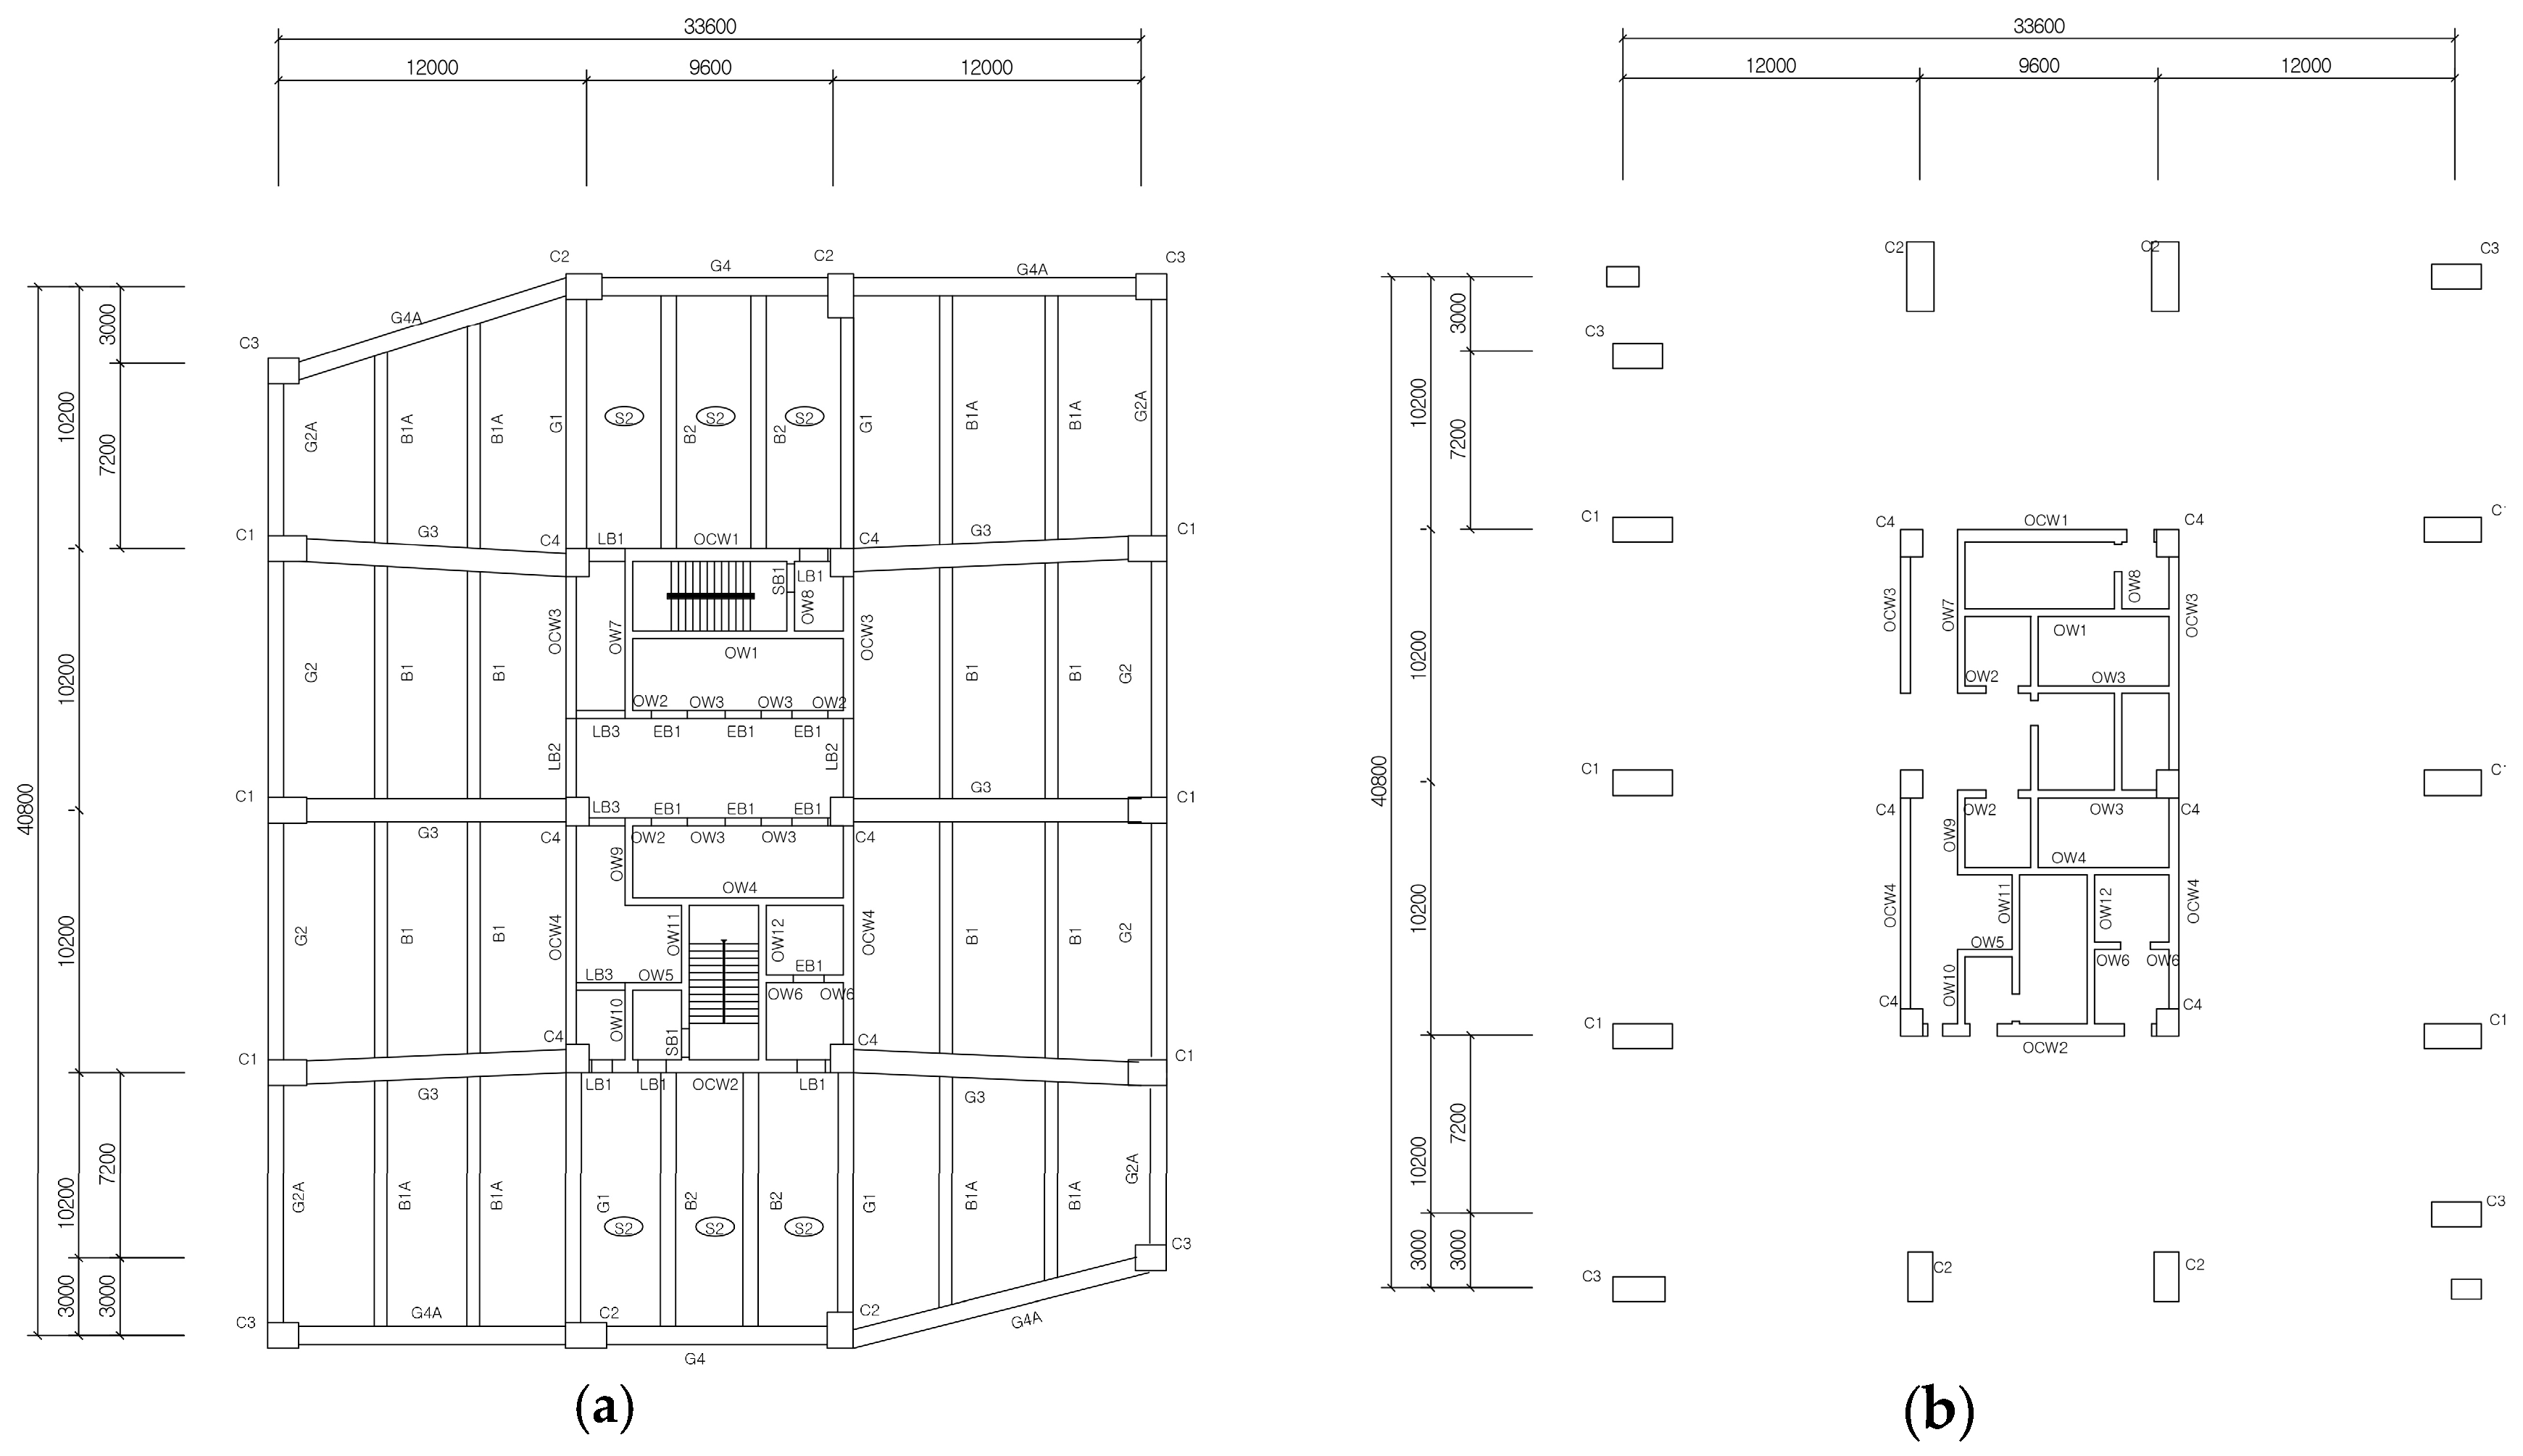
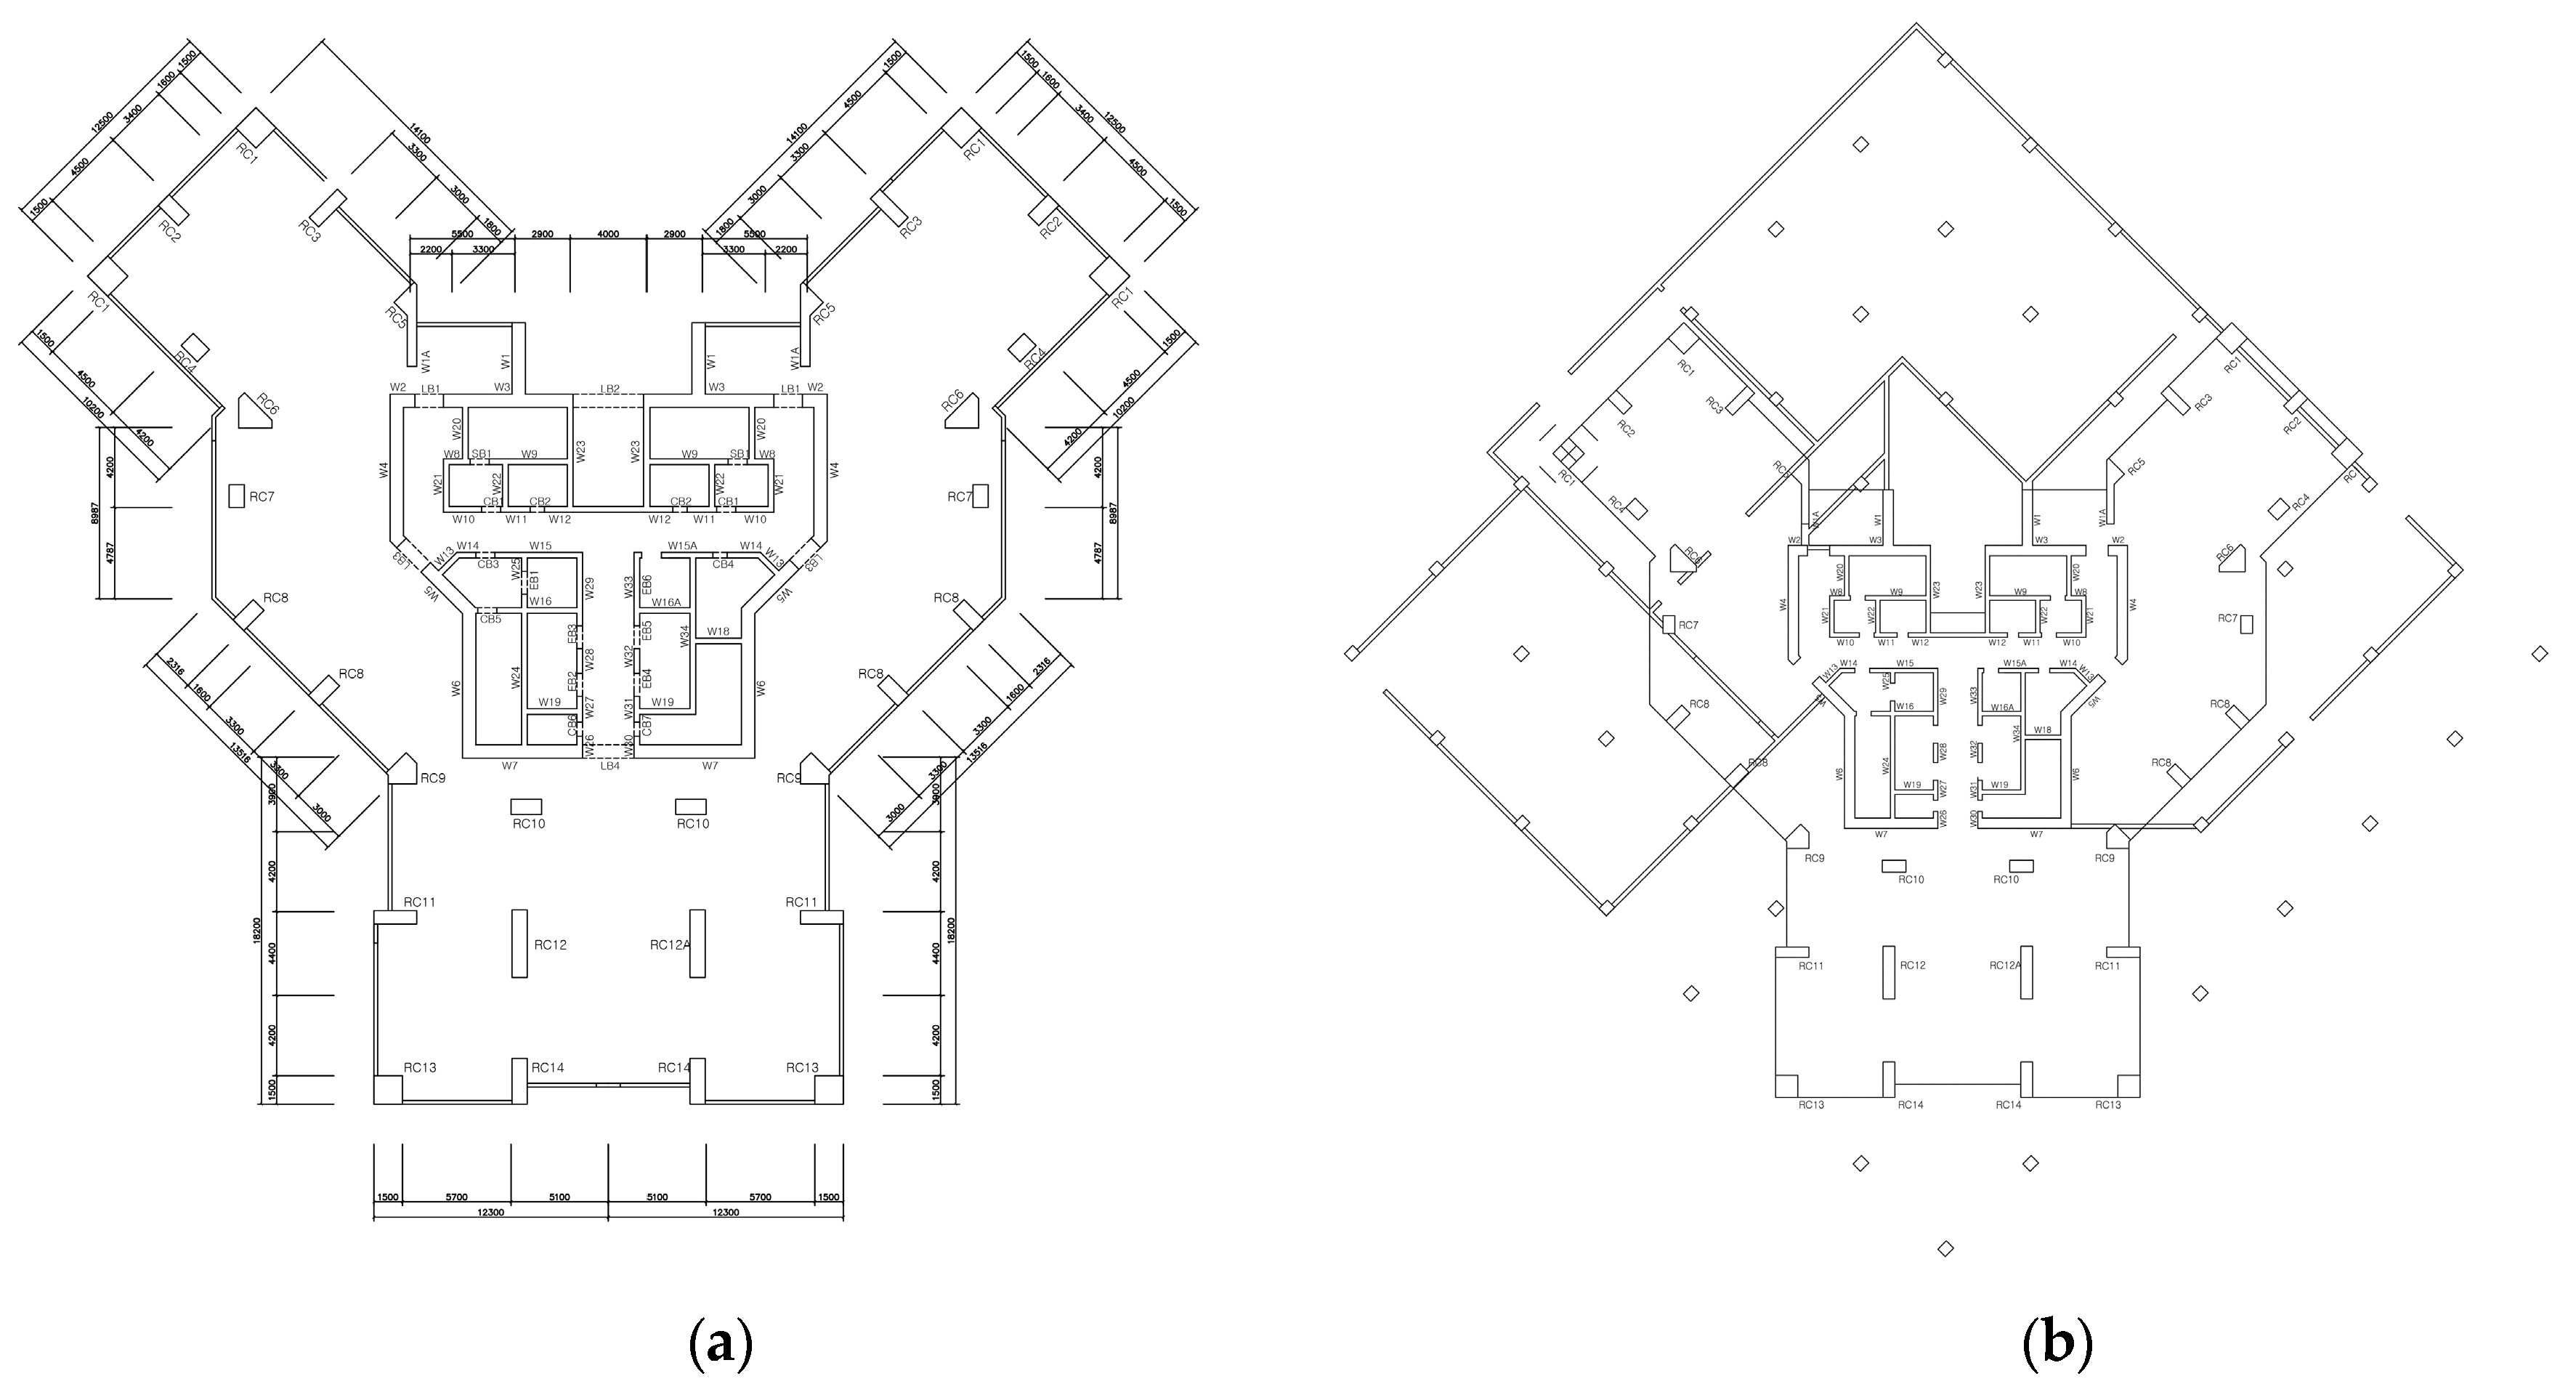
3.1. Calculating the Quantity of Re-Bars in the Different Building Structures
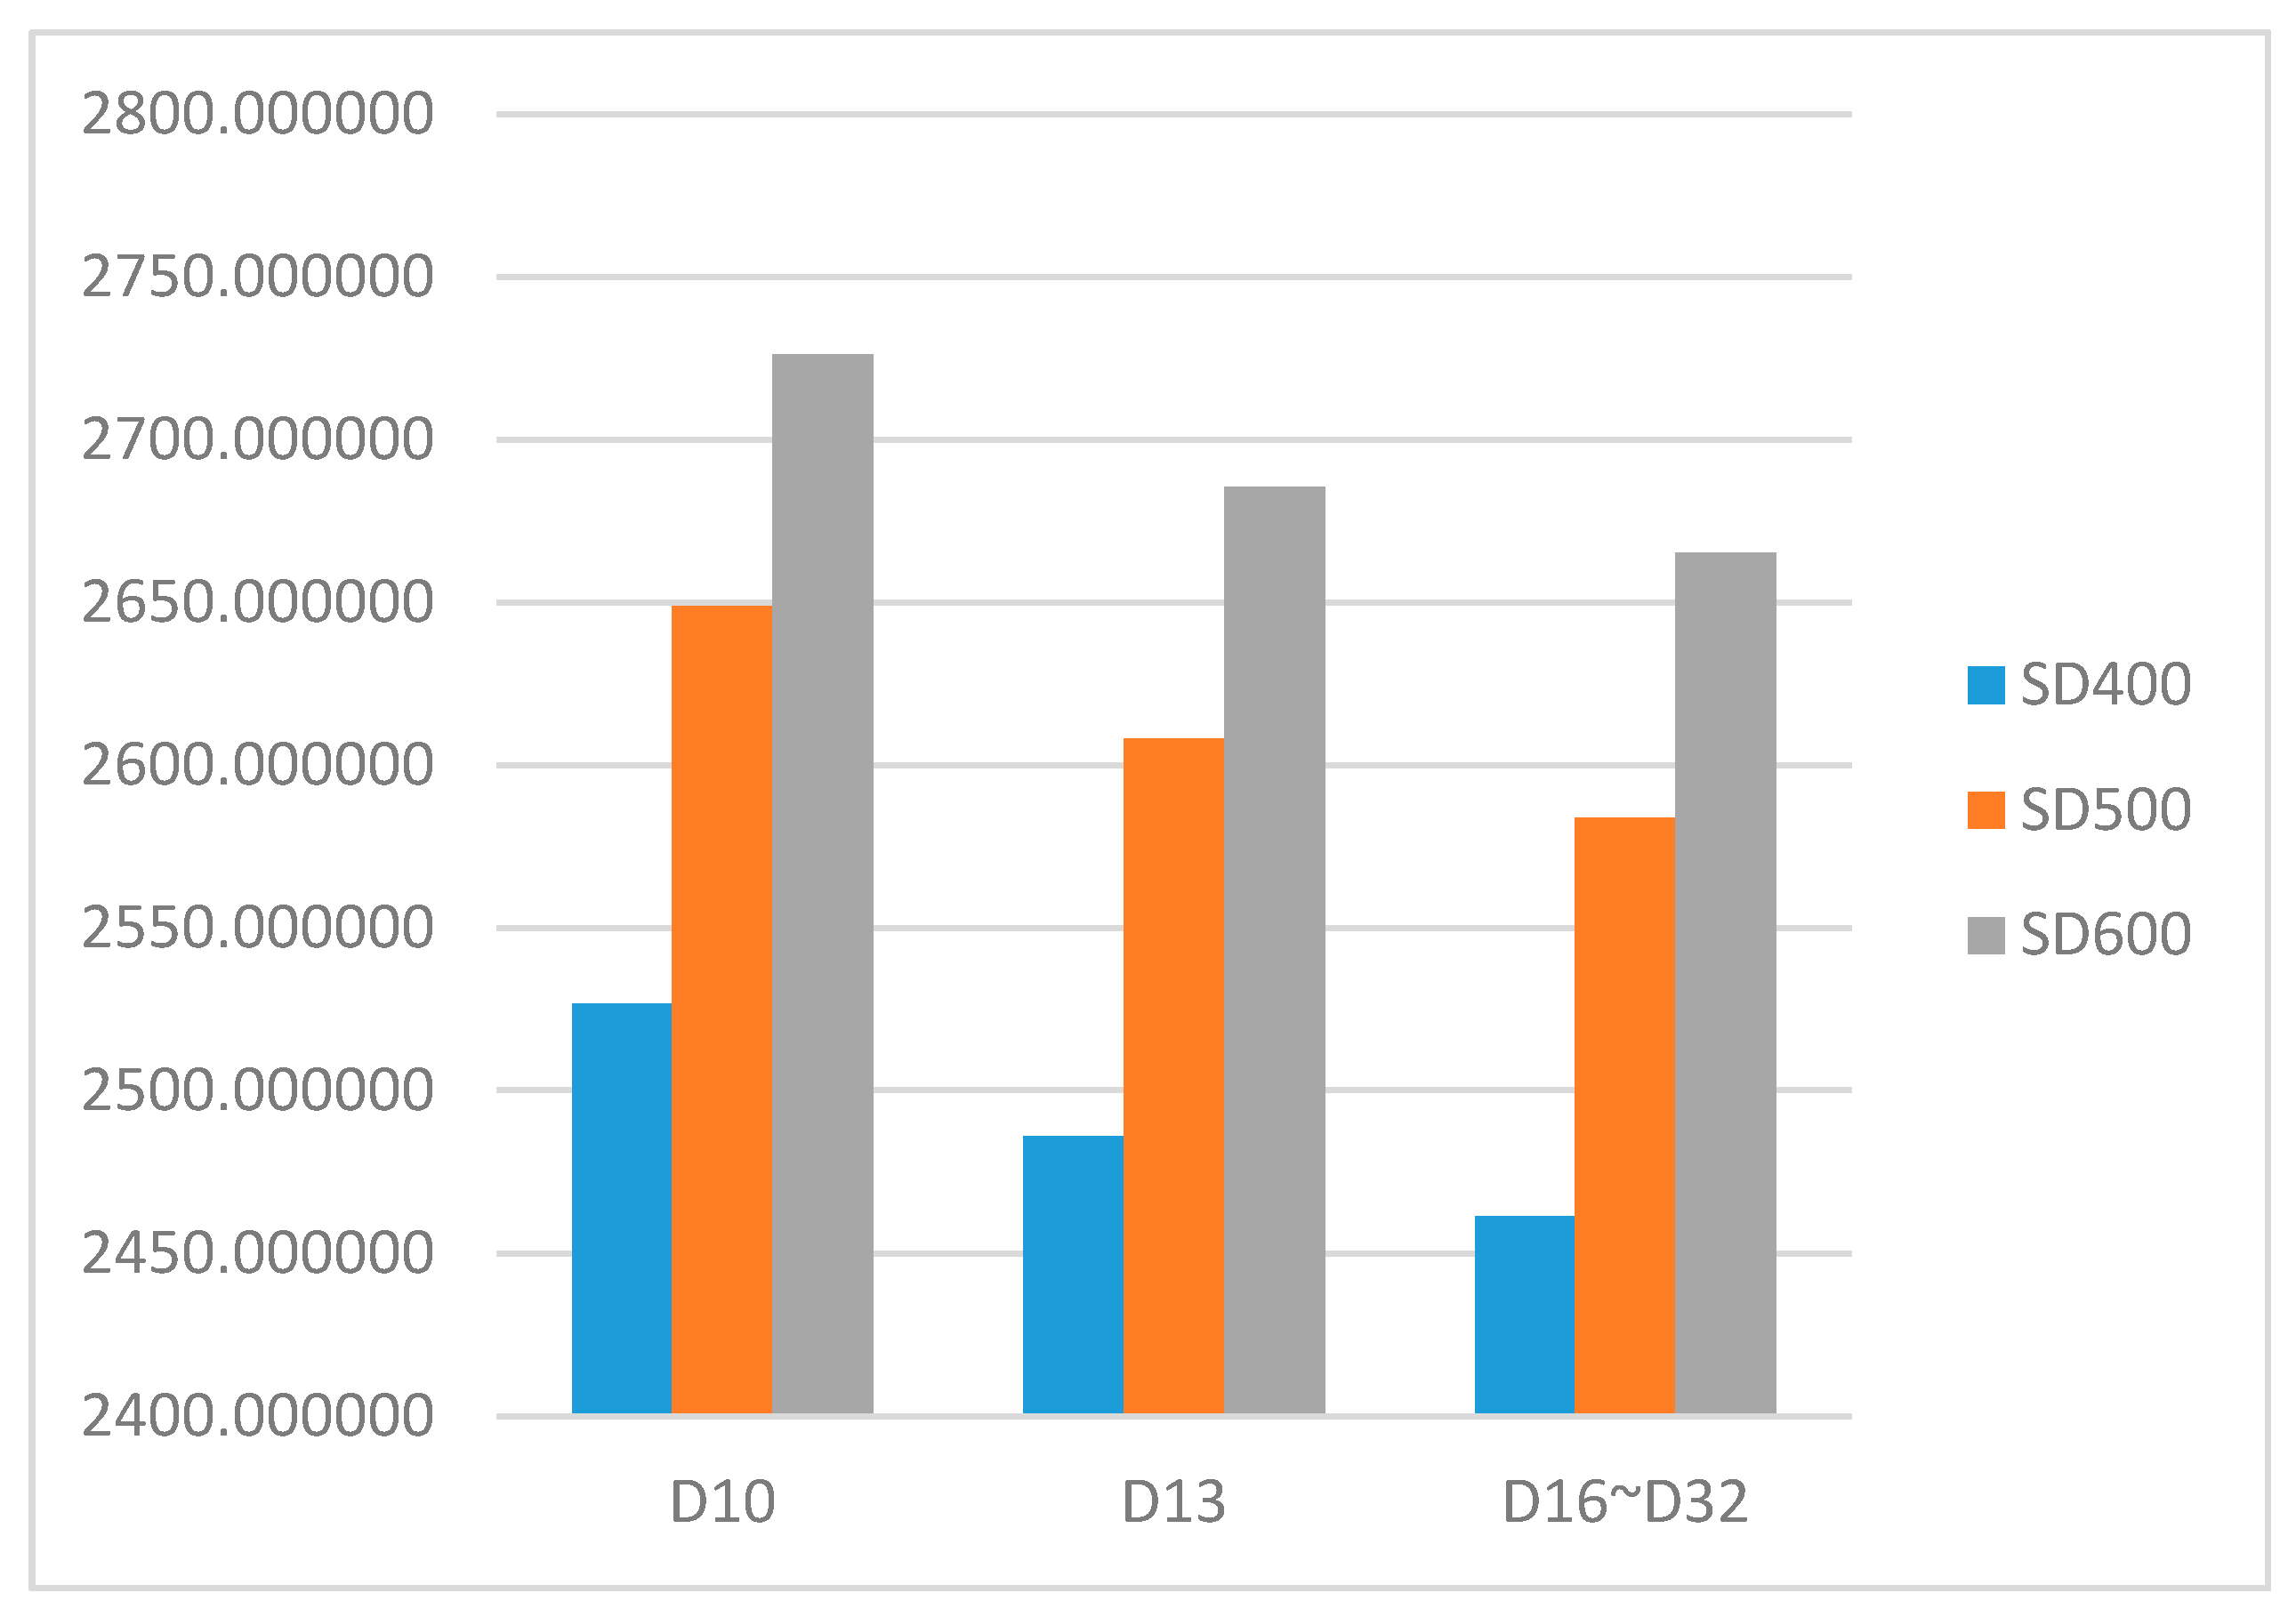
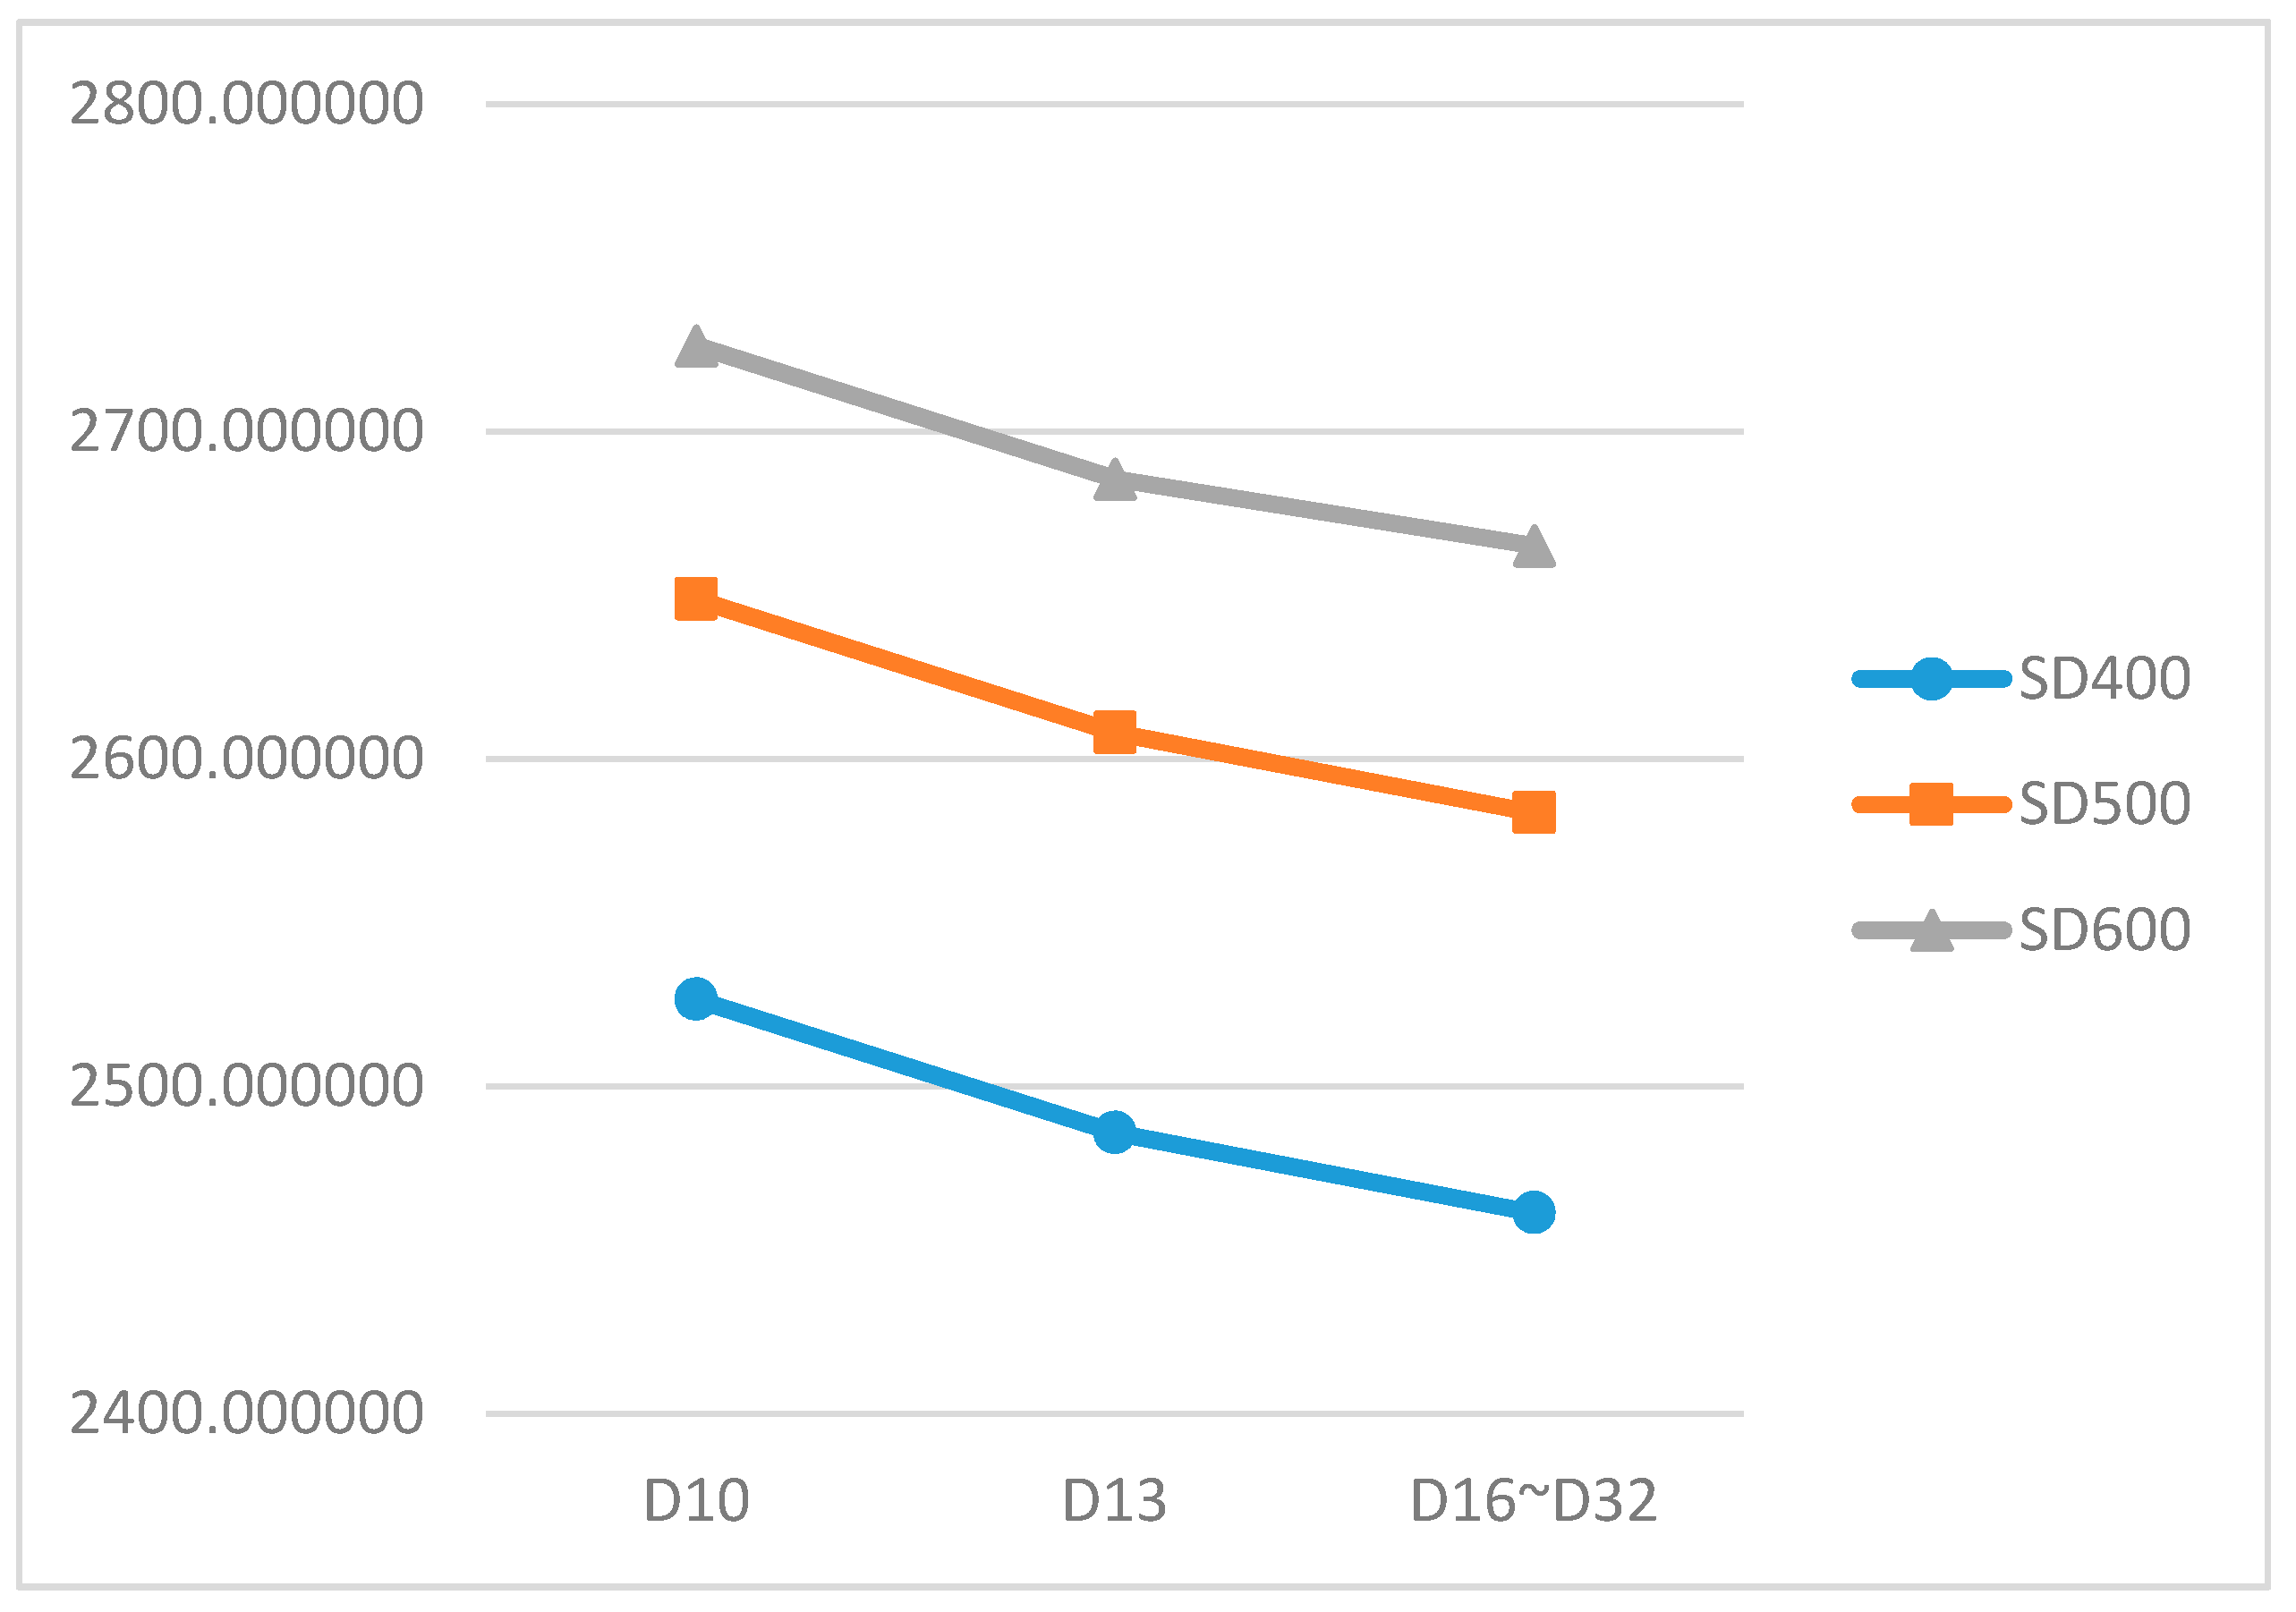
3.2. Calculation of Carbon Dioxide Emissions on Re-Bars by Using Yield Strength and Diameter
4. Data Analysis
4.1. Analysis of the Quantity of Reinforcement Bars
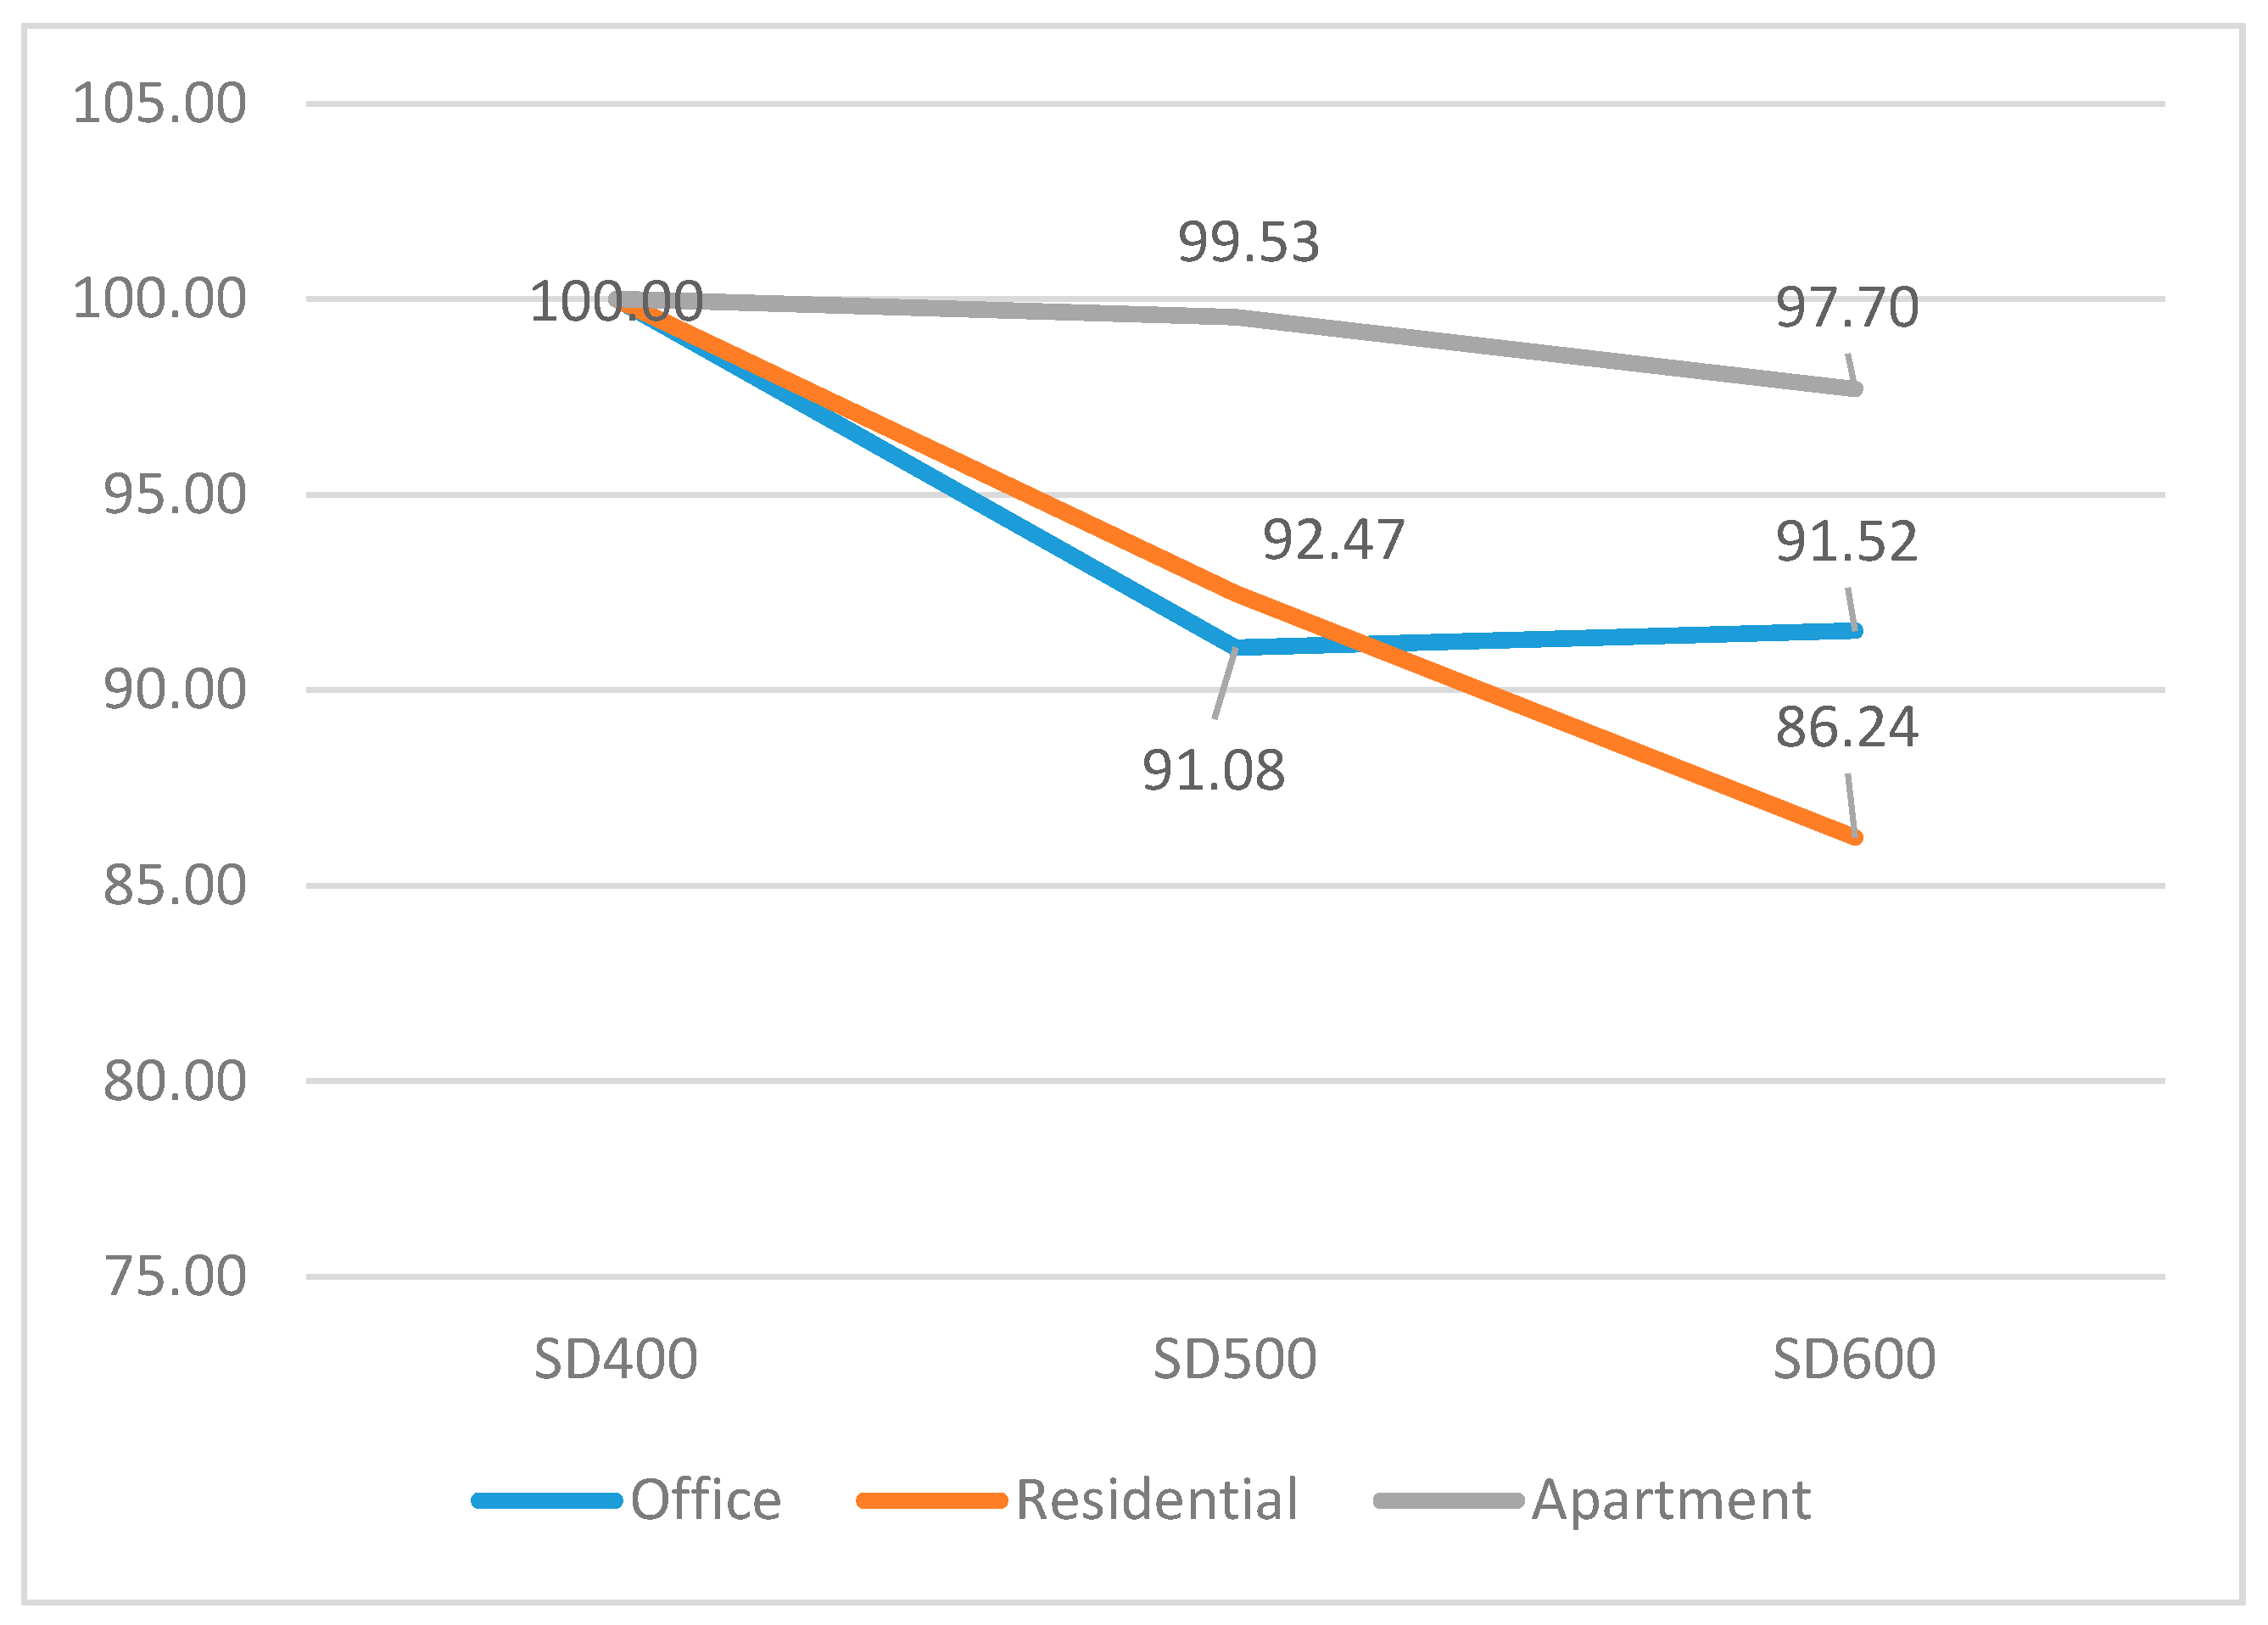
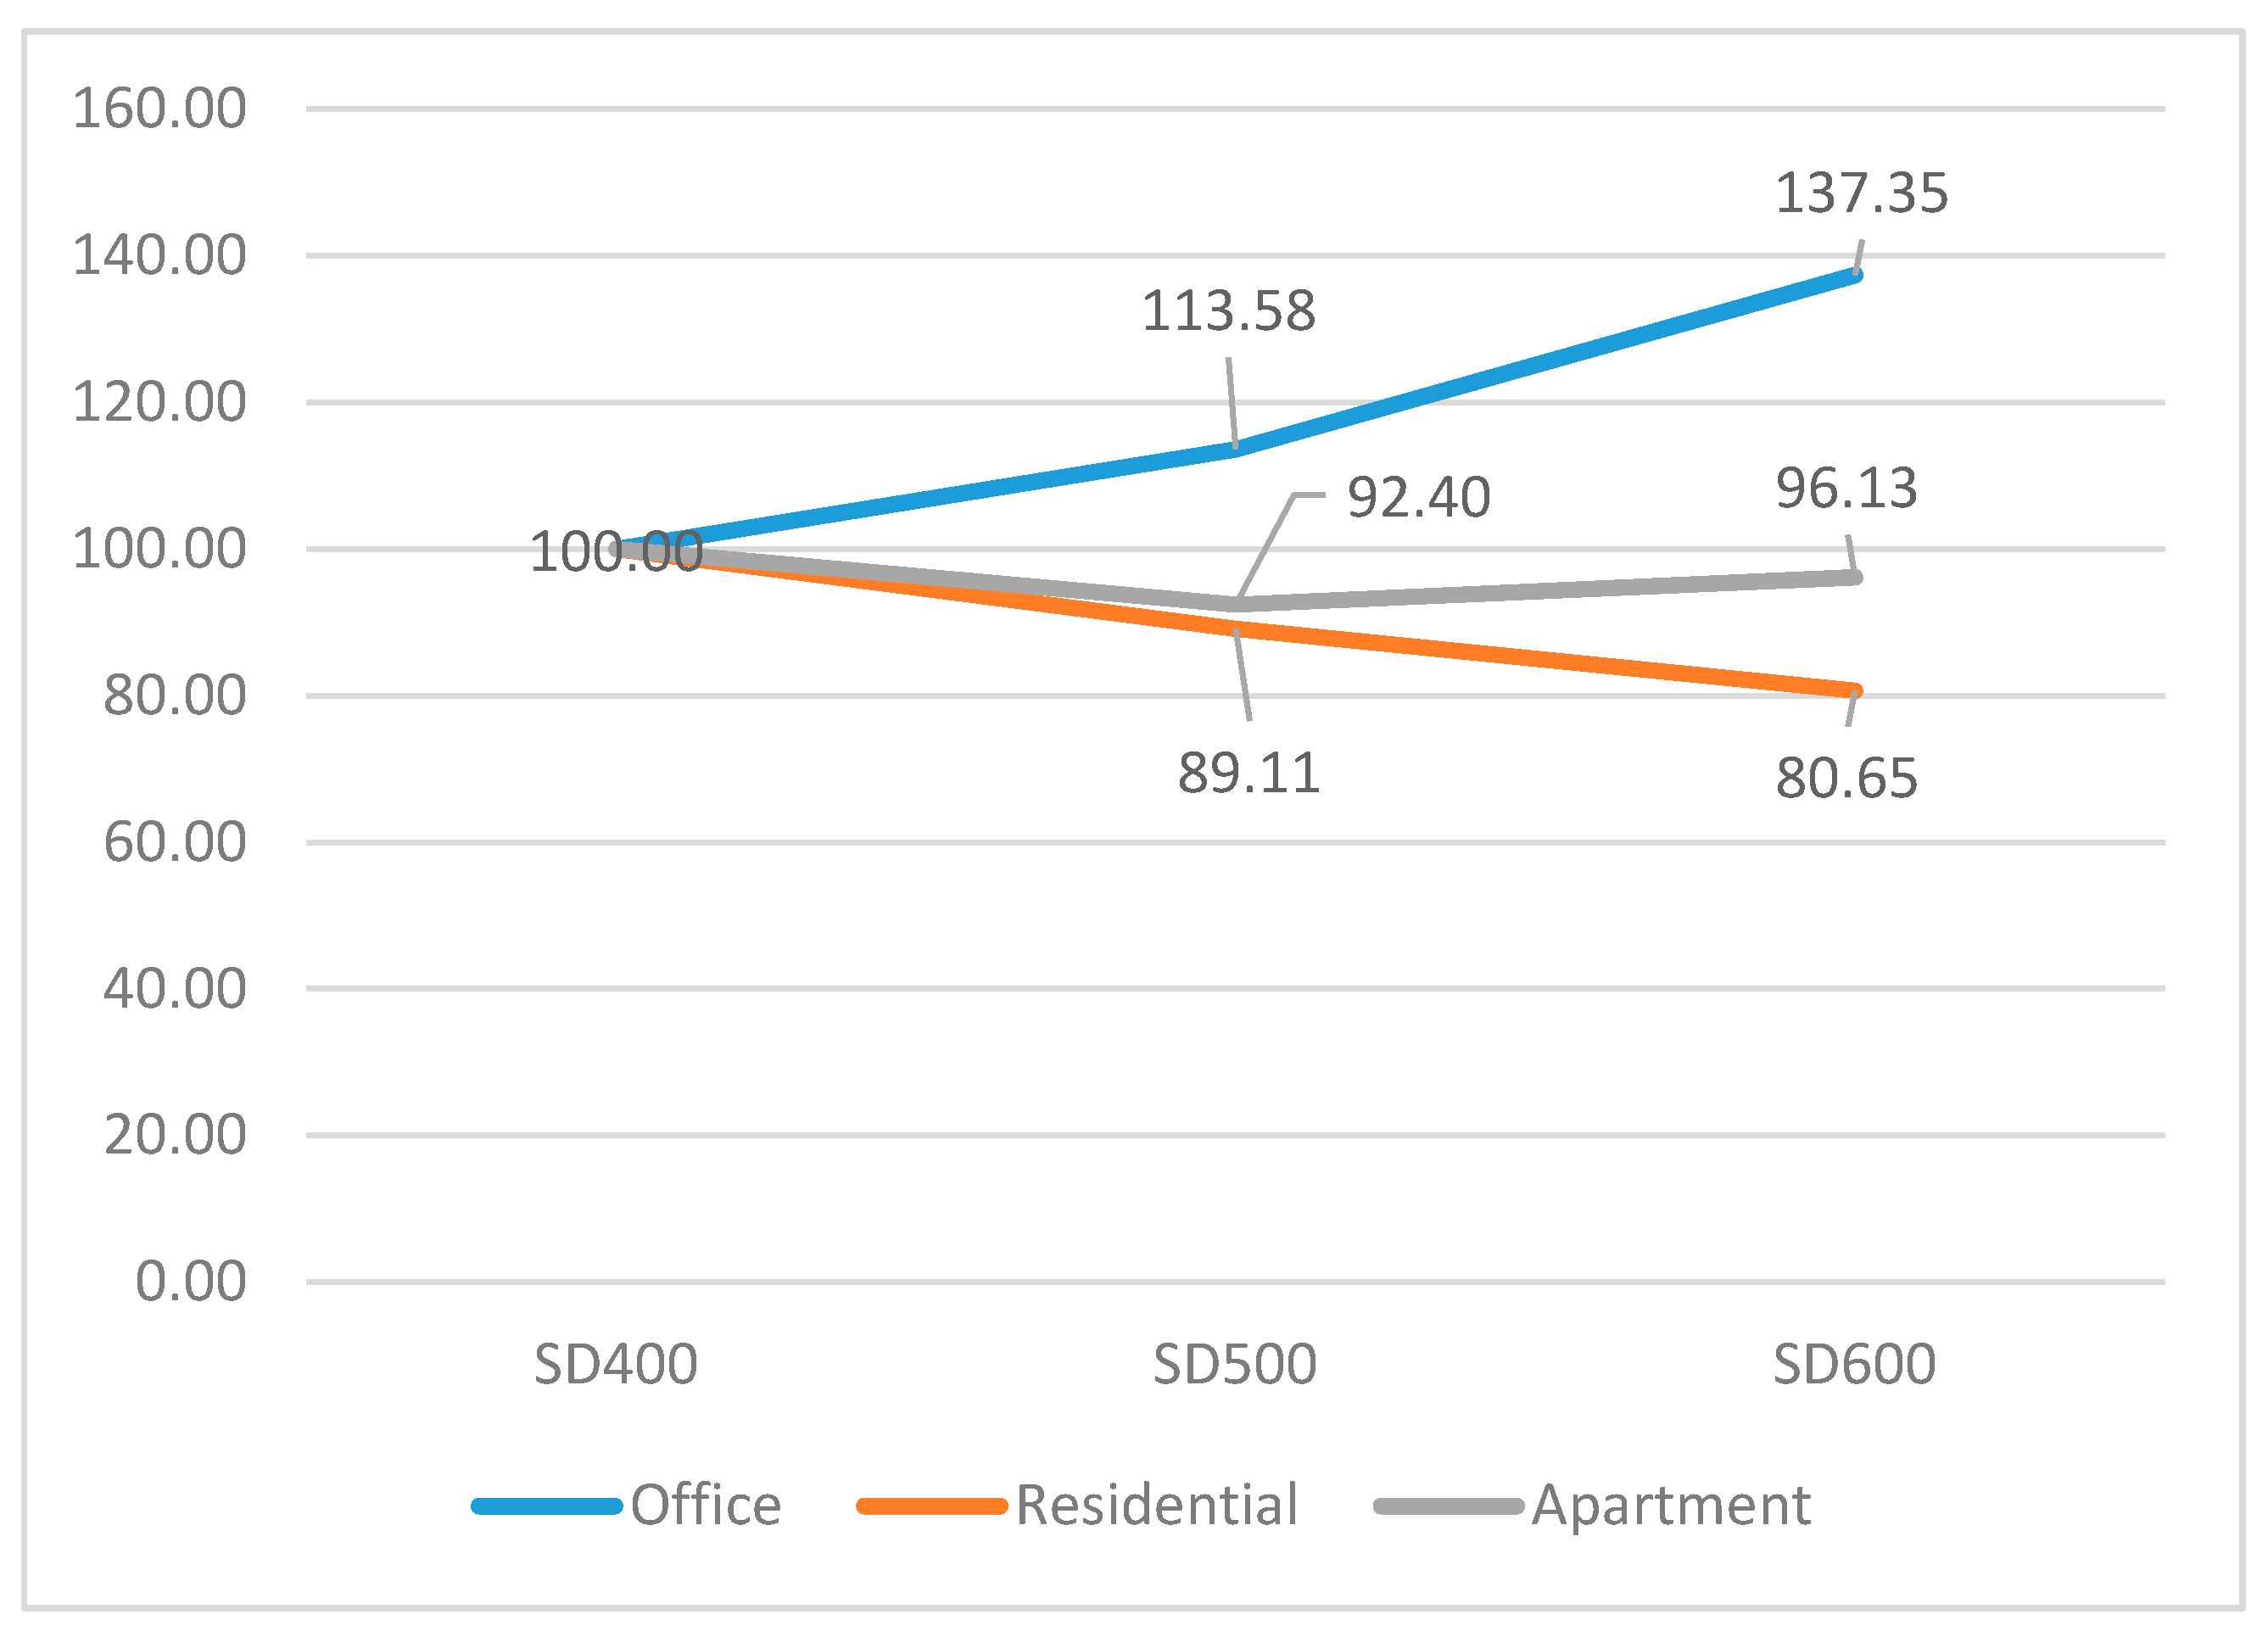
4.2. CO2 Emission Analysis of High-Strength Reinforcement Bars
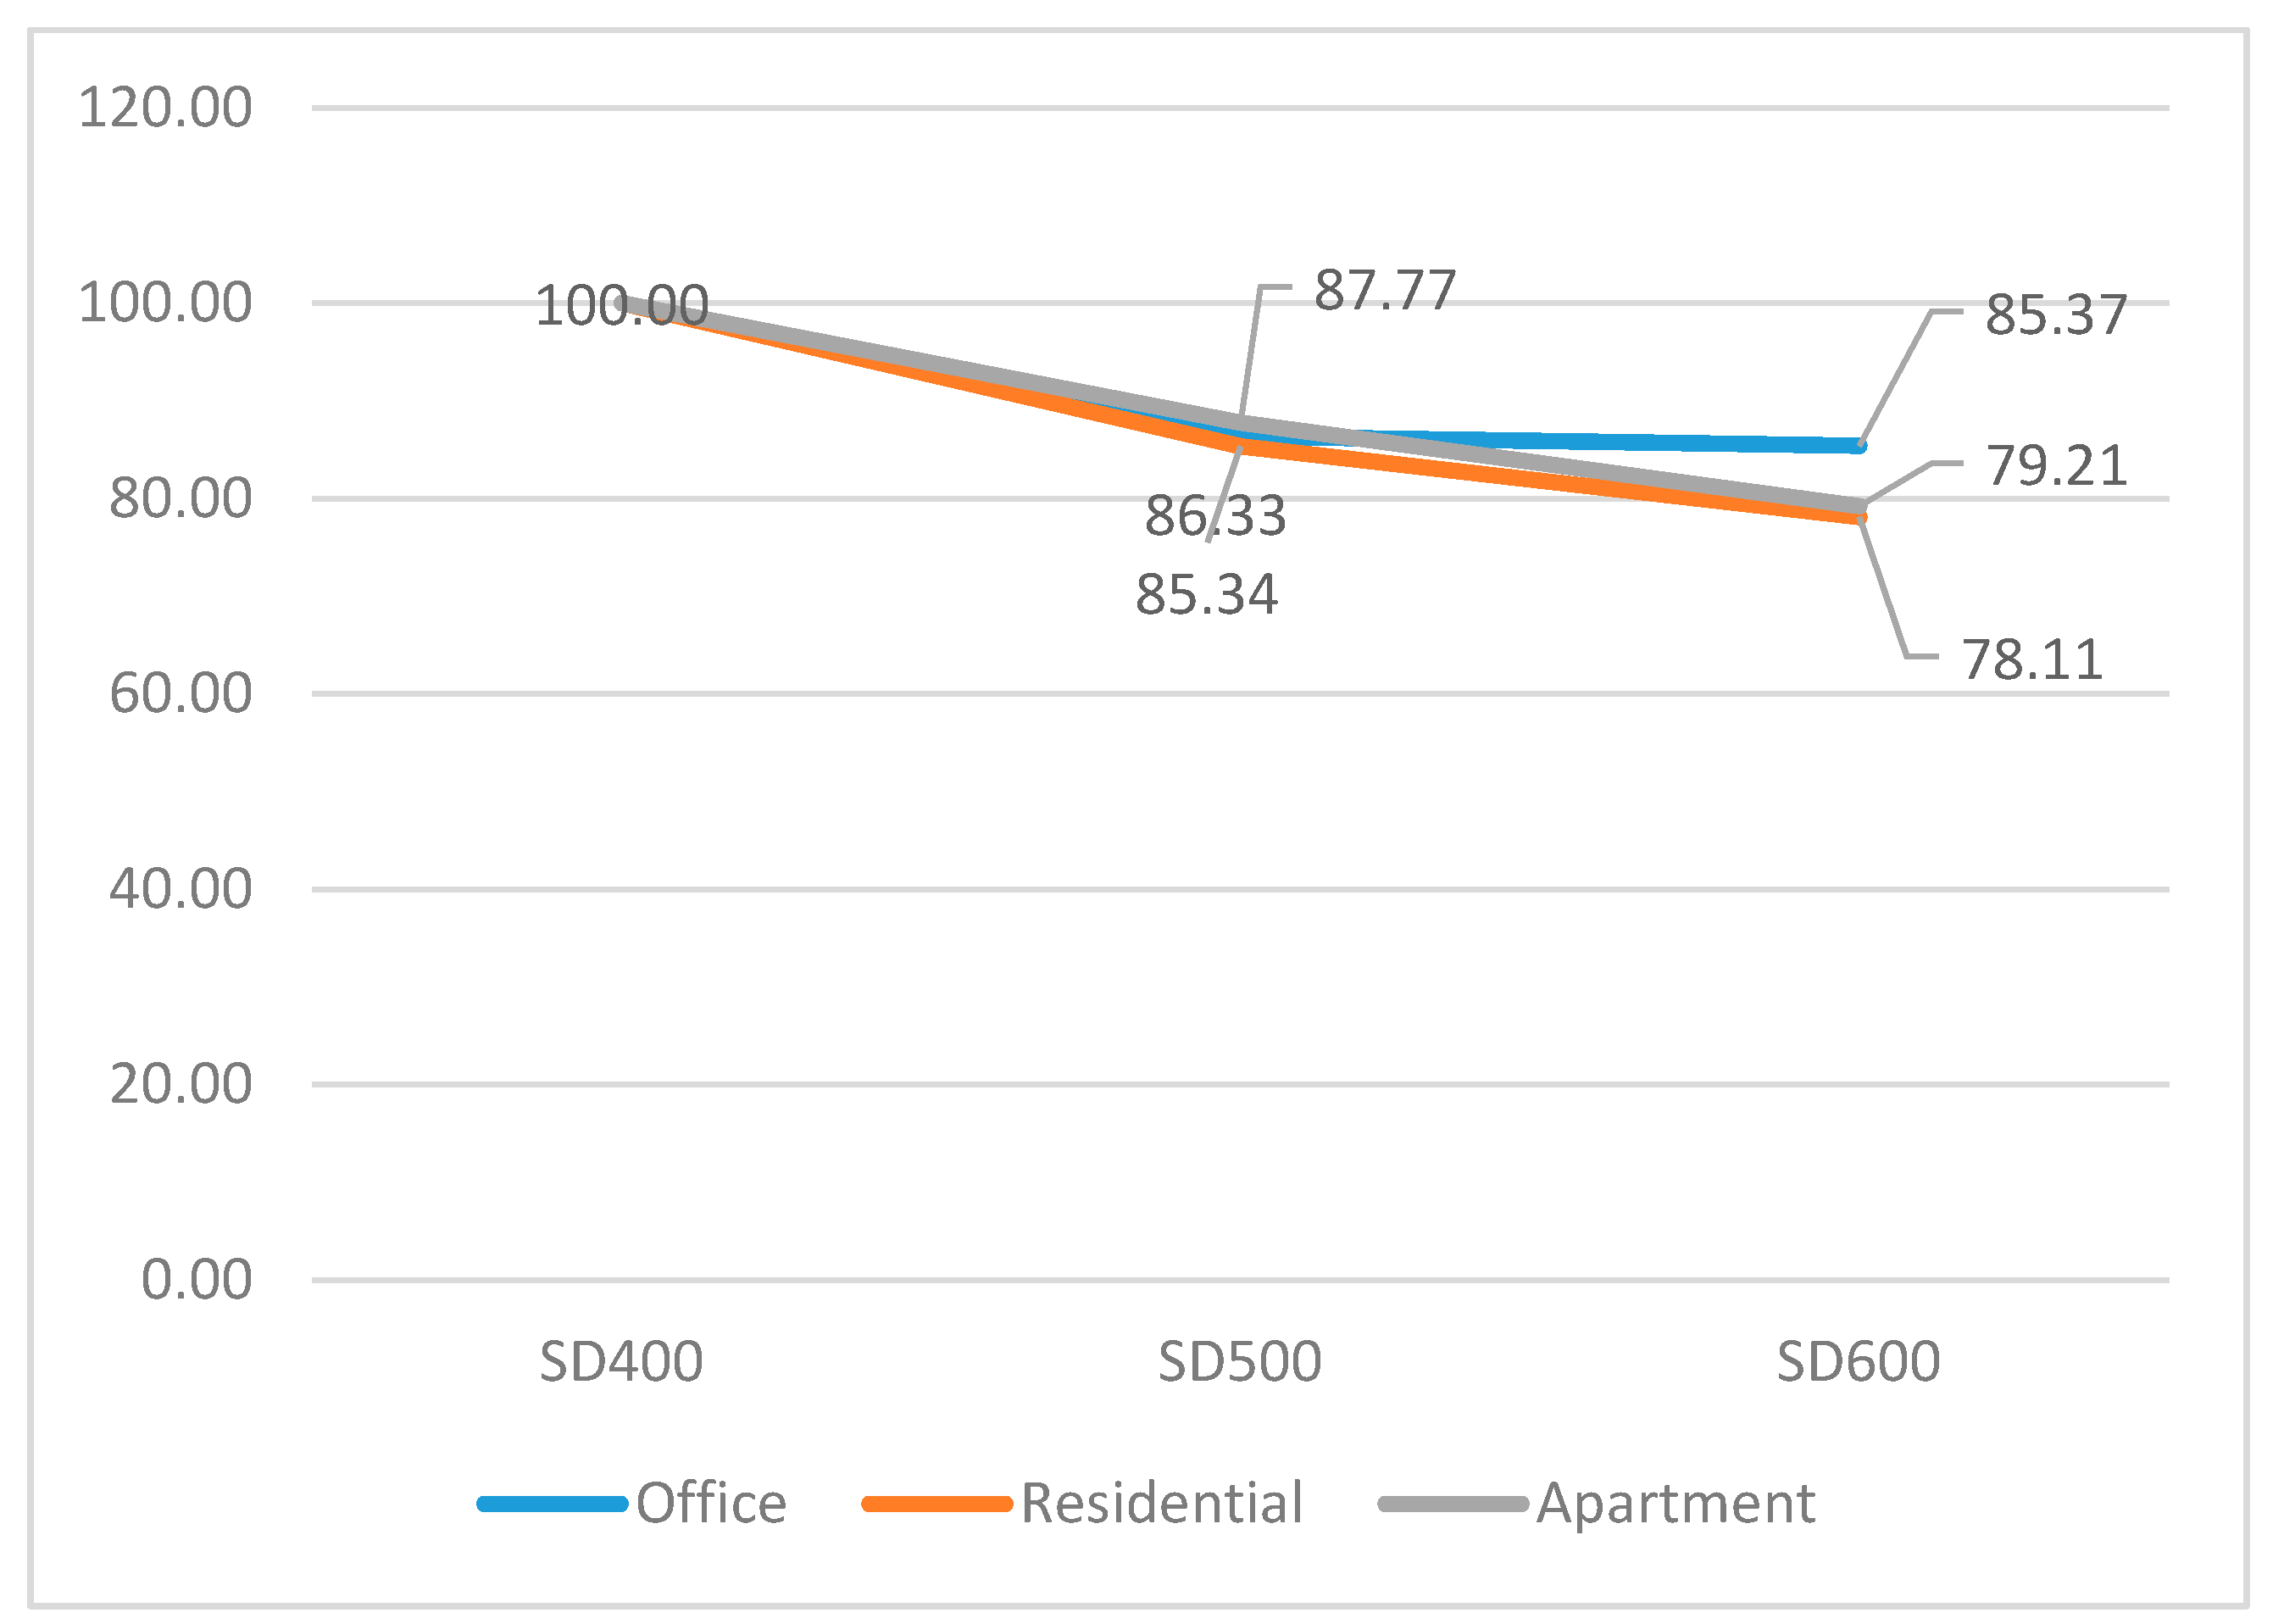
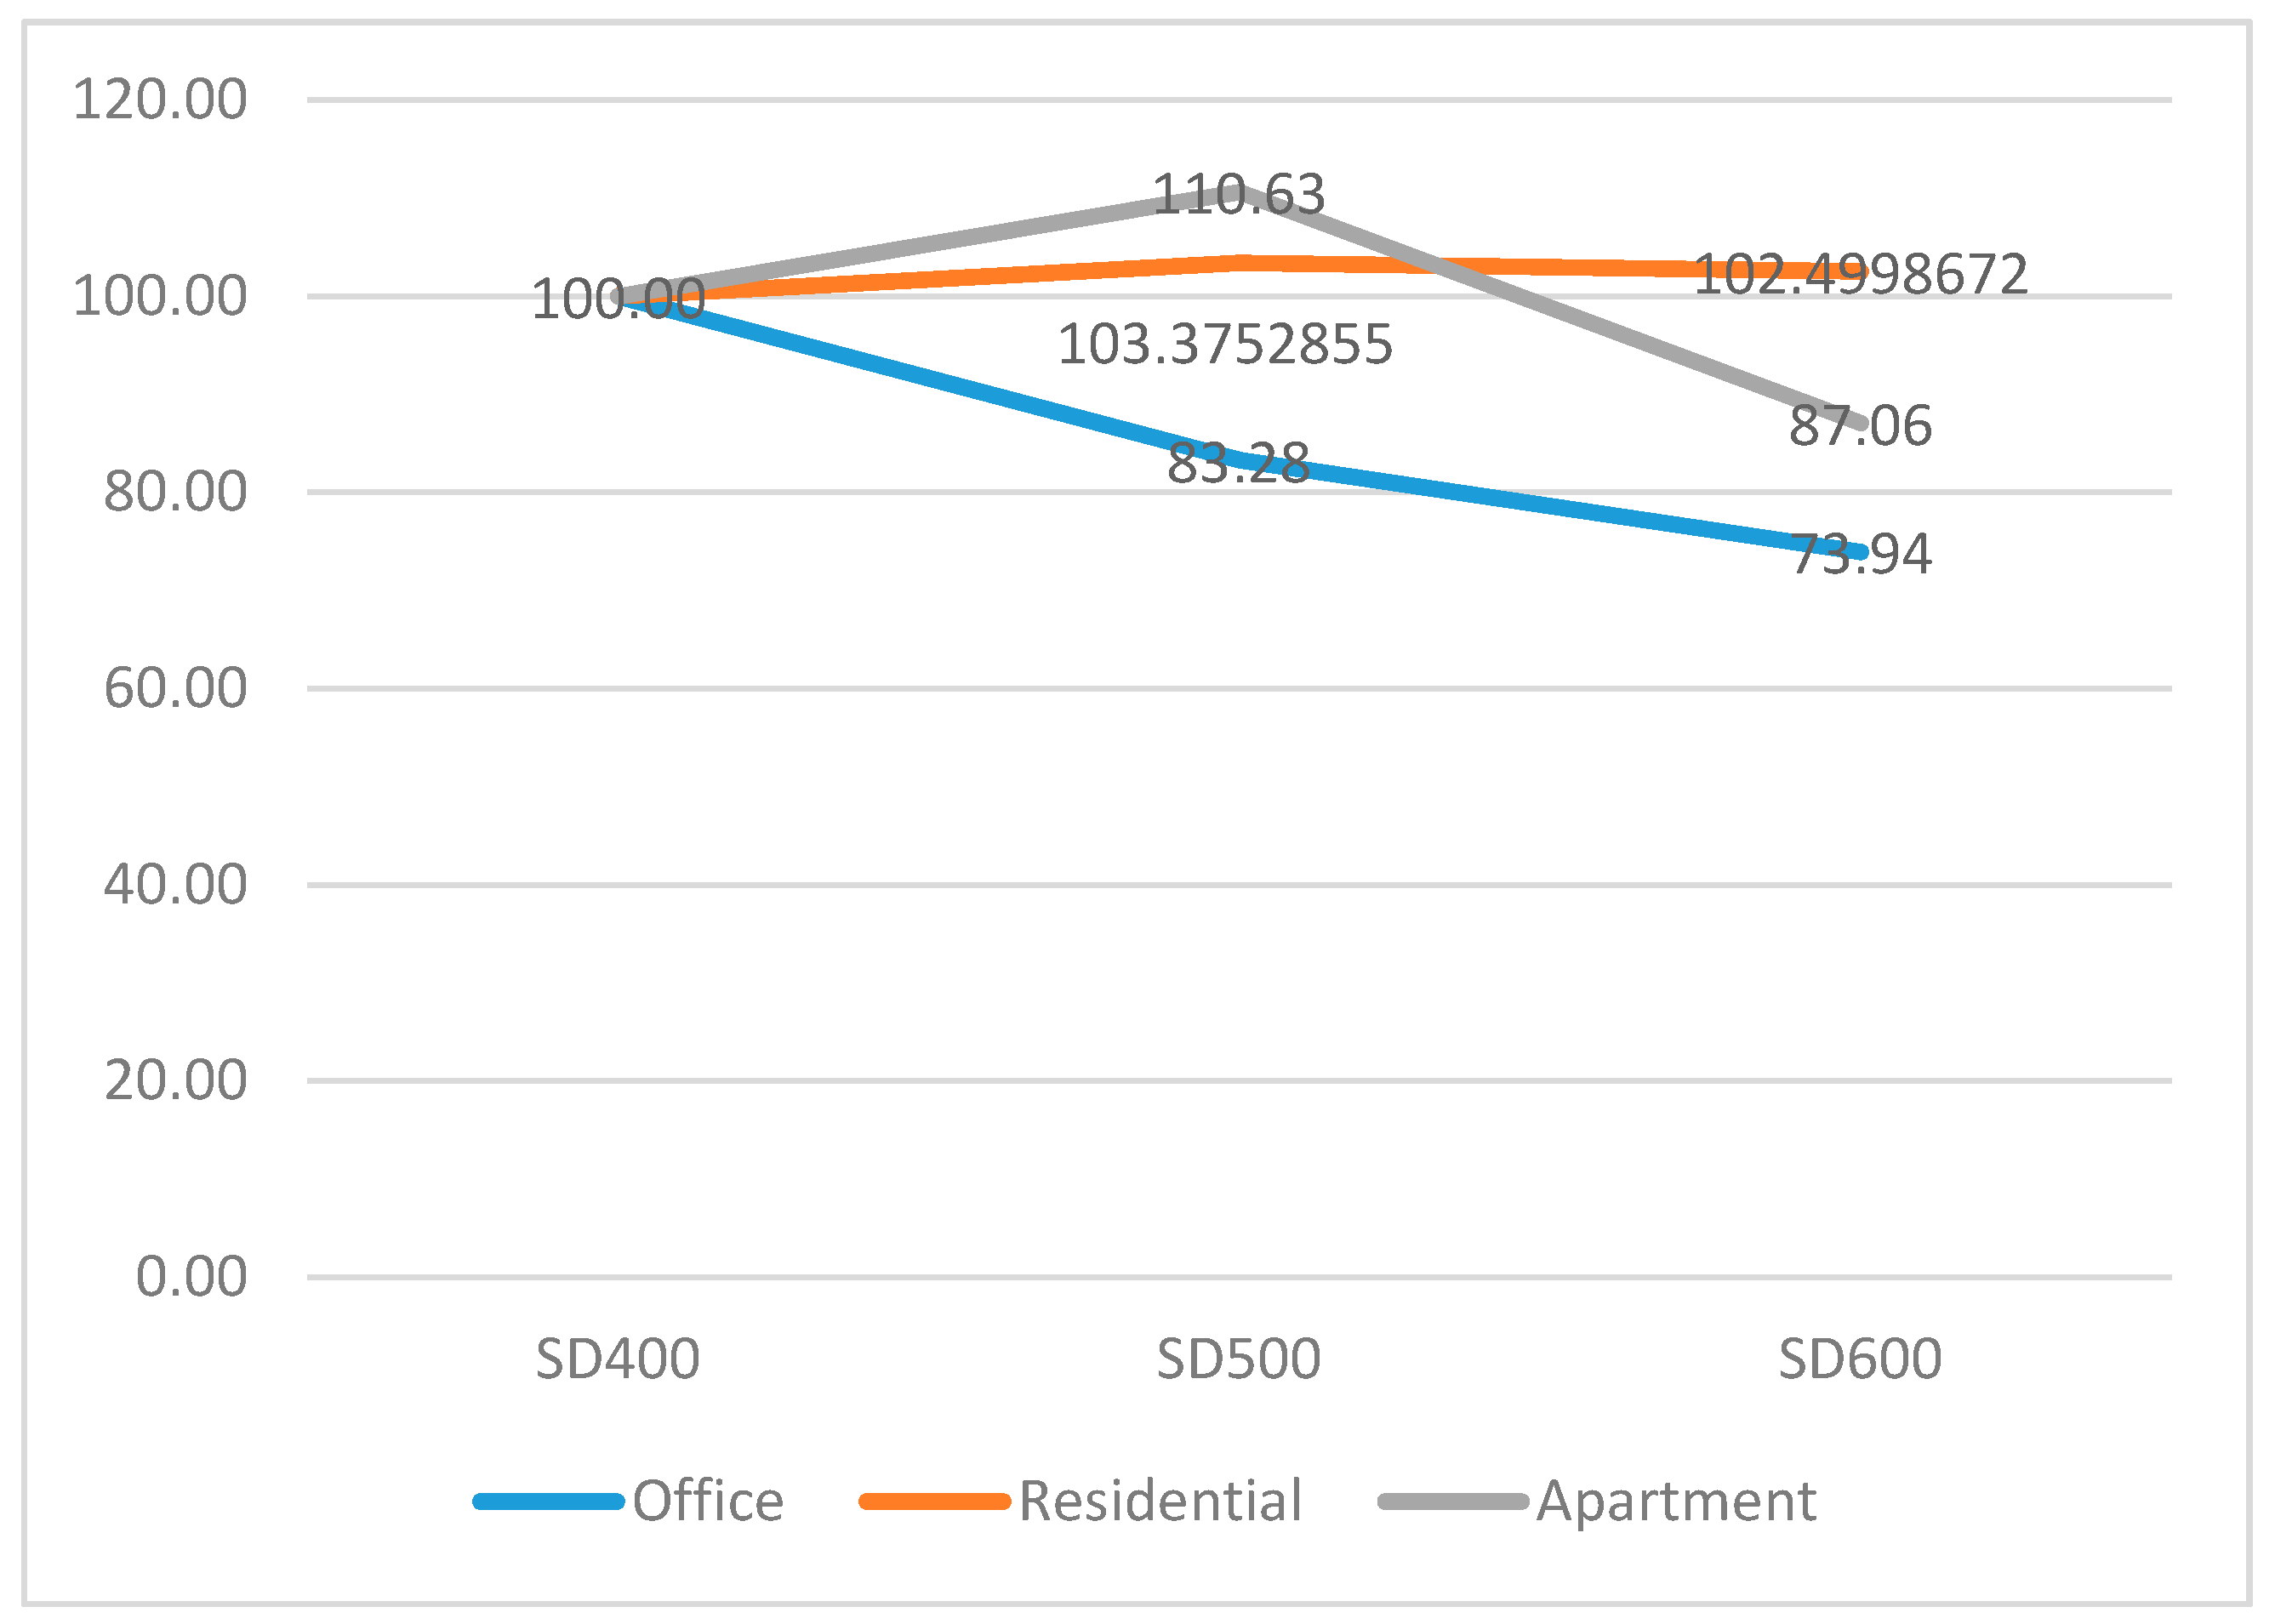
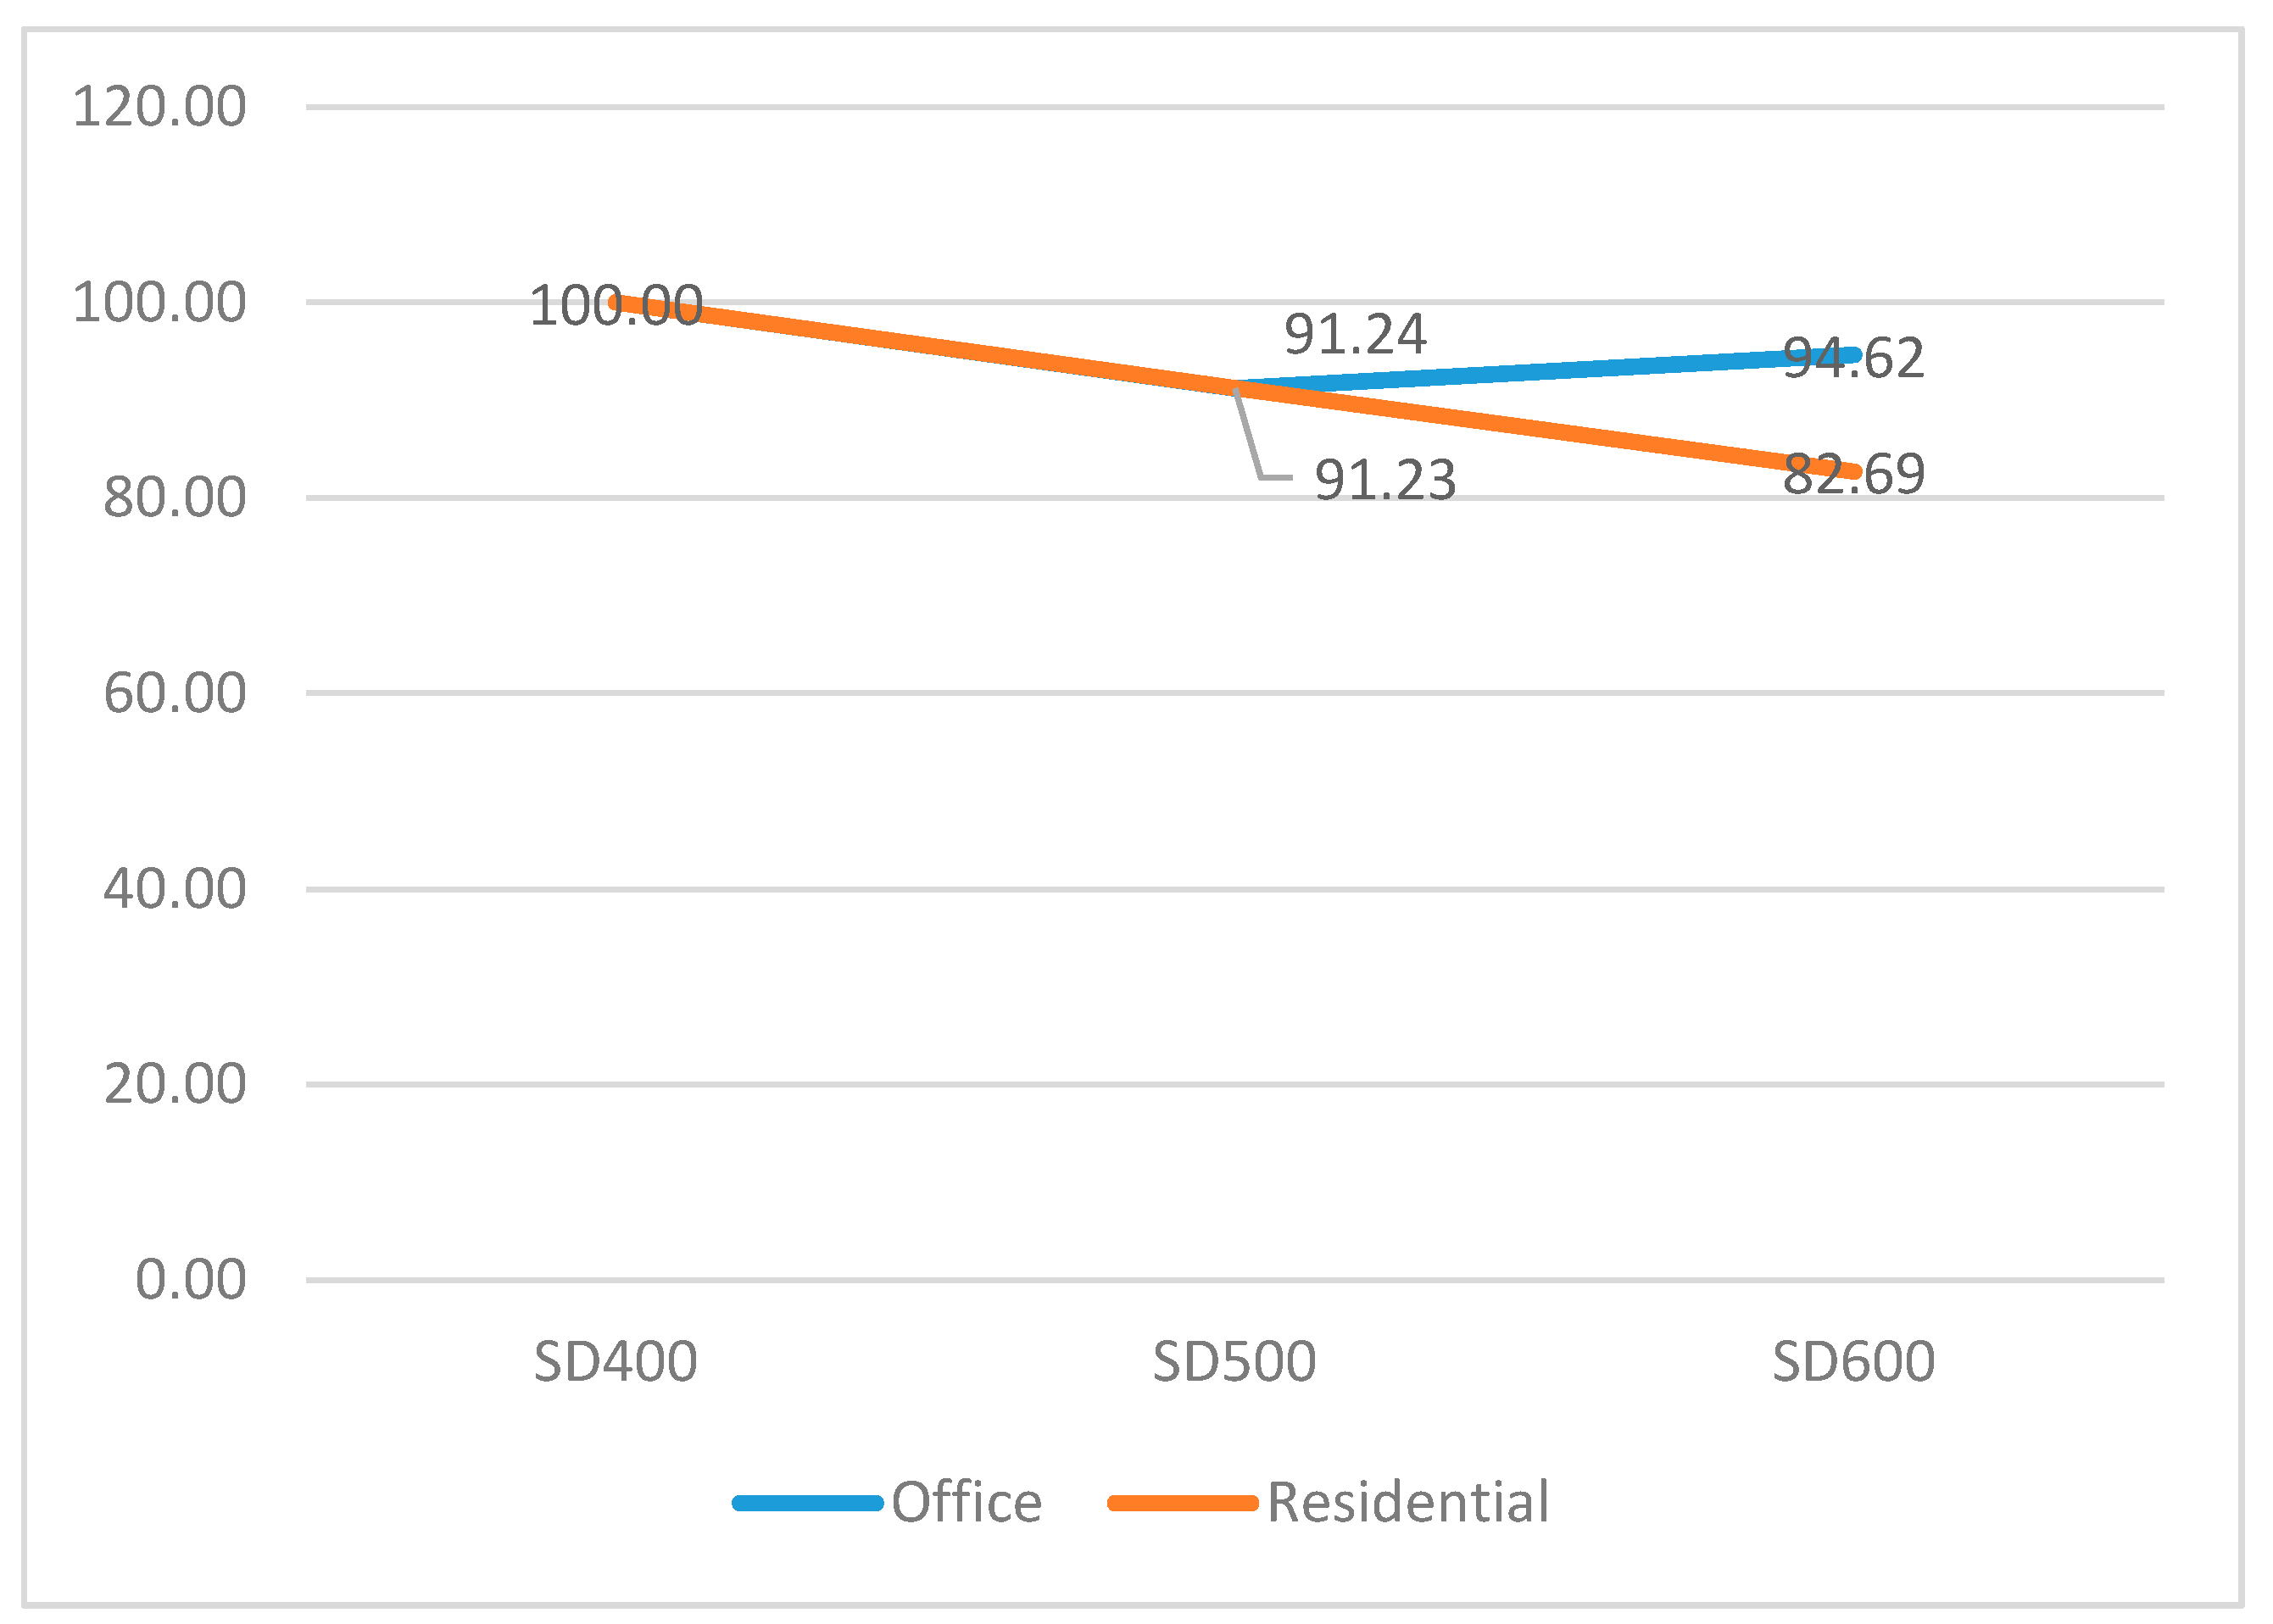
4.2.1. The Overview of the Total CO2 Emissions
4.2.2. CO2 Emissions on Slabs
4.2.3. CO2 Emissions on Beams or Girders
4.2.4. CO2 Emissions on Columns
4.2.5. CO2 Emissions on Footings
5. Discussion and Limitation
6. Conclusions
- A strength increase rate of SD500 and SD600 reinforcing bars when compared with that of SD400 was approximately 25% and 50%, respectively, and the reduction ratio of materials input on SD500 and SD600 re-bars was approximately 20% and 33%, respectively, when compared with those of SD400.
- The reinforcement quantity of SD500 and SD600 in compliance with the minimum reinforcement ratio in the flexural members and one-way structure was lowered by 20% and 30%, respectively, when compared to those of SD400 re-bars.
- When the high-strength reinforcing bars were applied to the three structural systems, the pure quantity of bar arrangement including upper and lower bar arrangement, stirrup, and hoop generally exhibited a decreasing tendency. Conversely, the quantity of splice and development increased when the strength of deformed bars increased. However, the total quantity of reinforcement bars exhibited a decrease, since the reduction ratio of pure quantity exceeded that of the increment in splice and development.
- Generally, applications to high-strength materials, especially high-strength deformed bars in the study is potentially beneficial in reducing the input amount of materials in the rigid-frame structure, bearing wall system, and flat-plate system.
- The results indicated that the implementation of SD500 deformed bars was the most effective in reducing carbon dioxide emissions. Thus, the excessive pursuit of high-strength materials detrimentally impacts carbon dioxide emissions. Hence, it is necessary to carefully calculate and compare the trade-off between material reduction and CO2 emissions for sustainable structures and buildings.
Acknowledgments
Author Contributions
Conflicts of Interest
Appendix A
Application of the Codes
Analysis of the Reference of Codes
- Main reinforcement
- (1)
- Beams;
- Nominal flexural strength at section
Nominal flexural strength at section Specified compressive strength of concrete, MPa Specified yield strength of reinforcement, MPa Tsion reinforcement ratio Width of compression face of member, mm Effective depth, mm
- Minimum reinforcement ratio
- ,
- SD400 is 0.35%, SD500 is 0.28% or lower than 20%, and SD600 is 0.23% or lower than 33.3%.
- Minimum allowable strain
Minimum allowable strain: 0.004, Reinforcement ratio: Minimum allowable strain: 0.005 (), Reinforcement ratio: Minimum allowable strain: 0.005 (), Reinforcement ratio: - Designing beam components
- Design of non-seismic structures as single beam reinforced concrete, and composite reinforcing bars should be applied to two for minimum bar arrangement;
- Design of composite parts in seismic structures should be considered the lateral loads;
- Consideration of space for thermal cracking control.
- (2)
- Slabs;
- Shrinkage and temperature reinforcement
- Limit of space for cracks control (one-way slabs)
- Bars arrangement for horizontal load
- (3)
- Columns: calculating the amount of reinforcement for compression members;
- (a)
- ;
- (b)
- Minimum and maximum reinforcement ratio ;
- (c)
- If a structure is high-rise and the section of the column is same in all floors, the dominant reinforcement ration is minimum reinforcement under certain conditions;
- (d)
- When high strength reinforcing bars are used, it would be required to adjust the section of the column if we want to reduce the input of reinforcing bars.
- (4)
- Walls: core walls;
- (a)
- Horizontal reinforcement: the regulation is equal spacing;
- (b)
- Vertical reinforcement;
- Under D16: 0.12%
- Exceeding D16: 0.15%
- (c)
- Horizontal reinforcement;
- Under D16: 0.2%
- Exceeding D16: 0.25%
- (d)
- There is no regulation in terms of reinforcement in wall regardless of . Thus, the amount of high-strength reinforcing bars is same as the amount of SD400. Moreover, the efficiency would be lowered if the amount of minimum reinforcement would be increased.
- (5)
- Footings;
- (a)
- Design of footings should comply with the code of flexural members;
- (b)
- When SD500 is used, would be reduced 20 %, and when SD600 is applied, would be deducted to 33.3%;
- (c)
- The type of footing is soil bearing capacity of mat foundations.
- (6)
- Deflection;
- There are none of variables affecting deflection, when we use high strength reinforcing bars. However, the deflection would be slightly increased when the high strength reinforcing bars are used, since the cracked moment of inertia is decreased. In this study, each specimen was designed in consideration of deflection and the value was relatively small and negligible.
- (7)
- Cracks;
- (a)
- Reinforcement space of controlling cracks;
- (b)
- If the section of beams is large, especially the width of beam is large, the tests were carried out in consideration of reducing the diameter of the reinforcing bars;
- (c)
- Intervals of controlling cracks on slabs;
- When SD400 is used, it is 200 mm
- When SD500 is used, it is 186 mm
- When SD600 is used, it is 146 mm
- (d)
- Intervals of controlling cracks on beams
- When SD400 is used, it is 170 mm
- When SD500 is used, it is 136 mm
- When SD600 is used, it is 71 mm
- (8)
- Development and splice;
- (a)
- The development length;
- Development length for deformed bars in compression:
- Development length for deformed bars in tension:
- Development length for standard hooks in tension:
- (b)
- Beams: Applied to the general design codes;
- (c)
- Vertical members: Applied seismic resistance design;
- (d)
- Slabs: Applied 1 way slab design code;
- (e)
- Footings: Applied codes in accordance with the design code of beams.
- Shear reinforcement
- (1)
- Beams;
- The strength of concrete with shear and flexural moment
- (a)
- Space of shear reinforcement;
- (b)
- ;
- (c)
- ;
- (d)
- Minimum shear reinforcement;
- All the flexural members (the factored shear strength is not exceeded a half of the minimum shear strength) should place shear reinforcement.
- However, the minimum shear reinforcement should not exceed
- (e)
- Maximum shear strength should be lower than
- (2)
- Columns
- (a)
- The strength of compressive axial force members;
- (b)
- Space of shear reinforcement;
- : Shear reinforcement is not required
- : Shear reinforcement is required
- Shear reinforcement
- Structures located in non-seismic areas
- Structures located in seismic area
- (c)
- Maximum shear strength should be lower than
- (3)
- Walls
- Generally, shear reinforcement in walls is similar to the design of shear reinforcement design in beams. However, there is slight difference between
- (a)
- Shear strength would be selected minimum value,
- or
Light-weight aggregate concrete factor Overall thickness or height of member, Distance from extreme compression fibre to centroid of longitudinal tension reinforcement, Factored axial force normal to cross section occurring simultaneously with or is to be taken as positive for compression and negative for tension, Length of entire wall or length of segment of wall considered in direction of shear force,
- (b)
- When ,
- : Area of shear reinforcement parallel to flexural tension reinforcement within spacing,;
- : Centre-to-centre spacing of longitudinal shear or torsion reinforcement, .
- (c)
- Minimum area of reinforcement and spacing
- : Comply with (a)–(d), or reinforcement of walls
- : Comply with (a)–(d)
- Reinforcement of horizontal shear force: Lower than , , or 450
- Reinforcement of vertical shear force: Lower than , , or 450
Appendix B
The Process of CO2 Emissions of Re-Bars by Yield Strength and Diameter
- (1)
- Production inducement coefficient of structural steel (Table 3);
- (2)
- (3)
- Computation of energy consumption of structural steel (Table 5);
- (4)
- Evaluation of net calorific value of structural steel by each energy source (Table A1);
- (5)
- Assessing CO2 emissions of structural steel with application of CO2 conversion coefficient (44/12);
- (6)
- Determination of CO2 emissions of each structural steel by yield strength and diameter.
- Calculation of input amount of hard coal from Equation (A1),
- Computation of the value of net calorific value () of hard coal from Equation (A3),
- The CO2 emissions from hard coal combustion is calculated from Equation (A2),
- The CO2 emissions from other energy sources were followed the above three steps and the sum of all the energy sources was the CO2 emissions of each deformed bar (see Table 5)

| Energy Source | Unit Price (KRW) | Coefficient of Net Calorific Value (10-3TOE) | CO2 Emission Factor |
|---|---|---|---|
| Hard coal | 91.60 | 0.445 | 1.1 |
| Soft coal | 101.36 | 0.537 | 1.059 |
| Crude oil | 712.58 | 1.008 | 0.829 |
| LNG | 706.45 | 1.178 | 0.637 |
| Other bituminous coals | 96.48 | 0.491 | 1.08 |
| Naphtha | 612.00 | 0.716 | 0.783 |
| Further oil refinery products | 380 | 0.936 | 0.912 |
| Gasoline | 1536.00 | 0.723 | 0.783 |
| Kerosene | 1005.50 | 0.82 | 0.812 |
| Diesel | 1384.00 | 0.842 | 0.837 |
| Crude oil | 664.76 | 0.982 | 0.875 |
| LNG | 1053.00 | 1.098 | 0.713 |
References
- Cho, S.H.; Chae, C.U. The comparative study on the environmental impact assessment of construction material through the application of carbon reducing element-focused on global warming potential of concrete products. Int. J. Korea Inst. Ecol. Archit. Environ. 2015, 33, 149–156. [Google Scholar] [CrossRef]
- Kim, T.-H.; Tae, S.-H. A study on the development of an evaluation systems of CO2 emission in the production of concrete. J. Korea Concr. Inst. 2010, 22, 787–796. [Google Scholar] [CrossRef]
- Core Writing Team. Climate Change 2007: Synthesis Report; Intergovernmental Panel on Climate Change: Geneva, Switzerland, 2008. [Google Scholar]
- UN. Kyoto Protocol to the United Nations Framework Convention on Climate Change; United Nations: Kyoto, Japan, 1997. [Google Scholar]
- Hammond, G.P.; Jones, C.I. Embodied energy and carbon in construction materials. Inst. Civ. Eng. Energy 2008, 161, 87–98. [Google Scholar] [CrossRef] [Green Version]
- González, M.J.; Navarro, J.G. Assessment of the decrease of CO2 emissions in the construction field through the selection of materials: Practical case study of three houses of low environmental impact. Build. Environ. 2006, 41, 902–909. [Google Scholar] [CrossRef]
- Poon, C.S.; Yu, A.T.W. Reducing building waste at construction sites in Hong Kong. Constr. Manag. Econ. 2004, 22, 461–470. [Google Scholar] [CrossRef]
- Nadoushani, Z.S.M.; Hammand, A.W.; Akbarnezhad, A. A Framework for Optimizing Lap Splice Positions within Concrete Elements to Minimize Cutting Waste of Steel Bars. In Proceedings of the International Symposium on Automation and Robotics in Construction, Auburn, AL, USA, 18–21 July 2016; Vilnius Gediminas Technical University: Vilnius, Lithuania, 2016. [Google Scholar]
- Liu, C.; Ahn, C.R.; An, X.; Lee, S. Integrated Evaluation of Cost, Schedule and Emission Performance on Rock-Filled Concrete Dam Construction Operation Using Discrete Event Simulation. In Proceedings of the Winter Simulation Conference (WSC), Washington, DC, USA, 8–11 December 2013. [Google Scholar]
- Hammand, A.W.A.; Akbarnezhad, A.; Rey, D. A multi-objective mixed integer nonlinear programming model for construction site layout planning to minimise noise pollution and transport costs. Autom. Constr. 2016, 61, 73–85. [Google Scholar] [CrossRef]
- Ahmadian, F.F.A.; Akabarnezhad, A.; Rashidi, T.H.; Waller, T. BIM-enabled sustainability assessment of material supply decisions. Eng. Constr. Archit. Manag. 2016, 24, 668–695. [Google Scholar] [CrossRef]
- Yan, H.; Shen, Q.; Fan, L.C. H.; Wang, Y.; Zhang, L. Greenhouse gas emissions in building construction: A case study of one Peking in Hong Kong. Build. Environ. 2010, 45, 949–955. [Google Scholar] [CrossRef]
- Lee, K.H.; Lee, H.S.; Yang, J.H. A study on the functional unit trend of carbon dioxide emission in the construction materals between 2000, 2003 and 2005. Int. J. Korea Inst. Ecol. Archit. Environ. 2010, 10, 123–129. [Google Scholar]
- Tae, S.; Baek, C.; Shin, S. Life cycle CO2 evaluation on reinforced concrete structures with high-strength concrete. Environ. Impact Assess. Rev. 2011, 31, 253–260. [Google Scholar] [CrossRef]
- Akbarnezhad, A.; Xiao, J. Estimation and minimization of embodied carbon of buildings: A review. Buildings 2017, 7, 5. [Google Scholar] [CrossRef]
- Cole, R.J. Energy and greenhouse gas emissions associated with the construction of alternative structural systems. Build. Environ. 1999, 34, 335–348. [Google Scholar] [CrossRef]
- Cho, S.H.; Chae, C.U. A study on life cycle CO2 emissions of low-carbon building in South Korea. Sustainability 2016, 8, 579. [Google Scholar] [CrossRef]
- Tae, S.; Shin, S.; Woo, J.; Roh, S. The development of apartment house life cycle CO2 simple assessment system using standard apartment houses of South Korea. Renew. Sustain. Energy Rev. 2011, 15, 1454–1467. [Google Scholar] [CrossRef]
- Baek, C.; Tae, S.; Kim, R.; Shin, S. Life cycle CO2 assessment by block type changes of apartment housing. Sustainability 2016, 8, 752. [Google Scholar] [CrossRef]
- Kim, T.H.; Chae, C.U.; Kim, G.H.; Jang, H.J. Analysis of CO2 emissions characteristics of concrete used at construction sites. Sustainability 2016, 8, 348. [Google Scholar] [CrossRef]
- Park, H.S.; Kwon, B.; Shin, Y.; Kim, Y.; Hong, T. Cost and CO2 emission optimization of steel reinforced concrete columns in high-rise buildings. Energies 2013, 6, 5609–5624. [Google Scholar] [CrossRef]
- Nadousharni, Z.S.M.; Akbarnezhad, A. Effects of structural system on the life cycle carbon footprint of buildings. Energy Build. 2015, 102, 337–346. [Google Scholar] [CrossRef]
- Choi, J.H.; Lee, D.H.; Kwon, G.D.; Kim, S.K. A study on energy consumption and estimation of CO2 from re-bar production. J. Korea Inst. Ecol. Archit. Environ. 2010, 10, 101–109. [Google Scholar]
- Han, Y.S.; Kim, S.D. A comparative study on CO2 amount of construction material in structural design. J. Archit. Inst. Korea 2005, 25, 203–206. [Google Scholar]
- Hong, T.H.; Ji, C.Y.; Jang, M.H. An analysis on CO2 emission of structural steel materials by strength using input-output analysis. Korean J. Constr. Eng. Manag. 2012, 13, 132–140. [Google Scholar] [CrossRef]
- Korea Institute of Concrete. Structural Concrete Design Code and Commentary; Korea Institute of Concrete: Seoul, Korea, 2012. [Google Scholar]
- Choi, Y.H.; Kang, M.G. Korean Building Code–Structure; Architectural Institute of Korea: Seoul, Korea, 2009. [Google Scholar]
- Korea Environemental Industry and Technology; Korea National LCI Network: Seoul, Korea, 2012.
- International Organization for Standardization. ISO 14044:2006—Life Cycle Assessment (Requirement and Guidelines); Interantional Organisation for Standization: Geneva, Switzeland, 2006. [Google Scholar]
- International Organization for Standardization. ISO 21930:2007—Environmental Declaration of Building Product; ISO: Geneva, Switzeland, 2007. [Google Scholar]
- Lave, L.; Hendrickson, C.; Harvath, A.; Joshi, S. Economic input-output models for environment life—Cycle assessment. Environ. Sci. Technol. 2002, 32, 184–191. [Google Scholar]
- Miller, R.E.; Blair, P.D. Input-Output Analysis: Foundations and Extensions; Cambridge University Press: Cambridge, UK, 2009. [Google Scholar]
- Gay, P.W.; Proops, J.L. Carbon dioxide production by the UK economy: An input-output assessment. Appl. Energy 1993, 44, 113–130. [Google Scholar] [CrossRef]
- Minx, J.C.; Widermann, T.; Wood, R.; Peters, G.P.; Lenzenm, M.; Owen, A.; Paul, A. Input–output analysis and carbon foot printing: An overview of applications. Econ. Syst. Res. 2009, 21, 187–216. [Google Scholar] [CrossRef]
- Basbagill, J.; Flager, F.; Lepech, M.; Fischer, M. Application of life—Cycle assessment to early stage building design for reduced embodied environmental impacts. Build. Environ. 2013, 60, 81–92. [Google Scholar] [CrossRef]
- Cabeza, L.F.; Rijcón, L.; Vilariño, V.; Pérez, G.; Castell, A. Life cycle assessment (LCA) and life cycel energy analysis (LCEA) of buildings and the building sector: A review. Renew. Sustain. Energy Rev. 2014, 29, 394–416. [Google Scholar] [CrossRef]
- Hendrickson, C.; Horvath, A.; Joshi, S.; Klausner, M.; Lave, L.B.; McMichael, F.C. Comparing two life cycle assessment approaches: A process model vs. economic input-output-based assessment. In Proceedings of the 1997 IEEE International Symposium on Electronics and the Environment, San Francisco, CA, USA, 5–7 May 1997. [Google Scholar]
- The Bank of Korea. 2014 Input-Output Statistics; The Bank of Korea: Seoul, Korea, 2016. [Google Scholar]
- Korea Price Information Corporation. Korea Price Information; Korea Price Information Corporation: Seoul, Korea, 2017. [Google Scholar]


| Type | Number of Storeys (Ground/Basement) | Type of Structure | Type of Footings | Concrete Compressive Strength |
|---|---|---|---|---|
| Office complex building | 25/1 | Rigid frame | Bearing capacity of soil (Mat footing) | |
| (Vertical members) | ||||
| (Horizontal members and footings) | ||||
| Apartment | 25/1 | Bearing wall | Bearing capacity of soil (Mat footing) | |
| (11F-RF: Vertical members, B1-RF: Horizontal members and footings) | ||||
| (B1-10F: Vertical members) | ||||
| Residential–commercial complex | 43/1 | Flat plate | Bearing capacity of soil (Mat footing) | |
| (Vertical members) | ||||
| (Horizontal members and footing) |
| Type | Seismic Load | Wind Load | |||||
|---|---|---|---|---|---|---|---|
| Site Coefficient | Importance Factor | Ground | Response Modification Coefficient | Terrain Category | Design Wind Speed | Gust Influence Factor | |
| Office complex building | A | 1.5 | Sc | 5.0 | B | 30 m/s | 2.2 |
| Apartment | A | 1.5 | Sc | 4.5 | B | 30 m/s | 2.2 |
| Residential–commercial complex | A | 1.5 | Sc | 5.0 | B | 30 m/s | 2.2 |
| Production Inducement Coefficient of Structural Steel | |||
|---|---|---|---|
| Contents | Production Inducement Coefficient | Contents | Production Inducement Coefficient |
| Hard coal | 0.01471 | Naphtha | 0.007866 |
| Soft coal | 0.071602 | Further oil refinery products | 0.002327 |
| Crude oil | 0.051524 | Gasoline | 0.003923 |
| LNG | 0.023119 | Kerosene | 0.003667 |
| Other bituminous coals | 0.088715 | Gasoline | 0.003923 |
| Product | Strength | Diameter | Unit Price |
|---|---|---|---|
| Steel re-bars | SD400 | D10 | 620,000 |
| D13 | 610,000 | ||
| D16–D32 | 604,000 | ||
| SD500 | D10 | 650,000 | |
| D13 | 640,000 | ||
| D16–D32 | 634,000 | ||
| SD600 | D10 | 669,000 | |
| D13 | 659,000 | ||
| D16–D32 | 654,000 |
| Product | Strength | Diameter | Energy Consumption (toe/ton) | CO2 Emissions (kg-CO2/ton) |
|---|---|---|---|---|
| Steel re-bars | SD400 | D10 | 0.6720 | 2526.611924 |
| D13 | 0.6611 | 2485.860118 | ||
| D16–D32 | 0.6546 | 2461.409035 | ||
| SD500 | D10 | 0.7045 | 2648.867339 | |
| D13 | 0.6936 | 2608.115534 | ||
| D16–D32 | 0.6871 | 2583.664451 | ||
| SD600 | D10 | 0.7251 | 2726.295769 | |
| D13 | 0.7142 | 2685.543964 | ||
| D16–D32 | 0.7088 | 2665.169062 |
| Types | Quantity | Slabs | Beams/Girders | Columns | Walls | Footings | Total | |
|---|---|---|---|---|---|---|---|---|
| Office complex building | SD400 | Pure quantity | 233.36 | 654.09 | 381.21 | 192.15 | 284.36 | 1745.17 (100%) |
| Development and splice | 10.26 | 172.88 | 95.27 | 13.31 | 74.84 | 366.56 (100%) | ||
| Subtotal | 243.62 (100%) | 826.97 (100%) | 476.48 (100%) | 205.46 (100%) | 359.2 (100%) | 2106.73 (100%) | ||
| SD500 | Pure quantity | 250.35 | 533.92 | 346.59 | 185.78 | 232.12 | 1548.76 (82.20%) | |
| Development and splice | 13.60 | 120.70 | 89.15 | 14.55 | 63.29 | 301.29 (87.60%) | ||
| Subtotal | 263.95 (108.3%) | 654.62 (79.2%) | 435.74 (91.5%) | 200.33 (97.5%) | 294.41 (82.0%) | 1849.05 (87.6%) | ||
| SD600 | Pure quantity | 291.35 | 464.38 | 335.31 | 182.48 | 214.05 | 1487.57 (100%) | |
| Development and splice | 18.77 | 98.10 | 102.40 | 15.13 | 69.14 | 303.82 (82.8%) | ||
| Subtotal | 310.12 (127.3%) | 562.48 (69.0%) | 437.71 (92.9%) | 197.61 (96.2%) | 283.19 (78.8%) | 1786.64 (84.6%) | ||
| Apartment | SD400 | Pure quantity | 139.83 | 38.76 | 236.41 | 24.85 | 439.85 (100%) | |
| Development and splice | 6.77 | 16.38 | 16.66 | 5.55 | 45.36 (100%) | |||
| Subtotal | 146.60 (100%) | 55.14 (100%) | 253.07 (100%) | 30.40 (100%) | 485.21 (100%) | |||
| SD500 | Pure quantity | 122.05 | 37.70 | 229.03 | 20.75 | 409.53 (93.1%) | ||
| Development and splice | 7.18 | 20.50 | 18.52 | 4.67 | 50.87 (112.2%) | |||
| Subtotal | 129.23 (88.2%) | 58.20 (105.6%) | 247.55 (97.8%) | 25.42 (83.6%) | 460.4 (94.9%) | |||
| SD600 | Pure quantity | 122.05 | 31.37 | 221.67 | 17.88 | 392.97 (89.3%) | ||
| Development and splice | 8.57 | 12.77 | 19.52 | 4.36 | 45.22 (99.7%) | |||
| Subtotal | 130.62 (89.1%) | 44.14 (80.1%) | 241.19 (95.3%) | 22.24 (73.2%) | 438.19 (90.3%) | |||
| Residential–commercial complex | SD400 | Pure quantity | 1873.07 | 182.68 | 852.75 | 708.22 | 141.22 | 3757.94 (100%) |
| Development and splice | 214.28 | 269.33 | 386.32 | 75.85 | 43.63 | 989.41 (100%) | ||
| Subtotal | 2087.35 (100%) | 452.012 (100%) | 1239.06 (100%) | 784.07 (100%) | 184.85 (100%) | 4747.34 (100%) | ||
| SD500 | Pure quantity | 1551.04 | 164.75 | 731.78 | 668.84 | 112.40 | 3228.81 (85.9%) | |
| Development and splice | 221.21 | 279.85 | 344.79 | 78.55 | 37.88 | 962.28 (97.3%) | ||
| Subtotal | 1772.25 (84.9%) | 444.60 (98.4%) | 1076.57 (86.9%) | 747.39 (95.3%) | 150.28 (81.3%) | 4191.09 (88.3%) | ||
| SD600 | Pure quantity | 1330.20 | 151.38 | 637.01 | 656.36 | 96.82 | 2971.77 (79.4%) | |
| Development and splice | 226.28 | 275.99 | 308.71 | 87.48 | 36.53 | 934.99 (94.5%) | ||
| Subtotal | 1556.48 (74.6%) | 427.37 (94.6%) | 945.72 (76.3%) | 743.84 (94.9%) | 133.35 (72.1%) | 3806.76 (80.2%) | ||
© 2017 by the authors. Licensee MDPI, Basel, Switzerland. This article is an open access article distributed under the terms and conditions of the Creative Commons Attribution (CC BY) license (http://creativecommons.org/licenses/by/4.0/).
Share and Cite
Cho, S.; Na, S. The Reduction of CO2 Emissions by Application of High-Strength Reinforcing Bars to Three Different Structural Systems in South Korea. Sustainability 2017, 9, 1652. https://doi.org/10.3390/su9091652
Cho S, Na S. The Reduction of CO2 Emissions by Application of High-Strength Reinforcing Bars to Three Different Structural Systems in South Korea. Sustainability. 2017; 9(9):1652. https://doi.org/10.3390/su9091652
Chicago/Turabian StyleCho, Seungho, and Seunguk Na. 2017. "The Reduction of CO2 Emissions by Application of High-Strength Reinforcing Bars to Three Different Structural Systems in South Korea" Sustainability 9, no. 9: 1652. https://doi.org/10.3390/su9091652