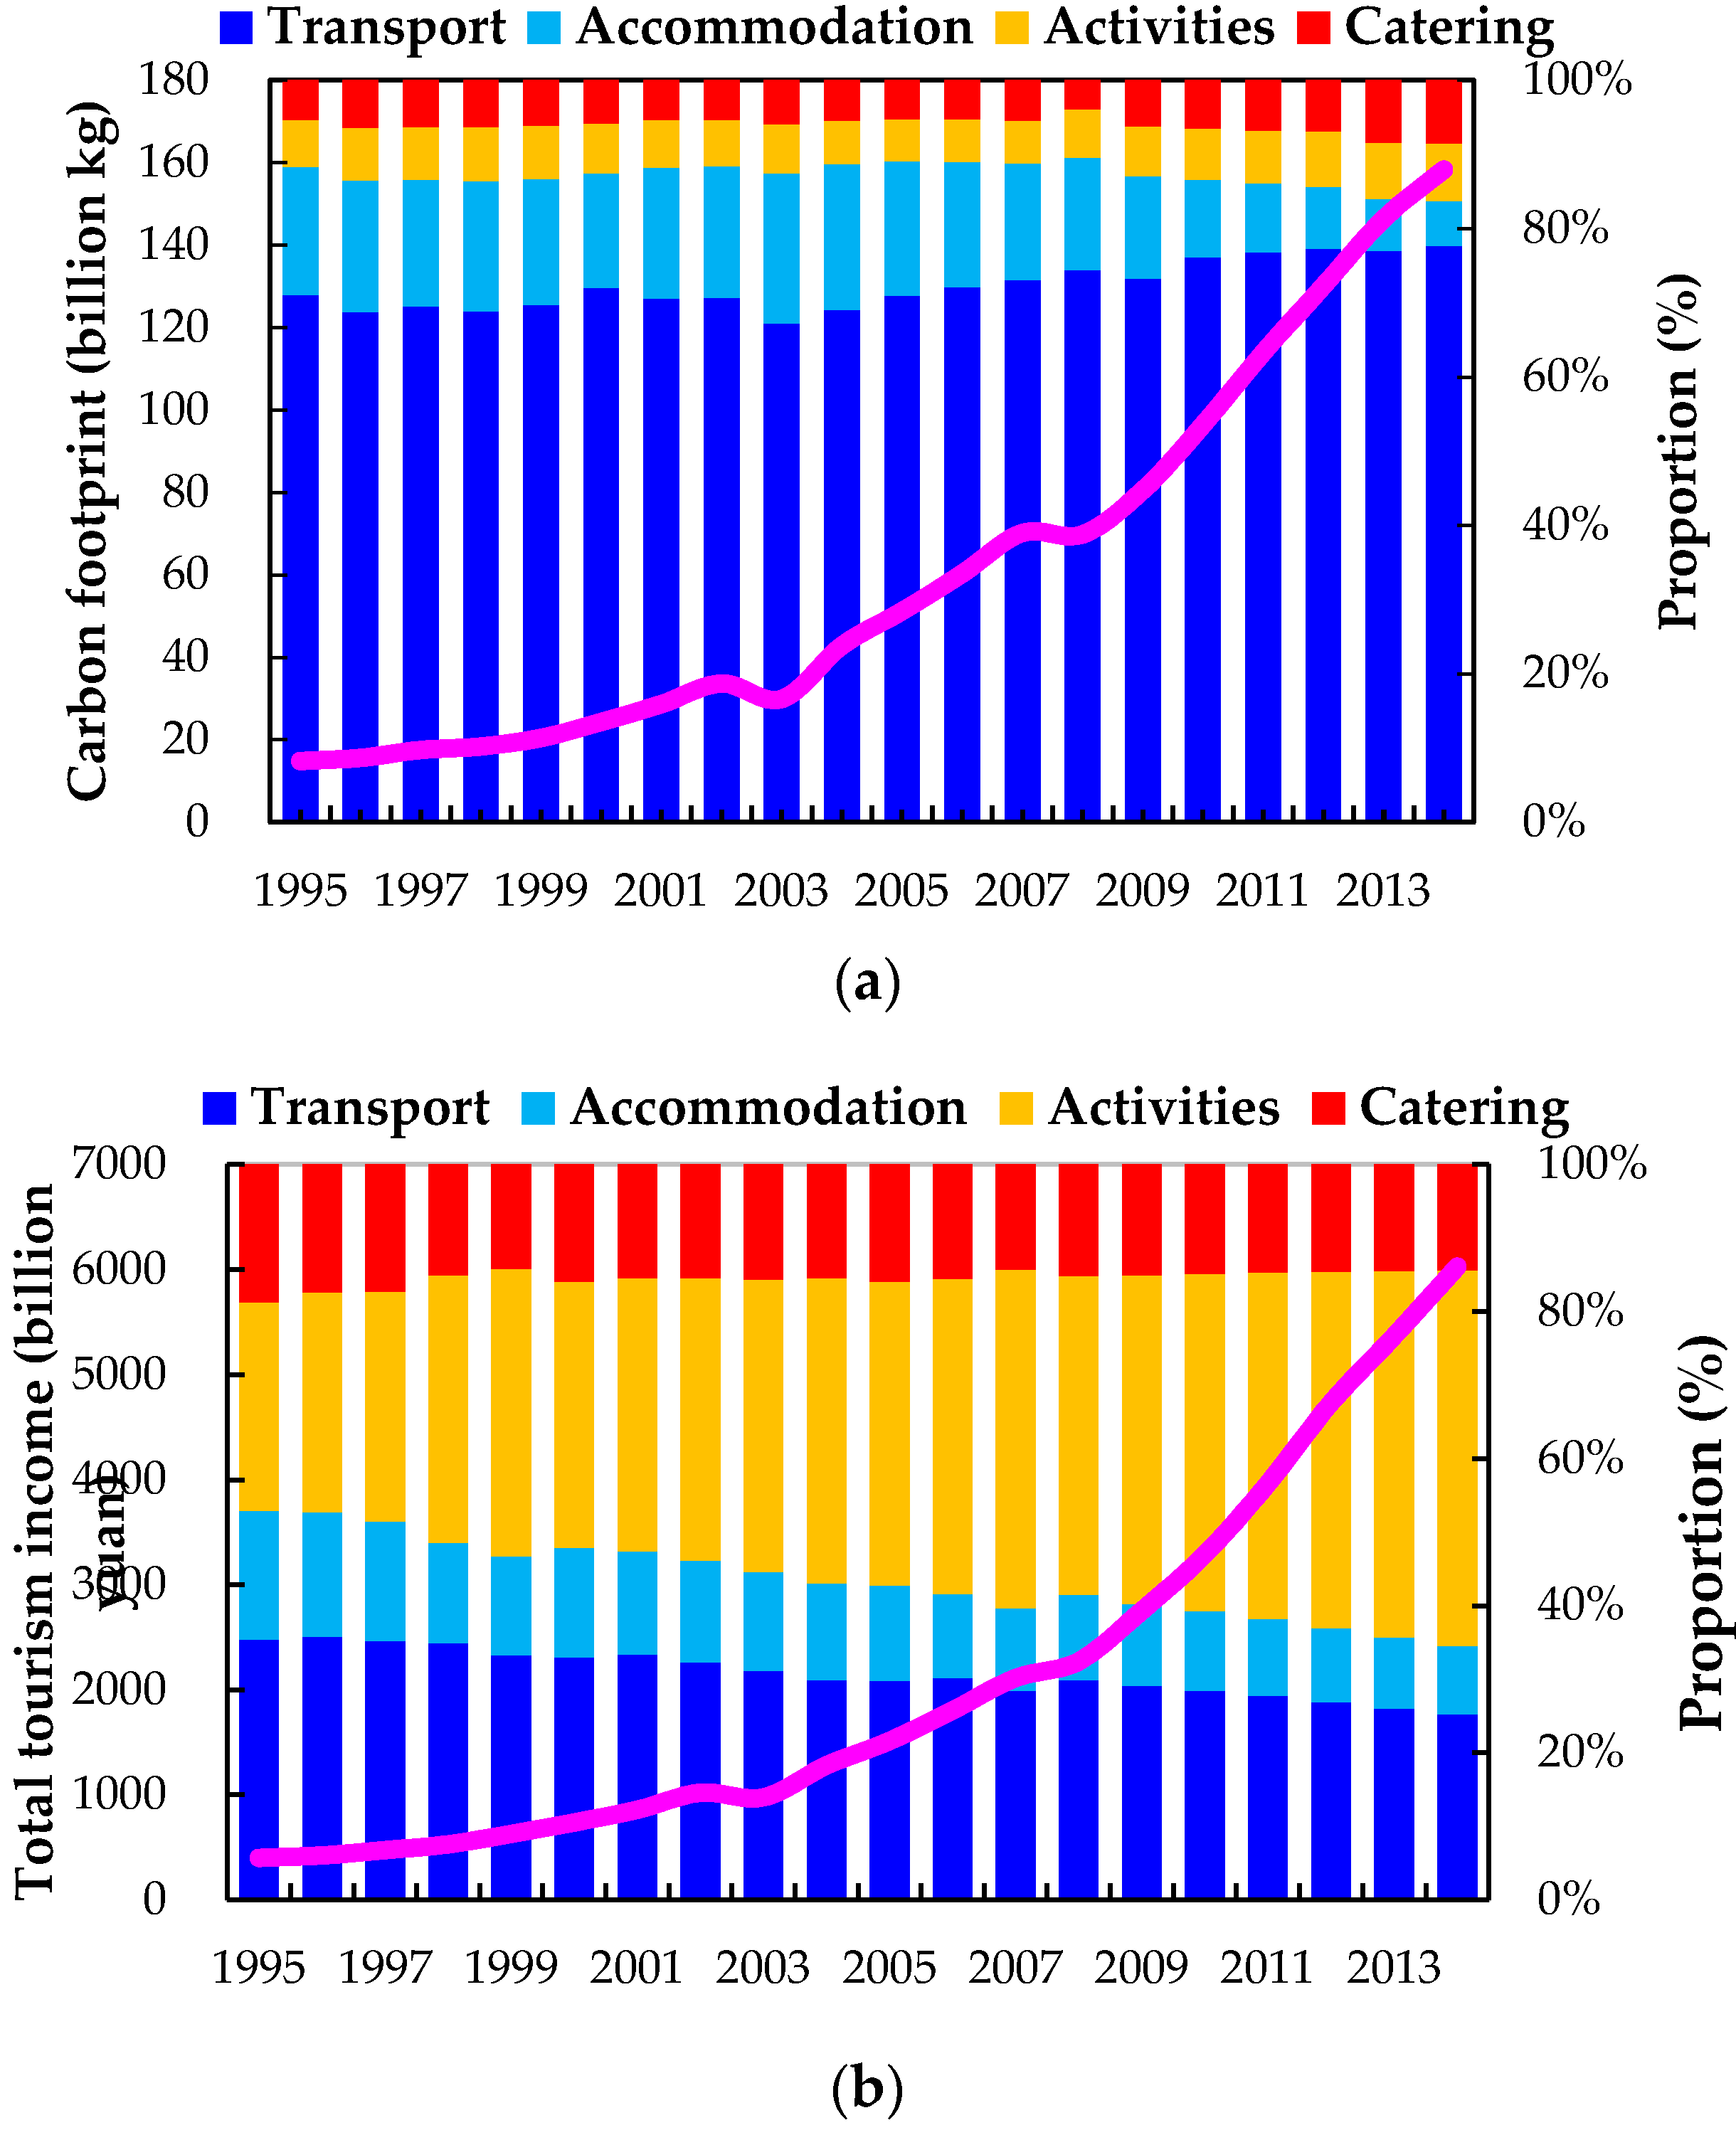
2.1. The Tourism Eco-Efficiency Measurement Method
Tourism involves several industries, including transportation, accommodation, catering and other industries. Three steps are taken to arrive at the tourism eco-efficiency measurement.
Step 1 Estimation of tourism-related CO2 emissions.
There are multiple ways of accounting for tourism CO
2 emissions, so figures can only be estimated. Two main methods of estimating tourism CO
2 emissions are the “top-down” and “bottom-up” carbon footprint method—the former estimates tourism CO
2 emissions by calculating the proportion of tourism CO
2 emissions to total CO
2 emissions, and the latter calculates tourism CO
2 emissions by analyzing CO
2 emissions in different tourism sectors. We draw lessons from the previous research, and utilized the “bottom-up” method to estimate the CO
2 emissions of tourism in China.
where
C indicates the tourism carbon footprint; and
,
,
and
represent the transportation carbon footprint, the accommodation carbon footprint, the tourism activity carbon footprint, and the catering carbon footprint, respectively. The detailed calculations are shown in Equations (2)–(5).
where,
l denotes the transportation mode (air, rail, car, and ferry),
means the number of visitors of mode
l,
refers to the per capita travel distance of mode
l,
stands for the CO
2 emission factor of mode
l,
presents the equivalence of mode
l;
j indicates the star level,
represents the number of beds of level
j,
denotes the average room occupancy rate of level
j,
means the CO
2 emission per bed night for level
j;
m refers to the visitor type,
stands for the number of tourists from type
m,
presents the average duration of stay for visitors from type
m,
indicates per capita daily CO
2 emissions from type
m;
k represents the food consumption type,
refers to the total visitor days,
denotes the per capita daily consumption of type
k, and
means the CO
2 emission factor of type
k.
This study argues that the domestic tourists take the airplane, the train, the car, and the ship, while all of the foreign tourists take the airplane. The number of tourists taking various types of transportation is determined by the proportion of the passenger volume of this type of transportation in the total passenger volume, the CO
2 emission factor, and the equivalence factor are learnt from the results by Yao et al. [
38] (
Table 1).
As the statistical data is mainly on star-rated hotels, therefore, this paper estimates the tourism accommodation carbon footprint of star-rated hotels. In terms of the study by Tang et al. [
39], the energy intensities and CO
2 emissions of different star levels of hotels are presented in the
Table 2.
In the absence of the statistics on the average duration of stay of domestic tourism, the disposal methods for China from the World Tourism Organization are adopted [
40], and domestic overnight visitors and day-trippers are estimated in accordance with the proportion of 3:7. According to China’s Tourism Statistics Bulletin, the average duration of stay of domestic overnight visitors is 2.81 days. The purposes of tourism are mainly sightseeing, family visits, leisure vacations, and business travel, and combined with the results presented by Wu et al. [
41], CO
2 emission is taken as 0.9 kg per capita daily.
This study assumes that the average daily food consumption of tourists is consistent with that of urban residents, and according to the conclusions drawn by Tan [
42], the CO
2 emission coefficients of various foods are shown in the
Table 3.
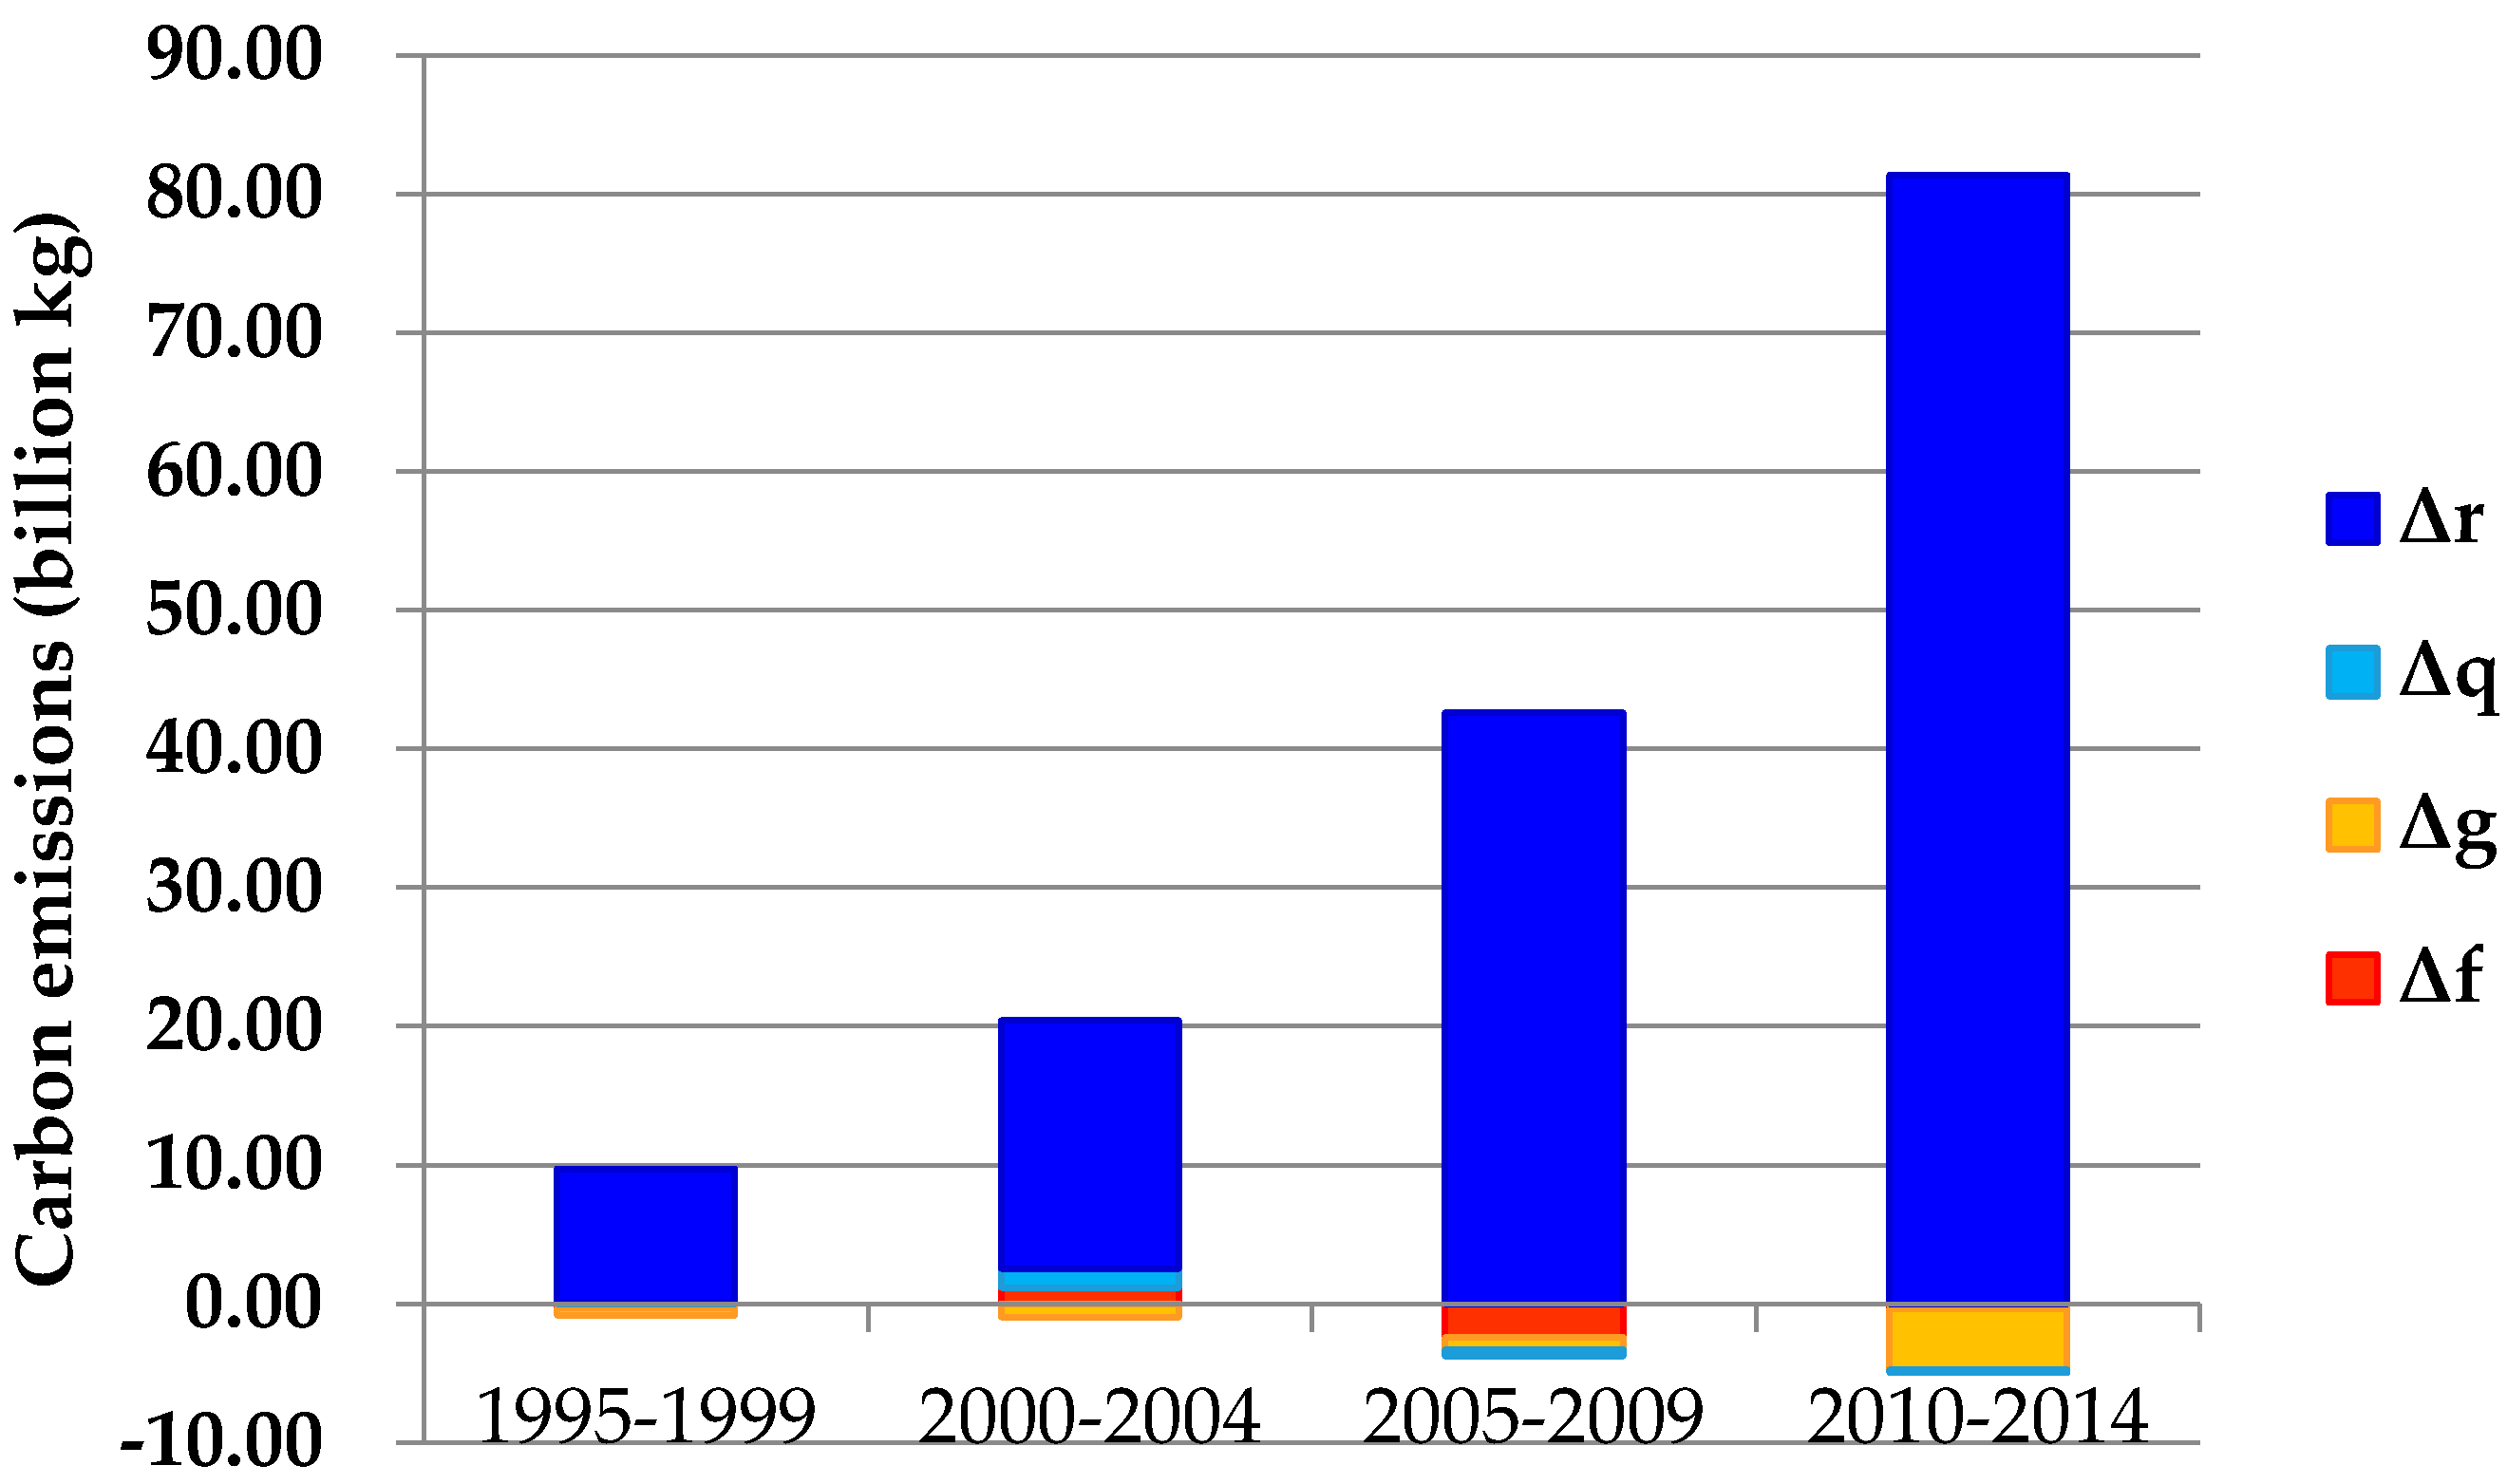
Step 2 Identification of the driving factors of the changes of tourism CO2 emissions using the Logarithmic Mean Divisia Index (LMDI).
In recent years, increasing numbers of scholars have applied structural decomposition analysis (SDA) to explore the driving factors of carbon emissions [
43]. The Logarithmic Mean Divisia Index (LMDI) method is a complete and non-residual decomposition method, and it is also a good way to study the mechanism of carbon emission changes [
44]. Based on Equations (2)–(5), this study uses LMDI to decompose the influencing factors of tourism CO
2 emissions in China. According to the Kaya identity, Equation (1) is extended as:
where
i indicates the sector in tourism
,
indicates the tourism income of sector
i,
refers to the total tourism income, and
denotes the total number of tourists. Let
,
,
, and
represent the carbon emission intensity factor, income structure factor, consumption level factor, and tourist scale factor, respectively. Then, tourism CO
2 emissions can be decomposed into four factors:
Tourism CO
2 emissions in the initial year and the target year are set as
and
, respectively, so tourism CO
2 emission changes from the initial year to the target year are as follows:
The LMDI method is used to decompose Equation (8), and the results obtained after the decomposition of various factors are expressed as follows:
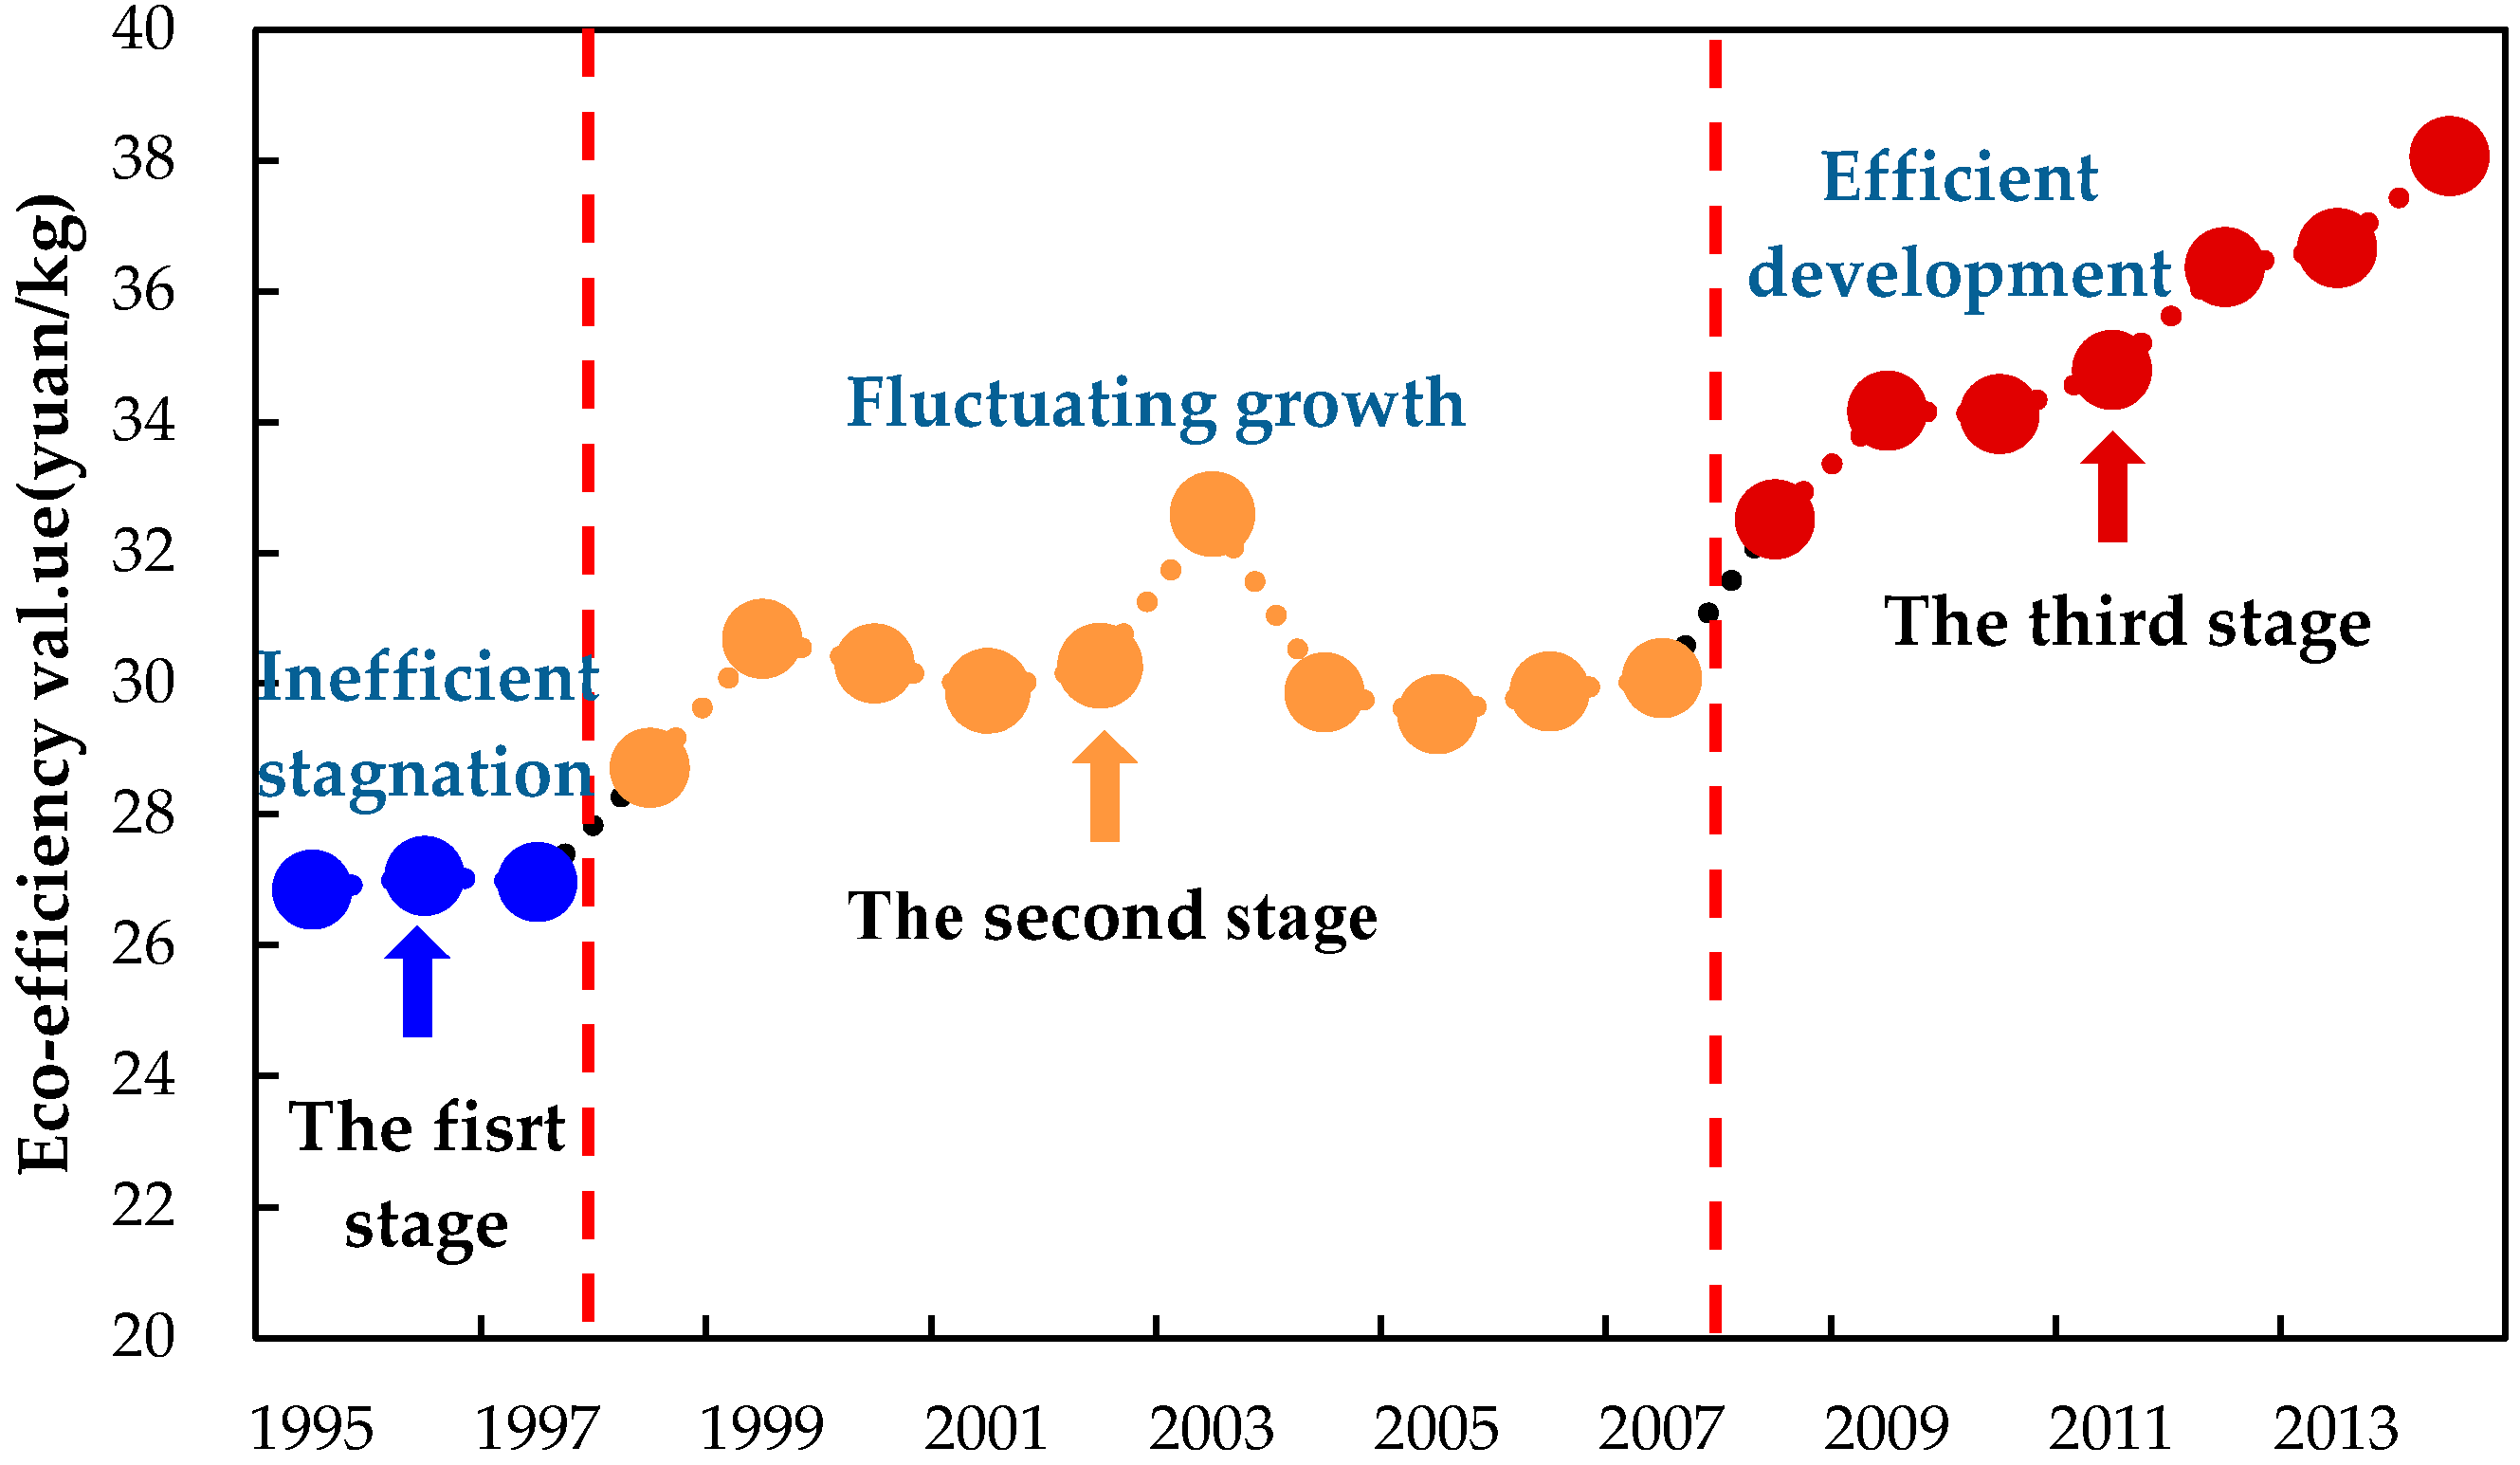
Step 3 Calculation of tourism eco-efficiency.
Based on the quantitative measurement framework of tourism eco-efficiency, tourism eco-efficiency (
E) is the ratio of the total tourism income (
V) to the tourism carbon footprint (
C):
where
indicates the carbon emission intensity of sector
i. According to Equation (13), the tourism eco-efficiency of China and various provinces are calculated respectively.
2.3. The Regression Analysis
The tourism eco-efficiency is described as the product of two factors in Equation (13), but since it can be affected by many factors, it is necessary to explain the influencing factors of tourism eco-efficiency theoretically. The environmental Kuznets curve (EKC) is the classic hypothesis of environmental economics; it expounds the relationship between economic development and environmental quality. Specifically, with the increase in income levels, environmental quality presents a degradation-improvement trend. Since then, the relationship between environmental quality and income has been further explored theoretically, and the scale effect, the technical effect, the structural effect, the environmental quality demand, environmental regulation, the market mechanism, the pollution-reduction investment, and other factors are also used to explain the relationship [
46,
47,
48]. Combined with previous research on the factors affecting eco-efficiency [
49,
50,
51,
52], this paper argues that the main influencing factors of tourism eco-efficiency are the scale effect, the structural effect, the technical effect, and the environmental regulation.
The scale effect: Tourism eco-efficiency is affected in two ways, namely, economic scale and population size. On the one hand, with the expansion of economic scale and the constant improvement of tourism development level, the public continuously put forward higher requirements for environmental quality in the process of tourism, and driven by internal demand and external competition, various regions, especially the regions with higher economic development levels, tend to intensify resource and environmental protection, so as to promote the improvement of the ecological efficiency of tourism. On the other hand, while promoting the increase in tourism income, the expansion of the tourism market scale will inevitably lead to the increase in resource consumption and environmental pollution emissions, and as the tourists’ comfort requirements for tourism transportation and accommodation grow, the environmental pollution emissions of tourism will multiply. Thus, this paper selects two indicators, which are per capita tourism income (PCTI) and number of visitors per capita (NVPC).
The structural effect: There are significant differences in growth rates, contributions to the national economy, energy and resource consumption, pollutant emissions, and other aspects between various sectors of tourism, and the tourism eco-efficiency in a region is reflected by the structures of various sectors. From the perspective of income, if tourism is dominated by transportation, accommodation, catering and other basic consumption factors, the regional tourism income will be relatively low; if shopping, entertainment, and other high-level consumption factors are dominant, the tourism income will be relatively high. From the emissions point of view, if the sectors with high energy consumption and high pollution are the main tourism sectors, the tourism pollution emissions will be more; if the sectors with low energy consumption and low pollution are the main tourism sectors, the tourism pollution emissions will be fewer. Therefore, the ratio of the star hotel’s revenue that accounts for total tourism income (RSHR) is adopted to reflect the impact of tourism structure on tourism eco-efficiency.
The technical effect: The endogenous growth theory argues that the economy can achieve the sustained growth without relying on external forces, and the decisive factor is technical progress. The resource utilization efficiency and pollution control capacity can be improved by the development and application of energy-saving emission-reduction technology, which is conducive to the reduction of carbon intensity, so as to have a positive impact on eco-efficiency. We use energy consumption per ten thousand yuan of tourism revenue (ECTR), and the discharge of wastewater per ten thousand yuan of tourism revenue (DWTR) as the two representative indicators.
The environmental regulation: The “Porter hypothesis” believes that reasonable and strict environmental regulation can promote an enterprise’s innovation activities, as well as improve productivity and competitiveness. The implementation of active and rigorous environmental policies can promote scientific and technological progress, improve resource utilization efficiency, reduce the environmental pollution, decrease the emissions of resource consumption, minimize the economic losses, and facilitate the growth of ecological efficiency. We use the ratio of pollution charges to tourism revenue (RPCR) to reflect environmental regulation.
To avoid the non-stationary problem of parameter estimation caused by different data dimensions, the natural logarithms of various variables are taken to preserve the characteristics of the panel data to the maximum extent. The following model is constructed:
where
t represents the year;
is the dependent variable that refers to the provincial tourism eco-efficiency, which calculated according to Equation (13), and is a continuous variable with approximately normal distribution after logarithmic transformation;
refers to the intercept term; PCTI, NVPC, RSHR, ECTR, DWTR, and RPCR are the independent variables;
,
,
,
,
,
are the parameters to be estimated; and
denotes the random error. Eviews 8.0 is used to conduct to the panel data regression analysis from 1995 to 2014. Before the panel data are used for regression analysis, the unit root test is required. If the variables under consideration are not stable, the model cannot be run; then, the Hausman test of the model is carried out to determine whether the fixed effect or the random effect coefficient estimation method is adopted.
It is indicated from the results that there are unit roots in various variables, and the stability requirement is met after the first order difference is carried out. According to the Hausman test, the panel data in this paper are determined as the fixed effect models; the regression is conducted by cross-section weights, and it is indicated that heteroscedasticity in different cross sections is allowed; the estimation method is based on the panel corrected standard errors (PCSE) method introduced by Beck and Katz [
53], and especially when the sample is relatively small, it can effectively deal with the complex panel error structures.


