Efficiency Analysis of Retail Chain Stores in Korea


Abstract
:1. Introduction
2. Literature Reviews
3. Methods
3.1. DEA
3.2. Data
3.3. Input/Output Measures
3.4. DEA Models
3.5. Tobit Regression Model
4. Discussion of Results
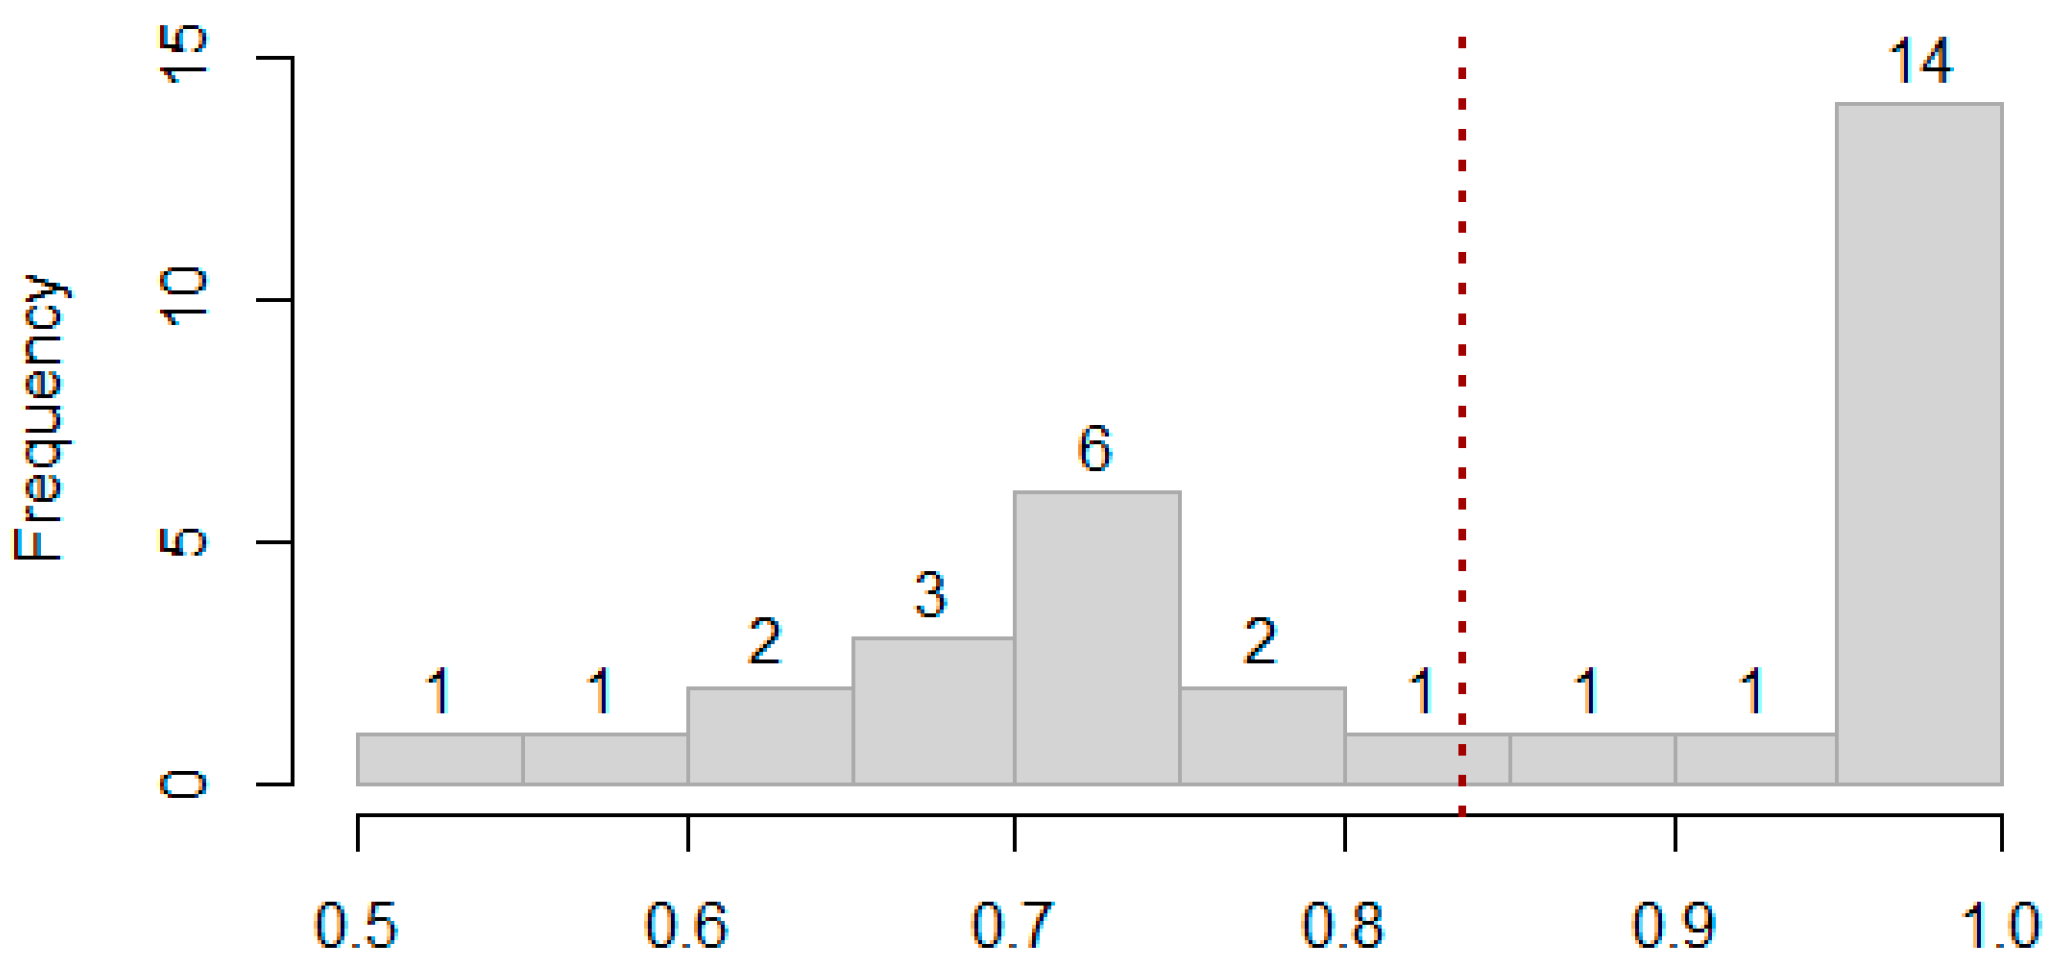
4.1. Efficiency Scores
4.2. Comparison of Efficiency
4.3. Tobit Regression Model
4.4. In-Depth Analysis of Significant Variables
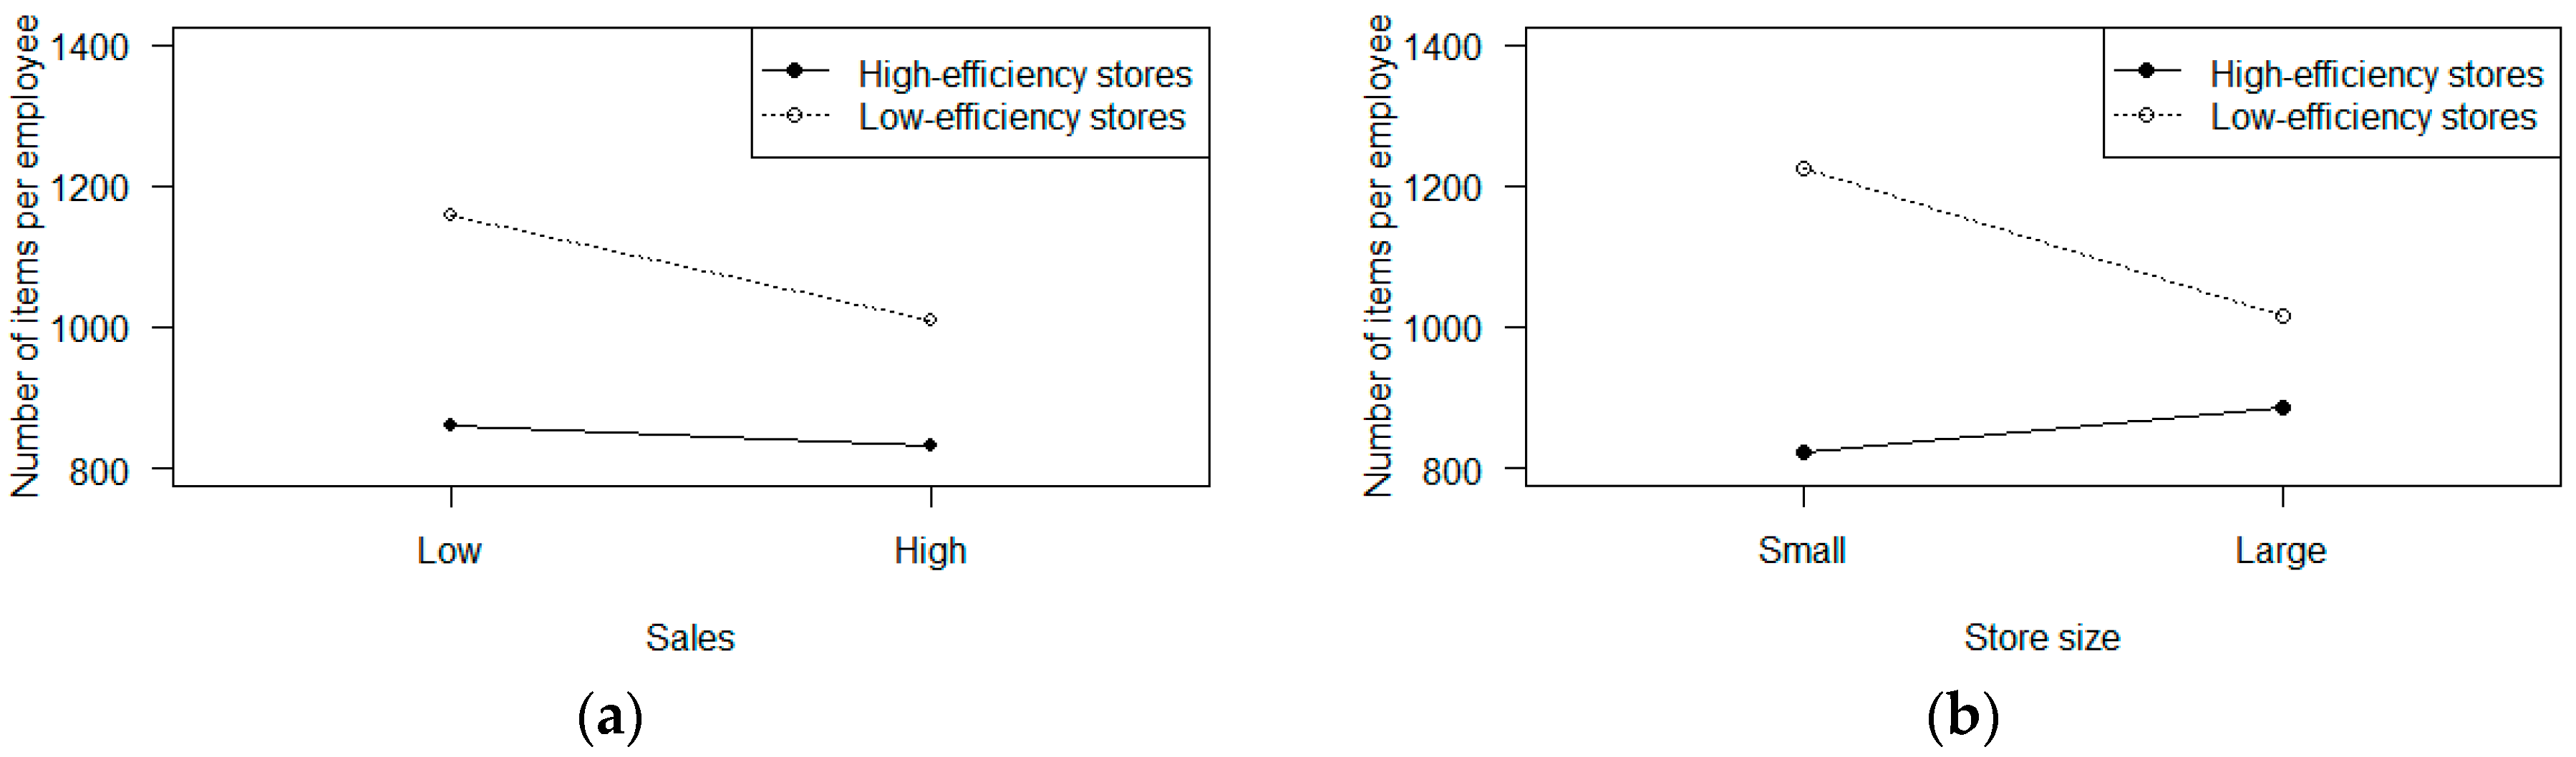
4.4.1. Number of Items per Employee
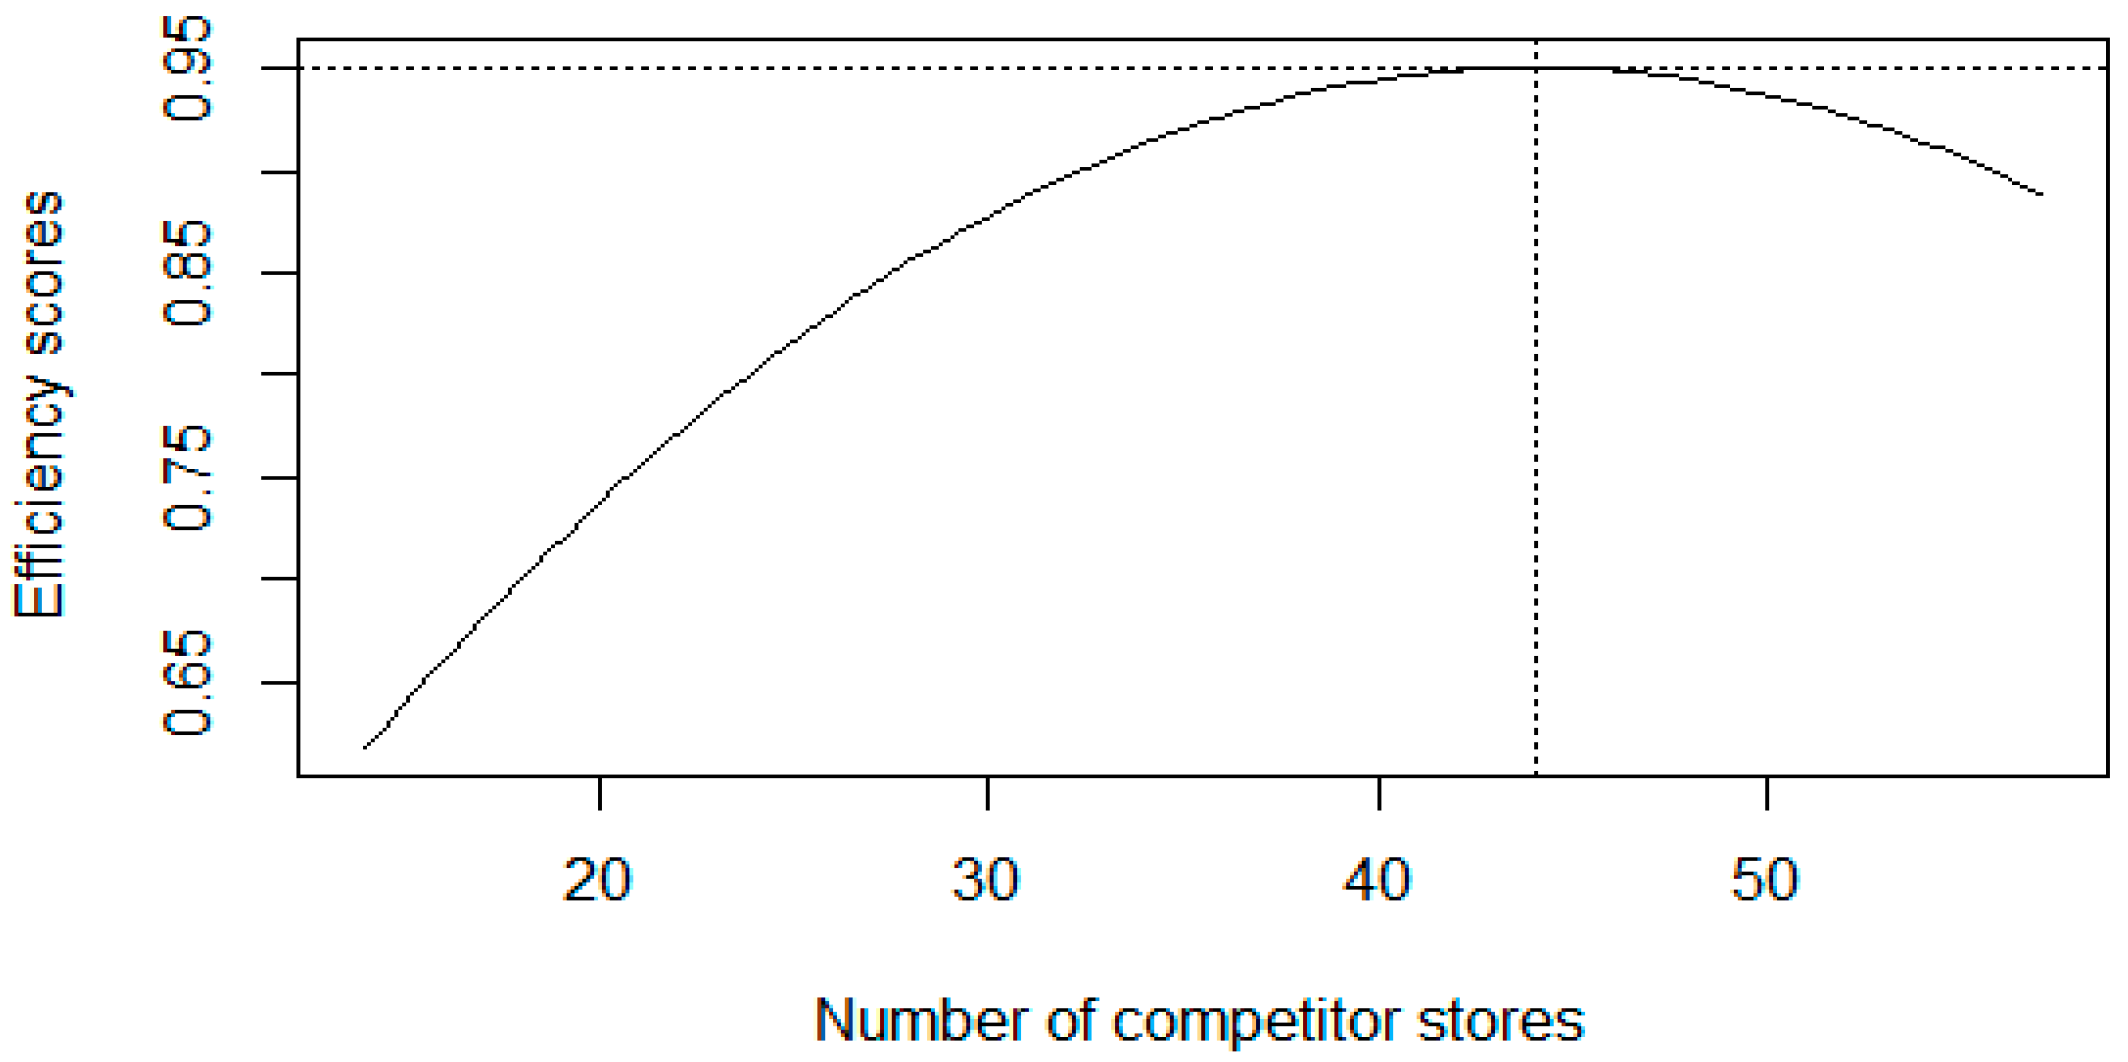
4.4.2. Number of Competitor Stores
5. Conclusions
Author Contributions
Conflicts of Interest
References
- Barros, C.P.; Alves, C.A. Hypermarket retail store efficiency in Portugal. Int. J. Retail Distrib. Manag. 2003, 31, 549–560. [Google Scholar] [CrossRef]
- Liu, J.S.; Lu, L.Y.; Lu, W.M.; Lin, B.J. Data envelopment analysis 1978–2010: A citation-based literature survey. Omega 2013, 41, 3–15. [Google Scholar] [CrossRef]
- Donthu, N.; Yoo, B. Retail productivity assessment using Data Envelopment Analysis. J. Retail. 1998, 74, 89–105. [Google Scholar] [CrossRef]
- Thomas, R.R.; Barr, R.S.; Cron, W.L.; Slocum, J.W., Jr. A process for evaluating retail store efficiency: A restricted DEA approach. Int. J. Res. Mark. 1998, 15, 487–503. [Google Scholar] [CrossRef]
- Keh, H.T.; Chu, S. Retail productivity and scale economies at the firm level: A DEA approach. Omega 2003, 31, 75–82. [Google Scholar] [CrossRef]
- Sellers-Rubio, R.; Mas-Ruiz, F. Economic efficiency in supermarkets: Evidence in Spain. Int. J. Retail Distrib. Manag. 2006, 34, 155–171. [Google Scholar] [CrossRef]
- Mostafa, M.M. Benchmarking the US specialty retailers and food consumer stores using data envelopment analysis. Int. J. Retail Distrib. Manag. 2009, 37, 661–679. [Google Scholar] [CrossRef]
- Gupta, A.; Mittal, S. Measuring retail productivity of food & grocery retail outlets using the DEA technique. J. Strat. Mark. 2010, 18, 277–289. [Google Scholar]
- Sharma, V.; Choudhary, H. Measuring operational efficiency of retail stores in Chandigarh Tri-city using DEA. J. Serv. Res. 2010, 10, 99–115. [Google Scholar]
- Barros, C.P. Efficiency measurement among hypermarkets and supermarkets and the identification of the efficiency drivers: A case study. Int. J. Retail Distrib. Manag. 2006, 34, 135–154. [Google Scholar] [CrossRef]
- Perrigot, R.; Barros, C.P. Technical efficiency of French retailers. J. Retail. Consum. Serv. 2008, 15, 296–305. [Google Scholar] [CrossRef]
- Yu, W.; Ramanathan, R. An assessment of operational efficiencies in the UK retail sector. Int. J. Retail Distrib. Manag. 2008, 36, 861–882. [Google Scholar] [CrossRef]
- Yu, W.; Ramanathan, R. An assessment of operational efficiency of retail firms in China. J. Retail. Consum. Serv. 2009, 16, 109–122. [Google Scholar] [CrossRef]
- Uyar, A.; Bayyurt, N.; Dilber, M.; Karaca, V. Evaluating operational efficiency of a bookshop chain in Turkey and identifying efficiency drivers. Int. J. Retail Distrib. Manag. 2013, 41, 331–347. [Google Scholar] [CrossRef]
- Gandhi, A.; Shankar, R. Efficiency measurement of Indian retailers using Data Envelopment Analysis. Int. J. Retail Distrib. Manag. 2014, 42, 500–520. [Google Scholar] [CrossRef]
- Charnes, A.; Cooper, W.W.; Rhodes, E. Measuring the efficiency of decision making units. Eur. J. Oper. Res. 1978, 2, 429–444. [Google Scholar] [CrossRef]
- Banker, R.D.; Charnes, A.; Cooper, W.W. Some models for estimating technical and scale inefficiencies in Data Envelopment Analysis. Manag. Sci. 1984, 30, 1078–1092. [Google Scholar] [CrossRef]
- Tobin, J. Estimation of relationships for limited dependent variables. Econometrica 1958, 26, 24–36. [Google Scholar] [CrossRef]
- Assaf, A.G.; Barros, C.; Sellers-Rubio, R. Efficiency determinants in retail stores: A Bayesian framework. Omega 2011, 39, 283–292. [Google Scholar] [CrossRef]
- Sellers-Rubio, R.; Mas-Ruiz, F. Technical efficiency in the retail food industry: The influence of inventory investment, wage levels, and age of the firm. Eur. J. Mark. 2009, 43, 652–669. [Google Scholar] [CrossRef]
- Dubelaar, C.; Bhargava, M.; Ferrarin, D. Measuring retail productivity: What really matters? J. Bus. Res. 2002, 55, 417–426. [Google Scholar] [CrossRef]
- Wilcoxon, F. Individual comparisons by ranking methods. Biom. Bull 1945, 1, 80–83. [Google Scholar] [CrossRef]
- Broniarczyk, S.M.; Hoyer, W.D. Retail Assortment: More ≠ Better. In Retailing in the 21st Century, 2nd ed.; Krafft, M., Mantrala, M.K., Eds.; Springer: Berlin/Heidelberg, Germany, 2010; pp. 271–284. [Google Scholar]
- Green, A.; Harris, C.; Mayes, D. Estimation of technical inefficiency in manufacturing industry. Appl. Econ. 1991, 23, 1637–1647. [Google Scholar] [CrossRef]
- Nickell, S.J. Competition and corporate performance. J. Political Econ. 1996, 104, 724–746. [Google Scholar] [CrossRef]
- Nickell, S.; Nicolitsas, D.; Dryden, N. What makes firms perform well? Eur. Econ. Rev. 1997, 41, 783–796. [Google Scholar] [CrossRef]
- Disney, R.; Haskel, J.; Heden, Y. Restructuring and productivity growth in UK manufacturing. Econ. J. 2003, 113, 666–694. [Google Scholar] [CrossRef]
- Aghion, P.; Bloom, N.; Blundell, R.; Griffith, R.; Howitt, P. Competition and innovation: An inverted-U relationship. Q. J. Econ. 2005, 120, 701–728. [Google Scholar]
- Yun, J.; Won, D.; Park, K. Dynamics from open innovation to evolutionary change. J. Open Innov. Technol. Mark. Complex. 2016, 2, 1–22. [Google Scholar] [CrossRef]
- Yun, J. How do we conquer the growth limits of capitalism? Schumpeterian dynamics of open innovation? J. Open Innov. Technol. Mark. Complex. 2015, 1, 1–20. [Google Scholar] [CrossRef]
- Witt, U. Capitalism as a complex adaptive system and its growth. J. Open Innov. Technol. Mark. Complex. 2017, 3, 1–15. [Google Scholar] [CrossRef]
- Leydesdorff, L.; Ivanova, I. Open Innovation and triple helix models of innovation: Can synergy in innovation systems be measured? J. Open Innov. Technol. Mark. Complex. 2016, 2, 1–12. [Google Scholar]
- Schiuma, G.; Lerro, A. The business model prism: Managing and innovating business models of arts and cultural organization. J. Open Innov. Technol. Mark. Complex. 2017, 3, 1–13. [Google Scholar] [CrossRef]


| Studies | Units | Inputs | Outputs |
|---|---|---|---|
| Donthu and Yoo (1998) | 24 outlets of a USA fast food restaurant chain | Store size, Store manager experience, Store location, Promotion expenses | Sales, Customer satisfaction |
| Thomas et al., (1998) | 520 outlets of a USA multi-store, multi-market retailer | Full-time employees, Full-to-part-time employees, Salaries, Employee tenure, Store manager tenure, Store age, Occupancy expenses, Population, Household income, Households, Proximity, Inventory, Transactions, Employee turnover, Shrinkage | Sales, Profits |
| Keh and Chu (2003) | 13 outlets of a USA grocery store chain | Labor (floor staff and management wages and benefits), Capital (occupancy, utilities, maintenance and general expenses) | Intermediate output: Accessibility, Assortment, Assurance of product delivery, Product information, Ambience Final output: Sales revenue |
| Barros and Alves (2003) | 47 outlets of a Portuguese hypermarket retail company | Full-time employees, Part-time employees, Cost of labor, Absenteeism, Area of outlets, Number of points of sale (POS), Age of the outlet, Inventory, Other costs | Sales, Operational results |
| Sellers-Rubio and Mas-Ruiz (2006) | 100 supermarket chains in Spain | Employees, Outlets, Capital | Sales, Profits |
| Mostafa (2009) | 45 USA retailers | Employees, Assets | Revenue, Market value, Earn share |
| Gupta and Mittal (2010) | 43 outlets of a Indian grocery retailer | Area of outlets, Number of SKU(Stock Keeping Unit)s, Number of POS machines, Labor cost of employees, Number of employees, Working hours of employees | Sales, Customer conversion ratio |
| Sharma and Choudhary (2010) | 200 Indian retail stores | Size of retail store, Manager‘s experience, Location of retail store | Sales, Customer satisfaction |
| Studies | Units | Inputs | Outputs |
|---|---|---|---|
| Barros (2006) | 22 hypermarket and supermarket firms in Portugal | Labor, Capital Tobit regression model variables: Share, Outlets, Ownership, Regulation, Location | Sales, Operational results |
| Perrigot and Barros (2008) | 11 French generalist retailers | Labor, Capital, Total costs Tobit regression model variables: Trend, Square trend, Quoted, mergers and aquisitions (M&A), Group, International | Turnover, Profits |
| Yu and Ramanathan (2008) | 41 retail companies in the UK | Total assets, Shareholders funds, Employees Tobit regression model variables: Head office location, Types of ownership, Years of incorporation, Legal form, Retail characteristic | Turnover, Profit before taxation |
| Yu and Ramanathan (2009) | 61 retail firms in China | Total selling floor space, Employees Tobit regression model variables: Head office location, Firm nationality, Years of incorporation, Ownership type, Retail characteristic | Sales, Profit before taxation |
| Uyar et al., (2013) | 79 bookshops within a bookshop chain in Turkey | Area, Population, Inventory, Employee, Salaries, Other costs Tobit regression model variables: Education of manager, Experience of manager, Experience of staff, Age of bookshop | Sales, Profit |
| Gandhi and Shankar (2014) | 18 Indian retailers | Cost of labor, Capital employed Tobit regression model variables: Number of outlets, Ownership, Age since incorporation, Mergers and acquisitions | Sales, Profit |
| Variables | Minumum | Maximum | Mean | Standard Deviation |
|---|---|---|---|---|
| Inputs | ||||
| Store size | 22 | 218 | 103.9 | 51.6 |
| Number of items | 4177.00 | 20,939.00 | 12,156.40 | 3460.70 |
| Number of employees | 6 | 23 | 12.9 | 3.9 |
| Rental cost | 1061.60 | 30,020.20 | 8603.70 | 5485.70 |
| Outputs | ||||
| Sales revenue | 1672.00 | 10,999.00 | 4651.20 | 1872.10 |
| Number of customers | 305 | 1636.00 | 831.3 | 287.6 |
| Tobit model variables | ||||
| Store age | 12 | 98 | 45.4 | 22.1 |
| Number of items per unit area | 73.1 | 273.1 | 135.4 | 50.9 |
| Number of items per employee | 522.1 | 1789.70 | 981.2 | 288.5 |
| Trade area index | 0.314 | 0.757 | 0.479 | 0.113 |
| Number of competitor stores | 14 | 57 | 34.8 | 11.9 |
| Variables | Estimate | Std. Error | z Value | p-Values |
|---|---|---|---|---|
| Store age | 0.0011525 | 0.0015299 | 0.753 | 0.45128 |
| Number of items per unit area | 0.001473 | 0.0007993 | 1.843 | 0.06536 |
| Number of items per employee | −0.0004210 | 0.0001429 | −2.945 | 0.00322 ** |
| Trade area index | −0.3490104 | 0.3113706 | −1.121 | 0.26234 |
| Number of competitor stores | 0.0067086 | 0.0025178 | 2.664 | 0.00771 ** |
| R-Squared = 0.6469811, Adjusted R-Squared = 0.5790929 | ||||
| Variables | Estimate | Std. Error | z value | p-values |
|---|---|---|---|---|
| Store age | 0.0008127 | 0.0014315 | 0.568 | 0.57024 |
| Number of items per unit area | 0.0014026 | 0.0007522 | 1.865 | 0.06224 |
| Number of items per employee | −0.0004082 | 0.0001345 | −3.036 | 0.00240 ** |
| Trade area index | −0.3134973 | 0.2904058 | −1.080 | 0.28036 |
| Number of competitor stores | 0.0325403 | 0.012631 | 2.576 | 0.00999 ** |
| Square number of competitor stores | −0.0003695 | 0.0001767 | −2.091 | 0.03655 * |
| R-Squared = 0.6469811, Adjusted R-Squared = 0.5790929 | ||||
© 2017 by the authors. Licensee MDPI, Basel, Switzerland. This article is an open access article distributed under the terms and conditions of the Creative Commons Attribution (CC BY) license (http://creativecommons.org/licenses/by/4.0/).
Share and Cite
Ko, K.; Chang, M.; Bae, E.-S.; Kim, D. Efficiency Analysis of Retail Chain Stores in Korea. Sustainability 2017, 9, 1629. https://doi.org/10.3390/su9091629
Ko K, Chang M, Bae E-S, Kim D. Efficiency Analysis of Retail Chain Stores in Korea. Sustainability. 2017; 9(9):1629. https://doi.org/10.3390/su9091629
Chicago/Turabian StyleKo, Kyungwan, Meehyang Chang, Eun-Song Bae, and Daecheol Kim. 2017. "Efficiency Analysis of Retail Chain Stores in Korea" Sustainability 9, no. 9: 1629. https://doi.org/10.3390/su9091629
APA StyleKo, K., Chang, M., Bae, E.-S., & Kim, D. (2017). Efficiency Analysis of Retail Chain Stores in Korea. Sustainability, 9(9), 1629. https://doi.org/10.3390/su9091629