Estimation of Greenhouse Gas Emissions from the EU, US, China, and India up to 2060 in Comparison with Their Pledges under the Paris Agreement


Abstract
:1. Introduction
2. Materials and Methods
2.1. Carbon Dioxide (CO2) Emission Model Based on Final Consumption by Sector
2.2. Non-Fossil CO2 GHG Emissions Data
3. Results and Discussion
3.1. China
3.2. EU
3.3. US
3.4. India
3.5. Comparisons and Actions among Different Countries
4. Conclusions
- (1)
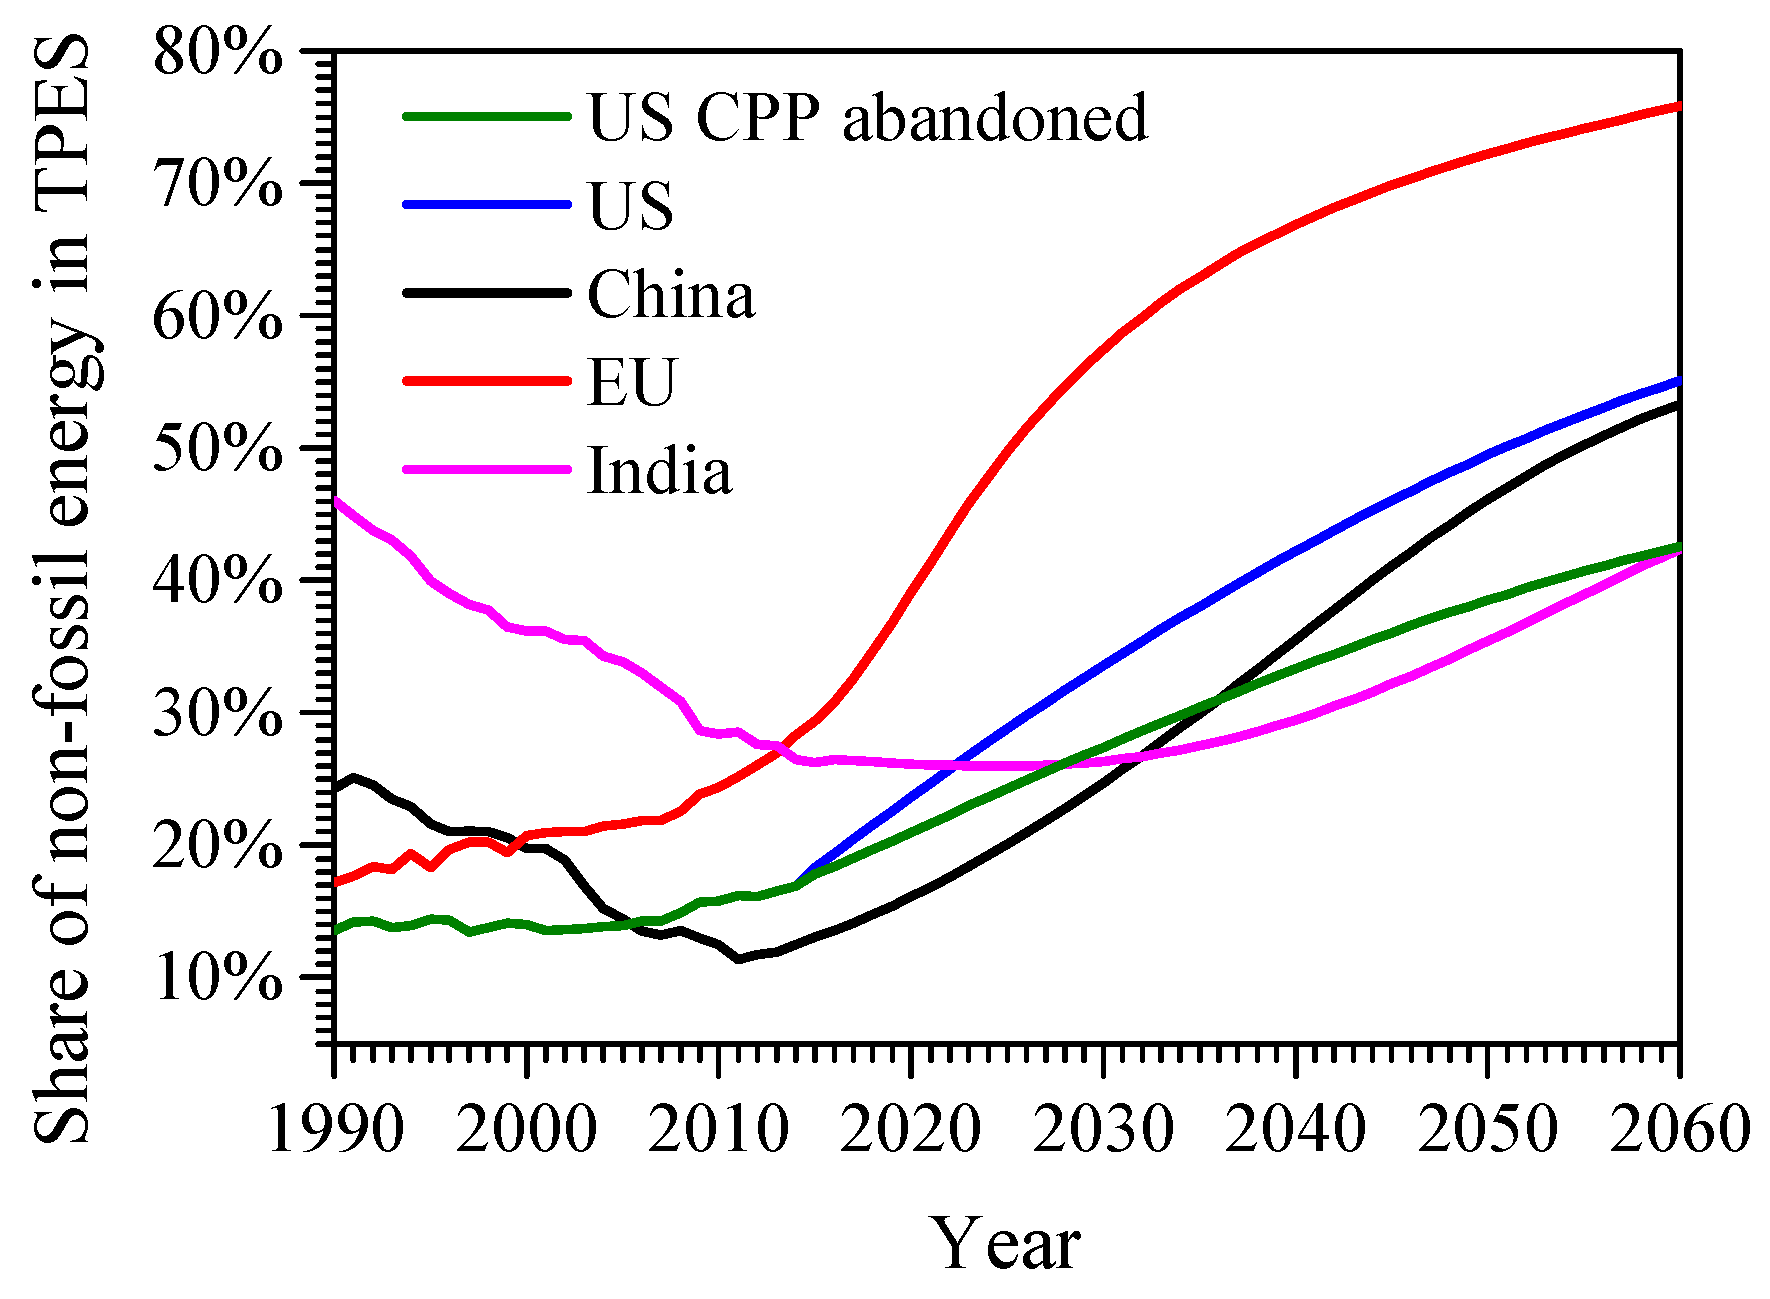
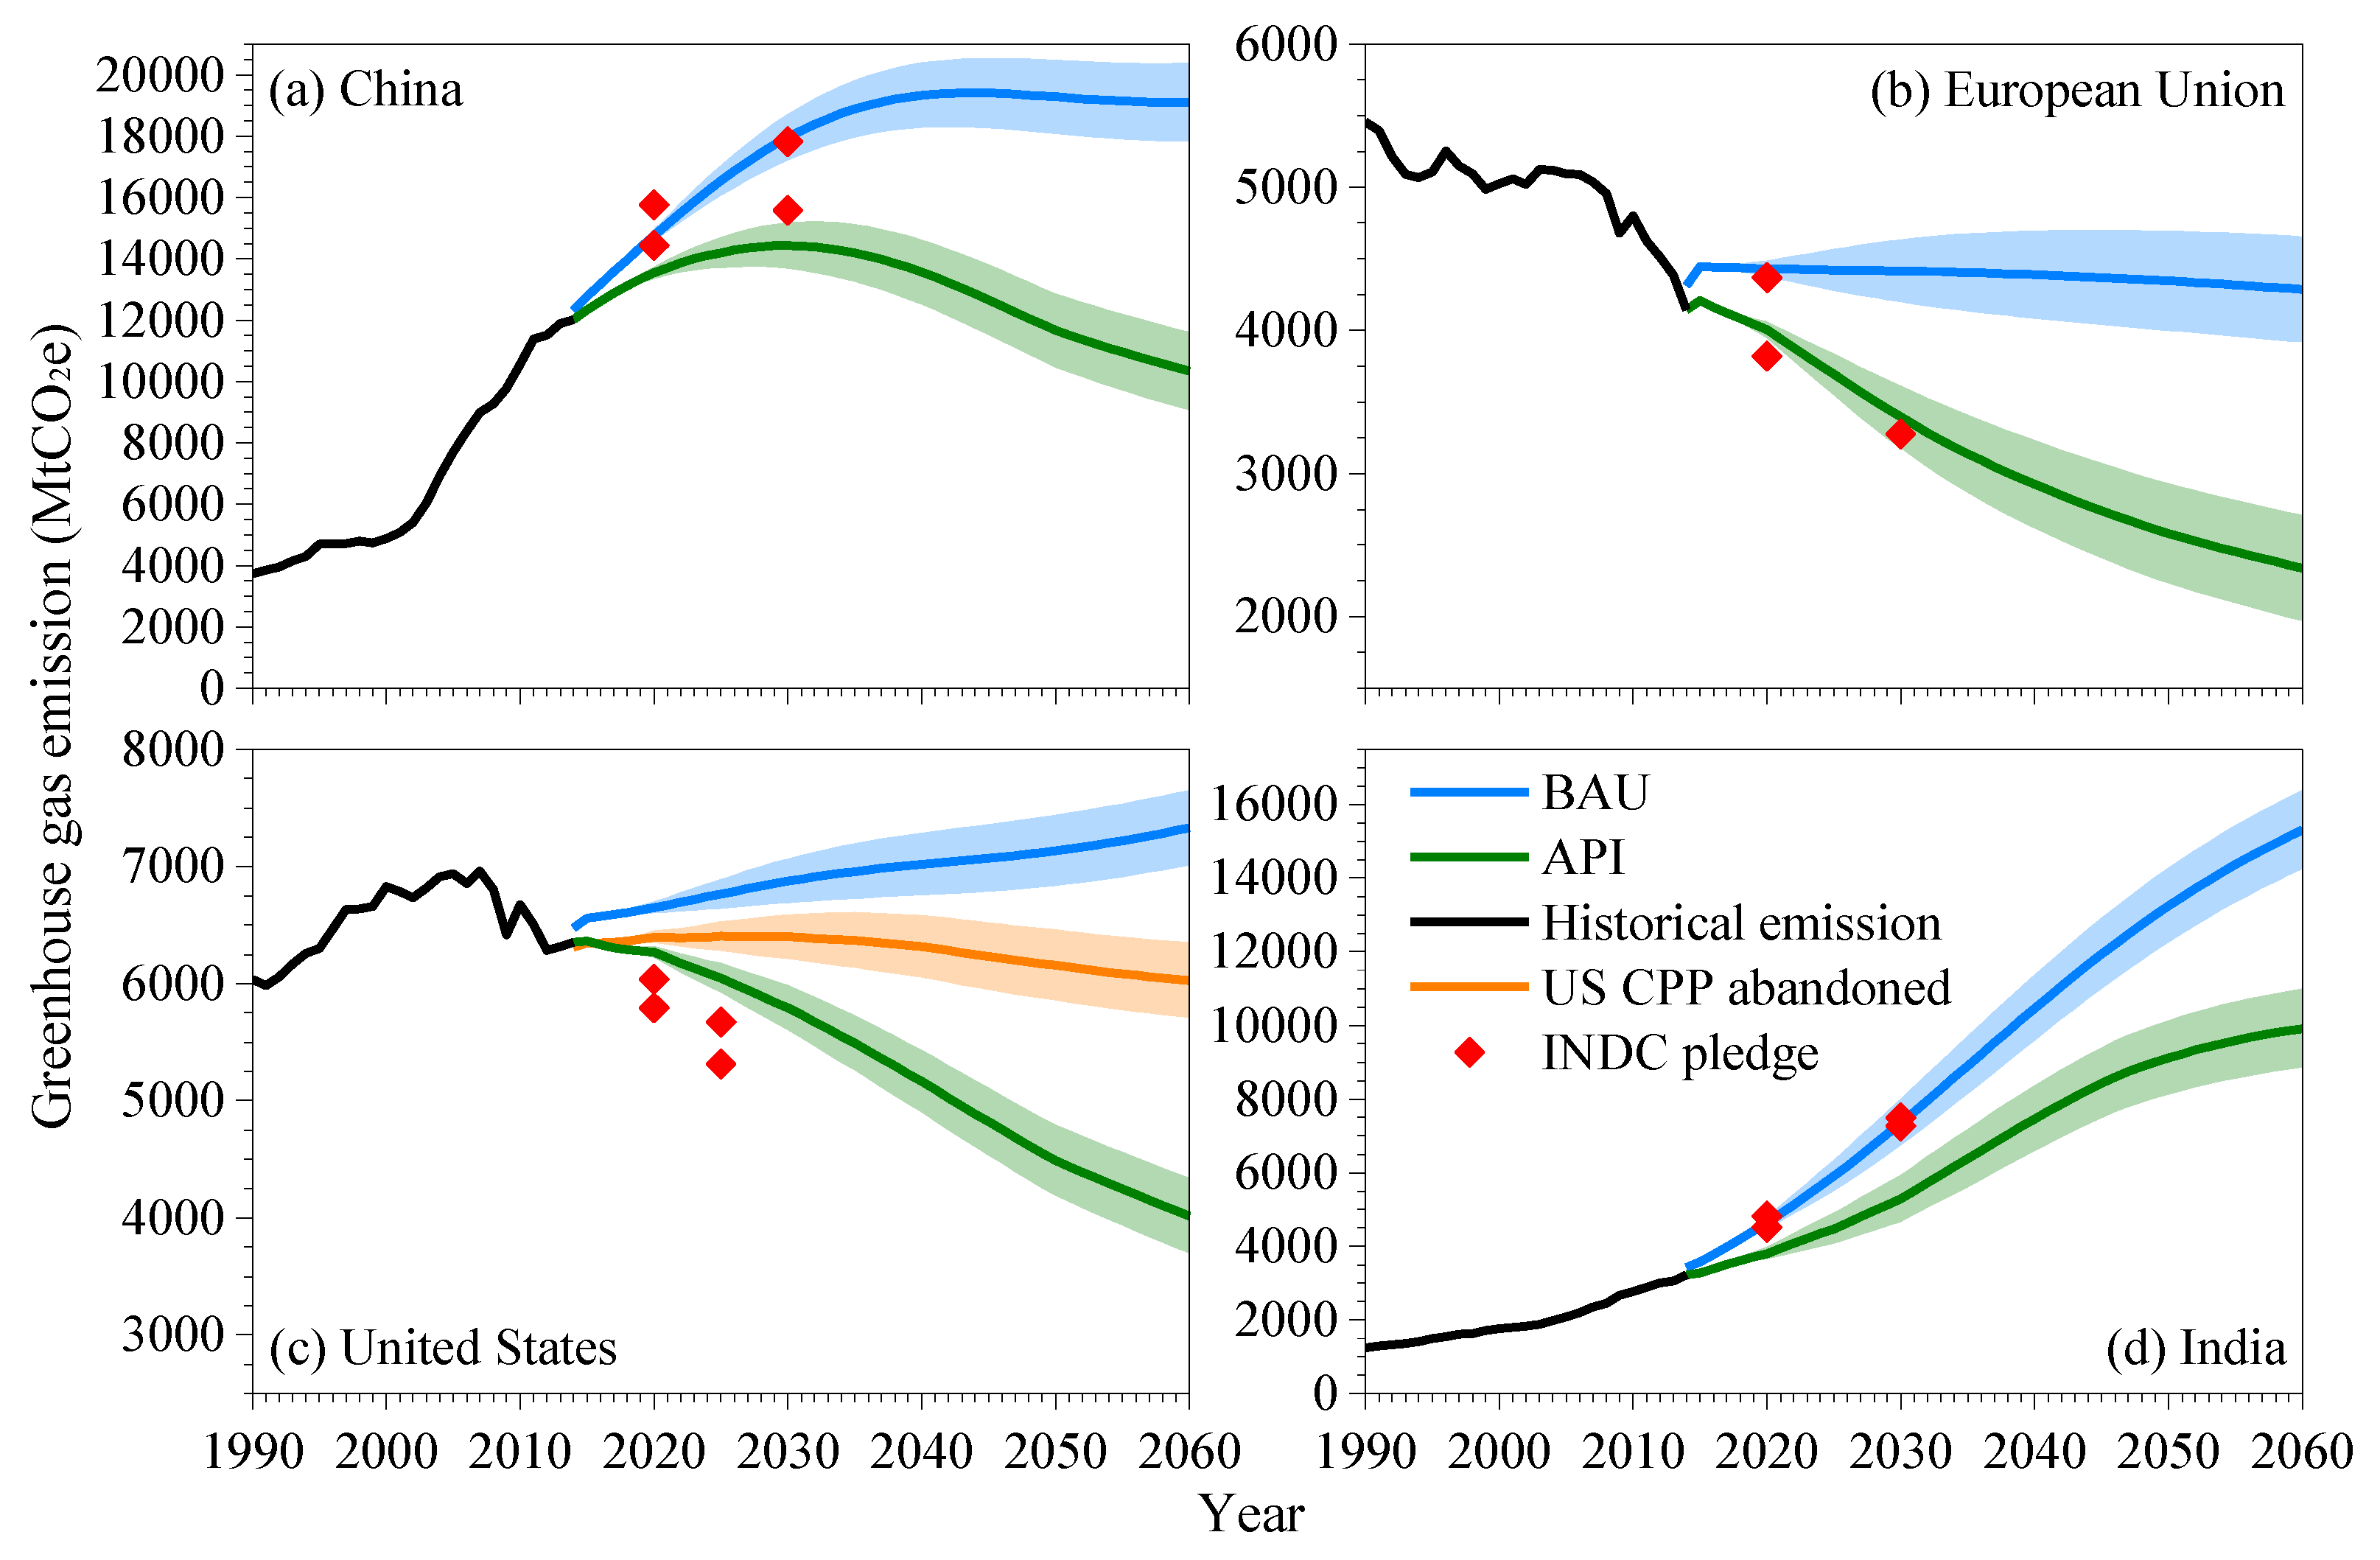
- In API, with all existing energy policies fully implemented, the EU’s emissions fell from 4160 MtCO2e in 2020 to 2340 MtCO2e in 2060, while the US’s emissions fell from 6330 to 4020 MtCO2e during the same period. However, if the CPP were to be abandoned, the US’s GHG emissions would remain above 6000 MtCO2e/year until 2060. China’s emissions peaked in 2030 (14,428 ± 747 MtCO2e) and then rapidly slowed, while India’s emissions grew until 2060 and may reach 10,000 MtCO2e.
- (2)
- The INDCs for the EU and US were remarkably ambitious in terms of emission reductions compared with BAU. The US is aiming for a reduction of more than 700 MtCO2e in 2020 and 1300 MtCO2e in 2025, while the EU is aiming for a reduction of more than 300 MtCO2e in 2020 and 1100 MtCO2e in 2030. It was found that the EU is probably able to achieve its pledge, while the US will still have a deficit of 370 MtCO2e in 2025 under the CPP.
- (3)
- In BAU, China’s GHG emissions were almost equal to the minimum INDC target in terms of intensity (GHG emission per GDP), but the peak occurred in 2044 (19,409 ± 1124 MtCO2e), which was 14 years later than the Chinese pledge. India’s emissions were already close to the strict INDC emission intensity target. In API, China and India both achieved an extra reduction of about 2000 MtCO2e exceeding their INDC targets in 2030.
- (4)
- Acceleration of clean energy process is essential to reach a more ambitious global reduction. Developed countries need incentive policies to ensure their target in the next decade and provide developing countries with technology support to help them reverse the increasing trend on fossil consumption.
Acknowledgments
Author Contributions
Conflicts of Interest
References
- Rogelj, J.; den Elzen, M.; Höhne, N.; Fransen, T.; Fekete, H.; Winkler, H.; Schaeffer, R.; Fu, S.; Riahi, K.; Meinshausen, M. Paris Agreement climate proposals need a boost to keep warming well below 2 °C. Nature 2016, 534, 631–639. [Google Scholar] [CrossRef] [Green Version]
- Greenblatt, J.B.; Wei, M. Assessment of the climate commitments and additional mitigation policies of the United States. Nat. Clim. Chang. 2016, 6, 1090–1093. [Google Scholar] [CrossRef]
- Dai, H.; Masui, T.; Matsuoka, Y.; Fujimori, S. Assessment of China’s climate commitment and non-fossil energy plan towards 2020 using hybrid AIM/CGE model. Energy Policy 2011, 39, 2875–2887. [Google Scholar] [CrossRef]
- Climate Action Tracker—Rating Countries. Available online: http://climateactiontracker.org/countries.html (accessed on 22 June 2017).
- World Resources Institute—CAIT—Historical Emissions Data. Available online: http://www.wri.org/resources/data-sets/cait-historical-emissions-data-countries-us-states-unfccc (accessed on 22 June 2017).
- International Energy Agency—Statistics. Available online: https://www.iea.org/statistics/ (accessed on 22 June 2017).
- Intergovernmental Panel on Climate Change (IPCC). Climate Change 2007: Mitigation; Contribution of Working Group III to the Fourth Assessment Report of the Intergovernmental Panel on Climate Change; Cambridge University Press: Cambridge, UK; New York, NY, USA, 2007; pp. 169–250. ISBN 978-0-521-70598-1. [Google Scholar]
- Intergovernmental Panel on Climate Change (IPCC). Climate Change 2014: Mitigation of Climate Change; Contribution of Working Group III to the Fifth Assessment Report of the Intergovernmental Panel on Climate Change; Cambridge University Press: Cambridge, UK; New York, NY, USA, 2014; pp. 351–410. ISBN 978-1-107-65481-5. [Google Scholar]
- O’Mahony, T. Decomposition of Ireland’s carbon emissions from 1990 to 2010: An extended Kaya identity. Energy Policy 2013, 59, 573–581. [Google Scholar] [CrossRef]
- Li, W.; Ou, Q.; Chen, Y. Decomposition of China’s CO2 emissions from agriculture utilizing an improved Kaya identity. Environ. Sci. Pollut. Res. Int. 2014, 21, 13000–13006. [Google Scholar] [CrossRef] [PubMed]
- Yuan, L.; Pan, J.H. Disaggregation of carbon emission drivers in Kaya identity and its limitations with regard to policy implications. Adv. Clim. Chang. Res. 2013, 9, 210–215. (In Chinese) [Google Scholar] [CrossRef]
- Schäfer, A. Structural change in energy use. Energy Policy 2005, 33, 429–437. [Google Scholar] [CrossRef]
- United Nations Industrial Development Organization. Industrial Development Report 2013; UNIDO: Vienna, Austria, 2014; pp. 15–28. ISBN 978-92-1-106451-3. [Google Scholar]
- National Health and Family Planning Commission of the People’s Republic of China—Chinese Population Is Supposed to Reach the Peak of 1.45 Billion in 2030. Available online: http://news.xinhuanet.com/live/2016-01/11/c_1117730833.htm (accessed on 1 November 2016). (In Chinese).
- General Office of the State Council of the People’s Republic of China—Energy Development Strategy Action Plan (2014–2020). Available online: http://www.gov.cn/zhengce/content/2014-11/19/content_9222.htm (accessed on 7 June 2014). (In Chinese)
- United Nations—Population Division—World Population Prospects 2016. Available online: https://esa.un.org/unpd/wpp/Download/Standard/Population/ (accessed on 31 July 2016).
- Organisation for Economic Co-Operation and Development—GDP Long-Term Forecast. Available online: https://data.oecd.org/gdp/gdp-long-term-forecast.htm (accessed on 31 December 2016).
- Morris, J.; Paltsev, S.; Reilly, J. Marginal abatement costs and marginal welfare costs for greenhouse gas emissions reductions: Results from the EPPA model. Environ. Model. Assess. 2012, 17, 325–336. [Google Scholar] [CrossRef]
- Den Elzen, M.; Beltran, A.; Hof, A.; Ruijven, B.; Vliet, J. Reduction targets and abatement costs of developing countries resulting from global and developed countries’ reduction targets by 2050. Mitig. Adapt. Strateg. Glob. Chang. 2013, 18, 491–512. [Google Scholar] [CrossRef]
- Hof, A.; den Elzen, M.; Admiraal, A.; Roelfsema, M.; Gernaat, D.; Vuuren, D. Global and regional abatement costs of Nationally Determined Contributions (NDCs) and of enhanced action to levels well below 2 °C and 1.5 °C. Environ. Sci. Policy. 2017, 71, 30–40. [Google Scholar] [CrossRef]
- Project Group of Research on China’s Medium and Long Term Energy Development Strategy. Research on China’s Medium and Long Term (2030 and 2050) Energy Development Strategy: Volume Energy Conservation and Coal; Science Press: Beijing, China, 2011; pp. 223–252. ISBN 978-7-03-029935-2. (In Chinese) [Google Scholar]
- Energy Foundation (China) and Energy Research Institute of the National Development and Reform Commission—China 2050 High Renewable Energy Penetration Scenario and Roadmap Study. Available online: http://www.efchina.org/Reports-zh/china-2050-high-renewable-energy-penetration-scenario-and-roadmap-study-zh (accessed on 30 November 2016). (In Chinese).
- International Energy Agency—World Energy Statistics and Balances. Available online: http://www.iea.org/statistics/relateddatabases/worldenergystatisticsandbalances/ (accessed on 31 July 2016).
- Masanet, E.; Poponi, D.; Bryant, T.; Burnard, K.; Cazzola, P.; Dulac, J.; Pales, A.; Husar, J.; Janoska, P.; Munuera, L.; et al. Energy Technology Perspectives 2016; International Energy Agency: Paris, France, 2016; pp. 22–76. ISBN 978-92-64-25233-2. [Google Scholar]
- International Energy Agency—Energy Technology Perspectives 2016. Available online: http://www.iea.org/etp/explore/ (accessed on 31 July 2016).
- Project Group of Research on China’s Medium and Long Term Energy Development Strategy. Research on China’s Medium and Long Term (2030 and 2050) Energy Development Strategy: Volume Renewable; Science Press: Beijing, China, 2011; pp. 13–116. ISBN 978-7-03-029944-4. (In Chinese) [Google Scholar]
- Project Group of Research on China’s Medium and Long Term Energy Development Strategy. Research on China’s Medium and Long Term (2030 and 2050) Energy Development Strategy: Volume Power, Oil, Natural Gas, Nuclear and Environment; Science Press: Beijing, China, 2011; pp. 3–240. ISBN 978-7-03-029945-1. (In Chinese) [Google Scholar]
- China National Energy Administration—Guiding Opinions on Establishing a Guiding System for Renewable Energy Development and Utilization Targets. Available online: http://zfxxgk.nea.gov.cn/auto87/201603/t20160303_2205.htm (accessed on 29 February 2016). (In Chinese)
- European Commission. Available online: http://ec.europa.eu/clima/policies/strategies/2020 (accessed on 29 June 2016).
- European Commission. Available online: http://ec.europa.eu/clima/policies/strategies/2030 (accessed on 29 June 2016).
- United States Environmental Protection Agency. Available online: https://www.epa.gov/cleanpowerplan (accessed on 29 June 2016).
- White House. Available online: https://www.whitehouse.gov/the-press-office/2015/06/30/us-brazil-joint-statement-climate-change (accessed on 29 June 2016).
- United States Environmental Protection Agency. Available online: https://www.federalregister.gov/documents/2017/04/04/2017–06522/review-of-the-clean-power-plan (accessed on 22 June 2017).
- Planning Commission Government of India. Available online: http://planningcommission.gov.in/plans/planrel/fiveyr/welcome.html (accessed on 29 June 2016).
- Ministry of New and Renewable Energy Government of India. Available online: http://mnre.gov.in/related-links/jnnsm/introduction-2/ (accessed on 29 June 2016).
- World Bank. Available online: http://data.worldbank.org.cn/data-catalog/world-development-indicators (accessed on 29 June 2016).
- Sterman, J.; Fiddaman, T.; Franck, T.; Jones, A.; McCauley, S.; Rice, P.; Sawin, E.; Siegel, L. Climate interactive: the C-ROADS climate policy model. Syst. Dyn. Rev. 2012, 28, 295–305. [Google Scholar] [CrossRef] [Green Version]
- Ding, R.; Li, J. Nonlinear finite-time Lyapunov exponent and predictability. Phys. Lett. A 2007, 364, 396–400. [Google Scholar] [CrossRef]
- Stockholm Environment Institute. Available online: https://calculator.climateequityreference.org/ (accessed on 29 June 2016).


| Variables | Available Regions | Functions 1 | Explained Variance |
|---|---|---|---|
| Share of agriculture in GDP | World | y = 1 − Gp^0.886/(619^0.886 + Gp^0.886) | 0.924 |
| Share of service in GDP | World | y = Arctan(Gp × 1.83 × 10−4) × 0.814/(Pi/2) | 0.685 |
| Final energy intensity of agriculture 2 | Developing countries of Europe and Central Asia and China | y = (0.0033 + 0.0207 × Gp)^(−1/1.23) | 0.974 |
| Others in the world | y = 4.41 × (1 + Gp)^(−0.209) | 0.728 | |
| Final energy intensity of industry | Developing countries of South Asia, Africa and Latin America | y = 49.1 × (1 + Gp)^(−0.286) | 0.862 |
| Others in the world | y = (6.22 × 10⁻⁵ + 6.13 × 10⁻⁴ × Gp)^(−1/1.38) | 0.952 | |
| Final energy intensity of service | Europe and developing countries of Central Asia | y = 44.8 × (1 + Gp)^(−0.436) | 0.510 |
| Other developing countries | y = 1/(33.0 × Gp^(1.00175 − 1) − 32.8) | 0.554 | |
| Developed countries of America | y = 935 × (1 + Gp)^(−1.17) | 0.953 | |
| Final energy intensity of household | World | y = 1/(0.00656 × Gp^(1.73 − 1) − 0.00186) | 0.933 |
| Final energy intensity of others | World | y = 1/(0.242 × Gp^(1.39 − 1) − 0.0974) | 0.656 |
| Share of non-energy use in final consumption | World | y = 0.126 − 0.126/(1 + (Gp/4.64)^0.944) | 0.596 |
| Share of electricity and heat in final consumption | World (excl. Middle East) | y = 0.0475 × Gp^0.0574 | 0.691 |
| Ratio of fossil/clean energy in final consumption | World (excl. Middle East) | z = (Gp − 14)/13, y = 35.9 × exp(1 − exp(−z)−z) | 0.470 |
| Countries | 2020 Targets | 2025 or 2030 Targets |
|---|---|---|
| China | 40–45% emissions reduction per GDP below 2005 levels; non-fossil share of energy supply to 15% | 60–65% emissions reduction per GDP below 2005 levels; non-fossil share of energy supply to 20% |
| EU | 20–30% emissions reduction below 1990 levels | 40% emissions reduction below 1990 levels |
| US | 17% emissions reduction below 2005 levels | 26–28% emissions reduction below 2005 levels |
| India | 20–25% emissions reduction per GDP below 2005 levels | 33–35% emissions reduction per GDP below 2005 levels; non-fossil share of cumulative power generation capacity to 40% |
| Countries | 2020 | 2025 or 2030 | 2020 | 2025 or 2030 |
|---|---|---|---|---|
| BAU—INDC | INDC—API | |||
| China | −339 MtCO2e | 1039 MtCO2e | 1560 MtCO2e | 2268 MtCO2e |
| EU | 336 MtCO2e | 1140 MtCO2e | 90 MtCO2e | −122 MtCO2e |
| US | 732 MtCO2e | 1382 MtCO2e | −354 MtCO2e | −554 MtCO2e |
| India | −28 MtCO2e | −25 MtCO2e | 867 MtCO2e | 2095 MtCO2e |
© 2017 by the authors. Licensee MDPI, Basel, Switzerland. This article is an open access article distributed under the terms and conditions of the Creative Commons Attribution (CC BY) license (http://creativecommons.org/licenses/by/4.0/).
Share and Cite
Liu, Y.; Wang, F.; Zheng, J. Estimation of Greenhouse Gas Emissions from the EU, US, China, and India up to 2060 in Comparison with Their Pledges under the Paris Agreement. Sustainability 2017, 9, 1587. https://doi.org/10.3390/su9091587
Liu Y, Wang F, Zheng J. Estimation of Greenhouse Gas Emissions from the EU, US, China, and India up to 2060 in Comparison with Their Pledges under the Paris Agreement. Sustainability. 2017; 9(9):1587. https://doi.org/10.3390/su9091587
Chicago/Turabian StyleLiu, Yang, Fang Wang, and Jingyun Zheng. 2017. "Estimation of Greenhouse Gas Emissions from the EU, US, China, and India up to 2060 in Comparison with Their Pledges under the Paris Agreement" Sustainability 9, no. 9: 1587. https://doi.org/10.3390/su9091587
APA StyleLiu, Y., Wang, F., & Zheng, J. (2017). Estimation of Greenhouse Gas Emissions from the EU, US, China, and India up to 2060 in Comparison with Their Pledges under the Paris Agreement. Sustainability, 9(9), 1587. https://doi.org/10.3390/su9091587