Article

Network Vulnerability Analysis of Rail Transit Plans in Beijng-Tianjin-Hebei Region Considering Connectivity Reliability

1
Institute of Transportation Engineering, Tsinghua University, Beijing 100084, China
2
National Defense University, Beijing 100858, China
3
Department of Management, Beijing Union University, Beijing 100101, China
*
Author to whom correspondence should be addressed.
Sustainability 2017, 9(8), 1479; https://doi.org/10.3390/su9081479
Submission received: 9 July 2017 / Revised: 15 August 2017 / Accepted: 15 August 2017 / Published: 21 August 2017

Abstract

:
In the context of the urban agglomeration and the rapid development of rail transit, the planning of the Beijing-Tianjin-Hebei Region (BTHR) rail transit 2020 is attracting attention. The BTHR is a natural disaster-prone area and a high-risk area for terrorist attacks; the robustness of the area is critical to the sustainable development of North China. Therefore, it is necessary to analyze the vulnerability of the regional planning rail transit network. This paper builds a model of planning regional rail transit in BTHR. A critical node recognition measure is designed according to the connectivity reliability of nodes. The method of Monte Carlo simulation of node connectivity reliability is applied based on link connectivity probability. In addition, a model of detecting multi-measure recognition and detecting Core-Nodes is proposed. Finally, the paper analyzes the impact of multiple attack modes on the network performance from the aspects of network performance within region and transit demand outside the region, and analyzes the vulnerability of the BTHR planning rail transit network.

1. Introduction

In recent years, regional integration, which takes the urban agglomeration as the main form, is a major feature of China’s regional economic and social development [1]. The integration of Beijing, Tianjin and Hebei is a major national strategy for the future to build the capital economic circle, in order to realize the complementary advantages of the Beijing-Tianjin-Hebei region (BTHR), as well as to promote the development of the northern hinterland. The integration of traffic is the skeleton system of the BTHR. In particular, rail transit will play an important role in the development of the integration of the BTHR, and to build “BTHR on the track” is the key area for the coordinated development. However, rail transit, like other infrastructure, faces many threats, including natural disasters, terrorist attacks, or random failures, which calls for evaluation on the robustness in order to attain sustainable development within the area. According to statistics, BTHR is a natural disaster-prone area, and the natural disasters that directly affect traffic in BTHR are floods, frosts and snowstorms, which generally have huge impact on society. In 2012, the Beijing “7.21” heavy rain caused direct economic losses of 11.64 billion yuan [2]. In addition, rail and public transport networks are generally more sensitive to disruptions than road networks [3], rail accidents not only cause traffic delays of the direct line(s), but also have a wider impact on passengers in other stations along the line(s) or even potential passengers, which generally generates larger social impact [4]. Therefore, a simulation model of different damage scenarios is proposed according to different hazards in BTHR, and the analysis of vulnerability of the whole planning rail transit network is important for identifying protection strategies.
The concept of vulnerability was proposed in social economics research at the beginning, especially in terms of psychology, military science, natural disasters and climate change. Vulnerability is often studied together with threats such as danger and disaster (e.g., terrorist attacks on traffic or power systems, financial crisis, pandemic spatial diffusions, natural disasters, etc.) [5]. Vulnerability analysis refers to the susceptibility of the dynamic system to extreme events and the impact of the propagation in the network. The study of vulnerability was first proposed in transportation network by Berdica in 2002. Berdica believes that vulnerability is closely related to the availability of services, especially the lack of adequate service provision [6]. In recent years, literature on vulnerability has emerged in the area of critical infrastructure networks [7,8,9,10,11]. However, the resilience and vulnerability in the transportation system are not easy to measure or quantify, and recent research on vulnerability evaluation has failed to draw clear conclusions [3]. Aura Reggiani, Peter Nijkamp and Diego Lanzi systematically combs the conceptual framework of traffic resilience and vulnerability, reviews the current research situation and classifies research methods into common methods and special methods (conclusions from realistic networks or case studies), according to whether they can be easily used in a variety of environments [9].
Previous research reveals that connectivity and accessibility are common parts of dynamic traffic system analysis. The complexity of the network is a proper way to study the vulnerability of the traffic system. The topological characteristics of traffic networks can be used as the basis for studying the vulnerability of traffic systems, in order to find the critical links or key nodes and the vulnerability conditions associated with these links or nodes, which can affect the vulnerability of the entire network. Due to the operability of vulnerability assessment, scholars have carried out extensive research on the vulnerability analysis of traffic networks. Based on the theory of vulnerability, scholars have studied the actual road network, public transportation network and rail transit network [7,12,13,14,15,16,17]. In addition, simulations are applied to the actual road network, route network and logistics network. Cats, O defines defined the robustness of the system as the capacity to absorb disturbances with a minimal on system performance [10]. It is found that predecessors’ research is based on the evaluation of the vulnerability of the existing road network in a city, but that the robustness evaluation of the alternative path in the transportation development plans has not been studied. Cats proposed a method by full-scan of all possible scenarios of link failure to evaluate the robustness of alternative public transport links. The method was used to evaluate the robustness implications of a substantial development plan of Stockholm multi-modal rapid urban rail network in 2025.

2. Literature Review

In a large number of studies, scholars have developed the method of vulnerability into two aspects: the first is to study the vulnerability of the system itself, which mainly studies the influence of traveler under various travel conditions, such as traffic accident, technical failures, natural disasters. The influence is usually expressed in the form of probability distribution (connectivity reliability, travel time reliability, capacity reliability, etc.) [18,19,20]; The second, in contrast, is focusing on the unreliability of the research system, aiming to study the potential weak points (critical nodes/links). Scholars have found that the connectivity of network will be heavily influenced if there is one or several weak/critical points. Such influence may be resulted in the functional deterioration of the nodes/links, and will lead to long-term impacts to the social economics. In addition, short-term influence would also be initiated because of temporary threats such as bad weather, technical failures or accidents. Moreover, some scholars and institutes pay attention to the operational transit domain.
From the perspective of operational transit, some projects have done better work in terms of analyzing and applying real-traffic data. ON-TIME is an European Union (EU)-funded project aiming at developing new methods and processes to help decrease overall delays on Europe railway transit, and one of its objectives is to provide robust and resilient timetables capable of coping with disrupt operations on transit [21]. Hamza Achit used the data provided by the National Security System in France; he analyzed the economic consequences for almost all road victims in France, and identified homogenous categories of victims according to these long-run consequences [22]. Yoshitsugu Hayashi established a map where different areas were identified according to their eco-sufficiency. These areas are locations for retreatments, which are useful to policy makers as they can help with actions for sustainable mobility [23]. Rayane Wehbé found that one of the causes of the increase in road accidents in Lebanon was the inappropriate geometry of the road infrastructure; he advocated the application of the audit method and recommended to adapt it to each step of the road infrastructure project [24].
Aura, Peter and Diego review literature of vulnerability in transportation system, and they summarize different definitions and methodological framework of measurement or evaluation of resilience and vulnerability [9].
According to Lars-Göran Mattsson and Erik Jenelius, there are two traditional approaches to the study of the vulnerability of the transport system. One is based on the study of graph theory and traffic network topology, while the other studies the response of travelers after the system or the supply-demand relationship is disturbed by using complex models. The latter approach describes the influence on vulnerability after disturbance more completely, but the computational demand is also higher [3].
Liu Hong et al. extracted 399 sites from China Railway Network and 500 linked topological networks; Monte Carlo simulation method was used to simulate the occurrence of floods in all provinces in China based on historical data. The vulnerability of rail transit network is evaluated through the assessment of the occurrence of floods in each province [11].
A dynamic agent-based bus assignment model was used by Cats, O and Jenelius to identify a subset of central links and completed a detailed dynamic robustness analysis. Taking the same method as a component of the continuous process, Cats, O and Jenelius identified the locations where the reserve capacity should be configured and the redundancy could be increased, in order to improve the robustness of the network. The physical meaning of the elements in the adjacency matrix is considered as the traffic impedance of the link, and the traffic impedance is deterministic at the traffic planning stage. The all-or-nothing assignment method is taken for network traffic assignment under destruction, with the computing advantage for large-scale network [8,13]. Yang, Y.H. et al. evaluated the robustness of rail transit in Beijing with complex network theory, and designed a method of weighting index of node importance, which can guide the site selection [16]. Cats, O performed the full-scan of network links, and analyzed the impacts of each disruption in terms of how the disruption influences the travel experience of population (cut-off, delayed, unaffected). He proposed three performance indicators of the network system: Share of cut-off demand; Share of delayed passengers; Average travel time; and the evaluation of robustness of the rapid rail-bound transport system of Stockholm, Sweden 2025, which was carried out based on the above indicators [10]. Oriol Lordan et al. compared the performances of several node selection indicators, together with a new indicator based on Bonacich power centrality. Identified the critical airports for the global ATN of November 2011–November 2012 [15]. Irina Petreska et al. started from the similarity of structural dynamics and complex networks, the network node/link busy degree is proposed on the basis of the modal equation, which could be used as the measure of vulnerability reflecting the influence on neighboring nodes [25]. Sun, D. et al. defined that the station vulnerability is the change of the topological efficiency and the influence of passenger flow after attacked, as well as the probability of station being attacked. A vulnerability evaluation model was proposed by introducing metro interchange and passenger flow, and was evaluated based on a case study of Shanghai Metro with full-scale network and real-world traffic data [4].
Researchers have also studied the system robustness or vulnerability based on complex network theory, in the areas of electric system, communication system, command system and social network other than transportation system. Shuliang Wang et al. took central China power grid as an example gave the algorithm for detecting community structure, and studied the vulnerability analysis of power systems under terrorist attacks [12]. Jian Li et al. compared the connectivity reliability (CR) and topological controllability (TC) of infrastructure systems in terms of three aspects: topology, robustness, and node importance, and developed a controllability index and a controllability-based node importance metric [26]. Sudha Gupta et al. explored the hidden geometry of current flow path for analysis of vulnerability in power system, and defined the Power Flow Index and the Vulnerability Index to analyze and measure the impact of line tripping on grid vulnerability, which may lead to cascade failure in smart power transmission system [27].
Though previous studies are quite systematic and detailed, limitations and space for improvements still remain. Firstly, some studies are only interested in topographical characteristics of the network while ignoring the other factors which would affect the importance of nodes, such as connectivity reliability which is a key component in transport. Secondly, the combination of node connectivity reliability and node centrality has not been studied thoroughly, thus the measurement used to identify key node importance is remained to be established. In the real operational transportation network, the connect probability of routes will be influenced related to natural or human factors, so as to influence the node connect reliability. One may lack considerations of real operating conditions if one only measures the node importance based on node centrality of transportation network topological structure. The real-traffic node importance should be measured based on the combination of node connectivity reliability (based on route connectivity probability) as well as the node centrality measurement.
The rest of the paper is arranged as below: the main methodology is proposed in Section 3, as well as the abstraction of rail network in the BTHR. In Section 4, the model is validated based on the case study of the BTHR rail transit planning, and the results and corresponding analysis are presented. Finally, some conclusions and future research prospects are put forward in Section 5.

3. Methodology

3.1. Network Model

In recent years, the use of complex network theory on traffic networks has become a hot topic, and proposing appropriate methods to build and correctly describe the road/rail network topology is the necessary prerequisite of path planning, traffic planning and management, and is a critical process to improve the accuracy of research results as well. Graph theory is first used to describe the topological system, which abstracts the real network into a mathematical method that consists of nodes and sets of edges. However, graph theory is quite simple and macro, and could not be applied to quantitatively study complex road network. Spatial syntax, fractal geometry, agent-based simulation and complex network theory have been proposed and used to network study more deeply [28,29,30].
The main methods of road network abstraction based on the complex network theory include: primal approach and dual approach. The primal approach is the traditional traffic network modeling method, which is quite simple and intuitive, and could retain the geographical relevance. In accordance with the “Beijing-Tianjin-Hebei regional inter-city railway network planning”, the BTHR inter-city railway network will be composed of 24 inter-city railways. By 2020, there will be 0.5~1 h commute circle of Beijing-Tianjin-Shijiazhuang with surrounding towns, and 0.5~1 h traffic circle of Beijing-Tianjin-Baoding region, which will effectively support and guide the regional space layout adjustment and industrial transformation and upgrading. Therefore, according to the “Beijing-Tianjin-Hebei regional inter-city railway network planning” diagram [31], the primal approach method is used to abstract the rail network in this paper. Detailed information of Station and node number of BTHR rail system development plans network is presented in Table 1.
The rail transport network is represented by an undirected graph G(N, E), where the node set N(1, 2, 3, ..., n) represents rail stations, and the link set E N × N represents rail track segments between stations. The graph is fully specified by: an adjacency matrix, Matrix A, where cell a ij equals 1 if nodes i, j N are connected and zero if no. Topology structure of the BTHR rail system development plans is extracted as illustrated in Figure 1.
In addition to the 43 nodes in the BTHR, the network figure also contains 6 neighboring nodes (see Table 1). Therefore, the characteristics of transit traffic outside the BTHR can also be measured as well as the characteristics within the region. N represents the number of nodes, E represents the number of links, <k> is the average value, C is the average clustering coefficient and B is the nodes average betweenness. The above general network properties are summarized in Table 2.

3.2. Critical Node Identification

Two conventional methods are used for the identification of critical nodes based on complex network theory: 1. The node degree K i is chosen as the measure of critical node identification to evaluate whether the correlation between nodes are high; 2. The nodes average betweenness B i is chosen as the measure of critical node identification, as it can represent the control level of shortest paths between nodes. In fact, the two methods both evaluate the importance of nodes based on the network structure. Some scholars consider the influence of adjacent nodes on the critical node importance and propose a shortest path number N e that also takes node neighbors in consideration. Besides, synthetic measures combining K i , B i , N e is put forward based on the weighted method [16] and AHP method [32]. Oriol Lordan summarized the existing research the effectiveness (measured in terms of reduction of the size of the giant component of has been compared) attacks based on five different measures: degree, betweenness, modal analysis, damage and Bonacich power [15]. However, the above method only assesses the importance of node from the perspective of structure without considering the node connectivity reliability. Based on previous studies, the critical node identification method considering node connectivity reliability is proposed in this paper.

3.2.1. Node Importance Measure Based on Network Centrality

The degree and betweenness are two standard measures of node centrality [33]. The degree K i of a node i is the number of edges incident with the node, and is defined in terms of the adjacency matrix A. The betweenness B i of a node i is the number of times that a node appears between the shortest paths of two other nodes and thereby quantifying the importance of a node [34,35]. The degree K i and betweenness B i can be defined as:
K i = j a ij
B i = i , j N , j k n jk ( i ) n jk

3.2.2. Node Connectivity Reliability Measure Based on Monte Carlo Simulation

The probability of node connectivity is used to measure the approximate values of connected reliability of each node based on Monte Carlo simulation. The simulation procedure is described as below:
Step 1: The network is abstracted as a planar topological network G(N, E) with N nodes and E links. An adjacency matrix A is established in consistent with the network model in Section 3.1.
Step 2: The connected probability matrix P(E) is input. Suppose all connected probabilities are undirected, then
p ij = { p ij , a ij = 1   and   i < j 1 ,   i = j 0 ,   else
where p ij is component of the matrix P(E), and represents the connected probability of link e ij with node i, j.
Step 3: Generate E pseudo random numbers between 0 and 1, and compare them with the connected probabilities of E edges. When r ij < p ij , the corresponding link is considered as “connected” in the simulation, otherwise it is seemed as disconnected.
Step 4: Modify the adjacency matrix as following, according to the results of Step 3.
{ a ij = a ji = 1 , r ij p ij a ij = a ji = 0 , r ij > p ij
Step 5: Union-Find is used to find the nodes that are directly or indirectly connected with the source nodes, and 1 represents the nodes connected with the source nodes, and 0 represents the nodes not connected.
Step 6: Repeat Step 3~Step 5, add up the number of connected nodes with the source node, and compare the value with the repeated number (5000 times in this paper), so that the connected probability is the connectivity reliability of the node i.
ω i = s i S
where s i is the connecting number with each node, S is the repeated number, ω i is the connectivity reliability of the node i.

3.2.3. Critical Nodes Identification Considering Connectivity Reliability

Considering the connectivity reliability and centrality of nodes comprehensively, the measuring methods are proposed as degree-based connectivity reliability metric (DCRi), Betweenness-based connectivity reliability metric (BCR), and core-nodes.
Degree-based connectivity reliability metric DCR i
DCR i = ω i · K i
Betweenness-based connectivity reliability metric BCR i
BCR i = ω i · B i
Core-nodes and ranking determination
O c i = { O k i + O b i + O DCR i + O BCR i } order
O c i represents a comprehensive node importance ranking that combines node connectivity and network centrality, which is defined as Core-nodes in this paper. O c i is the ranking number of core-nodes. O k i , O b i , O DCR i , O BCR i are ranking numbers of node i based on the degree value, the betweenness value, the DCR i value, the BCR i value separately. The comprehensive ranking number O c i depends on the value of the four above measures of node i, which is smaller with smaller summation of O k i , O b i , O DCR i , O BCR i representing for forward sorting, and vice versa. When the summation value is same, the determination principle in Equations (9)~(13) should be followed.
O c i > O c j ,  if  O k i + O b i + O DCR i + O BCR i = O k j + O b j + O DCR j + O BCR j ,   O b i > O b j ;
O c i > O c j ,  if  O k i + O b i + O DCR i + O BCR i = O k j + O b j + O DCR j + O BCR j ,   O b i = O b j ,   O k i > O k j ;
O c i > O c j ,  if  O k i + O b i + O DCR i + O BCR i = O k j + O b j + O DCR j + O BCR j ,   O b i = O b j ,   O k i = O k j ,   O BCR i > O bCR j ;
O c i > O c j ,  if  O k i + O b i + O DCR i + O BCR i = O k j + O b j + O DCR j + O BCR j ,   O b i = O b j ,   O k i = O k j ,   O BCR i = O BCR j ,   O DCR i > O DCR j ;
O c i > O c j ,  if  O b i = O b j ,     O k i = O k j ,   O BCR i = O BCR j ,   O DCR i = O DCR j ,   i > j .

3.3. Main Measures of Network Performance

Network performance should be determined first in order to measure the vulnerability. Five performance indicators are selected for vulnerability quantification [12]. INDICATOR (k) stands the value of the networks at phase k. Notations used in this paper are listed in Table 3.
  • Efficiency E ( k )
    E ( k ) = 1 N ( N 1 ) i j 1 d ij ( k )
  • Origin–destination consider efficiency ODE ( k )
The ODE ( k ) noly considers the shortest path between the origin nodes and the destination nodes.
ODE ( k ) = 1 N o N d i N o , j N d 1 d ij ( k )
3.
Largest component size LCS(k)
LCS ( k ) = N l ( k ) N
4.
Connectivity level CL(k)
CL ( k ) = N o i N o i
5.
Network average clustering coefficient CC(k)
CC ( k ) = 1 N C i ( k )

3.4. Attacks Simulation

Six types of disruptions are simulated in this paper: the random failures, the malicious attacks including degree based attacks, the betweenness based attacks, the DCR i based attacks, the BCR i based attacks and Core-nodes based attacks. The random failures are used to model the disruptions randomly happened in rail networks, such as accident, disaster. The nodes are randomly chosen in G and are set as failed; while the malicious attacks are used to model terrorist attacks and war attacks at important stations. The nodes are chosen in G according to the importance of the node (based on degree, betweenness, DCR i , BCR i and Core-nodes) as failed, implying that nodes with high important metric value are attacked in priority. All symbols of attack modes are listed in Table 4.

3.5. Vulnerability Assessment Model

The vulnerability evaluation model is established based on the method of robustness research on traffic planning by Cats, O [10]. The influence of damage on the network is defined as:
y ( k | n ) = y ( n , k ) y ( n , 0 )
V s = y ( k | n ) y ( n , 0 )
where n represents the network, k is the number of attack nodes.
Higher V s stands for a network with greater vulnerability. In addition, the relationship between change of network performance and the number of failed nodes after attack should be considered more deeply. The vulnerability of a network is relatively high if the network performance changes a lot with small number of failed nodes after attack, and vice versa.
It is defined in this paper that the number of failed nodes after attack (strategic or random attack) is the criteria of network vulnerability, with the level of network performance failure of 80%, 50% and 20%. The higher the number value is, the lower the network vulnerability is.

4. Application and Result

In this section, the method in Section 3 is applied to the BTHR rail system development plans. The network model of the BTHR rail system development plans has been built in 3.1. Firstly, the critical nodes are identified by different metrics in Section 4.1. Secondly, six different attacks are simulated according to Section 3.4. Finally, the vulnerability of the BTHR rail system development plans is evaluated.

4.1. Identifying the Critical Nodes

The critical nodes are identified with 5 metrics. Figure 2 shows the imrtance of nodes in the BTHR rail system development plans, with (a) indicating the importance of the nodes based on K i and (b) indicating the importance of the nodes based on B i . The importance is represented by the size of the nodes. The top fifteen nodes are list in Table 5 respectively based on two metrics.
Based on the degree of network centrality, Beijing, as the capital, has the most important position in the BTHR rail transit plans. The number of stations directly connected with Beijing is the most, followed by Tianjin and Hengshui. While based on the degree of betweenness, Tianjin appears to be more important. As the node with the largest number of shortest paths passing through, Tianjin shows the importance as a port city, as well as its traffic ease function of the influence of the outer transit traffic on Beijing in the BTHR rail transit plans. Meanwhile, Beijing and Tianjin also possess higher value of node centrality than other cities in the BTHR, especially the betweenness centrality value which is nearly 5 times the average. It is worth noticing that Huailai also has a relatively high betweenness centrality value only after Beijing and Tianjin, even higher than several critical cities in Hebei such as Shijiazhuang, Hengshui, Baoding, etc. It can be concluded that, although Huailai seems to be less critical in the BTHR traffic network, it will play an important role in node control.
Suppose that the connecting probability of each side of the G network is p ij , the connectivity reliability ω i can be calculated using method in Section 3.2.2, as shown in Table 6. The histogram of 49 node connectivity reliability as simulation outputs is presented in Figure 3. The degree-based connectivity reliability metric DCR i and betweeness-based connectivity reliability metric BCR i can be calculated by method in Section 3.2.3. Meanwhile, the Core-nodes ranking is determined, and summarized in Table 7.
It can be seen from Table 7 that the ranking of critical nodes has changed after considering node connectivity probability, though some nodes that are relatively large Ki & Bi and with higher connectivity probability still remain high rankings. Suppose the link connectivity probability pij is known, the core-nodes ranking can be obtained, of which 15 nodes are listed here according to the limited space of paper. Therefore, the core-nodes ranking can be used as the attack sequence destroying the simulation when evaluating the network vulnerability.

4.2. Simulations and Result Analysis

4.2.1. Rail Transit Network within Region Analysis

Destroying simulations have been carried out to the BTHR rail transit network, with random failure and 5 strategic attack modes based on critical node design. The simulation outputs of the network efficiency E(k) and the largest component size LCS(k) after attacks are presented in Figure 4 and Figure 5. After 50% nodes are destroyed, E(k) decreases to less than 5% of the original network efficiency, while LCS(k) is only 10% of that of the original network. Therefore, only simulation outputs of 25 nodes after attack are presented.
Figure 4 presents the simulation outputs of E(k) under 6 different attack modes. It can be concluded that: (a) The change gradient of network is the smallest under random failure Ar. The decrease speed of E(k) is slowest, and E(k) only decreases to 50% of E(0) after 10 nodes (20% of nodes) are destroyed. While E(k) is more sensitive to attack modes of Ac−n, Ab and Abcr. After 6 nodes (12% of nodes) are destroyed, E(k) decreases to less than 50%; (b) The decreasing patterns of E(k) are relatively similar under attack modes of Ab and Abcr, or Ad and Adcr. This is due to the close relationship of Abcr and Adcr with Ab and Ad, respectively. Significant difference would appear only when differences of node connectivity reliability is large; (c) Under 5 attack modes other than random failure, the change of network performance is relatively similar after two nodes, Beijing and Tianjin, are destroyed. The finding is consistent with common sense as Beijing and Tianjin are extremely critical points in the network. After the two cities are destroyed, the betweenness node-based attacks have larger impact on network efficiency, which are, however, beginning to change slower after the 8th node is destroyed. Meanwhile, the network efficiency decreases quickly under the degree node-based attacks. Such findings indicate that the nodes with a more direct link to other nodes have a higher sensitivity to the network efficiency than the nodes with more number of shortest paths passing through, after the former 8 nodes are destroyed.
Figure 5 shows the simulation outputs of LCS(k) under 6 different attack modes. The value of LCS(8) is 0.7959, indicating that after 8 nodes are destroyed, the percentage of nodes in largest connected sub-network can reach approximately 80%, which means that links between 38 nodes are still connected. The value of LCS(18) is 0.5152 indicates that after 18 nodes are destroyed, there are 50% nodes in largest connected sub-network left. It could be seen that the robustness of the BTHR rail transit plans to random failure is relatively high with the measure of LCS(k). The decreasing pattern of LCS(k) is similar with that of E(k) under 5 attack modes, but the difference is more significant. After the first two nodes are destroyed, the betweenness node-based attacks have larger impact on the largest connected sub-network. The value of LCS(k) decreases to 65% after the 7th node is destroyed, while the network connectivity remains 80% under degree node-based attacks. After the 8th node is destroyed, the impact of betweenness node-based attacks increases dramatically, with the percentage of nodes in largest connected sub-network decreasing from 80% to 55%. After 10% of nodes are destroyed, the percentage of nodes in largest connected sub-network remains only 33%.

4.2.2. Regional Exterior Transit Analysis

During the establishment of network, six regional exterior nodes have been added besides the 43 regional nodes, which are directions of Shenyang, Hohhot, Taiyuan, Zhengzhou, Liaocheng and Ji’nan respectively. Among the 6 cities, the directions of Hohhot, Taiyuan and Zhengzhou are located inland, and Yujiabao in Tianjin will become a more critical estuary after the integration of the BTHR. Taking the three directions as transit departure point and Yujiabao as the terminal point, simulations under attack modes of Ar and Ac−n are carried out based on the measure of ODE ( k ) in order to evaluate the network vulnerability. Simulation outputs are generated in Figure 6, which shows that the network efficiency of links between three inland nodes and the estuary changes a lot under the attack mode of Ac−n. After the first two critical nodes are destroyed, the network efficiency decreases to zero considering OD (origin-destination). The finding indicates that transit links between three inland cities and Yujiabao will all be destroyed after Beijing and Tianjin are unable to provide service. Especially once Tianjin station is destroyed, the transit network will be invalid as a whole. Robustness remains in the network under random failure.

5. Conclusions

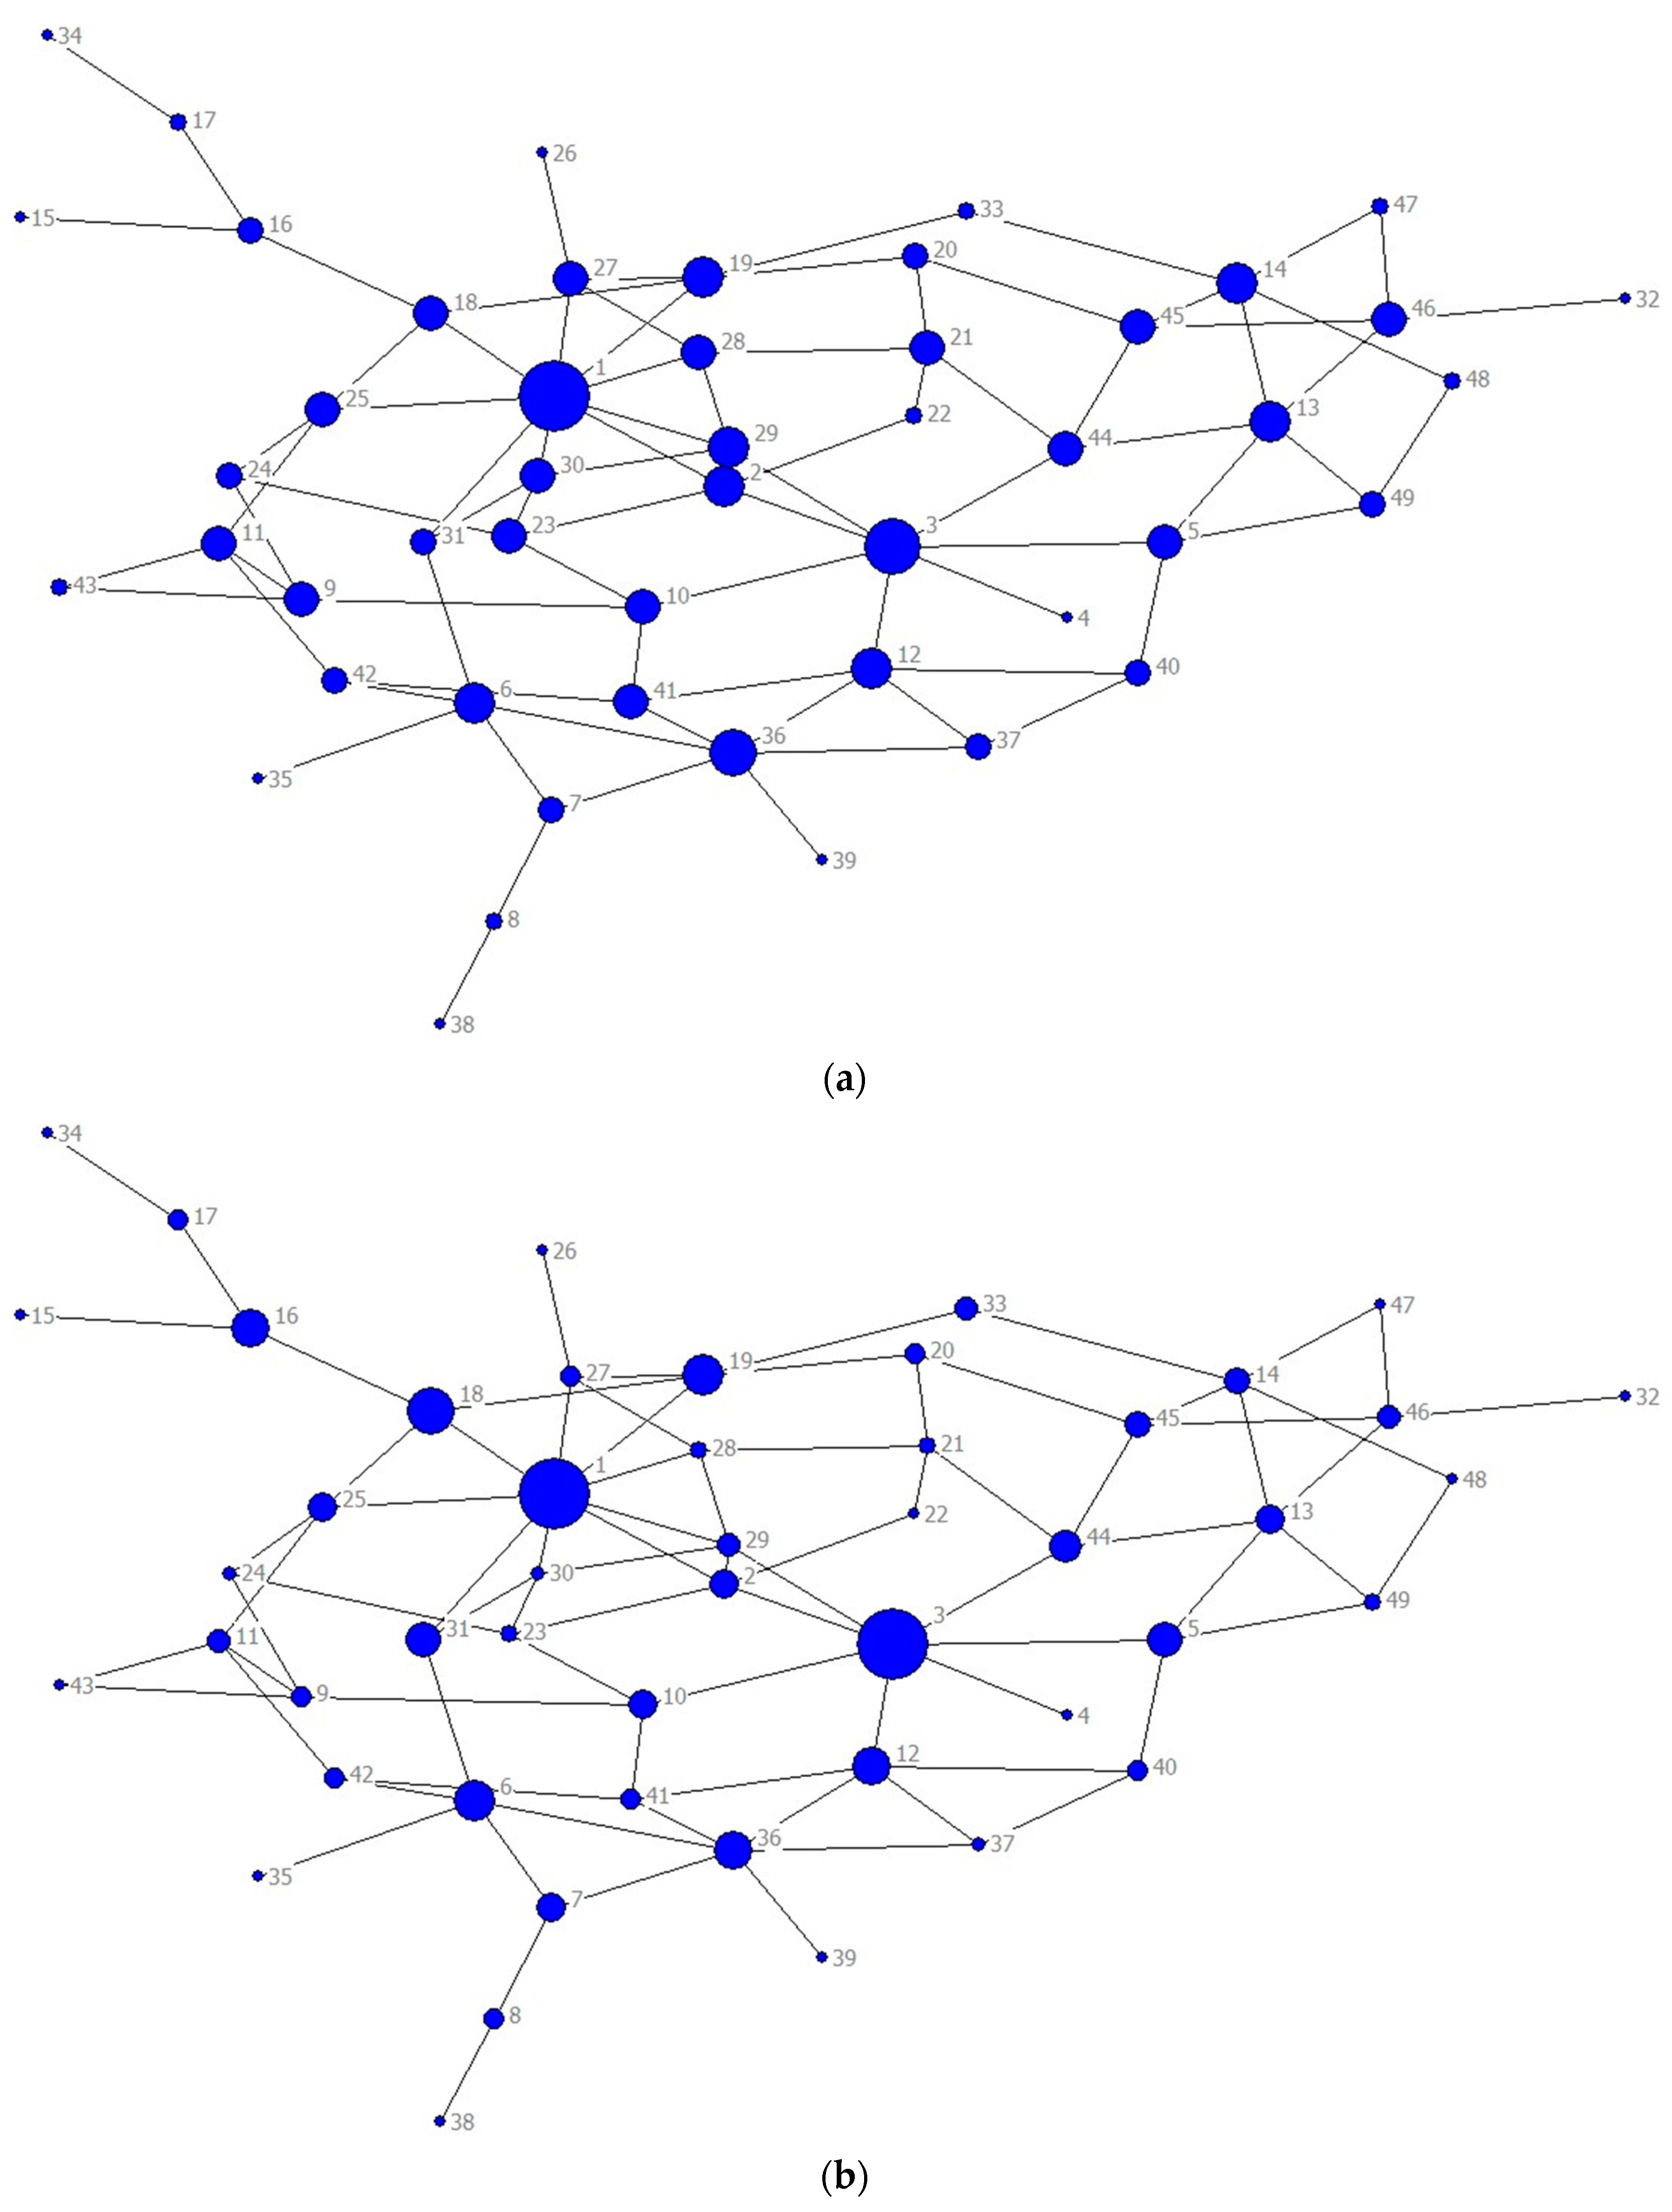
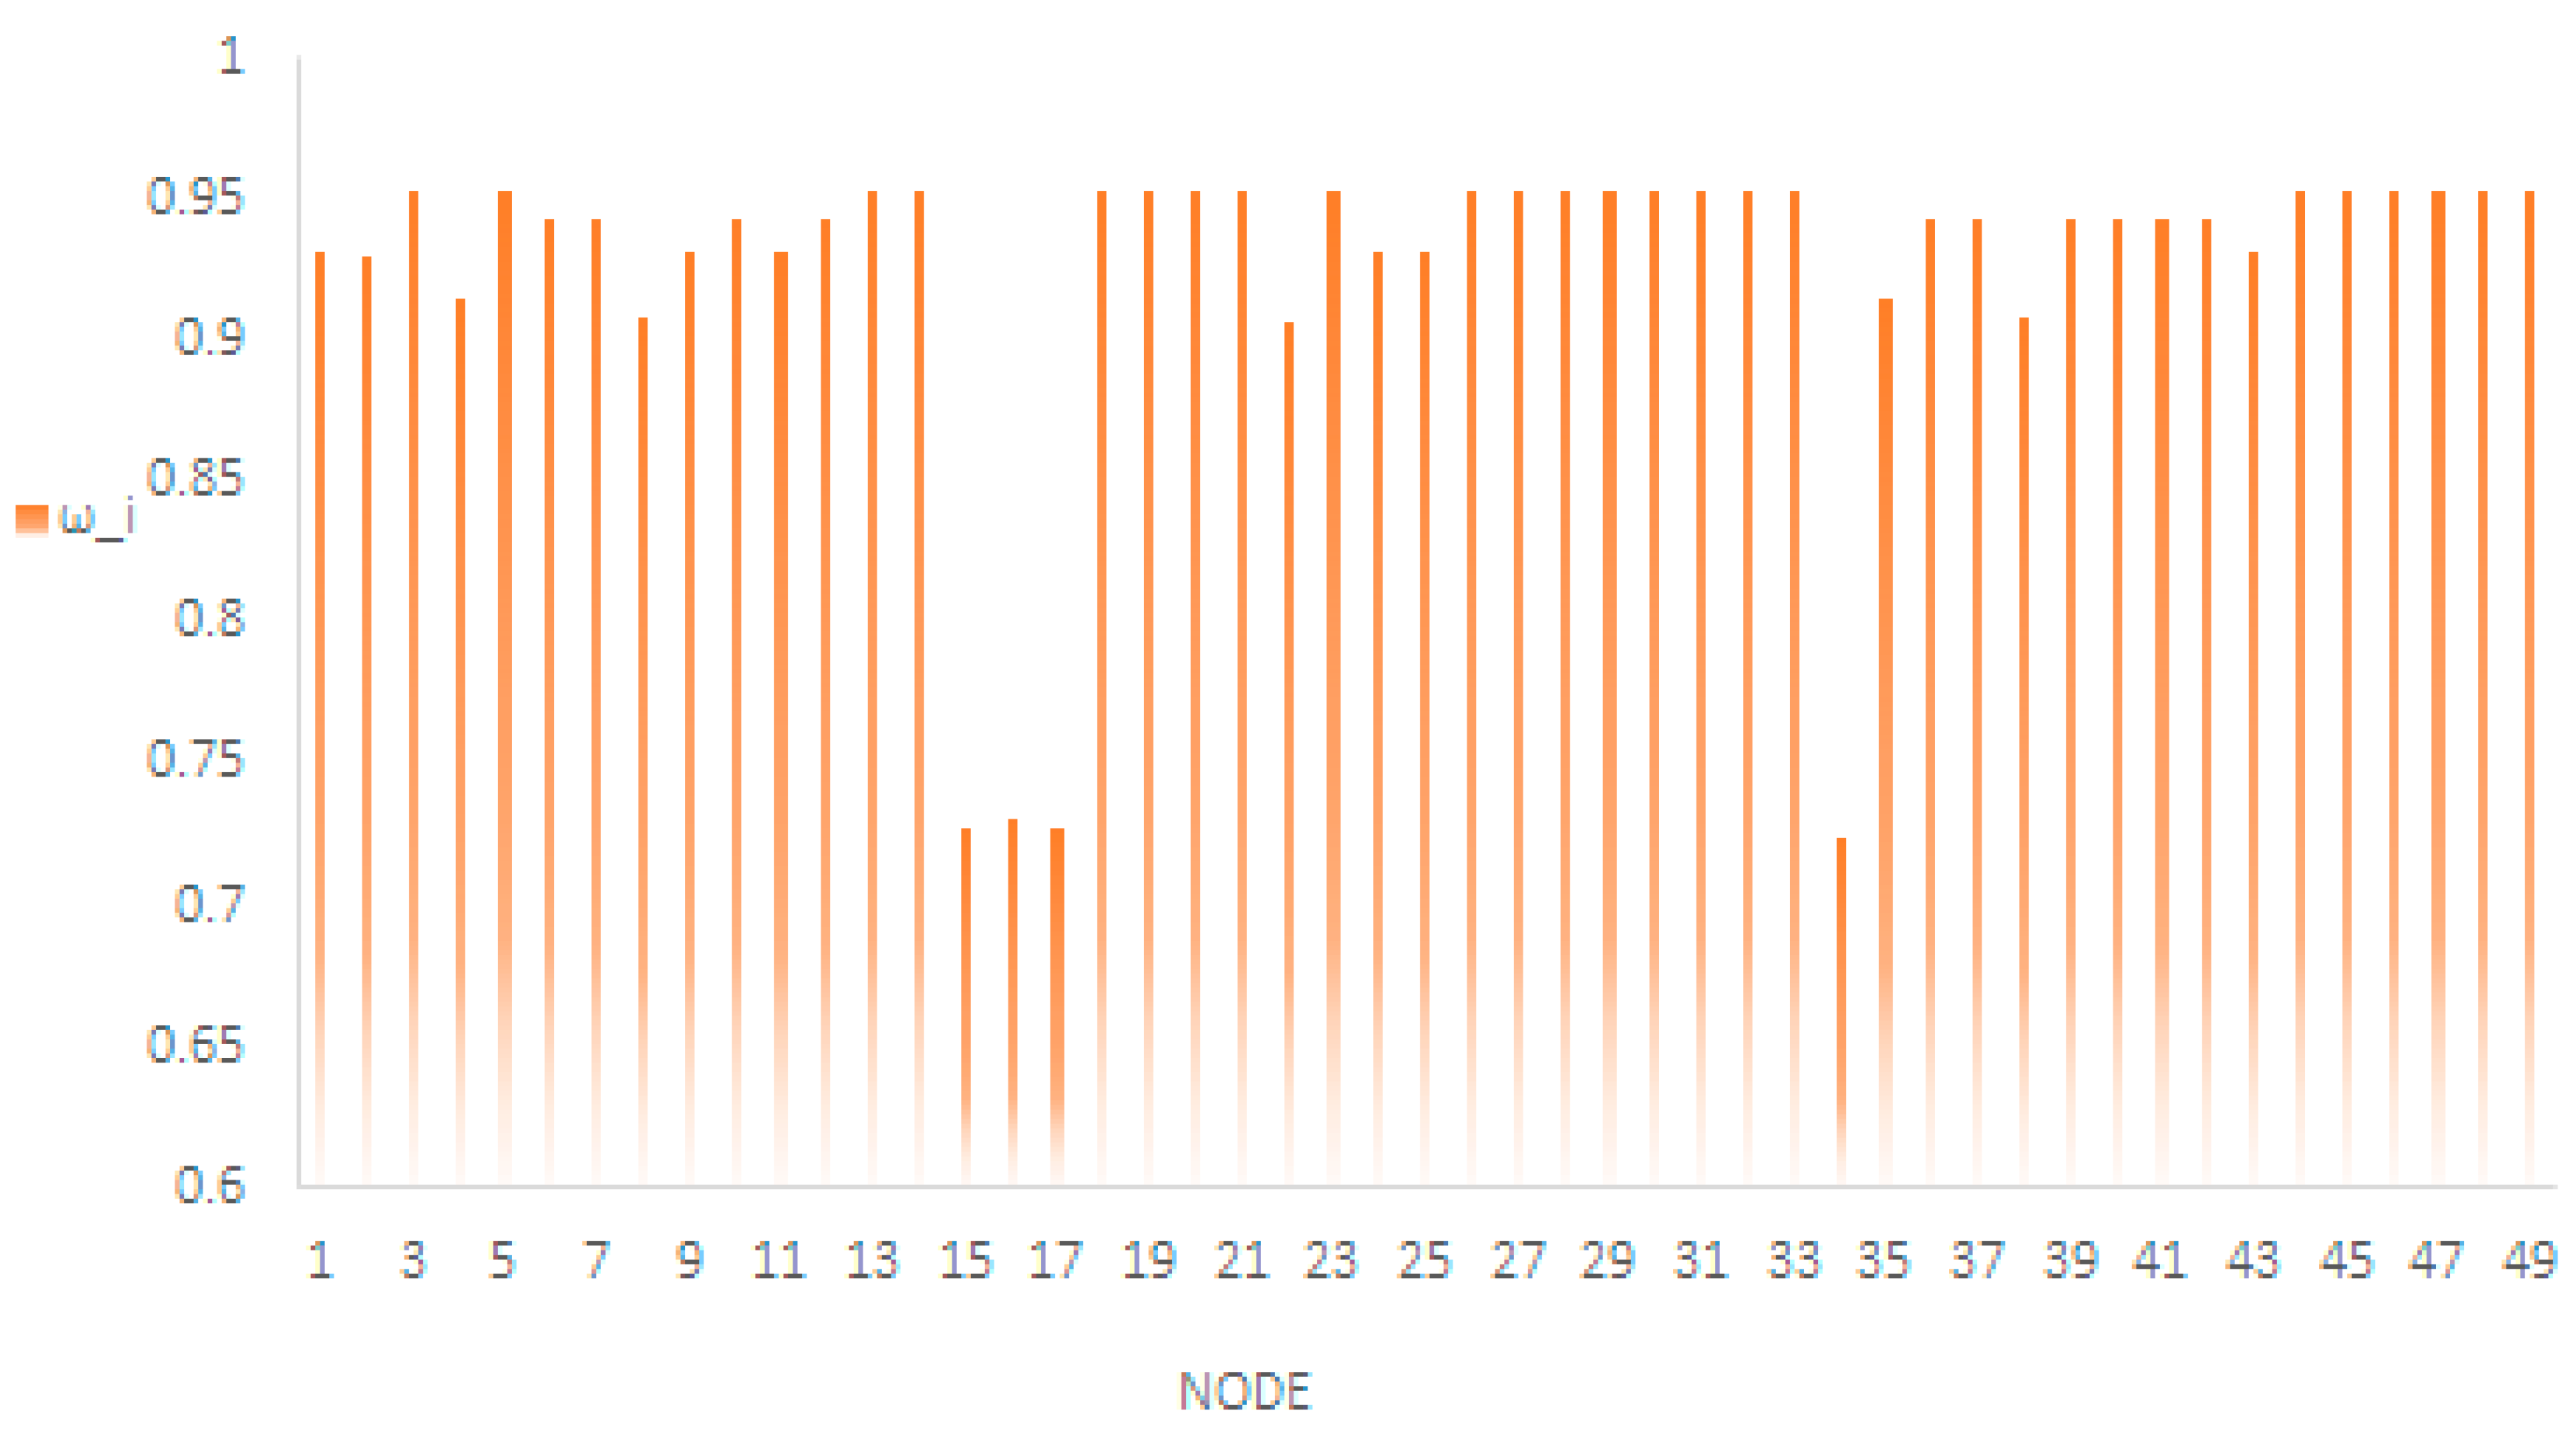
The method of critical node identification considering node connectivity reliability is proposed in this paper. A comprehensive measure of Core-Nodes is proposed based on 4 measures to identify critical nodes. The connectivity reliability of 49 nodes in the BTHR rail transit plan network is simulated by Monte Carlo simulations. The critical nodes in the BTHR rail transit plan network are analyzed based on network centrality measure. Combining the above measures together, we calculate the Core-Nodes in the BTHR rail transit plan network. Finally, the network vulnerability is evaluated based on measures of network efficiency and largest component size. Some findings and conclusions are summarized as below:
(1)
The critical node identification considering node connectivity reliability is based on connectivity probability of network links. As the output nodes from Monte Carlo is based on the measure of network centrality, the sequencing of critical nodes is similar with that of network centrality when the centrality and connectivity reliability are relatively high. However, when the connectivity reliability is low, the method of critical node identification can take network centrality into consideration as well as the real connectivity reliability.
(2)
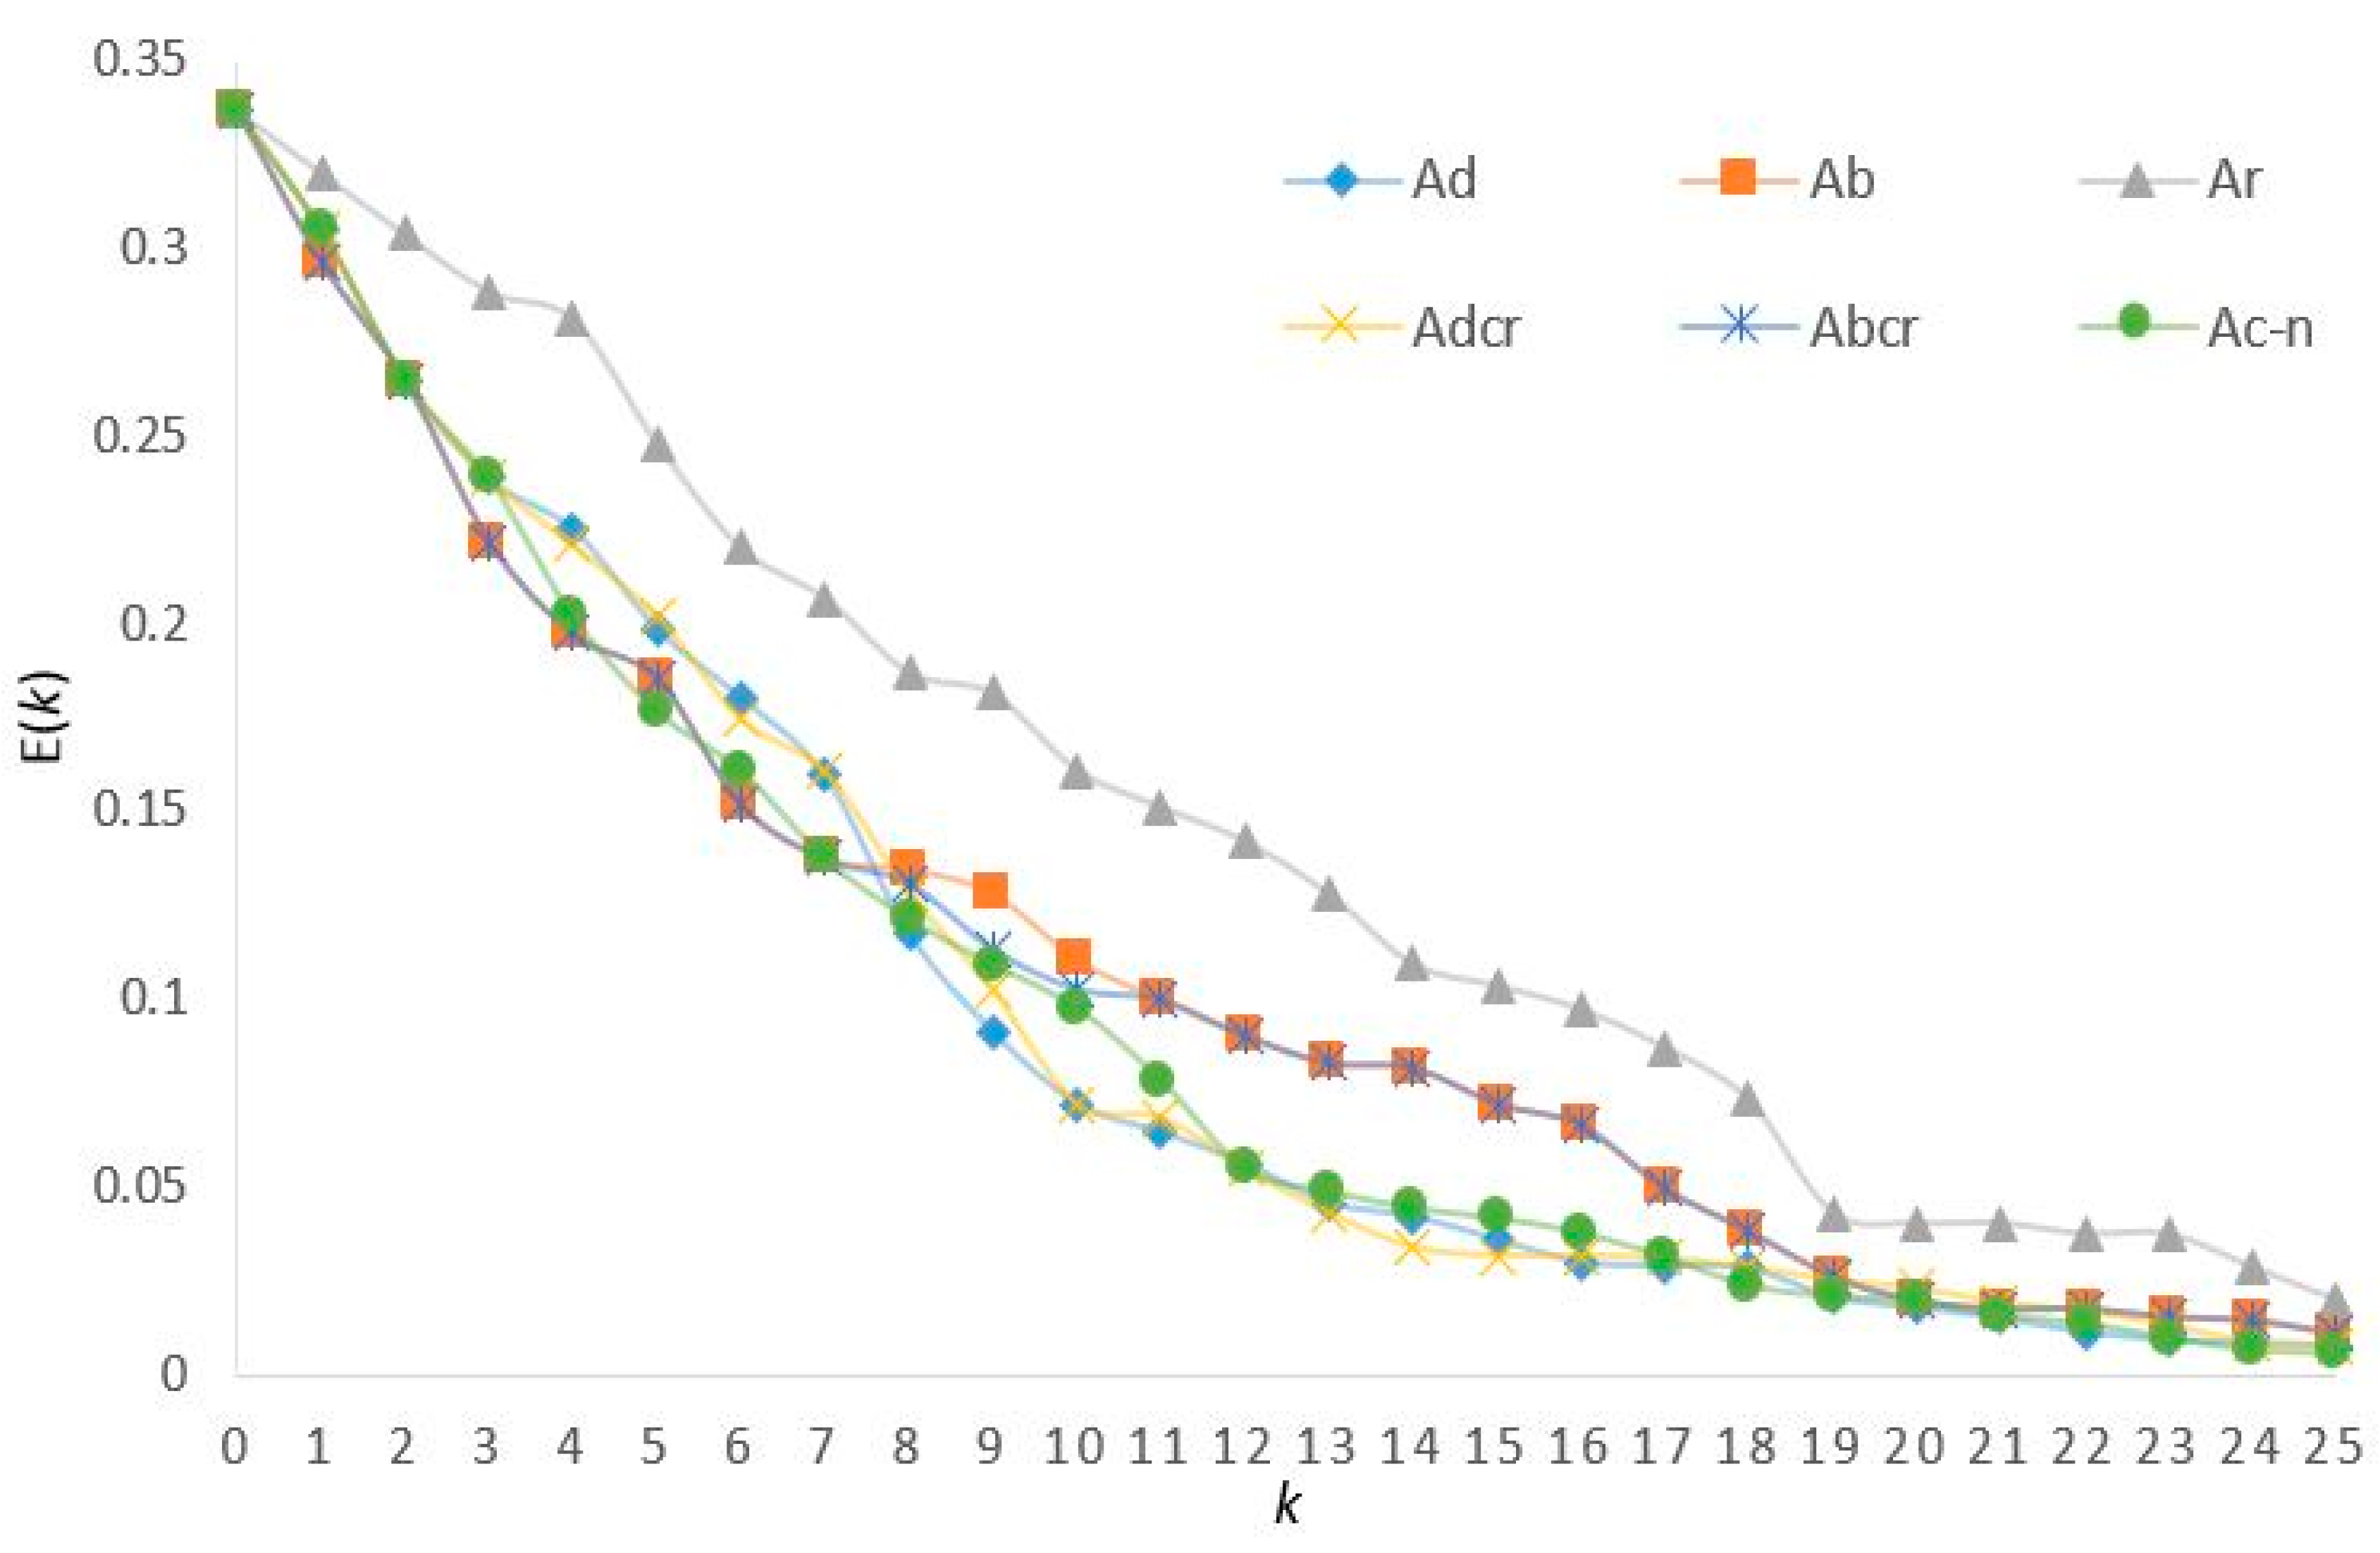
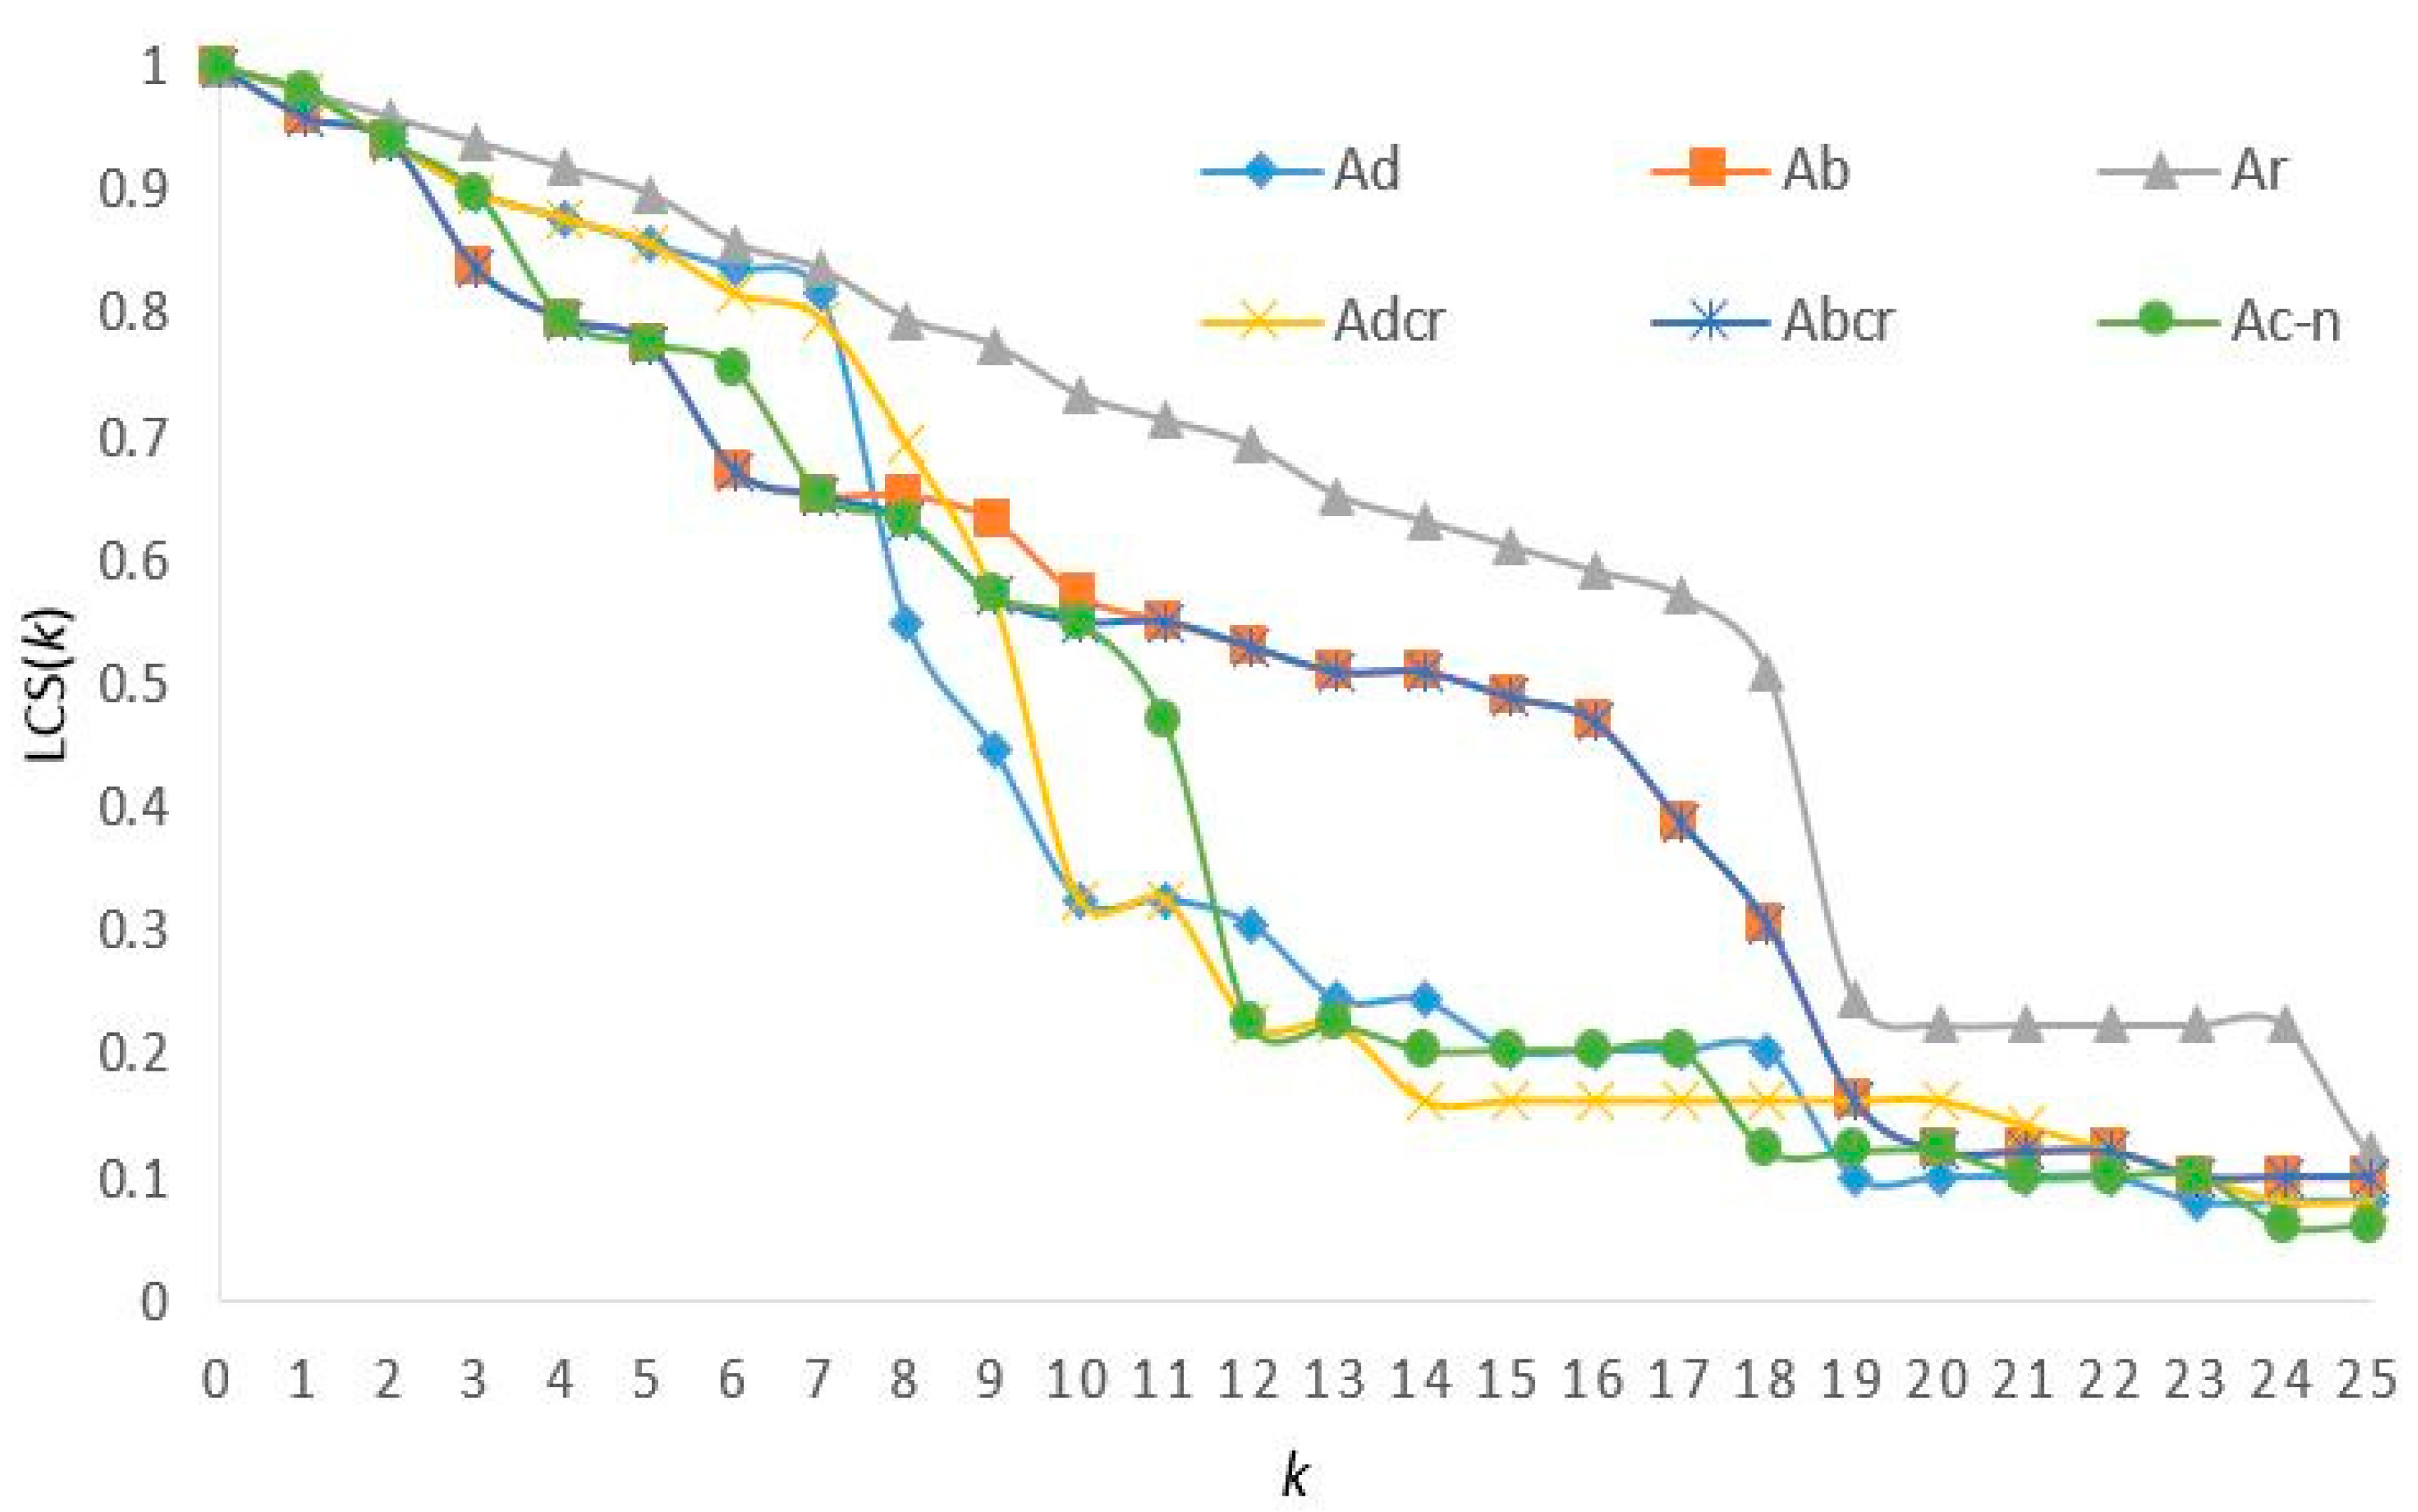
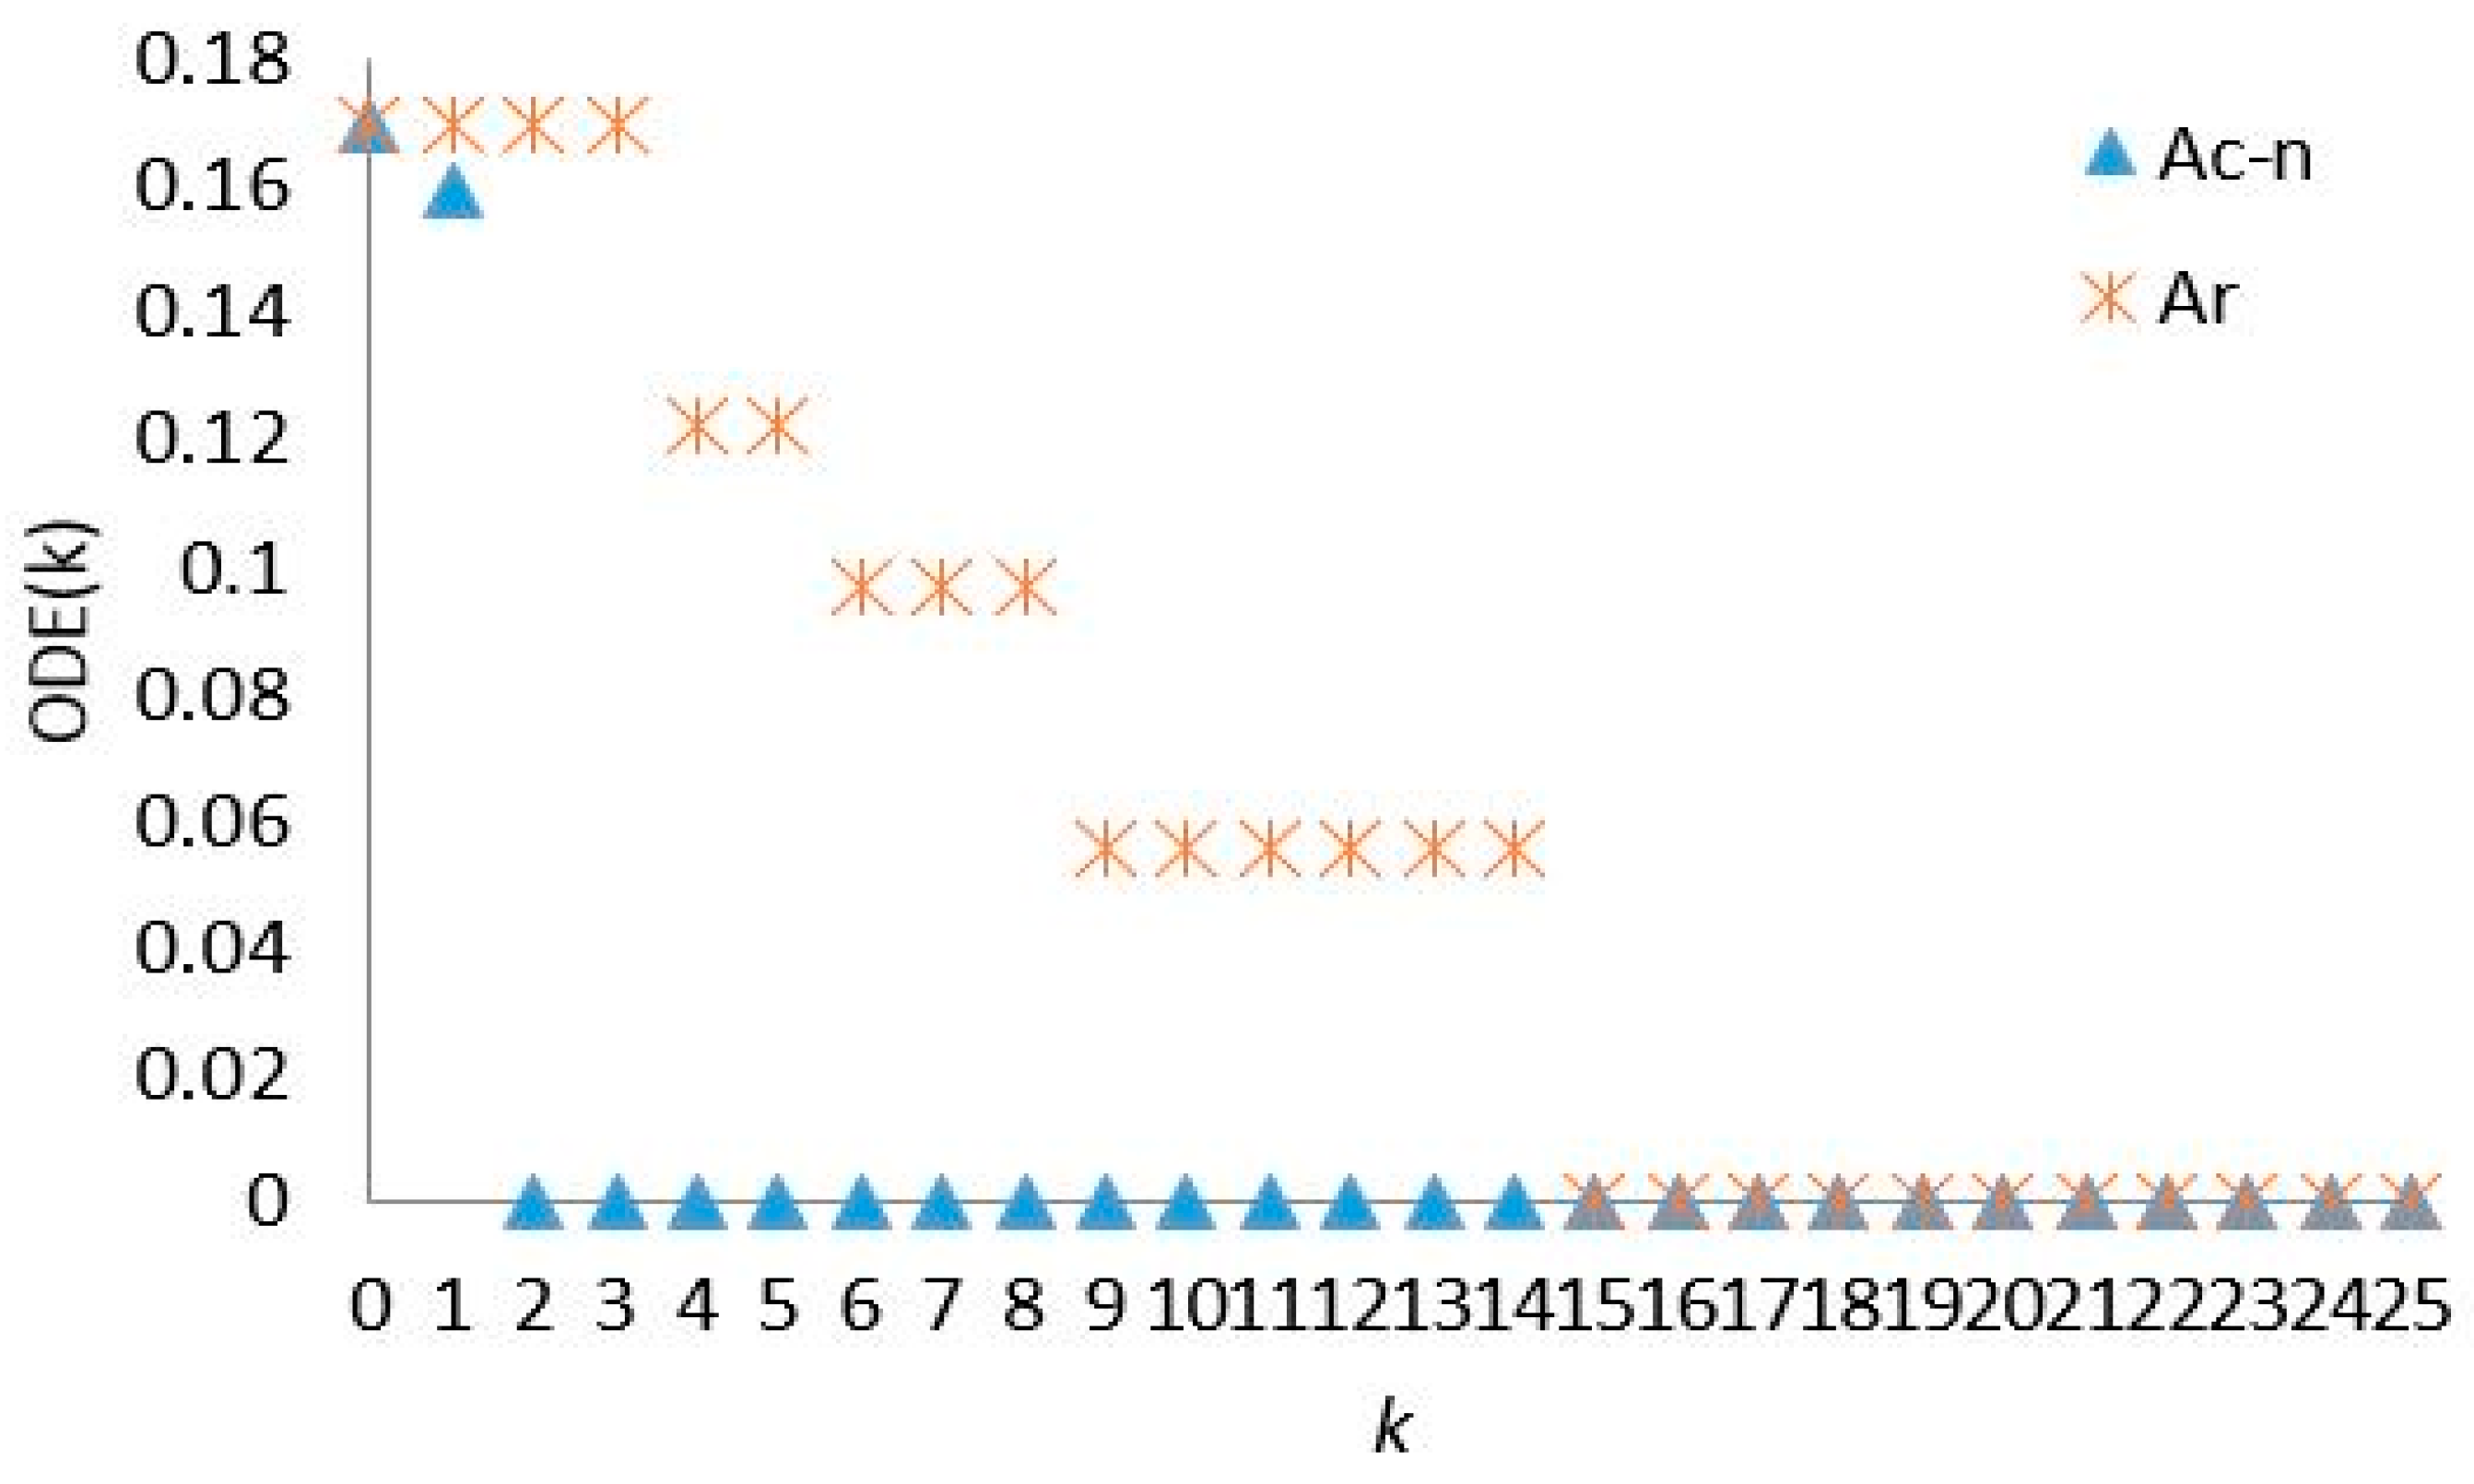
The attack modes based on random failure and 5 strategic modes provide simulations of different forms of destructions on the BTHR rail transit plan network. The network performances of E(k) and LCS(k) are simulated, and the results indicate that the network retains robustness under random failure. Under strategic attacks, though, the network shows ability to resist attack, the network vulnerability is relatively higher. An interesting finding from the measure of ODE(k) concerning regional exterior transit demand shows that failure of two critical nodes (Beijing and Tianjin) would cause fatal effect on the whole network.
(3)
The critical node rankings are quite different under different measures, such as degree/betweenness node-based metrics that have various emphases. However, when evaluating the network vulnerability, different aspects of influence should be taken into consideration. The network performance simulation under attack mode of Core-Nodes provides relatively balanced outputs between measures based on degree and on betweenness, from the perspective of either E(k) or LCS(k). Therefore, the measure of Core-Nodes is more suitable for critical node identification, as it represents for comprehensive network performance.
(4)
Although both centralities of Beijing and Tianjin are high, the influence of their failures on the whole BTHR rail transit network is only 6–21%. However, with multiple nodes failures, especially when the 8th node is destroyed, have huge impact on network performance, and the impact on E(k) is larger than that of LCS(k). The finding indicates that the robustness in the BTHR rail transit plan network is quite strong, though the impact of critical nodes failure on shortest paths is relatively high, the influence on partial nodes connectivity is quite small.
(5)
Considering regional network performance, the protection and emergency rescue preparation are not only essential for several large nodes such as Beijing and Tianjin, but is also important for nodes of Hengshui, Shijiazhuang, Miyun, Cangzhou, Huailai and Tangshan which have huge impact on the whole network shortest paths and connectivity. In terms of the regional exterior transit or transit towards the sea, Tianjin becomes a life-and-death node which should be paid large attention to. The safety protection and emergency rescue preparation should be strengthened, and multiple branch links connected to the sea should be constructed in order to raise the robustness of the network.
In the domain of transportation network, the identification of critical nodes is of great importance to the sustainable development of transportation infrastructures, as we can raise the network robustness by setting up rescue stations accordingly, increasing redundant lines or other lines in the network. The method of critical node identification in this study is expected to present the locations of vulnerable nodes combined with real network conditions. In addition, the methodology can also be applied to studies on system vulnerability evaluation of other areas, such as electricity, communication and infrastructure constructions.
Further studies may be conducted with several additional factors, or aiming at analyzing the vulnerability of the integrated effects of different modes of transport. The pattern of natural destroy can be evaluated based on historical statistics, and the network performance under natural attacks can be simulated. Nevertheless, the impact of different travel modes is critical to the integration of transportation in the BTHR, thus is worth studying in the future. Third, but not the least, the real travel flow from the BTHR rail transit network after construction is worth collecting and taking into consideration as a key component of vulnerability analysis. In this way, we will pay more attention to research on the operational rail domain, combine the theoretical model with actual operations and make the research more applicable to real-traffic sustainable developments.

Acknowledgments

This research was funded by the Beijing Science and Technology Project (No. Z161100001116093).

Author Contributions

Jing Liu and Huapu Lu designed the methodology and proposed the model; Jing Liu performed the experiments; Jing Liu and He Ma analyzed the data; Huapu Lu analyzed the outputs of the simulations. Jing Liu wrote the paper. He Ma and Wenzhi Liu contributed valuable opinions during the manuscript writing. All authors read and approved the final manuscript.

Conflicts of Interest

The authors declare no conflict of interest.

References

  1. Quan, B.; Li, X. Research on Transport Development Strategy in Tianjin in the Context of Beijing-Tianjin-Hebei Regional Integration. City Plan. Rev. 2014, 8, 15–22. [Google Scholar]
  2. Feng, L.; Feng, Z. Natural disaster character analysis of Beijing-Tianjin-Hebei metropolitan circle from the perspective of vulnerability. J. Nat. Disasters 2013, 22, 101–107. [Google Scholar]
  3. Mattsson, L.G.; Jenelius, E. Vulnerability and resilience of transport systems—A discussion of recent research. Transp. Res. Part A 2015, 81, 16–34. [Google Scholar] [CrossRef]
  4. Sun, D.J.; Zhao, Y.; Lu, Q.C. Vulnerability analysis of urban rail transit networks: A case study of Shanghai, China. Sustainability 2015, 7, 6919–6936. [Google Scholar] [CrossRef]
  5. Banica, A.; Rosu, L.; Muntele, I.; Grozavu, A. Towards Urban Resilience: A Multi-Criteria Analysis of Seismic Vulnerability in Iasi City (Romania). Sustainability 2017, 9, 270. [Google Scholar] [CrossRef]
  6. Berdica, K. An introduction to road vulnerability: What has been done, is done and should be done. Transp. Policy 2002, 9, 117–127. [Google Scholar] [CrossRef]
  7. Jenelius, E.; Mattsson, L.G. Road network vulnerability analysis of area-covering disruptions: A grid-based approach with case study. Transp. Res. Part A 2012, 46, 746–760. [Google Scholar] [CrossRef]
  8. Cats, O.; Jenelius, E. Dynamic vulnerability analysis of public transport networks: Mitigation effects of real-time information. Netw. Spat. Econ. 2014, 14, 435–463. [Google Scholar] [CrossRef]
  9. Reggiani, A.; Nijkamp, P.; Lanzi, D. Transport resilience and vulnerability: The role of connectivity. Transp. Res. Part A 2015, 81, 4–15. [Google Scholar] [CrossRef]
  10. Cats, O. The robustness value of public transport development plans. J. Transp. Geogr. 2016, 51, 236–246. [Google Scholar] [CrossRef]
  11. Hong, L.; Ouyang, M.; Peeta, S.; He, X.; Yan, Y. Vulnerability assessment and mitigation for the Chinese railway system under floods. Reliab. Eng. Syst. Saf. 2015, 137, 58–68. [Google Scholar] [CrossRef]
  12. Wang, S.; Zhang, J.; Zhao, M.; Min, X. Vulnerability analysis and critical areas identification of the power systems under terrorist attacks. Phys. A Stat. Mech. Appl. 2017, 473, 156–165. [Google Scholar] [CrossRef]
  13. Cats, O.; Jenelius, E. Planning for the unexpected: The value of reserve capacity for public transport network robustness. Transp. Res. Part A 2015, 81, 47–61. [Google Scholar] [CrossRef]
  14. Yang, Y.; Liu, Y.; Zhou, M.; Li, F.; Sun, C. Robustness assessment of urban rail transit based on complex network theory: A case study of the Beijing Subway. Saf. Sci. 2015, 79, 149–162. [Google Scholar] [CrossRef]
  15. Lordan, O.; Sallan, J.M.; Simo, P.; Gonzalez-Prieto, D. Robustness of the air transport network. Transp. Res. Part E 2014, 68, 155–163. [Google Scholar] [CrossRef]
  16. Duan, Y.; Lu, F. Robustness of city road networks at different granularities. Phys. A Stat. Mech. Appl. 2014, 411, 21–34. [Google Scholar] [CrossRef]
  17. Demšar, U.; Špatenková, O.; Virrantaus, K. Identifying critical locations in a spatial network with graph theory. Trans. GIS 2008, 12, 61–82. [Google Scholar] [CrossRef]
  18. Wu, L.; Tan, Q.; Zhang, Y. Network connectivity entropy and its application on network connectivity reliability. Phys. A Stat. Mech. Appl. 2013, 392, 5536–5541. [Google Scholar] [CrossRef]
  19. Bai, G.; Zuo, M.J.; Tian, Z. Ordering heuristics for reliability evaluation of multistate networks. IEEE Trans. Reliab. 2015, 64, 1015–1023. [Google Scholar] [CrossRef]
  20. Chen, A.; Kasikitwiwat, P.; Yang, C. Alternate capacity reliability measures for transportation networks. J. Adv. Transp. 2013, 47, 79–104. [Google Scholar] [CrossRef]
  21. ON-TIME Project. Available online: https://www.cooperationtool.eu/prj/public/ontime_brochure__P__.pdf (accessed on 12 January 2014).
  22. Achit, H. A64 Group-Based Trajectory Analysis of the Economic Effects of Road Accidents on Victims: Evidence from the French Case. J. Transp. Health 2015, 2, S38. [Google Scholar] [CrossRef]
  23. Hayashi, Y. Disaster resilience in transport. In Proceedings of the CODATU XVI Conference, Istanbul, Turkey, 2–5 February 2015; p. 25. [Google Scholar]
  24. Wehbé, R. Road safety and security in cities (II). In Proceedings of the CODATU XVI Conference, Istanbul, Turkey, 2–5 February 2015; p. 33. [Google Scholar]
  25. Petreska, I.; Tomovski, I.; Gutierrez, E.; Kocarev, L.; Bono, F.; Poljansek, K. Application of modal analysis in assessing attack vulnerability of complex networks. Commun. Nonlinear Sci. Numer. Simul. 2010, 15, 1008–1018. [Google Scholar] [CrossRef]
  26. Li, J.; Dueñas-Osorio, L.; Chen, C.; Shi, C. Connectivity reliability and topological controllability of infrastructure networks: A comparative assessment. Reliab. Eng. Syst. Saf. 2016, 156, 24–33. [Google Scholar] [CrossRef]
  27. Gupta, S.; Kazi, F.; Wagh, S.; Singh, N. Analysis and prediction of vulnerability in smart power transmission system: A geometrical approach. Electr. Power Energy Syst. 2018, 94, 77–87. [Google Scholar] [CrossRef]
  28. Albert, R.; Barabási, A.L. Statistical mechanics of complex networks. Rev. Mod. Phys. 2002, 74. [Google Scholar] [CrossRef]
  29. Albert, R.; Jeong, H.; Barabási, A.L. Error and attack tolerance of complex networks. Nature 2000, 406, 378–382. [Google Scholar] [CrossRef] [PubMed]
  30. Wang, J. Robustness of complex networks with the local protection strategy against cascading failures. Saf. Sci. 2013, 53, 219–225. [Google Scholar] [CrossRef]
  31. China Association of Plant Engineering. Available online: http://cape.ndrc.gov.cn/zcfg/201612/t20161202_829069.html (accessed on 18 November 2016).
  32. Liu, Y. Invulnerability Optimization and Evaluation Techniques of Complex Network. Ph.D. Thesis, Beijing University of Posts and Telecommunications, Beijing, China, 2011. [Google Scholar]
  33. Strogatz, S.H. Exploring complex networks. Nature 2001, 410, 268–276. [Google Scholar] [CrossRef] [PubMed]
  34. Brandes, U. On variants of shortest-path betweenness centrality and their generic computation. Soc. Netw. 2008, 30, 136–145. [Google Scholar] [CrossRef]
  35. Ghedini, C.G.; Ribeiro, C.H. Rethinking failure and attack tolerance assessment in complex networks. Phys. A Stat. Mech. Appl. 2011, 390, 4684–4691. [Google Scholar] [CrossRef]
  36. Watts, D.J.; Strogatz, S.H. Collective dynamics of ‘small-world’networks. Nature 1998, 393, 440–442. [Google Scholar] [CrossRef] [PubMed]
Figure 1. The topology networks of BTHR rail system development plans.
Sustainability 09 01479 g001
Figure 2. (a) Description of the degree of BTHR rail system development plans nodes; (b) Description of the betweenness of the BTHR rail system development plans nodes.
Sustainability 09 01479 g002
Figure 3. Node connectivity reliability based on Monte Carlo simulation.
Sustainability 09 01479 g003
Figure 4. Network efficiency simulation outputs under six different attack modes.
Sustainability 09 01479 g004
Figure 5. Simulation outputs of LCS(k) under 6 different attack modes.
Sustainability 09 01479 g005
Figure 6. Simulation outputs of ODE(k) under attack mode of Ac−n considering OD.
Sustainability 09 01479 g006
Table 1. Station and node number of Beijing-Tianjin-Hebei Region (BTHR) rail system development plans network.
Node No.StationNode No.StationNode No.StationNode No.Station
1Beijing14Qinhuangdao27Zhangxin40Huangye
2Langfang15Chongli28Tongzhou41Hejian
3Tianjin16Xiahuayuan29Yizhuang42Dingzhou
4Yujiapu17Zhangjiakou30Huangcun43Anxin
5Sea-front18Huailai31Liangxiang44Baodi
6Shijiazhuang19Miyun32Chengde45Jixian
7Xingtai20Pinggu33Shenyang direction46Zunhua
8Handan21Xianghe34Huhehaote direction47Qian’an
9Baigou22Wuqing North35Taiyuan direction48Laoting
10Bazhou23New airport36Hengshui49Caofeidian
11Baoding24Gu’an37Ji’nan direction
12Cangzhou25Zhuozhou38Zhengzhou direction
13Tangshan26Capital airport39Liaocheng direction
Table 2. General properties of BTHR rail system development plans network.
NetworkNE<k>CB
Value49833.3880.16967.571
Table 3. Notation glossary used in 3.3.
SymbolDescription
dij (k)The shortest path between node i and node j
N o Set of origin nodes of the planning rail network, representing, origin stations
N d Set of destination nodes of the planning rail network, representing, destination stations
N l ( k ) The number of the nodes in the largest connected sub- network
N o i The number of nodes in the fraction connected with origin node
C i ( k ) A node of degree at least 2 as the proportion of links between the vertices within its neighborhood divided by the number of links that could possibly exist between the neighbors [36]
E ( k ) The normalized average value of the inverse of shortest path distance tween any two nodes
ODE ( k ) Only considers the shortest path between the origin nodes and the destination nodes
LCS(k)The ratio of nodes to total nodes in the largest connected sub-network to total nodes
CL(k)The average fraction of nodes of origin nodes connected by each node
CC ( k ) The average clustering coefficient measures the clustering (triangulation) within a network by averaging the clustering coefficients of all its nodes.
Table 4. Notation glossary used in attack simulation.
SymbolDescription
A r Attack the nodes on random order
A d Attack the nodes on the order of K i
A b Attack the nodes on the order of B i
A d c r Attack the nodes on the order of DCR i
A b c r Attack the nodes on the order of BCR i
A c n Attack the nodes on the order of Core-nodes
Table 5. The nodes importance of the BTHR rail system development plans.
NodeDegreeNodeBetweenness
Beijing9Tianjin309.269
Tianjin7Beijing306.662
Hengshui6Huailai191.767
Langfang5Shijiazhuang159.752
Miyun5Miyun155.514
Yizhuang5Hengshui143.881
Tangshan5Cangzhou139.691
Qinhuangdao5Xiahuayuan137.000
Shijiazhuang5Liangxiang128.385
Cangzhou5Sea-front121.778
Tongzhou4Baodi111.573
Baoding4Bazhou93.558
Bazhou4Tangshan92.127
Baodi4Xingtai92.000
Baigou4Langfang89.827
Table 6. Node connectivity reliability based on Monte Carlo simulation.
Node ω i Node ω i Node ω i Node ω i
10.931959140.953820270.95382400.94389
20.929461150.728314280.95382410.94389
30.953820160.73031290.95382420.94389
40.914424170.728314300.95382430.93195
50.953820180.953820310.95382440.95382
60.943898190.953820320.95382450.95382
70.943898200.95382330.95382460.95382
80.908131210.95382340.723514470.95382
90.931959220.906539350.914424480.95382
100.943898230.95382360.943898490.95382
110.931959240.931959370.943898
120.943898250.931959380.908131
130.95382260.95382390.943898
Table 7. Values of DCR i BCR i and the Core-Node ranking.
Node D C R i Node K i Node B C R i Node B i Core-Node
18.387633193294.98713309.2691Beijing
36.676743371285.79651306.6623Tianjin
365.66338836618182.911318191.76736Hengshui
134.769102256150.78966159.7526Shijiazhuang
144.7691026519148.332419155.51419Miyun
194.76910212536135.80936143.88112Cangzhou
294.76910213512131.85412139.69118Huailai
64.7194914531122.45621613713Tangshan
124.719491955116.154331128.3855Sea-front
24.64730629544106.42065121.7782Langfang
53.8152825416100.052544111.57314Qinhuangdao
183.815282941088.309211093.55829Yizhuang
213.8152821041387.872611392.12710Bazhou
233.815282114786.8386179244Baodi
273.815282184283.49071289.82731angxiang

