1. Introduction
In buildings, excessive solar radiation is allowed indoors through curtain walls and wide window areas, increasing the indoor cooling load during the cooling period. To avoid over-heating in buildings, installation of shading devices is important. Shaded areas generated by shading devices can reduce solar heat gain through building windows. Studies on shaded areas are mostly conducted in fields where the duration of sunshine and solar beams directly influence the energy efficiency of buildings, such as green buildings and solar photovoltaics (PV) [
1,
2].
Shading devices can be largely divided into fixed shading devices and movable shading devices. In general, fixed shading devices use vertical or horizontal shading elements. Studies on fixed shading devices mostly concern comparisons of the required energy amount between cases that use a shading device and cases that do not, or comparisons of performance for environmental factors for different orientations of the building envelope [
3,
4,
5,
6,
7,
8]. Through a numerical analysis, Palmero-Marrero et al. [
3] compared the energy requirements according to the slat angles of fixed louvers, the altitude of the sun, the azimuth, and the height of the windows. Fixed shading devices dealt with in previous studies can be analyzed using various numerical analysis methods [
4,
8]. With fixed shading devices, however, it is difficult to provide active control in response to external weather conditions.
Movable shading devices have been studied to overcome the limitations of fixed shading devices in terms of energy and environmental performances, and to provide efficient solar radiation control methods. Studies that consider the shaded areas of movable shading devices have evaluated savings in energy consumption obtained by operating movable shading devices, using external venetian blinds and roll blinds as the most widely used examples [
9,
10,
11,
12,
13]. Sun et al. incorporated the shaded ratio as a factor depending on the type of shading device and the type of material in considering solar radiation quantity, and analyzed the energy consumption by rotating the experimental apparatus [
9]. Tzempelikos et al. [
10] compared the cooling and lighting demands according to the on/off control methods of roller shades and electric lighting, and in their other study [
11], shaded fractions were suggested for various rotating cases by considering factors related to the shape of venetian blinds such as slat dimensions. Corrado et al. [
12] and Pongpattana et al. [
13] calculated the shaded area by considering combinations of overhangs and fins.
An increasing number of buildings have adopted the kinetic façade in consideration of both design and functional elements to actively adjust the amount of solar radiation received [
14,
15,
16,
17]. A kinetic façade refers to a double skin façade structure in which an additional envelope comprising a shading device is installed on the outside of the curtain wall [
18]. A kinetic façade has shading elements of various shapes and movement directions that respond to changes in the surrounding environment, such as solar radiation and air currents. The shaded areas generated on windows by the shading device serve as an important factor in calculating the solar heat gain through the windows. The various shapes and movement directions of the shading device on a kinetic façade incur real-time changes in the shaded areas of the windows, thus making it difficult to calculate the solar heat gain. Therefore, to calculate the solar heat gain in consideration of the operation of the kinetic façade, it is necessary to first calculate the shaded areas based on the shapes and movement changes of the shading device.
The shaded area calculation methods used in existing studies include a method for calculating the shaded areas of shading elements having simple shapes based on the dimensional information of each shading element [
19], as well as the “cell method” and “point method,” which require complicated calculation procedures using computer programs. The cell method divides a window into segments and calculates the sum of the applicable cell areas [
20], whereas the point method uses the projection points of the actual geometrical figure [
21,
22,
23].
In the case of fixed shading devices, because the shading elements do not move, the shaded area can be estimated using equations that consider only the movement and orientation of the sun. However, to calculate a shaded area for a dynamic shading device such as a kinetic façade, not only the movement and orientation of the sun, but also the complex shapes and movements of the shading elements must be incorporated [
10,
24]. To calculate the solar heat gain in consideration of the irregular shapes and movements characteristic of a kinetic façade, the calculation of the accurate shaded areas must consider the geometric figures of the shading elements as well as changes that occur according to operating mode and time.
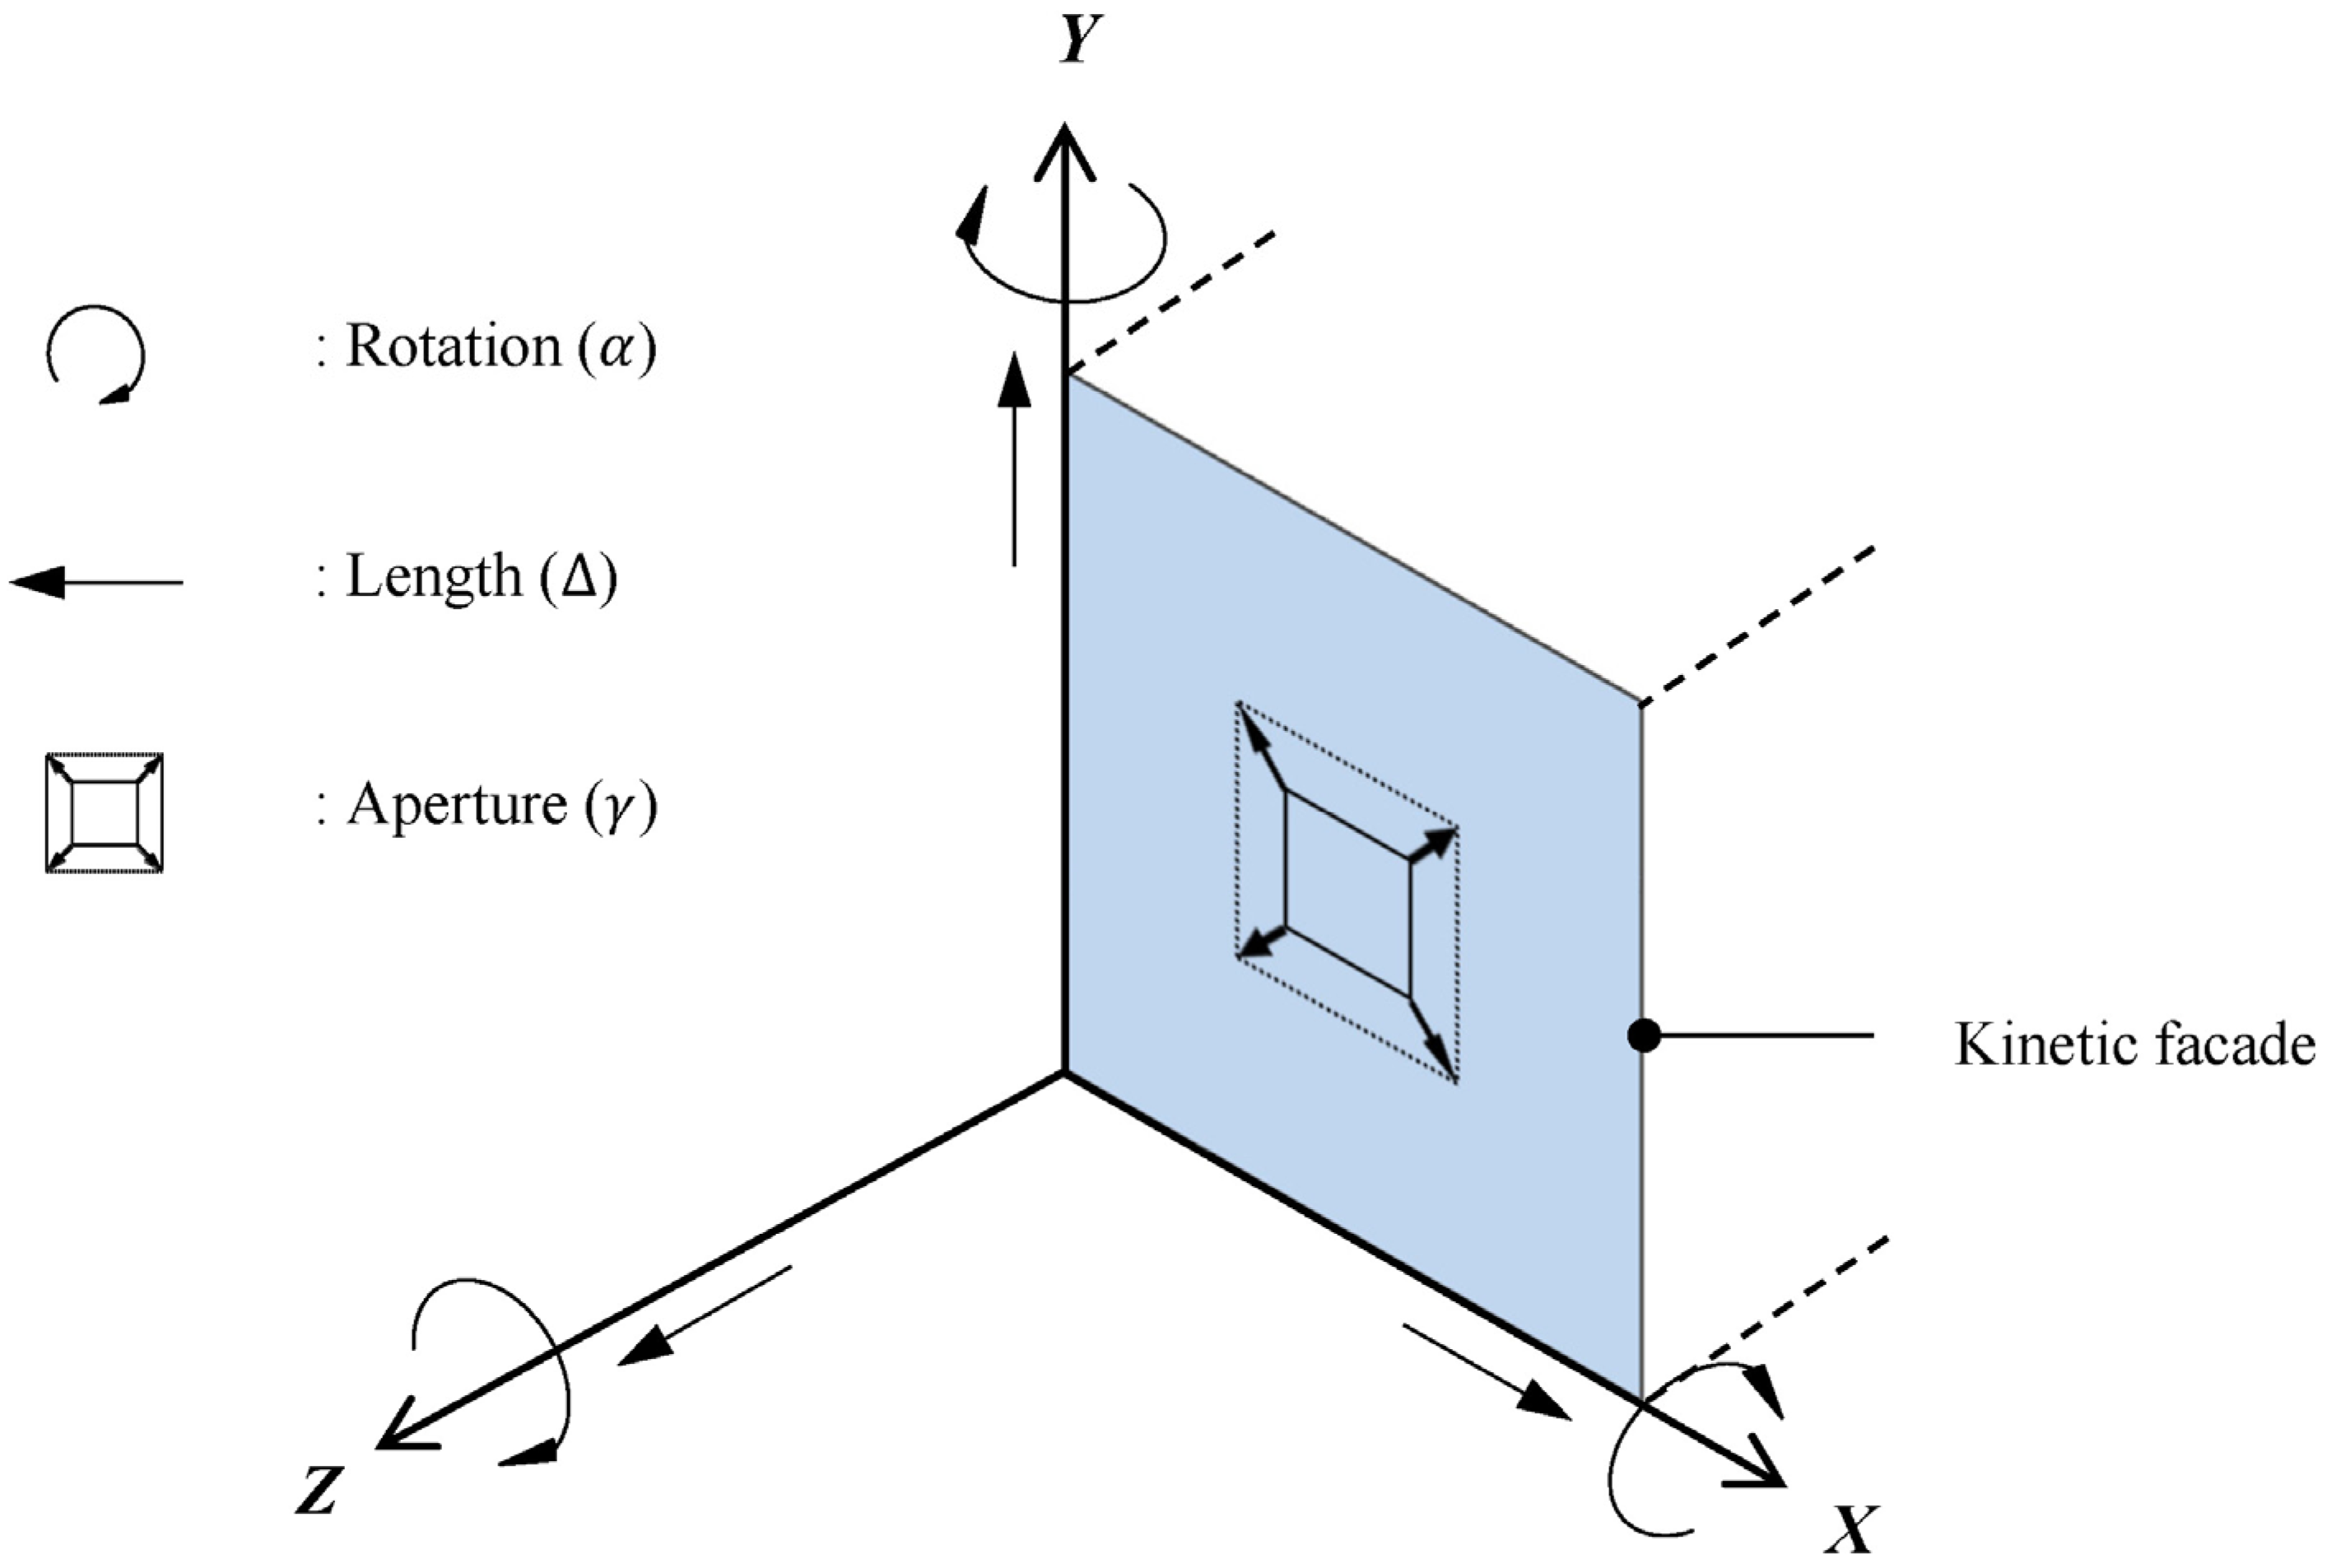
This study proposes a shaded fraction calculation process that considers the “irregular shapes” and “movement changes” characteristics of a kinetic façade. To consider the “position of the sun”, the “shape of the shading elements”, and the “movements of the shading device” in calculating the shaded areas, a planar-polygon method is used, which is a method for calculating the shape of a figure’s projection onto a plane. The shaded fractions were calculated for each orientation of the envelope, with the movement directions of the kinetic façade classified into the longitudinal, rotational, and opening/closing directions according to operation mode. A shaded fraction estimation equation having a movement step () as a variable was derived through an analysis of the shaded fraction values depending on the operation types of movable shading devices. The estimation equation was derived based on two selected movement directions (i.e., angle change and length change) of horizontal shading devices for an envelope facing southward located in Seoul, Korea, during the summer solstice.
The shaded fraction projected onto the window by an external movable shading device varies according to the type of shading device, façade orientation, and time. Therefore, to accurately evaluate the energy and environmental performance of a kinetic façade, the shaded fraction must be calculated using the detailed model information of the shading device and a complex calculation process. In addition, when reviewing and identifying the characteristics of the shaded areas provided by the various types of shading devices during the early design stages, a simpler method for estimating shaded area can be used.
2. Calculation of the Shaded Area for External Movable Shading Devices
2.1. Review of Shaded Area Calculation Methods
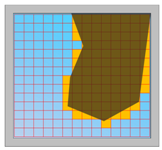
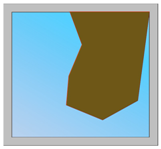
A shaded area created by an external movable shading device can be calculated in two ways. The first is the cell method, which entails dividing a lit plane into a grid of cells. The number of cells that do not receive solar rays within a target area (i.e., the glazing) is added up. The second is the point method, which entails projecting the coordinates of a shading element onto a target area to obtain the coordinates of the shadow and then calculating the area of the geometric figure defined by the shadow’s coordinates.
The cell method in turn can be divided into the grid method and the bar method. The grid method divides a lit plane into segments of a certain unit area, and calculates the shaded area by excluding the areas of segments that receive solar radiation from the total window area. The grid method provides the advantage of fast calculation speed, and an example of the grid method includes the ray-tracing method. This method has been used in Ecotect and Energy plus, which are types of daylight and energy analysis software [
25]. Similar to the grid method, the bar method divides a lit window into segments of a certain unit area; however, the divided segments each have the shape of a bar. The shadows projected onto a lit plane thus are shaped as bars in accordance with the divided segments, and the shaded area is calculated by adding up the areas of the bars. This method was applied to DOE-2, and the error rate was shown to vary depending on the number of divided bars [
26].
The point method adopts the polygon method. The polygon method entails calculating the area of a polygon by regarding it as a composite of lines. The three-dimensional coordinates of the solar rays and the shading elements form vectors, which are projected onto the target area. The projected coordinates, which form a geometrical figure, are the coordinates of the shaded area. The shaded area can thus be obtained by using the method of calculating polygonal areas according to the polygon method to calculate the areas defined by the shadow coordinates. Unlike the first method, the point method calculates the outline of the shadow actually projected by an object, thus its calculation speed is slower but its accuracy is higher [
20,
21,
22,
23].
Table 1 shows a comparison of the different shaded area calculation methods.
Although the grid method and the bar method, examples of the cell method, are used in many programs due to their fast speed and low error rate, the calculation error may increase as the shape of the target object becomes more complicated. In the case of existing fixed-type shading devices where the shading elements have simple shapes, the use of the cell method can be advantageous, but even in this case, the calculation of the shaded area can be limited when the cell size is larger.
The shaded area is a major factor for shading devices and is needed in evaluating the solar heat gain, glare protection, illuminance satisfaction, or other thermal and visual environment performance of a kinetic facade. Evaluating the shading performance of kinetic facades and determine their proper control strategies must be preceded by an accurate calculation of the shaded area. Therefore, for incorporating the complex shapes and movements of a kinetic façade, it is more appropriate to use the point method, which allows a more accurate calculation of the shaded area.
2.2. Shaded Area Calculation Using Planar-Polygon Method
Because the planar-polygon method [
21,
23] can accurately draw complex shadow shapes, it is suitable for calculating the shaded area of a movable shading device. This method calculates the shaded area by accurately defining the shape of a geometric figure projected onto the target area. Because it calculates the area of a figure formed by connecting the projected coordinates with lines, it can also be used for a figure defined by curved lines. General polygon clipper (GPC) [
22,
27] was adopted to calculate intersection areas of two or more polygons. Sum of the overlapped areas is subtracted from sum of the shaded areas generated by multi-slats using GPC method.
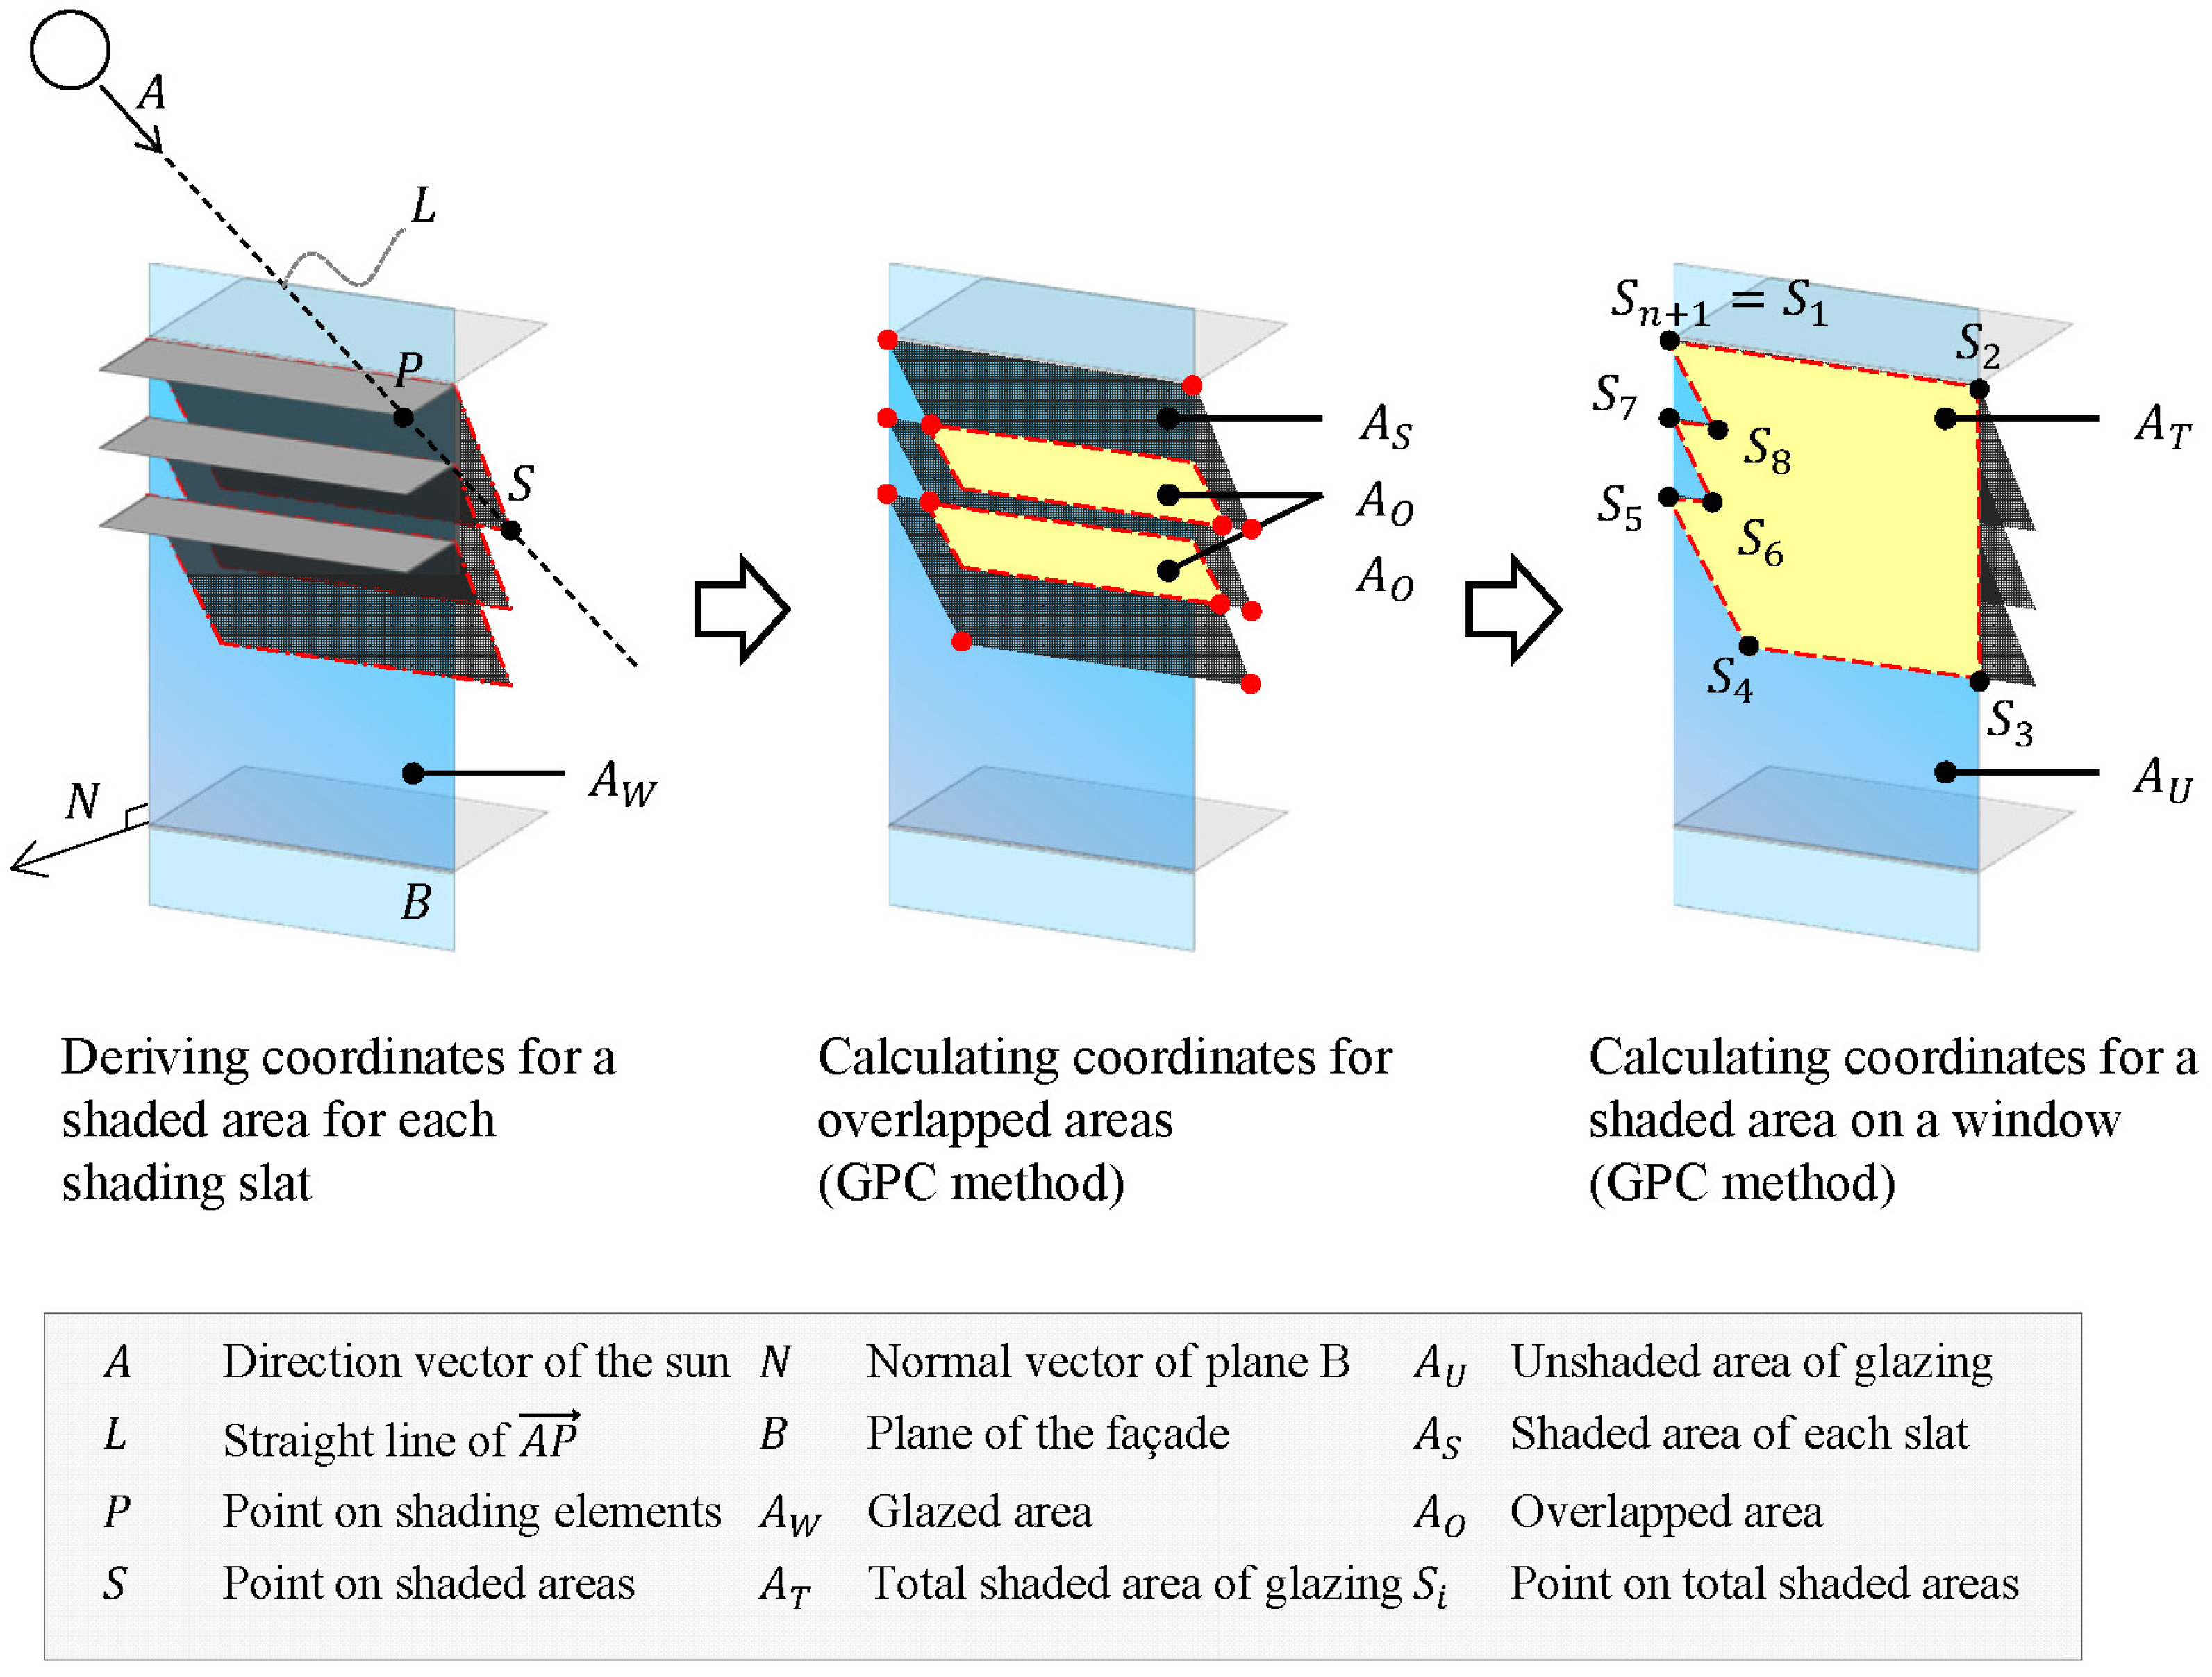
The shaded area calculation for a kinetic façade includes three processes, as shown in
Figure 1.
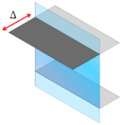
2.2.1. Calculation of the Shade Coordinates of the Shading Elements
To calculate the total shaded area (
) provided by a shading device, three-dimensional position coordinates must be obtained for the sun and the shading elements. The position of the sun can be calculated using the azimuth and altitude based on regional climate data, and its changes in position throughout the year can be represented in the coordinate system. The direction vector (
) of the sun can be calculated from Equation (1) using the azimuth (
) and solar altitude (
).
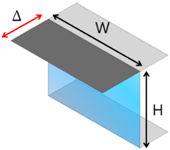
The shaded area is formed as the shape of the shading elements is projected onto the glazing by solar rays. The solar rays pass through a point on the shading device and arrive at the window, and the coordinate where the solar rays arrive becomes a shade coordinate of the shading element. These shade coordinates form a geometric figure on the window. The figure thus formed becomes the shaded area provided by the shading device. The shade coordinates of the shading device can be obtained through Equation (2) [
20].
where
L is a straight line passing through the sun’s direction vector (
) and a point
(=
) on a shading element, and
is a parameter. Parameter must be calculated to obtain the intersection of the line
L and plane
. Equation (3) is the equation for obtaining
. In addition,
(=
) is the normal vector of plane
(=
). Point
, which is a shade coordinate for the shading device, is the coordinate where the line
passes through point
of a shading element and meets the plane
. It can be obtained using Equations (2) and (3) (see
Figure 1).
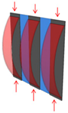
2.2.2. Calculation of Overlapping Shaded Areas for Exclusion
If a shading device has several slats, the shaded areas of the slats may overlap one another. For example, in the case of a single shading element, where the shading device has a single plane that needs to be considered (i.e., a roll blind or an awning), the shaded area can be calculated using the coordinates obtained through the shade coordinate calculation. However, in the case of several slats (i.e., venetian blinds or vertical fins), the shaded areas created by the multiple slats can be superimposed one over another. To exclude the area of overlapping shadows, it is necessary to find the coordinates of new geometric figures formed by the shadow outlines of the respective slats and their intersections (see
Figure 1, middle). This can be achieved using the GPC model [
21,
22,
23], and a GPC code published in the University of Manchester GPC library [
27] was adopted in the shaded area calculation algorithm.
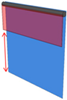
2.2.3. Calculation of the Shaded Area Drawn over a Window
Solar heat gain is obtained through the windows. Therefore, if a shadow provided by a shading device is not drawn over the window, the corresponding area must be excluded from consideration. This can be done by comparing the coordinates of the shading device’s shadow and the coordinates of the window, and calculating the coordinates of their intersection. The final shaded area (
) can be calculated through inner and outer products of coordinate
, as shown in Equation (4). To form a closed curve,
.
2.3. Shaded Area Calculation According to Changes in Operation
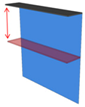
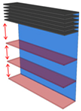
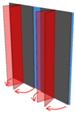
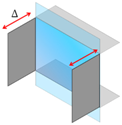
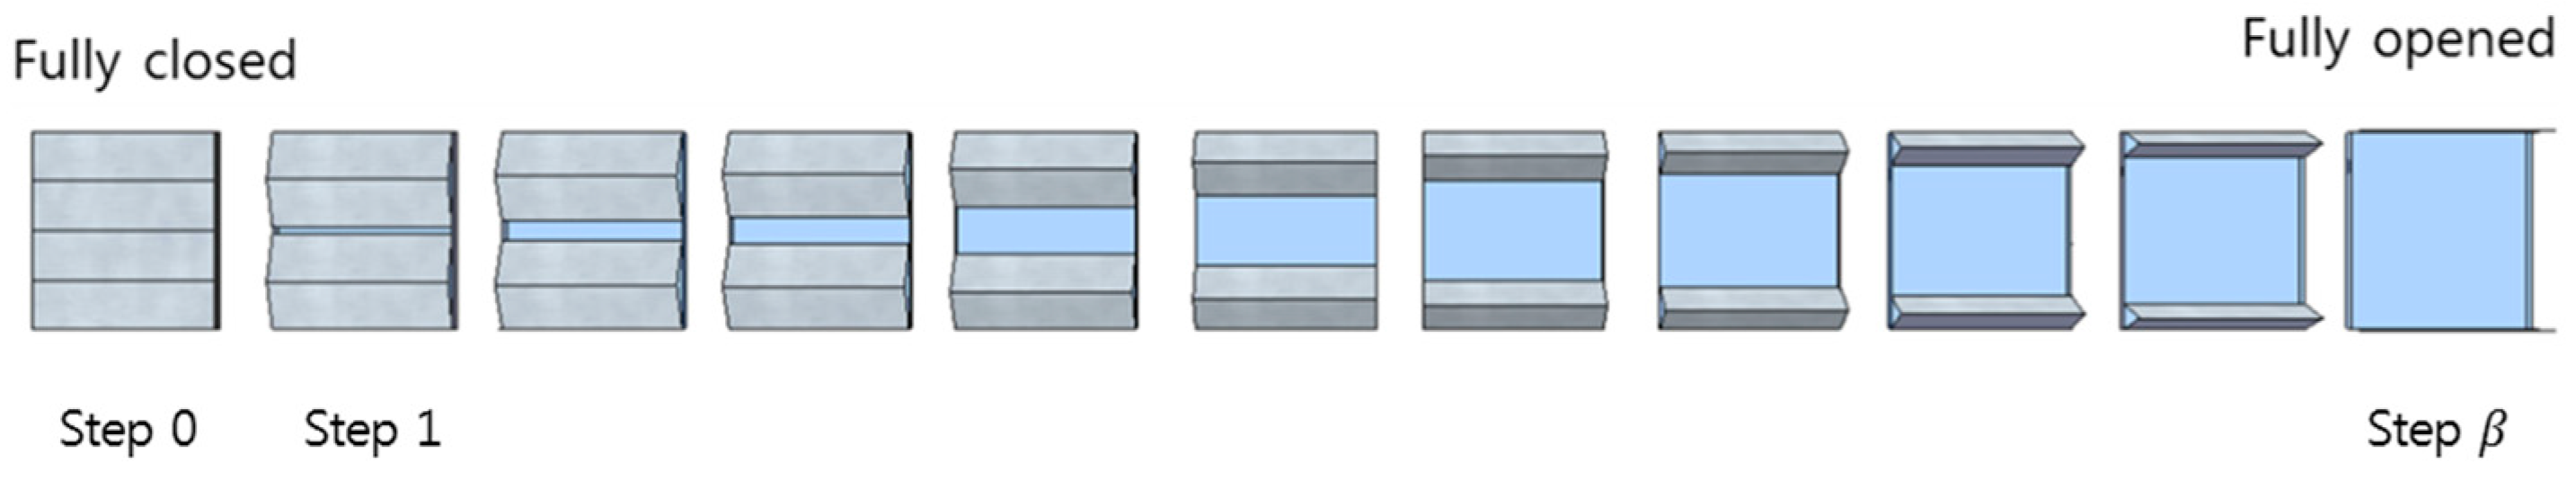
The shaded area of a fixed shading device changes over time. The shaded area of a movable shading device, however, changes over time and changes according to operation. Therefore, to incorporate the movement of a movable shading device, the two variables of time and operation must be considered together. As for time, because the position of the sun does not change dramatically, the shaded area is calculated in one-hour intervals. As for operation, there is no particular operation module that can be selected, because there is no definite control standard. To consider continuous changes in operation, the operating range is finely divided such that the difference in shaded area is not excessively large. Therefore, the operating range of a kinetic façade is divided into
steps, and the shaded area is calculated by representing the change in operation as an
number of fixed shading elements. Accordingly, the shaded area can be calculated with the mode of operation incorporated as a variable that changes over time in a discontinuous manner.
Figure 2 shows an example of incorporating changes in operation by representing the operation with
movement steps according to the length variation type.
If the value of an operation variable is
, the shaded area coordinate
can be obtained using Equation (5) and the position vector of the sun at a certain time (
). The total shaded area (
) for the value of the operation variable (i.e., specific level (
) of the movement step,
) can be calculated using
, as shown in Equation (6).
Since there are no specific control standards regarding how a kinetic façade should be operated, there is no definitive set of time-dependent operating procedure that can be applied. However, the position of the façade can be controlled to minimize cooling, heating, and lighting energy, or to minimize discomfort. To calculate the shaded area reflecting such control, the values and ranges of the operating variables representing the control must be established.
2.4. Deriving a Tool for Calculating Shaded Area
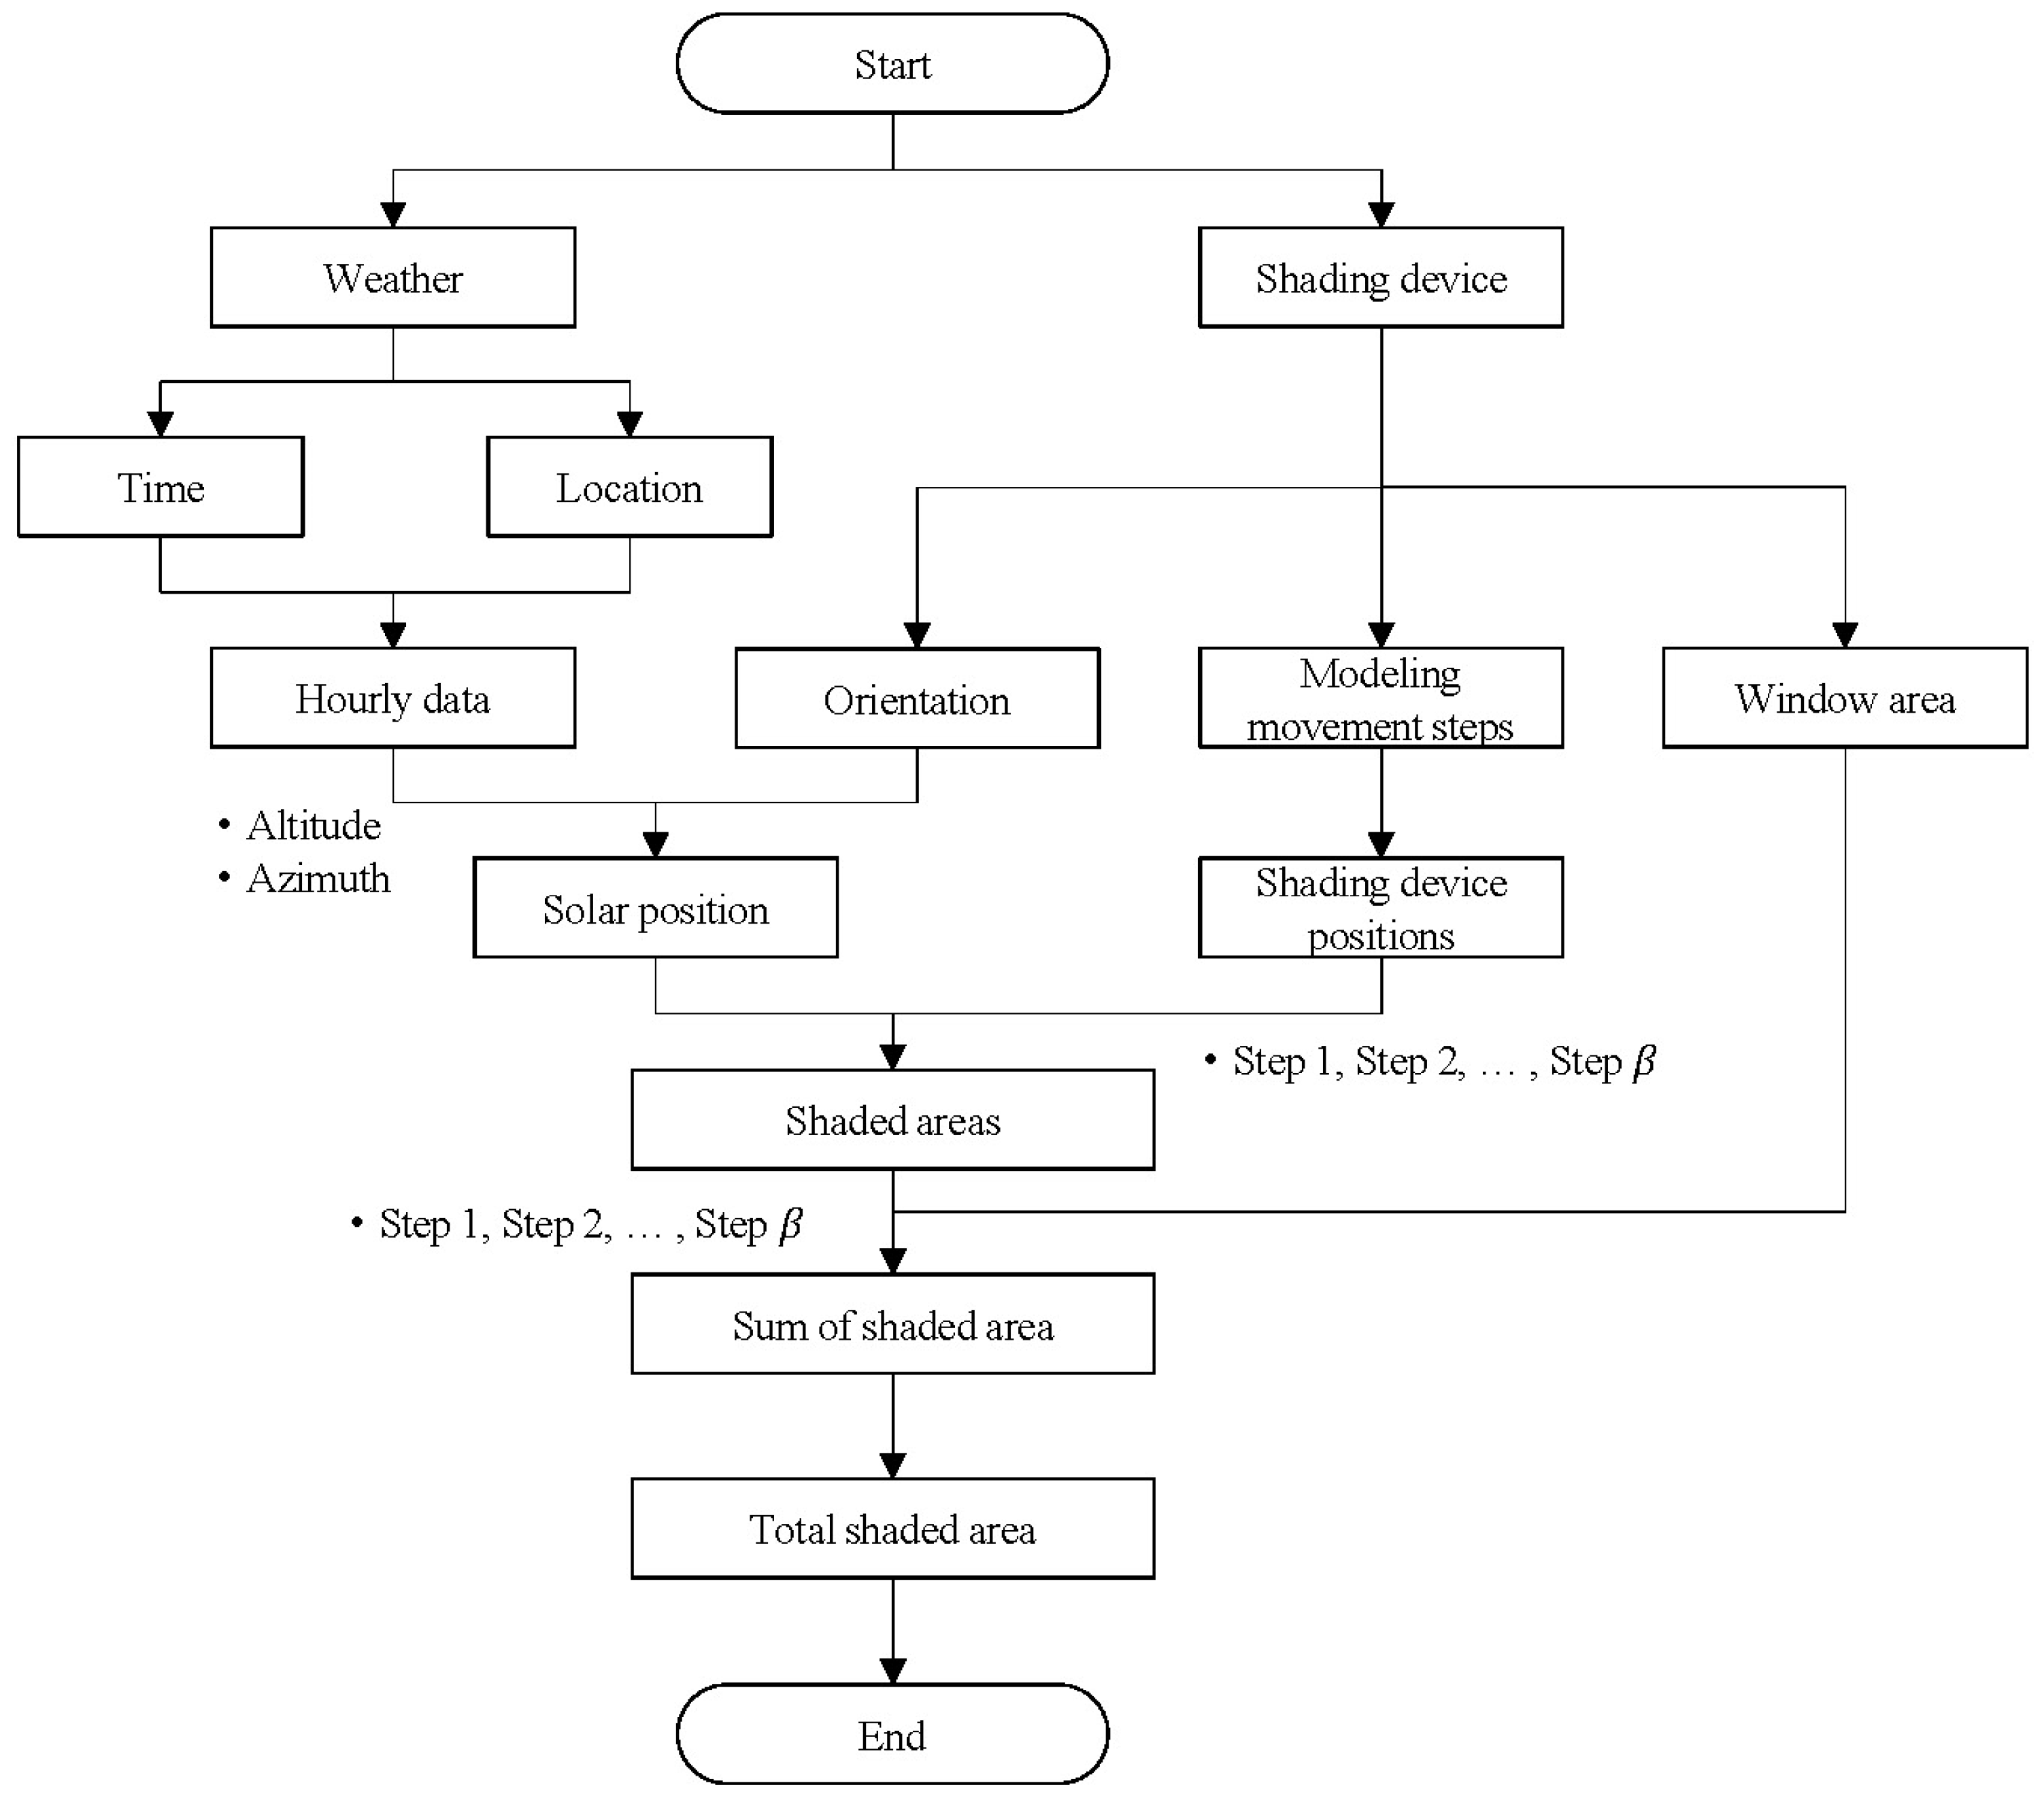
A calculation tool is implemented for calculating the shaded area provided by a kinetic façade. The calculation tool is composed using Visual Studio, and the changes in time and operation are reflected based on the planar-polygon method. Whenever a change in time or movement occurs, the shaded area corresponding to each change is calculated through repeated process calculations. In addition, to compare the performances of the shading device for different orientations, the orientation of the building envelope is considered.
Figure 3 shows the algorithm used by the shaded area calculation tool. The position of the sun is calculated using the azimuth and altitude for the particular region and time. The shaded area is calculated using the information on the positions of the sun, the shading device, and the lit plane.
The shaded area corresponding to a one-year period (i.e., 8760 h) is calculated based on the information of the sun, the shading device, and the lit plane inputted into the calculation tool. Using the shaded area calculation tool, the shaded areas according to changes in time and movement step of the shading device are calculated.
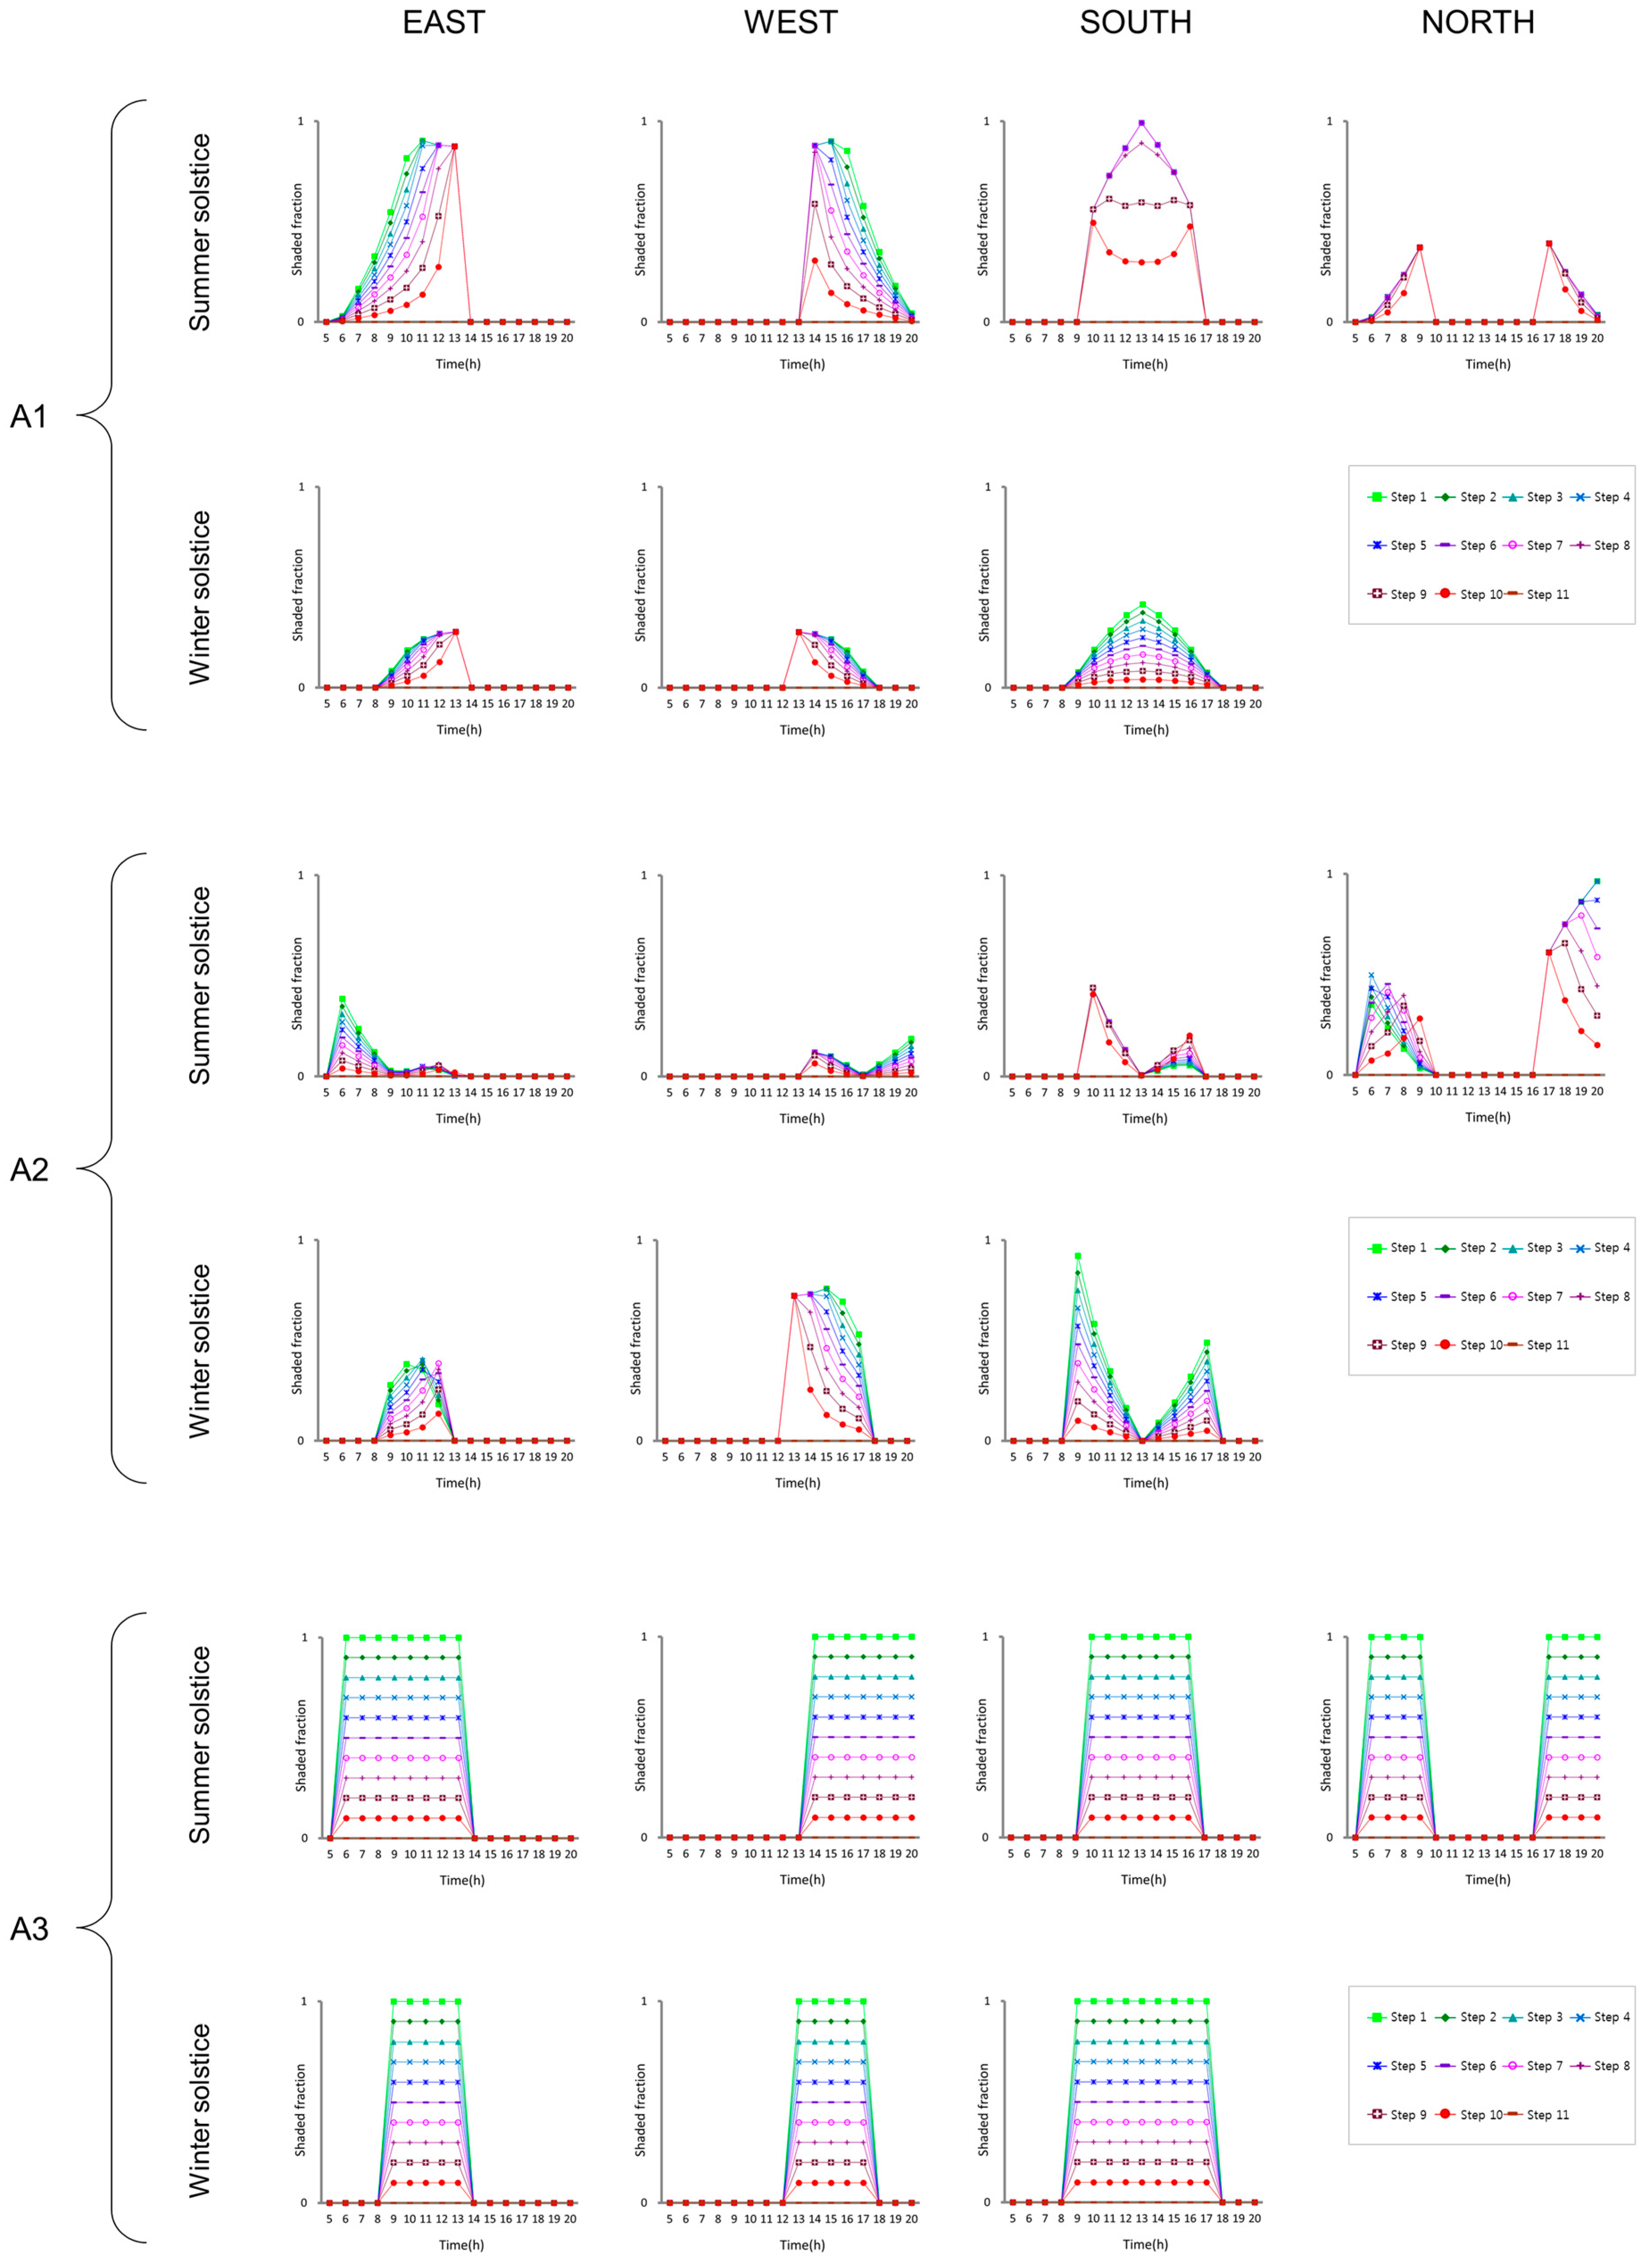
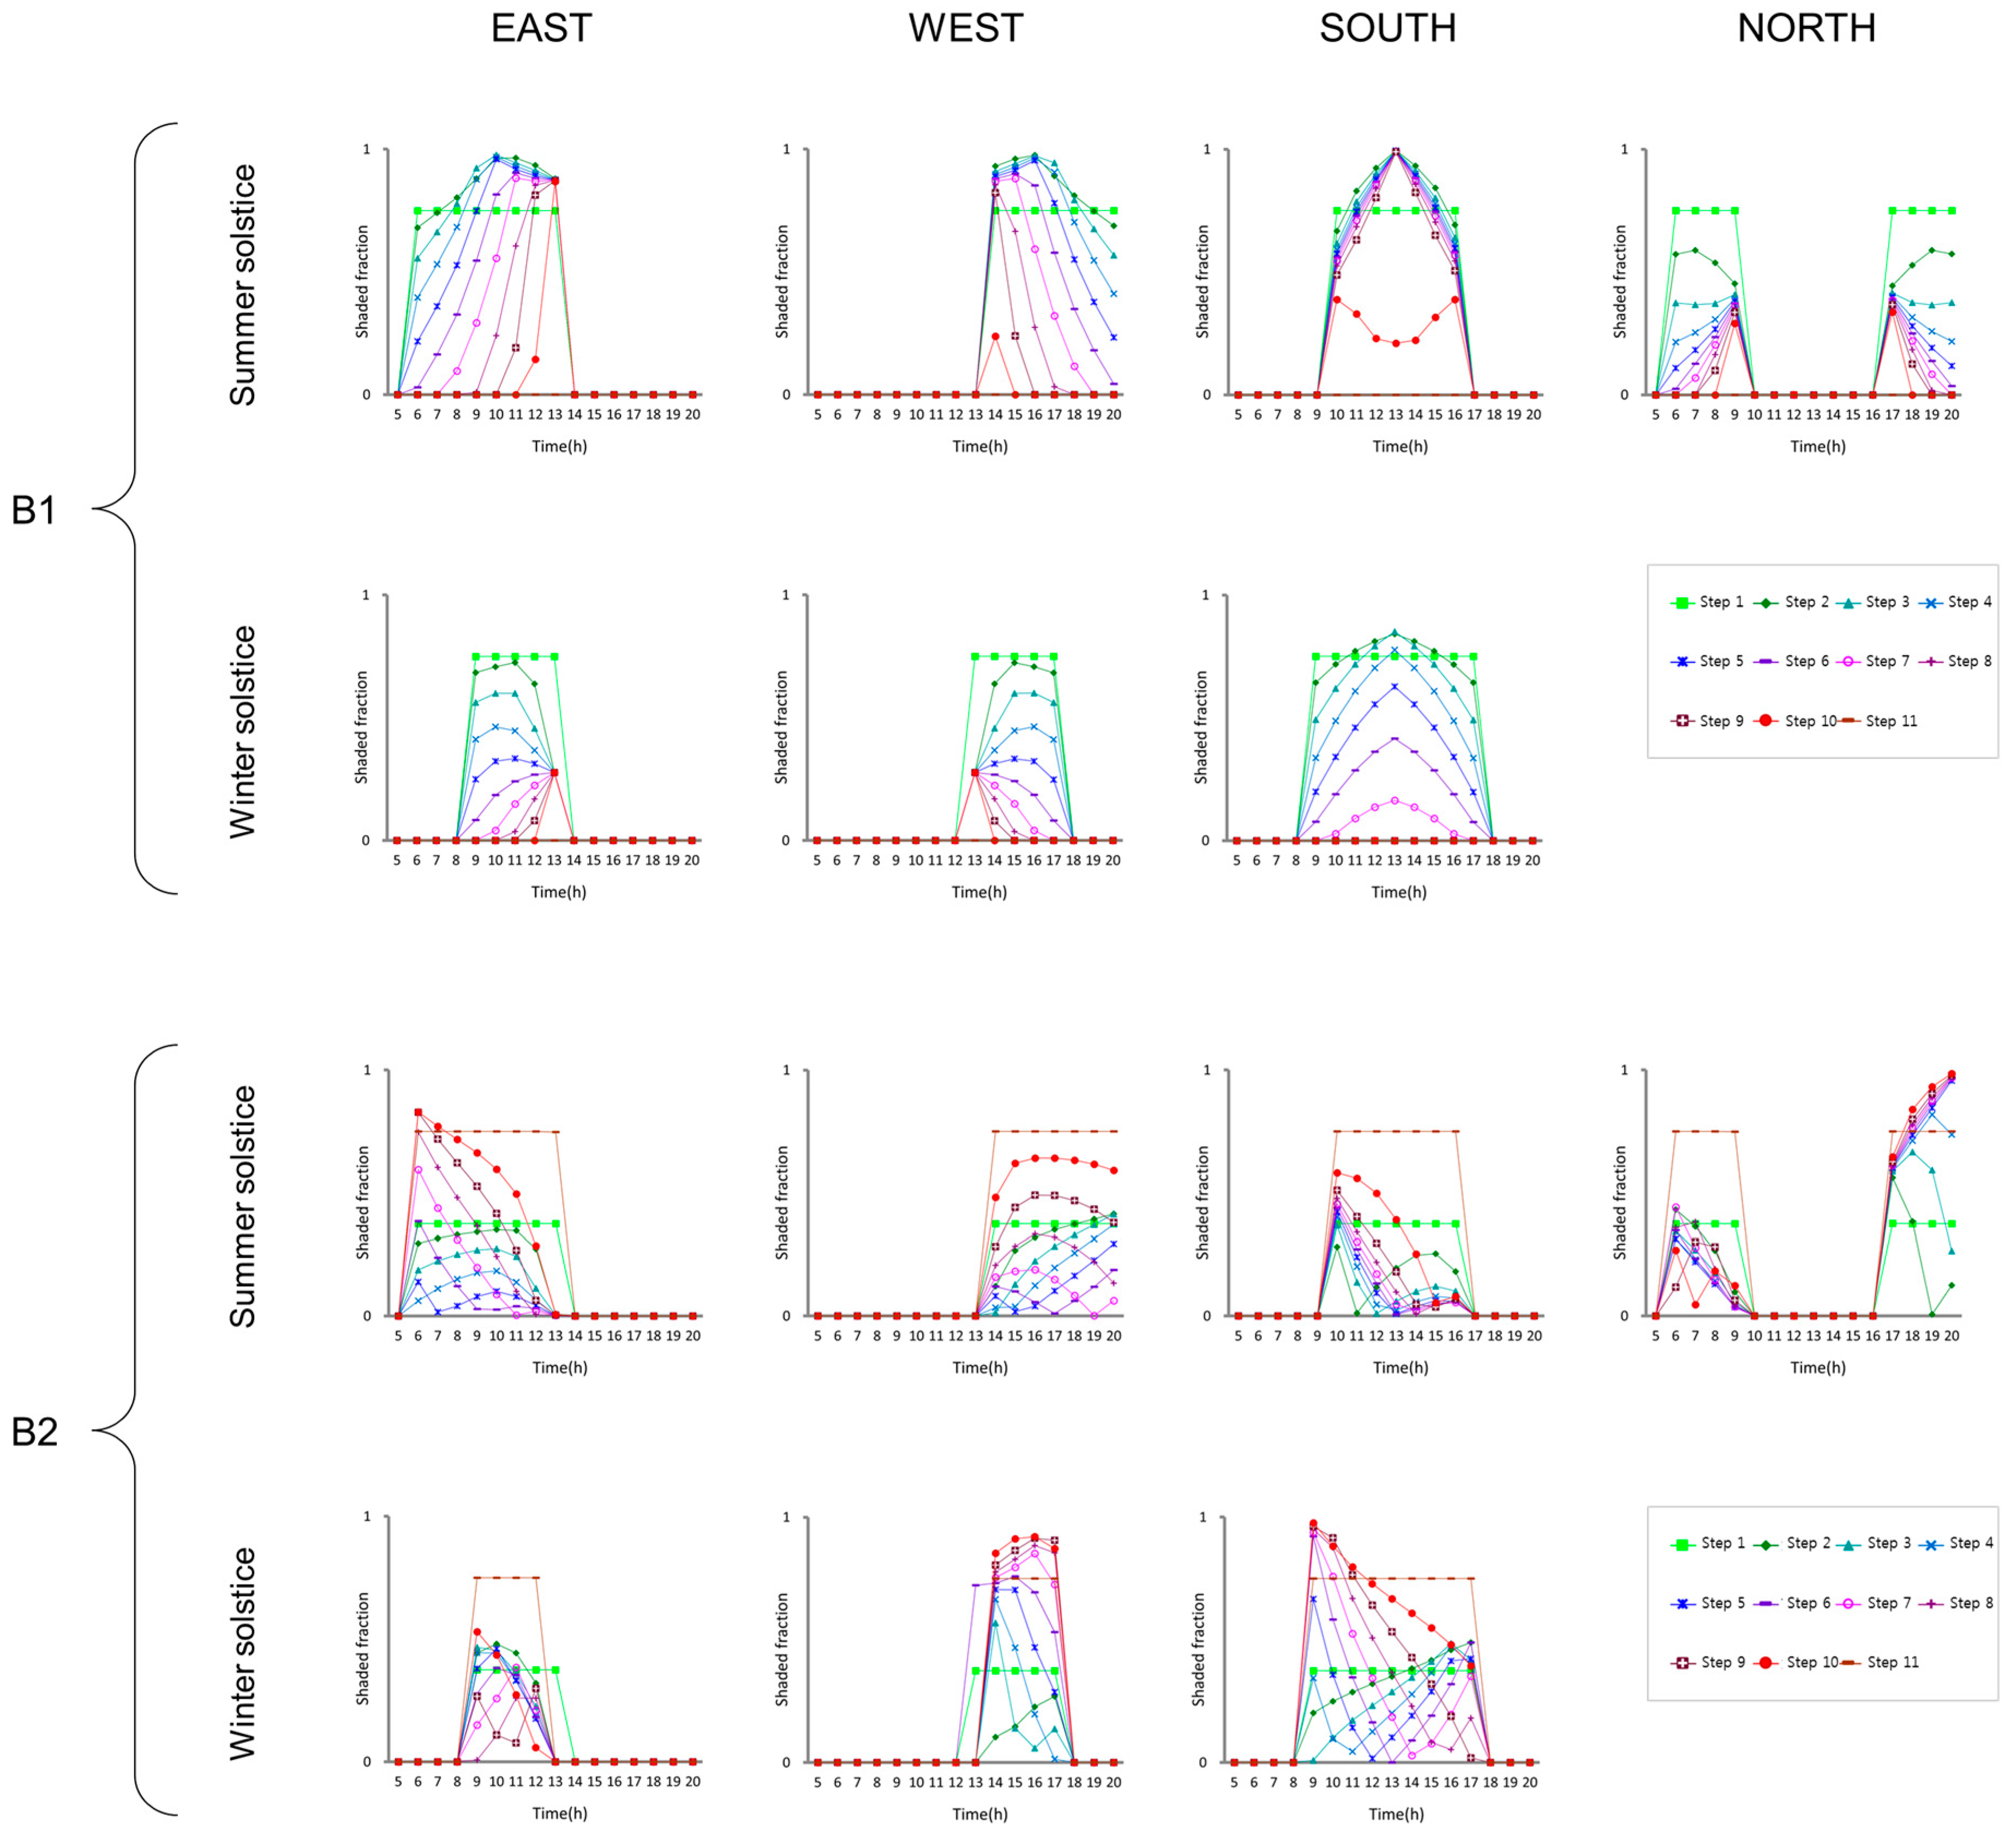
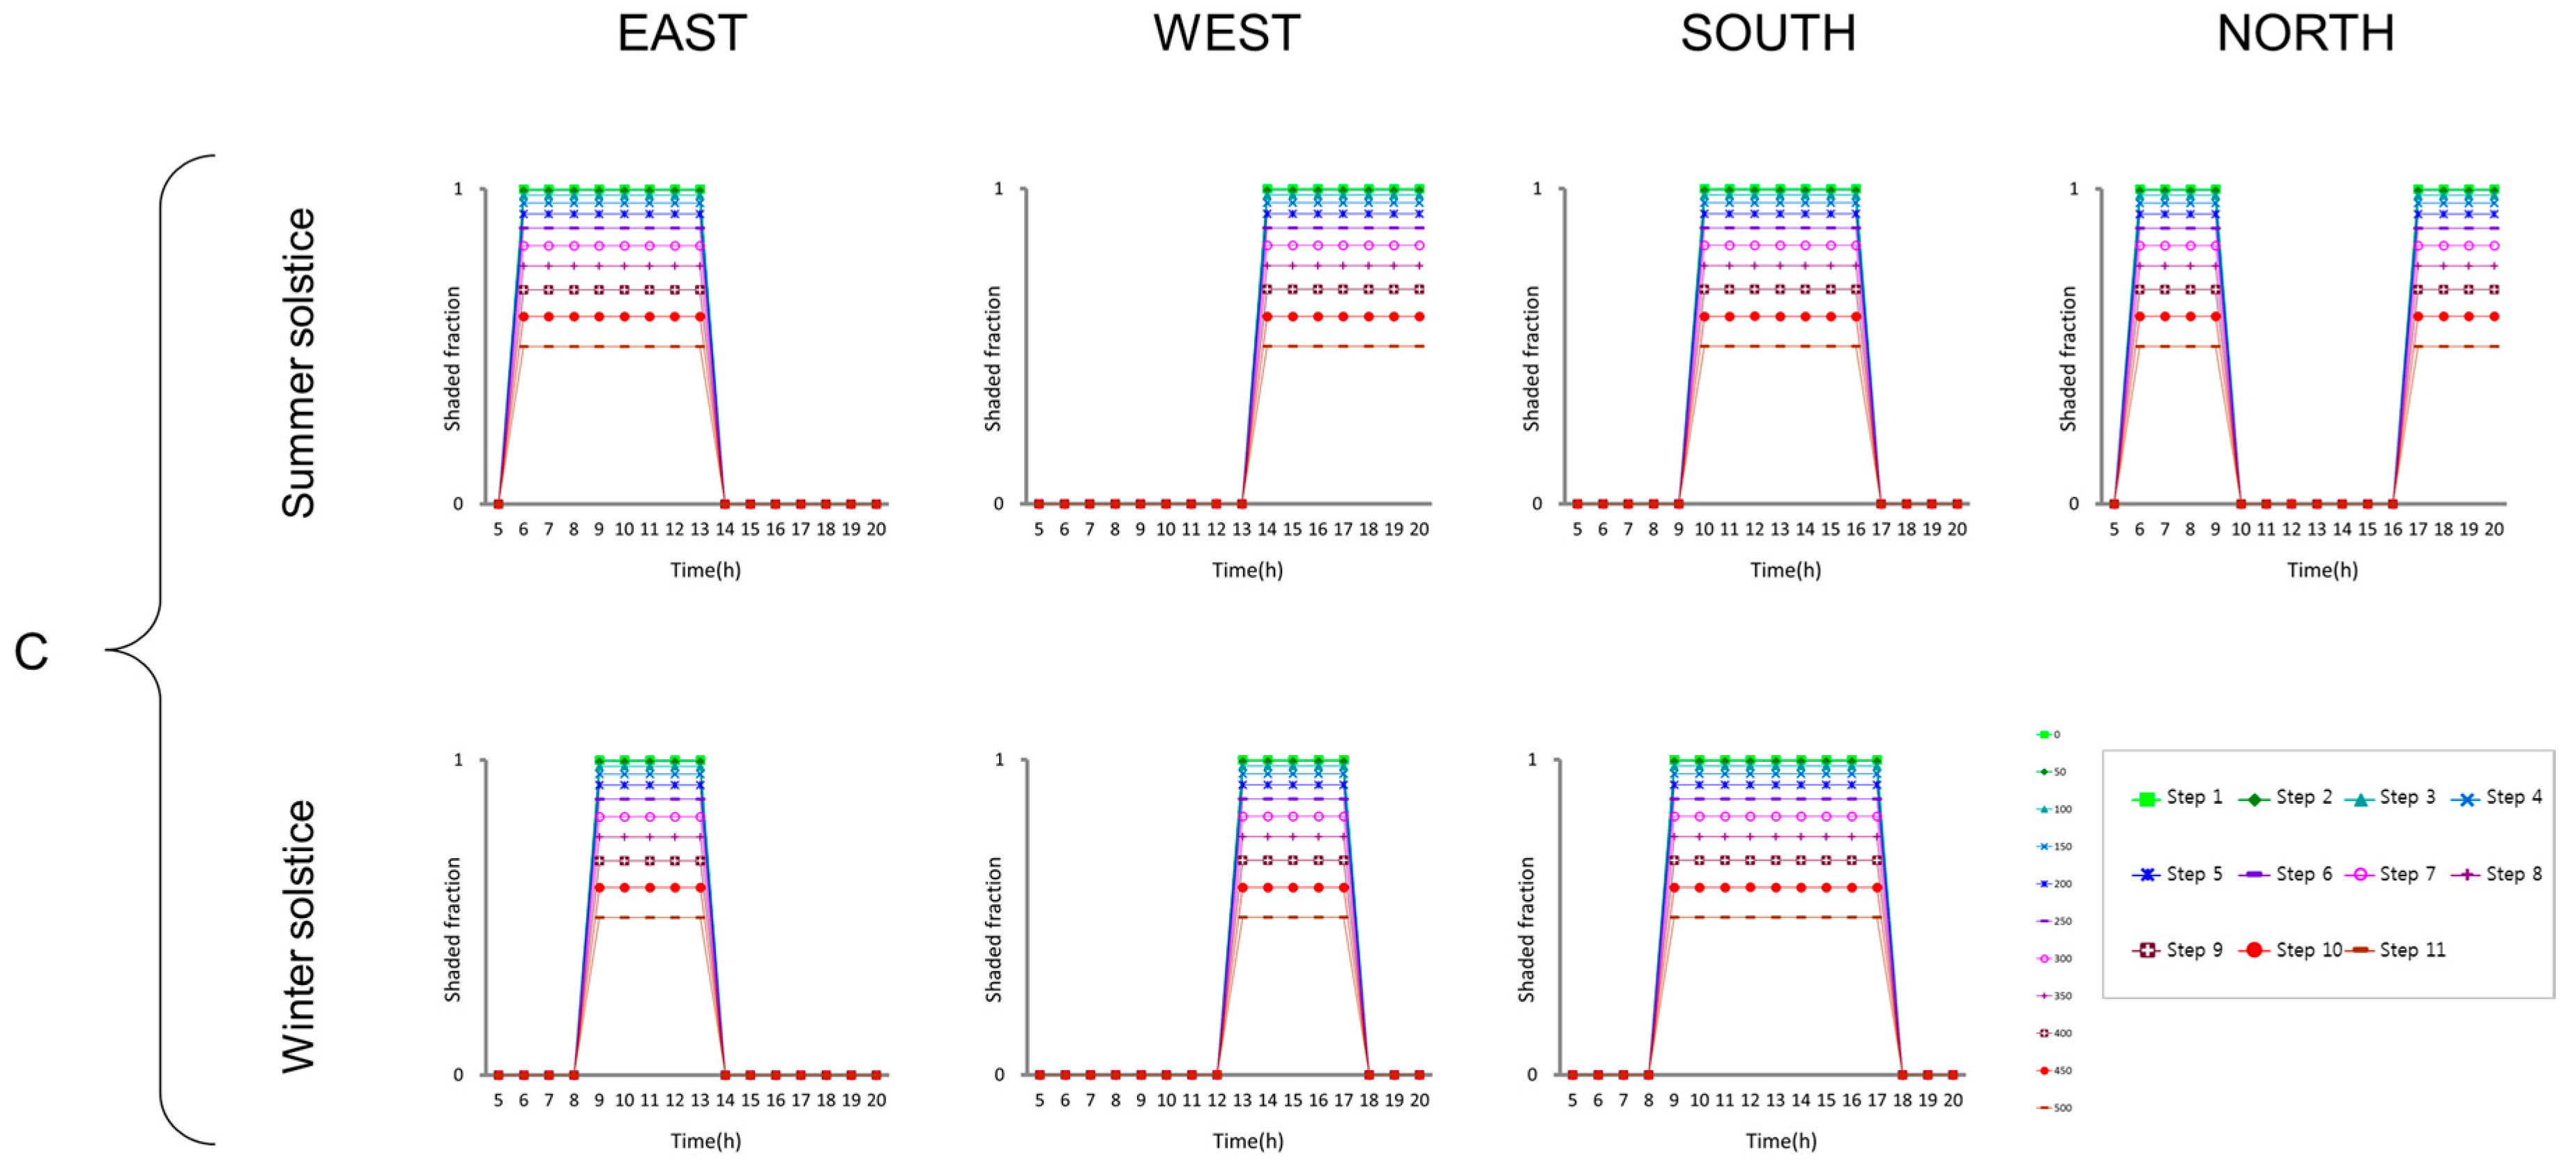
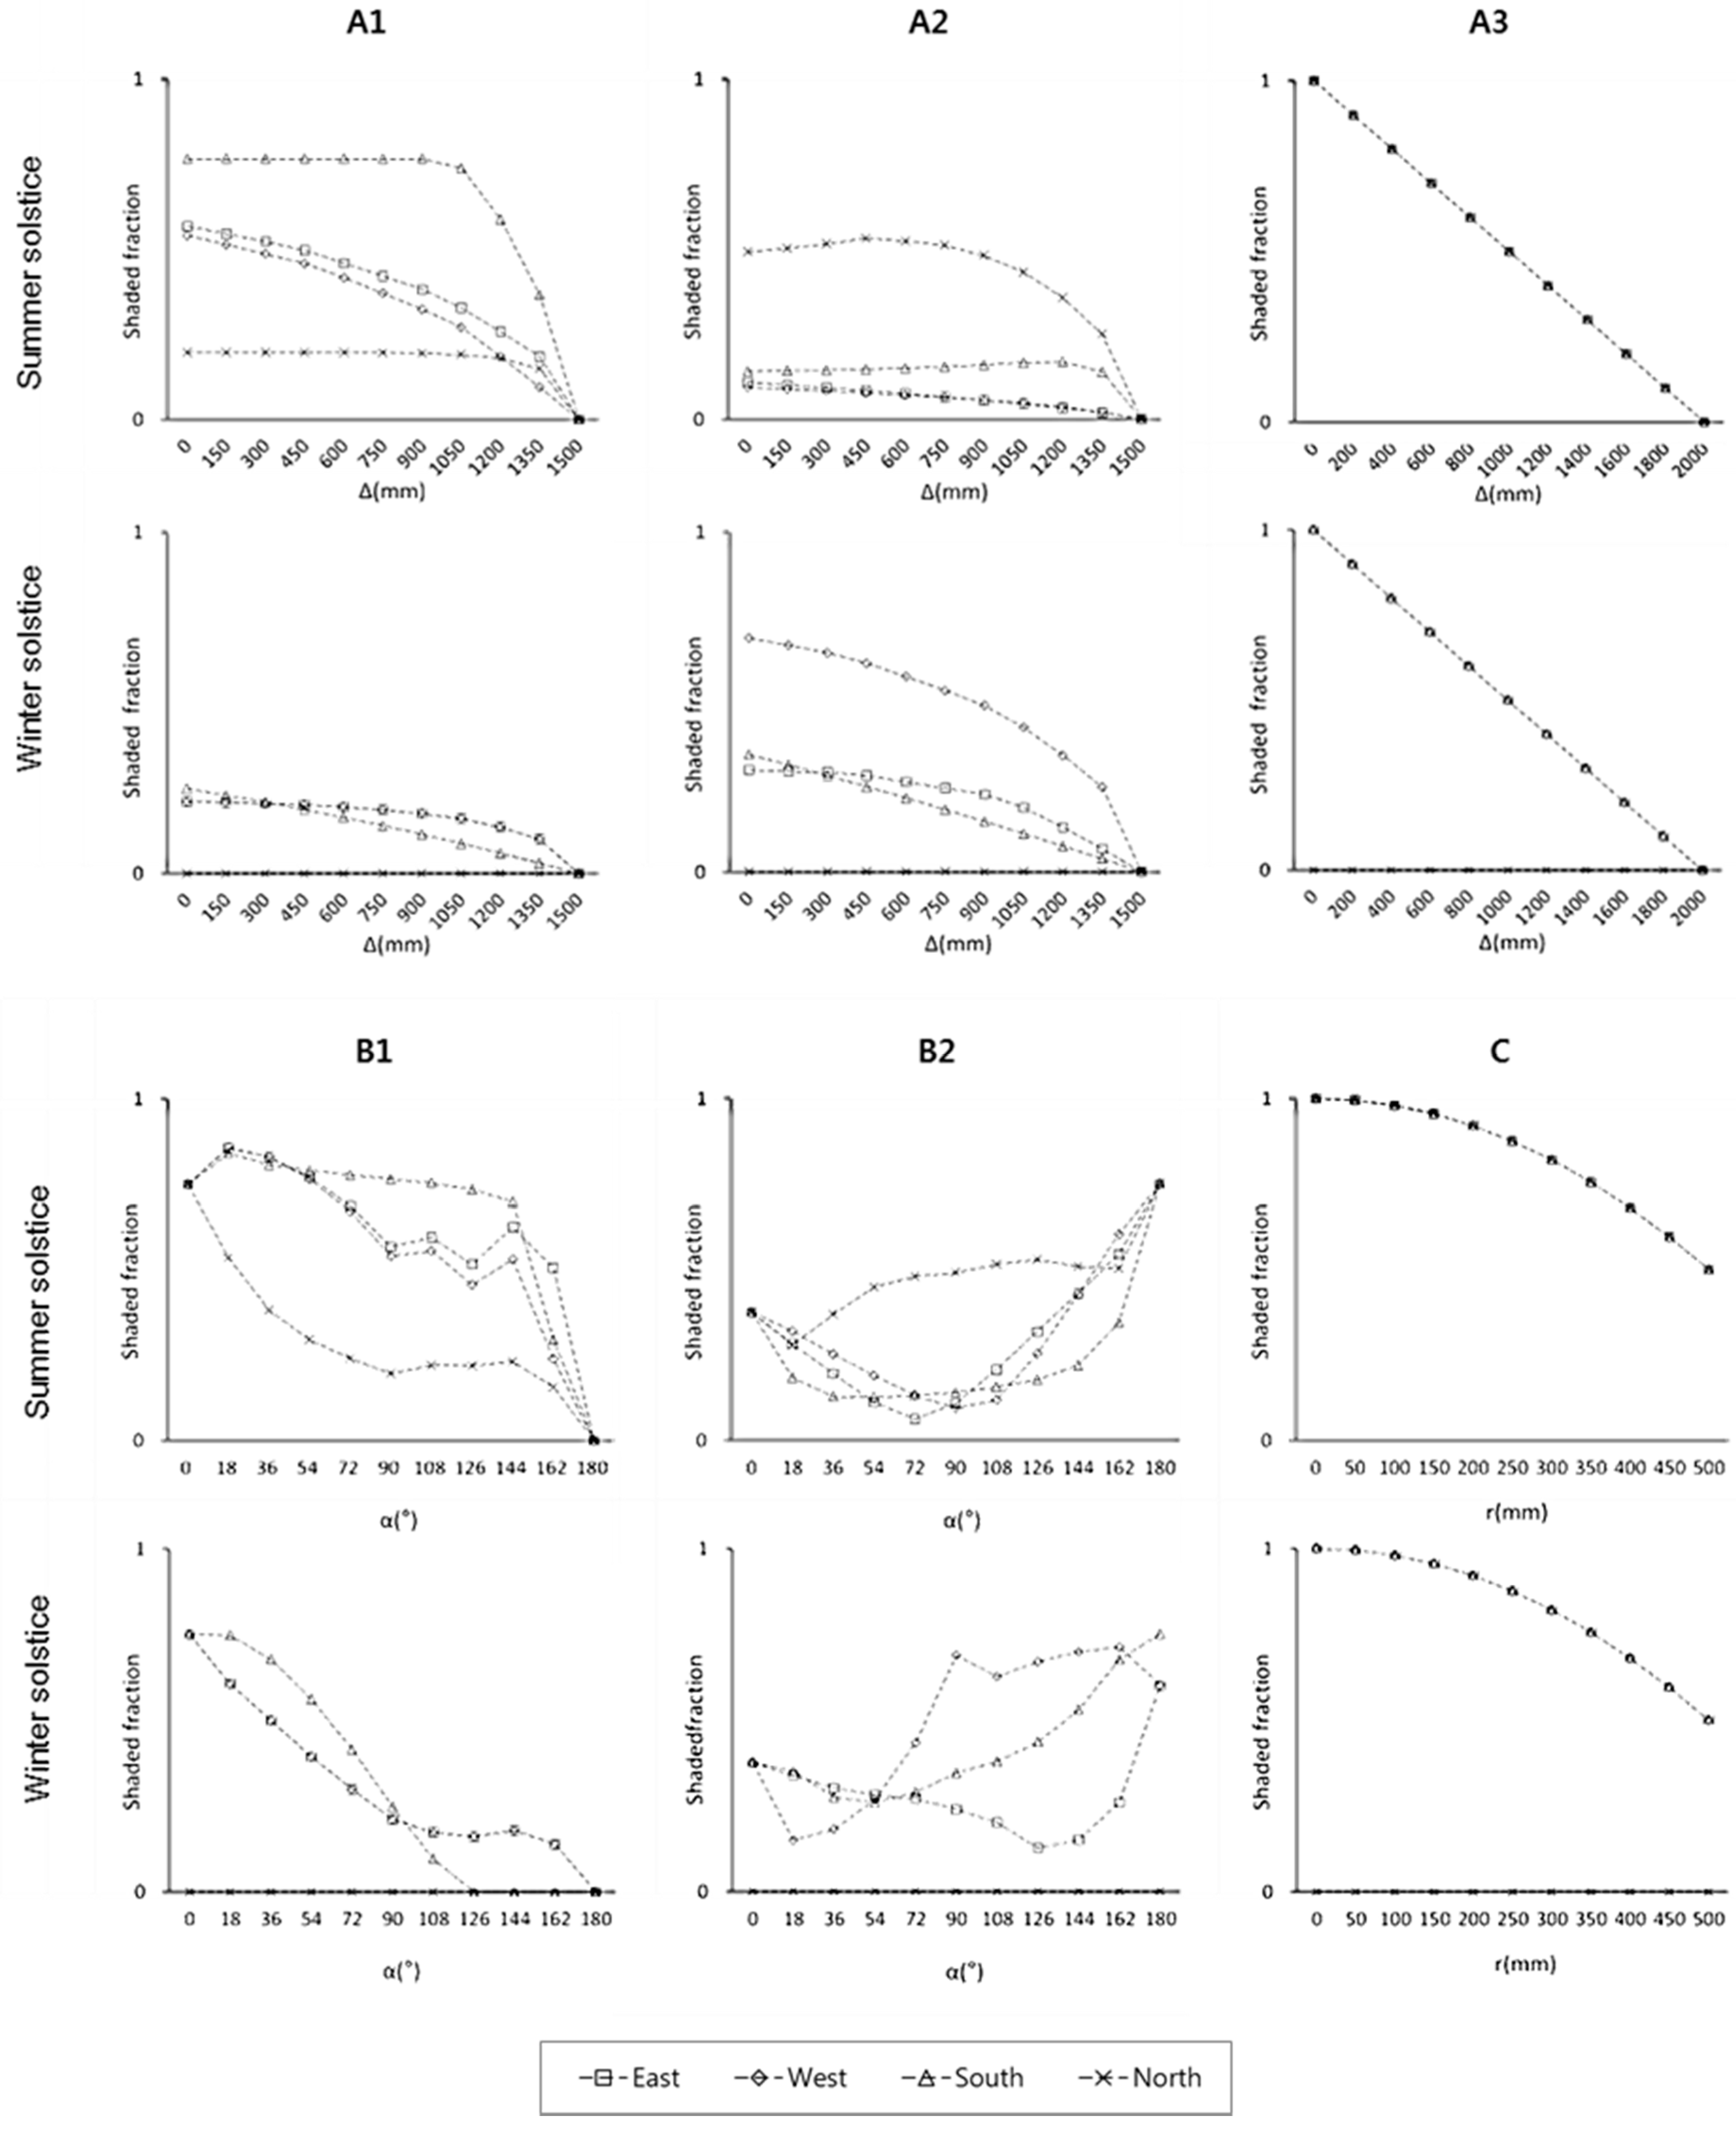
4. Average Shaded Fraction Characteristics According to the Movement Direction of the Movable Shading Devices
Figure 8 shows the daily average values of
according to the movement direction of the movable shading devices described in
Section 3. The four lines in the graphs represent the orientation. The
x-axis represents the movement step, and the
y-axis represents the shaded fraction. The summer and winter solstices showed similar
changes for each case. In particular, the A3 and C types, both of which are planar types, showed the same
values for the summer and winter solstices. In addition, the
values of the northward orientation for the winter solstice were all zero. Comparing the trends of the
values for the various shading device types, the summer solstice showed similar
values for the eastward and westward orientations, whereas the southward and northward orientations showed significantly different
values between the different types, with the exception of the planar types.
Regarding the values for the summer solstice, the A1 and B1 horizontal-type shading devices showed high values of approximately 0.8–0.9 for the southward orientation. The A2 and B2 vertical-type devices showed values of about 0.5 for the northward orientation, which was higher than any other orientation. The A3 and C planar-type devices did not show any differences between the orientations. For the winter solstice, the A1 and B1 horizontal-type devices showed similar values for the eastward, westward, and southward orientations. The A2 and B2 vertical-type devices, however, showed significantly different values for the eastward and westward orientations. The planar-type devices did not show any differences according to orientation, similar to the cases for the summer solstice.
Upon comparing the operations of the various types of shading devices, it is found that the values follow similar trends according to the operation type. The longitudinal-direction shading devices show trends of a slow decrease followed by a steep decrease. On the contrary, the plots for the rotation-change-type devices show trends of a steep decrease followed by a slow decrease. For the B2 type, which use vertical shading elements in a rotated operation, U-shaped plots appear owing to the shading elements being installed on the left and right sides. The opening/closing direction shading devices show slowly decreasing tendencies. Because the opening/closing direction shading devices are capable of providing completely shaded areas, the minimum value may vary accordingly. Except for the B2 type, smaller rotation angles, lengths, and openings led to higher values. In the case of the B2 type, the lowest value was observed with the 90° operation during the summer solstice, and the eastward and westward orientations showed largely symmetrical tendencies for the winter solstice.
The calculation results of the shaded fraction showed that the shaded fraction may vary depending on the type of shading device, the orientation of the building on which the shading device is installed, and time. Changes in the shaded area on a window affect the thermal and visual environments of the occupant in terms of the cooling/heating load, glare, daylight performance, and view. Therefore, the shaded fraction () for a shading device design proposal must be reviewed during the initial design stages of the building itself.
5. Deriving Estimation Equations for the Kinetic Facade
As described in
Section 2.3, the shaded fraction (
) can be accurately calculated using the positional relationships of the sun, shading device, and window. However, this method is only possible using complex computational algorithms that utilize a three-dimensional model of the shading device as the main input data.
In this section,
value estimation equations are derived for shading devices of representative operating types. The equations are derived by obtaining an average of the daily
values for each movement step of the shading devices through an accurate calculation method, and formulating equations for
using movement step as a variable. Various types of shading devices can be applied to a kinetic façade. In this study, however, two representative shading device movement directions were selected, and estimation equations were derived for the southward facing envelope of a building located in Seoul, Korea, during the summer solstice (see
Table 5).
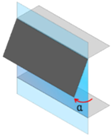
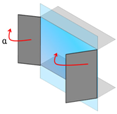
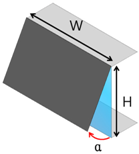
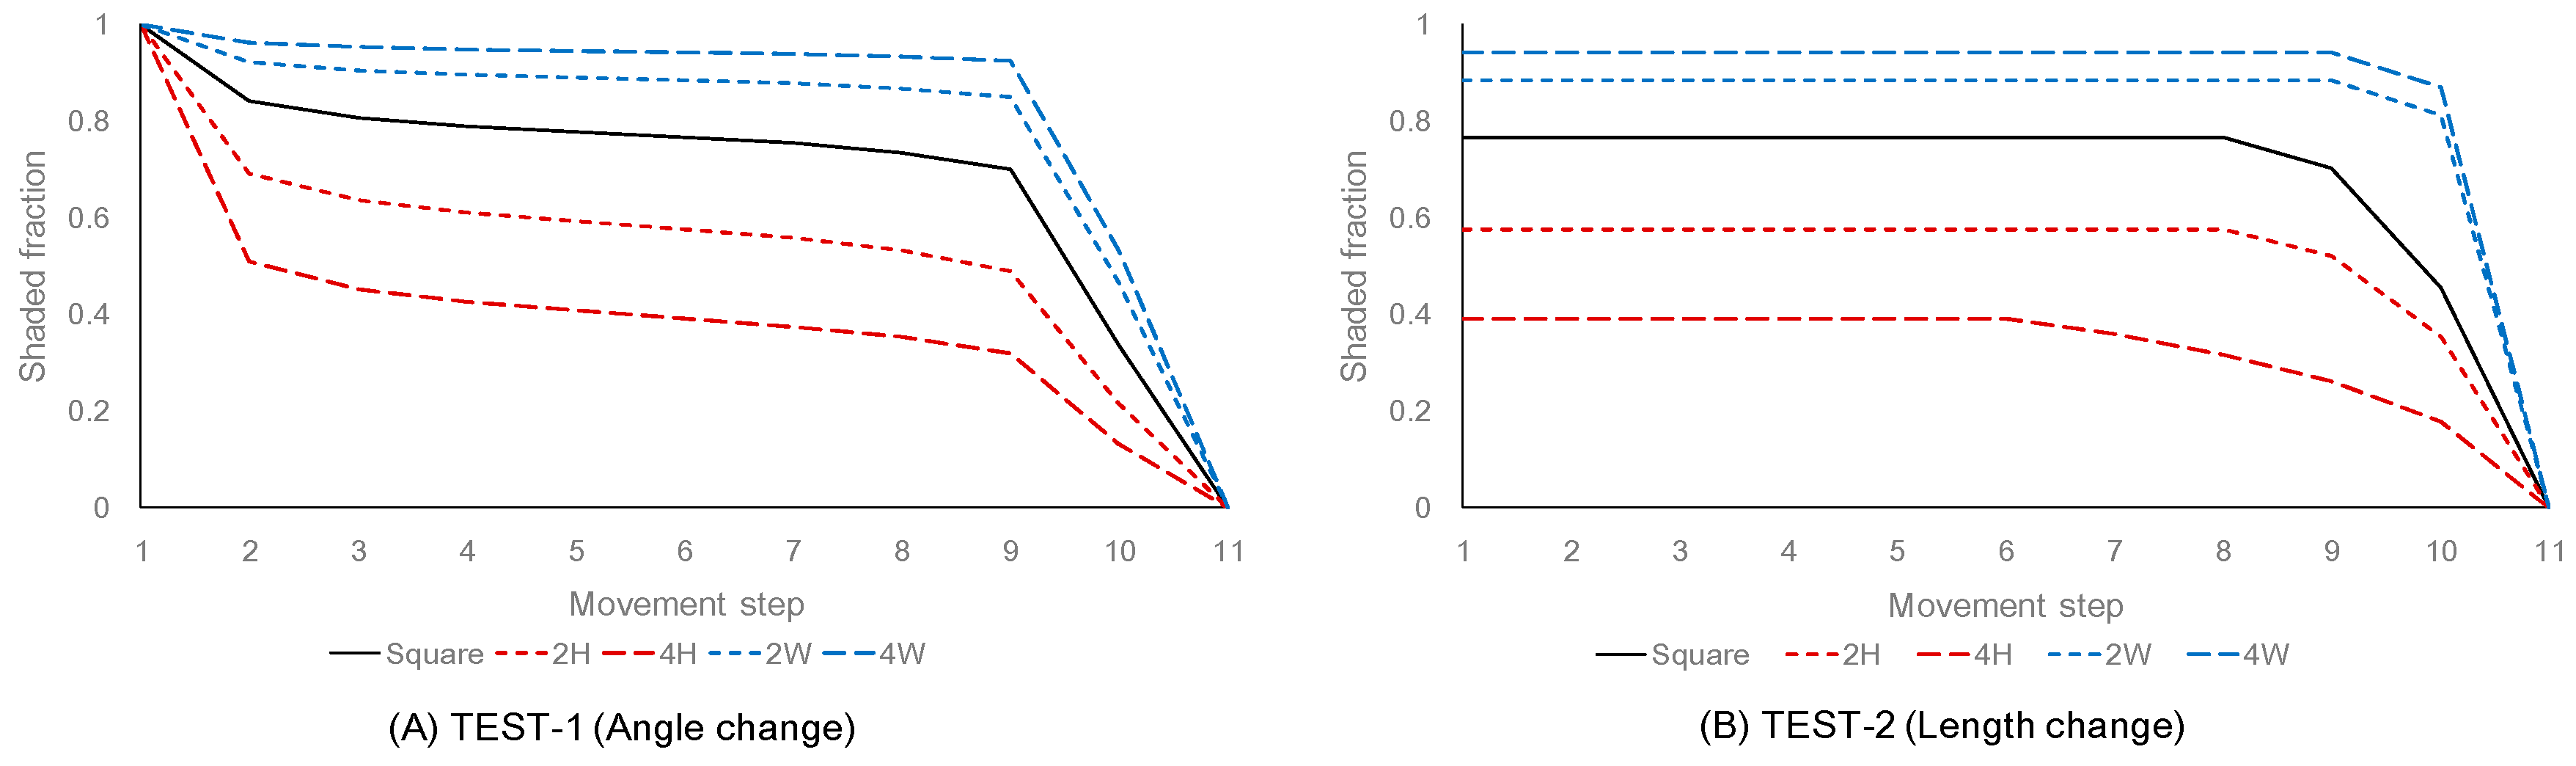
Horizontal-type shading devices were selected for testing, and their sizes were made identical to that of the window. Two movement directions were selected; TEST-1 for the angle change type and TEST-2 for the length change type. Even with shading devices that use the same operation type (movement direction) the shaded fractions can be different according to the width-to-height ratio of the window. Therefore, for each test set, five cases of varying width (W) and height (H) were tested, including the basic window size of 1000 × 1000.
Figure 9 shows the
calculation results for TEST-1 and TEST-2. The test results show that even shading devices of the same type may produce different
values for each movement step depending on how the shading devices are operated. However, it is observed that the
values in each test set follow similar trends. In both test sets, the
values are higher if the window height is greater and lower if the window width is greater. It is noted that the sizes of the window and shading element are set to the same in each test case.
The
graph for the angle change entails a logistic function (e.g.,
), and the
graph for the length change entails a log function (e.g.,
). To derive the
value estimation equations for the two types of shading devices, a logistic function and a log function were derived based on
values for a basic case (see Equations (7) and (8)). The coefficients of determination (R
2) of the estimation equations were 0.90 for angle change (i.e., TEST-1) and 0.94 for length change (i.e., TEST-2), indicating that the
values estimated by the estimation equations are highly persuasive. The average
values at each movement step (
) can be estimated using the derived equations.
where
and
are the daily average shaded fraction.
is the movement step of the shading device expressed as an integer. The relation of the
value to the width-to-height ratio of the window has a comparatively similar trend to the
value of the basic case. Therefore, the
value within a certain error range can be roughly estimated by multiplying the
value for the basic window size by a certain proportion (i.e., 0.75 for 2H, 0.5 for 4H, 1.20 for 2W, and 1.29 for 4W). The design data (
) obtained through the above calculation process allow the designer to roughly review the environmental performance of various shading devices during the early design stages.
6. Discussion and Suggestion
A kinetic façade requires a high level of technology and a significant amount of time during its design process, which may require considerations on the design of the external movable shading device, operating type of the shading devices, real-time control of the shading elements, review of the shading device construction, structural stability of the shading device, and energy performance. The external movable shading device is are installed on the outermost side of the building and is thus directly exposed to exterior conditions. Therefore, during the selection of the design alternatives for a kinetic façade, both the shading performance of the shading device and the aesthetics of the design are of great importance.
To reduce the costs and time required during the design stage of a kinetic façade, the environmental and energy performances of various designs for the external movable shading devices must be reviewed from the initial design stages. In particular, the changes in shaded area provided by the shading device affect the thermal and visual environments of the occupant in terms of cooling/heating load, glare, daylight performance, and view. When an accurate energy performance evaluation is required for the selected shading device, the energy consumption and environmental performance can be evaluated based on an analysis of the detailed design using a dynamic simulation tool [
30]. However, applying accurate energy and environmental performance evaluations for the detailed designs of various alternative shading devices during the selection process in the early design stages can incur considerable consulting cost and time.
Existing literature [
31] has proposed a reduction factor of the shading system (
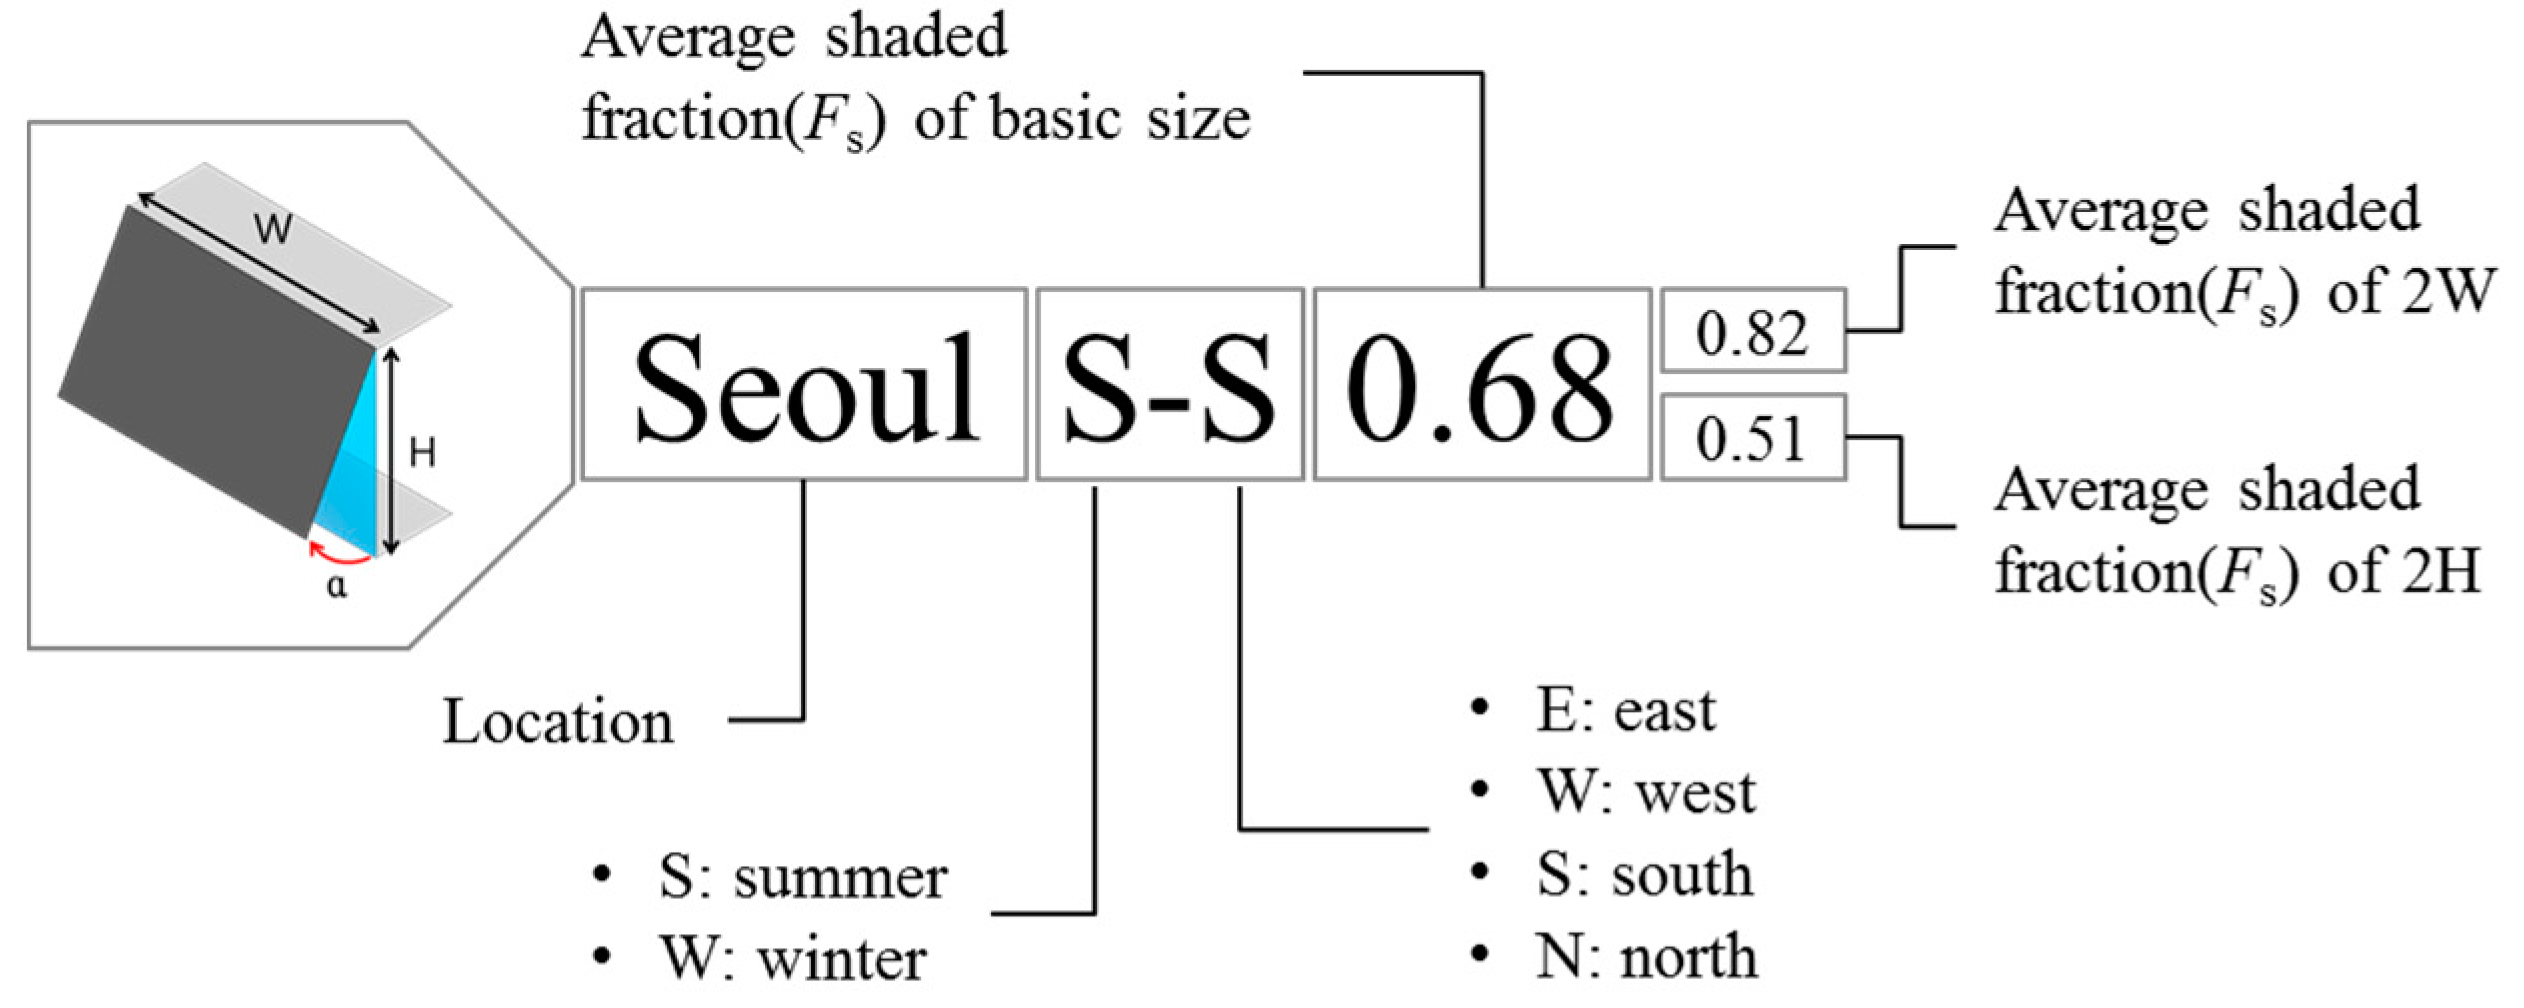
) for various types of shading devices (e.g., no shading = 1.0, internal venetian blind = 0.5, external awning blind = 0.4) as a means of reviewing the energy performance of the shading devices during the early design stages. This method can dramatically reduce the cost and time required for the building owner or designer to roughly review the energy and environmental performance of various shading devices during the early design stages. If the average shaded fraction (
) estimation equations derived for external movable shading devices of representative movement directions based on the results of this study were to be used to provide
information for each type of shading device, for example in the form of index labels (see
Figure 10), they may serve as useful design guides for the designer in reviewing the energy and environmental performance of the shading device according to design and movement direction during the early design stages.
7. Conclusions
In this study, a polygon method was used to calculate the shaded area drawn by the complex shape and movement of a kinetic façade. To simulate the movement of the shading device, the movement of the movable shading device was divided into
movement steps with the same operational intervals. The kinetic façade was classified into six types according to the shape (i.e., horizontal, vertical, and plane) and movement direction (i.e., length, rotation, and aperture) of the shading elements. The shaded fractions were calculated for the six classified types. The graphs of daily average shaded fractions showed differences according to the shapes, but it is found that the
values follow similar trends according to the movement direction. In
Section 5, estimation equations for obtaining
values that uses the movement step (
) as a variable were derived to simplify the complex calculation process. The derived equations can estimate the shaded fraction relatively accurately under limited conditions (i.e., in terms of location and orientation).
The shaded fraction varies according to the type of shading device used, the orientation of the facade, and time. Therefore, to accurately evaluate the energy and environmental performance of a kinetic façade, the shaded fraction must be calculated using the detailed model information of the shading device and a complex calculation algorithm. However, during the early design stages, a simpler method of identifying the characteristics of the shading device is required, as described in
Section 5 and
Section 6.
In this study, a method of calculating the shaded fraction was derived. In whole-building simulation, the shaded fraction calculation tool allows architects (or engineers) to calculate the shaded area generated on the window at a specific time and the movement step for the shade elements of the kinetic facade. The derived calculation process can be performed prior to a whole-building simulation of a building utilizing a kinetic facade by applying hourly shaded areas to the simulation, including processes for calculating the direct solar heat gain or other environmental performance indicators such as glare and indoor illuminance. In addition, the shade control strategy can include improving thermal (i.e., solar heat gain) and lighting environment performance (i.e., daylight, glare, indoor illuminance, etc.) [
32,
33]. The frequency of activation may be considered as well. To evaluate these performances and determine the shade control strategy, an accurate calculation of the shaded area must first be achieved.
Furthermore, equations for estimating the shaded fraction were derived. Possible future research may involve developing estimation equations based the results of this study for various regions, orientations, and shading device types, to serve as a useful design guide that enables designers to quickly review the performance of an external movable shading device.


