1. Introduction
Introducing criteria of rationality and economic efficiency in public educational institution management has become a priority with the aim of improving processes by identifying the variables with greatest impact. Indeed, many governments and organizations involved in higher education are implementing strategies to improve the efficiency of universities and ensure that they are properly run [
1,
2,
3,
4]. The allocation of public resources and their efficient use are two closely related factors compelling researchers in the field of education economics to focus on the efficiency evaluation of educational institutions at all levels and, in this study, at the university level. As stated by Barra and Zotti [
5], universities are financed according to their virtuosity level in order to achieve higher research performances and to promote academic excellence. We have only considered public Higher Education Institutions, but not private ones because the financial resources are not comparable.
The Colombian education system has for some time been called into question by educational monitoring agencies and institutions for its low performance concerning skills acquired by students in state-conducted quality tests. The results of the higher education institution (HEIs) are a possible indicator of inefficiency and educational failure, exposing the fact that the universities’ strategic mission of education, research and extension is not altogether being fulfilled. The OECD has recently claimed that, in Columbia, “public resources are not allocated in a way that promotes efficiency, equity, or the established goals” of the higher education sector [
6]. The Columbian government has created a national system of tertiary education (SNET) and a national quality system (SISNACET)—among other reforms—that presumably aim to secure improvements.
Although our work supports this hypothesis in part, we must point out that the analysis of efficiency that we have carried out has been limited to Colombian public universities, thus excluding private universities (whose financing is completely different) and in general to universities of other countries. Therefore, it is an analysis of relative efficiency, but not an analysis of efficiency in an absolute sense, since universities from other countries are not integrated.
It is noteworthy that HEIs differ significantly in terms of resources available to carry out their mission and strategic objectives, and that this affects the results they attain, and consequently their efficiency. It is possible to find HEIs with fewer, well allocated, resources performing better than institutions with more resources. We must therefore seek to uncover which variables affect efficiency in institutions, or make some more efficient than others, and which variables should be acted upon to improve performance.
An efficiency analysis of HEIs will allow decision-making units to define policies and guidelines that will improve quality, redirecting policies and decision making to improve efficiency according to research findings. It translates into actions based on proven empirical evidence, and not on the beliefs and perceptions of the faculty of the institutions or policy guidelines.
The purpose of this paper is to determine and compare the efficiency of Colombia’s public universities, using Data Envelopment Analysis (DEA) as an evaluation technique [
7,
8]. Data envelopment analysis is a non-parametric tool that produces an empirical efficient frontier given by the data provided to the model. It enables us to obtain a single efficiency index per evaluated unit and generates a reference set of efficient units, with which to establish a benchmark for improving efficiency (projection onto the efficient frontier). Moreover, it can handle multiple inputs (resources) and outputs (products), making it applicable to the educational process. The fact that it generates a single efficiency indicator facilitates analysis.
Our analysis of the efficiency of Colombian public universities within the State university system in 2012 places specific emphasis on the breakdown of overall inefficiency into technical inefficiency, administrative inefficiency, scale inefficiency and mix inefficiency in each HEI. Calculating efficiency rates and identifying the best-performing institutions characterize performance evaluation. The aim is to obtain an empirical production frontier compiling the best practices of the institutions studied, which will serve as a benchmark for inefficient institutions. Subsequently a cross-efficiency model is used to produce an efficiency ranking of the HEIs. Finally, productivity changes for the period 2011–2012 are determined using the Malmquist Productivity Index (MPI). The proper choice of input and output variables is a key aspect, as these have a direct impact on efficiency measurement. This aspect has been accomplished by different papers [
9,
10,
11,
12,
13,
14,
15].
An output orientation is chosen here, since to improve performance of an inefficient university it is more logical to increase the products (outputs) than reduce existing resources.
This study should bring about an increase in quality levels through increasing levels of efficiency, by establishing improvement policies for each of the variables selected for study, insofar as existing sources of inefficiency are detected in each HEI studied. Such evaluation processes could be helpful for university managers to shed some light on the effectiveness of various entities within the university as well as to better allocate both human and financial resources [
5]. Simultaneously, a study of this kind could encourage healthy competition between HEIs, which would result in increased efficiency and improved graduate student levels. In this context, data such as the efficiency rating, the extent of deficiencies in the university system variables themselves, the ranking of higher education institutions and productivity change over time, is vitally important, especially given current trends in accrediting institutions and academic programs. All the findings from this paper can be used in public resource allocation for Colombian higher education.
In summary, the aim of this paper is: (1) to determine technical, pure technical, scale and mix efficiencies of Higher Education Institutions in Colombia by using data acquired from the Ministry of National Education of Colombia, (2) to measure the different inefficient sources for each university considered in our study, (3) to rank Colombian universities by using a Pareto efficient cross-efficiency model from Wu et al. [
16], and (4) to analyze the change in productivity from 2011 to 2012 through the Malmquist index.
The rest of the paper is structured as follows.
Section 2 gives the theoretical background of our research.
Section 3 introduces the methodological framework for the ranking of the universities, by considering a Pareto optimal cross-efficiency model. In
Section 4 we present the database used in our analysis.
Section 5 shows the main results and
Section 6 gives the conclusions of the paper.
2. Theoretical Backgrounds
DEA is one of the main techniques used in the public and private sector to evaluate performance across a set of homogeneous production units with multiple resources and products. It has a wide application and has been used to evaluate efficiency in many fields, such as financial sector [
17,
18,
19,
20], police force performance [
21], resource allocation [
22,
23], environmental efficiency [
24,
25], or electricity sector [
26,
27].
DEA has also been used to evaluate performance in basic education institutions [
28,
29,
30], universities [
9,
13,
14,
15], academic programs [
12,
31], research centers [
11] and teachers [
32,
33].
The methodology of Data Envelopment Analysis (DEA) was proposed by Charnes, Cooper and Rhodes, based on concepts introduced by Farrell in 1957 (Charnes et al. [
7]). This technique uses linear programming to compare production units that handle the same resource group and yield the same group of products, generating an efficient frontier and related efficiency indicators within the population of production units studied. In this way, Colombian state universities, the Decision-Making Units (DMUs), can be treated as multi-product firms that transform resources into products. DEA aims to find the DMUs that produce the highest output levels by using the lowest input levels. A DMU reaches 100% efficiency only if none of the inputs or outputs can be improved without worsening some of its other inputs or outputs.
In the CCR model there are
DMUs to be evaluated, and each DMU
(
) has
inputs (resources) and
outputs (products), which are denoted with the vectors
and
respectively. DEA aims to maximize the scalar measure of efficiency
of the
, the production unit being evaluated, which is defined as the ratio of the weighted sums of the products to the weighted sum of resources using the following fractional programming Model (1):
where
and
represent
-th input and
-th output weights for DMU
0.
where
and
represent the most favorable set of weights for
in maximizing the previous ratio, which is given by
. Despite the objective function in (2) is to minimize the weighted sum of inputs, this is equivalent to maximize the efficiency of expression (1). It is assumed that the data is non-negative and that each DMU has at least one positive input and output value. The previous model can be expressed in matrix notation as follows (3):
Banker et al. [
34] suggest a model to determine technical and scale efficiency. This BCC model adds a new variable
to allow variable returns to scale (4).
The Slacks Based Measure (SBM) model developed by Tone [
35] is a special type of additive model in which the scalar measure of efficiency considers directly the input excesses and the output shortfalls simultaneously in a way that jointly maximizes both. The model is invariant and monotone decreasing regarding to input excesses and output shortfalls. Likewise, the efficiency of a DMU assessed should be determined by consulting its reference set, that is not affected by statistics over the whole data set and returns efficiency scores between zero and one, as in the radial DEA model.
Scale Efficiency measures the impact of the operating scale on DMU productivity, and is defined as:
Given that, no matter the orientation, the technical efficiency of a DMU can never exceed its pure technical efficiency. Thus:
In this way, the overall efficiency or technical efficiency (CCR) can be decomposed as follows:
The CCR model calculates the technical efficiency (TE). It measures the success of a DMU in producing as large as possible the outputs from a given set of inputs [
36], and does not take into account possible inefficiencies attributed to output and input mix.
The BCC model calculates the pure technical efficiency (PTE). It measures the technical efficiency without considering inefficiencies due to the scale of operation of the productive unit. This is done by comparing a DMU with other units of similar scale. According to Kumar and Gulati [
37], PTE is used as an index to capture managerial performance.
This decomposition is unique and describes the source of inefficiency, i.e., whether this is caused by inefficient operation (administration) (BCC), or by unfavorable circumstances shown by scale efficiency (SE), or by both.
By definition, scale efficiency measures the gap between the efficiency score of a DMU under Constant Returns to Scale (CRS) and Variable Returns to Scale (VRS).
The relationship between the optimal solutions of the CCR and SBM models leads to the following definition of Mix Efficiency [
8,
38]. Let
and
be the efficiency scores of the CCR-O (output-oriented CCR) and SBM-O (output-oriented SBM) models of
, respectively. Mix efficiency is defined by:
In this way, we obtain a decomposition of non-radial efficiency (SBM-O) into radial efficiency (CCR-O) and mix efficiency (MIX):
Using the scale efficiency definition, we have:
The above decomposition is unique and contributes towards interpreting inefficiency sources for non-radial inefficient DMUs (SBM).
3. Cross-Efficiency Model and Ranking
An interesting aspect of efficiency evaluation is the ranking of the production unit set under analysis. Several models have been proposed, including super-efficiency models [
35,
39,
40], and cross-efficiency evaluation models [
16,
41,
42,
43,
44].
It is worth noting here that Banker and Chang [
45] recommend super-efficiency models for outlier identification, but not for ranking.
With the aim of improving the discriminating power of DEA, Sexton et al. [
42] incorporated the concept of cross-evaluation. In this method, each DMU obtains
efficiency scores, one being self-evaluation, calculated with its most favorable weights, and
represents the evaluations obtained from the most favorable weights of the other
DMUs. Then these
efficiencies are averaged to obtain the cross-efficiency score for the DMU under evaluation.
Thus, the cross-efficiency evaluation of DMU
with the most favorable weights of the DMU
is determined as follows:
The cross-efficiency score of the DMU
,
, is the average of
efficiency scores (13):
Unfortunately, the cross-efficiency scores generated with (13) may not be Pareto optimal, which has reduced the effectiveness of this method. To solve this problem, Wu et al. [
16] propose a cross-efficiency evaluation approach based on Pareto improvement.
In order to rank the universities of the Colombian public system we adapt the model from [
16] to consider the output orientation.
This algorithm is based on the following two principles, required for all DMUs.
Principle 1. Given a set of cross-efficiency scores for the DMUs, when a new set of weights is selected for a DMU to improve the cross-efficiency scores of DMUs, the new set must guarantee that the DMU’s new self-evaluated efficiency is no smaller than its previously given cross-efficiency score.
Principle 2. Given a set of cross-efficiency scores for the DMUs, when a new set of weights is selected for a DMU to improve the cross-efficiency scores of DMUs, the new set must guarantee that the other DMUs’ cross efficiencies calculated with the new set are no smaller than their previously given cross-efficiency scores.
Pareto efficient cross-efficiency can be defined as follows:
Definition 1. A cross-efficiency score set is Pareto optimal for all DMUs if it is impossible to improve the cross-efficiency score of one DMU without worsening that of at least one other DMU.
Model (14) is used to decide whether a given cross-efficiency score set is Pareto-optimal.
In (14) the cross-efficiency score set to be evaluated is given by
. This model can determine whether DMUs have the potential to improve their cross-efficiency through (15):
From the results of Model (14), if , then Model (15) always has a feasible solution. Furthermore, when the DMU cross-efficiency is improved, it aims to maximize the efficiency of DMU , maintaining the cross-efficiencies of the other DMUs at least at their current value.
After solving Model (15), each DMU will obtain a new set of optimal weights. These weights are used to obtain the new cross-efficiency set, improved for all DMUs as defined below.
Definition 2. Let be an optimum solution to Model (15) with respect to . For each , is defined as its Pareto improved cross-efficiency: Thus, the algorithm consists of the following steps:
Step 1. Solve Model (2) and obtain a set of cross-efficiency scores defined in (12) for all DMUs. Make
Step 2. Use the cross-efficiency scores from the previous step in models (14) and (15). Solve Model (14), if the optimal solution is stop. If solve Model (15) to select a new set of weights for all DMUs, then do where are the optimal weights after solving Model (15).
Step 3. If for a given , then do and go to step 2. If for all , stop.
In this algorithm, the initial values for in Model (14) are the average values of the original cross-efficiencies of DMU .
When the proposed algorithm terminates at step 3, it is possible to calculate a common set of weights for the model variables, by standardizing the optimal weights of any DMU
through the following equations:
The DEA models can be used to statically evaluate efficiency across a set of DMUs. To evaluate the efficiency changes between two time periods it is common to use the Malmquist Productivity Index (MPI). The non-parametric version of this index was first introduced by Färe et al. [
46], and can be written as the geometric mean of two indices:
where
is the Malmquist productivity index with output orientation,
represents the output vector that can be obtained with the resource vector
, and
denotes the distance function based on outputs (20):
This function is defined as the reciprocal of the “maximum” proportional expansion of the output vector
, given inputs
[
46].
The MPI can be decomposed into technical efficiency changes and technological frontier changes, in the following way:
where the first parenthesis measures technical efficiency change (TEC) between period
and
, the geometric mean of the two ratios in the second parenthesis measures production frontier change (FC) between two time periods. Thus, we can calculate the Malmquist index as the product of these factors:
This index reflects the progress or decline in the efficiency of the DMU with the progress or regression of the technological frontier.
Thus, is simply the ratio of two successive distance functions and is related to the level of effort that the DMU has made to achieve efficiency, and measures the capacity of the DMU to shift closer to or further way from the technological frontier from one time period to the next. The technological change index, reflects changes in the efficient frontier relative to the DMU in two time periods, and measures the change in the set of products or the movement of the production frontier during this time: it is associated with capital investment and long-term planning strategies.
This decomposition allows us to identify the factors contributing to productivity change in a given DMU. Therefore:
MPI has been widely used in Data Envelopment Analysis [
25,
46,
47,
48].
4. Materials and Methods
For this paper, we make a quantitative analysis supported by Data Envelopment Analysis (DEA): pure technical, technical, scale and mix efficiencies of 32 public universities within the Colombian Public University System from data for 2012, using DEA CCR, BCC and SBM models with an output orientation. For the Colombian Higher Education Institutions, the academic year coincides with the calendar year. Then the HEIs are ranked using the algorithm proposed by Wu et al. [
16], and productivity changes for the period 2011–2012 are evaluated using the MPI.
We selected as variables some education and research topics, two of the three core functions of a HEI.
In the case of the Universidad Nacional de Colombia, its data corresponds to the five campuses located in the cities of Bogotá, Medellín, Manizales, Palmira and Leticia as a single DMU, in the absence of disaggregated data.
Table 1 shows the institutions that were included in the study. We must stress that all these universities are public and very homogeneous regarding teaching and researching activities. Despite being mainly focused on teaching, in recent years a great effort has been conducted in order to improve their research skills.
Data on the variables selected for this study, and their respective description, was obtained from the Ministry of National Education of Colombia (
Table 2). The variables were selected considering previous researches [
10,
49,
50].
The six outputs measures are the teaching and research activities of universities. The first two are the two different categories of students: undergraduate and postgraduate students. The third output is a measure of the quality of graduates (number of students with Saber PRO exam results in the top quintile). The other three products reflect the performance in research activities (weighted number of indexed journals of the institution according to current regulations, weighted number of articles published in indexed journals in the current year and number of teachers participating in mobility processes promoted from their own HEI).
The four inputs are referred to teaching and research activities: academic staff of all levels, administrative staff expenditure, financial resources and physical resources.
Some of these variables are weighted according to the Colombian Law 1279, 19 June 2002. For example, the weighted number of indexed journals is calculated by the Ministry of National Education of Colombia as 15 × A1 + 12 × 2 + 8 × B + 3 × C, where A1, A2, B and C represents the number of Journals according to its quality level (the quality classification is made by the Colombian Institute Colciencias). This calculation is made for the variable Indexed Journals, which refers to journals edited by the university institution itself, and for the variable Articles in Indexed Journals, which refers to articles published by university researchers in indexed journals.
The variables of Number of undergraduate students and Number of graduate students are also weighted (Although it would have been very interesting to have the number of graduates, we have only been able to work with the number of students. It should be noted that the Colombian public universities receive their funding according to the number of students enrolled, and not by the number of graduates. However, we can assume that the number of students can be a good proxy for the number of graduates). The weighting takes into account the knowledge area, the level of training (professional, technical or technological) and the teaching methodology used (traditional learning or distance learning). For example, a student enrolled in distance education weights 0.6 times a student in person. It also takes into account the development level of the Colombian regions and the educational level of its population. For example, a student from a less developed region weights 1.2 times. Similarly, students enrolled in an accredited degree or postgraduate degree have a weight of 2 compared to students enrolled in non-accredited degrees.
With regard to faculty mobility, the number of teachers who make a stay in another university is taken into account. They are also weighted differently depending on whether they are attending a course of short duration (from one week to three months), postgraduate studies (master’s, doctoral and post-doctoral programs), etc.
The number of campuses has been considered by literature as a possible cause of inefficiency [
51]. Although our work does not explicitly include this variable, the number of students is weighted considering the campus in which they study. In this way, the weighting of the students differs as they study on one or the other campus. For example, enrolment in municipalities with low participation in the total enrolment will be multiplied by 1.2.
Following the basic rule of DEA, (number of DMUs) is equal to or greater than the maximum between , where is the number of input variables and the number of output variables. In our case , and . Therefore, .
Table 3 shows the descriptive statistics of the input and output variables for each of the HEIs considered in the study. Regarding data in
Table 3, all public Colombian universities have undergraduate students, but there are some universities with no postgraduate students nor indexed journals. This make the value of some standard deviations very large.
Table 4 shows the correlation analysis, revealing a high positive correlation between input and output variables, indicating that an increase in inputs will be reflected in an increase in outputs. In particular, we note that the output variable with lowest correlation with input variables is undergraduate enrollment. In contrast, the Saber Pro variable has a high correlation with all the input variables. In general, a high correlation of 3 of the 4 input variables is found with 5 of the 6 output variables, which is acceptable for DEA.
5. Results
The results of this research paper are based on the efficiency scores of Colombian public HEIs using CCR-O, BCC-O (output-oriented BCC) and SBM-O-C (output-oriented SBM under constant returns-to-scale assumption) models, as well as the extent to which output variables should be improved in order for an inefficient DMU to become efficient. The results corresponding to 2012 are shown in
Table 5.
The results show that 14 HEIs reveal some type of inefficiency; 18 of 32 HEIs (56.25%) are therefore efficient according to CCR, BCC and SBM models, thereby showing technical, scale, mix and administrative efficiency , which is to say they do not exhibit any inefficiency. These figures represent 56.25% of HEIs evaluated.
The BCC model results show that 23 of 32 universities are administratively efficient, increasing by five the number of efficiently administered HEIs.
In particular, the overall inefficiency in UPTC, UIS, UFPS-Ocaña and Sucre universities is due mainly to problems in the mix of their inputs and/or outputs, while Universidad del Pacífico has both scale and mix inefficiency. However, this latter HEI exhibits increasing returns to scale, indicating that increasing its operational scale would produce greater performance improvements.
Similarly, it can be observed that apart from UPTC and UIS universities, all inefficient HEIs exhibit increasing or constant returns to scale, indicating that for most HEIs increased level of resources would lead to a more than proportional increase in outputs.
It is instructive to examine how robust the DEA results might be to changing the specification of the model by reducing the number of outputs and inputs considered. In fact, the high correlation observed between some of the variables may suggest that some of them would be redundant, and their elimination would not affect the levels of efficiency achieved.
In this sense, Eskelinen [
52] states that variables in the efficiency evaluation are often highly correlated, so it could be sensible to omit some of the highly correlated variables without a significant loss of information. However, Jenkins and Anderson [
53] criticized this approach because interrelations between variables are less obvious and cannot be determined directly from the correlation matrix.
Therefore, considering the scores from the SBM-O-C model, we have performed new DEA models by removing some highly-correlated variables: FTE Faculty and Admin Staff Expenditure.
Table 6 summarizes the efficiency scores. The values with dark background imply changes with respect to the original model. We can observe that 18 universities were efficient in the model that included both variables. Removing the variable FTE Faculty means that 3 universities become inefficient, while removing the variable Admin Staff Expenditure increases the number of inefficient universities in 7. It is also observed how the score of some inefficient universities is also modified. This gives an idea of how the inclusion or exclusion of some inputs or outputs can affect the result. In spite of being highly correlated, we see how these variables do provide relevant information, since their elimination affects the number of efficient universities (especially in the case of eliminating the Admin Staff Expenditure variable from the analysis).
In addition to analyzing the robustness of DEA by removing some highly-correlated variables, it is also interesting to know how the result varies when some universities with extreme values are eliminated. For example, if we analyze the FTE Faculty we can observe two universities with the minimum and maximum value in the sample. The university with 56 FTE Faculty is the UFPS-Ocaña. The university with 2161 FTE Faculty is the National University. If we exclude both universities from analysis, 3 universities become efficient: Cauca, UIS and Cartagena. We cannot conclude that the presence of Universities with very different values in some variable affect the results obtained. Whenever we eliminate some variable, or eliminate some University, there will be changes in efficiency in the rest of DMUs.
On the other hand,
Table 7 shows that the main source of inefficiency of UFPS-Ocaña is Mix Inefficiency, being hardly affected by its size.
The decomposition of overall efficiency according to Equations (10) and (11), allows us to appreciate that the overall inefficiency (SBM) of the universities of Cauca, Córdoba, Tecnológica de Chocó, Atlántico, Cartagena and Cundinamarca is due both to poor operation, which is observable in its pure technical or administrative efficiency (BCC), and to problems in the mix of inputs and/or outputs (mix efficiency, MIX), but not to problems in the scale of operation (SE). Of these, Universidad Tecnológica de Chocó has the lowest overall performance (SBM = 0.0703) in administration (BCC = 0.6042) and mix (MIX = 0.1271), closely followed by the Universidad de Cundinamarca (SBM = 0.075, BCC = 0.5448, MIX = 0.1447), indicating that these universities need to intensify effort in the areas of administration and reallocation of resources.
Turning to the universities of Llanos and Amazonia, their overall inefficiency (SBM) is due to inefficient operation (BCC), problems in the mix of inputs and/or products (MIX), and problems in their operating scale (SE).
In the case of Universidad de Nariño, overall inefficiency is due in greater proportion to the mix of inputs and/or outputs. (MIX).
Table 7 shows the main sources of inefficiency for inefficient universities.
Table 8 shows the reference set. Analysis of the reference set shows that the Universidad Nacional participates as a peer evaluator for 12 inefficient HEIs, (85.71% of inefficient HEIs), followed by Militar and Tolima universities who evaluated 9 inefficient HEIs (64.28%), and the Universidad Pedagógica with 8 evaluations (57.14%). These four HEIs serve as role models for inefficient HEIs and therefore demonstrate best practice.
The universities of Cesar, Colegio Mayor de Cundinamarca, Surcolombiana, Valle, UPFs Cúcuta, Pamplona, Guajira and Distrital do not participate as peer evaluators of inefficient universities, indicating that their mix of resources/products is unusual compared with the other HEIs.
DEA indicates the extent to which the input and output variables must be improved for an inefficient HEI to become efficient, through the projection of the inefficient DMU onto the efficient frontier.
Table 9 shows the amount that output variables should be improved (increased) for each inefficient HEI. Here we note that only two inefficient HEIs need to increase the number of students enrolled in undergraduate programs, while all need to increase enrollment in graduate programs and number of indexed journals published by the institution. On the other hand, the only university not needing to improve scores in the Saber Pro exams is UIS, which is in line with the high academic level attained by this university. It is highly selective, as it is highly demanded because of the recognized quality of its graduates (which is shown in the results of the Saber Pro top quintile), being able to choose better their future students, nevertheless evidences a deficit in the research production and enrolment. Besides it has some special features that increase its financial resources, for example, it is an accredited university. Likewise, Universidad de Cartagena is the only inefficient HEI not requiring more articles published in indexed journals and UPTC the only one that does not need more teachers with international mobility.
The results of the algorithm proposed by Wu et al. [
16] to conduct an assessment of cross-efficiency based on Pareto optimality gives the university ranking shown in
Table 10.
Table 10 shows that the universities of Tolima, Caldas and UNAD are the best performers, followed by the universities of Antioquia, Militar and Nacional. In contrast, the Universidad del Pacífico has the worst performance, followed by the universities of Tecnológica de Chocó, Amazonía, Mayor de Cundinamarca and Cundinamarca.
Equations (17) and (18) determine a set of weights for the variables, common to all DMUs, which are shown in
Table 11.
These weights show the relative importance of the variables in the efficiency analysis, demonstrating that Faculty Mobility is the output variable with highest weight, followed by Indexed Journals. Conversely Postgraduate Enrollment is the product with the lowest weight in HEI efficiency. In terms of resources, we see that the number of Full Time Equivalent (FTE) Faculty is the variable with highest weight in the evaluation, followed by Physical Resources. In addition to analyzing the efficiency of universities, the DEA model objectively determines the weight of inputs and outputs in obtaining the efficient frontier. However, it may be interesting to include the opinion of a group of experts, such as researchers, professors or university managers, to determine the different importance of each of these variables. To model this issue, new restrictions could be included in the DEA model. For example, limiting the maximum/minimum weight of some criteria, restricting the weight of one criterion according to the weight of another, etc.
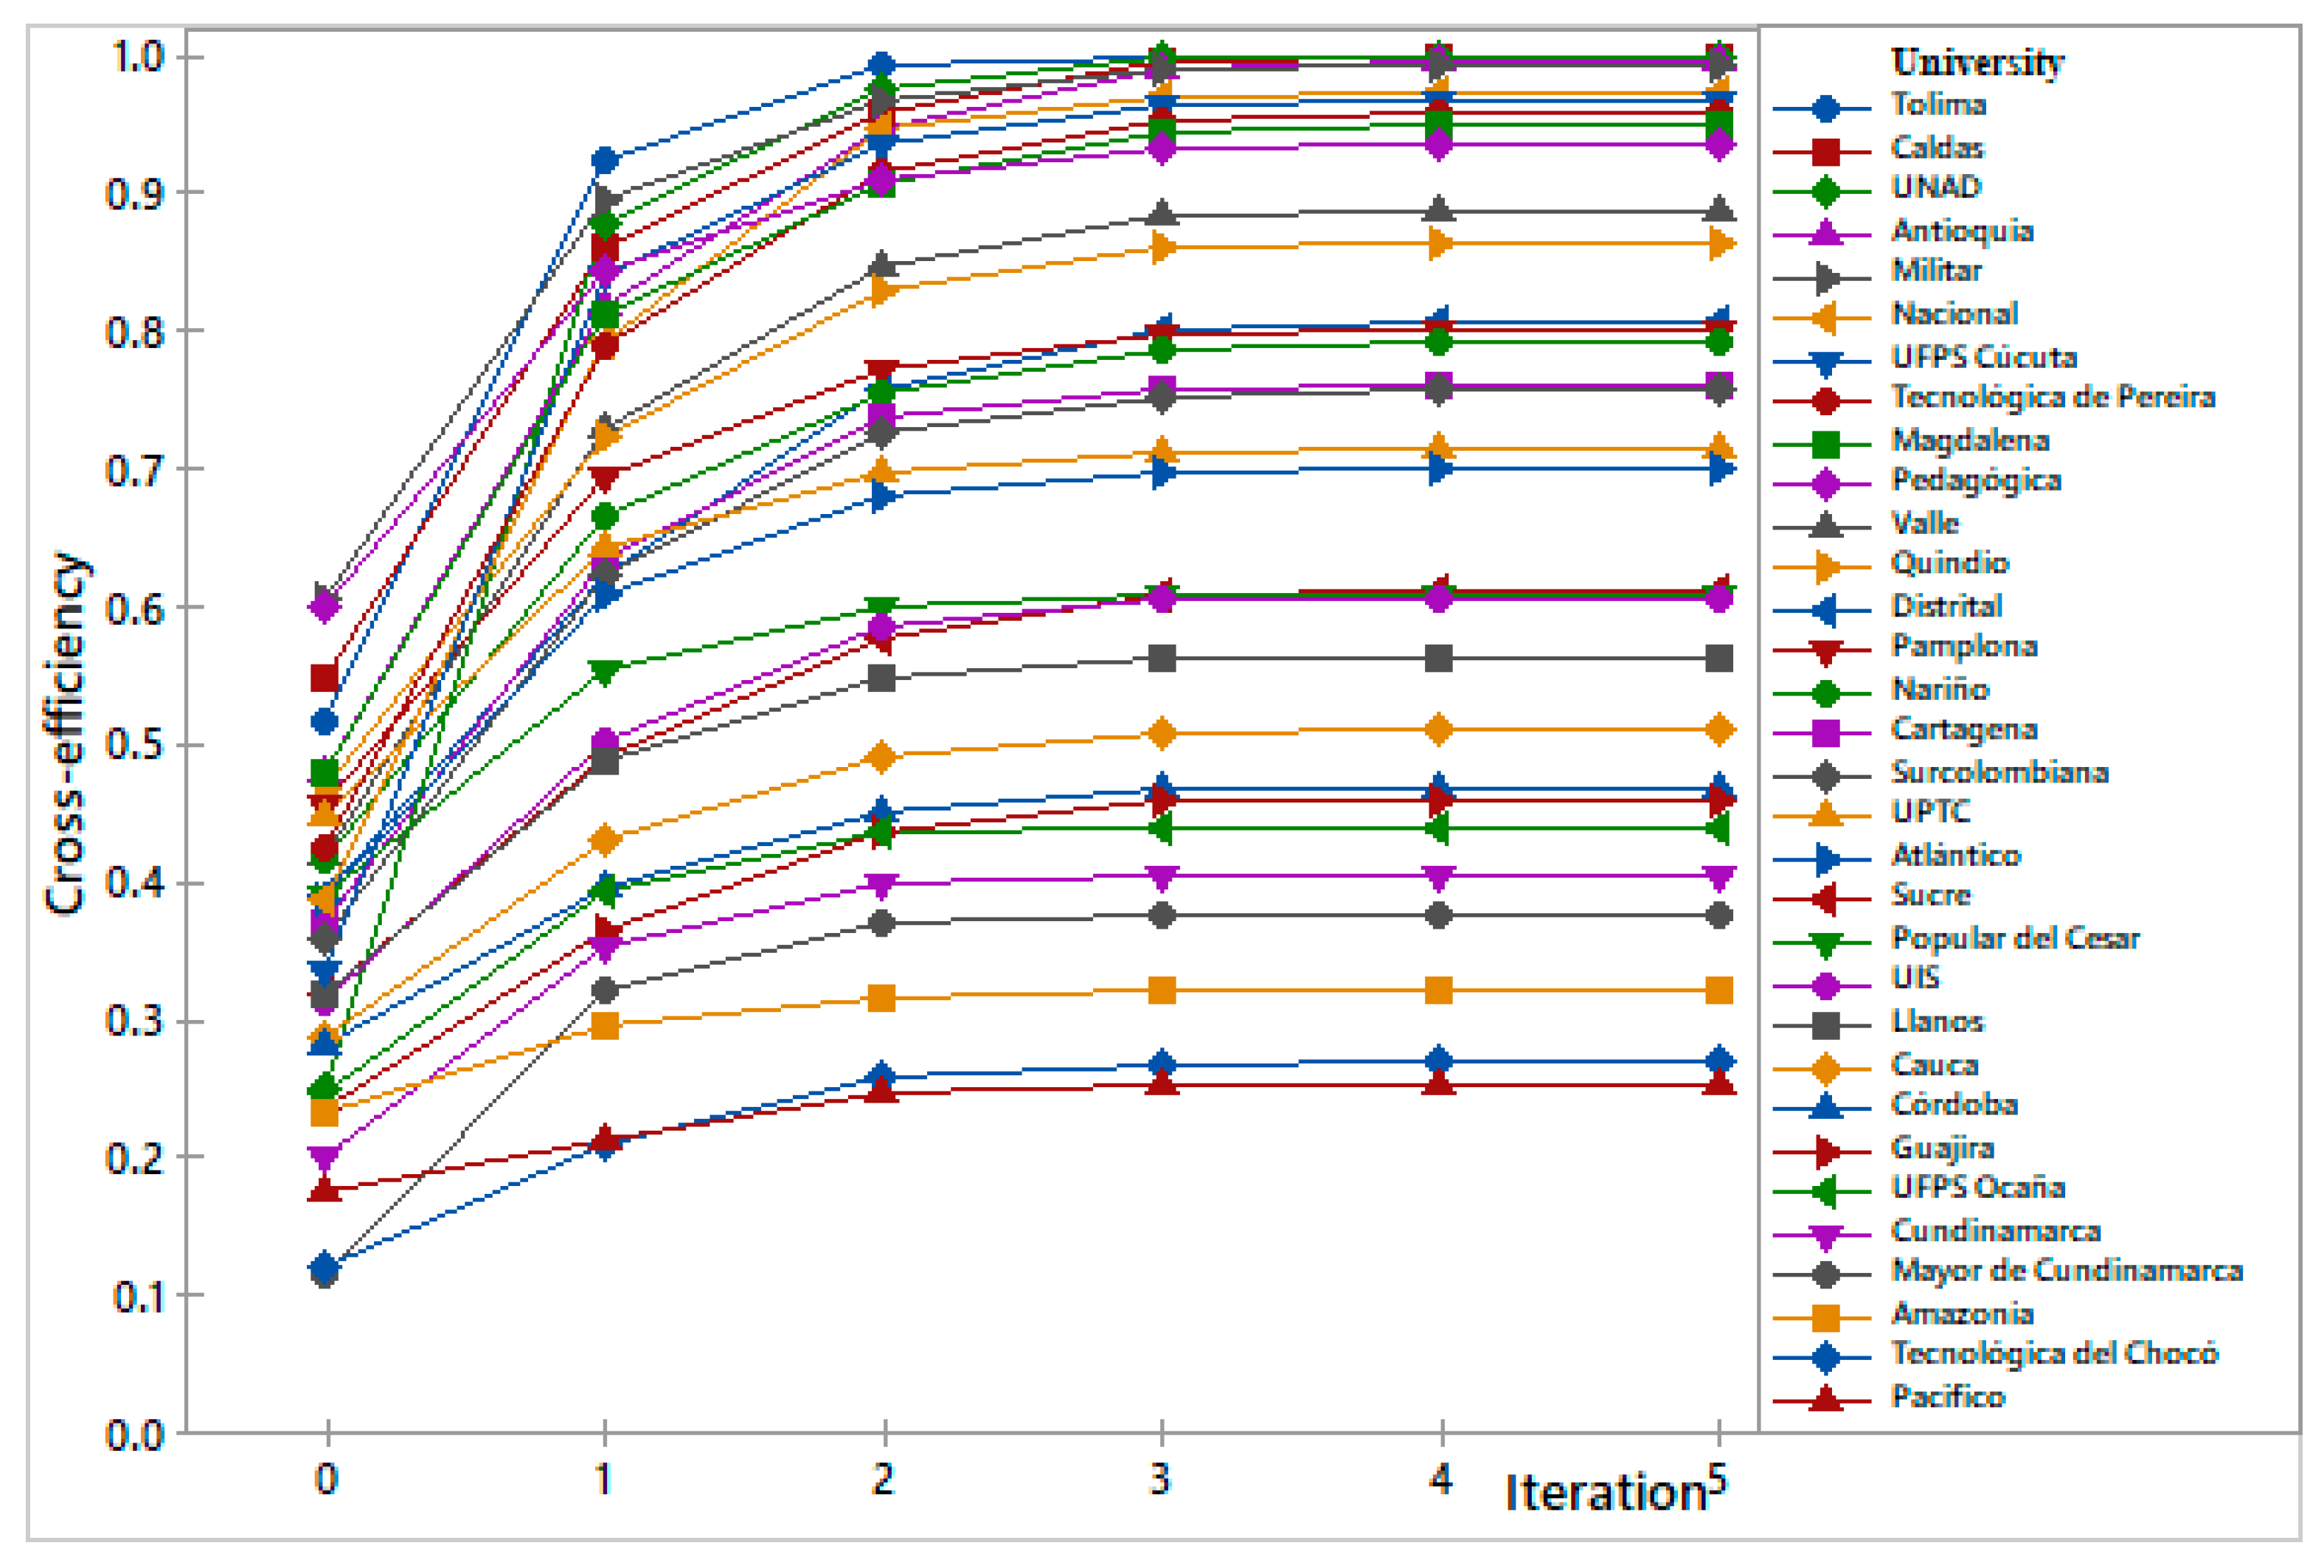
Figure 1 shows the improvement in cross-efficiency during the iterative process of the algorithm, which converges in 5 iterations. In this figure, the iteration 0 is the cross-efficiency with the CCR model weights.
To analyze productivity change for the period 2011–2012 with the Malmquist index, we used data on input and output variables for the year 2011 based on the SBM model.
Table 12 shows the descriptive statistics.
The results, shown in
Table 13, indicate an overall improvement of 20.21% in average technical efficiency between 2011 and 2012, a decrease of 21.2% in technological efficiency, and a decrease of 3.08% in average overall productivity. It can also be observed that 20 HEIs improved their technical efficiency, only 2 improved their technological efficiency and 10 improved overall productivity. Of the HEIs evaluated only Universidad de La Guajira improved both technical and technological efficiency. This indicates that the decrease in average total productivity is due to a decline in technological efficiency rather than technical efficiency. In particular, Universidad de La Guajira is the HEI with the greatest improvement in productivity between 2011 and 2012 (MI = 5.5140; TEC = 4.5664, and FC = 1.2075), with an improvement of 356.64% in its technical efficiency and 20.75% in technological change. Universidad de La Guajira is efficient in 2012 and technical efficiency change is 4.5664, and Equation (23) indicates that for 2011 efficiency is approximately 0.219, highlighting excellent improvements in technical efficiency. This improvement is explained by the fact that the institution is a provincial university and one of the smallest in Colombia; hence a small improvement in absolute terms is reflected in a great improvement in relative terms, this being the great strength of Data Envelopment Analysis.
Finally, we would like to point out the existence of a generalization of deterministic DEA models to stochastic efficiency frontiers [
54,
55] that could be applied in this case. This model would imply the probable inclusion of some university in the stochastic efficiency frontier. Although this change would not significantly affect the conclusions reached in our work, it seems appropriate to consider this for future research.
6. Discussion and Conclusions
This paper has evaluated efficiency in the use of resources for public higher education in Colombia, taking into account two basic functions of higher education institutions: teaching and research. For each HEI we have determined the technical, pure technical scale and mix efficiencies with an output orientation.
The results show that 18 of the 32 institutions included in the study do not present any kind of inefficiency (56.25%); i.e., they are efficient overall. The 14 higher education institutions that have some type of inefficiency are mix inefficient, 8 are administrative inefficient, and only 3 are scale inefficient. Two universities, Amazonía and Llanos, are overall inefficient in the three sources of inefficiency.
For inefficient HEIs that need to increase their output, the SBM-O model projections to the efficient frontier show the following results: the required increase in the number of weighted students enrolled in undergraduate programs is between 619 for Los Llanos and 10,081 for UIS; the weighted number of students enrolled in postgraduate programs should increase between 190 for Cauca and 1637 for UIS. The weighted number of students scoring in the top quintile of the Saber Pro exams should increase by from 2 for Cartagena and 342 for Tecnológica de Chocó. The weighted number of indexed journals should increase from 5 for UIS to 81 for UPTC, and the weighted number of articles published in indexed journals should increase by between 88 for Sucre and 1325 for Cundinamarca. Finally, faculty mobility should be improved by 7 for Cartagena and 130 for UIS.
Universities found to be inefficient should, as a whole, increase the weighted number of students enrolled in undergraduate programs by 10,700, this accounts for the 1.9% of the total enrolled; the weighted number of students enrolled in postgraduate programs should rise by 11,203 (30.4%); and the weighted number of students with high scores in Saber Pro exams needs to increase by 1979 (8.79%). In terms of research, the group of inefficient state universities should increase their weighted number of indexed journals by 477 (35%), increasing the weighted number of articles published in indexed journals by 8272 (14.22%), and the number of teachers with mobility by 467 (16.22%). In conclusion, it can be observed that Colombian universities require a significant percentage increase in postgraduate enrollment and research results.


