1. Introduction
Severe earthquakes may cause significant damage and casualties, especially in densely built areas. The management of catastrophic events, such as earthquakes or floods, typically involves four phases: disaster assessment, short-term recovery, long-term reconstruction, and recovery management [
1]. After the assessment of victims and damage, the short-term recovery phase aims to provide temporary accommodations for displaced people; it also involves the restoration of infrastructures and lightly damaged buildings. Among others, the main goal of the long-term reconstruction is the repair/reconstruction of severely damaged buildings. The recovery process strongly depends on the local context and may have very different durations. The first months after the event involves short-term recovery, while the time of long-term reconstruction, including the repairing/rebuilding of damaged houses and the in place or delocalized re-settlement of the homeless, strongly depends on political strategies and relevant post-earthquake standards and criteria. The housing recovery time, which starts few months after an earthquake, may last several years, depending on housing recovery programs and their financing process.
After the 1906 San Francisco earthquake, with an estimated moment magnitude of 7.8 (550 dead, 220,000 homeless, 55% of housing units destroyed, and 300,000 evacuees) the emergency period lasted four weeks, while the short-term recovery involved about 40 weeks and the long-term reconstruction duration was about nine years [
2]. The 1994 Northridge (Los Angeles, CA, USA) and the 1999 Chi-Chi earthquake in Taiwan were the most destructive earthquakes in their respective countries in the past half-century [
3]: magnitude 6.8 and 7.3, 57 and 2417 people killed, more than 51,000 and 65,000 damaged buildings, respectively. In the case of the 1994 Northridge earthquake, data concerning the reconstruction process showed that among the 19,229 approvals for housing rebuilding permits issued by the Los Angeles Building and Safety Department at the end of November 1996, 95.69% were single-family buildings, while the remaining were apartment buildings and condominiums. The speed of apartment and condominium reconstruction was slower than single-family buildings [
3]. The same trend was observed after the Chi-Chi earthquake in Taiwan: condominium reconstruction started almost one year later than other types of buildings. Three years after the earthquake, only about 41% of the total 44 condominiums had been rebuilt or were under construction. The reason for such a delay was the difficulty in reaching consensus on reconstruction among condominium owners.
The 1995 Great Hanshin earthquake or Kobe earthquake was the greatest urban earthquake in Japan since the Second World War, with over 6000 deaths, 350,000 or more persons injured, approximately 200,000 collapsed and/or burned buildings, in addition to the destruction of infrastructures [
4]. The number of units lost was 79,283 in the city of Kobe alone, thus new housing increased immediately after the earthquake and reached 4000 per month in the second half of 1995, with a peak of more than 6000 in July 1997; after this, it slowly started to decline.
The Moment Magnitude Mw 8.8 2010 Maule earthquake in central-south Chile affected over four million households, 24% of which were insured. In addition to the impacts of the earthquake, the subsequent tsunami also hit over 500 km of the coastline. The long-term reconstruction process involved several stages: housing, which addresses the work on repair/reconstruction; neighborhoods, which is associated with the work on social camps and villages; and city and territory, which is linked to the urban scale incorporating future urban regulation plans and guidance for the reconstruction process in heavily damaged regions [
5].
Recently, the New Zealand 2010–2011 Canterbury earthquake sequence severely damaged over 6000 residential buildings and disrupted the main lifelines systems of the city; the re-classification of large areas in Christchurch as liquefaction-prone zones led to the disproportional raising of repairing/rebuilding costs with an undeniable influence on demolition decisions and reconstruction time impact [
6].
The 2011 Tohoku Earthquake and associated tsunamis caused 15,894 deaths; the number of houses destroyed or partially destroyed were 128,530 and 240,332, respectively [
7]. Disaster recovery and reconstruction policy and planning stages in Japan consist of three stages: disaster evaluation, in which acts are issued and a budget is passed (I, 0 to 4 months); provisional reconstruction, which includes basic recovery plans and a supplementary budget (II, 4 to 11 months); and finally, disaster recovery and reconstruction, with a further budget definition (III, 11 months to 10 years). The total recovery and reconstruction period for the 2011 Tohoku Earthquake was expected to take 10 years and require JPY 23 trillion (USD 290 billion) in funding [
8].
Such a brief summary of devastating earthquakes and their consequences clearly show that the management of catastrophic events strictly depends on the housing conditions in the earthquake-hit city as well as the local policy and the circumstances under which the earthquake occurred [
9,
10,
11,
12].
The present paper focuses on the analysis of the short-term recovery and long-term reconstruction phases following the 2009 L’Aquila earthquake. In particular, three key points are discussed: types of assistance and the timing of each assistance solution; the timing for people returning home; and reconstruction strategy effects on people returning home. To this aim, the paper discusses and reports data related to the number of people assisted in the temporary solutions as well as the strategy and time for allowing people to come back to their houses. The analysis refers to L’Aquila city because data concerning the other 56 municipalities affected by earthquake damage were not available to the authors. In particular, this study focuses on the population returning home starting from December 2009, when 53,968 people living in L’Aquila city were receiving assistance from the government. The overview of how displaced people were assisted as well as how housing reconstruction affected the population returning home may be useful for future decisions and definitions of disaster recovery timing and reconstruction policy planning.
2. Unusable Buildings and Reconstruction Strategy
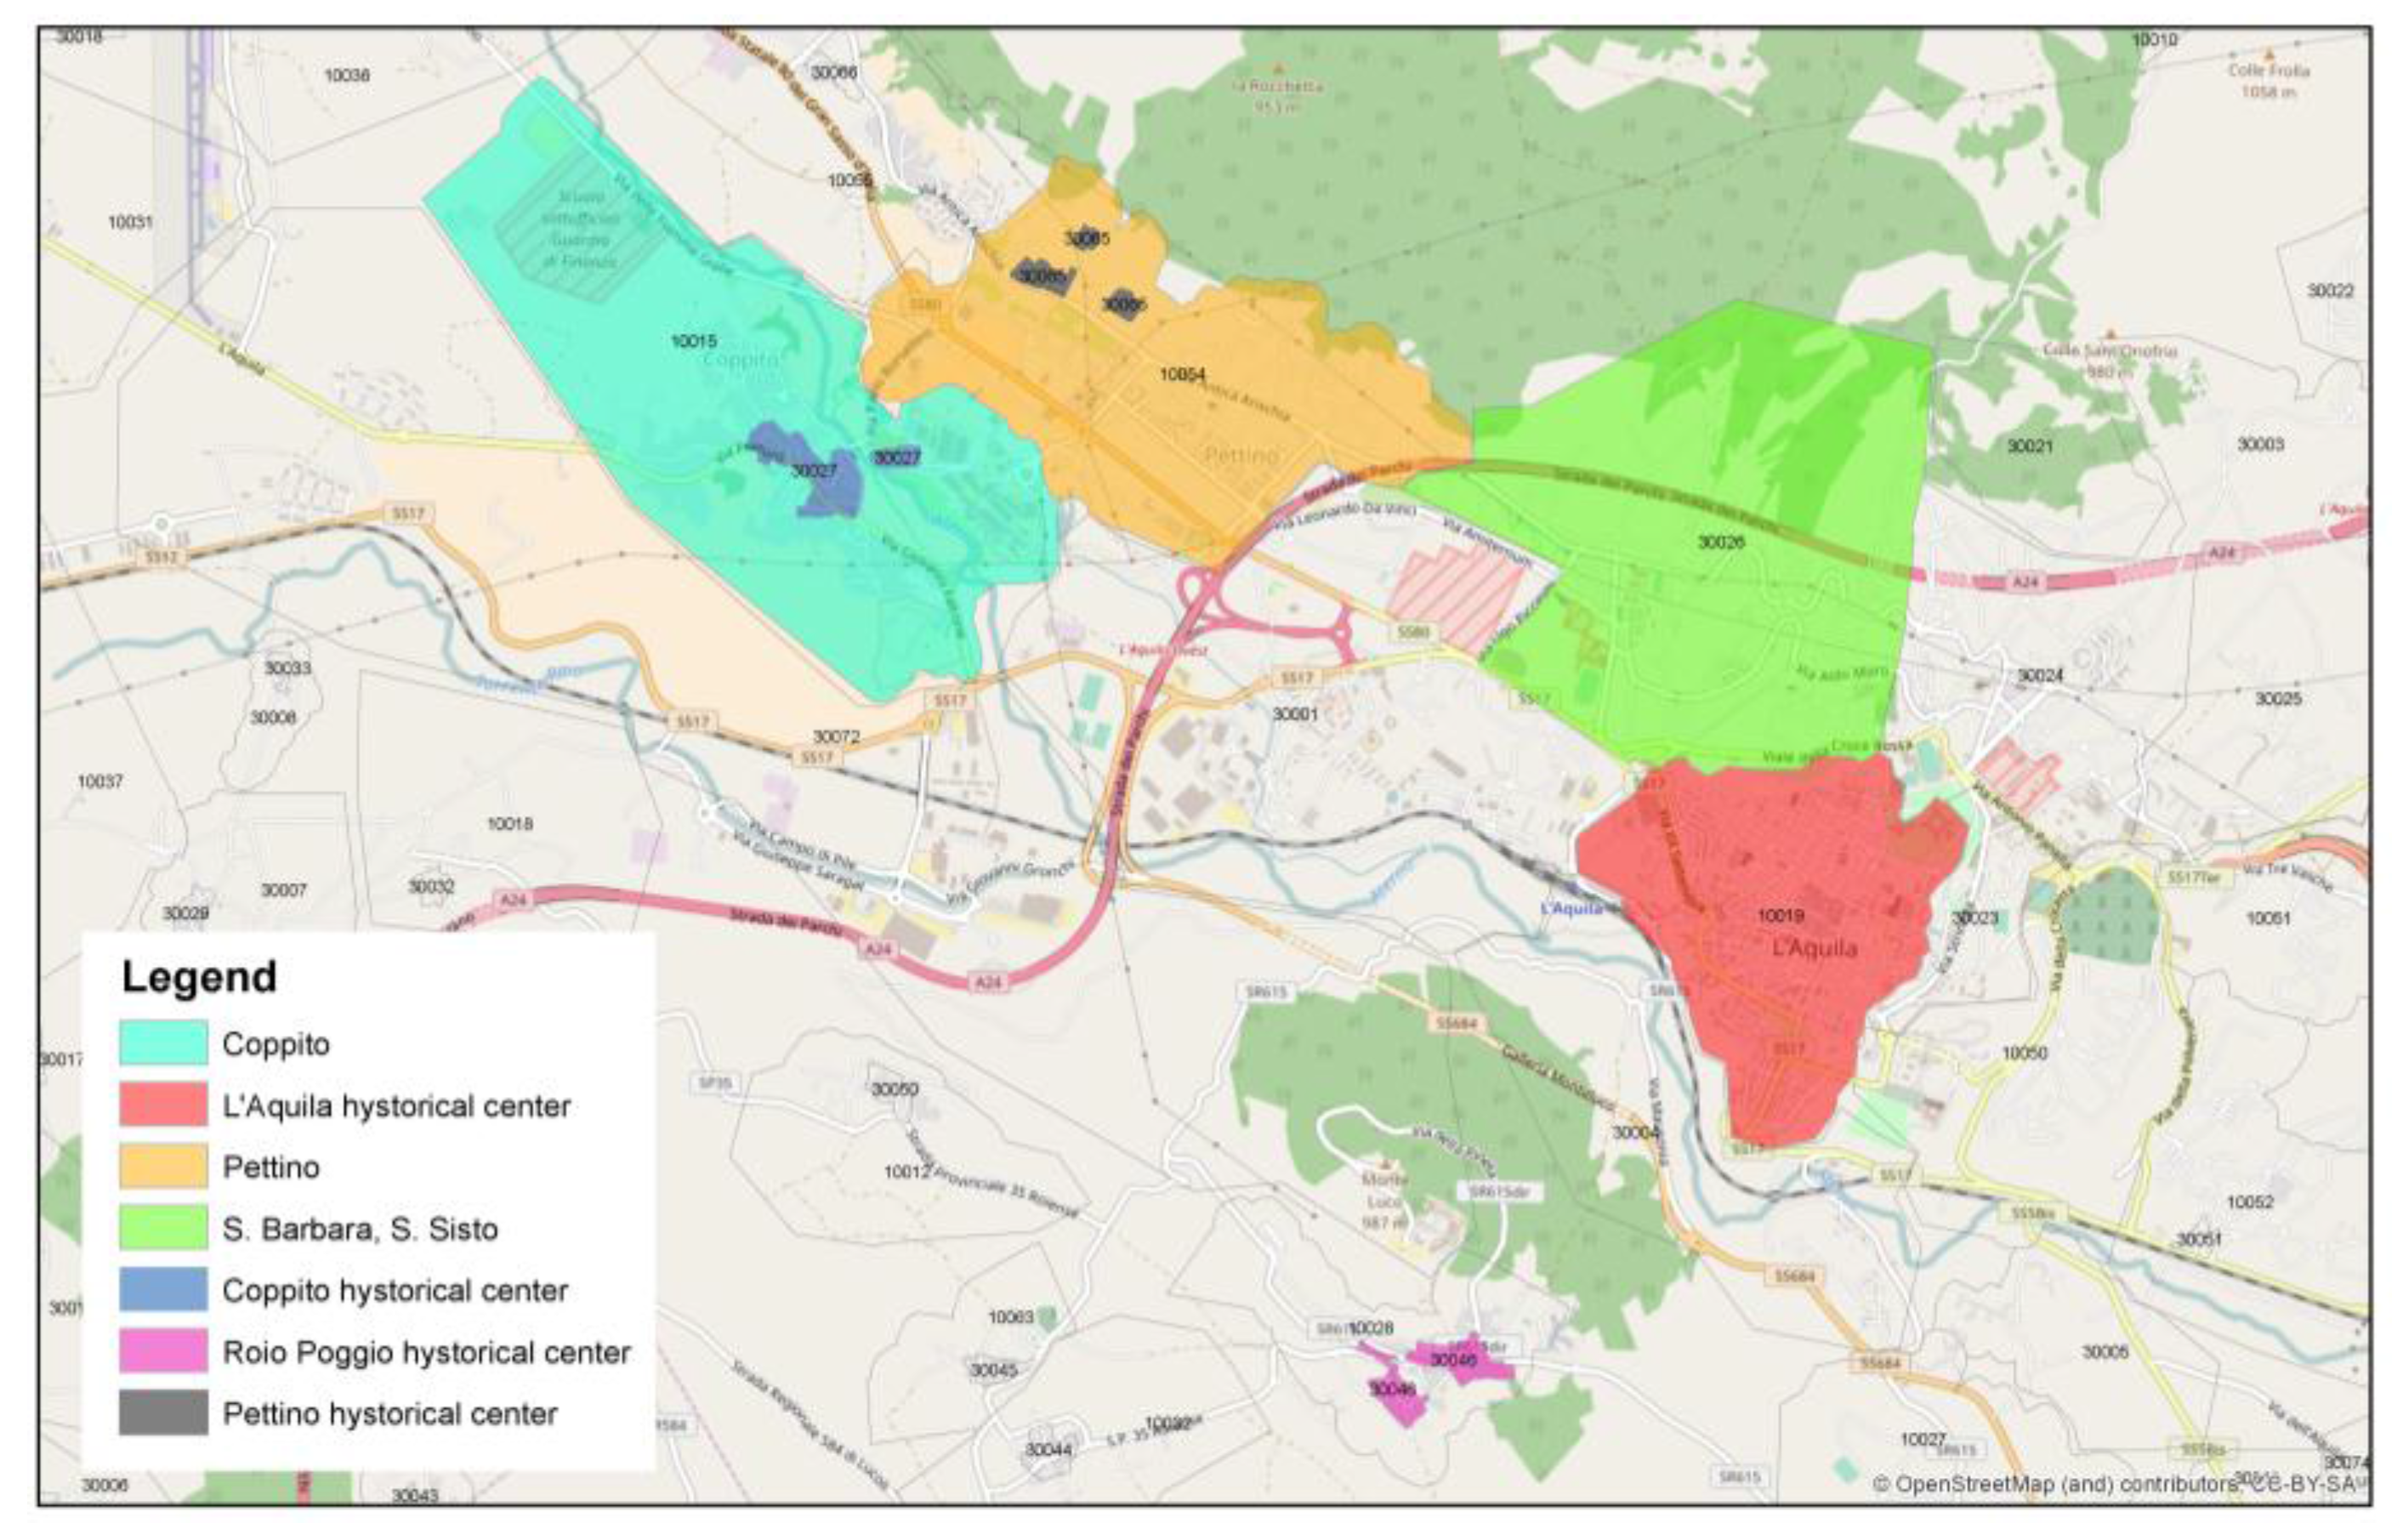
The L’Aquila earthquake occurred on 6 April 2009 at 3:32 a.m., with the epicenter located beneath the Monteluco hill, southwest of the L’Aquila downtown (Abruzzi region), 8.8 km depth; it was the main shock of a seismic sequence that started in December 2008. In addition to a large number of small seismic events, remarkable aftershocks (Mw > 5) struck the same area (i.e., 7, 9 and 13 April). The earthquake strongly affected the chief town and other villages of the Aterno valley, with extensive damage and collapses (mostly concentrated in the areas of historical centers). It caused 309 casualties and severely damaged the historical heritage of L’Aquila and other smaller towns in the surrounding area.
After the event, 67,459 people were displaced and accommodated in tents (35,690 people into 171 camps with 5957 tents) or in hotels and private homes (31,769) [
13].
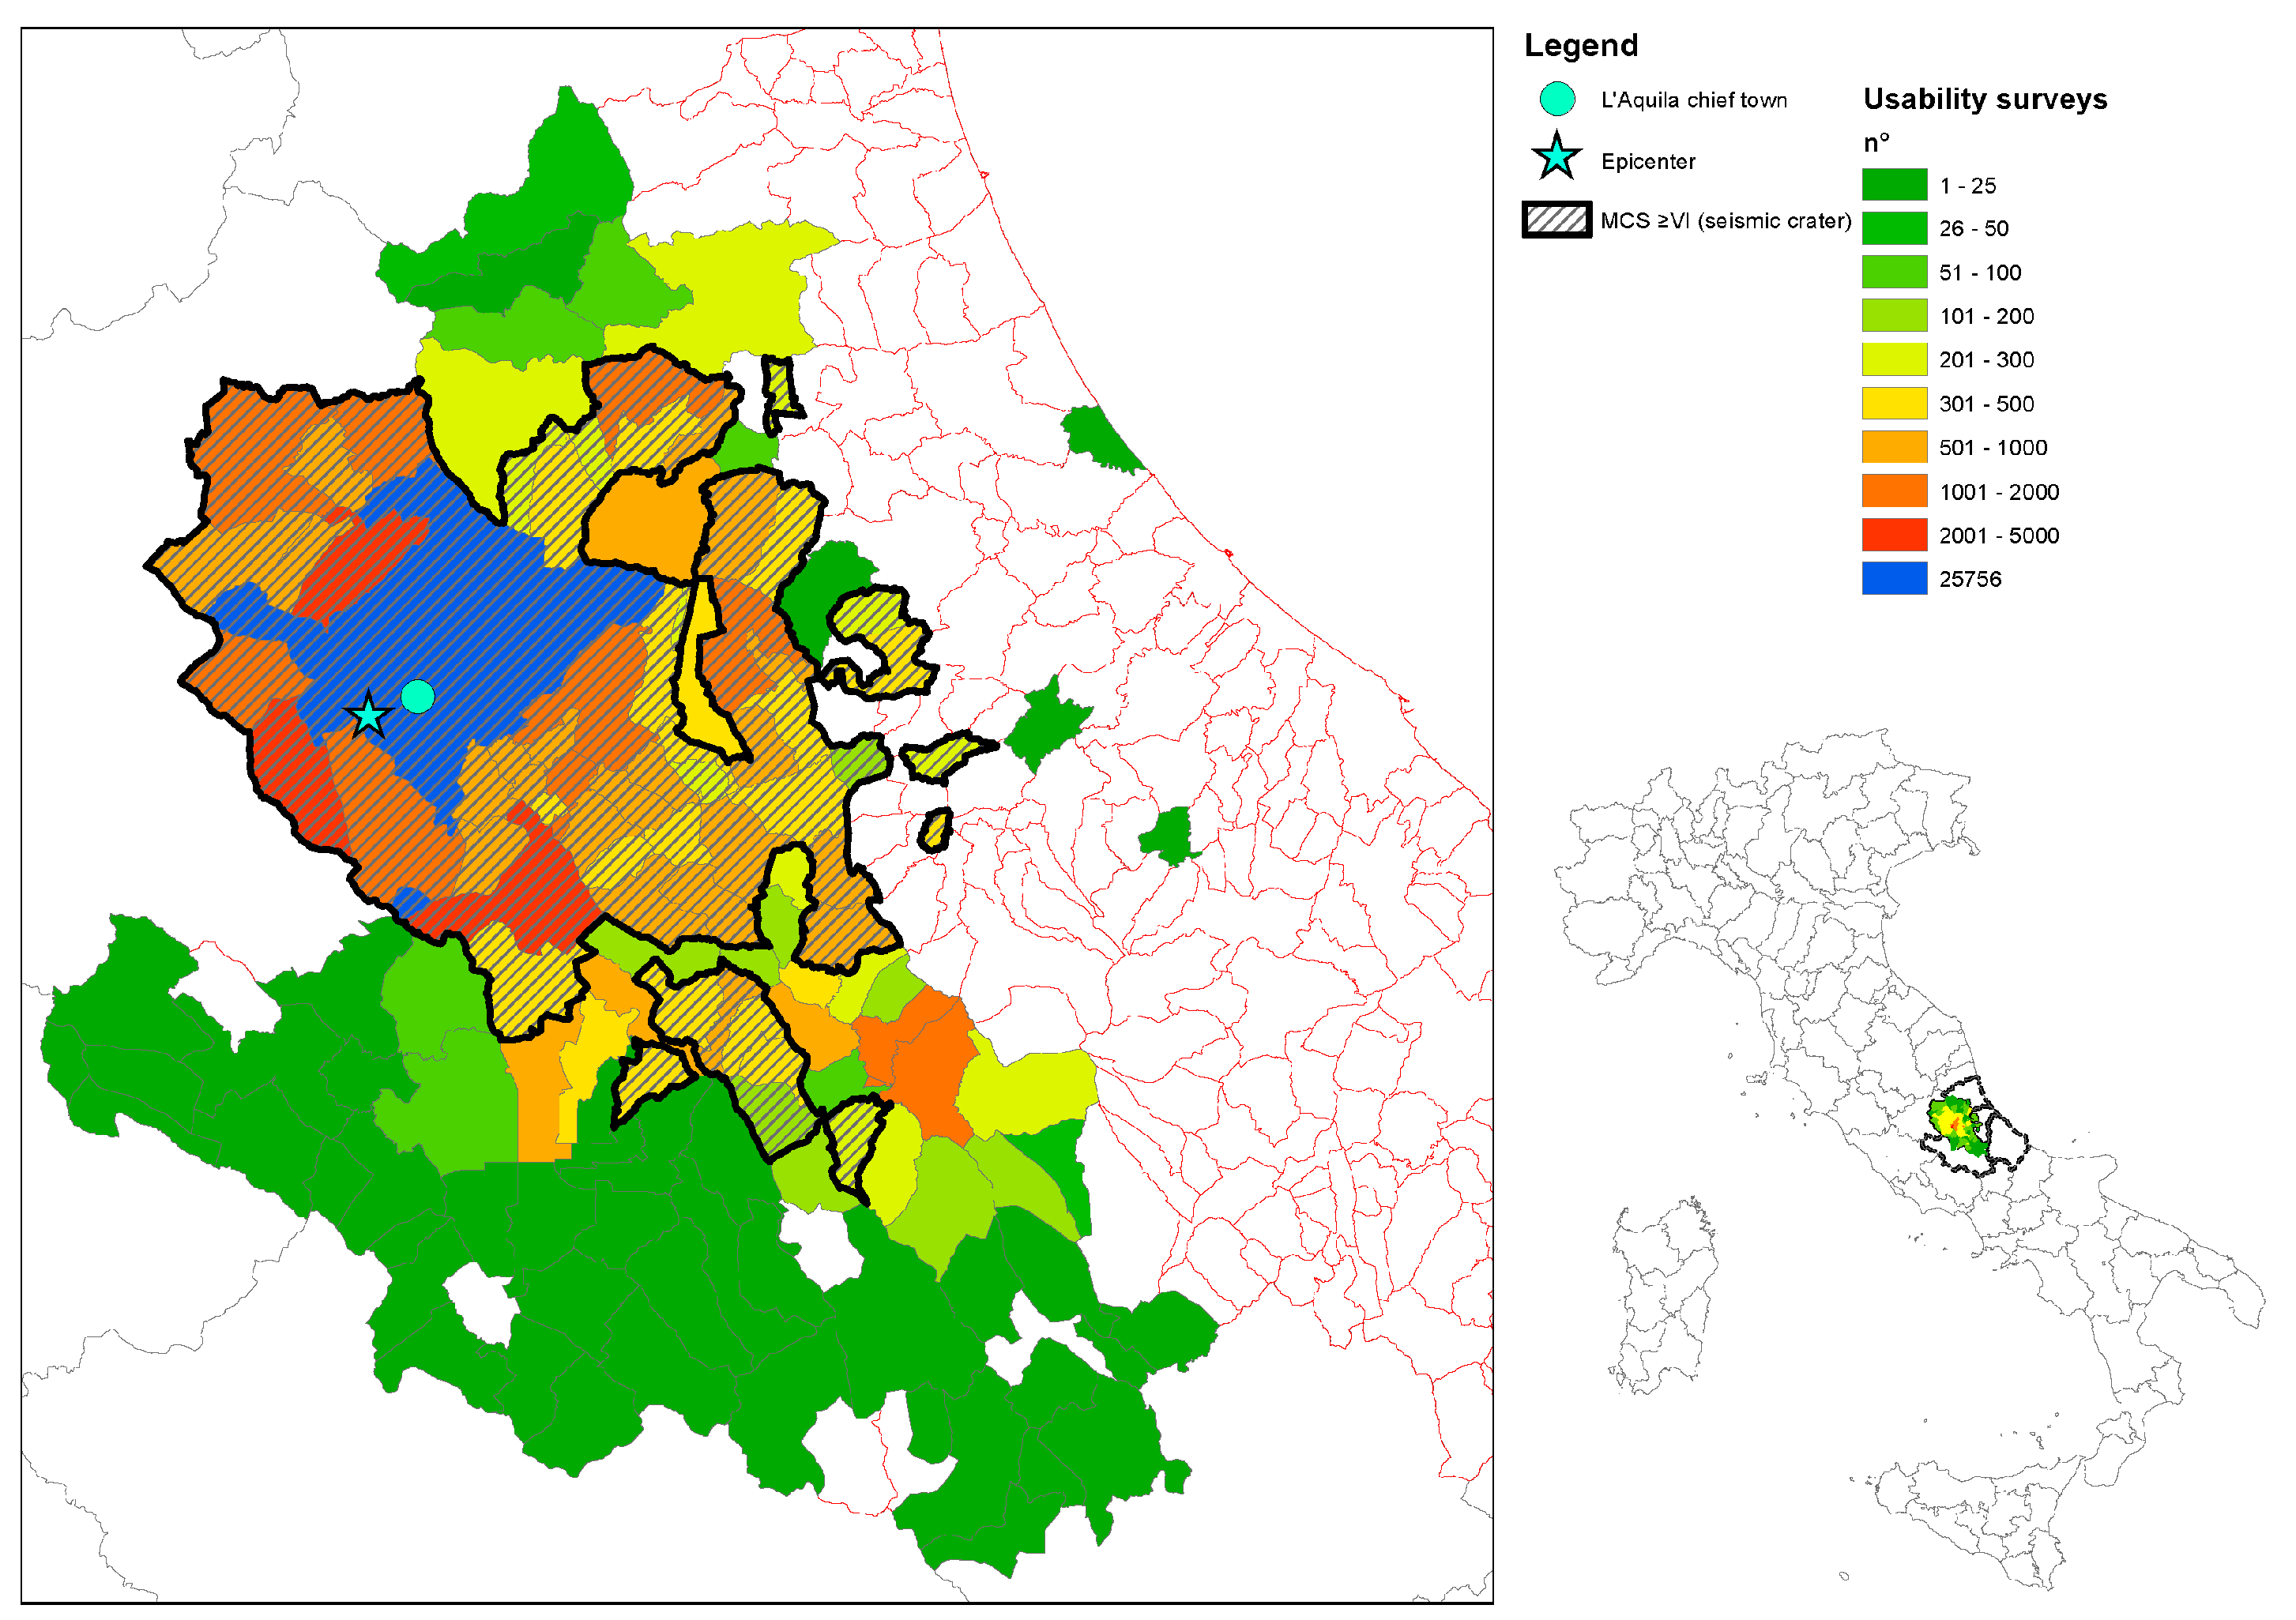
In order to estimate the number of persons to be assisted in the post-emergency phase and to plan temporary housing, the Italian Civil Protection Department immediately launched a vast campaign of post-earthquake field inspections. Over 75,000 in situ inspections were carried out by teams of expert surveyors (over 8000), to evaluate buildings damage levels and to define their usability rating. The surveys involved all buildings located in the areas with macro-seismic intensity, according to Mercalli–Cancani–Sieberg (MCS) seismic scale, MCS ≥ VI; in addition, in areas with macro-seismic intensity MCS < VI, the survey was carried out only upon owner request [
14]. The AeDES (post-earthquake damage and safety assessment and short term countermeasures) survey form [
15] was used as a tool for the seismic damage and usability assessment. According to the AeDES survey form, buildings can be classified into several categories depending on the usability rating, see
Table 1.
Figure 1 depicts the municipalities involved in the usability assessment of buildings as well as those included in the so-called “crater” (MCS ≥ VI). The range of the number of usability surveys carried out in each municipality is also shown in
Figure 1.
A total of 25,756 surveys was carried out in L’Aquila city to determine the usability of public or private buildings.
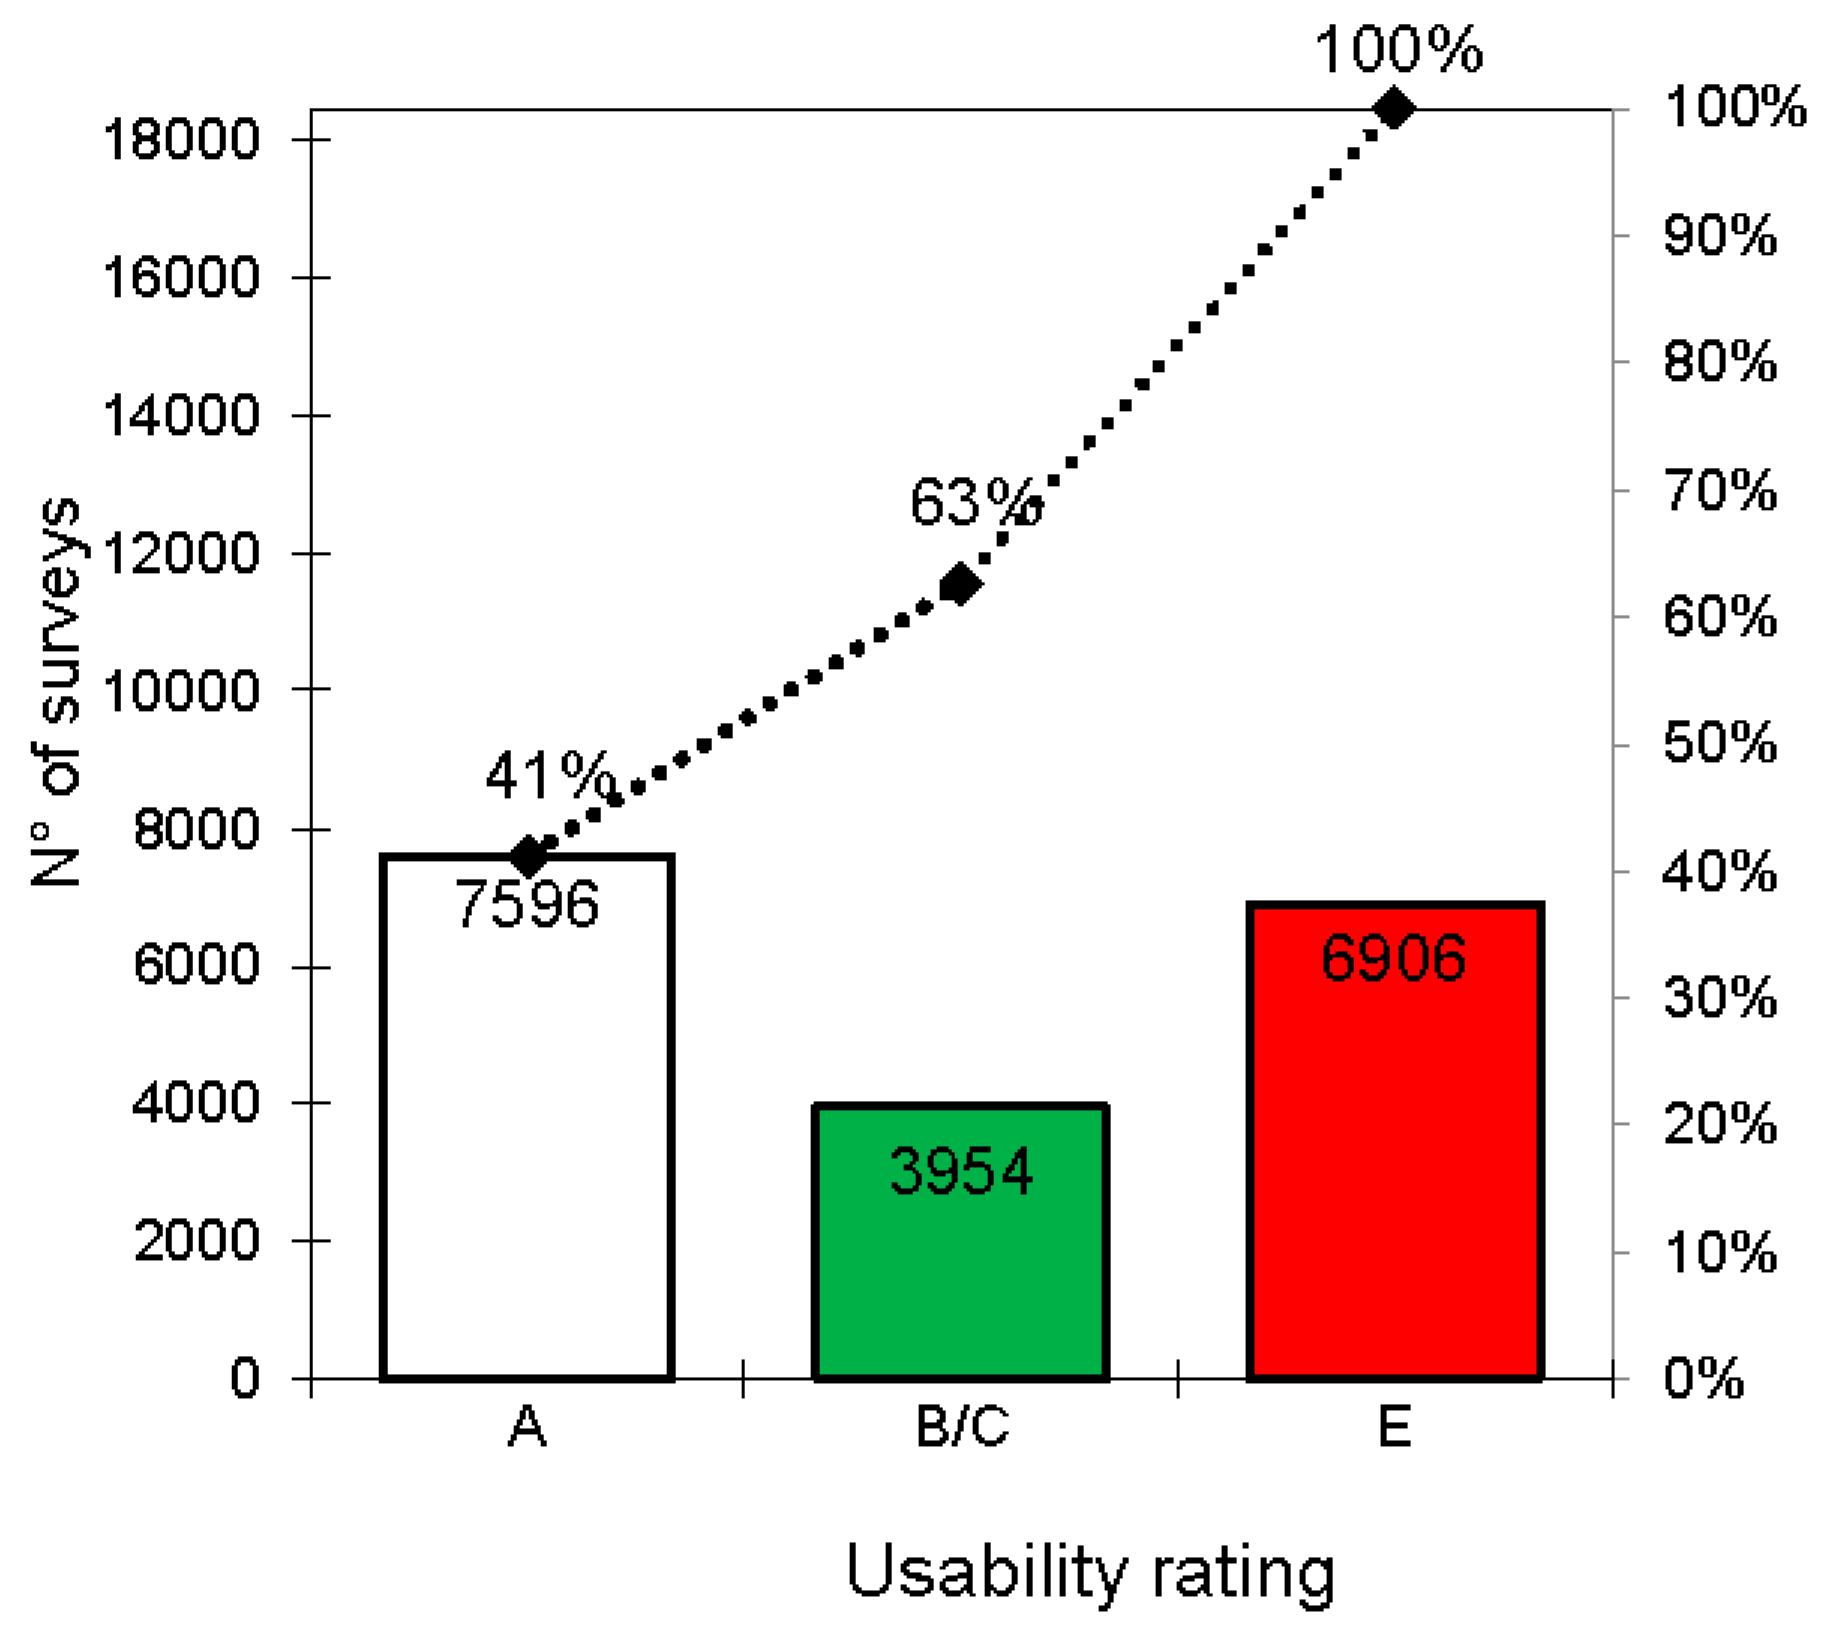
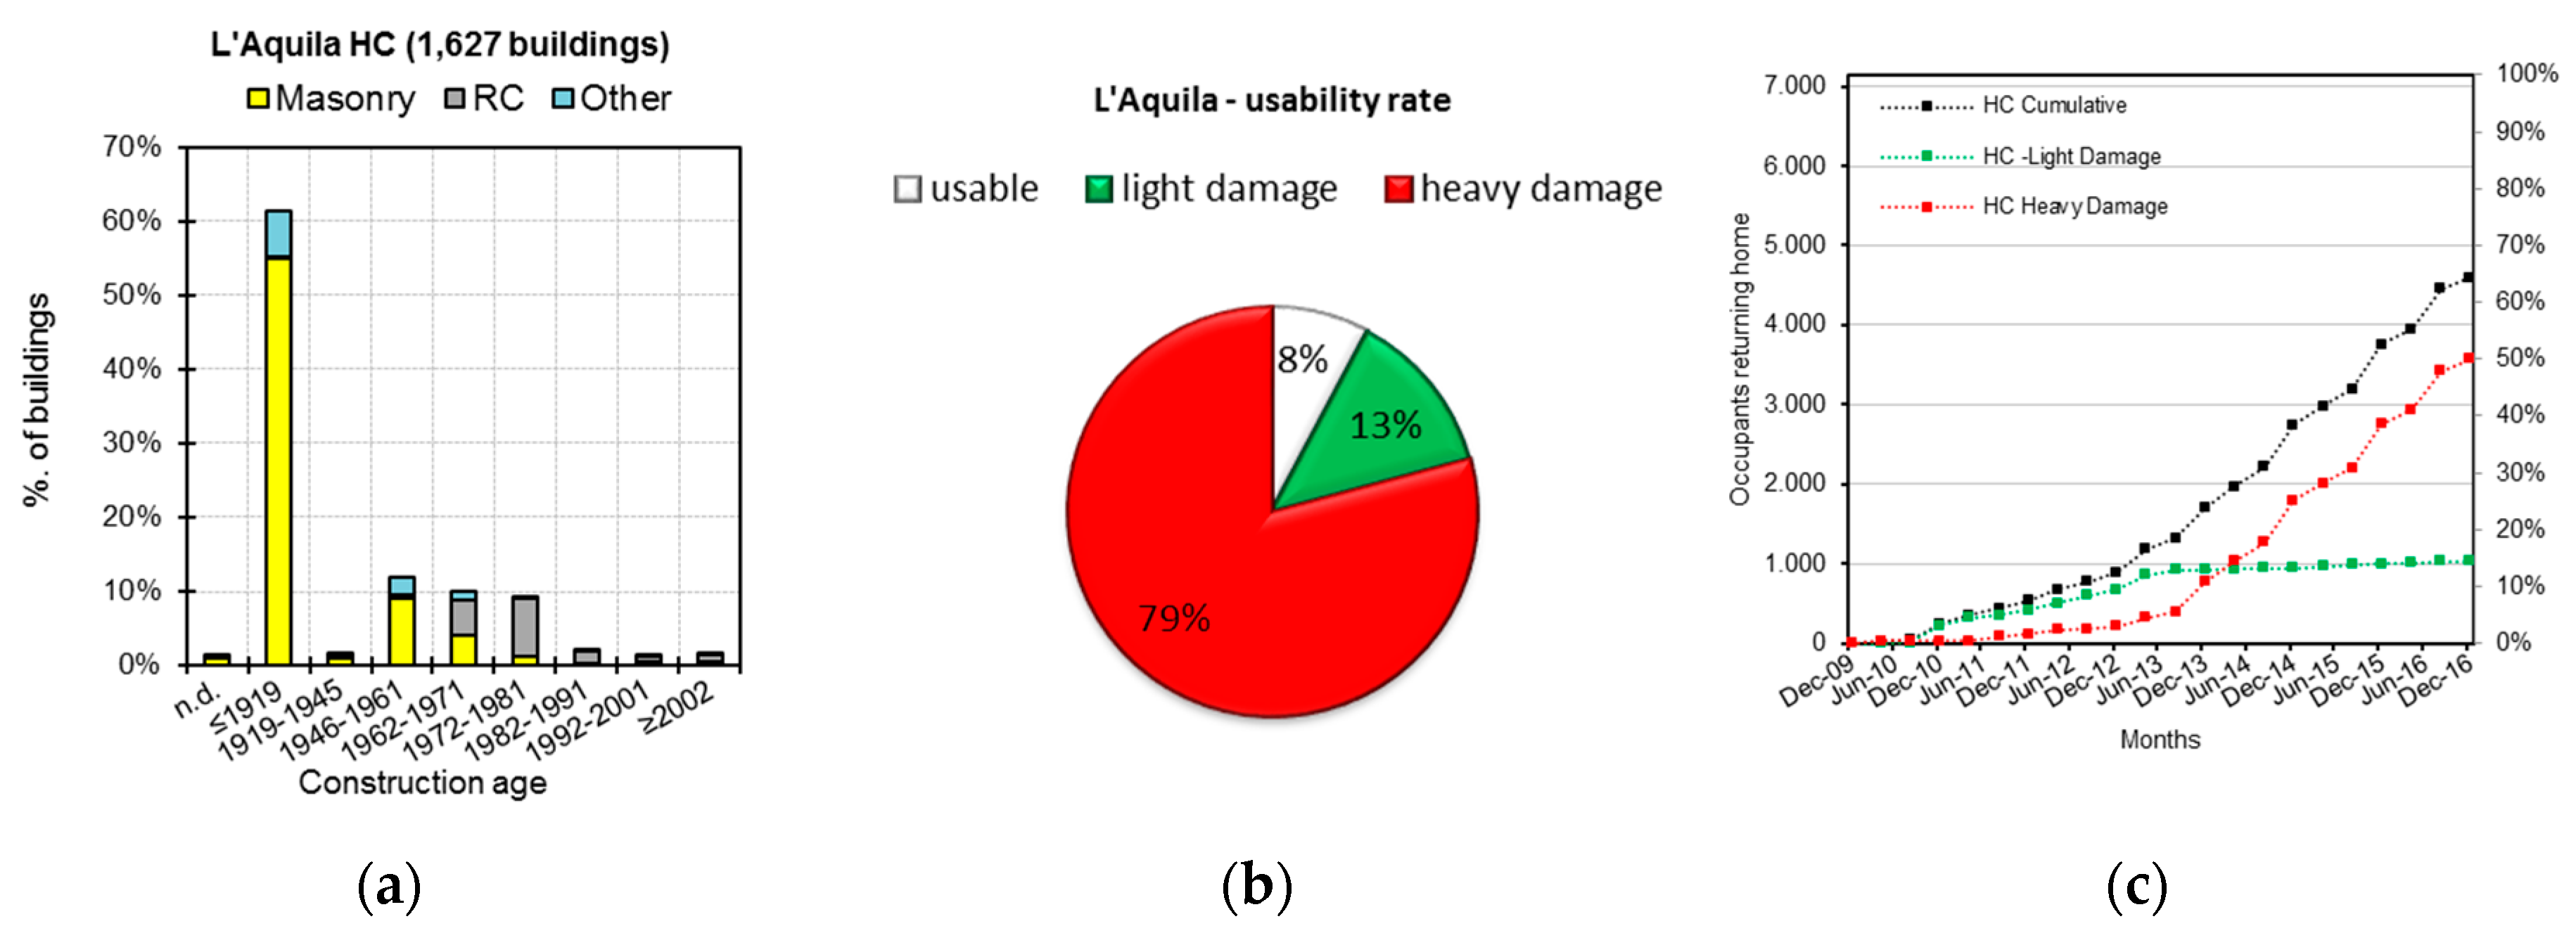
Figure 2 summarizes the usability outcomes related to private residential buildings (i.e., 18,456 buildings corresponding to about 76% of the dataset). It reports three categories of usability ratings: an A rating indicates usable buildings ready for immediate occupancy; a B or C ratings marks unusable buildings with only light damage to the structural components, usable only after short-term countermeasures; an E rating denotes unusable buildings with severe structural and non-structural damage, usable only after a strong repair/retrofit intervention. The dotted line in
Figure 2 reports the percentage cumulative trend of buildings inspected and their relevant usability rating.
Figure 2 also shows that the unusable residential buildings made up about 59% (sum of B/C and E rated buildings), while only 41% were mostly undamaged by the earthquake and thus ready for immediate occupancy. To facilitate and speed up the recovery process, the general strategy aimed to start immediately on the reconstruction of buildings located outside historical centers (OHC), and then tackle the complex issues concerning the reconstruction inside historical centers (HC). Furthermore, the so-called “light damage” reconstruction relevant to less damaged buildings (B or C usability rating) started prior to “heavy damage”, see
Table 1. This strategy aimed to accelerate the re-occupancy of slightly damaged buildings, reducing public costs incurred in housing the displaced people.
This scenario pointed out the huge housing need. To meet this need and to move people from tents, the Italian government foresaw several solutions: financial assistance for accommodation in hotels or public structures, self-accommodations (so-called “self-accommodation grant, s.a.g.”) or apartments leased by Civil Protection (so-called “rent-controlled apartments, r.c.a.”); and permanent structures intended to outlast the recovery timeframe (classic temporary wooden-house units, M.A.P.—Temporary Inhabitable Modules—and the so-called “C.A.S.E. project”—Anti-seismic, Sustainable and Ecologically Compatible Housing Complexes).
M.A.P. are standard light-walled prefabricated dwellings that have commonly been used in Italy after earthquakes for many decades [
16]. The C.A.S.E. project construction plan intended to build 185 residential buildings in a short time (with 4449 dwellings located in 19 different districts) with high levels of quality, technological innovation, seismic protection through the seismic base isolation, energy conservation, and environmental sustainability. M.A.P. modules and C.A.S.E project buildings had a maximum capacity of about 18,000 inhabitants from the municipality of L’Aquila [
9].
The M.A.P. modules and buildings of the C.A.S.E project were primarily realized to host citizens whose homes were: (i) damaged such as to receive the E usability rating; (ii) located in inaccessible areas due to external risk; or (iii) located within the perimeters of the so-called “Red Zone”, a restricted area of the town due to the widespread presence of buildings near collapse.
Simultaneously to the construction of M.A.P. modules and the C.A.S.E project, the reconstruction process of damaged residential buildings started in June 2009 according to directives of Law 77/2009 and subsequent Decrees of the Italian President of the Council of Ministers [
17,
18,
19,
20].
The Italian government fully covered, for owners of their first house, repair work costs to restore the usability of damaged buildings; a further public grant was also established for strengthening interventions. For each building, the funding request for repair and strengthening works was determined by practitioners engaged by owners.
In order to oversee and deal with the analysis of numerous funding requests for buildings located OHC, a proper team called “Filiera” (Ordinances of the President of the Council of Ministers, O.P.C.M. No. 3803, [
20]) was set up; this team managed the reconstruction process along with the local municipalities from September 2009 to March 2013. It comprised three groups: Fintecna, a company totally owned by the State; ReLUIS, an Italian interuniversity consortium; and Cineas, a university consortium for Insurance Engineering. The goal of Filiera was to check the numerous applications for funding from an administrative (Fintecna), technical (ReLUIS), and economic angle (Cineas). At the end of such a reconstruction phase, funding applications related to 4885 residential buildings OHC of L’Aquila municipality were examined and approved by Filiera for a total grant released to the order of 2.6 billion euros. Details of this first phase of the reconstruction process can be found in References [
21,
22].
The second phase of the reconstruction process (the so-called “Post-Emergency Phase”) started in March 2013 and focused on the HC of L’Aquila and 56 surrounding municipalities. A new reconstruction model based on new procedures was necessary in order to deal with the reconstruction of old masonry building aggregates (i.e., groups of masonry buildings to form complex building agglomerates) with a cultural and architectural heritage value, located in the historical centers of L’Aquila and of others villages and small towns of the crater area. The reconstruction policy was regulated by Law 134/2012 [
23], which introduced a parametric model to determine the maximum public grant eligible to restore the usability of damaged buildings. Some extra public funds to preserve the cultural and architectural heritage value of historical buildings were also introduced [
24]. The management of this stage of the reconstruction process was conducted by two special offices: the Special Reconstruction Office of L’Aquila—USRA—for the reconstruction process of buildings in the historical centers of L’Aquila; and the Special Reconstruction Office of the Crater Municipalities—USRC—for the reconstruction process of buildings in the historical centers of other municipalities, divided into eight homogeneous areas with eight relevant reconstruction offices.
3. Accommodation Trends in L’Aquila City
The Civil Protection Department managed the assistance to people displaced after the earthquake until 31 January 2010, then the population assistance was handled by the Structure of the Deputy Commissioner for Reconstruction and, since 31 August 2012, this task was in charge of the municipality of L’Aquila.
In the immediate post-earthquake period, emergency accommodations for people left homeless included tents, usable private houses, and hotels (especially those located on the Adriatic coast, 90 km far from L’Aquila).
In a second stage, several forms of assistance involved people who lived in lightly or heavily damaged buildings. For people in slightly damaged buildings (B or C usability rating) the accommodation forms were: hotels in the Abruzzo municipalities or temporary housing in the Army barracks and Guardia di Finanza academy (i.e., tax and customs police offices) located in L’Aquila (namely, hotels and public accommodations in the following); financial assistance for own accommodations (namely, s.a.g. in the following); or rent-controlled apartment (namely, r.c.a. in the following). M.A.P. modules and C.A.S.E. project buildings hosted people who lived in heavily damaged buildings.
The closure of tent camps ended in November 2009 and the possibility to take advantage of forms of assistance financed by the government was then given to specific categories: people who lived in unusable buildings or those located in the “Red Zone”.
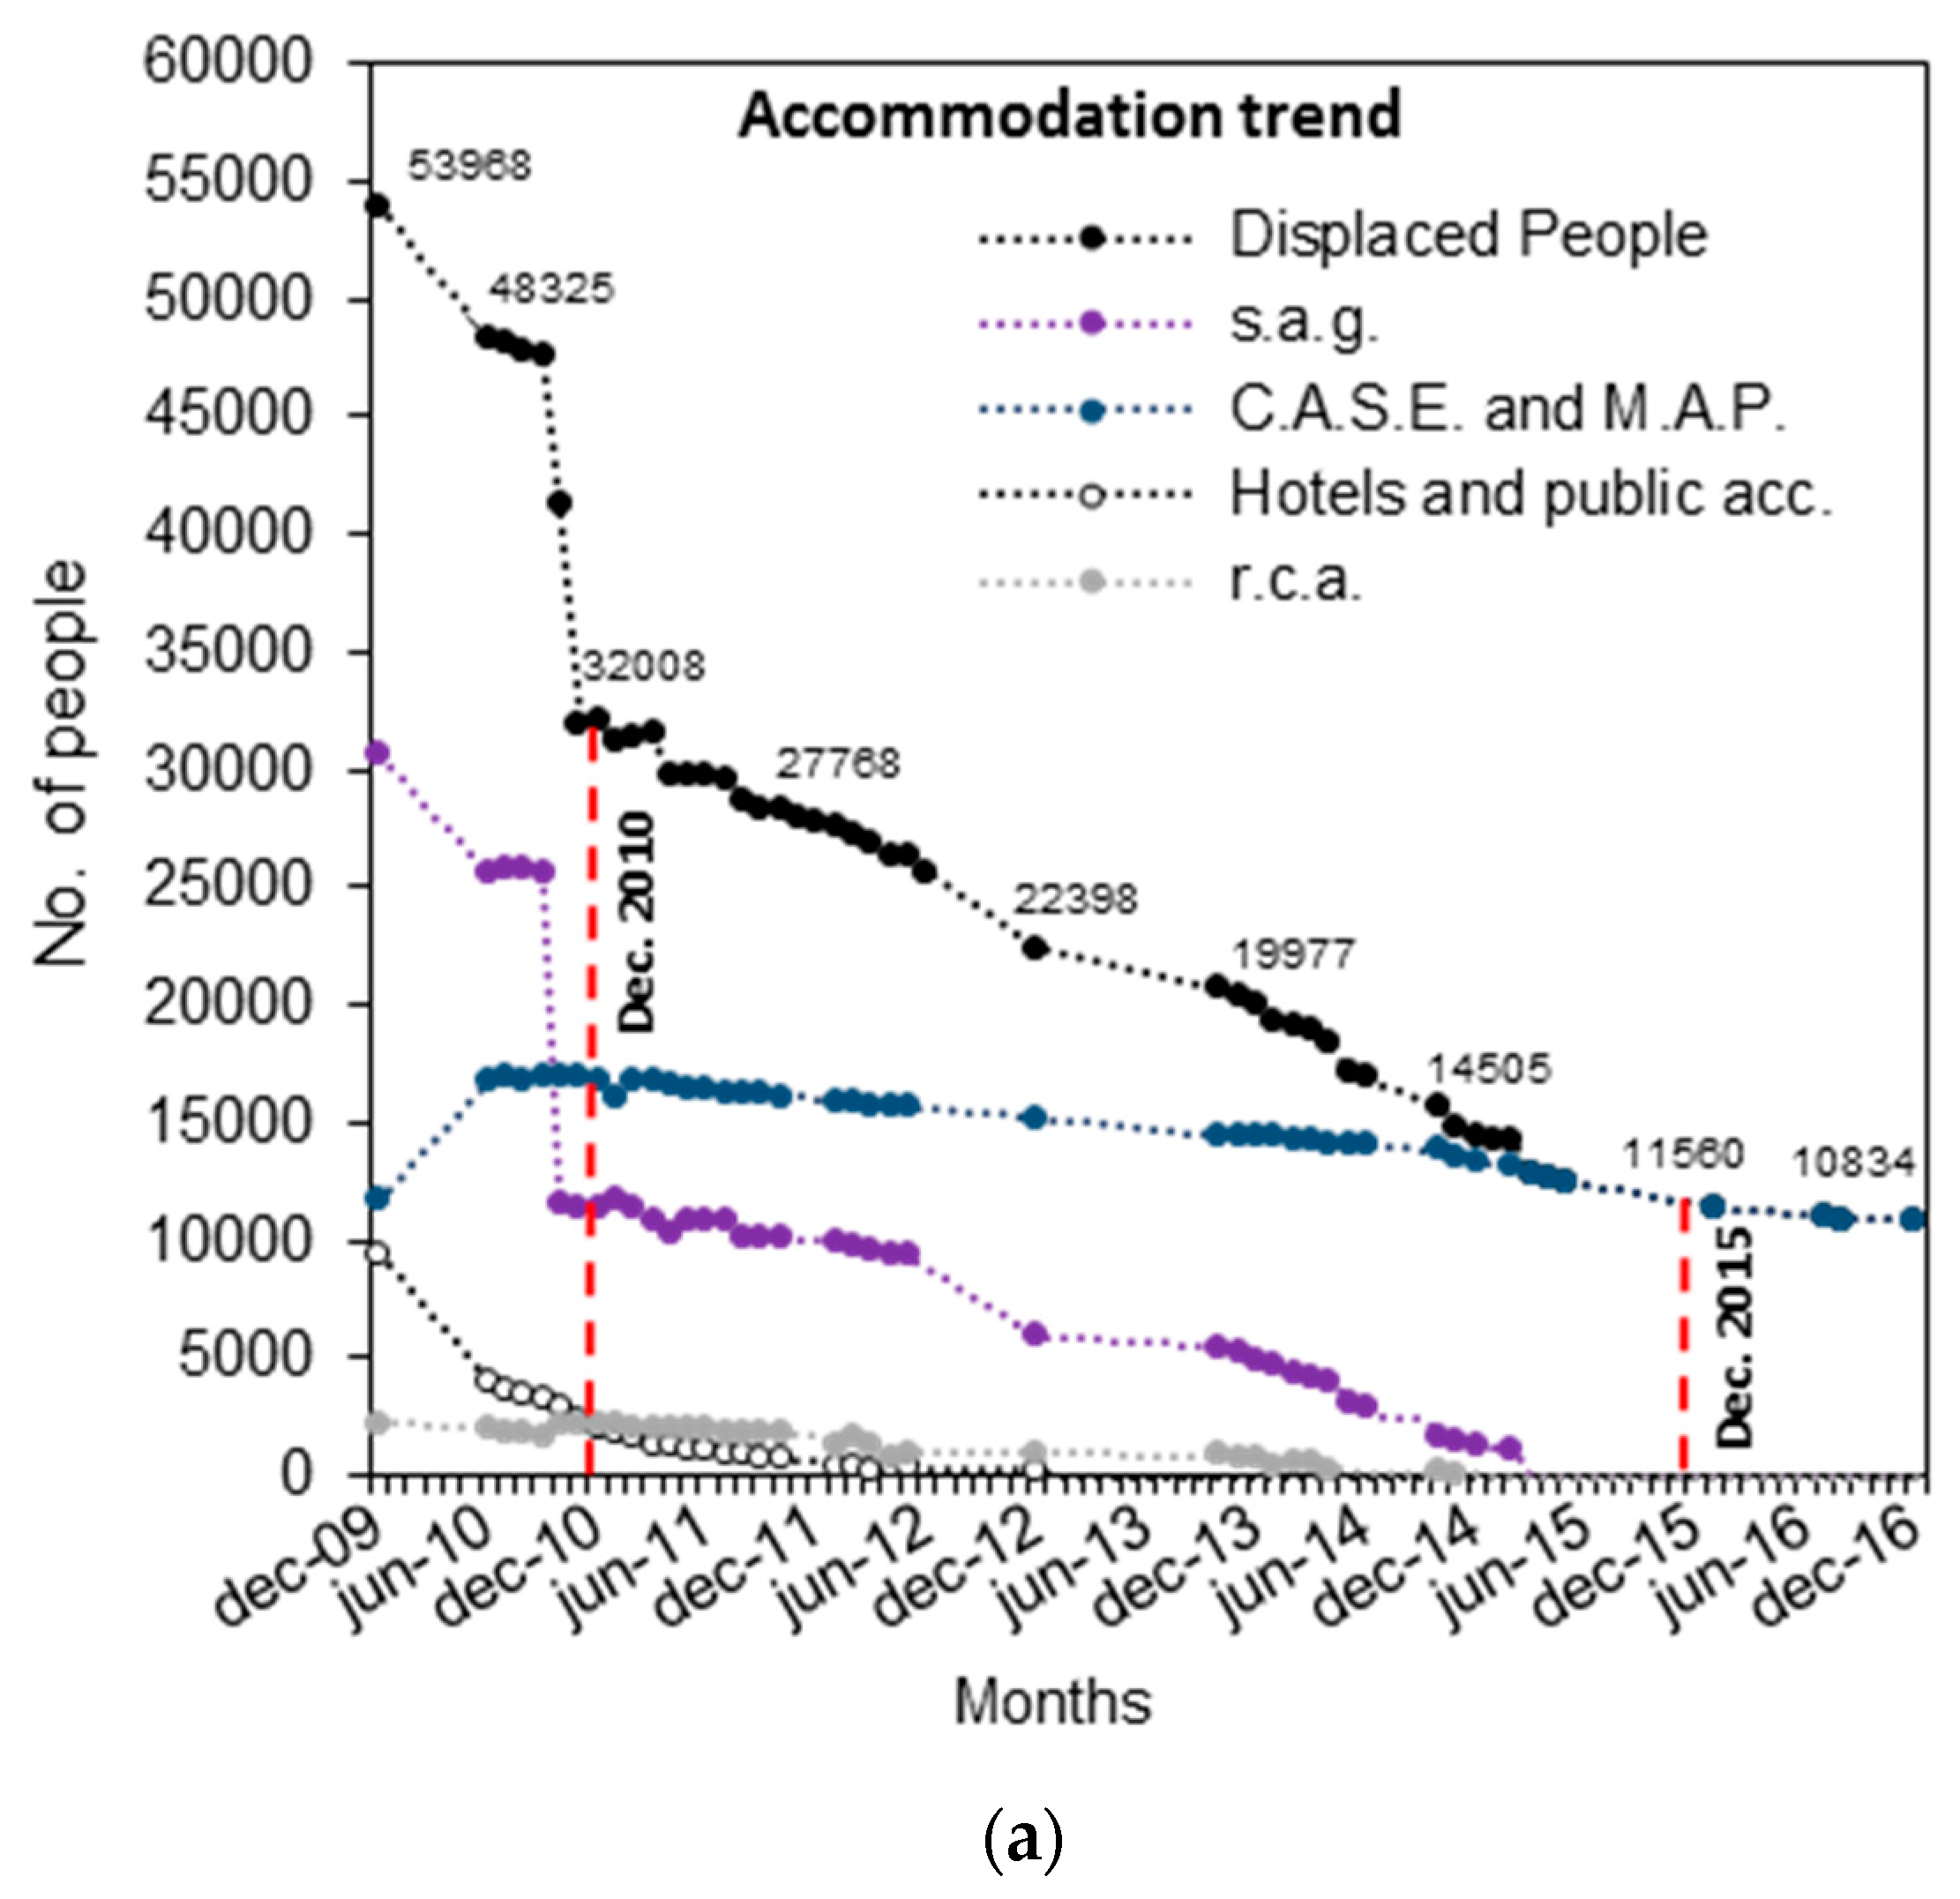
The population assistance trend is reported in
Figure 3a, starting from December 2009 (first dwellings available in C.A.S.E and M.A.P. projects) until December 2016. Data were retrieved by proper offices of the Civil Protection Department and of the Municipality of L’Aquila.
Figure 3a reports people in need of assistance and the type of accommodation provided by the government.
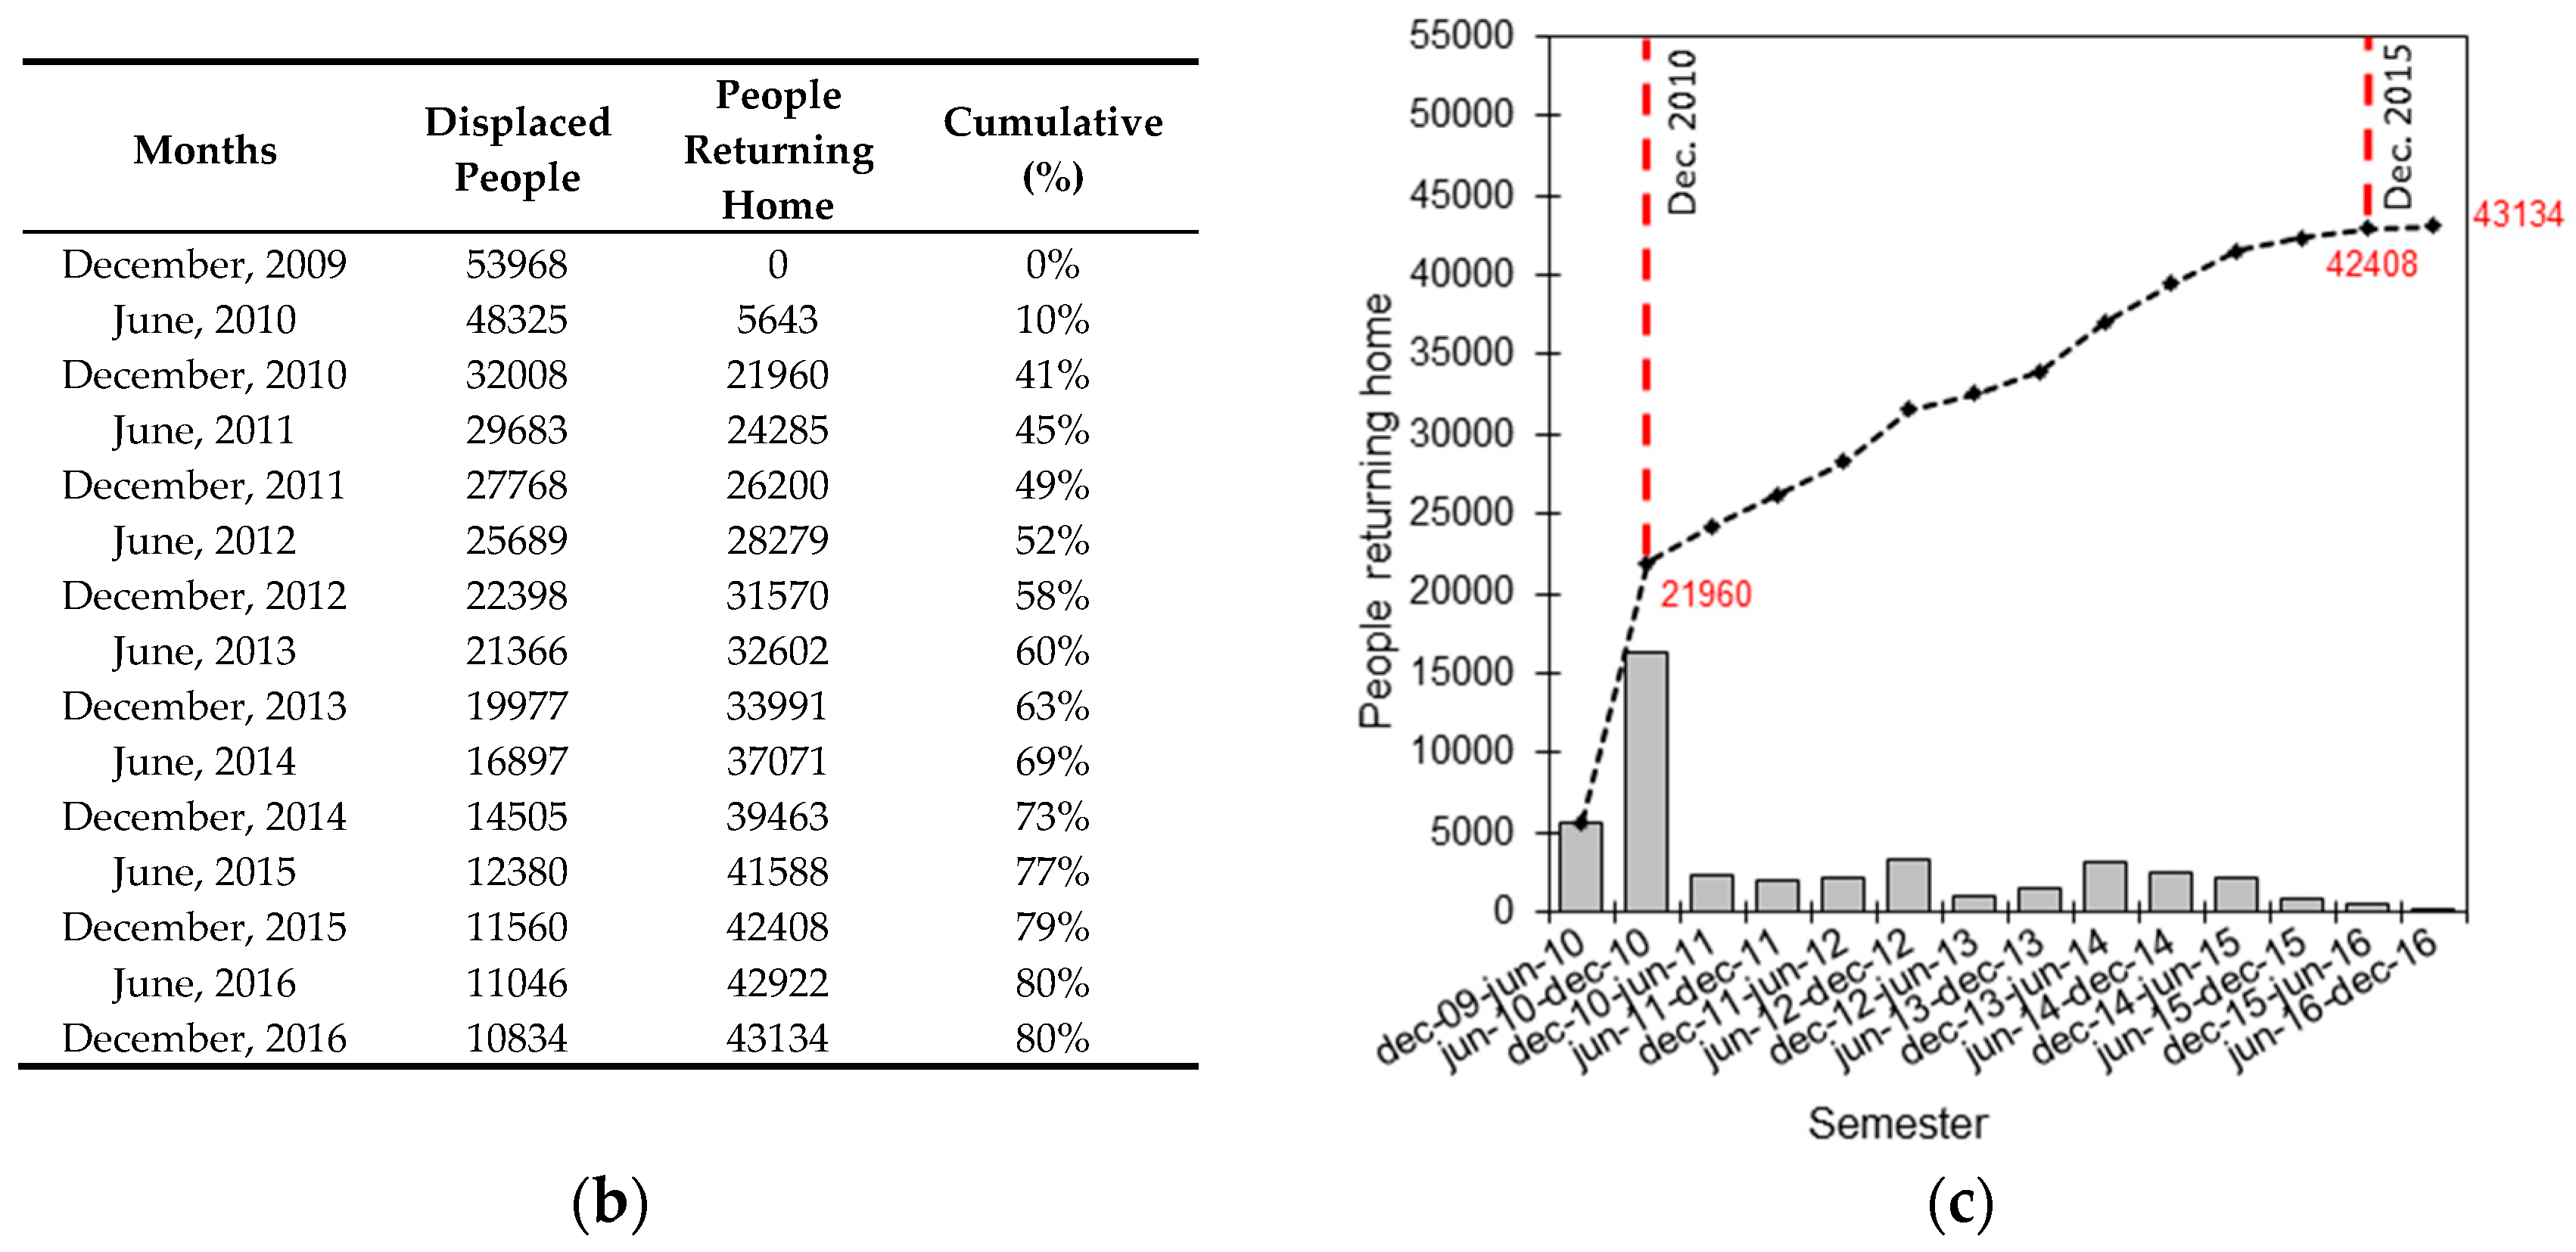
Figure 3a shows that in December 2009, the number of displaced people needing assistance was 53,968:30,636 people assisted with s.a.g., corresponding to 57% of the displaced people; 11,685 (i.e., 22%) in C.A.S.E project and M.A.P. modules; 9406 (17%) hosted in hotels or public accommodations; and 2241 (4%) in r.c.a. The table reported in
Figure 3b shows the number of displaced people needing assistance at every six months starting from December 2009. The people returning home (assumed as people without any form of assistance) as well as the relevant cumulative percentage is also summarized in this table.
Figure 3c depicts the trend of people returning home from December 2009 to December 2016.
Hospitality in hotels, which was the most expensive accommodation form, initially involved 9406 people who quickly decreased from December 2009 as soon as other accommodation forms were available. The assistance for accommodation in hotels or public structures involved 2052 people in December 2010 (i.e., about 22% of the initial people) (
Figure 3a). Only in few and particular cases was the hotel accommodation held (for elderly people and families with specific problems) until December 2012.
The initial number of 30,636 people benefiting from s.a.g. strongly decreased in the period of December 2009–December 2010 to 11,432 people, corresponding to about 37% of the initial number. In particular, in August 2010 the criteria to take advantage of a form of accommodation subsidized by the government changed and, after an extensive audit carried out to verify stated requirements, there was a strong decrease in the number of people benefiting from s.a.g. It is stressed that some of the people were switched from s.a.g. to C.A.S.E project buildings and M.A.P. modules as these solutions become available. A negligible variation was recorded in terms of people benefitting from r.c.a. in the period of December 2009–December 2010; its number reduced from 2241 to 2189.
The works related to the C.A.S.E project and M.A.P. modules started in June 2009 and were completed on 19 February 2010. Since September 2009, an average of 300 dwellings per week was delivered; in December 2009 (seven months after the earthquake), the percentage of C.A.S.E. and MAP occupancy was 70% of its capacity, with 11,685 people hosted. The maximum number of people hosted in C.A.S.E. project buildings and M.A.P. modules was recorded in the period of June–December 2010 with an average of about 16,850 people, including a peak of 16,992 during July 2010; after December 2010, the trend gradually decreased (
Figure 3a).
The data reported in
Figure 3b,c show that the number of displaced people in December 2010 was 32,008, corresponding to a reduction by 21,960 people compared to the initial number in December 2009. This means that the adopted reconstruction policy allowed 41% of the displaced people of L’Aquila city to return back home within one year and eight months after the earthquake. This result is consistent with data related to the reconstruction process of private buildings outside the historical centers [
21]; in fact, about 90% of the 9439 applications for the corresponding 2904 residential buildings with usability rate B or C funding had been approved and granted by September 2010. Thus, it is reasonable that in December 2010, most of works to repair slightly damaged buildings were ended and people who lived in those buildings before the earthquake could return to their own homes. It is noted that a marginal effect may be due to the resizing of the “Red Zones” in that period, which allowed a little area of the city to return to its habitable state.
In the period of December 2010–December 2015, the number of people benefiting from s.a.g., r.c.a., and hotels and public accommodations decreased from 11,432, 2189, and 2052, respectively, to zero. In December 2015, the number of people hosted in C.A.S.E. project buildings and M.A.P. modules became equal to 11,560.
Therefore, as depicted in
Figure 3b,c, the total remaining displaced people was 11,560 in December 2015, indicating that 20,448 people returned home between December 2010 and December 2015. Thus, starting from December 2009, a total number of 42,408 people, corresponding to about 80% of the total number of displaced people in L’Aquila, returned home.
The trend of people returning home from December 2010 to December 2015 mostly depended on the conclusion of the heavy damage reconstruction process of private buildings of L’Aquila municipality outside the historical centers. In particular, the “heavy damage” reconstruction phase of residential buildings with usability rating E involved 8906 applications for funding, corresponding to 1951 buildings. The financial grants related to buildings with usability rating E were allocated for about 74% of the buildings within September 2013 [
22]; thus, it is reasonable to believe that the repair/strengthening interventions on these buildings had ended by December 2015.
As anticipated, since December 2015, the number of displaced people became equal to that of people living in C.A.S.E. project buildings and M.A.P. modules. In December 2016, the number of displaced people was 10,834, corresponding to about 20% of the original displaced population in December 2009. The total number of people returning home reached 43,134, see
Figure 3c.
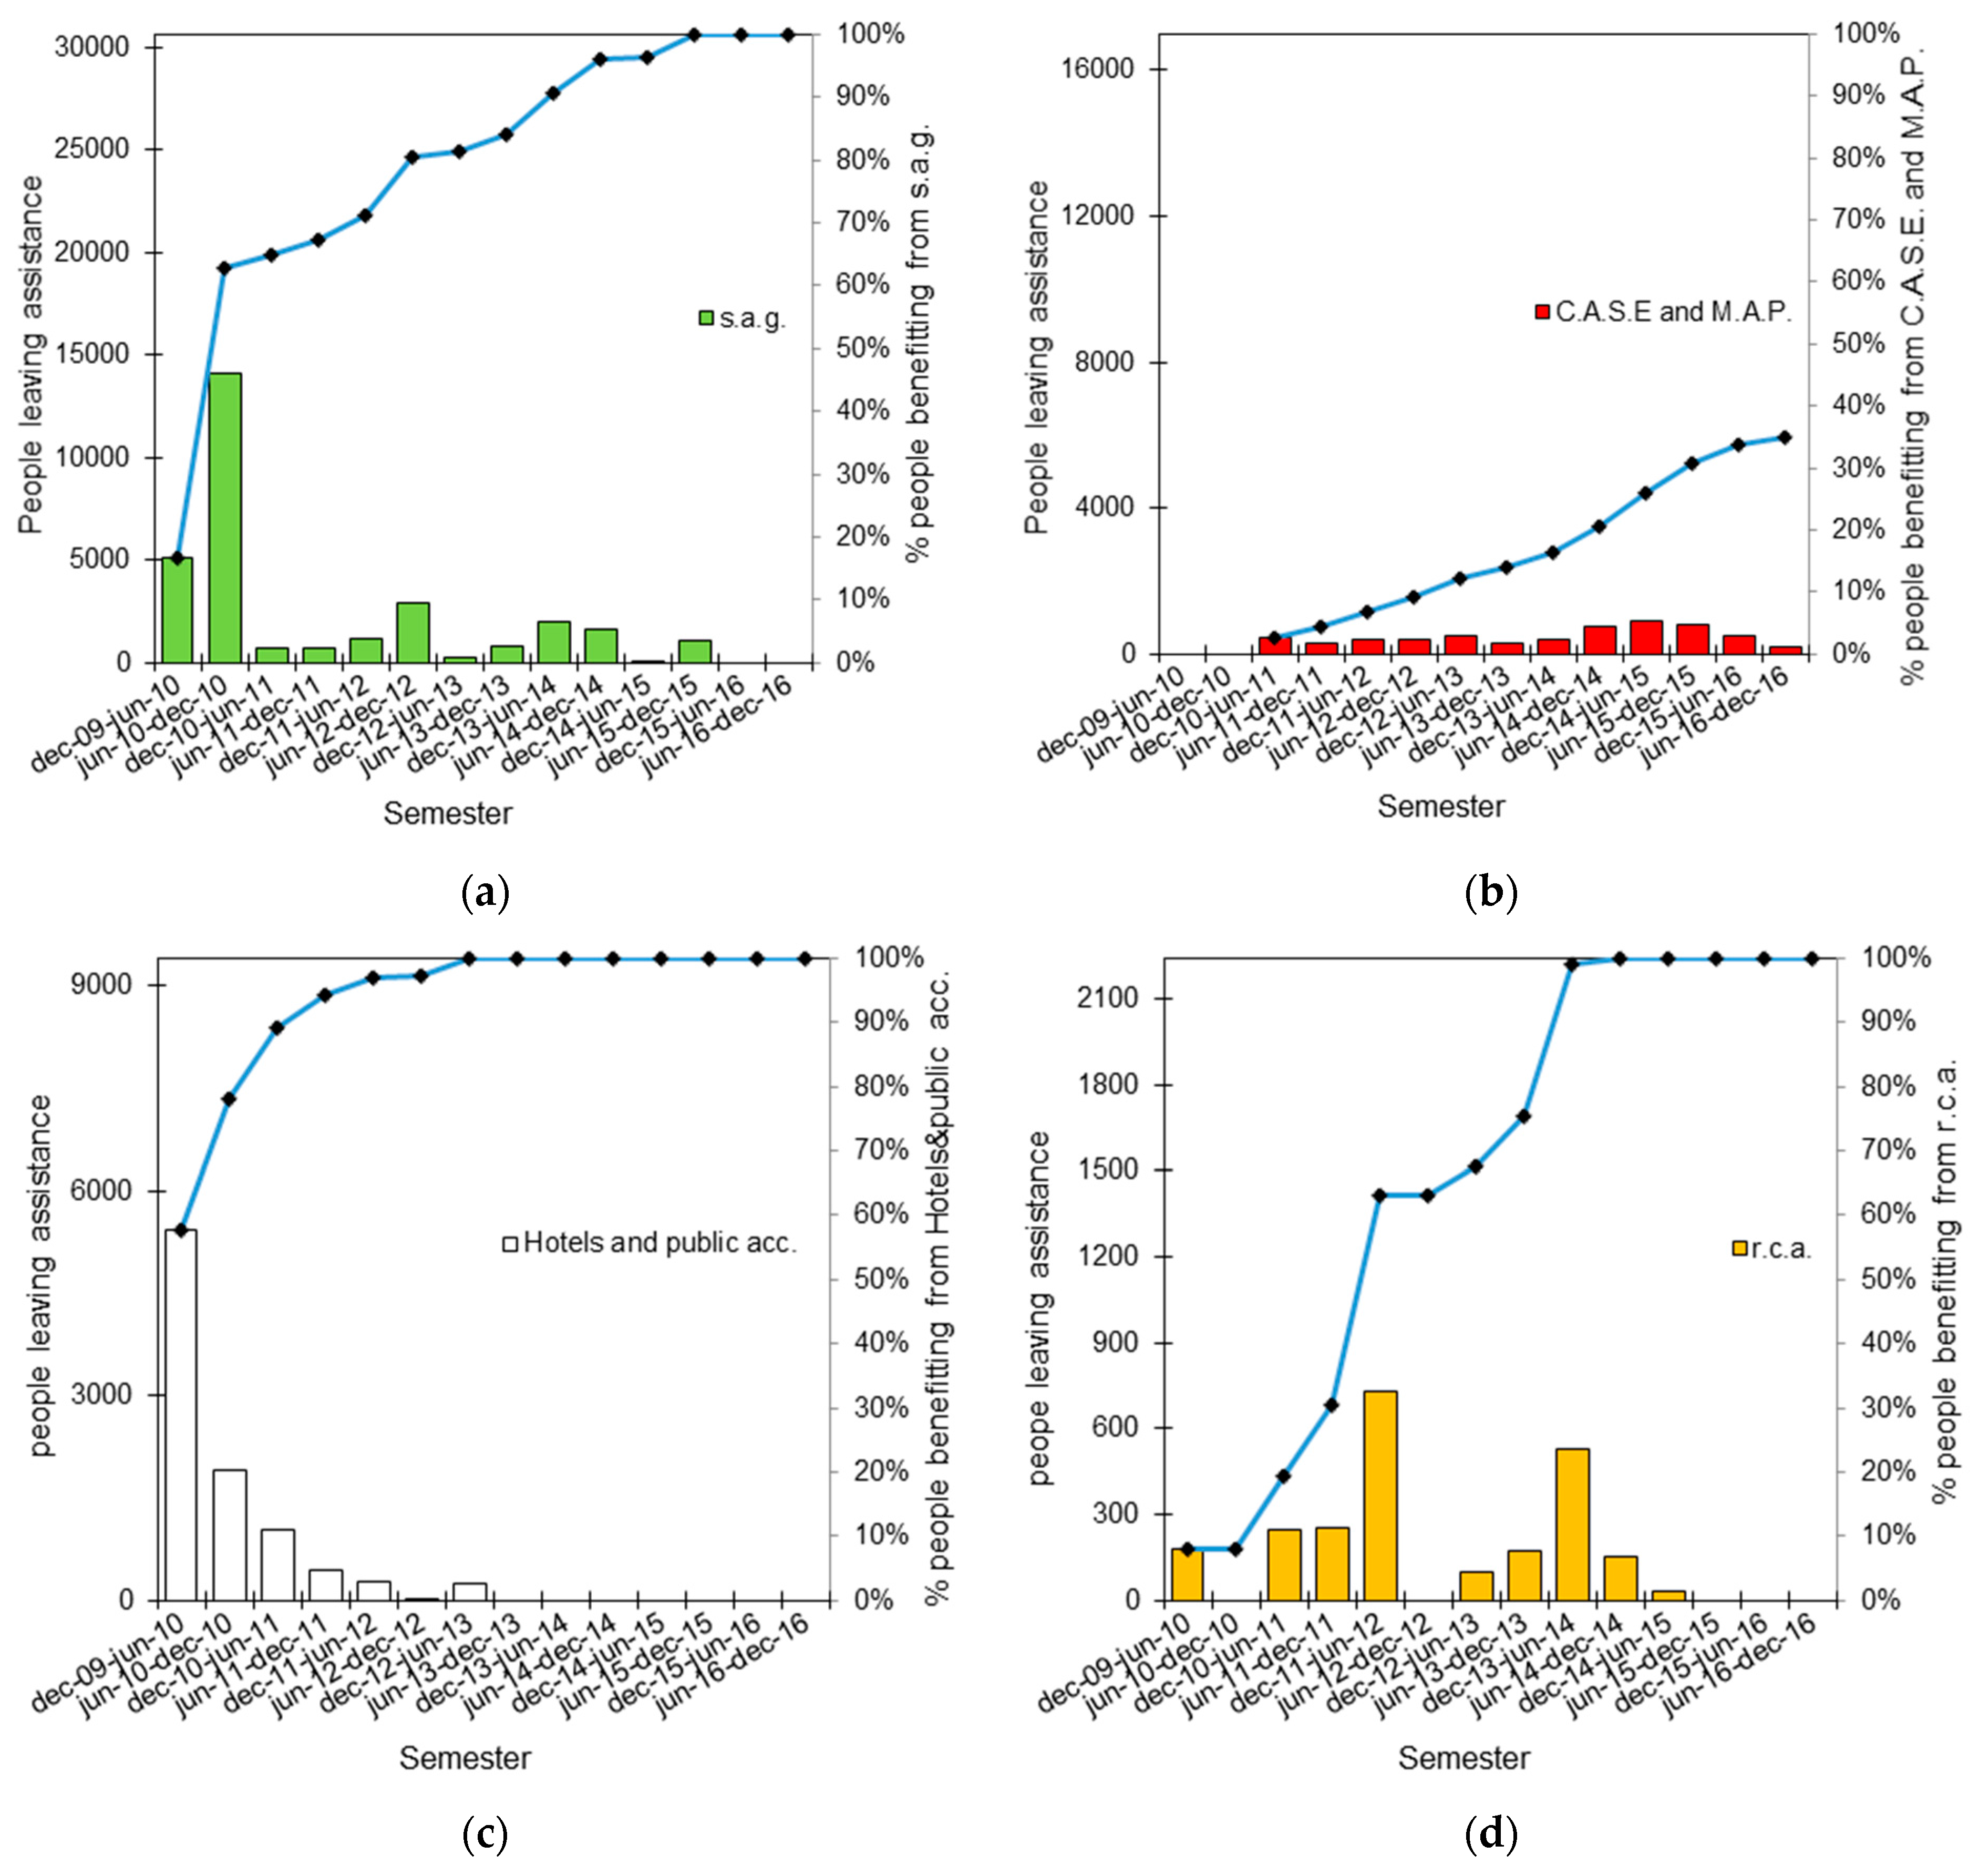
Figure 4 shows the trend of people leaving assistance in terms of s.a.g., C.A.S.E. project buildings and M.A.P. modules, hotels and public accommodations, and r.c.a., respectively. The graphs show, for each semester in the period of December 2009–December 2016, the number of people that left a specific assistance type. Note that people leaving a form of assistance do not necessarily returned home, but may be also simply assisted by another kind of accommodation. In each graph of
Figure 4, the cumulative percentage trend of people leaving assistance is also reported; the percentage is computed with reference to the peak of people benefitting from each assistance form: 30,636 for s.a.g.; 16,992 for C.A.S.E. project buildings and M.A.P. modules; 9406 for hotels and public accommodations, and 2241 for r.c.a.
The graphs of
Figure 4 clearly show that hotels and public accommodations as well as s.a.g. were mainly left in the first year under investigation (December 2009–2010). In particular, in December 2010, 78% of the maximum number of people hosted in hotels and public accommodations and 63% of those recorded in s.a.g. left their accommodations. The r.c.a assistance form mostly ended in December 2014, while the assistance in C.A.S.E. project buildings and M.A.P. modules is currently ongoing. It is noted that, since 2015, the C.A.S.E. project has also been used as social housing [
25] and hosts people who need a house for several reasons, even without a direct relation to the consequences of the earthquake (i.e., low-income people, young families, students, and others). Without official data, it has been estimated that in December 2016, the number of people assisted for economic reasons was about 10% of the total population of C.A.S.E. and M.A.P. settlements. In December 2016, the dwellings in such structures hosted 10,834 people (8624 in the C.A.S.E. project and 2210 in M.A.P. modules).
4. Reconstruction Process and Population Returning Home
The return of people to their homes is one of the main goals of the activity promoted and funded by national and local institutions after an earthquake. In this context, it is essential to evaluate the effectiveness of the actions taken by all institutions contributing to the reconstruction phase, through an indicator that expresses the progress of the reconstruction process. For the selection of this indicator, it is possible to refer to a wide range of economic and social parameters (funds granted for reconstruction, the number of open/ended construction sites, etc.). In order to consider an easily identifiable factor by all stakeholders, the attention is herein focused on the number of people able to return, at any given date, to buildings repaired and strengthened or rebuilt. The previous section showed the general trend of the population benefiting from assistance in the municipality of L’Aquila after the earthquake in the period of December 2009–December 2016. The type of assistance and the variation of people benefitting from a given assistance type have been discussed. This also allowed for the determination of preliminary information on the trend of people returned home (i.e., assumed as the variation of people needing assistance). However, such a general trend only marginally allows for the assessment of the impact of reconstruction process choices on the people returning to their homes. Indeed, those data refer only to the population housed in the various forms of assistance by the government, without any information about the location, characteristics, and damage of the buildings where displaced people lived before the earthquake. By contrast, this section aims to illustrate the impact of the reconstruction process on the population returning home. Therefore, the analysis goal is to illustrate the relationship between the reconstruction data (i.e., location of damaged buildings, duration of repair/strengthening works or demolition and reconstruction works, beginning and end of works) and the relevant people that had returned home. To this aim, data collected from different databases related to the reconstruction process have been merged and analyzed. In particular, by initiative of the Deputy Commissioner for Reconstruction, a database was created to collect data and documents related to the funding request applications and relevant approved grants for damaged buildings as well as the time of the beginning and end of works.
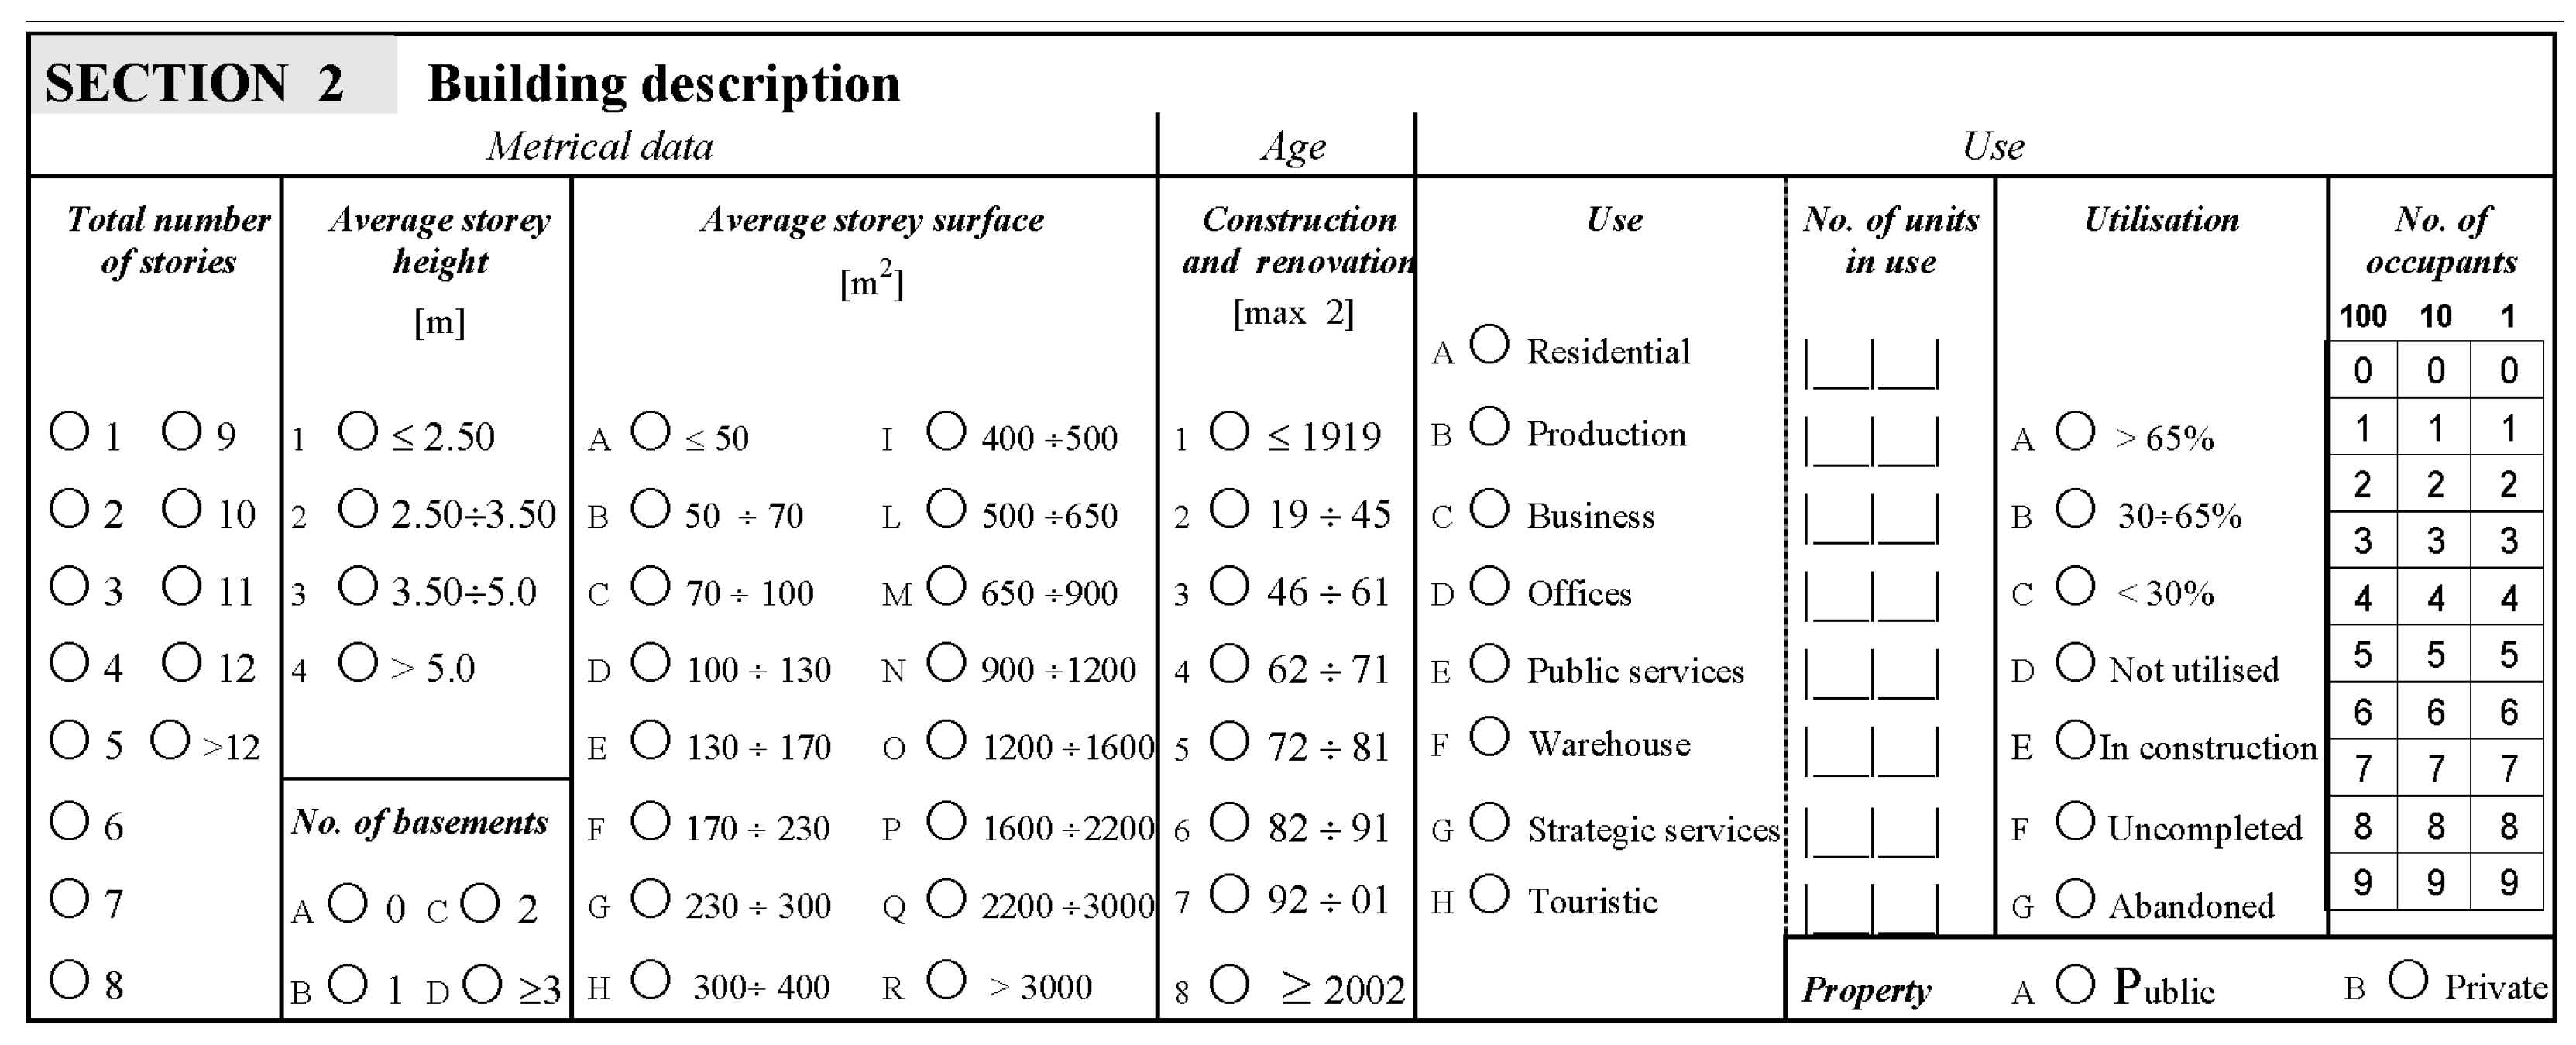
In order to link the end of repair/strengthening or rebuilt works on damaged buildings to the number of people who returned to their homes, two approaches were initially adopted based on the estimation of: (i) the number of occupants of buildings (i.e., people occupying the buildings according to data collected in
Section 2 of the AeDES form [
15],
Figure 5); (ii) residents in buildings according to data retrieved from the National Institute of Statistics (ISTAT) census section [
26].
Section 2 of the AeDES form provides information about the geometry of the building (number of stories, average story height and surface), construction age, the use of the building, and the number of occupants. The estimated number of occupants of each building refers to the average number of people that, before the event, occupied the building with continuity for business or residence.
The data collected by ISTAT gives information on the number of buildings and relevant residents for each census section of the city of L’Aquila (852 census sections throughout the municipal area). For the purposes of this study, the 2001 census data were used, because the 2011 data are strongly affected by the reconstruction process effects (temporary displacement of the population in C.A.S.E. and M.A.P. projects or in other temporary accommodations, waiting for repair of buildings, etc.).
After the earthquake, the residential unusable buildings (B/C and E usability rating) of L’Aquila numbered 10,860 both inside and outside the historical centers: 3954 with B or C usability rating (36% of the dataset of unusable buildings) and 6906 with E usability rating (64% of the dataset of unusable buildings), see
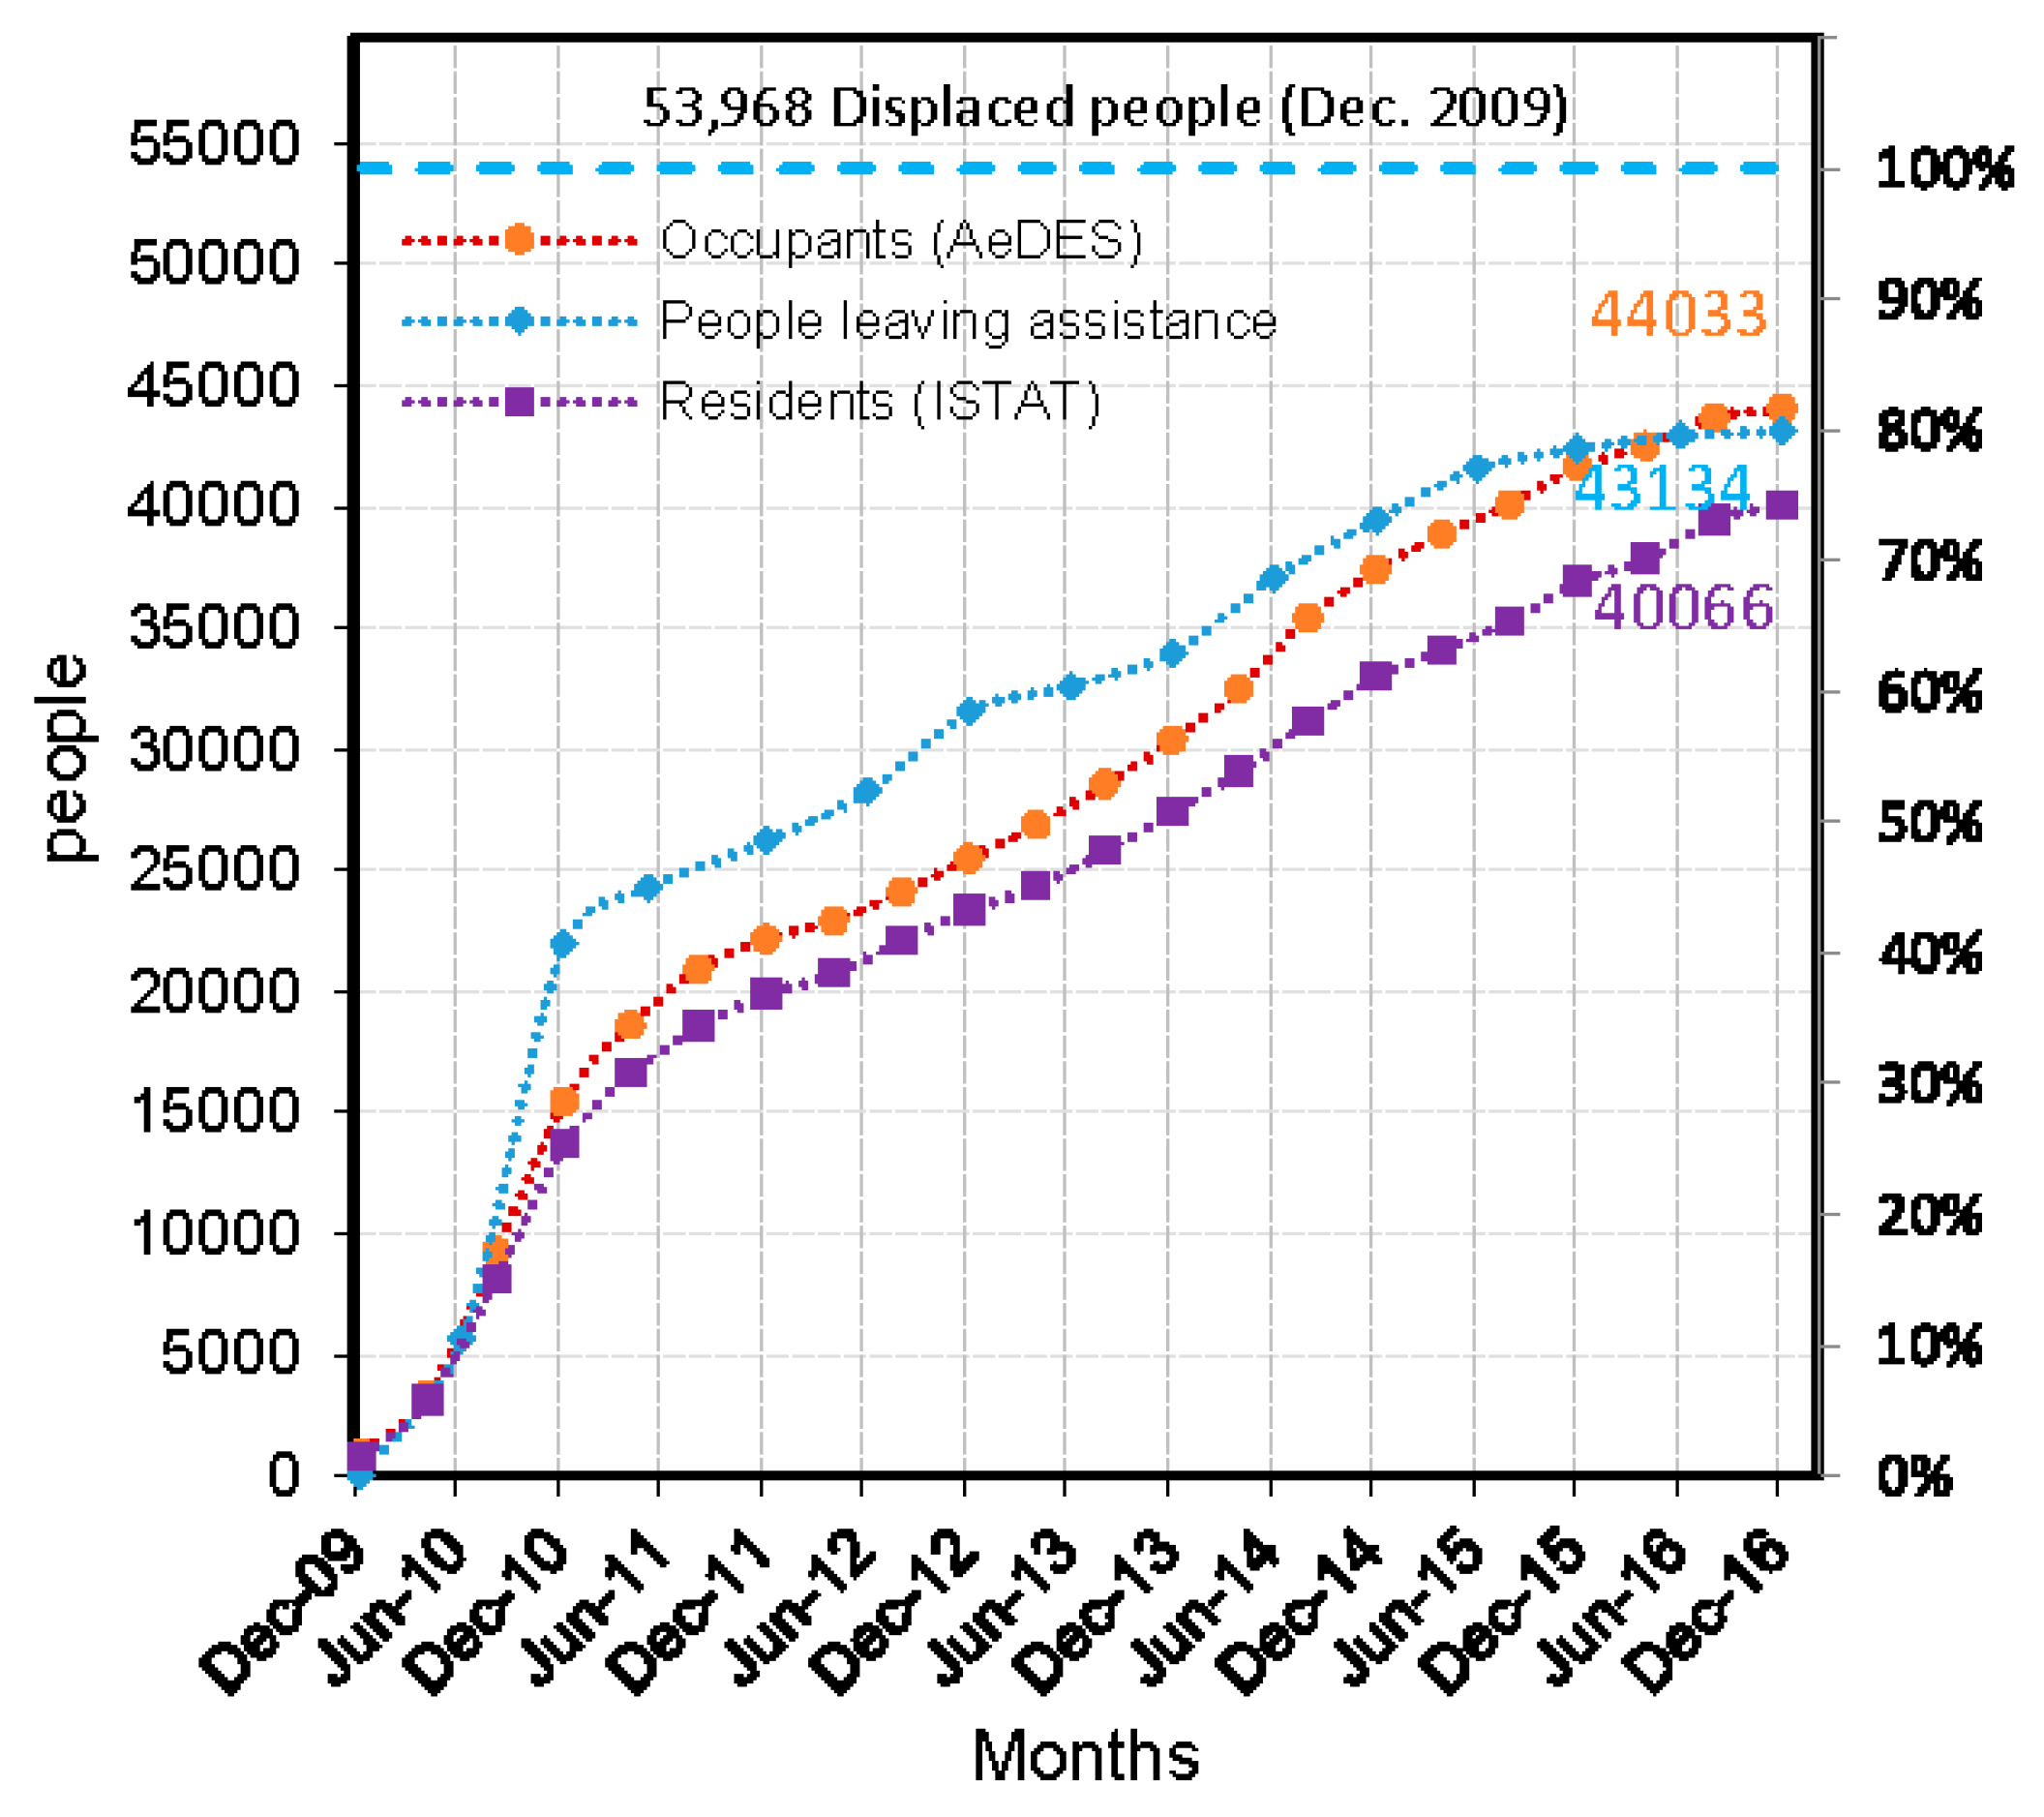
Figure 2. The trend of people returning home from December 2009 to December 2016 was computed and is reported in
Figure 6 according to data related to the end of repair/strengthening works (or demolition and reconstruction) on damaged unusable buildings and to the number of occupants or residents given by AeDES and ISTAT source data.
It was assumed that all the occupants reported in
Section 2 of AeDES returned to live and/or perform their business in the same building once the usability of the structure had been restored (i.e., end of repair/strengthening works, or demolition and reconstruction), as detailed analysis of what happened to individuals before returning home based on individual interviews is beyond the scope of this study.
The number of residents returning home was computed by identifying each building through the aggregate identification code in a base map GIS (represented by the regional technical map with data according to census section perimeters). Then, an average number of inhabitants per building was determined as the ratio between the number of inhabitants of its ISTAT census section and the whole number of buildings in that census section. Then, the number of residents returning home was obtained according to data related to the end of repair/strengthening/demolition and reconstruction works on buildings. For comparison purposes,
Figure 6 shows also the trends of people leaving assistance (i.e., returning home) computed according to data presented in the previous section. The analysis is made based on the assumption that the people in the repaired buildings are the same people who have left—that they returned home. While this may be true, but there appears to be no way of knowing whether the people are the same or not. Likewise, it appears that once a person exits a particular assistance mechanism, they are no longer displaced.
Figure 6 indicates that the number of people returning home was equal to 44,033 occupants; this number was equal to 40,066 if expressed in terms of residents. A slight difference, less than 10%, was found between data given by
Section 2 of the AeDES form and the ISTAT census. It is noted that the information provided by
Section 2 of the AeDES form suffer from uncertainty as they were acquired by interview. Furthermore, in the buildings used not only for residential purposes, the number of occupants also includes people normally occupying the building for business reasons; therefore, the number of occupants generally overestimates the number of residents. Despite these limitations, the number of occupants seems reliable since the estimated number of occupants returning in previously damaged buildings was also similar to that of people leaving assistance (44,033 versus 43,134, a percentage overestimation of about 2%). The three curves of
Figure 6 clearly show that a bilinear trend can be observed in the returning home trend: a first linear branch from December 2009 to December 2010 with a slope greater than the linear branch related to the period of December 2010–December 2016. This confirms the effectiveness of the reconstruction process that strongly takes into account the extent and severity of damage to define the strategy of interventions on the buildings. Although the ordinance regulating the reconstruction of heavily damaged buildings, OPCM 3790 July 2009 [
19], was issued only one month later than that related to lightly damaged buildings, OPCM 3779 June 2009 [
18], the opportunity given by latter ordinance to carry out repair and local strengthening interventions clearly promoted fast and effective solutions to speed up the usability recovery of lightly damaged buildings. Indeed, local strengthening could increase the seismic capacity of one or more under-designed components without affecting the overall response mechanism of the structure [
27,
28,
29]; it could require only the assessment of local components capacity increase, thus reducing the timing and costs of the intervention and consequently reducing public costs incurred in housing the homeless.
Figure 6 shows that about 80% of people displaced after the earthquake in L’Aquila had returned home by the time this paper was written.
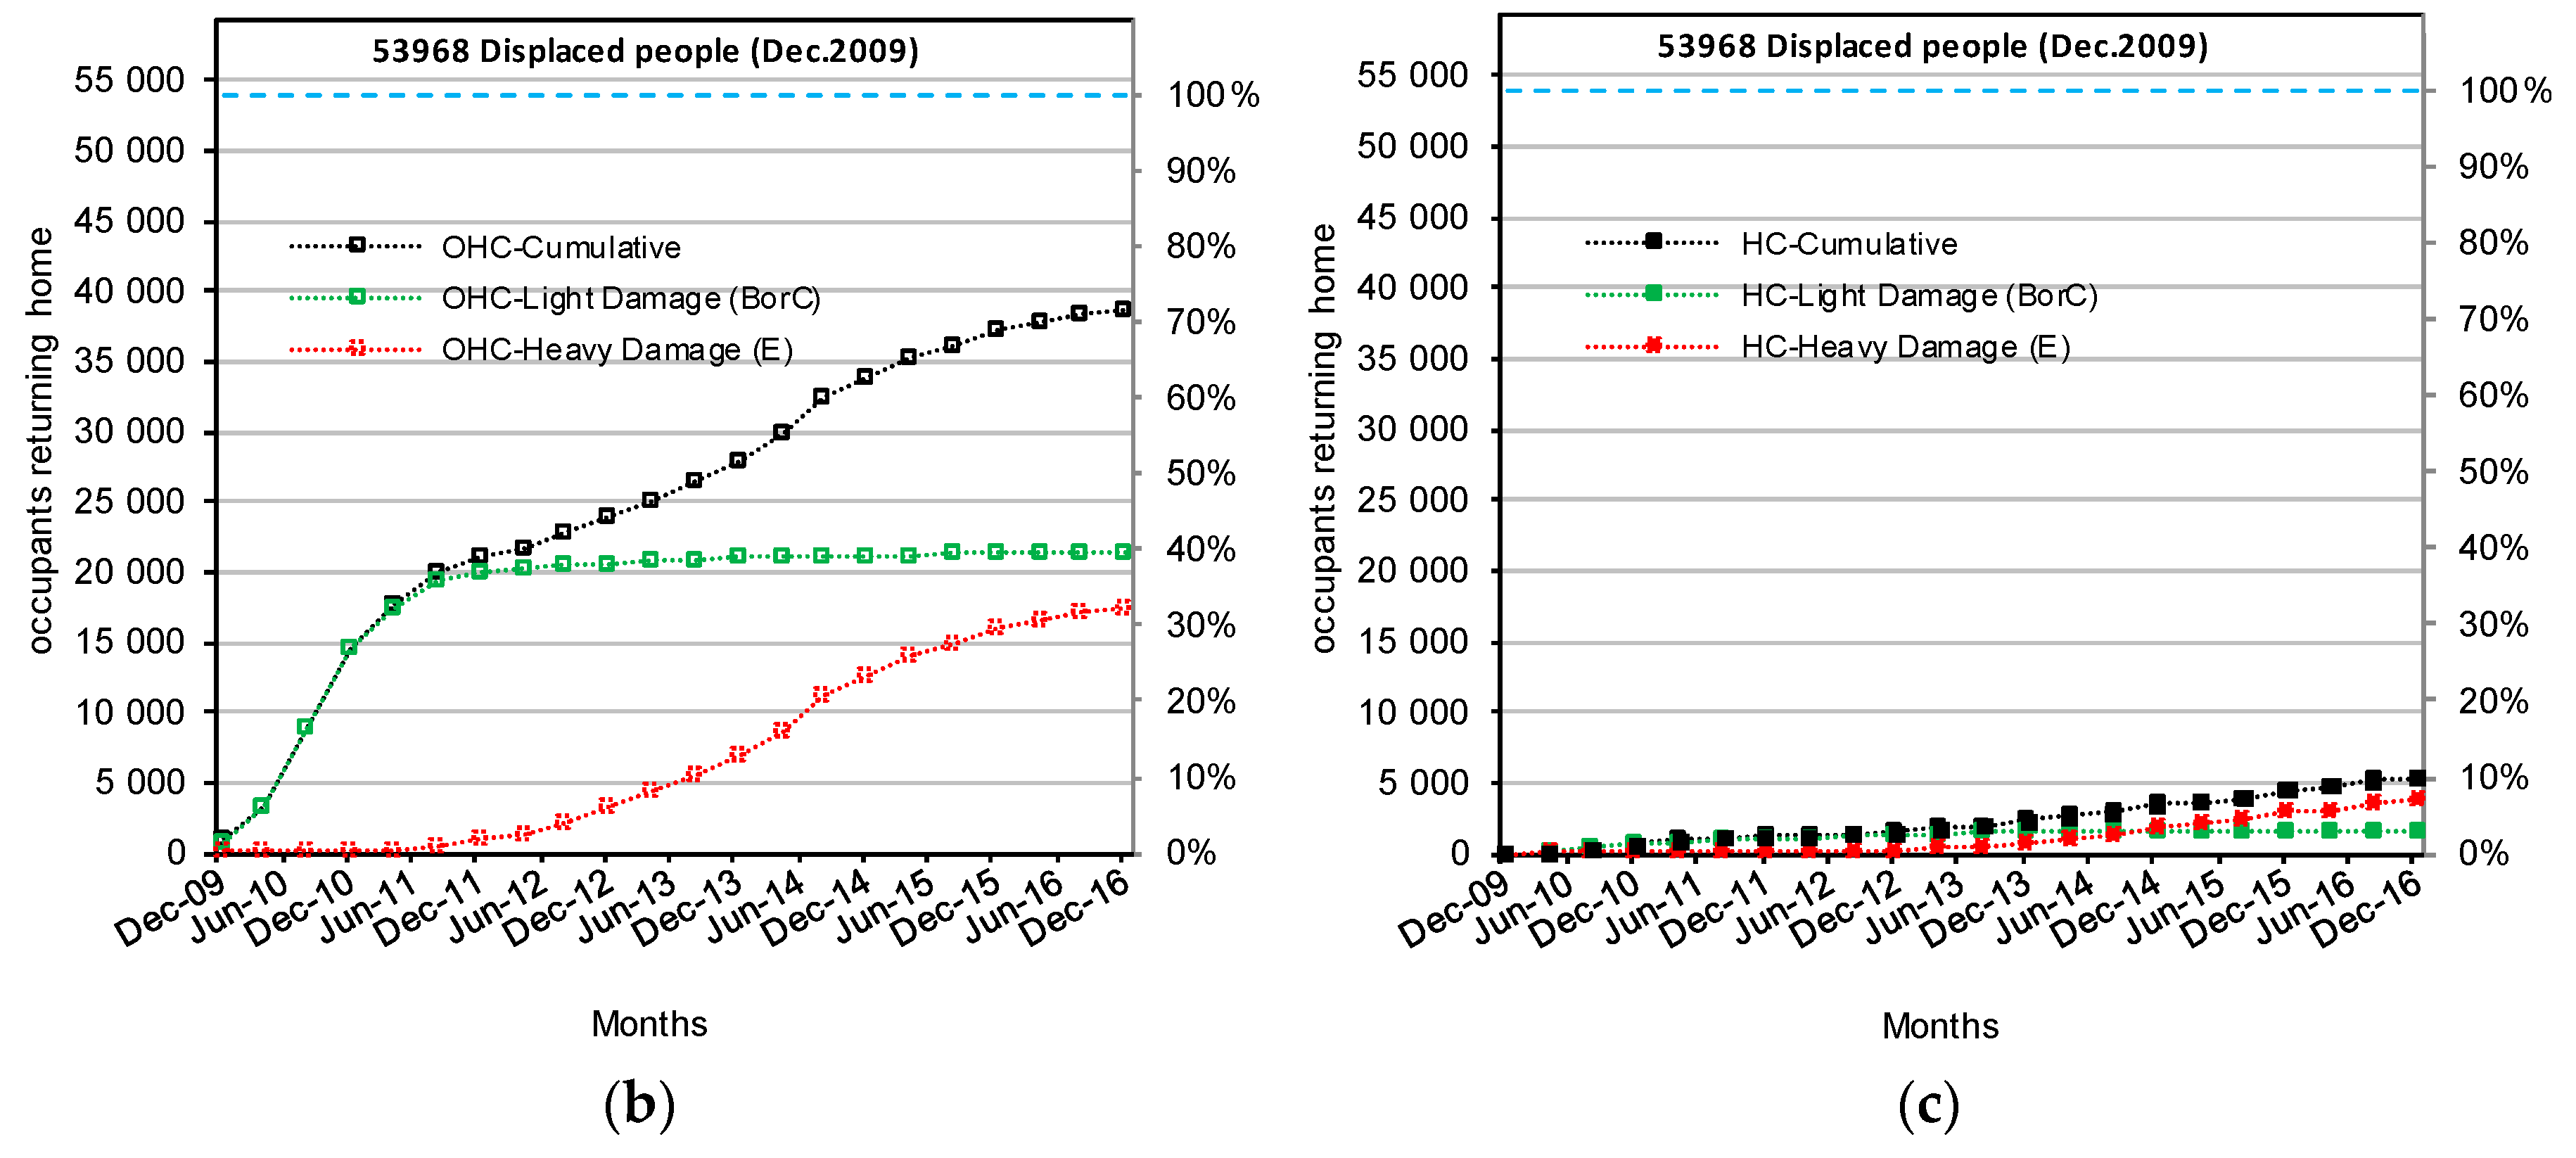
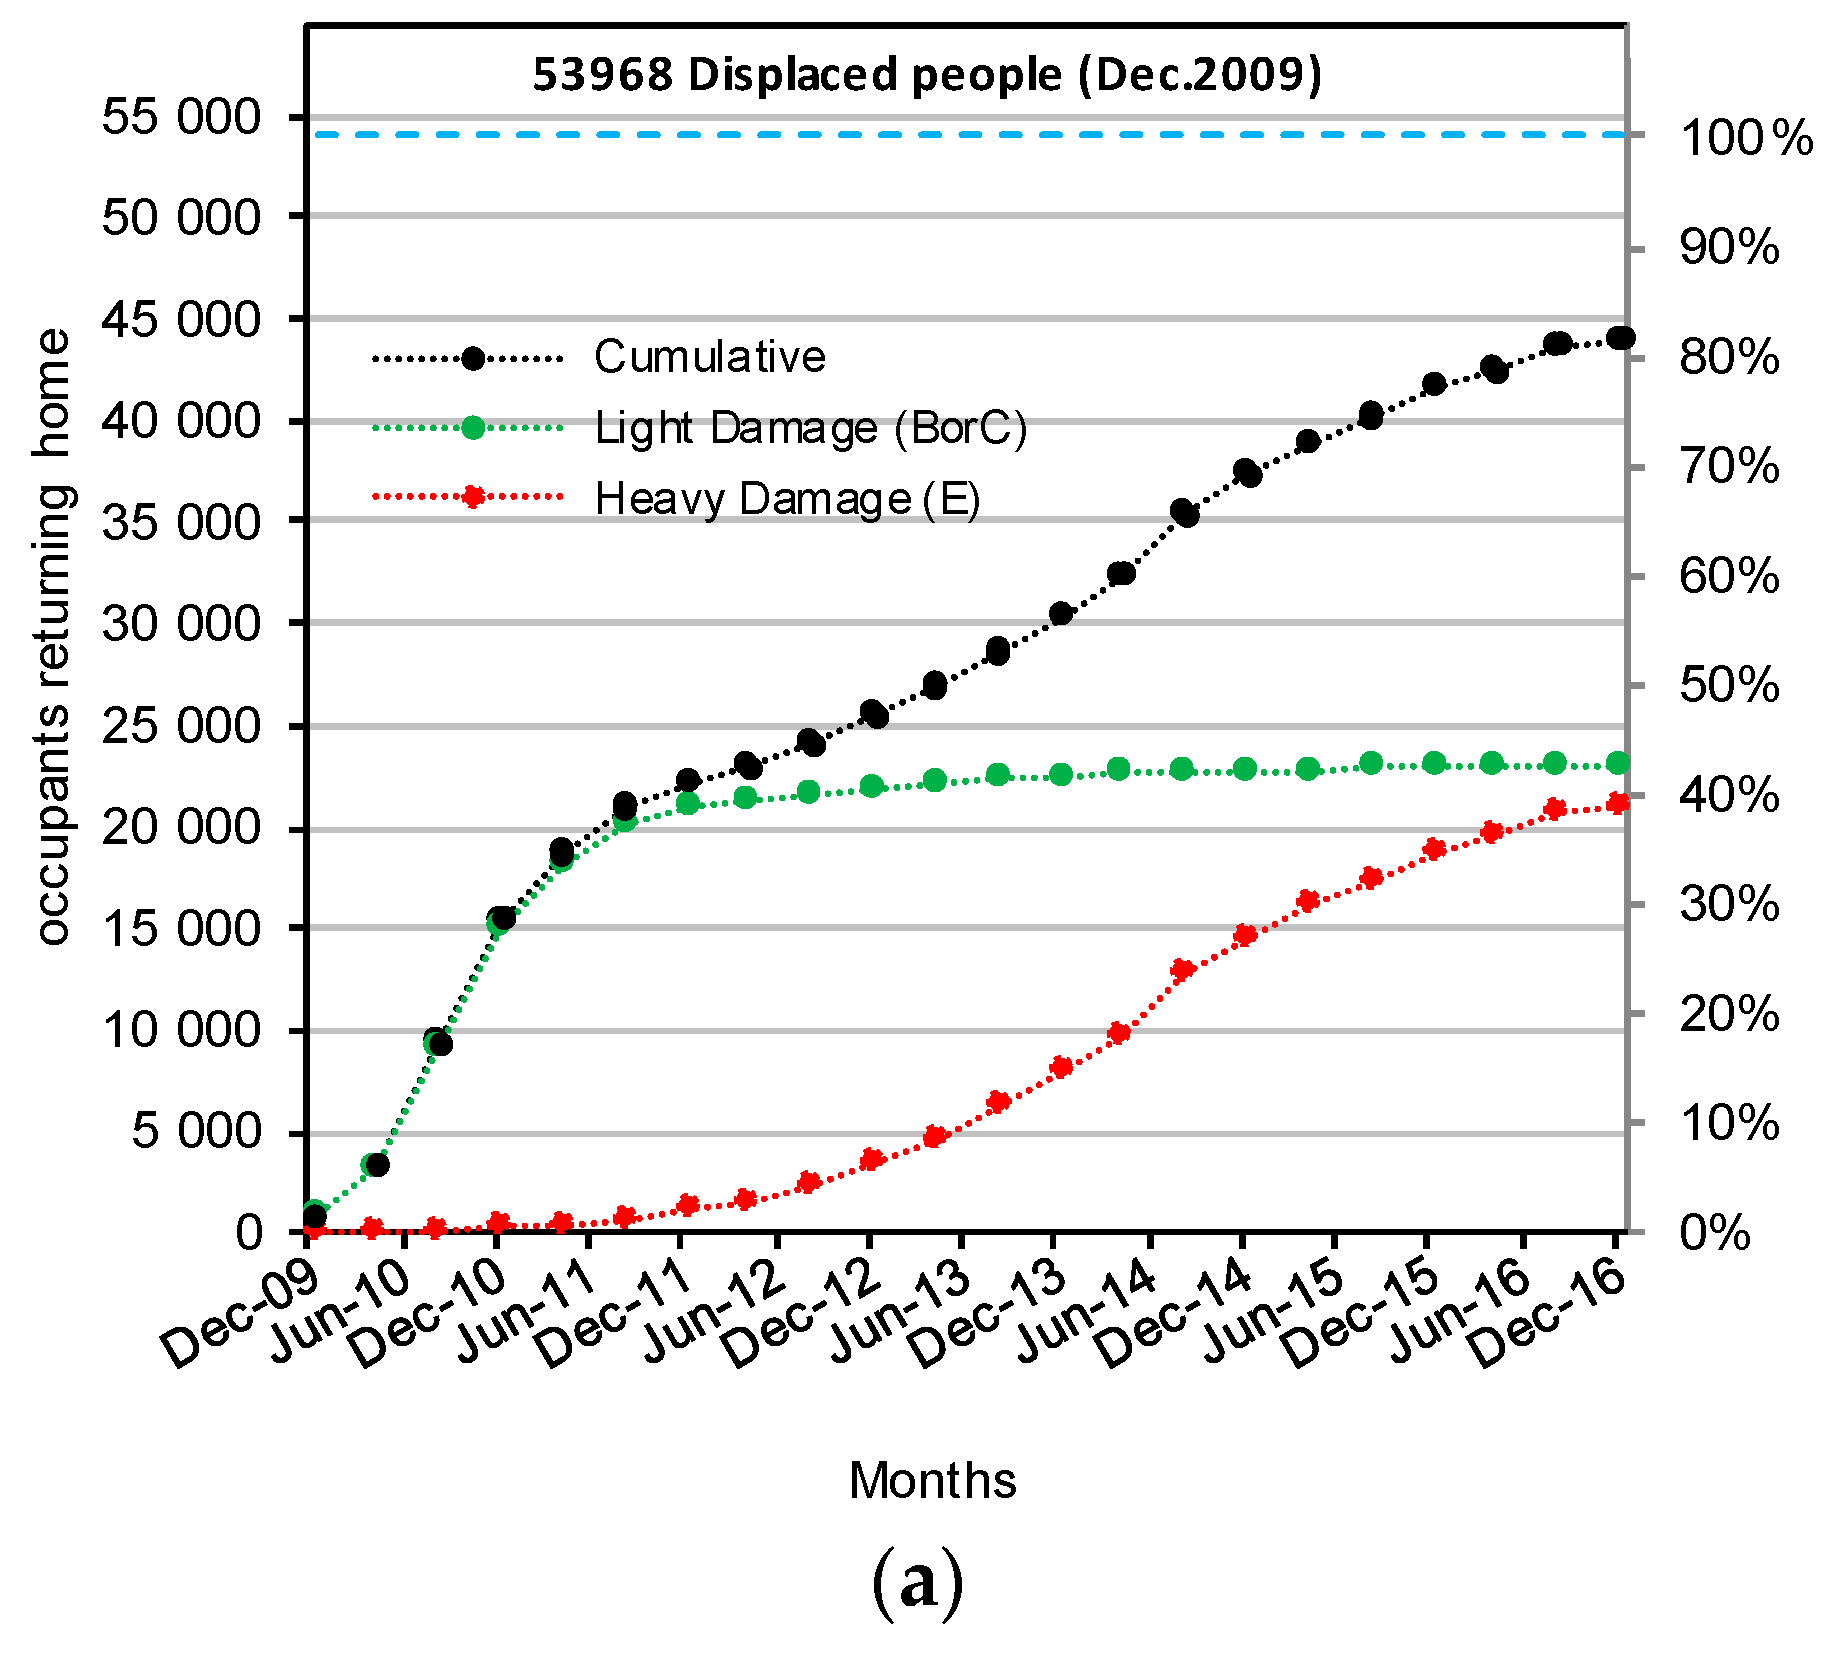
According to data provided by the AeDES form in terms of the number of occupants and usability rating of buildings,
Figure 7a shows the trend of occupants of buildings with light or heavy damage (i.e., B/C or E usability rating, respectively) returning between December 2009 and December 2016.
Figure 7a clearly shows that “light damage” reconstruction almost ended in December 2010, while the “heavy damage” reconstruction mostly started from December 2011. The total number of occupants returning home was 22,921 and 21,112 for buildings with light or heavy damage, respectively; they represent 82% (43% for lightly and 39% for heavily damaged buildings) of the initial number of displaced people (i.e., 53,968).
Figure 7a also shows that for buildings with a usability rating of B/C, the curve approaches a constant trend as time moves from the end of 2011 towards December 2016. The curve related to E rated buildings has indeed a different trend, probably due to the fact that a portion of heavily damaged buildings still needs to be repaired/rebuilt or because they are located in structural aggregates located in the historical centers. As previously mentioned, the reconstruction process of historical centers started in a second phase; in fact, the complex spatial and morphological structure of the territory required special rules for the reconstruction of historical centers. At the end of Filiera activity in March 2013, the management of this stage of the reconstruction process was assigned to two special offices: The Special Reconstruction Office of L’Aquila—USRA—for the reconstruction process of buildings in historical centers of L’Aquila, and the Special Reconstruction Office of the Crater Municipalities—USRC—for the reconstruction process of buildings in historical centers of other municipalities [
24].
Figure 7b,c show the trend of occupants returning home for buildings located outside historical centers (OHC) and inside historical centers (HC). The graphs show that the number of occupants returning home was 38,643 and 5390 for buildings OHC and HC, respectively (corresponding to about 72% and 10% of the whole set of occupants returning home, making up a total of 82% with respect to 53,968 displaced people).
A consideration can be made about the origin of the 10,834 people still benefitting from assistance at the end of 2016. According to ISTAT, the resident population in L’Aquila HC at the time of the earthquake was about 11,000 inhabitants; as mentioned above, 5390 of these returned home by December 2016. It is reasonable to suppose (according to the assumption that the number of occupants of buildings slightly differ from the number of displaced people living in those buildings before the earthquake) that more than half of the currently displaced people lived in buildings HC before the earthquake. The remaining portion probably originated from heavily damaged buildings for which demolition and reconstruction works have not been completed. To this end, it is recalled that, according to data related only to the reconstruction process of buildings OHC, demolition and reconstruction involved 541 buildings out of the 2211 buildings with a usability rating of E [
22].

 ,
, 


