Precision Agriculture Technologies Positively Contributing to GHG Emissions Mitigation, Farm Productivity and Economics


 , and
, and 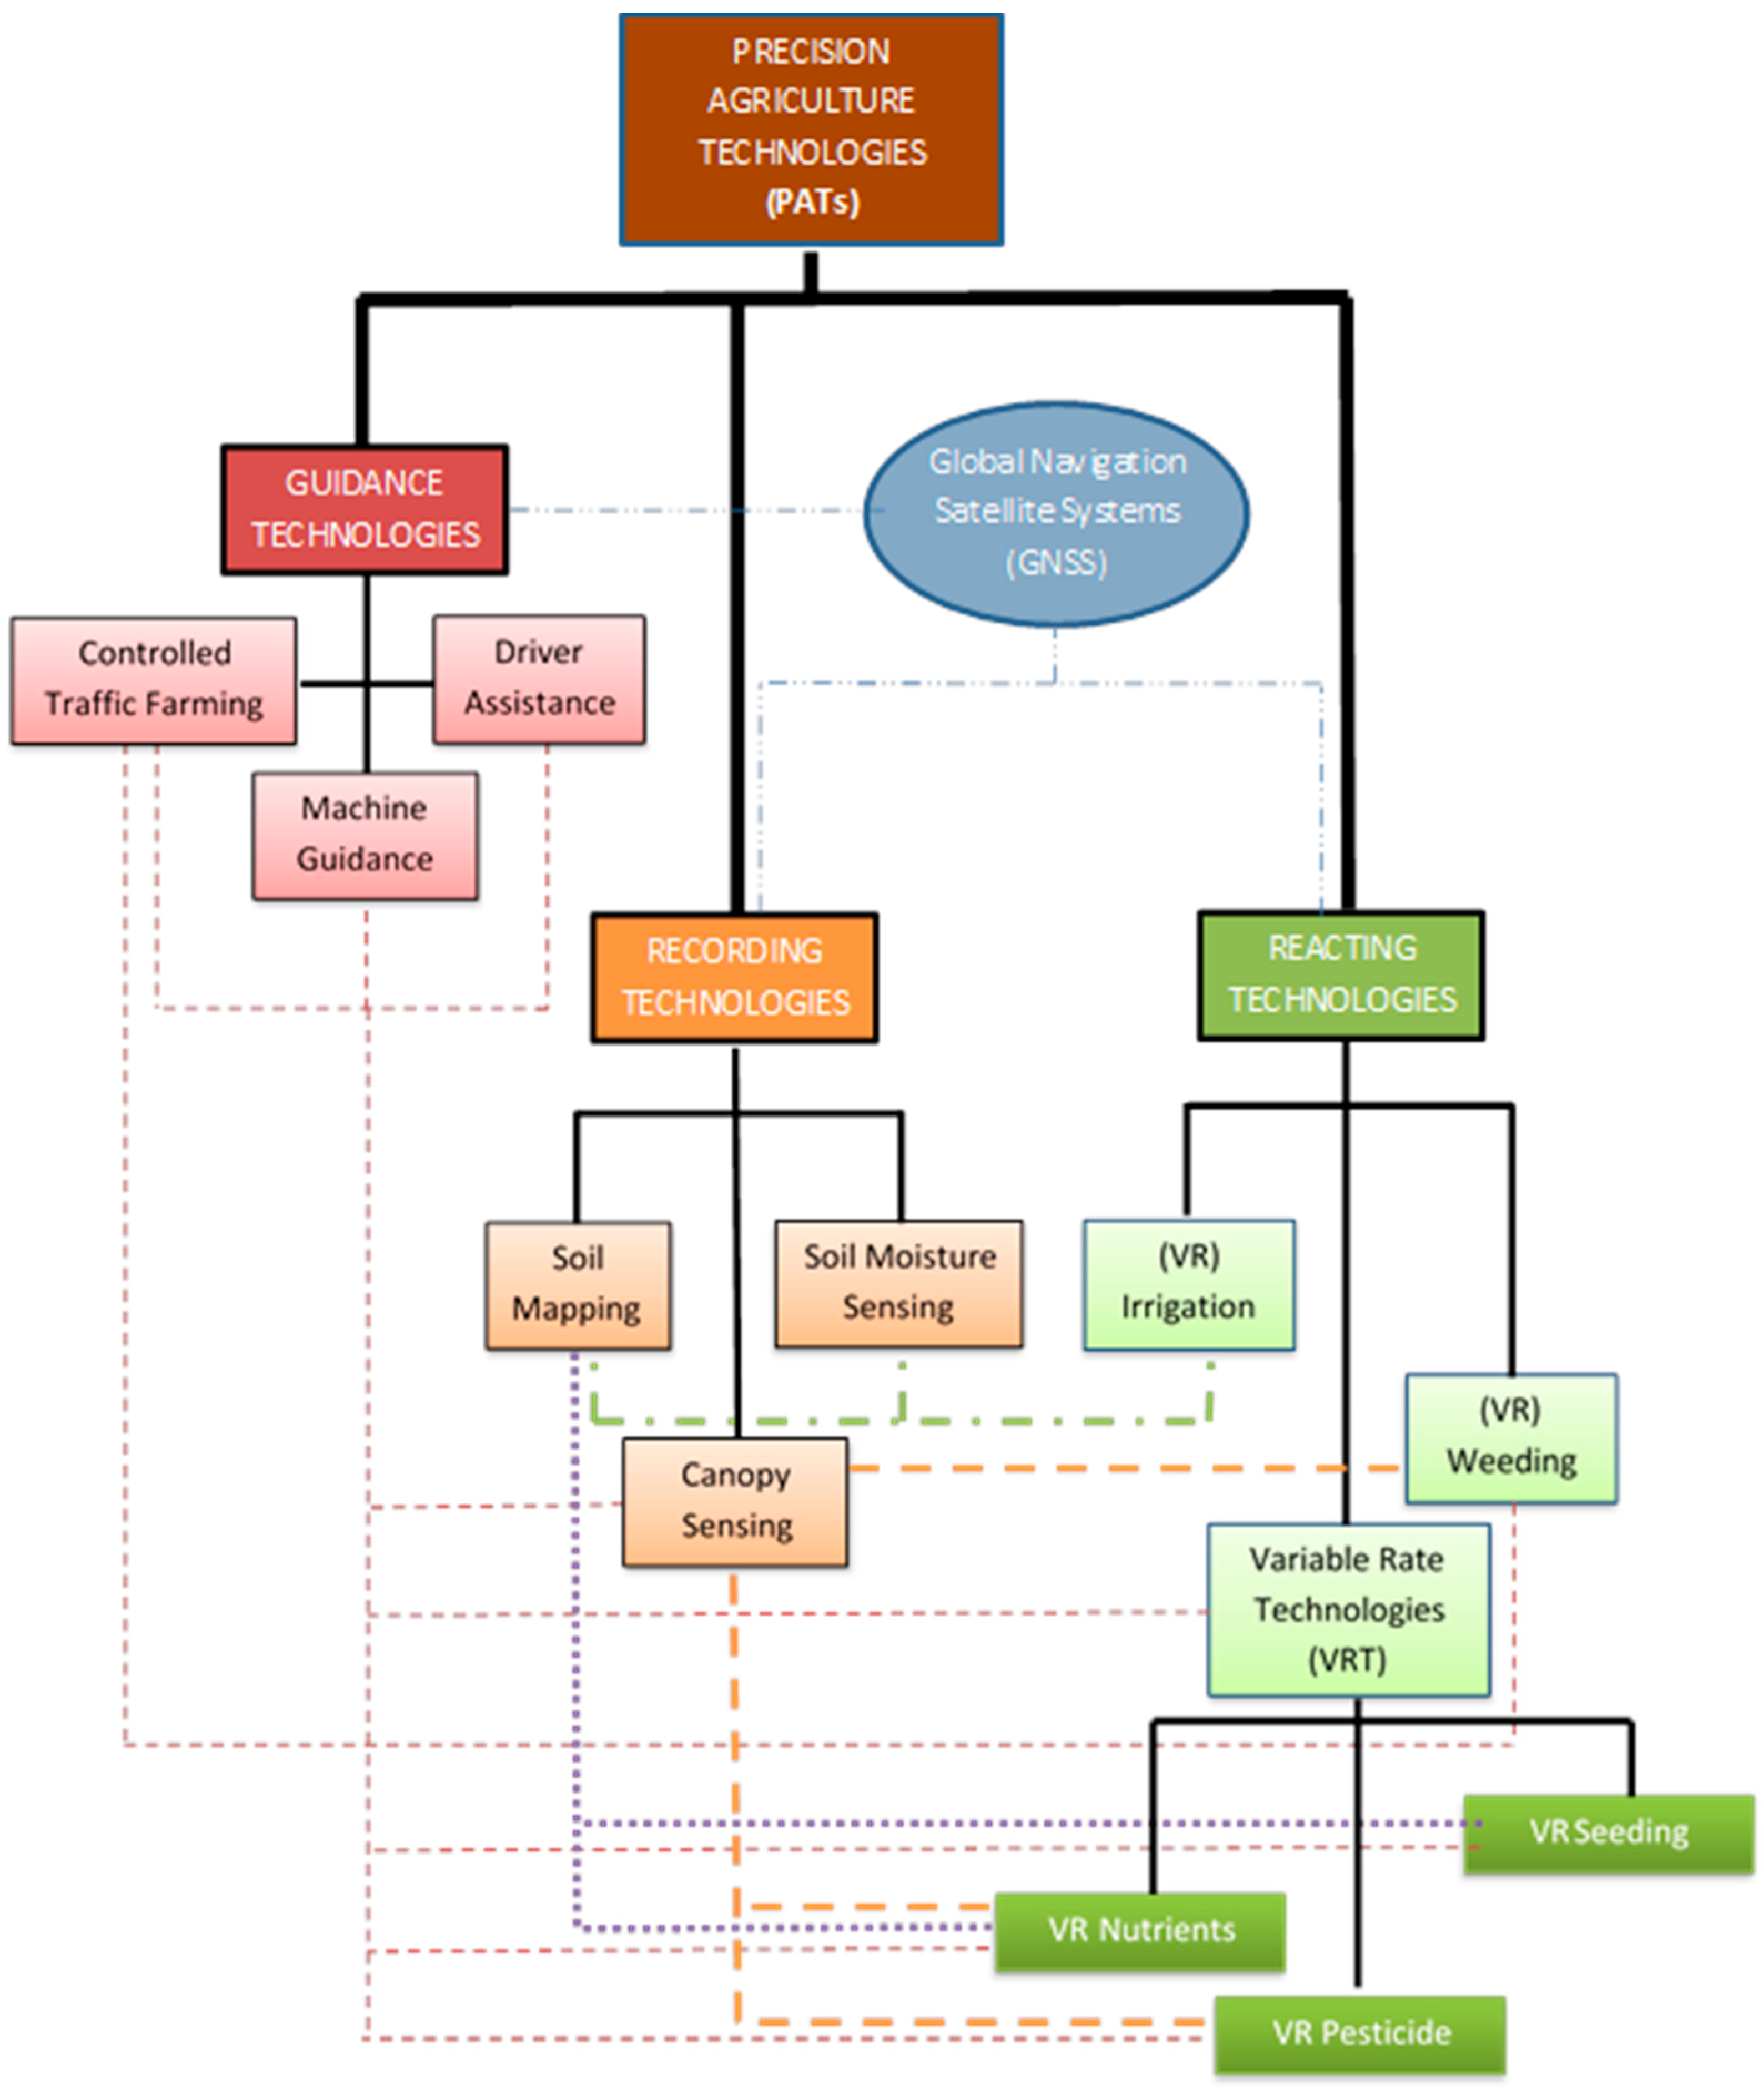
Abstract
1. Introduction
2. Main Sources of Agricultural GHG Emissions
3. Greenhouse Gases Mitigation Practices
4. Typology of Precision Agriculture Technologies
5. Impacts of Reacting Precision Agriculture Technologies
5.1. Variable Rate Nutrient Application (VRNA)
5.1.1. Description of VRNA Technologies
5.1.2. GHG Emissions Reduction Potential through VRNA
GHG Emissions from Nitrogen Fertiliser Production
GHG Emissions from Nitrogen Fertiliser Application
GHG Emissions from Variable Rate Application of other Macronutrients and Lime
5.1.3. Impacts of the Use of VRNA on Productivity and Farm Economics
Productivity and Farm Economics Impact from Variable Rate Nitrogen Fertiliser Application
Productivity and Farm Economics Impact from Variable Rate Lime Application
5.2. Variable Rate Irrigation (VRI)
5.2.1. Description of VRI Technologies
5.2.2. GHG Emission Reduction Potential through VRI
5.2.3. Impacts of VRI Use on Productivity and Farm Economics
5.3. Machine Guidance (MG)
5.3.1. Description of MG Technologies
5.3.2. GHG Emissions Reduction Potential through MG
5.3.3. Impacts of MG Use on Productivity and Farm Economics
5.4. Controlled Traffic Farming (CTF)
5.4.1. Description of CTF Technology
5.4.2. GHG Emission Reduction Potential through CTF
5.4.3. Impacts of the Use of CTF on Productivity and Farm Economics
5.5. Variable Rate Pesticide Application (VRPA)
5.5.1. Description of VRPA Technologies
5.5.2. GHG Emission Reduction Potential through VRPA
5.5.3. Impacts of the Use of VRPA on Productivity and Farm Economics
5.6. Variable Rate Planting/Seeding (VRP/VRS)
5.6.1. Description
5.6.2. GHG Emission Reduction Potential through VRP/VRS
5.6.3. Impacts of the Use of VRP/VRS on Productivity and Farm Economics
5.7. Precision Physical Weeding Technology (PPW)
5.7.1. Description of PPW Technology
5.7.2. GHG emission Reduction Potential through PPW
5.7.3. Impacts of PPW on Productivity and Farm Economics
6. Conclusions
- Variable rate nutrient application (VRNA) technologies can reduce the fertilizer quantities applied in modern agriculture by using technology to cover site-specific nutrient needs. VRNA can be applied to all nutrient application, with nitrogen being the most important to be regulated through these technologies as it is the element that is mostly used for crop growth increase and covers the highest percentage of fertilizers globally. Therefore, VRNA can significantly contribute in accurate nutrient management, which can be translated to reduction of GHG emissions and especially nitrogen that is responsible for N2O release (the GHG derived from agricultural activities with the highest global warming potential). They can also affect positively farm productivity and income by increasing final yield especially in low productivity sections of a farm and by reducing the fertilization costs that follows optimized application of nitrogen according to the plants’ needs.
- Variable rate irrigation (VRI) systems have the following GHG emission reduction potential, as its impact is dual: primarily, the decrease of irrigated water reduces the energy for water pumping, and, secondly, the optimum irrigation scheduling affect significantly the release of GHG emissions derived from fertilisers through the soil (mainly N2O). In terms of productivity, the impact is also significant, particularly in dry areas, as irrigation scheduling kai dosage can be optimized resulting in economic benefits (lower pumping costs combined with higher yields).
- Controlled Traffic Farming (CTF) and machine guidance (MG) limit the use of tractors to only the necessary passes through the fields avoiding overlapping with respective decrease in agricultural inputs and fuel (translated into GHG emissions reduction and lower cost of production). Variable rate pesticide application (VRPA) is also expected to have GHG reduction potential by reducing the pesticide application and its industrial production. However, the actual environmental effect can be extremely significant, but through lower chemical substances application that contaminates all natural resources (water, air, and soil). The effect on farm economics is also major, especially in crops that receive many chemical applications, such as herbicides and fungicides.
- Variable rate planting/seeding (VRP/VRS) and precision physical weeding (PPW) show lower, but not irrelevant GHG emission mitigation. VRP/VRS is mainly important for optimising plant density in the field that can increase farm productivity, while the reduction in seed/plant population is associated with GHG emissions during their production. PPW reduces pesticide application and fuel used for flame burning of weeds.
Acknowledgments
Author Contributions
Conflicts of Interest
References
- Montzka, S.A.; Dlugokencky, E.J.; Butler, J.H. Non-CO2 greenhouse gases and climate change. Nature 2011, 476, 43–50. [Google Scholar] [CrossRef] [PubMed]
- EU. Measures at Farm Level to Reduce Greenhouse Gas Emissions from EU Agriculture. Available online: http://www.europarl.europa.eu/RegData/etudes/note/join/2014/513997/IPOL-AGRI_NT(2014)513997_EN.pdf (accessed on 20 May 2017).
- Angers, D.A.; Eriksen-Hamel, N.S. Full-Inversion Tillage and Organic Carbon Distribution in Soil Profiles: A Meta-Analysis. Soil Sci. Soc. Am. J. 2008, 72, 1370–1374. [Google Scholar] [CrossRef]
- Waldrop, M.P.; Zak, D.R.; Sinsabaugh, R.L.; Gallo, M.; Lauber, C. Nitrogen deposition modifies soil carbon storage through changes in microbial enzymatic activity. Ecol. Appl. 2004, 14, 1172–1177. [Google Scholar] [CrossRef]
- Khan, S.A.; Mulvaney, R.L.; Ellsworth, T.R.; Boast, C.W. The Myth of Nitrogen Fertilization for Soil Carbon Sequestration. J. Environ. Qual. 2007, 36, 1821–1832. [Google Scholar] [CrossRef] [PubMed]
- Plant, R.E.; Pettygrove, G.S.; Reinert, W.R. Precision agriculture can increase profits and limit environmental impacts. Calif. Agric. 2000, 54, 66–71. [Google Scholar] [CrossRef]
- Daberkow, S.G.; McBride, W.D. Farm and Operator Characteristics Affecting the Awareness and Adoption of Precision Agriculture Technologies in the US. Precis. Agric. 2003, 4, 163–177. [Google Scholar] [CrossRef]
- Fountas, S.; Blackmore, S.; Ess, D.; Hawkins, S.; Blumhoff, G.; Lowenberg-Deboer, J.; Sorensen, C.G. Farmer Experience with Precision Agriculture in Denmark and the US Eastern Corn Belt. Precis. Agric. 2005, 6, 121–141. [Google Scholar] [CrossRef]
- Sarantis, M. Europe Entering the Era of Precision Agriculture’. Available online: https://www.euractiv.com/section/science-policymaking/news/europe-entering-the-era-of-precision-agriculture/ (accessed on 13 March 2017).
- Roland, B. Press Release. Available online: http://www.rolandberger.com/press_releases/market_for_smart_agriculture_applications_growing.html (accessed on 25 May 2016).
- Pedersen, S.M.; Fountas, S.; Blackmore, B.S.; Gylling, M.; Pedersen, J.L. Adoption and perspectives of precision farming in Denmark. Acta Agric. Scand. Sect. B 2004, 54, 2–8. [Google Scholar] [CrossRef]
- McBratney, A.; Whelan, B.; Ancev, T.; Bouma, J. Future Directions of Precision Agriculture. Precis. Agric. 2005, 6, 7–23. [Google Scholar] [CrossRef]
- Kutter, T.; Tiemann, S.; Siebert, R.; Fountas, S. The role of communication and co-operation in the adoption of precision farming. Precis. Agric. 2011, 12, 2–17. [Google Scholar] [CrossRef]
- Zarco-Tejada, P.; Hubbard, N.; Loudjani, P. Precision Agriculture: An Opportunity for EU Farmers—Potential Support with the Cap 2014–2020. Available online: http://www.europarl.europa.eu/RegData/etudes/note/join/2014/529049/IPOL-AGRI_NT%282014%29529049_EN.pdf (accessed on 15 May 2017).
- MacLeod, M.; Eory, V.; Gruere, G.; Lankoski, J. Cost-Effectiveness of Greenhouse Gas Mitigation Measures for Agriculture; OECD Publishing: Paris, France, 2015; Volume 89. [Google Scholar]
- Gruère, G.; Lankoski, J. A Review of the Literature on the Cost-Effectiveness of Greenhouse Gas Mitigation Measures for Agriculture. Available online: https://www.oecd.org/officialdocuments/publicdisplaydocumentpdf/?cote=COM/TAD/CA/ENV/EPOC(2014)44/FINAL&docLanguage=En (accessed on 10 February 2017).
- A Practical Guide to a Prosperous, Low Carbon Europe. Available online: http://www.roadmap2050.eu (accessed on 10 March 2017).
- Van Groenigen, K.J.; Osenberg, C.W.; Hungate, B.A. Increased soil emissions of potent greenhouse gases under increased atmospheric CO2. Nature 2011, 475, 214–216. [Google Scholar] [CrossRef] [PubMed]
- Le Mer, J.; Roger, P. Production, oxidation, emission and consumption of methane by soils: A review. Eur. J. Soil Biol. 2001, 37, 25–50. [Google Scholar] [CrossRef]
- Pathak, H.; Prasad, S.; Bhatia, A.; Singh, S.; Kumar, S.; Singh, J.; Jain, M.C. Methane emission from rice-wheat cropping system in the Indo-Gangetic plain in relation to irrigation, farmyard manure and dicyandiamide application. Agric. Ecosyst. Environ. 2003, 97, 309–316. [Google Scholar] [CrossRef]
- Linquist, B.A.; Adviento-Borbe, M.A.; Pittelkow, C.M.; van Kessel, C.; van Groenigen, K.J. Fertilizer management practices and greenhouse gas emissions from rice systems: A quantitative review and analysis. Field Crops Res. 2012, 135, 10–21. [Google Scholar] [CrossRef]
- Ma, J.; Li, X.L.; Xu, H.; Han, Y.; Cai, Z.C.; Yagi, K. Effects of nitrogen fertiliser and wheat straw application on CH4 and N2O emissions from a paddy rice field. Aust. J. Soil Resour. 2007, 45, 359–367. [Google Scholar] [CrossRef]
- Zou, J.; Huang, Y.; Jiang, J.; Zheng, X.; Sass, R.L. A 3-year field measurement of methane and nitrous oxide emissions from rice paddies in China: Effects of water regime, crop residue, and fertilizer application. Glob. Biogeochem. Cycles 2005, 19. [Google Scholar] [CrossRef]
- Smith, P.; Martino, D.; Cai, Z.; Gwary, D.; Janzen, H.; Kumar, P.; McCarl, B.; Ogle, S.; O’Mara, F.; Rice, C.; et al. Greenhouse gas mitigation in agriculture. Phil. Trans. R. Soc. B 2008, 363, 789–813. [Google Scholar] [CrossRef] [PubMed]
- Ma, Y.C.; Kong, X.W.; Yang, B.; Zhang, X.L.; Yan, X.Y.; Yang, J.C.; Xiong, Z.Q. Net global warming potential and greenhouse gas intensity of annual rice–wheat rotations with integrated soil–crop system management. Agric. Ecosyst. Environ. 2013, 164, 209–219. [Google Scholar] [CrossRef]
- FAO. Global Estimates of Gaseous Emissions of NH3, NO and N2O from Agricultural Land. Available online: ftp://ftp.fao.org/agl/agll/docs/globest.pdf (accessed on 10 March 2017).
- Bouwman, A.F.; Boumans, L.J.M.; Batjes, N.H. Modeling Global Annual N2O and NO Emissions from Fertilized Fields. Glob. Biogeochem. Cycles 2002, 16, 1080–1107. [Google Scholar] [CrossRef]
- Lal, R. Soil Carbon Sequestration Impacts on Global Climate Change and Food Security. Science 2004, 304, 1623–1627. [Google Scholar] [CrossRef] [PubMed]
- Cannell, M.G.R. Carbon sequestration and biomass energy offset: Theoretical, potential and achievable capacities globally, in Europe and the UK. Biomass Bioenergy 2003, 24, 97–116. [Google Scholar] [CrossRef]
- Schneider, U.A.; McCarl, B.A. Economic Potential of Biomass Based Fuels for Greenhouse Gas Emission Mitigation. Environ. Resour. Econ. 2003, 24, 291–312. [Google Scholar] [CrossRef]
- Robertson, G.P.; Grace, P.R. Greenhouse Gas Fluxes in Tropical and Temperate Agriculture: The need for a Full-Cost accounting of Global Warming Potentials. Environ. Dev. Sustain. 2004, 6, 51–63. [Google Scholar] [CrossRef]
- Schils, R.L.M.; Verhagen, A.; Aarts, H.F.M.; Šebek, L.B.J. A farm level approach to define successful mitigation strategies for GHG emissions from ruminant livestock systems. Nutr. Cycl. Agroecosys. 2005, 71, 163–175. [Google Scholar] [CrossRef]
- Mangalassery, S.; Sjögersten, S.; Sparkes, D.L.; Sturrock, C.J.; Craigon, J.; Mooney, S.J. To what extent can zero tillage lead to a reduction in greenhouse gas emissions from temperate soils? Sci. Rep. 2014, 4, 4586. [Google Scholar] [CrossRef] [PubMed]
- Robertson, G.P. Keeping Track of Carbon. Science 1999, 285, 1849. [Google Scholar] [CrossRef]
- Eory, V.; Moran, D. Review of Potential Measures for RPP2-Agriculture. Available online: http://www.climatexchange.org.uk/files/3413/7338/8148/Review_of_Potential_Measures_for_RPP2_-_Agriculture.pdf (accessed on 15 March 2017).
- UK Government. Indicator 2: Uptake of Mitigation Methods. Available online: https://www.gov.uk/government/uploads/system/uploads/attachment_data/file/448954/ghgindicator-2mitigation-29jul15.pdf (accessed on 15 March 2017).
- LIFE_Environment. Climate Change Mitigation. Available online: https://ec.europa.eu/clima/sites/clima/files/docs/climate_change_mitigation_en.pdf (accessed on 19 May 2017).
- CAP_Reform. Overview of CAP Reform 2014–2020. Available online: https://ec.europa.eu/agriculture/sites/agriculture/files/policy-perspectives/policy-briefs/05_en.pdf (accessed on 10 April 2017).
- Schwarz, J.; Herold, L.; Pölling, B. Typology of PF Technologies; FP7 Project Future Farm. Available online: http://www.futurefarm.eu/ (accessed on 24 May 2017).
- Behic Tekin, A.; Okyay Sındır, K. Variable Rate Control System Designed for Spinner Disc Fertiliser Spreader–“Pre Fer”. Agric. Eng. 2013, 2, 45–53. [Google Scholar]
- Hijazi, B.; Cool, S.; Vangeyte, J.; Mertens, K.; Cointault, F.; Paindavoine, M.; Pieters, J. High Speed Stereovision Setup for Position and Motion Estimation of Fertilizer Particles Leaving a Centrifugal Spreader. Sensors 2014, 14, 21466–21482. [Google Scholar] [CrossRef] [PubMed]
- Grisso, R.; Alley, M.; Thomason, W.; Holshouser, D.; Roberson, G.T. Precision Farming Tools: Variable-Rate Application. Available online: https://www.pubs.ext.vt.edu/content/dam/pubs_ext_vt_edu/442/442-505/442-505_PDF.pdf (accessed on 20 March 2017).
- Calcante, A.; Brambilla, M.; Oberti, R.; Bisaglia, C. A Retrofit Variable-Rate Control System for Pressurized Slurry Tankers. Appl. Eng. Agric. 2015, 31, 569–579. [Google Scholar]
- Brambilla, M.; Calcante, A.; Oberti, R.; Bisaglia, C. Slurry tanker retrofitting with variable rate dosing system: A case study. In Precision Agriculture ‘15; Wageningen Academic Publishers: Wageningen, The Netherlands, 2015; pp. 361–368. [Google Scholar]
- Morgan, J.; Connolly, E. Plant-soil interactions: Nutrient uptake. Nat. Educ. Knowl. 2013, 4, 2. [Google Scholar]
- Bentrup, F.; Paliere, C. Energy Efficiency and Greenhouse gas Emissions in European Nitrogen Fertilizer Production and Use. Fertilizers Europe. Available online: http://www.fertilizerseurope.com/fileadmin/user_upload/publications/agriculture_publications/Energy_Efficiency__V9.pdf (accessed on 4 April 2017).
- Wood, S.; Cowie, A. A Review of Greenhouse Gas Emission Factors for Fertiliser Production; For IEA Bioenergy Task 38; Orange, Research and Development Division, State Forests of New South Wales: New South Wales, Australia, 2004.
- Schepers, J.S.; Raun, W.R. Nitrogen in Agricultural Systems; American Society of Agronomy, Crop Science Society of America, Soil Science Society of America: Madison, WI, USA, 2008. [Google Scholar]
- Kang, N.; Jung, M.-H.; Jeong, H.-C.; Lee, Y.-S. Comparison of pooled standard deviation and standardized-t bootstrap methods for estimating uncertainty about average methane emission from rice cultivation. Atmos. Environ. 2015, 111, 39–50. [Google Scholar] [CrossRef]
- Liu, Y.; Zhou, Z.; Zhang, X.; Xu, X.; Chen, H.; Xiong, Z. Net global warming potential and greenhouse gas intensity from the double rice system with integrated soil–crop system management: A three-year field study. Atmos. Environ. 2015, 116, 92–101. [Google Scholar] [CrossRef]
- Bausch, W.C.; Delgado, J.A. Impact of Residual Soil Nitrate on In-Season Nitrogen Applications to Irrigated Corn Based on Remotely Sensed Assessments of Crop Nitrogen Status. Precis. Agric. 2005, 6, 509–519. [Google Scholar] [CrossRef]
- Millar, N.; Robertson, G.P.; Grace, P.R.; Gehl, R.J.; Hoben, J.P. Nitrogen fertiliser management for nitrous oxide (N2O) mitigation in intensive corn (Maize) production: An emissions reduction protocol for US. Midwest agriculture. Mitig. Adapt. Strat. Glob. Change 2010, 15, 185–204. [Google Scholar] [CrossRef]
- Ribaudo, M.; Delgado, J.; Hansen, L.; Livingston, M.; Mosheim, R.; Williamson, J. Nitrogen in Agricultural Systems: Implications for Conservation Policy. Dept. Agric. Econ. Res. Serv. 2011. [Google Scholar] [CrossRef]
- Eurostat. Gross Nitrogen Surplus in EU 28. Available online: http://ec.europa.eu/eurostat/statistics-explained/index.php/File:Gross_Nitrogen_Surplus,_EU-28,_CH_and_NO,_average_2005-08_vs_2009-12.png (accessed on 20 April 2017).
- Bates, J.; Brophy, N.; Harfoot, M.; Webb, J. Sectoral Emission Reduction Potentials and Economic Costs for Climate Change (SERPEC-CC). In Agriculture: Methane and Nitrous oxide; Ecofys Netherlands: Utrecht, The Netherlands, 2009. [Google Scholar]
- Hoben, J.P.; Gehl, R.J.; Millar, N.; Grace, P.R.; Robertson, G.P. Nonlinear nitrous oxide (N2O) response to nitrogen fertilizer in on-farm corn crops of the US Midwest. Glob. Chang. Biol. 2011, 17, 1140–1152. [Google Scholar] [CrossRef]
- McSwiney, C.P.; Robertson, G.P. Nonlinear response of N2O flux to incremental fertilizer addition in a continuous maize (Zea mays L.) cropping system. Glob. Chang. Biol. 2005, 11, 1712–1719. [Google Scholar] [CrossRef]
- Ogle, S.; Archibeque, S.; Gurung, R.; Paustian, K. Report on GHG Mitigation Literature Review for Agricultural Systems; US. Department of Agriculture, Climate Change Program Office: Fort Collins, CO, USA, 2010.
- Babcock, B.A.; Paustian, K.; Hatfield, J.; Kling, C.L.; Lal, R.; McCarl, B.; McLaughlin, S.; Mosier, A.; Post, W.; Robertson, G.P.; et al. Climate Change and Greenhouse Gas Mitigation: Challenges and Opportunities for Agriculture; Council on Agricultural Science and Technology (CAST): Ames, IA, USA, 2004. [Google Scholar]
- Sehy, U.; Ruser, R.; Munch, J.C. Nitrous oxide fluxes from maize fields: Relationship to yield, site-specific fertilization, and soil conditions. Agric. Ecosys. Environ. 2003, 99, 97–111. [Google Scholar] [CrossRef]
- Søgaard, H.T.; Kierkegaard, P. Yield Reduction Resulting from Uneven Fertilizer Distribution. Trans. ASAE 1994, 37, 1749–1752. [Google Scholar] [CrossRef]
- Raun, W.R.; Solie, J.B.; Johnson, G.V.; Stone, M.L.; Lukina, E.V.; Thomason, W.E.; Schepers, J.S. In-Season Prediction of Potential Grain Yield in Winter Wheat Using Canopy Reflectance. Agron. J. 2001, 93, 131–138. [Google Scholar] [CrossRef]
- Biggar, S.; Man, D.; Moffroid, K.; Pape, D.; Riley-Gilbert, M.; Steele, R.; Thompson, V. Greenhouse Gas Mitigation Options and Costs for Agricultural Land and Animal Production within the United States; ICF International, Department of Agriculture Climate Change Program Office: Washington, DC, USA, 2013.
- Tekin, A.B. Variable rate fertiliser application in Turkish wheat agriculture: Economic assessment. Afr. J. Agric. Res. 2010, 5, 647–652. [Google Scholar]
- Koch, B.; Khosla, R.; Frasier, W.M.; Westfall, D.G.; Inman, D. Economic Feasibility of Variable-Rate Nitrogen Application Utilizing Site-Specific Management Zones This study was conducted through a USDA-IFAFS-funded grant. Agron. J. 2004, 96, 1572–1580. [Google Scholar] [CrossRef]
- HydroSence. Innovative Precision Technologies for Optimised Irrigation and Integrated Crop Management in a Water—Limited Agrosystem; LIFE+ PROJECT; LIFE08 ENV/GR/000570; Best LIFE Projects: Athens, Greece, 2013. [Google Scholar]
- Raun, W.R.; Solie, J.B.; Johnson, G.V.; Stone, M.L.; Mullen, R.W.; Freeman, K.W.; Thomason, W.E.; Lukina, E.V. Improving Nitrogen Use Efficiency in Cereal Grain Production with Optical Sensing and Variable Rate Application. Agron. J. 2002, 94, 815–820. [Google Scholar] [CrossRef]
- Mamo, M.; Malzer, G.L.; Mulla, D.J.; Huggins, D.R.; Strock, J. Spatial and temporal variation in economically optimum nitrogen rate for corn. Agron. J. 2003, 95, 958–964. [Google Scholar] [CrossRef]
- Huber, D.M.; Sutton, A.L.; Jones, D.D.; Joern, B.C.; Mitchell, J.K. Nutrient management of manure to enhance crop production and protect the environment. In Proceedings of the Integrated Resource Mgt. Landscape Modifications for Environ. Protect. Conference, ASABE, Chicago, IL, USA, 13–14 December 1993. [Google Scholar]
- Morris, D.K.; Ess, D.R.; Hawkins, S.E.; Parsons, S.D. Development of a site-specific application system for liquid animal manures. Appl. Eng. Agric. 1999, 15, 633–638. [Google Scholar] [CrossRef]
- Schellberg, J.; Lock, R. A site-specific slurry application technique on grassland and on arable crops. Bioresour. Technol. 2009, 100, 280–286. [Google Scholar] [CrossRef] [PubMed]
- Weisz, R.; Heiniger, R.; White, J.G.; Knox, B.; Reed, L. Long-Term Variable Rate Lime and Phosphorus Application for Piedmont No-Till Field Crops. Precis. Agric. 2003, 4, 311–330. [Google Scholar] [CrossRef]
- Kuang, B.; Tekin, Y.; Waine, T.; Mouazen, A.M. Variable rate lime application based on on-line visible and near infrared (vis-NIR) spectroscopy measurement of soil properties in a Danish field. In Proceedings of the AgEng Conference, Zurich, Switzerland, 6–10 July 2014. [Google Scholar]
- Swinton, S.M.; Lowenberg-DeBoer, J. Evaluating the Profitability of Site-Specific Farming. J. Produc. Agric. 1998, 11, 439–446. [Google Scholar] [CrossRef]
- Pierce, F.J.; Warncke, D.D. Soil and crop response to variable-rate liming for two Michigan fields. Soil Sci. Soc. Am. J. 2000, 64, 774–780. [Google Scholar] [CrossRef]
- Lambert, D.; Lowenberg-De Boer, J. Precision Agriculture Profitability Review; Purdue University: West Lafayette, IN, USA, 2000. [Google Scholar]
- Bongiovanni, R.; Lowenberg-Deboer, J. Economics of Variable Rate Lime in Indiana. Precis. Agric. 2000, 2, 55–70. [Google Scholar] [CrossRef]
- Berne, D. Agricultural Irrigation Initiative: Overview of Center Pivot Irrigation Systems. Available online: https://neea.org/docs/default-source/reports/overview-of-center-pivot-irrigation-systems.pdf?sfvrsn=4 (accessed on 12 May 2017).
- CSANR. Available online: http://csanr.wsu.edu/wp-content/uploads/2014/07/Peters_LEPA_2014_BIOAg.pdf (accessed on 14 May 2017).
- McCann, I.R.; King, B.A.; Stark, J.C. Variable rate water and chemical application for continuous-move sprinkler irrigation systems. Appl. Eng. Agric. 1997, 13, 609–615. [Google Scholar] [CrossRef]
- King, B.A.; McCann, I.R.; Eberlein, C.V.; Stark, J.C. Computer control system for spatially varied water and chemical application studies with continuous-move irrigation systems. Comput. Electon. Agric. 1999, 24, 177–194. [Google Scholar] [CrossRef]
- Omary, M.; Camp, C.R.; Sadler, E.J. Center pivot irrigation system modification to provide variable water application depths. Appl. Eng. Agric. 1997, 13, 235–239. [Google Scholar] [CrossRef]
- Stone, K.C.; Sadler, E.J.; Millen, J.A.; Evans, D.E.; Camp, C.R. Water flow rates from a site-specific irrigation system. Appl. Eng. Agric. 2006, 22, 73–78. [Google Scholar] [CrossRef]
- Dukes, M.D.; Perry, C. Uniformity testing of variable-rate center pivot irrigation control systems. Precis. Agric. 2006, 7, 205. [Google Scholar] [CrossRef]
- Han, Y.J.; Khalilian, A.; Owino, T.O.; Farahani, H.J.; Moore, S. Development of Clemson variable-rate lateral irrigation system. Comput. Electon. Agric. 2009, 68, 108–113. [Google Scholar] [CrossRef]
- Chávez, J.L.; Pierce, F.J.; Elliott, T.V.; Evans, R.G.; Kim, Y.; Iversen, W.M. A remote irrigation monitoring and control system (RIMCS) for continuous move systems. Part B: Field testing and results. Precis. Agric. 2010, 11, 11–26. [Google Scholar] [CrossRef]
- King, B.A.; Kincaid, D.C. A variable flow rate sprinkler for site-specific irrigation management. Tran. ASAE 2004, 20, 765–770. [Google Scholar]
- Evans, R.G.; LaRue, J.; Stone, K.C.; King, B.A. Adoption of site-specific variable rate sprinkler irrigation systems. Irrig. Sci. 2013, 31, 871–887. [Google Scholar] [CrossRef]
- Camp, C.R. Subsurface drip irrigation: A review. Tran. ASAE 1998, 41, 1353–1367. [Google Scholar] [CrossRef]
- Sadler, E.J.; Evans, R.G.; Stone, K.C.; Camp, C.R. Opportunities for conservation with precision irrigation. J. Soil Water Conserv. 2005, 60, 371–378. [Google Scholar]
- La Rua, J.; Evans, R. Considerations for variable rate irrigation. In Proceedings of the 24th Annual Central Plains Irrigation Conference, Colby, Kansas, USA, 21–22 February 2012. [Google Scholar]
- Trost, B.; Prochnow, A.; Drastig, K.; Meyer-Aurich, A.; Ellmer, F.; Baumecker, M. Irrigation, soil organic carbon and N2O emissions. Agron. Sustain. Dev. 2013, 33, 733–749. [Google Scholar] [CrossRef]
- Tomasiewicz, D.J.; Hingley, L.; Derdall, E.; Vestre, B. Variable Rate Irrigation: The Next Big Thing in Irrigated Agriculture? In Proceedings of the Soils and Crops Conference, Saskatchewan, SK, Canada, 5–6 March 2013. [Google Scholar]
- Seo, S.; Segarra, E.; Mitchell, P.D.; Leatham, D.J. Irrigation technology adoption and its implication for water conservation in the Texas High Plains: A real options approach. Agric. Econ. 2008, 38, 47–55. [Google Scholar] [CrossRef]
- Booker, J.D.; Lascano, R.J.; Molling, C.C.; Zartman, R.E.; Acosta-Martínez, V. Temporal and spatial simulation of production-scale irrigated cotton systems. Precis. Agric. 2015, 16, 630–653. [Google Scholar] [CrossRef]
- Evans, R.G.; King, B.A. Site-Specific Sprinkler Irrigation in a Water-Limited Future. Tran. ASABE. 2012, 55, 493–504. [Google Scholar] [CrossRef]
- Hedley, C.B.; Yule, I.J. Soil water status mapping and two variable-rate irrigation scenarios. Precis. Agric. 2009, 10, 342–355. [Google Scholar] [CrossRef]
- Daccache, A.; Knox, J.W.; Weatherhead, E.K.; Daneshkhah, A.; Hess, T.M. Implementing precision irrigation in a humid climate – Recent experiences and on-going challenges. Agric. Water Manag. 2015, 147, 135–143. [Google Scholar] [CrossRef]
- Abidine, A.Z.; Heidman, B.C.; Upadhyaya, S.K.; Hills, D.J. Application of RTK GPS Based Auto-Guidance System in Agricultural Production; ASABE: St. Joseph, MI, USA, 2002. [Google Scholar]
- Shockley, J.M.; Dillon, C.R.; Stombaugh, T.S. A Whole Farm Analysis of the Influence of Auto-Steer Navigation on Net Returns, Risk, and Production Practices. J. Agric. Appl. Econ. 2015, 43, 57–75. [Google Scholar] [CrossRef]
- Bora, G.C.; Nowatzki, J.F.; Roberts, D.C. Energy savings by adopting precision agriculture in rural USA. Energy Sustain. Soc. 2012, 2, 22. [Google Scholar] [CrossRef]
- Ortiz, B.V.; Balkcom, K.B.; Duzy, L.; van Santen, E.; Hartzog, D.L. Evaluation of agronomic and economic benefits of using RTK-GPS-based auto-steer guidance systems for peanut digging operations. Precis. Agric. 2013, 14, 357–375. [Google Scholar] [CrossRef]
- Bergtold, J.S.; Raper, R.L.; Schwab, E.B. The Economic Benefit of Improving the Proximity of Tillage and Planting Operations in Cotton Production with Automatic Steering. Appl. Eng. Agric. 2009, 25, 133–143. [Google Scholar] [CrossRef]
- Grisso, R.; Alley, M.; Groover, G. Precision Farming Tools: GPS Navigation. Virginia Cooperative Extension. Available online: https://pubs.ext.vt.edu/442/442-501/442-501.html (accessed on 20 May 2017).
- Jensen, H.G.; Jacobsen, L.-B.; Pedersen, S.M.; Tavella, E. Socioeconomic impact of widespread adoption of precision farming and controlled traffic systems in Denmark. Precis. Agric. 2012, 13, 661–677. [Google Scholar] [CrossRef]
- Tullberg, J.N. CTF and Global Warming. Available online: http://actfa.net/wp-content/uploads/2014/02/CTF-and-Global-Warming.pdf (accessed on 20 May 2017).
- CTF_Europe Benefits of Controlled Traffic Farming. Available online: http://www.controlledtrafficfarming.com/WhatIs/Benefits-Of-CTF.aspx (accessed on 22 May 2017).
- Horsch. Talking CTF. Available online: http://courteenhall.co.uk/wp-content/uploads/2015/03/H035-Talking-CTF-web-2.pdf (accessed on 24 May 2017).
- Chamen, T. Impact of Machinery on Soils and Crops. Available online: http://www.controlledtrafficfarming.com/downloads/CTF-Uffington-ImpactMachinerySoilsCrops.pdf (accessed on 25 May 2017).
- GRDC. Controlled Traffic Farming Fact Sheet. Available online: https://grdc.com.au/__data/assets/pdf_file/0028/83872/grdcfsctflow-respdf.pdf.pdf (accessed on 27 May 2017).
- Karkee, M.; Steward, B.; Kruckeberg, J. Automation of pesticide application systems. In Agricultural Automation, Fundamentals and Practices; Zhang, Q., Pierce, F.J., Eds.; CRC Press: Boca Raton, FL, USA, 2013. [Google Scholar]
- Ess, D.R.; Parsons, S.D.; Case, R.M. Implementing Site-Specific Management: Sprayer Technology—Controlling Application Rate on the Go. Available online: http://www.ces.purdue.edu/extmedia/AE/SSM-5-W.pdf (accessed on 22 July 2016).
- Timmermann, C.; Gerhards, R.; Kühbauch, W. The Economic Impact of Site-Specific Weed Control. Precis. Agric. 2003, 4, 249–260. [Google Scholar] [CrossRef]
- Vasileiadis, V.P.; Moonen, A.C.; Sattin, M.; Otto, S.; Pons, X.; Kudsk, P.; Veres, A.; Dorner, Z.; van der Weide, R.; Marraccini, E.; et al. Sustainability of European maize-based cropping systems: Economic, environmental and social assessment of current and proposed innovative IPM-based systems. Eur. J. Agron. 2013, 48, 1–11. [Google Scholar] [CrossRef]
- Gerhards, R.; Sökefeld, M.; Timmermann, C.; Reichart, S.; Kühbauch, W.; Williams, M.M. Results of a four-year study on site-specific herbicide application. In Proceedings of the 2nd European Conference on Precision Agriculture, Odense, Denmark, 11–15 July 1999; pp. 689–697. [Google Scholar]
- Heisel, T.; Christensen, S.; Walter, A.M. Whole-field experiments with site-specific weed management. Proceeding of the 2nd European Conference on Precision Agriculture, Odense, Denmark, 11–15 July 1999; pp. 759–768. [Google Scholar]
- Dammer, K.H.; Wartenberg, G. Sensor-based weed detection and application of variable herbicide rates in real time. Crop Prot. 2007, 26, 270–277. [Google Scholar] [CrossRef]
- Solanelles, F.; Escolà, A.; Planas, S.; Rosell, J.R.; Camp, F.; Gràcia, F. An Electronic Control System for Pesticide Application Proportional to the Canopy Width of Tree Crops. Biosyst. Eng. 2006, 95, 473–481. [Google Scholar] [CrossRef]
- Gil, E.; Escolà, A.; Rosell, J.R.; Planas, S.; Val, L. Variable rate application of plant protection products in vineyard using ultrasonic sensors. Crop Prot. 2007, 26, 1287–1297. [Google Scholar] [CrossRef]
- Llorens, J.; Gil, E.; Llop, J.; Escolà, A. Variable rate dosing in precision viticulture: Use of electronic devices to improve application efficiency. Crop Prot. 2010, 29, 239–248. [Google Scholar] [CrossRef]
- Chen, Y.; Ozkan, H.E.; Zhu, H.; Derksen, R.C.; Krause, C.R. Spray Deposition inside Tree Canopies from a Newly Developed Variable-Rate Air-Assisted Sprayer. Tran. ASABE 2013, 56, 1263–1272. [Google Scholar]
- Dammer, K.-H.; Adamek, R. Sensor-Based Insecticide Spraying to Control Cereal Aphids and Preserve Lady Beetles. Agron. J. 2012, 104, 1694–1701. [Google Scholar] [CrossRef]
- Batte, M.T.; Ehsani, M.R. The economics of precision guidance with auto-boom control for farmer-owned agricultural sprayers. Comput. Electron. Agric. 2006, 53, 28–44. [Google Scholar] [CrossRef]
- IPCC. Climate Change 2007: The Physical Science Basis; Fourth Assessment Report; IPCC: New York, NY, USA, 2007. [Google Scholar]
- Oriade, C.A.; King, R.P.; Forcella, F.; Gunsolus, J.L. A Bioeconomic Analysis of Site-Specific Management for Weed Control. Rev. Agric. Econ. 1996, 18, 523–535. [Google Scholar] [CrossRef]
- Swinton, S.M. Site-specific pest management. In Pesticides—Problems, Improvements, Alternatives; den Hond, F., Groenewegen, P., van Straalen, N.M., Eds.; Oxford: England, UK, 2003; p. 155. [Google Scholar]
- Gerhards, R.; Sökefeld, M. Precision farming in weed control—System components and economic benefits. In Precision Agric; Stafford, J.V., Werner, A., Eds.; Wageningen Academic Publishers: Wageningen, The Netherlands, 2003; pp. 229–234. [Google Scholar]
- Vasileiadis, V.P.; Sattin, M.; Otto, S.; Veres, A.; Pálinkás, Z.; Ban, R.; Pons, X.; Kudsk, P.; van der Weide, R.; Czembor, E.; et al. Crop protection in European maize-based cropping systems: Current practices and recommendations for innovative Integrated Pest Management. Agric. Syst. 2011, 104, 533–540. [Google Scholar] [CrossRef]
- Trimble. Available online: www.trimble.com (accessed on 18 April 2017).
- Hörbe, T.A.N.; Amado, T.J.C.; Ferreira, A.O.; Alba, P.J. Optimization of corn plant population according to management zones in Southern Brazil. Precis. Agric. 2013, 14, 450–465. [Google Scholar] [CrossRef]
- Decisive_Farming. Variable Rate Seeding Benefits. Available online: http://www.decisivefarming.com/variable-rate-seeding-benefits/ (accessed on 22 April 2017).
- IPF. Under the Microscope: Variable Seed Rate Application. Available online: http://www.ipf-af.com/precision-farming/media/enews-oct14.pdf (accessed on 27 April 2017).
- Hefty, D. Variable Rate Variety Planting in Wheat and Soybeans. AgPhD. Available online: http://www.agphd.com/ag-phd-newsletter/2014/03/21/variable-rate-variety-planting-in-wheat-and-soybeans/ (accessed on 3 May 2017).
- Eric, S. Something Old: VRA Seeding & Nitrogen. Cotton Grow. Available online: http://www.cottongrower.com/crop-inputs/precision-technology/something-old-vra-seeding-nitrogen/ (accessed on 5 May 2017).
- Bullock, D.G.; Bullock, D.S.; Nafziger, E.D.; Doerge, T.A.; Paszkiewicz, S.R.; Carter, P.R.; Peterson, T.A. Does variable rate seeding of corn pay? Agron. J. 1998, 90, 830–836. [Google Scholar] [CrossRef]
- Lowenberg-DeBoer, J.M. Economics of Variable Rate Planting for Corn. In Proceedings of the 4th International Conference on Precision Agriculture; Lafayette: Louisiana, IN, USA, 1998; pp. 1643–1651. [Google Scholar]
- Taylor, R.K.; Staggenborg, S. Using a GIS to Evaluate the Potential of Variable Rate Corn Seeding. In Proceedings of the ASAE Meeting Presentation, Milwaukee, WI, USA, 9–12 July 2000. [Google Scholar]
- Shanahan, J.F.; Doerge, T.A.; Johnson, J.J.; Vigil, M.F. Feasibility of Site-Specific Management of Corn Hybrids and Plant Densities in the Great Plains. Precis. Agric. 2004, 5, 207–225. [Google Scholar] [CrossRef]
- Dillon, C.R.; Gandonou, J.; Shockley, J. Variable rate seeding for French wheat production: Profitability and production risk management potential. In JIAC2009 Book of Abstracts; Lokhorst, C., Huijsmans, J.F.M., de Louw, R.P.M., Eds.; Wageningen Academic Publishers: Wageningen, The Netherlands, 2009; p. 350. [Google Scholar]
- Velandia, M.; Buschermohle, M.; Larson, J.A.; Thompson, N.M.; Jernigan, B.M. The economics of automatic section control technology for planters: A case study of middle and west Tennessee farms. Comput. Electron. Agric. 2013, 95, 1–10. [Google Scholar] [CrossRef]
- Martelloni, L. Design and Realization of an Innovative Automatic Machine Able to Perform Site-Specific Thermal Weed Control in Maize. Ph.D. Thesis, Università degli Studi di Firenze, Firenze, Italy, 2014. [Google Scholar]
- Peteinatos, G.G.; Rueda-Ayala, R.; Gerhards, R.; Andujar, D. Precision harrowing with a flexible tine harrow and an ultrasonic sensor. In Precision Agriculture ’15; Stafford, J.V., Ed.; Wageningen Academic Publishers: Wageningen, The Netherlands, 2015; pp. 579–586. [Google Scholar]
- Norremark, M. Technologies for precision weed control. In Proceedings of the 3rd Conference of Precision crop Protection, Bonn, Germany, 19–21 September 2010. [Google Scholar]
- Peruzzi, A.; Raffaelli, M.; Ginanni, M.; Lulli, L.; Frasconi, C.; Fontanelli, M. Innovative operative machines for physical weed control on tomato in the Serchio Valley (Central Italy). In Proceedings of the International Conference “Innovation Technology to Empower Safety, Health and Welfare in Agriculture and Agro-food Systems”, Ragusa, Italy, 15–17 September 2008. [Google Scholar]

© 2017 by the authors. Licensee MDPI, Basel, Switzerland. This article is an open access article distributed under the terms and conditions of the Creative Commons Attribution (CC BY) license (http://creativecommons.org/licenses/by/4.0/).
Share and Cite
Balafoutis, A.; Beck, B.; Fountas, S.; Vangeyte, J.; Wal, T.V.d.; Soto, I.; Gómez-Barbero, M.; Barnes, A.; Eory, V. Precision Agriculture Technologies Positively Contributing to GHG Emissions Mitigation, Farm Productivity and Economics. Sustainability 2017, 9, 1339. https://doi.org/10.3390/su9081339
Balafoutis A, Beck B, Fountas S, Vangeyte J, Wal TVd, Soto I, Gómez-Barbero M, Barnes A, Eory V. Precision Agriculture Technologies Positively Contributing to GHG Emissions Mitigation, Farm Productivity and Economics. Sustainability. 2017; 9(8):1339. https://doi.org/10.3390/su9081339
Chicago/Turabian StyleBalafoutis, Athanasios, Bert Beck, Spyros Fountas, Jurgen Vangeyte, Tamme Van der Wal, Iria Soto, Manuel Gómez-Barbero, Andrew Barnes, and Vera Eory. 2017. "Precision Agriculture Technologies Positively Contributing to GHG Emissions Mitigation, Farm Productivity and Economics" Sustainability 9, no. 8: 1339. https://doi.org/10.3390/su9081339
APA StyleBalafoutis, A., Beck, B., Fountas, S., Vangeyte, J., Wal, T. V. d., Soto, I., Gómez-Barbero, M., Barnes, A., & Eory, V. (2017). Precision Agriculture Technologies Positively Contributing to GHG Emissions Mitigation, Farm Productivity and Economics. Sustainability, 9(8), 1339. https://doi.org/10.3390/su9081339