Article

Measuring the Coordinated Development of Ecological and Economic Systems in Hengduan Mountain Area

1
Institute of Mountain Hazards and Environment, Chinese Academy of Sciences, Chengdu 610041, China
2
Department of Resources and Environment, University of Chinese Academy of Sciences, Beijing 100049, China
3
Department of Earth Sciences, Chengdu University of Technology, Chengdu 610059, China
*
Author to whom correspondence should be addressed.
Sustainability 2017, 9(8), 1270; https://doi.org/10.3390/su9081270
Submission received: 26 May 2017 / Revised: 10 July 2017 / Accepted: 14 July 2017 / Published: 25 July 2017

Abstract

:
With the expansion of the concept of sustainable development, it has become increasingly important to investigate the means for achieving sustainable eco-economic development. On the basis of Landsat imagery of Hengduan Mountain area of China acquired in 1990, 2000, and 2010, we analyzed the coordination relationships, evolution characteristics, and aggregation modes of the economy and ecology in this region using ecosystem service value (ESV) and ecological economic harmony (eco-economic harmony, EEH) models. The following results were obtained. (1) There was a significant transition in land cover, wherein grassland increased the most and farmland decreased the most, by 1.18 × 10⁴ km2 and 9.41 × 10³ km2, respectively. These trends were related to urban expansion and the implementation of ecological measures; (2) From 1990 to 2000, there was a deterioration in the ecological system, whereas after 2000, the ecosystem improved due to implementation of the Chinese government’s “Returning Farmland to Forest (Grassland)” scheme, thereby illustrating the importance of forest to ecosystem stability; (3) Spatially, the EEH index showed a dual-core structure centered on a low conflict zone and potential crisis zone, which signified that there was a trend of coordinated development between the economy and ecology; however, this was not stable; (4) There were four types of EEH evolution zones—low conflict, potential crisis, slight improvement, and significant improvement zones—of which the improvement zones accounted for 55.15% of the area, thereby indicating that over time the economy has played a positive role in shaping the ecological environment; (5) The spatial aggregation modes of EEH evolution were band coordinated mode, group uncoordinated mode and group improvement mode, which meant the relationship of ecology and economy was always in lowest coordinated state in a banded form, in uncoordinated state and a significant increase in a block form, respectively. These modes were intended to provide a reference for the sustainable development in southwest China.

1. Introduction

Industrialization and urbanization are important symbols of the level of countries’ economic and sociobiological development [1]. Nevertheless, because of heavy industrial development and imperfect pollution control measures, a large amount of energy was consumed, different kinds of pollutants were directly discharged without any treatments, and the ecological environment was seriously damaged, especially in developing countries [2,3]. According to statistics, China’s carbon dioxide emissions have become the largest in the world, with those of the United States being second, and account for approximately 14% of the world’s emissions [4]. Meantime, urbanization promotes population and industry aggregation, which has caused land cover changes, and damaged food and ecological security [5]. In China, since 1996, its farmland has decreased by 83 thousand km2, or 5.95 thousand km2 per year, thus, the limited farmland resources are experiencing production pressure and threating human life [6]. Therefore, the pursuit of economic development and ecological security is a contradiction; the coordination degree of the two will affect the health and sustainability of regional development [7,8]. Therefore, research regarding the relationship between ecological and economic system has been necessary and prevalent [9,10].
Ecosystem services represent the benefits that living organisms derive from ecosystem functions that maintain the Earth’s life support system [11]. They include nutrient cycling, carbon sequestration, air and water filtration, and flood amelioration, to name a few [12,13]. Since 1990, numerous methods have been conducted to estimate the values of various ecosystem services (ecosystem service value, ESV), such as the alternative market method [14,15], the market valuation method [16,17], the survey evaluation method [18,19] and so on. Most notably, Costanza et al., (1997, 1998) [12,13] presented a model for placing an economic value on different biomes and the services that they provided. Based on their model, they estimated that the global biospheric value of 17 identifiable ecosystem services provided by the 16 dominant global biomes is $33 trillion per year. In 1999, Ouyang et al., adopted this concept to evaluate the service value of terrestrial ecosystem in China and figured out the selection of evaluation parameters may lead to misunderstanding conclusions [20]. Then, to more meet the actual situation of China, Xie et al., (2008) conducted a questionnaire survey on 200 Chinese experts, used the survey results to calculate a value per unit area of China’s terrestrial ecosystem [21] and had been widely used [22,23,24,25]. All the studies have enabled research on ecosystem services to become the focus of the academic community.
At present, the relevant methods used to measure the coordinated development of the ecological-economic (eco-economic) system include energy analysis, ecological footprint analysis, material flow analysis, the market value method, and the sustainability evaluation method [26,27,28]. However, the applicability of these methods is still restricted with respect to external ecological and socioeconomic factors, and also in terms of the accuracy of regional spatial analysis [29]. To overcome these shortcomings, and with the support of remote sensing and geo-information system technology, many scholars have adopted the eco-economic harmony (EEH) model to conduct regional eco-economic sustainability evaluations and spatial grading division. Nevertheless, these studies have mainly focused on large cities, plains, and areas experiencing rapid development. Conversely, large-scale research in mountainous areas is comparatively limited [30]. In China, mountainous areas account for 70% of the total area, and are inhabited by almost 40% of the population [31]. Mountainous areas are therefore important regions for population and economic studies. Moreover, the ecosystems of mountainous areas are often fragile, which poses substantial challenges for regionally sustainable development strategies. The ecological equilibria of such ecosystems can easily be damaged by the pressures associated with social, economic, and technological development [32]. Therefore, achieving a coordinated development of the economy and ecological environment in mountain areas has become a major scientific problem that needs to be resolved.
Hengduan Mountain area is not only a biodiversity priority area identified by The Nature Conservancy (TNC) but is also a “national key environment function zone”, designated by the Chinese Environment Function Division. However, in the process of pursuing economic development, land cover in Hengduan Mountain area is facing considerable pressure, and the ecological environment is under threat from many sources. In this study, we explored the coordinated development of the ecology and economy of Hengduan Mountain area, and discuss functional partitioning and evolutionary modelling of the ecosystem and economy in this area. In doing so, we aim to gain an understanding of the problems of ecological fragility and sensitivity in this region, and also to provide a scientific framework for coordinated economic development and maintenance of an ecological balance in this region.

2. Study Area

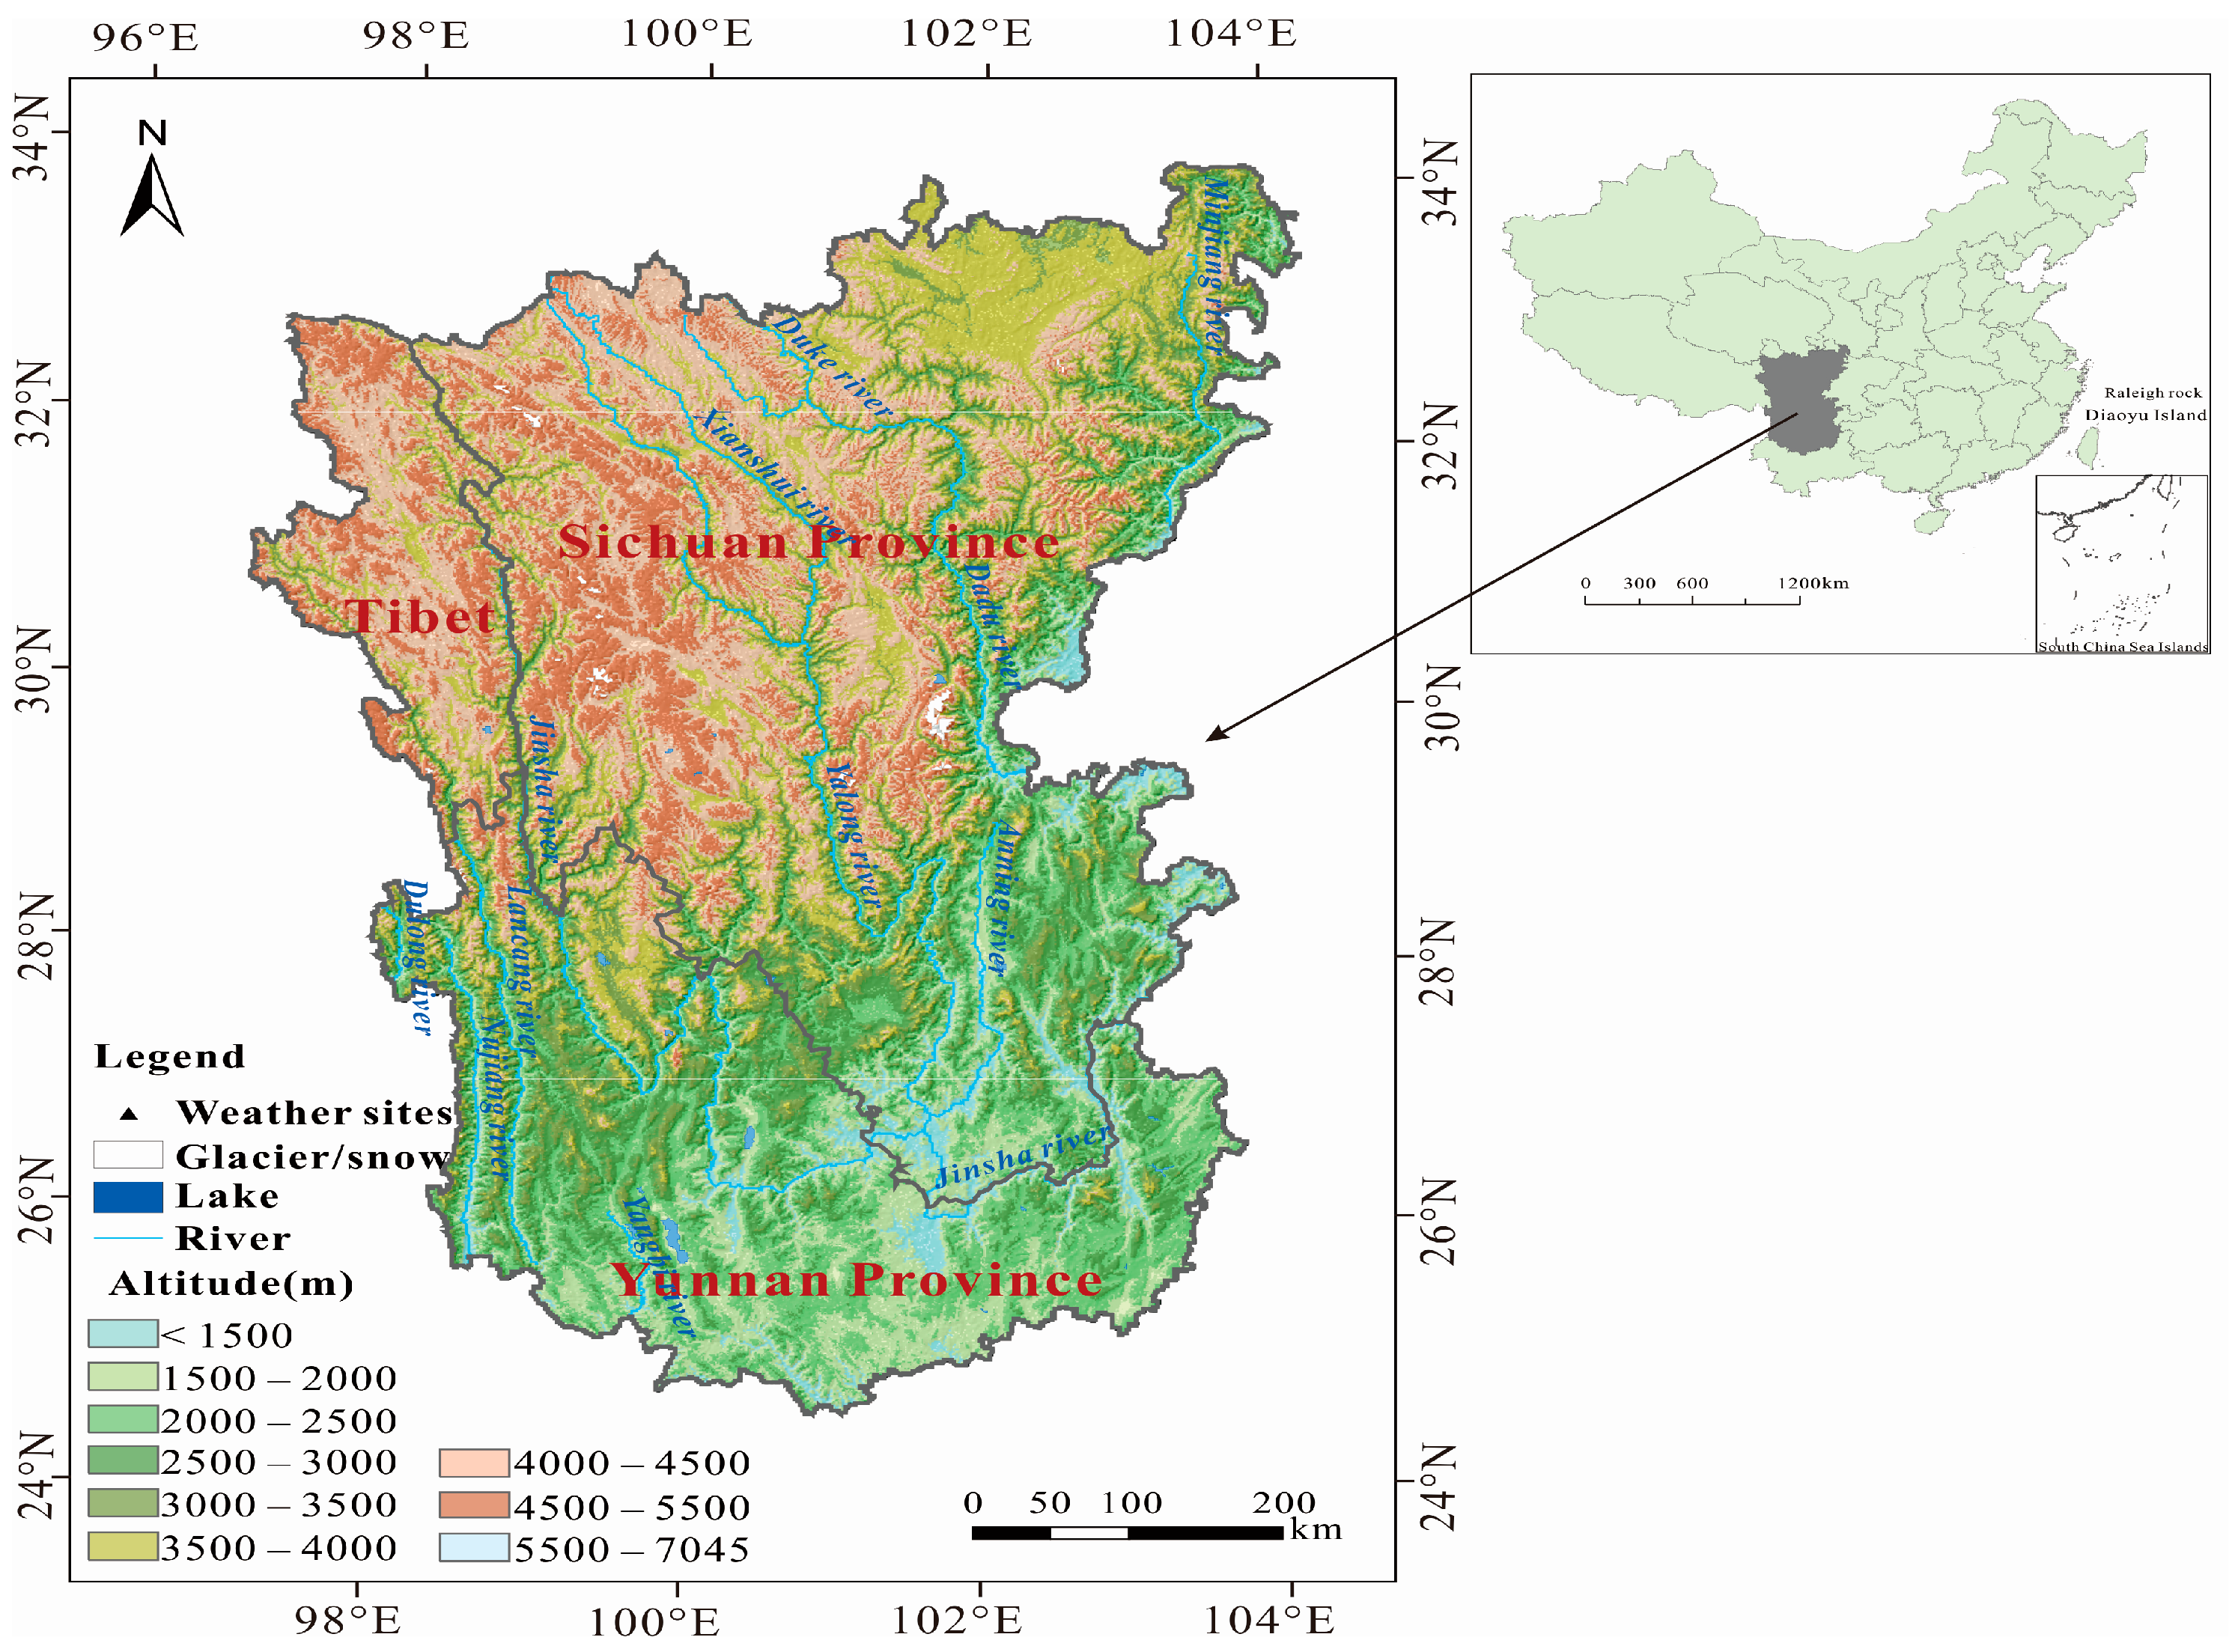
Hengduan Mountain area is located near the southeastern border of China’s Qinghai-Tibet Plateau and encompasses 98 counties (97°20’ E–104°25’ E, 24°30’ N–33°43’ N, Figure 1). Within its total area of 376,000 km2, there are a series of intersected east–west- and north–south-facing mountains and valleys. The terrain is high in the northwest and low in the southeast, with altitudes ranging from 219 m to 7447 m, and deep river valleys are typical of the region. Owing to the influences of the southwestern and southeastern monsoons from the Indian and Pacific oceans, respectively, the climate is warm and wet in the southeastern area, and cold and dry in the northwestern region [33]. As of 2014, the urbanization rate of the Hengduan Mountain area (20.31%) was somewhat lower than that of the remainder of China (54.77%). The gross domestic product (GDP) of this region was 471.518 billion RMB, which accounts for only 0.83% of China’s overall GDP. In an effort to enhance the economy of Hengduan Mountain area, large-scale production activities, including “Western Development”, have been implemented in this region. Forests have been destroyed and farmland has been converted to built-up land, resulting in serious ecological repercussions. This has inevitably led to conflicts among those with interests in food security, ecological protection, and economic development [34].

3. Materials and Methods

3.1. Data Resources and Processing

Land cover data used in this study came from NASA’s Landsat Thematic Mapper 5 (TM 5) remote sensing (RS) image data in 1990, 2000 and 2010, at a spatial resolution of 30 m × 30 m. The scenes of remote sensing image were 58, 57, 60 in 1990, 2000 and 2010, respectively. In the ENVI/ArcGIS platform, mosaic stitching, projection transformation, radiation correction, geometric correction, and resampling were conducted on the RS data. Land cover types in the Hengduan Mountain area were divided into six categories according to the land use/cover classification methods of the Resources and Environment Information Database of the Chinese Academy of Sciences (http://www.resdc.cn/). Six primary land cover classes were considered: farmland, forest, grassland, water, built-up land, and unused land. Among them, unused land refers to the land which was difficult to be used or has not been used, it includes sandy land, gobi, saline-alkali land, marsh, barren, bare rock and so on. A classification scheme, which includes acquirement and expression of knowledge, as well as application of knowledge in land cover classification [35] and the fusion technology of multi-source remote sensing image [36] have been applied to obtain land classification through visual interactive interpretation. In order to ensure the reliability of land cover data, its accuracy must be verified. Verification of the accuracy of land cover data in this place was conducted by the following steps. First, after the pre-treatments of remote sensing data, we carried on artificial interpretation and compared the interpreted data with data obtained from statistical yearbooks or related literature to verify its rationality from macroscopic view. Second, data was collected at sampling points in different land cover types to carry out more detailed verification of accuracy. Table 1 shows the area, proportion and interpretation accuracy of different land cover types in different years. From Table 1, we can see that the number of sampling points was 3600, 1110 and 2580 in 1990, 2000 and 2010, respectively. Overall, the average accuracy of land cover types was 90.02%, 86.70% and 73.82% in 1990, 2000 and 2010, respectively. This is reasonable and suggests that this method will be useful in related scientific research.
Data related to GDP and grain yield were obtained from Sichuan Statistical Yearbook (1991, 2001, 2011) [37,38,39], Yunnan Statistical Yearbook (1991, 2001, 2011) [40,41,42], and Tibet Statistical Yearbook (1991, 2001, 2011) [43,44,45]. In order to facilitate the research, the county-level unit was used as the basic research scale.

3.2. Methods

3.2.1. Assessment of Ecosystem Service Value (ESV)

According to related research [21], we classify ecosystem services into four primary categories including provisioning services, regulating services, supporting services and cultural services. Among them, provisioning services include food production and raw materials production, they mainly provide material support for human life and production. Regulating services include gas regulation, climate regulation, water regulation and waste treatment, they mainly adjust the material cycle and human ecological environment. Supporting services include soil conservation and biodiversity maintenance, they mainly ensure the stability of ecosystems and other functions. Cultural service only includes leisure, it mainly provides non-material interests to humans, such as spiritual and aesthetic experience. This classification effectively reflects the understanding of citizens and decision-makers on ecosystem services, and thus provides a valuable framework for assessing ecosystems and human well-being in the Hengduan Mountain area.
In this study, the ESV of the Hengduan Mountain area was calculated with reference to Costanza (1997) and Xie et al., (2008, 2003) [21,46]. The formula is as follows:
ESV = k = 1 n ( A k V C k )
where, ESV is the ecosystem service value, and the unit is 100 million yuan; AK is the area of the k-th land cover type, and the unit is ha; VCk is the eco-service coefficient of the k-th land cover type, and the unit is yuan/(ha × a); and n is the number of land cover types.
Based on Costanza et al.’s parameters, Xie et al., (2008) [21] extracted the equivalent weight factor of ecosystem services per hectare of terrestrial ecosystems in China and modified the value coefficient of Chinese ecosystem (Table 2). The average natural food production of cropland per hectare per year was used to define a standard unit (1) of ecosystem service value. Generally, the natural food production is proposed to be 1/7 of the actual food production. The average actual food production of cropland in the Hengduan Mountain area was approximately 4354.36 kg/ha from 1990–2010, and the average price of grain was 2 yuan/kg in 2010 (the average selling price of three major economic crops: rice, wheat, and corn, China Yearbook of Agricultural Price Survey 1991, 2001 and 2011) [47,48,49]. Hence, the ecosystem service value of one equivalent weight factor for the Hengduan Mountain area is, therefore, 1244 Yuan.
Ecosystem service value of per unit area of each land cover category in the Hengduan Mountain area was then assigned based on the nearest equivalent ecosystems (Table 3). For example, forest equates to forest, unused land equates to barren land, farmland equates to cropland, water equates to water body, and grassland equates to grassland. The service value for built-up land is zero [50]. Although the biomass used as proxies for the land cover categories are clearly not perfect matches in every case [51], they are related. Estimation of the ecosystem service value based on land use data has been applied and proves feasible in other case studies [52].

3.2.2. Eco-Economic Harmony (EEH)

EEH refers to the ratio of the change rate of ESV per unit area to the change rate of GDP per unit area in the study period, and its calculation is as follows:
EEH = E S p r G D P p r
G D P p r = G D P p j G D P p i G D P p i
E S p r = E S p j E S p i E S p i
where, ESpi and ESpj respectively indicate ESV per unit area (yuan/hm2) in the start year and the end year of a certain period in the study area; whereas GDPpi and GDPpj refer to GDP per unit area (yuan/hm2) in the start year and the end year of a certain period in the study area, respectively.
There are four possible cases in Formula (2): ① (3) > 0 and (4) > 0, then (2) > 0, indicating that economy and ecosystem are in the coordinated state; ② (3) > 0, (4) < 0, then (2) < 0, suggesting that economy and eco-system are in the uncoordinated state; ③ (3) < 0 and (4) > 0, then (2) < 0, denoting that economy and eco-system are in the uncoordinated state; ④ (3) < 0 and (4) < 0, then (2) > 0, showing that economy and ecosystem are in the most uncoordinated state. According to the statistics of this study, GDP of all the research units in the Hengduan Mountain area is in the state of increasing from 1990 to 2010, so Case ③ and Case ④ do not exist.
EEH ≥ 1 indicates that ESV growth is not lower than GDP growth during this period of time in the study area, and that the economy and ecology are in a coordinated state. 0 ≤ EEH < 1 indicates that ESV growth lags behind economic growth in the study area, and that economic development is placing increasing pressure on the ecological environment. However, the ecological environment has not deteriorated, and the economy and ecology are still coordinated. −1 ≤ EEH < 0 indicates that ESV growth is negative in the study area, and that development has already had harmful effects on the ecological environment. Consequently, the relationship between the economy and ecology has entered an uncoordinated orbit.
Considering the characteristics of the Hengduan Mountain area and related research [53], the classification of EEH can be carried out in accordance with the following criteria (Table 4):

4. Results

4.1. Characteristics of Land Cover Changes

Table 5 shows that from 1990 to 2010 there were significant differences in land cover changes among six land cover types, with grassland showing the highest increase (1.18 × 10⁴ km2), followed by unused land and built-up land, which increased by 2.93 × 10³ km2 and 245.80 km2, respectively. Farmland showed the highest decrease of 9.41 × 10³ km2, followed by forest and open water, which decreased by 5.49 × 10³ km2 and 74.70 km2, respectively.
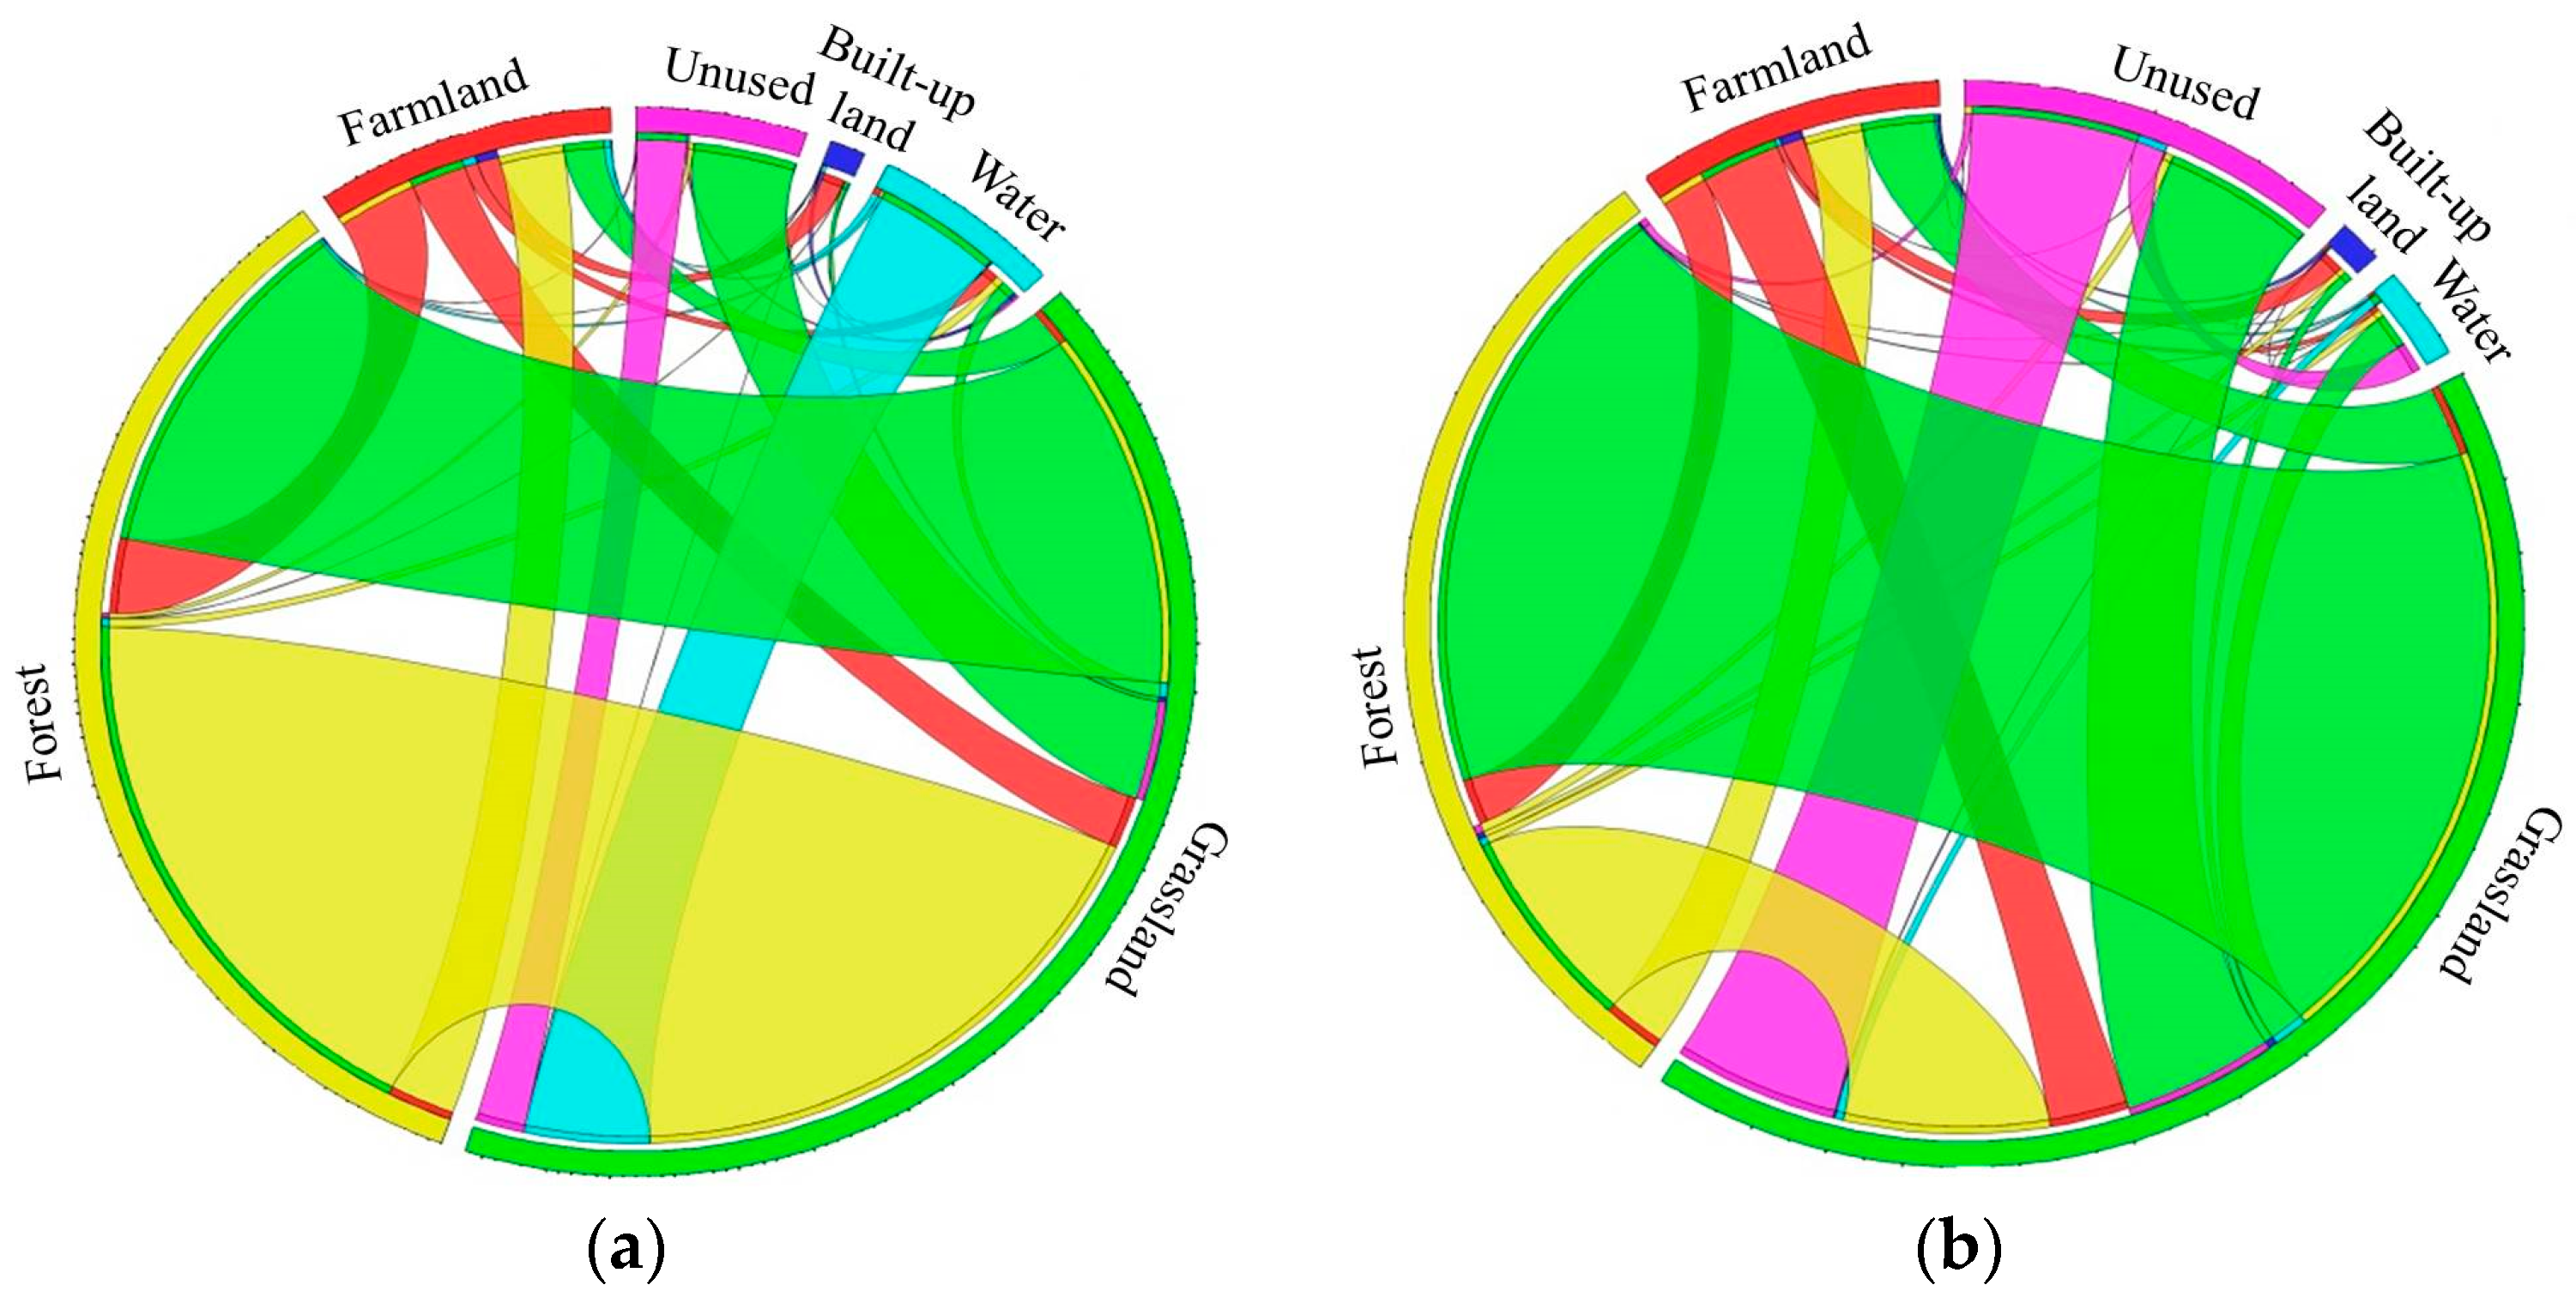
Through calculation, we can see that the extents of land cover transition from 1990 to 2000 and from 2000 to 2010 were 6520 km2 and 21,589 km2, respectively, suggesting that the land cover change from 1990 to 2000 was less intense than it was from 2000 to 2010. From 1990 to 2000 (Figure 2a), land transition patterns were primarily characterized by decreases in the area of forest, farmland, and water, and concomitant increases in the areas of grassland, built-up land, and unused land. Among these various transitions, the conversion from forest to grassland was predominant. From 2000 to 2010 (Figure 2b), land transition patterns indicated a loss of farmland, grassland, and unused land, and an increase in forest, water, and built-up land. During this period, the most conspicuous trend was the conversion of grassland to forest.

4.2. Evolution Characteristics of Ecosystem Service Functions

4.2.1. Changes of ESV in Different Land Cover Types

ESVs in 1990, 2000, and 2010 were 1381.67, 1035.62, and 1050.92 billion RMB, respectively (Table 6), signaling a fluctuating downward trend and indicating a deterioration of the ecological system in the Hengduan Mountain area. The proportion of the ESV of forest was the largest, accounting for 69% of the total ESV, and the reduction of forest accounted for 73.4% of the total reduction in ESV, indicating the importance of forest to ecosystem stability.

4.2.2. Changes of Value in Different Eco-Service Functions

Among the values of different eco-service functions (Table 7), biodiversity maintenance ranked first (15.80%), soil conservation second (15.40%), followed by water regulation (14.45%), gas regulation (14.20%), climate regulation (13.90%), raw material production (8.30%), waste treatment (8.35%), leisure (7.30%), and food production (2.20%). The value of biodiversity maintenance was seven times as great as food production, illustrating the ecological importance of Hengduan Mountain area.
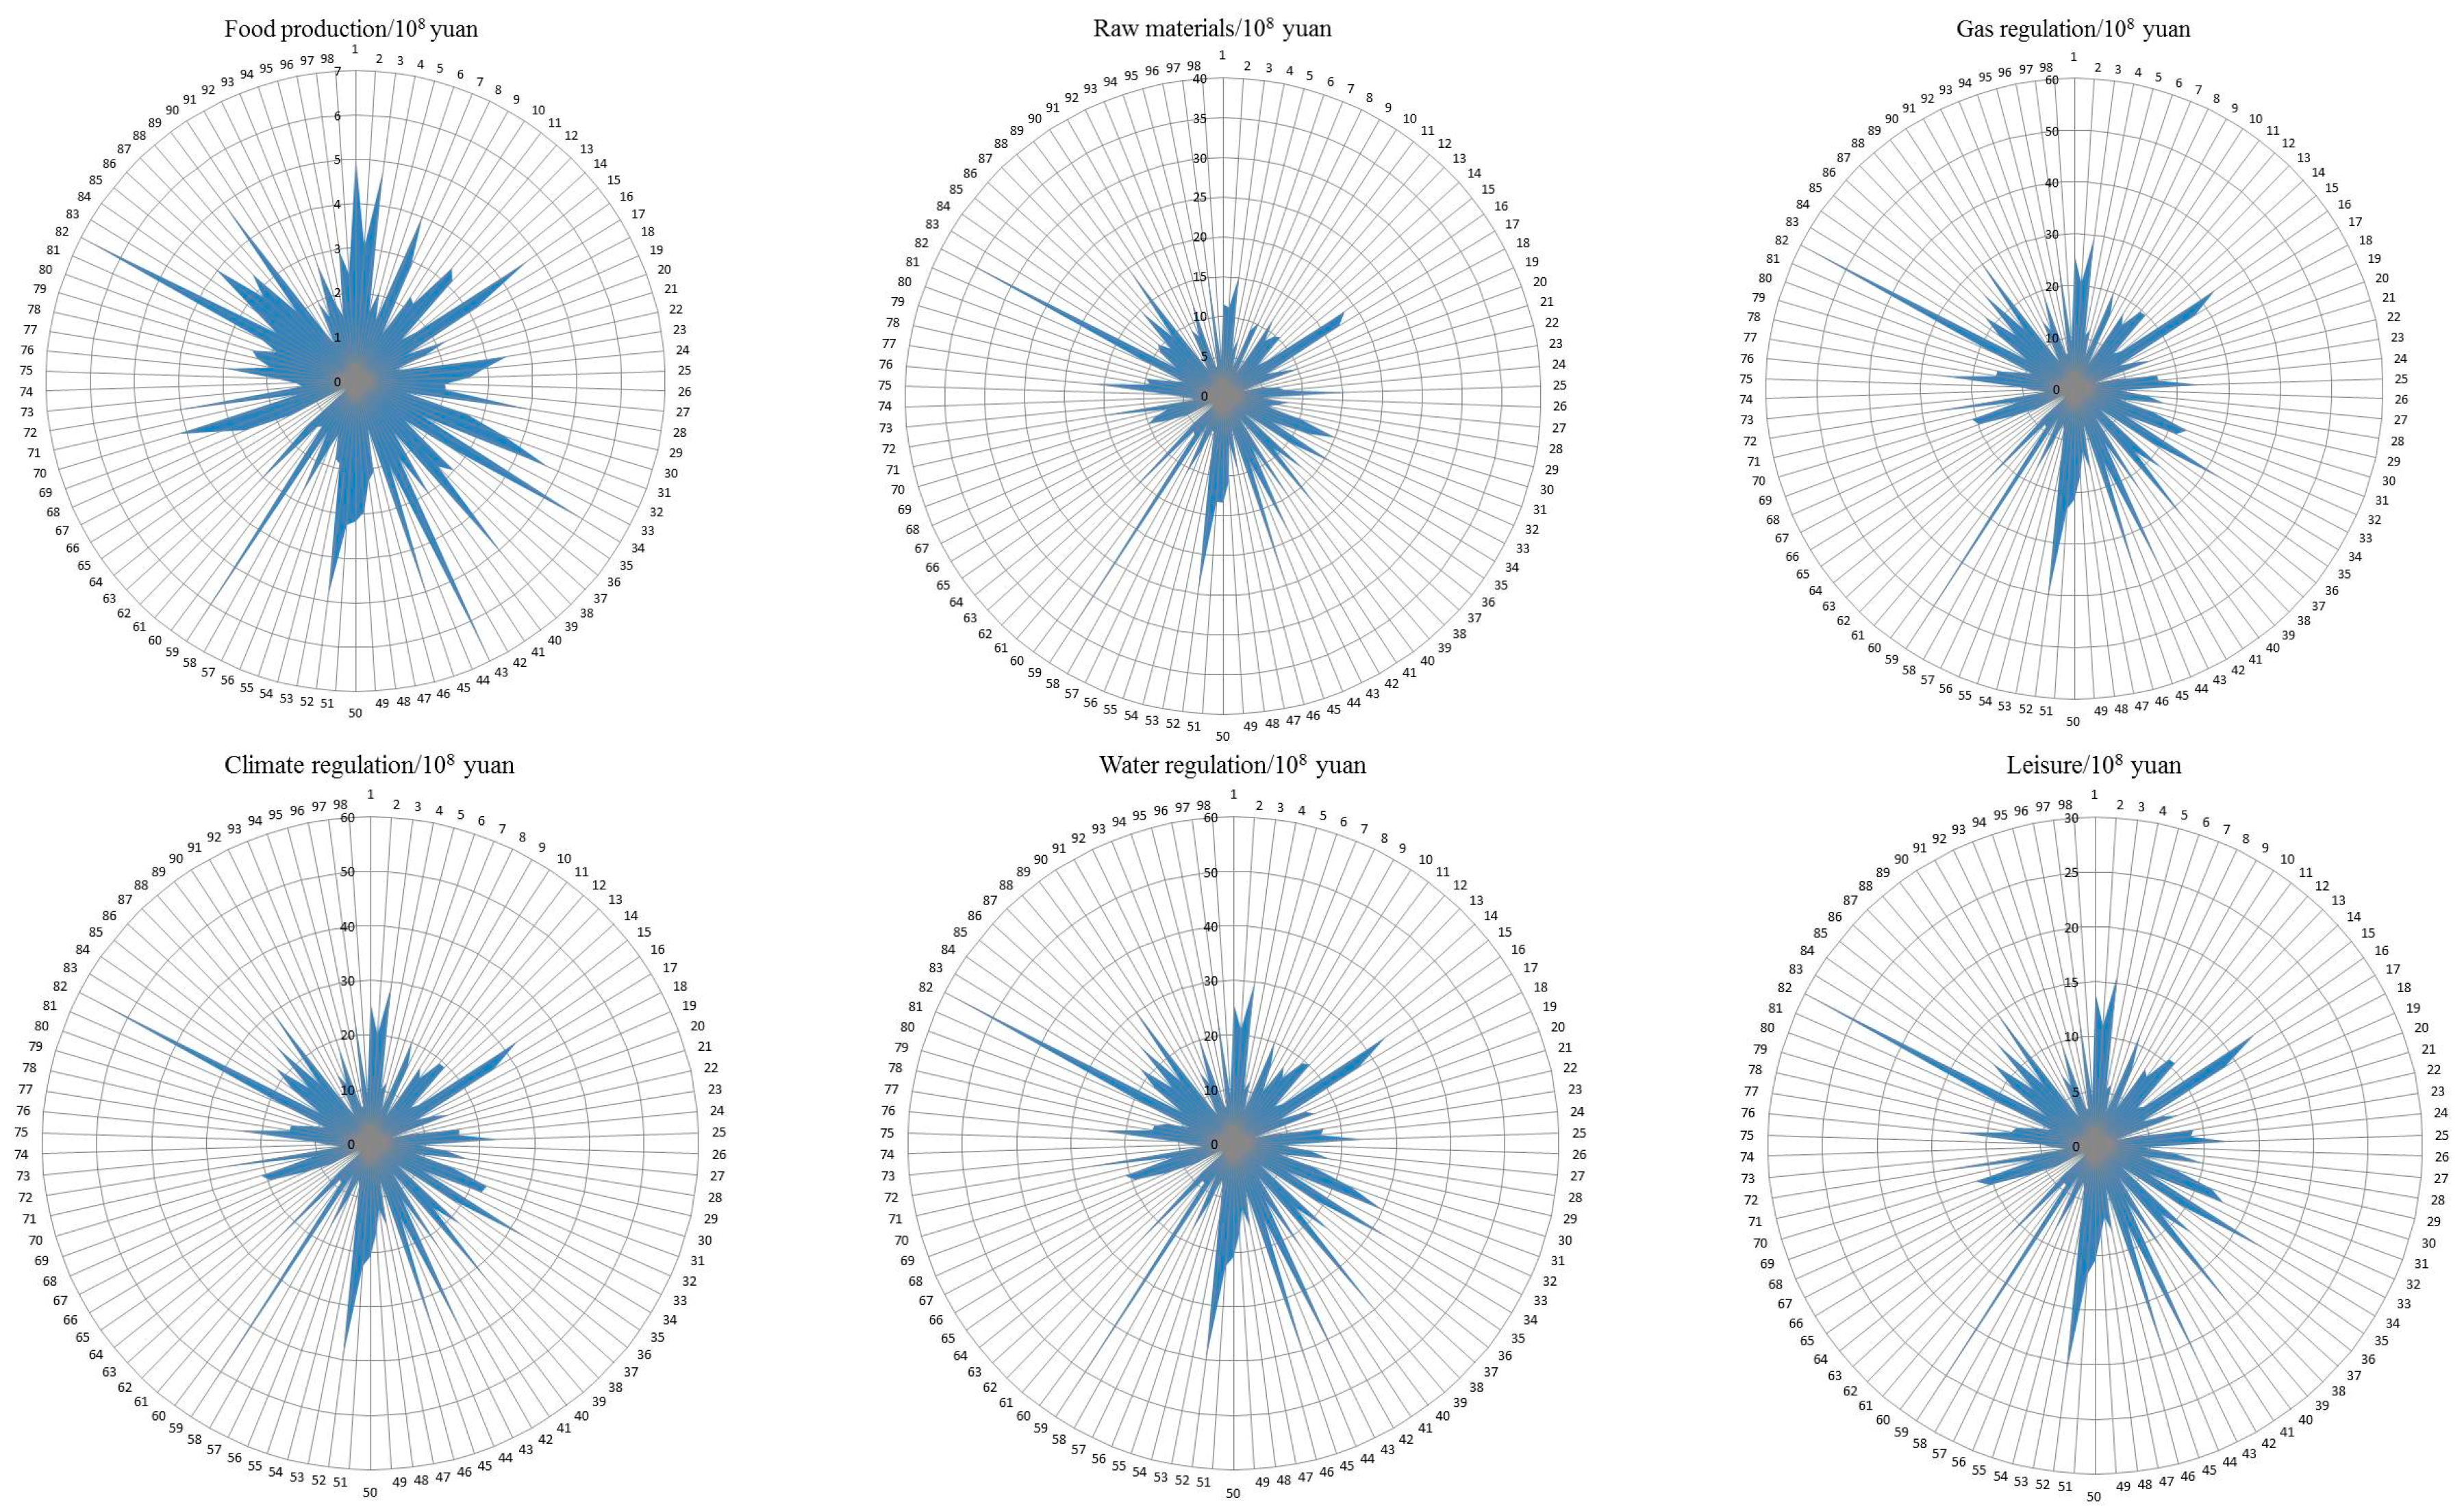
From Figure 3, although the value of various eco-service functions was different, their value distributions were similar, indicating the close correlations between them. Among various counties, the counties whose values for various eco-service functions were the greatest and the smallest were Shangri-la County and Panzhihua City, respectively.

4.2.3. Spatial Evolution of ESV

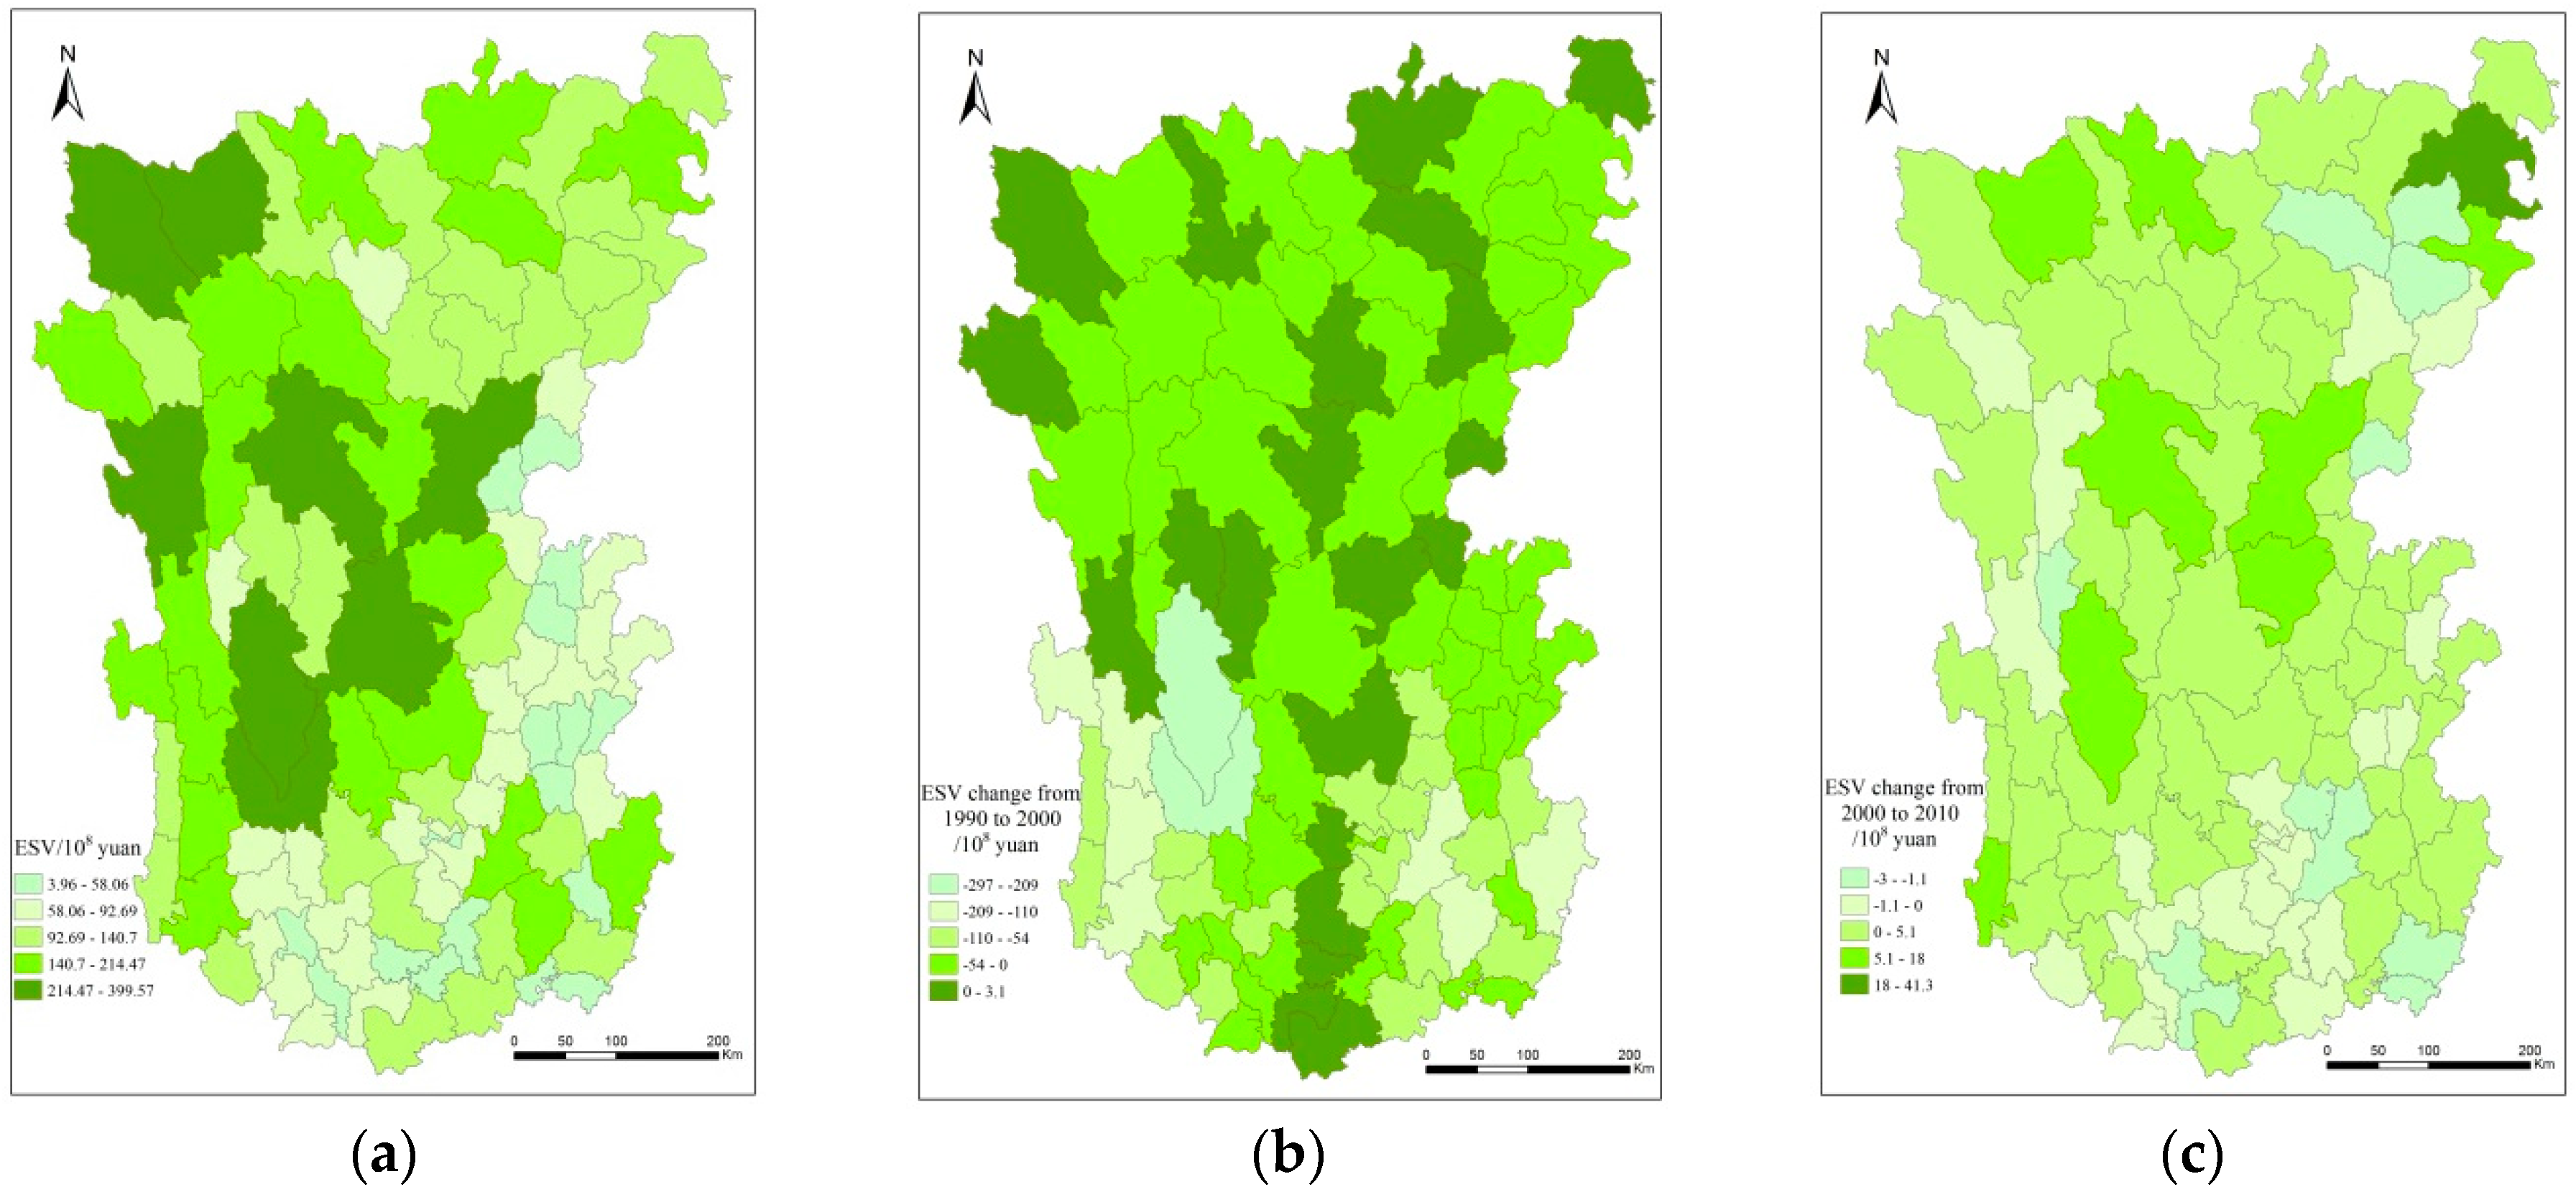
It can be seen from Figure 4a that the ESV of the central Hengduan Mountain area was slightly higher than that of the northern region, which in turn, was higher than the southern region, forming a significant “convex” shape. From 1990 to 2000, changes in ESVs fluctuated between 3.10 × 10⁸ RMB and −297 × 108 RMB (Figure 4b), wherein there were more counties (reaching 78.57%) whose ESVs were decreasing, distributing throughout the whole area. From 2000 to 2010, the change in ESVs was between 41.30 × 10⁸ RMB and −3 × 10⁸ RMB (Figure 4c), wherein counties whose ESVs were increasing rapidly (65.31%), were mainly located in the Sichuan Province, as well as northeast and northwest of Yunnan Province.

4.3. Economic Development in Hengduan Mountain Area

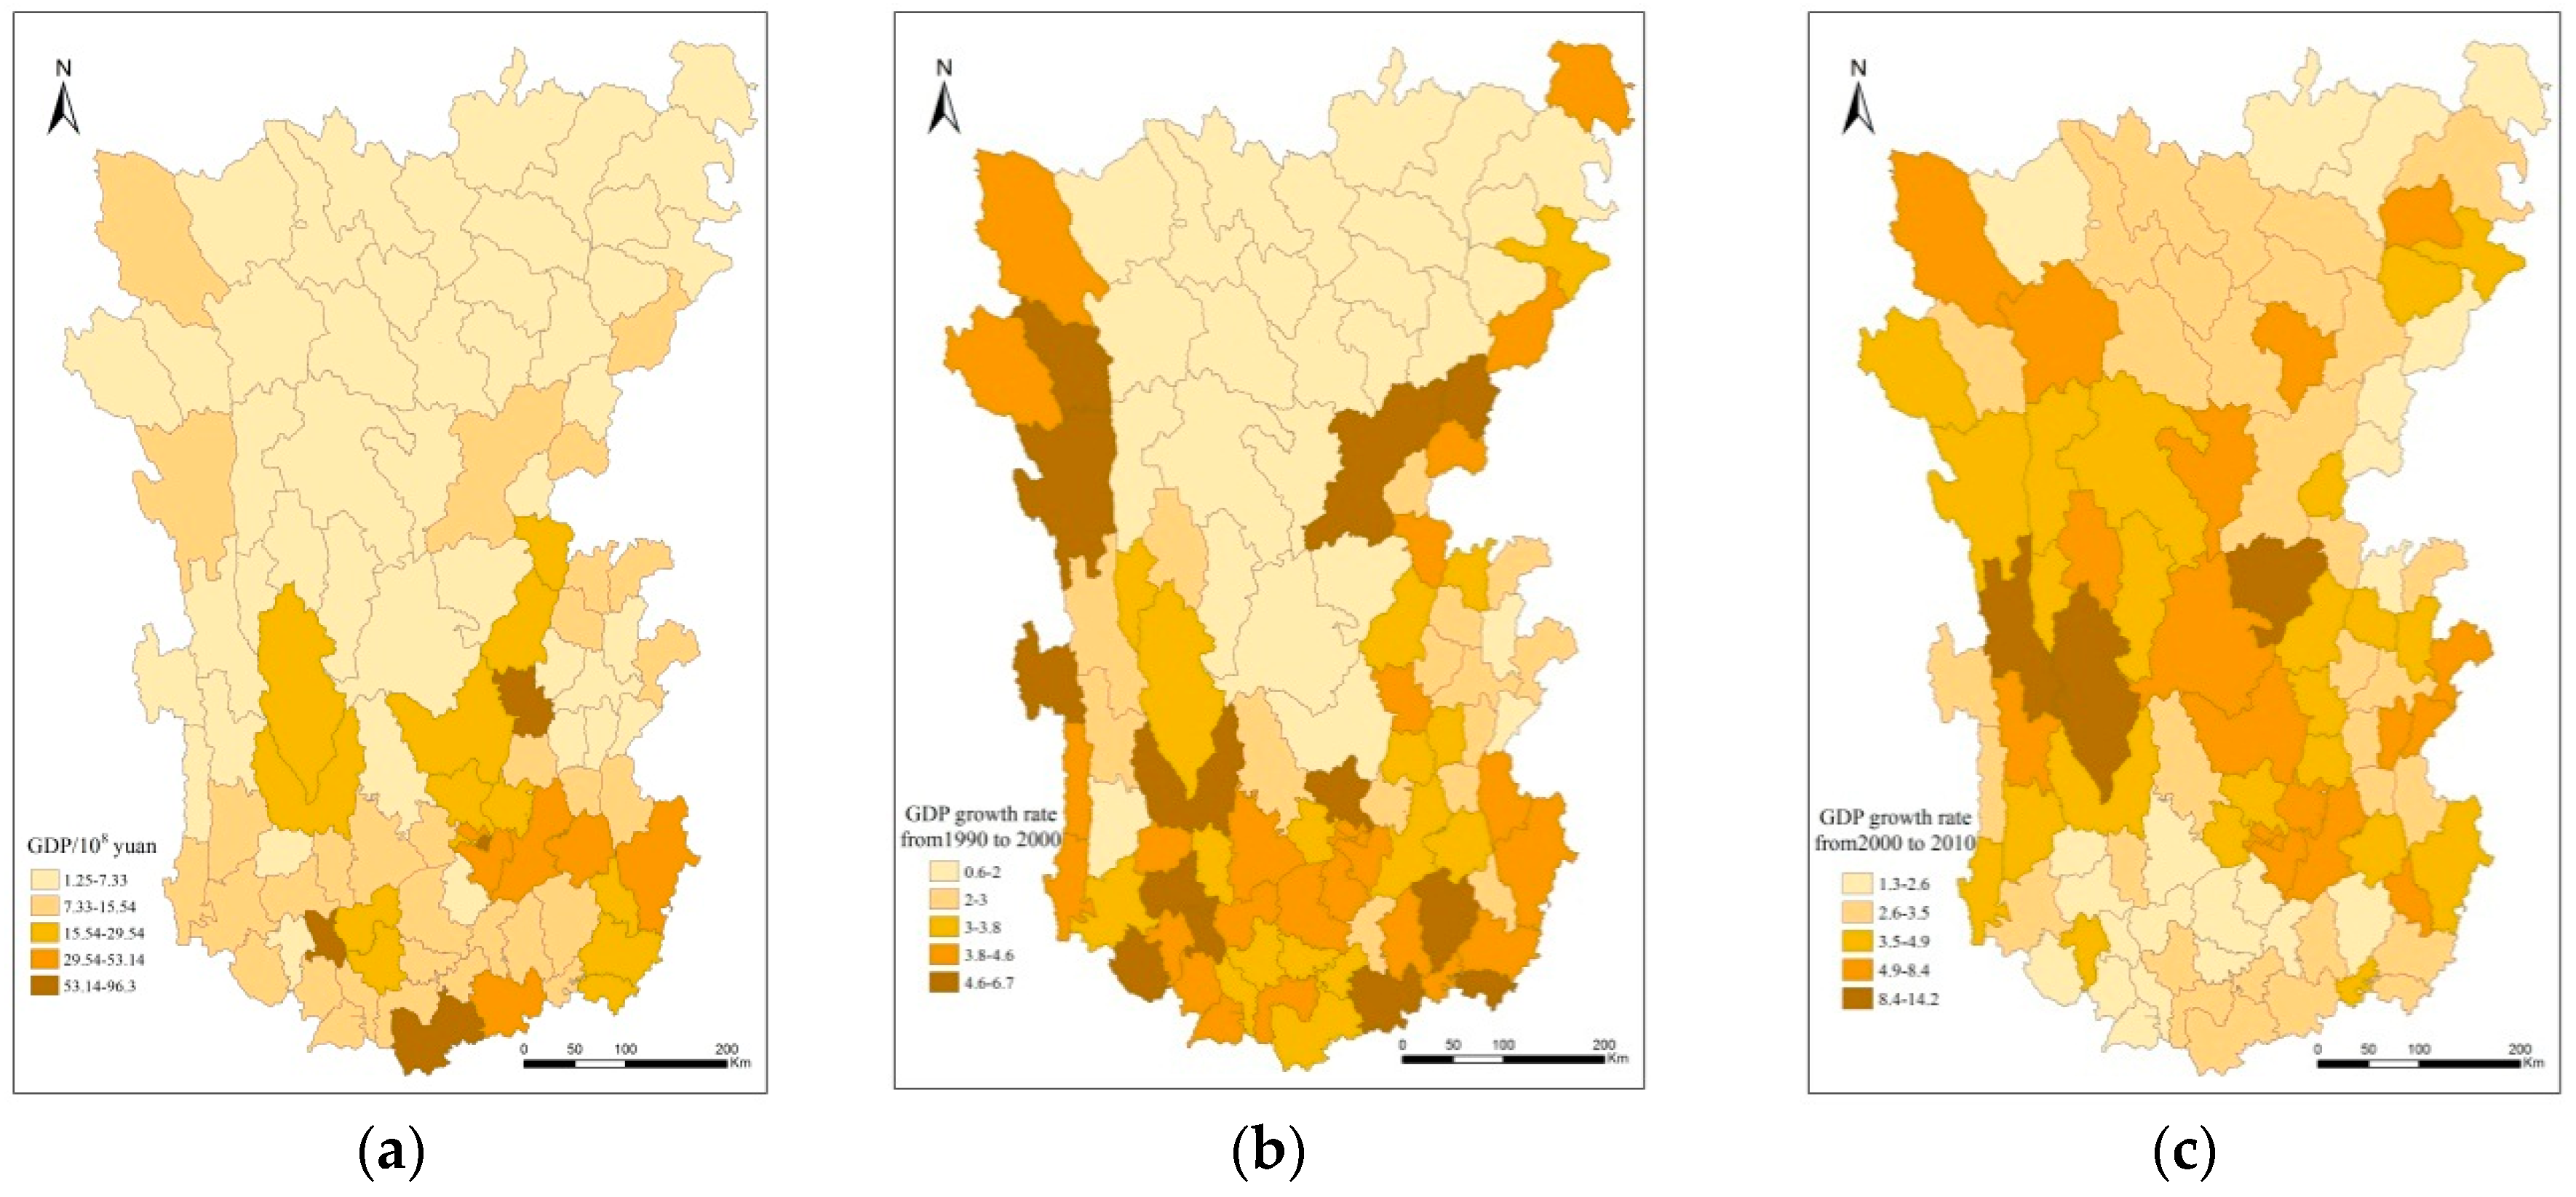
The GDP of the Hengduan Mountain area increased from 14,135 billion RMB in 1990 to 321,866 billion RMB in 2010, increasing nearly 23-fold over 20 years. In space, the GDP of southern region was higher than the central part, which was higher than the northern region (Figure 5a). From 1990 to 2000, the growth rate of GDP was relatively slow, fluctuating between 0.60 and 6.70 (Figure 5b), and its distribution of growth trend was similar to the partition of GDP. From 2000 to 2010, the growth rate of GDP was relatively high, between 1.30 and 14.20 (Figure 5c), presenting the “convex” shape characteristic in which the central region was higher than that of the northern part, which was higher than the southern region.

4.4. Evaluation of EEH in Hengduan Mountain Area

4.4.1. Characteristics of EEH in Hengduan Mountain Area

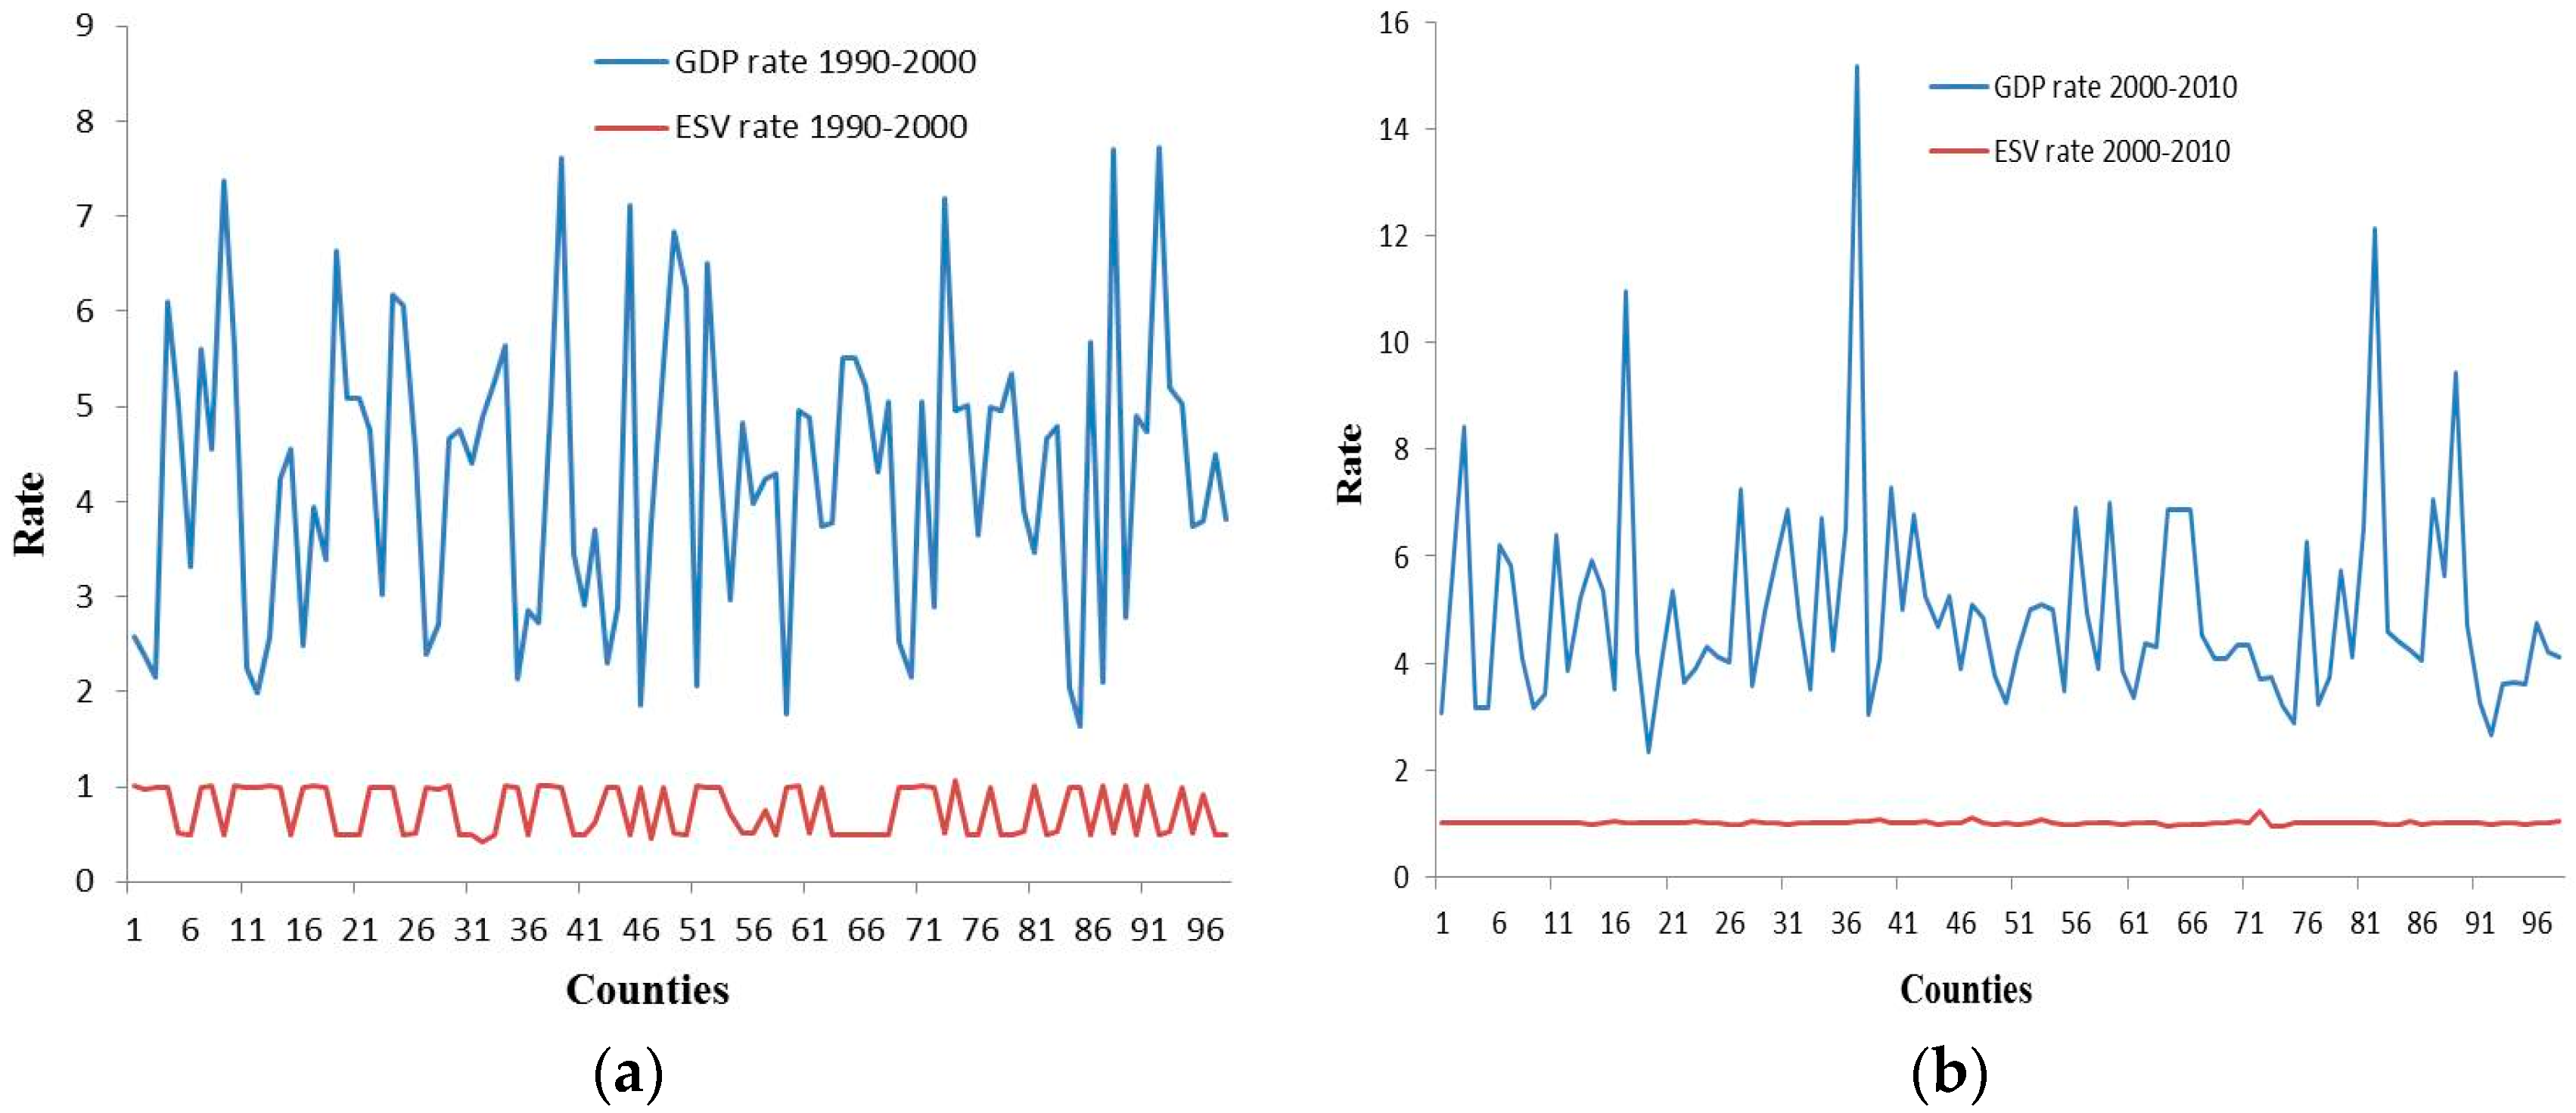
From 1990 to 2000, there was a large gap between ESV and GDP of each county, and many counties fluctuated reversely (Figure 6a). This suggested there were marked differences in the development of eco-economic system among different counties, and their overall coordination was poor. From 2000 to 2010 (Figure 6b), in addition to several counties, the volatility of most counties was not severe. This indicated that differences of eco-economic system of all counties were declining, the degree of coordination showed an improvement.
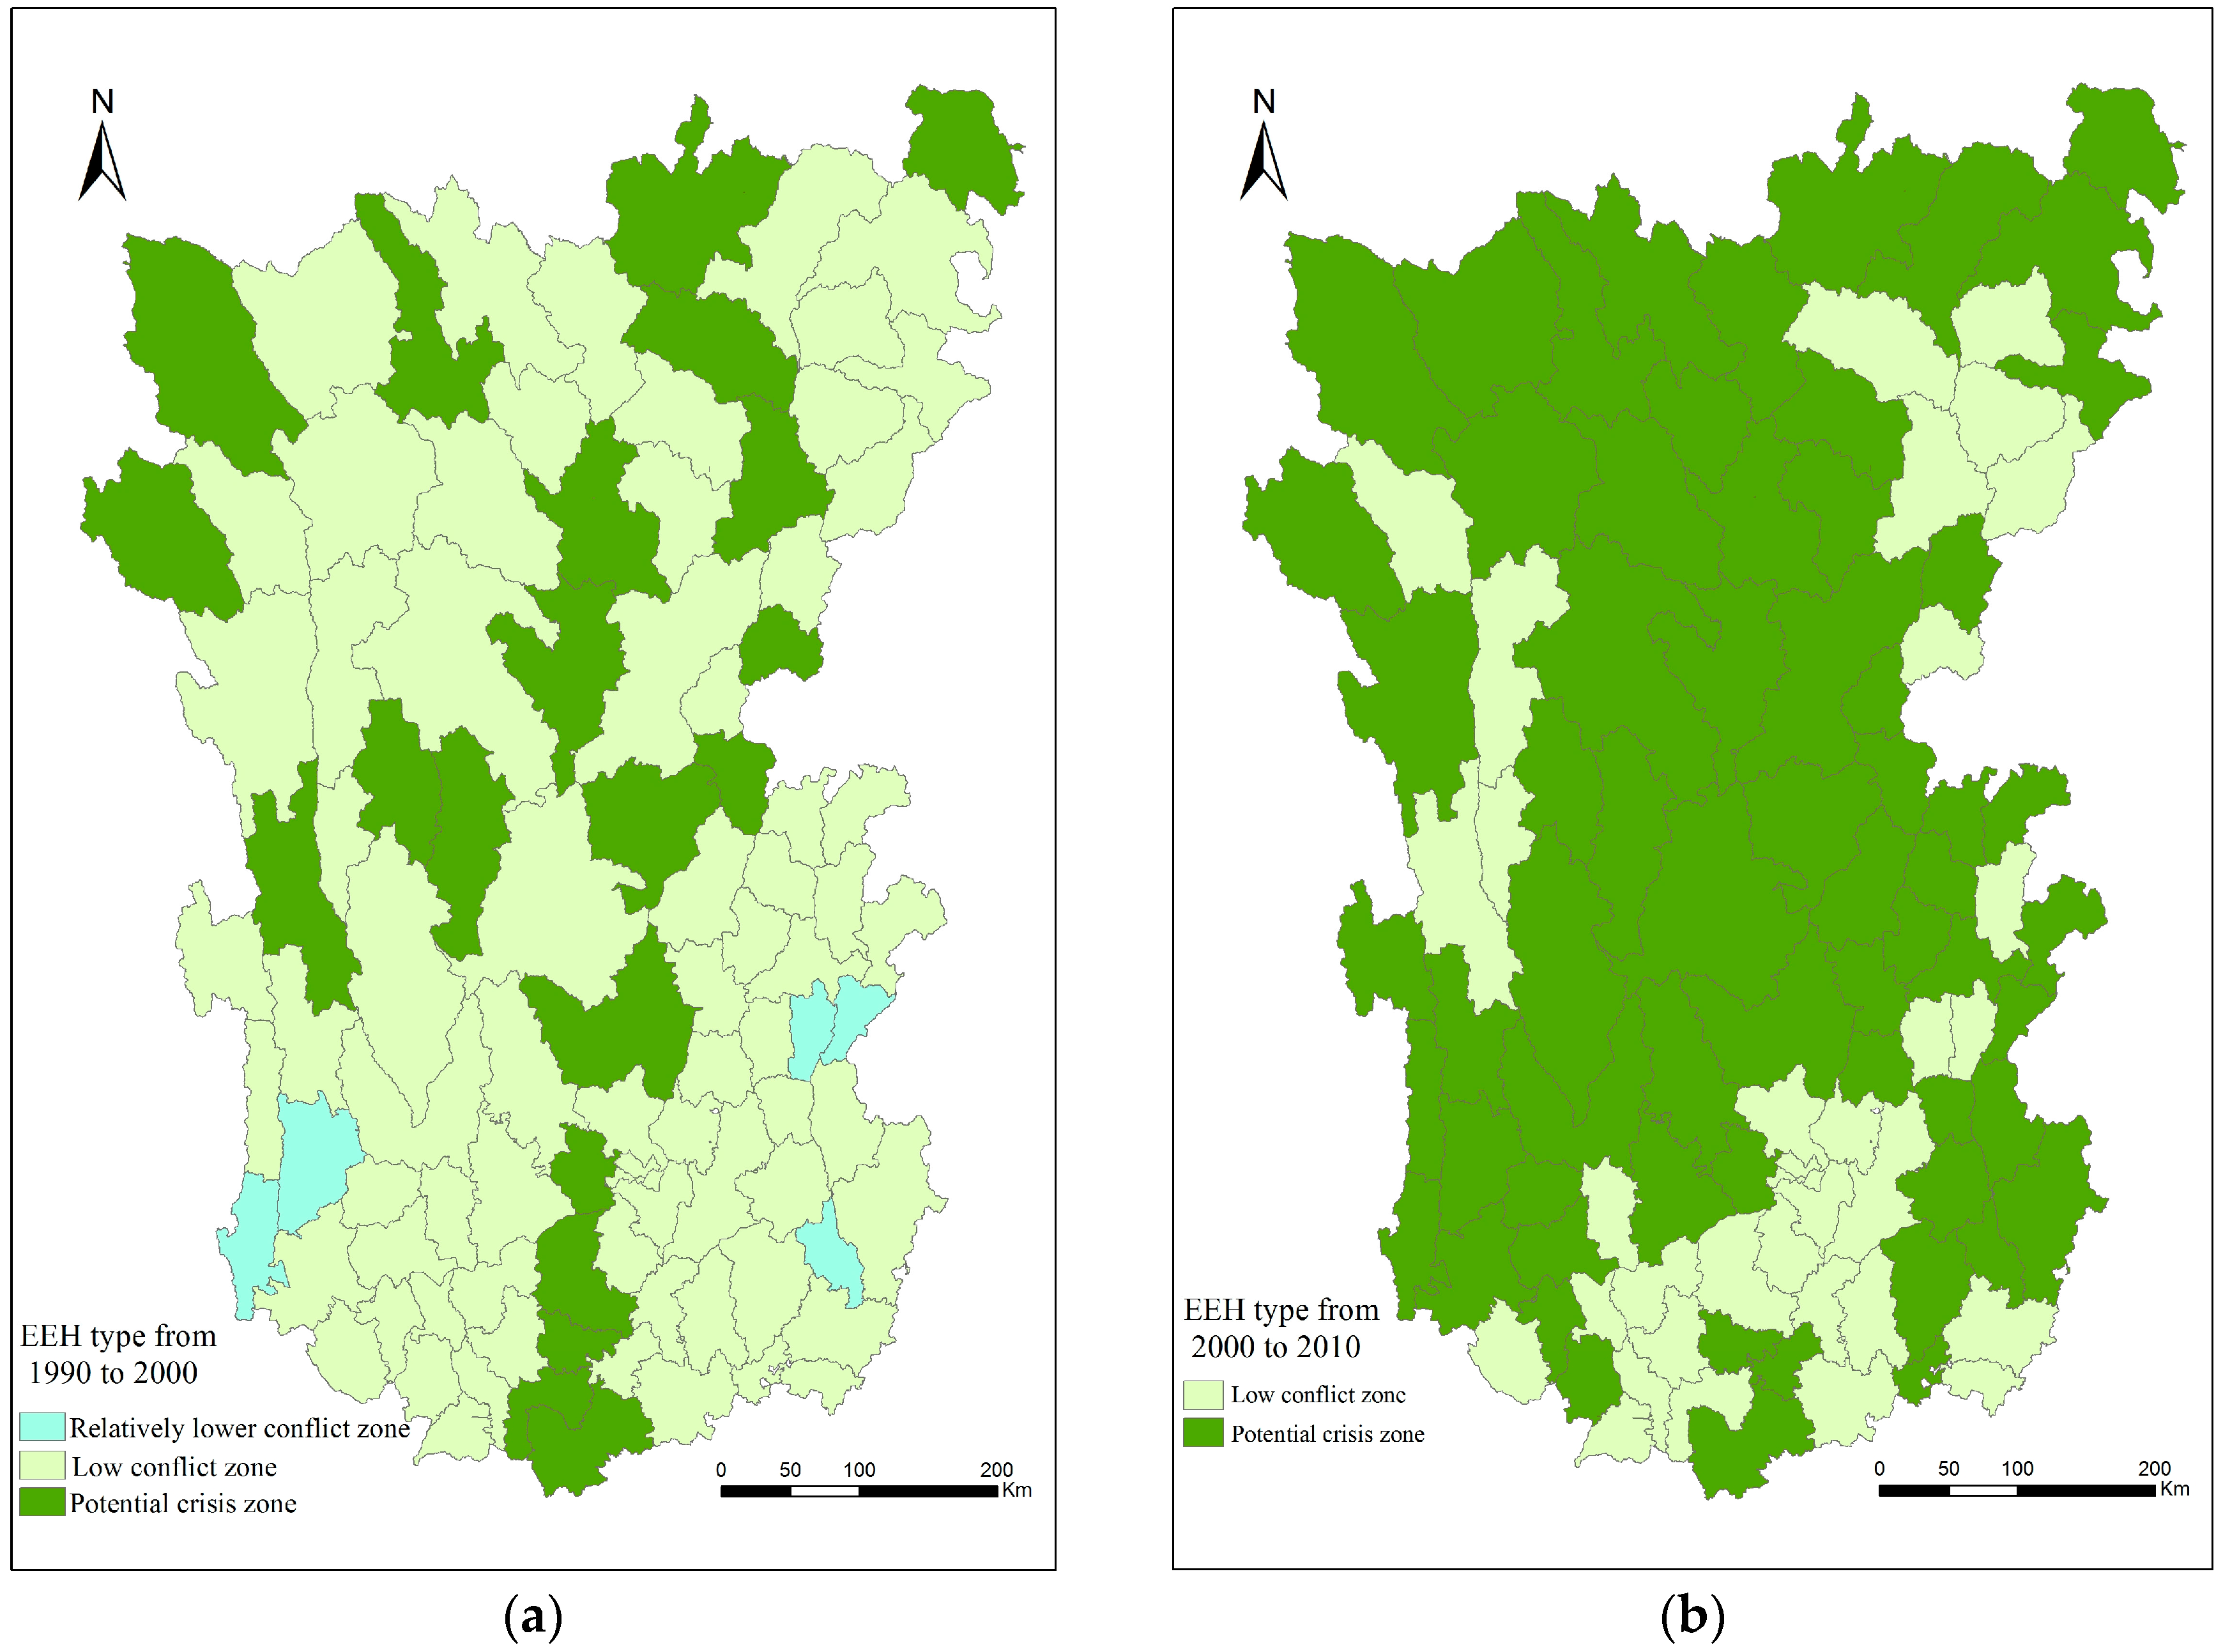
The EEH of the Hengduan Mountain area was characterized by a dual-core spatial structure centered on the low conflict zone and potential crisis zone (Table 8). Wherein, from 1990 to 2000, the relationship between economy and ecology presented a trend of concentrated low conflict. There were 3 types of EEH, namely E, F, and G. Of 98 research units, 77 counties, distributed in clump shape in Hengduan Mountain area, were in the conflict stage and 21 counties, scattered in the whole study area, were in potential crisis (Figure 7a). From 2000 to 2010, the eco-economic relationship in the Hengduan Mountain area had a trend of concentrated potential crisis. There were only 2 types of EEH, namely F and G. Among all counties, 34 belonged to low conflict units, concentrating in southern the Hengduan Mountain area and 64 were potential crisis units, locating in the central and northern part (Figure 7b). Overall, the eco-economic conflict in Hengduan Mountain area was not severe, but the coordination degree was not high; it was in the transitional stage of conflict to coordination.

4.4.2. Evolutionary Partition of EEH in Hengduan Mountain Area

Through transformation matrix, there were four evolutionary partitions of EEH, which were low conflict zone, potential crisis zone, slight improvement zone, and significant improvement zone. From 1990 to 2010, slight improvement zone and significant improvement zone occupied 55.15% of the whole area (Table 9), indicating economic development is playing a positive role in the ecological environment. Meanwhile, eco-economic relationship of 44.85% counties was in a contradiction-prone and unstable stage.

4.4.3. Aggregation Modes of EEH Evolution in Hengduan Mountain Area

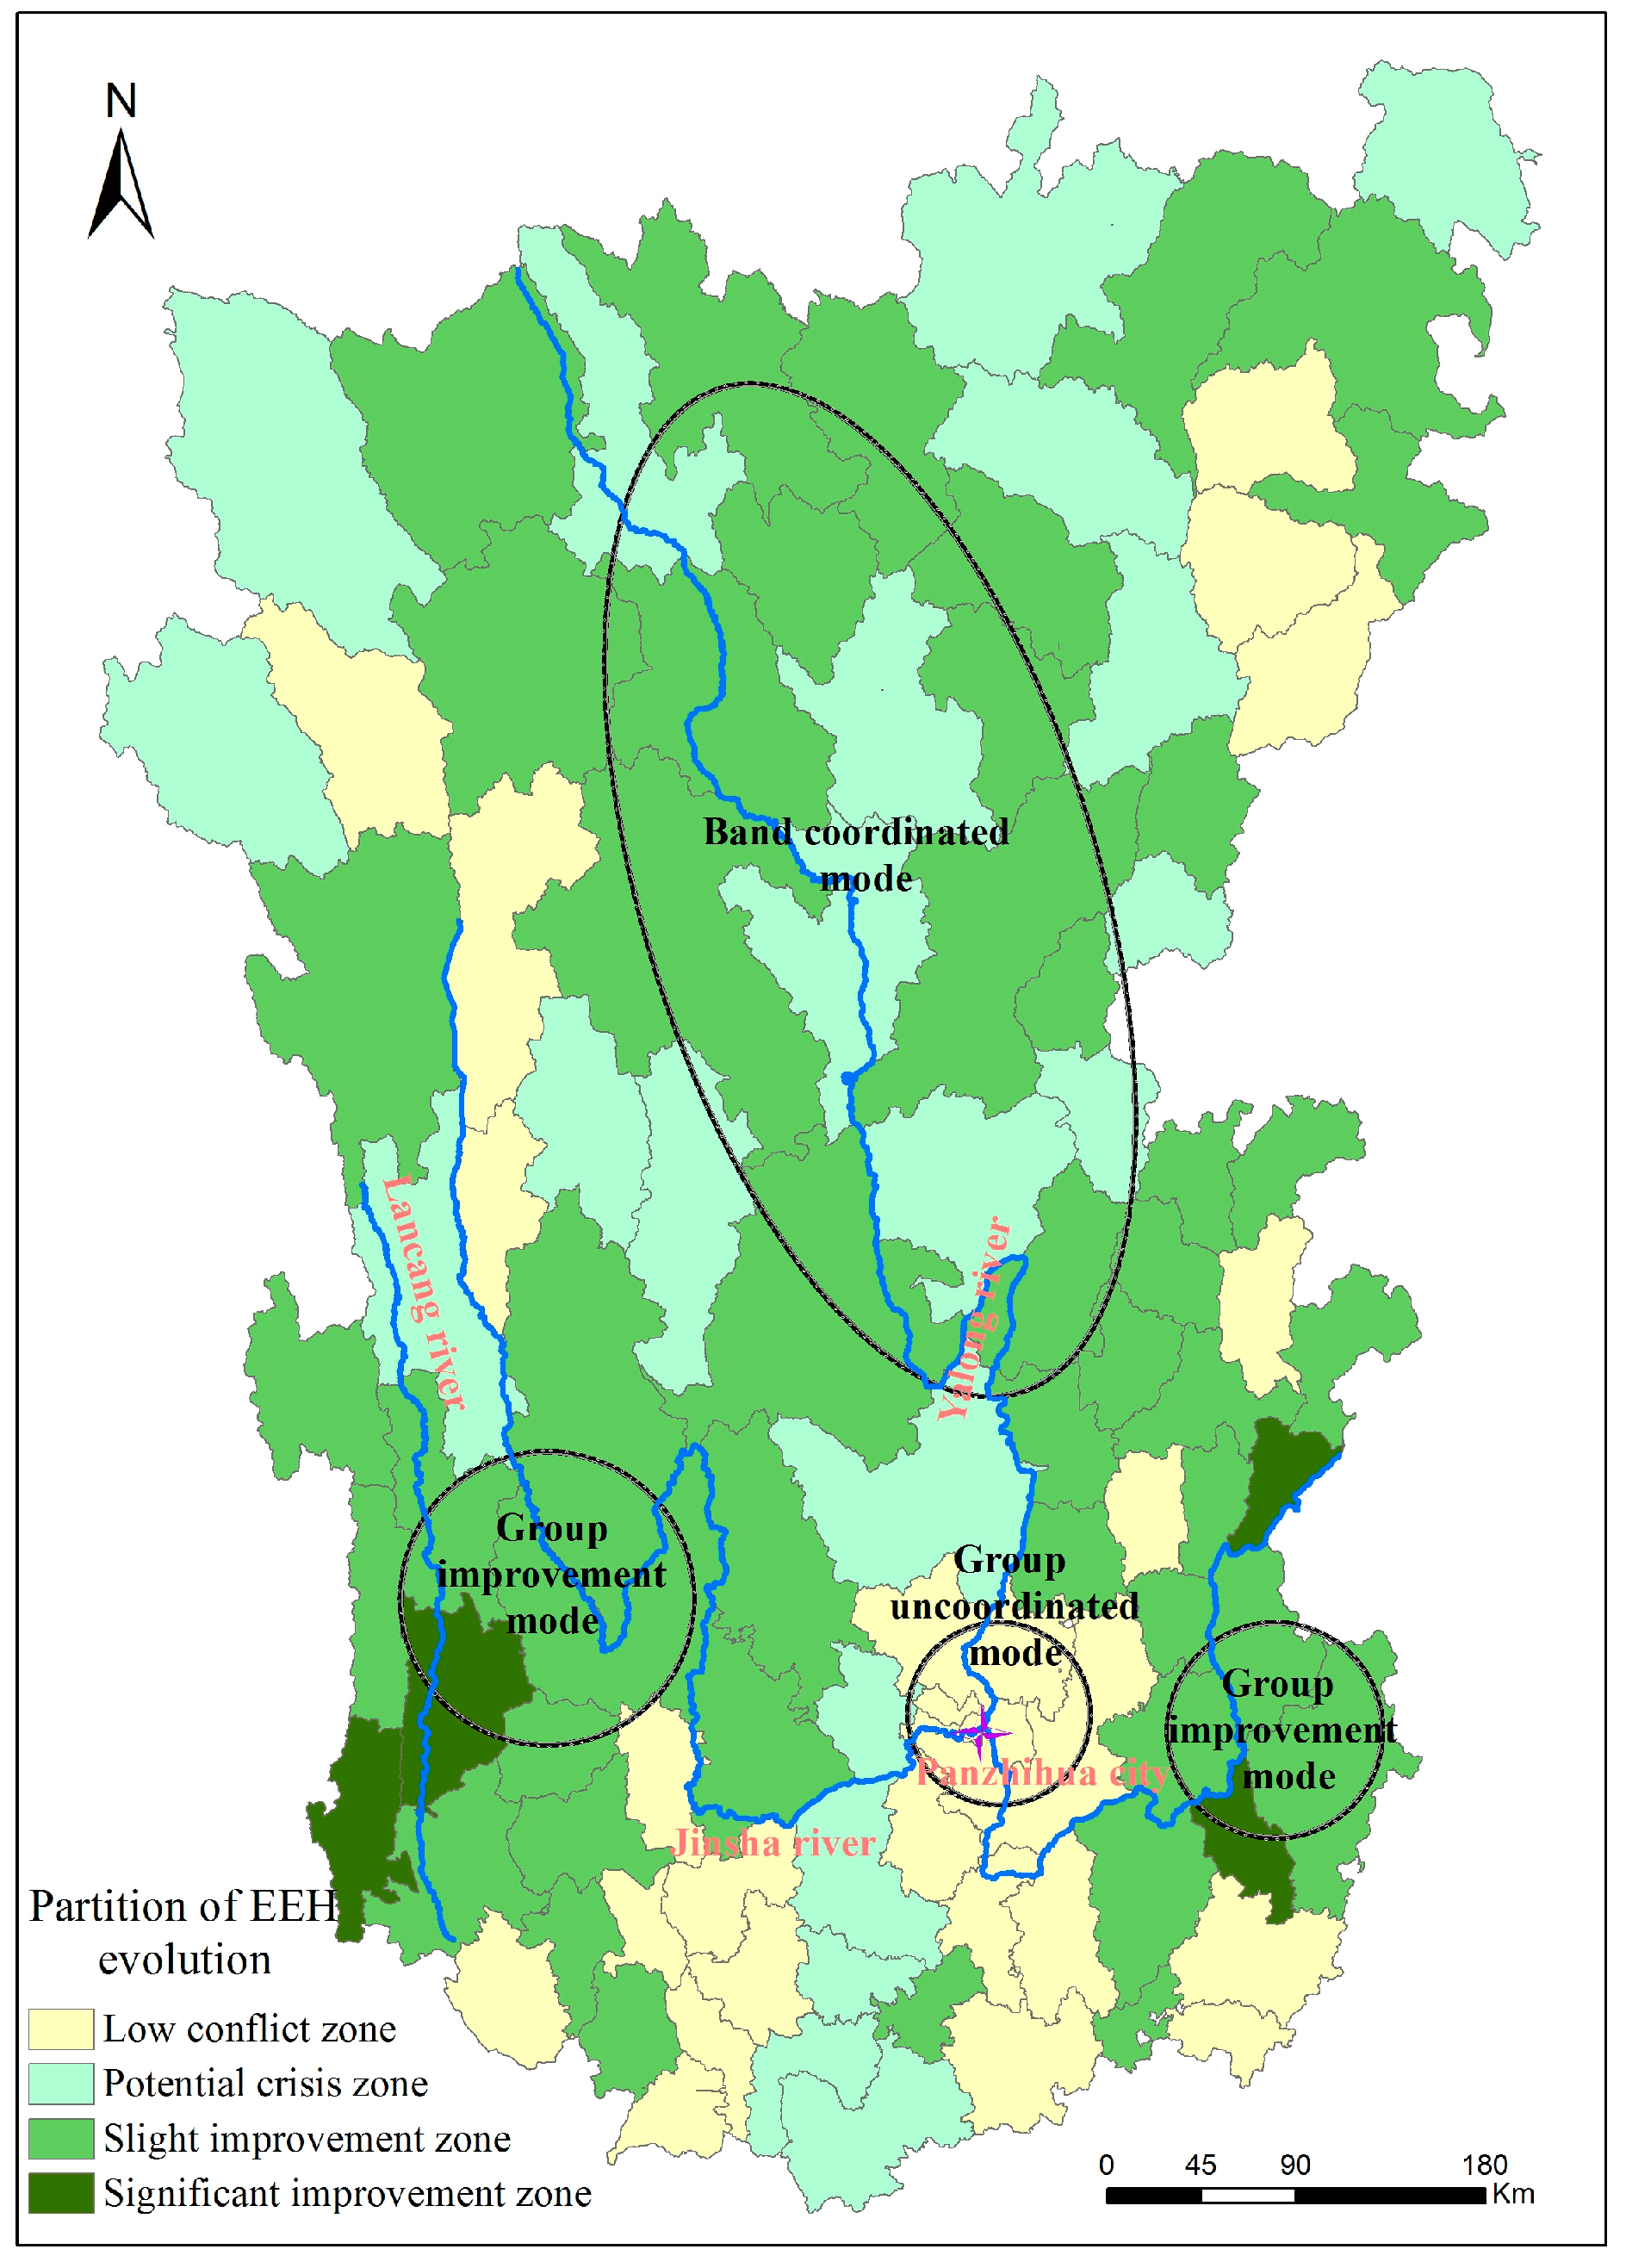
By taking into consideration the spatial distribution, evolution, and spatial agglomeration of EEH, we established three aggregation modes (Figure 8). The band coordinated mode, which indicated that most counties were in a potential crisis zone from 1990 to 2010 in a banded form, mainly distributed along the Yalong River. The economic level of these counties was not high and there was good ecological protection in this region due to the high altitude, extensive terrain, and low-scale human activities. For this region, the focus should be on strengthening economic construction that is based on maintaining the environment. Specifically, there should be increased development of tertiary industries, particularly the tourism industry. Furthermore, inter-planting of crops should be conducted, along with vigorous development of the understory economy. The group uncoordinated mode, which was always associated with a low conflict zone from 1990 to 2010 in a block form, was mainly located in Panzhihua City and its surrounding areas. The economy was developed in this region, to the extent that it became the most prominent economic region in the entire study area due to the advancements of urbanization and industrialization. However, its economic growth was largely dependent on resource consumption and there was a high level of ecological destruction. For this region, the focus should be on strengthening ecological construction, whilst simultaneously ensuring economic growth. Specifically, industrial restructuring and upgrading should be promoted, and outdated and polluting industries should be phased out. At the same time, stringent pollutant emission standards should be established, along with reductions in ecological damage caused by production and domestic wastes. The group improvement mode, which had undergone transition from uncoordinated zone to potential crisis zone in block form, was mainly located along the Lancang and Jinsha Rivers. For this region, there was a certain economic basis because of the flat terrain and suitable climate; however, the level of industrialization was low and the existing industries were inefficient. Further, the ecological environment was notably vulnerable in this region, and geological disasters and soil erosion were more frequent here than in other regions. Therefore, for this mode there should be a strengthening of both ecological environmental protection and economic development. On one hand, taking travel as the main focus, the eco-tourism industry could be developed to exploit the unique natural and cultural features of the region. On the other hand, ecological governance measures, such as Returning Farmland to Forest and Closing the land for Reforestation, should be promoted, along with establishing integrated soil and water conservation measures within a watershed unit.

5. Discussion

Land cover change can generally be defined as a human-induced process that has considerable repercussions for the landscape and associated ecosystems [54]. These changes typically lead to the degradation of environmental quality and ecosystem services. For Hengduan Mountain area, a series of development activities were carried out from 1990 to 2000 to meet the needs of economic development and human life. Forests were cut down and farmland was converted to alternative land uses (Table 5, Figure 2). During this period, ESV growth was negative in the study area, and the land cover changes attributable to human activities had already had harmful effects on the ecological environment. However, humans invariably attempt to modify land cover types for greater benefits and a better quality of life. Accordingly, since 2000, various ecological protection measures have been implemented in this region, such as the “Grain for Green” Project [55]. The areas of forest and water bodies were significantly increased during the period from 2000 to 2010 (Table 5, Figure 2). These are land cover types that have high ecosystem service value, which is the main reason why the ESV increased dramatically from 2000 to 2010.
During the course of this study, we found that the most important function of land cover types in the Hengduan Mountain area is biodiversity maintenance (which has a value seven times greater than that of food production), and that forests play an important role in maintaining the stability of ecosystems. This is consistent with the orientation of Hengduan Mountain [56], which provides an ecological security barrier, and the Chinese government has accordingly taken measures to protect the environment. In recognition of the environmental importance of this region, we argue that, in future land-use policy formulation, the conservation of forests and the regions resource-rich ecosystems should take precedence over the single-minded, uncontrolled reclamation of this region for economic purposes. Although it may not be feasible to stop all reclamation activities in this area, it is imperative that future land reclamation projects be controlled and based on rigorous environmental impact assessments. To achieve this, it will be necessary to conduct more detailed studies on the potential impacts of land reclamation projects on the ecosystem services provided in the Hengduan Mountain area.
At present, the Hengduan Mountain area can be considered to conform to a dual-core spatial structure centered on a low conflict zone and a potential crisis zone. With the passage of time, the economic and ecological conditions of most counties have shown signs of improvement, gradually being transformed from a conflict state to a coordinated state. This demonstrates that economic growth generally causes a certain amount of ecological destruction during the early stages of economic development, whereas over time, the quality of the ecological environment tends to improve concomitantly with economic advances [57]. However, it is noteworthy that the degree of coordination between the economy and ecology was not high in Hengduan Mountain area, and any form of extensive or intensive disturbance is likely to disrupt the existing state of balance [58]. Therefore, the central government should consolidate and strengthen the existing coordinated state by exploring the industrial potential of the region, increasing the economic outputs and industrial level, and improving the strength and sustainability of ecological environmental protection.
In this study, the estimation of ESV in Hengduan Mountain area was based mainly on the research of Costanza and Xie, and it has been confirmed that their methodology is applicable for evaluating ecosystem services in many regions of China [59]. On the basis of the calculation of ESV in Hengduan Mountain area, it could be concluded that the ESV decreased slightly from 1990 to 2010. However, compared with the average level for China, the area has a relatively high ESV and important ecological function, which is consistent with the research of Wang Qiang et al. [60] and provides supporting data for further studies. However, there was not a precise match between land cover classification and natural ecosystems. The same directory of land cover classifications typically contains a number of different ecosystems with different ESVs [61]. Therefore, the service value per unit area of each ecosystem is only an approximate value. Furthermore, economic and ecosystem development are variable processes with nonlinear changes [62]. Consequently, a dynamic coupling model between the economy and ecosystem should be established (based on system evolution in system theory) to clarify and characterize the evolutionary trends and direction of a giant system involving the economy and ecosystem.

6. Conclusions

Economic development will cause substantial changes in the nature and extent of different types of land cover. Such land cover changes will inevitably disrupt the original ecological system, which in turn will cause imbalances in the eco-economic system. In this study, taking Hengduan Mountain area as an example, we discuss the characteristics, evolutionary pattern, and mode of eco-economic system in a mountainous area. Our findings can be summarized as follows. From 1990 to 2010, there were significant decreases in the area of farmland and forest, which promoted a fluctuating downward trend in the ecosystem service values of Hengduan Mountain area, thereby signifying that the ecological system in this area was in the process of deterioration. The EEH index showed a dual-core structure mainly centered on low conflict zones and potential crisis zones, which indicated that although the conflict between the economy and ecology in Hengduan Mountain area was not serious, the coordinated status between the two was not high. In addition, the improvement zones of the eco-economic system accounted for 55.15% of the entire area, which indicates that the eco-economic system in most parts of Hengduan Mountain area has improved, although there remains considerable room for improvement. We described three agglomeration modes of EEH evolution, namely, the band coordinated, group uncoordinated, and group improvement modes, which correspond to different eco-economic development states, and provide a potential reference for the sustainable development of southwest China.
Acknowledgments

This study was supported by the National Key Basic Research Program of China (973 Program, 2015CB452706), the youth talent team program of the Institute of Mountain Hazards and Environment, Chinese Academy of Sciences (CAS) (SDSQB-2015-01), the National Natural Science Foundation of China (41401198 and 41571527) and the Youth Innovation Promotion Association, CAS (No. 2016332).

Author Contributions

Tiantian Chen, Li peng, Qiang Wang and Shaoquan Liu. Tiantian Chen, Li peng and Qiang Wang conceived and designed the research; Tiantian Chen and Qiang Wang conducted the literature review; Tiantian Chen and Li peng analyzed the data; Tiantian Chen, Li peng, Qiang Wang and Shaoquan Liu wrote the paper.

Conflicts of Interest

The authors declare no conflict of interest.

References

  1. Bičı́k, I.; Jeleček, L.; Štěpánek, V. Land-use changes and their social driving forces in Czechia in the 19th and 20th centuries. Land Use Policy 2001, 18, 65–73. [Google Scholar] [CrossRef]
  2. Perrings, C. Conservation of mass and instability in a dynamic economy-environment system. J. Environ. Econ. Manag. 1986, 13, 199–211. [Google Scholar] [CrossRef]
  3. Shafik, N. Economic development and environmental quality: An econometric analysis. Oxf. Econ. Pap. 1994, 46, 757–773. [Google Scholar] [CrossRef]
  4. McMichael, A.J. The urban environment and health in a world of increasing globalization: Issues for developing countries. Bull World Health Organ. 2000, 78, 1117–1126. [Google Scholar] [PubMed]
  5. Woodward, R.T.; Wui, Y.S. The economic value of wetland services: A meta-analysis. Ecol. Econ. 2001, 37, 257–270. [Google Scholar] [CrossRef]
  6. Wang, G.G.; Liu, Y.S.; Li, Y.R.; Chen, Y.F. Dynamic trends and driving forces of land use intensification of cultivated land in China. J. Geogr. Sci. 2015, 25, 45–57. [Google Scholar] [CrossRef]
  7. Anderies, J.M.; Janssen, M.A.; Ostrom, E. A framework to analyze the robustness of social-ecological systems from an institutional perspective. Ecol. Soc. 2004, 9, 10–18. [Google Scholar] [CrossRef]
  8. Bolund, P.; Hunhammar, S. Ecosystem services in urban areas. Ecol. Econ. 1999, 29, 293–301. [Google Scholar] [CrossRef]
  9. Andreoni, J.; Levinson, A. The Simple Analysis of the Environmental Kuznets Curve. J. Public Econ. 2001, 80, 269–286. [Google Scholar] [CrossRef]
  10. Derissen, S.; Quaas, M.F.; Baumgärtner, S. The relationship between resilience and sustainability of ecological-economic systems. Ecol. Econ. 2011, 70, 1121–1128. [Google Scholar] [CrossRef]
  11. Vitousek, P.M.; Mooney, H.A.; Lubchenco, J.; Melillo, J.M. Human domination of Earth’s ecosystems. Science 1997, 277, 494–499. [Google Scholar] [CrossRef]
  12. Pattanayak, S.K. Valuing watershed services: Concepts and empirics from southeast Asia. Agric. Ecosyst. Environ. 2004, 104, 171–184. [Google Scholar] [CrossRef]
  13. Loomis, J.; Kent, P.; Strange, L.; Fausch, K.; Covich, A. Measuring the total economic value of restoring ecosystem services in an impaired river basin: Results from a contingent valuation survey. Ecol. Econ. 2000, 33, 103–117. [Google Scholar] [CrossRef]
  14. Hanley, N.D.; Ruffell, R.J. The contingent valuation of forest characteristics: Two experiments. J. Agric. Econ. 1993, 44, 218–229. [Google Scholar] [CrossRef]
  15. Mendonça, M.J.C.; Sachsida, A.; Loureiro, P.R. A study on the valuing of biodiversity: The case of three endangered species in Brazil. Ecol. Econ. 2003, 46, 9–18. [Google Scholar] [CrossRef]
  16. Zhao, B.; Kreuter, U.; Li, B.; Ma, Z.; Chen, J.; Nakagoshi, N. An ecosystem service value assessment of land-use change on Chongming Island, China. Land Use Policy 2004, 21, 139–148. [Google Scholar] [CrossRef]
  17. Eade, J.D.O.; Moran, D. Spatial economic valuation: Benefits transfer using geographical information systems. J. Environ. Manag. 1996, 48, 97–110. [Google Scholar] [CrossRef]
  18. Costanza, R.; D’Arge, R.; De Groot, R.; Faber, S.; Grasso, M. The value of the world’s ecosystem services and natural capital. Nature 1997, 387, 253–260. [Google Scholar] [CrossRef]
  19. Costanza, R.; D’Arge, R.; De Groot, R.; Farber, S.; Grasso, M.; Hannon, B.; Raskin, R.G. The value of ecosystem services: Putting the issues in perspective. Ecol. Econ. 1998, 25, 67–72. [Google Scholar] [CrossRef]
  20. Ouyang, Z.Y.; Wang, X.K.; Miao, H. A primary study on Chinese terrestrial ecosystem services and their ecological-economic values. Acta Geogr. Sin. 1999, 19, 607–613. [Google Scholar]
  21. Xie, G.D.; Zhen, L.; Lu, C.X.; Xiao, Y.; Chen, C. Expert knowledge based valuation method of ecosystem services in China. J. Nat. Res. 2008, 23, 911–919. [Google Scholar]
  22. Dai, L.; Yao, X.C.; Zhou, S.L. Land ecological assessment of Jintan city in Yangtze River Delta with highly developed economy. Trans. Chin. Soc. Agric. Eng. 2013, 29, 249–257. [Google Scholar]
  23. Guo, R.Z.; Yang, M.H. Ecosystem service value analysis and trend prediction in Chang-Zhu-Tan region. Trans. Chin. Soc. Agric. Eng. 2014, 30, 238–245. [Google Scholar]
  24. Piao, S.L.; Fang, J.Y.; Ciais, P.; Peylin, P.; Huang, Y.; Sitch, S.; Wang, T. The carbon balance of terrestrial ecosystems in China. Nature 2009, 458, 1009–1013. [Google Scholar] [CrossRef] [PubMed]
  25. Potter, C.S.; Randerson, J.T.; Field, C.B.; Matson, P.A.; Vitousek, P.M.; Mooney, H.A.; Klooster, S.A. Terrestrial ecosystem production: A process model based on global satellite and surface data. Glob. Biogeochem. Cycles 1993, 7, 811–841. [Google Scholar] [CrossRef]
  26. Hau, J.L.; Bakshi, B.R. Promise and problems of emergy analysis. Ecol. Model. 2004, 178, 215–225. [Google Scholar] [CrossRef]
  27. Common, M.; Perrings, C. Towards an ecological economics of sustainability. Ecol. Econ. 1992, 6, 7–34. [Google Scholar] [CrossRef]
  28. Suh, S. Theory of materials and energy flow analysis in ecology and economics. Ecol. Model. 2005, 189, 251–269. [Google Scholar] [CrossRef]
  29. Nuñez, D.; Nahuelhual, L.; Oyarzún, C. Forests and water: The value of native temperate forests in supplying water for human consumption. Ecol. Econ. 2006, 58, 606–616. [Google Scholar] [CrossRef]
  30. Dai, Q.H.; Liu, G.B.; Liu, M.Y.; Wang, Y.B. An evaluation on sustainable development of eco-econommic system in small watershed in hilly area of Northeast China. Acta Geogr. Sin. 2005, 60, 209–218. [Google Scholar]
  31. Deng, W.; Fang, Y.P.; Tang, W. The strategic effect and general directions of urbanization in mountain areas of china. Bull. Chin. Acad. Sci. 2013, 28, 66–73. [Google Scholar]
  32. Glasby, G.P. Sustainable development: The need for a new paradigm. Environ. Dev. Sustain. 2002, 4, 333–345. [Google Scholar] [CrossRef]
  33. Li, B.Y. Geomorphologic regionalization of the Hengduan mountainous region. Mt. Res. 1989, 7, 13–20. [Google Scholar]
  34. Li, M.S. Rational land exploitation of dry valleys in the Hengduan Mountains Region. J. Nat. Resour. 1991, 6, 326–334. [Google Scholar]
  35. Yang, C.J.; Zhou, C.H. Investigation on classification of remote sensing image on basis of knowledge. Geogr. Territ. Res. 2001, 17, 72–77. [Google Scholar]
  36. Zhang, J. Multi-source remote sensing data fusion: Status and trends. Int. J. Ima. Dat. Fus. 2010, 1, 5–24. [Google Scholar] [CrossRef]
  37. Sichuan Statistical Bureau. Sichuan Statistical Yearbook; China Statistics Press: Sichuan, China, 1991.
  38. Sichuan Statistical Bureau. Sichuan Statistical Yearbook; China Statistics Press: Sichuan, China, 2001.
  39. Sichuan Statistical Bureau. Sichuan Statistical Yearbook; China Statistics Press: Sichuan, China, 2011.
  40. Yunnan Statistical Bureau. Yunnan Statistical Yearbook; China Statistics Press: Yunnan, China, 1991.
  41. Yunnan Statistical Bureau. Yunnan Statistical Yearbook; China Statistics Press: Yunnan, China, 2001.
  42. Yunnan Statistical Bureau. Yunnan Statistical Yearbook; China Statistics Press: Yunnan, China, 2011.
  43. Tibet Statistical Bureau. Tibet Statistical Yearbook; China Statistics Press: Tibet, China, 1991.
  44. Tibet Statistical Bureau. Tibet Statistical Yearbook; China Statistics Press: Tibet, China, 2001.
  45. Tibet Statistical Bureau. Tibet Statistical Yearbook; China Statistics Press: Tibet, China, 2011.
  46. Xie, G.D.; Lu, C.X.; Leng, Y.F.; Zheng, D.U.; Li, S.C. Ecological assets valuation of the Tibetan Plateau. J. Nat. Resour. 2003, 18, 189–196. [Google Scholar]
  47. National Bureau of Statistics of the People’s Republic of China. China Yearbook of Agricultural Price Survey; China Statistics Press: Beijing, China, 1991.
  48. National Bureau of Statistics of the People’s Republic of China. China Yearbook of Agricultural Price Survey; China Statistics Press: Beijing, China, 2001.
  49. National Bureau of Statistics of the People’s Republic of China. China Yearbook of Agricultural Price Survey; China Statistics Press: Beijing, China, 2011.
  50. Li, T.H.; Li, W.K.; Qian, Z.H. Variations in ecosystem service value in response to land use changes in Shenzhen. Ecol. Econ. 2010, 69, 1427–1435. [Google Scholar]
  51. Kreuter, U.P.; Harris, H.G.; Matlock, M.D.; Lacey, R.E. Change in ecosystem service values in the San Antonio area, Texas. Ecol. Econ. 2001, 39, 333–346. [Google Scholar] [CrossRef]
  52. Barbier, E.B.; Hacker, S.D.; Kennedy, C.; Koch, E.W.; Stier, A.C.; Silliman, B.R. The value of estuarine and coastal ecosystem services. Ecol. Monogr. 2011, 81, 169–193. [Google Scholar] [CrossRef]
  53. Wang, Z.B.; Fang, C.L.; Wang, J. Evaluation on the Coordination of Ecological and Economic Systems and Associated Spatial Evolution Patterns in the Rapid Urbanized Yangtze Delta Region since 1991. Acta Geogr. Sin. 2011, 66, 1657–1668. [Google Scholar]
  54. Sawut, M.; Eziz, M.; Tiyip, T. The effects of land-use change on ecosystem service value of desert oasis: A case study in Ugan-Kuqa River Delta Oasis, China. Can. J. Soil. Sci. 2013, 93, 99–108. [Google Scholar] [CrossRef]
  55. Zheng, Z.M.; Fu, B.J.; Hu, H.T.; Sun, G. A method to identify the variable ecosystem services relationship across time: A case study on Yanhe Basin, China. Landsc. Ecol. 2014, 29, 1689–1696. [Google Scholar] [CrossRef]
  56. Sherman, R.; Mullen, R.; Haomin, L.; Zhendong, F.; Yi, W. Spatial patterns of plant diversity and communities in Alpine ecosystems of the Hengduan Mountains, northwest Yunnan, China. J. Plant Ecol. 2008, 1, 117–136. [Google Scholar] [CrossRef]
  57. Qiao, B.; Fang, C.L. The dynamic coupling model of the harmonious development between urbanization and eco-environment and its application in arid area. Acta Geogr. Sin. 2005, 25, 3003–3009. [Google Scholar]
  58. Zhou, J.S. Fragility of mountain ecosystem and desertification. J. Nat. Res. 1997, 12, 10–16. [Google Scholar]
  59. Su, C.H.; Fu, B.J.; He, C.S.; Lu, Y.H. Variation of ecosystem services and human activities: A case study in the Yanhe Watershed of China. Acta Oecol. 2012, 44, 46–57. [Google Scholar] [CrossRef]
  60. Wang, Q.; Zhang, T.B.; Yi, G.H.; Chen, T.T.; Bie, X.J.; He, Y.X. Tempo-spatial variations and driving factors analysis of net primary productivity in the Hengduan mountain area from 2004 to 2014. Acta Geogr. Sin. 2017, 37, 3084–3095. [Google Scholar] [CrossRef]
  61. Zhao, J.; Yang, K. Valuation of ecosystem services: Characteristics, issues and prospects. Acta Geogr. Sin. 2007, 27, 346–356. [Google Scholar]
  62. Yang, G.M.; Li, W.H.; Min, Q.W. Review of foreign opinions on evaluation of ecosystem services. Acta Geogr. Sin. 2006, 26, 205–212. [Google Scholar]
Figure 1. Location map of Hengduan Mountain area.
Sustainability 09 01270 g001
Figure 2. Chord diagram of land cover transition (a) 1990–2000 (b) 2000–2010.
Sustainability 09 01270 g002
Figure 3. Value of each eco-service function in different counties. Notes: 1–98 means the name of counties. 1 Aba; 2 Batang; 3 Baiyu; 4 Baoxing; 5 Binchuan; 6 Butuo; 7 Chaya; 8 Chuxiong; 9 Dali city; 10 Dyao; 11 Danba; 12 Daofu; 13 Daocheng; 14 Derong; 15 Dechang; 16 Dege; 17 Deqin; 18 Ebian; 19 Eyuan; 20 Fugong; 21 Fumin; 22 Ganluo; 23 Ganzi; 24 Gongjue; 25 Gongshan; 26 Heqing; 27 Heishui; 28 Hongyuan; 29 Huaping; 30 Huidong; 31 Huili; 32 Huize; 33 Jianchuan; 34 Jiangda; 35 Jinchuan; 36 Jinyang; 37 Jiulong; 38 Jiuzhaigou; 39 Kangding; 40 Dongchuan district in Kunming city; 41 Lanping; 42 Leibo; 43 Litang; 44 Li county; 45 Lijiang; 46 Luding; 47 Lushui; 48 Luhuo; 49 Lufeng; 50 Luquan; 51 Maerkang; 52 Mangkang; 53 Mao county; 54 Meigu; 55 Midu; 56 Miyi; 57 Mianning; 58 Mouding; 59 Muli; 60 Nanhua; 61 Nanjian; 62 Ninglang; 63 Ningnan; 64 East district in Panzhihua city; 65 Renhe district in Panzhihua city; 66 West district Panzhihua city; 67 Puge; 68 Qiaojia; 69 Rangtang; 70 Seda; 71 Shimian; 72 Songpan; 73 Songming; 74 Tianquan; 75 Weishan; 76 Weixi; 77 Wenchuan; 78 Wuding; 79 Xichang; 80 Xide; 81 Xiangcheng; 82 Shangri-la; 83 Xiangyun; 84 Xiaojin; 85 Xinlong; 86 Xundian; 87 Yajiang; 88 Yanbian; 89 Yanyuan; 90 Yangbi; 91 Yaoan; 92 Yongping; 93 Yongren; 94 Yongsheng; 95 Yuanmou; 96 Yuexi; 97 Yunlong; 98 Zhaojue.
Sustainability 09 01270 g003aSustainability 09 01270 g003b
Figure 4. Spatial distribution of ESV (a), evolutionary partition of ESV from (b) 1990–2000 and (c) 2000–2010.
Sustainability 09 01270 g004
Figure 5. Spatial distribution of GDP (a), evolutionary partition of GDP from (b) 1990–2000 and (c) 2000–2010.
Sustainability 09 01270 g005
Figure 6. Changing of GDP and ESV from (a) 1990–2000 and (b) 2000–2010. Notes: 1–98 means the name of counties. Their names are the same as what is listed for Figure 3.
Sustainability 09 01270 g006
Figure 7. Spatial distribution of EEH from (a) 1990–2000 and (b) 2000–2010.
Sustainability 09 01270 g007
Figure 8. Spatial aggregation modes of EEH evolution in the Hengduan Mountain area.
Sustainability 09 01270 g008
Table 1. Area, proportion and accuracy verification of land cover types (km2, %, %).
Land Cover Types1990 (3600)2000 (1110)2010 (2580)
AreaProportionAccuracyAreaProportionAccuracyAreaProportionAccuracy
Farmland46,917.209.0493.1046,559.298.9786.5045,917.268.8565.04
Forest235,266.0645.3386.90233,535.4445.0083.75240,313.8446.375.94
Grassland211,507.9940.7589.60213,534.5341.1484.00206,274.0339.7574.00
Water3889.700.7592.503516.730.6888.003931.360.7672.73
Built-up land1305.500.2589.001517.270.2991.002262.400.4485.19
Unused land20,099.773.8789.0020,322.953.9287.0020,287.343.9170.00
Comprehensive accuracy 90.02 86.70 73.82
Notes: 3600, 1110 and 2580 means the scenes of sampling points in 1900, 2000 and 2010, respectively.
Table 2. Equivalent weight factor of ecosystem service per hectare of terrestrial ecosystems in China.
Land Cover TypeForestGrasslandCroplandWetlandWater BodyBarren Land
Ecosystem Service
Food production0.330.431.000.360.530.02
Raw materials production2.980.360.390.240.350.04
Gas regulation4.321.50.722.410.510.06
Climate regulation4.071.560.9713.552.060.13
Water regulation4.091.520.7713.4418.770.07
Waste treatment1.721.321.3914.4014.850.26
Soil conservation4.022.241.471.990.410.17
Biodiversity maintenance4.511.871.023.693.430.40
Leisure2.080.870.174.694.440.24
Total28.1211.677.9054.7745.351.39
Table 3. Ecosystem service value (ESV) per unit area of Hengduan Mountain area (yuan/(ha × a)).
Land Cover TypeFarmlandForestGrasslandWaterBuilt-Up LandUnused Land
Ecosystem Service
Food production1244.00410.51534.91659.32024.87
Raw materials production485.173707.15447.85435.42049.75
Gas regulation895.685374.101866.01634.44074.65
Climate regulation1206.75063.121940.662562.670161.71
Water regulation957.895087.991890.8923,350.02087.09
Waste treatment1729.172139.691642.0818,473.520323.45
Soil conservation1828.705000.902786.56510.040211.49
Biodiversity maintenance1268.885610.472326.304266.940497.60
Leisure211.492587.541082.295523.380298.55
Total9827.6834,981.4714,517.5756,415.7301729.17
Table 4. The size and classification of eco-economic harmony (EEH).
LevelState
EEH < −1Deterioration zone (A)
−1 < EEH < −0.8Higher conflict zone (B)
−0.8 < EEH < −0.6High conflict zone (C)
−0.6 < EEH < −0.4Moderate conflict zone (D)
−0.4 < EEH < −0.2Relatively low conflict zone (E)
−0.2 < EEH < 0Low conflict zone (F)
0 < EEH < 0.2Potential crisis zone (G)
0.2 < EEH < 0.4Low coordination zone (H)
0.4 < EEH < 0.6Relatively low coordination zone (I)
0.6 < EEH < 0.8Moderate coordination zone (J)
0.8 < EEH < 1High coordination zone (K)
EEH > 1Higher coordination zone (L)
Table 5. Area and proportion of different land cover types in different years (km2, %).
YearUnitFarmlandForestGrasslandWaterBuilt-Up LandUnused Land
1990km243,475.23212,340.80174,260.603731.591079.0014,656.59
%9.6747.2338.760.830.243.26
2000km234,293.34201,310.90192,151.502765.25903.6718,164.00
%7.6344.7842.740.620.204.04
2010km234,066.16206,847.50186,109.903656.901324.8117,584.50
%7.5846.0141.400.810.293.91
Table 6. Ecological service value and proportion of different land cover types (108 yuan, %).
Land Cover Types199020002010Total Decreased (1990–2010)
Farmland555.93 (4.00)337.02 (3.20)334.79 (3.20)221.14 (6.70)
Forest9662.99 (69.90)7042.15 (68.00)7235.83 (68.90)2427.16 (73.40)
Grassland3290.70 (23.80)2789.57 (26.90)2701.86 (25.70)588.84 (17.80)
Water274.12 (2.00)156.00 (1.50)206.31 (2.00)67.81 (2.00)
Built-up land0000
Unused33.00 (0.24)31.41 (0.30)30.41 (0.29)2.59 (0.10)
Total value13816.7410356.1510509.203307.54
Table 7. Value and proportion of different ecological service function (108 yuan, %).
Eco-Service Functions199020002010
Food production308.69 (2.20)230.36 (2.20)229.69 (2.20)
Raw materials production1156.06 (8.40)851.09 (8.20)869.16 (8.30)
Gas regulation1962.64 (14.20)1474.25 (14.20)1493.05 (14.20)
Climate regulation1922.28 (13.90)1443.57 (13.90)1461.80 (13.90)
Water regulation2003.38 (14.50)1486.60 (14.40)1523.90 (14.50)
Waste treatment1157.01 (8.40)862.53 (8.30)880.35 (8.40)
Soil conservation2123.00 (15.40)1610.14 (15.40)1620.91 (15.40)
Biodiversity maintenance2179.10 (15.80)1640.80 (15.80)1661.04 (15.80)
Leisure1004.58 (7.30)756.81 (7.30)769.30 (7.30)
Table 8. Type of EEH and the number of counties in different periods.
StateConflictCoordination
TypeABCDEFGHIJKL
Number of counties 1990–200000005722100000
Number of counties 2000–201000000346400000
Table 9. Evolutionary partitions of EEH and its results.
PartitionArea and ProportionCharacteristics of EEH
Low conflict zone77,692 km2, 17.05%Remaining in F of two periods
Potential crisis zone126,684 km2, 27.80%Remaining in G of two periods
Slight improvement zone240,699 km2, 52.81%Increasing from E to F or F to G in two periods
Significant improvement zone10,687 km2, 2.34%Increasing from E to G in two periods